Embed Size (px)
Citation preview

The Sample The Sample VarianceVariance
© Chistine CrispEdited by Dr Mike Hughes
The Sample Variance
Can you find the medians and means for the following 3 data sets?
Although the medians and means are the same, the data sets are not really alike.
The spread or variability of the numbers is quite different.How can we measure the spread within the
data sets?ANS: The range and inter-quartile range both measure spread but neither uses all the data items.
5
5
5 5
55
955555551Set C
999654111Set B
987654321Set A
Mean,Median
x
Interquartile range we will do later with Cumulative Frequency
The Sample Variance
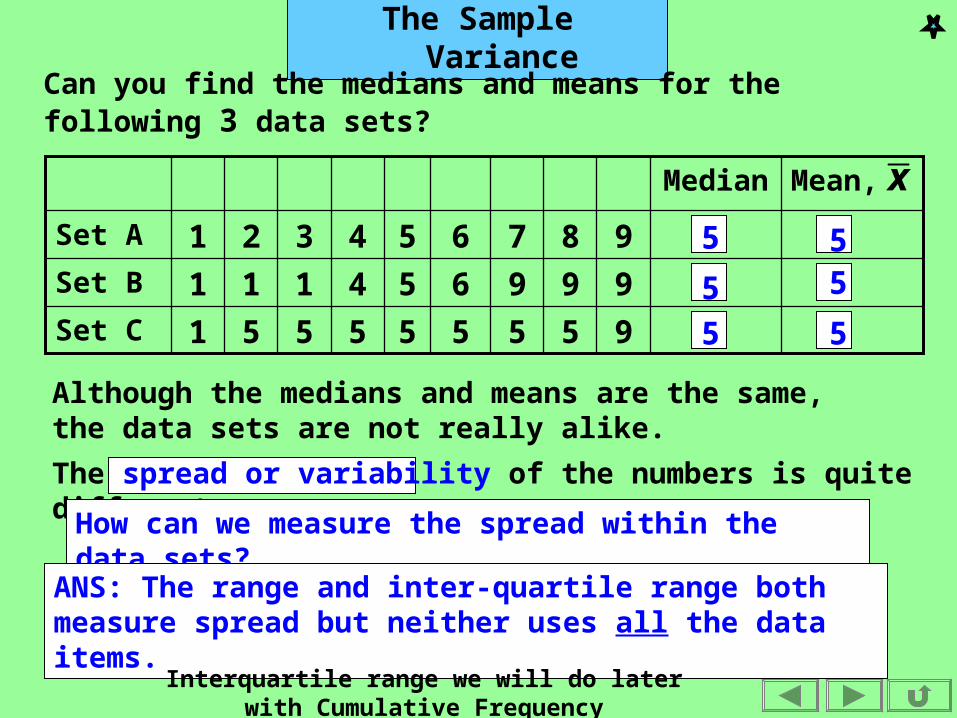
If you had to invent a method of measuring spread that used all the data items, what could
you do?One thing we could do is find out how far each item is from the mean and add up these differences.
e.g.
)( xx 4 3 . . . + 3 + 4 =Data sets B and C give the same result. The negative and positive values have cancelled each other out.
432101234
55955555551Set C
55999654111Set B
55987654321Set A
Mean,Median
x
987654321Set A: xxx
5x
0
The Sample Variance
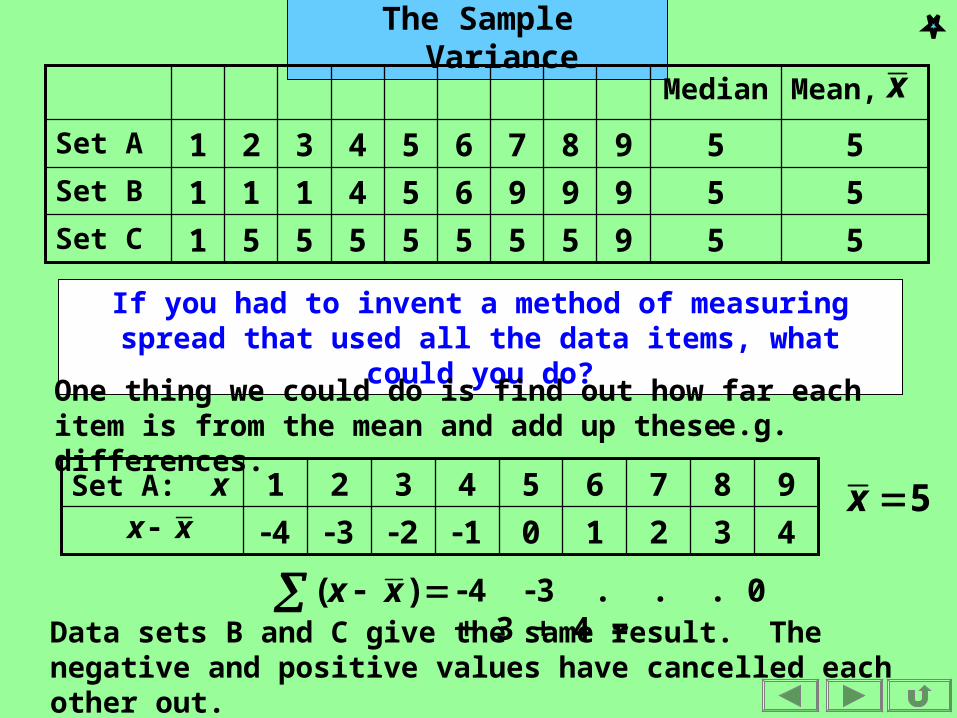
To avoid the effect of the negative values we can either • ignore the negative
signs, or• square each difference ( since the squares will all be positive ).
Squaring is more convenient for developing theory, so, e.g.
16941014916
432101234987654321Set A: x
xx 2)( xx
2)( xx 60
Let’s do this calculation for all 3 data sets:
The Sample Variance
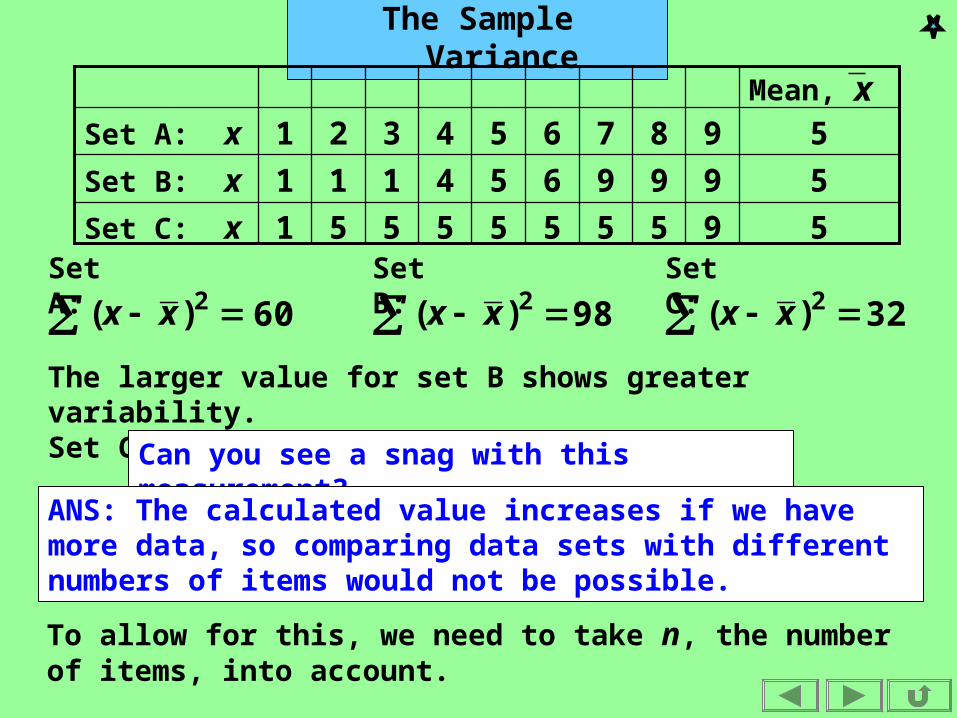
98 3260 2)( xx 2)( xx 2)( xxSet A: Set B: Set C:
The larger value for set B shows greater variability. Set C has least variability.Can you see a snag with this
measurement?ANS: The calculated value increases if we have more data, so comparing data sets with different numbers of items would not be possible.
To allow for this, we need to take n, the number of items, into account.
5955555551Set C: x
5999654111Set B: x
5987654321Set A: xMean, x
The Sample Variance
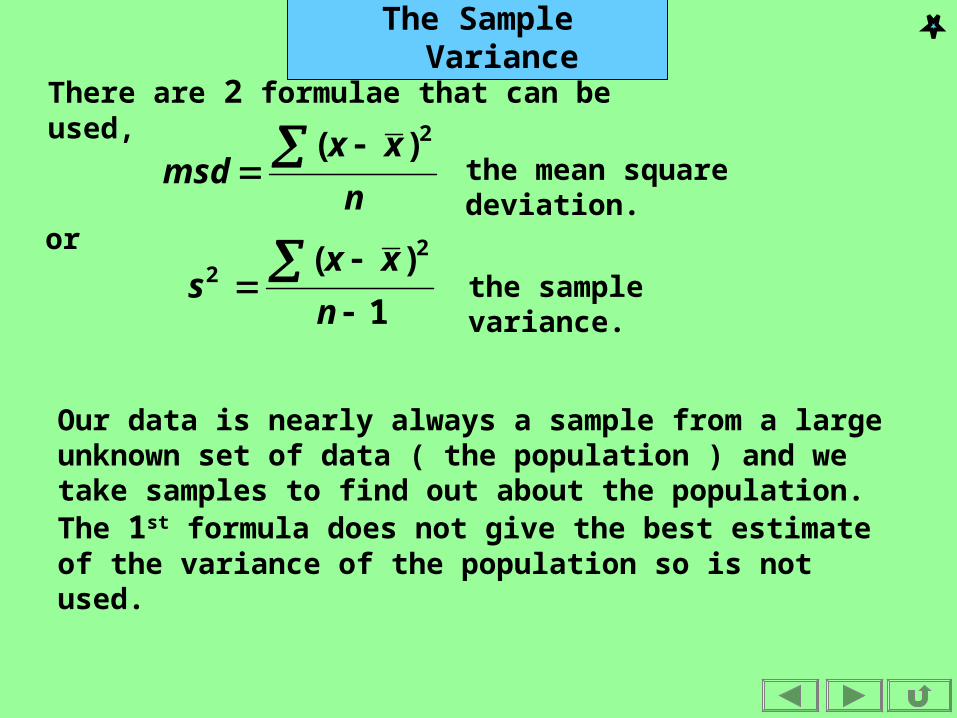
There are 2 formulae that can be used,
n
xxmsd
2)( the mean square
deviation.
1
)( 22
n
xxs
or
the sample variance.
Our data is nearly always a sample from a large unknown set of data ( the population ) and we take samples to find out about the population. The 1st formula does not give the best estimate of the variance of the population so is not used.

The Sample Variance
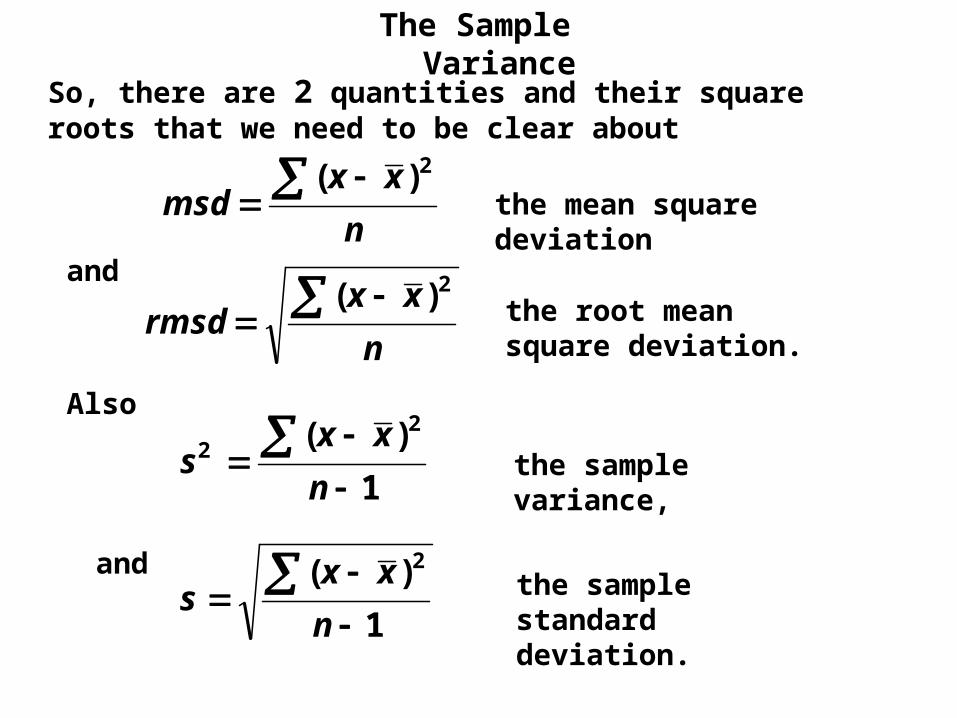
So, there are 2 quantities and their square roots that we need to be clear about
n
xxmsd
2)( the mean square
deviation,POPULATION VARIANCE
1
)( 22
n
xxs
Also
the sample variance,
and
n
xxrmsd
2)(
the root mean square deviation.POPULATION STANDARD DEVIATION
and
1
)( 2
n
xxs the sample
standard deviation.
WE nearly ALWAYS use THESE TWO
formula

The Sample Variance
e.g. Find the rmsd and msd of the following data:
n
xx 22 )( (i
)
x 7 9 14
Mean, n
xx
103
30 x
3
)1014()109()107( 222
)..3(6783
1619fs
22
2 xn
x(ii) 210
3
1968149
100
3
326
)..3(678 fsThe 2nd form is exactly the same as the first form but quicker to use !!
The Sample Variance
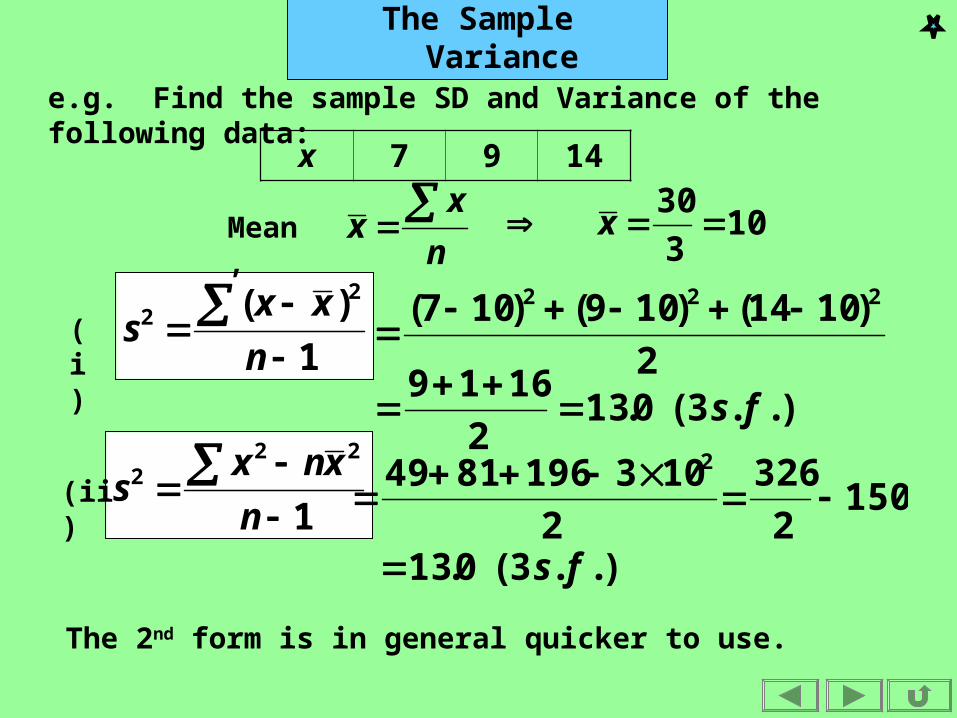
e.g. Find the sample SD and Variance of the following data:
1
)( 22
n
xxs(i
)
x 7 9 14
Mean, n
xx
103
30 x
2
)1014()109()107( 222
)..3(0.132
1619fs
1
222
n
xnxs(ii)
2
1031968149 2 150
2
326
)..3(0.13 fs
The 2nd form is in general quicker to use.
The Sample Variance
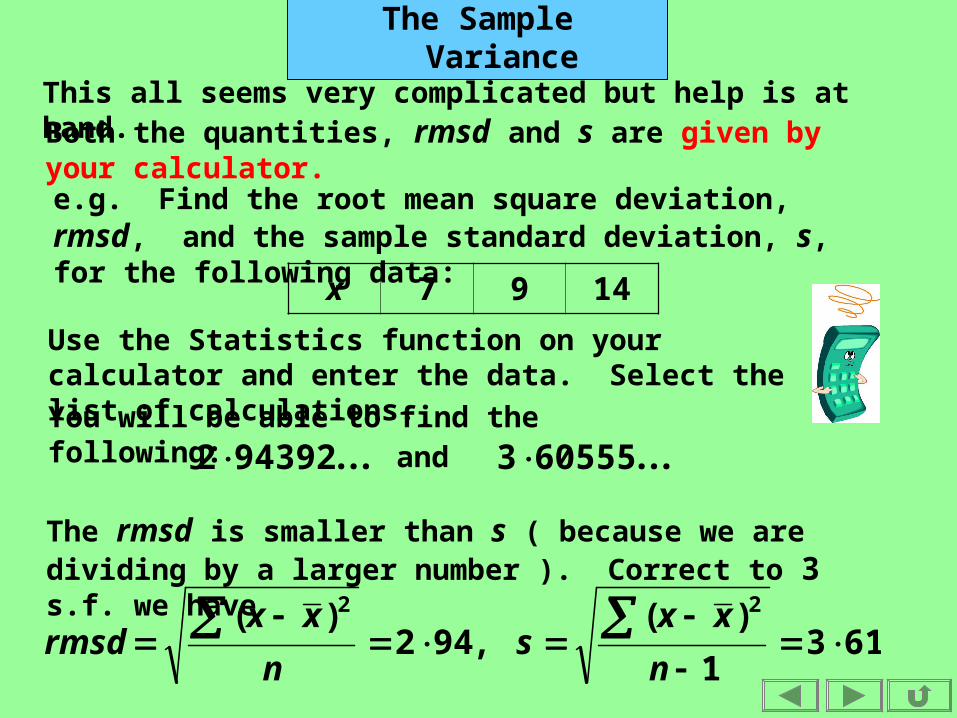
This all seems very complicated but help is at hand.
,942)( 2
n
xxrmsd 613
1
)( 2
n
xxs
Both the quantities, rmsd and s are given by your calculator.
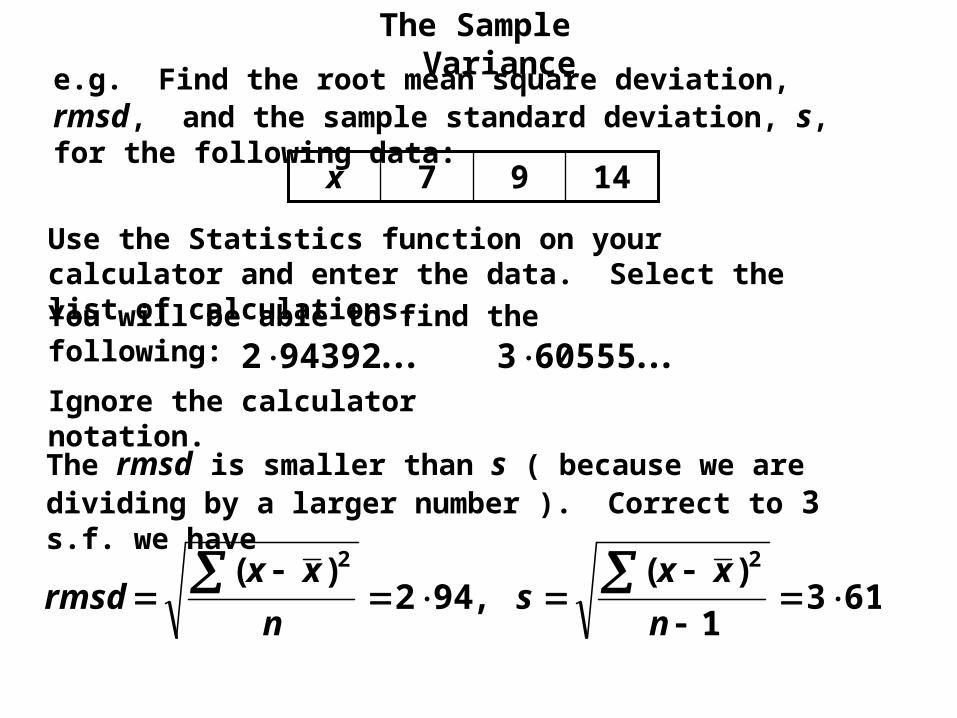
The rmsd is smaller than s ( because we are dividing by a larger number ). Correct to 3 s.f. we have
e.g. Find the root mean square deviation, rmsd, and the sample standard deviation, s, for the following data: x 7 9 14
Use the Statistics function on your calculator and enter the data. Select the list of calculations.You will be able to find the following: ...605553 ...943922 and
The Sample Variance
,942)( 2
n
xxrmsd 613
1
)( 2
n
xxs
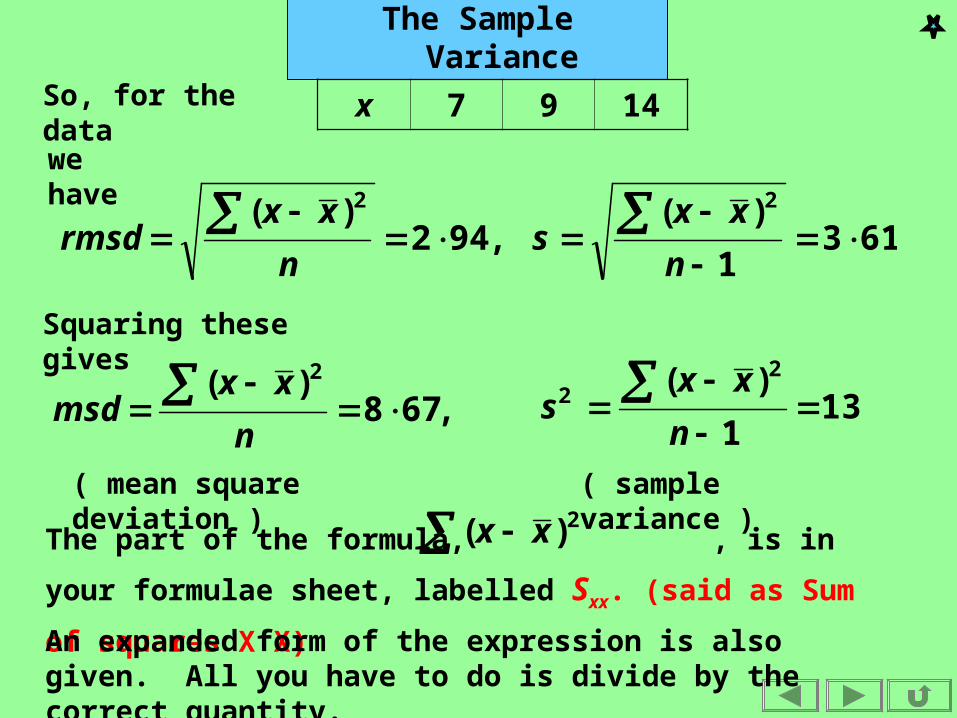
x 7 9 14So, for the data
we have
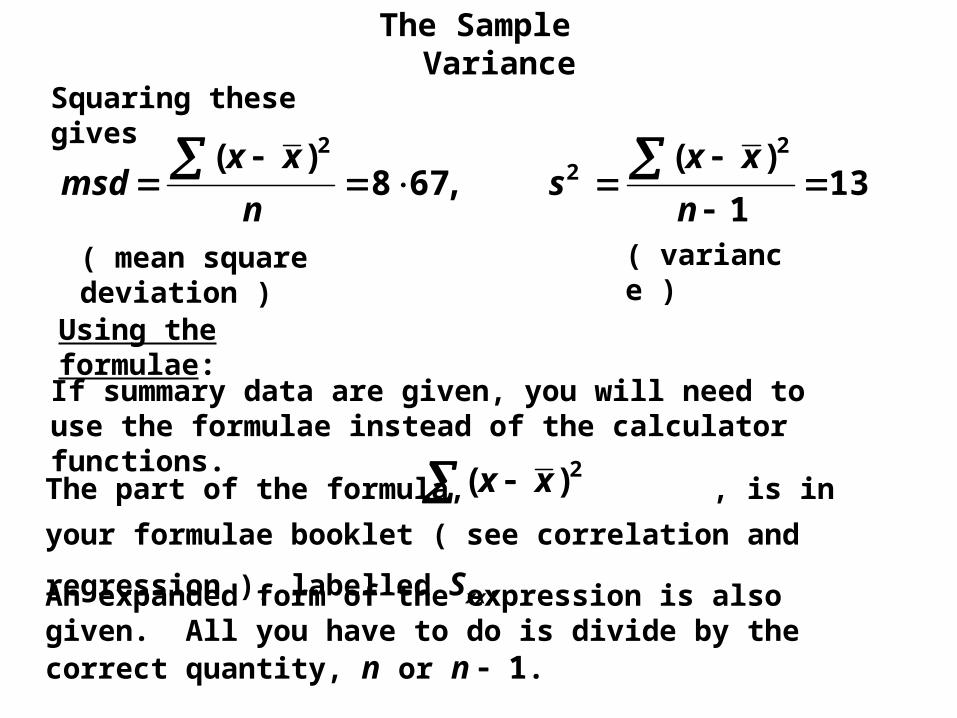
Squaring these gives
,678)( 2
n
xxmsd 13
1
)( 22
n
xxs
( sample variance )
( mean square deviation )
The part of the formula, , is in your
formulae sheet, labelled Sxx. (said as Sum of
squares X X)
2)( xx
An expanded form of the expression is also given. All you have to do is divide by the correct quantity.
The Sample Variance
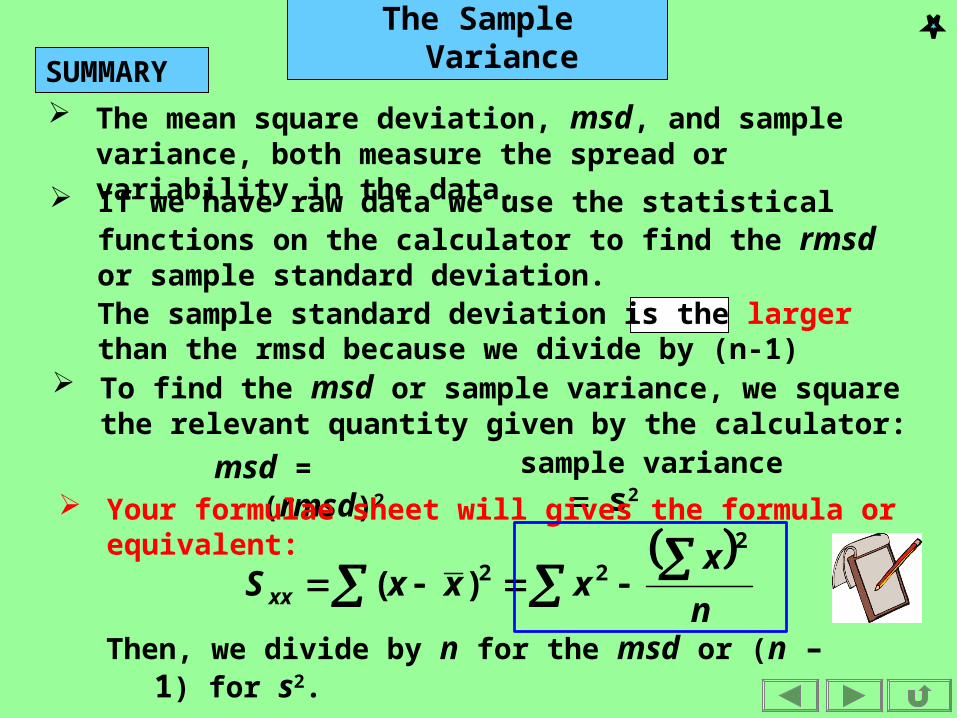
The mean square deviation, msd, and sample variance, both measure the spread or variability in the data.
SUMMARY
To find the msd or sample variance, we square the relevant quantity given by the calculator:
If we have raw data we use the statistical functions on the calculator to find the rmsd or sample standard deviation.
msd = (rmsd)2 sample variance s2 Your formulae sheet will gives the formula or
equivalent: n
xxxxS xx
2
22)(
Then, we divide by n for the msd or (n – 1) for s2.
The sample standard deviation is the larger than the rmsd because we divide by (n-1)
The Sample Variance
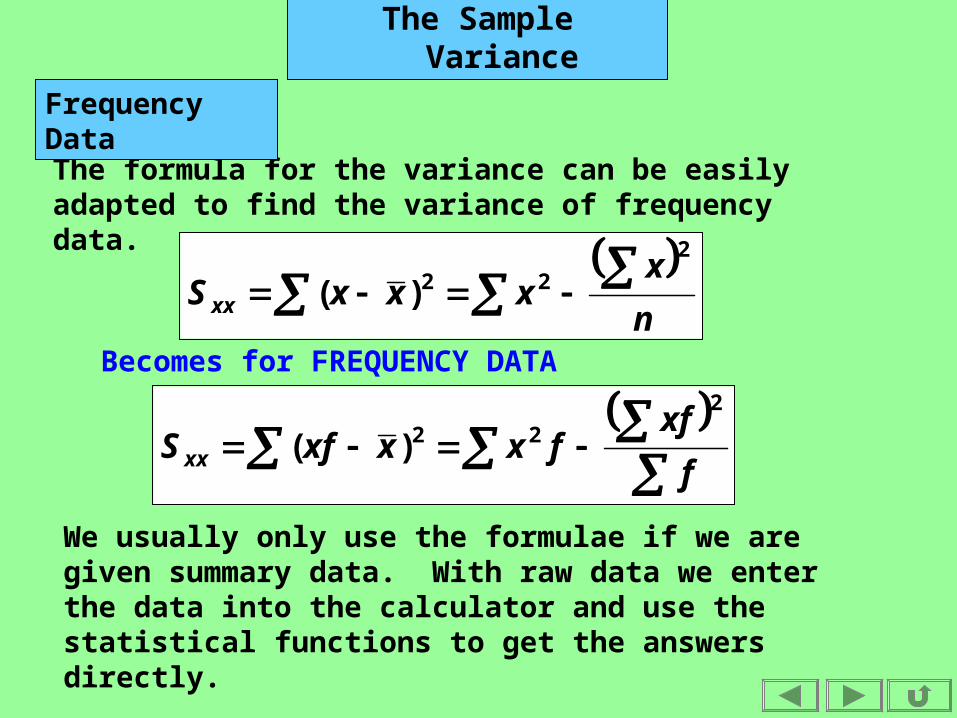
The formula for the variance can be easily adapted to find the variance of frequency data.
n
xxxxS xx
2
22)(
Becomes for FREQUENCY DATA
Frequency Data
f
xffxxxfS xx
2
22)(
We usually only use the formulae if we are given summary data. With raw data we enter the data into the calculator and use the statistical functions to get the answers directly.
The Sample Variance
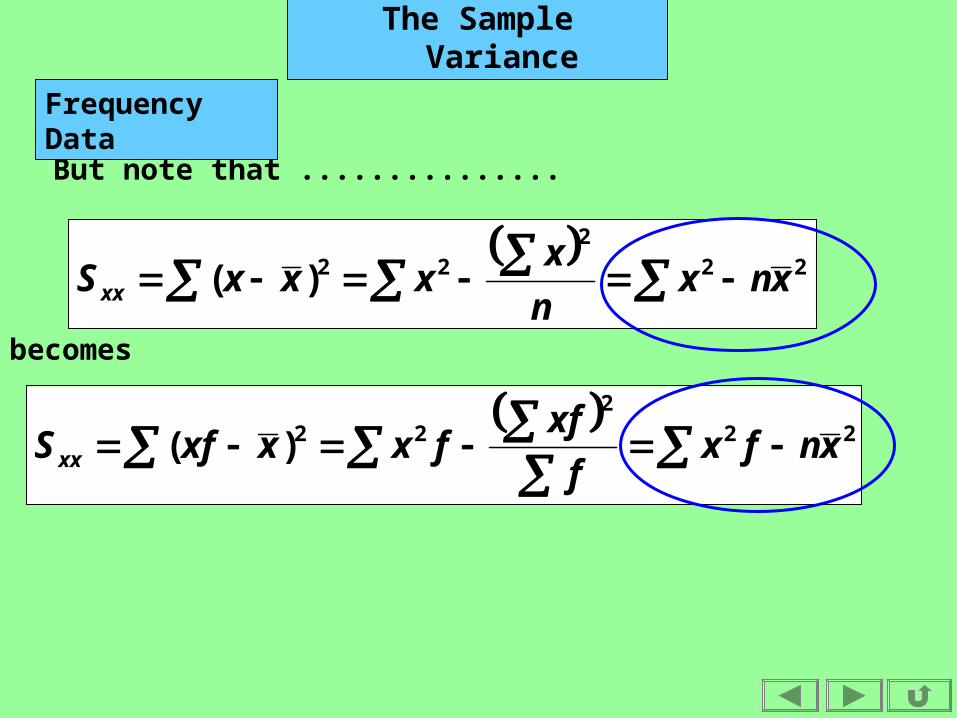
But note that ...............
22
2
22)( xnxn
xxxxS xx
becomes
Frequency Data
22
2
22)( xnfxf
xffxxxfS xx
The Sample Variance
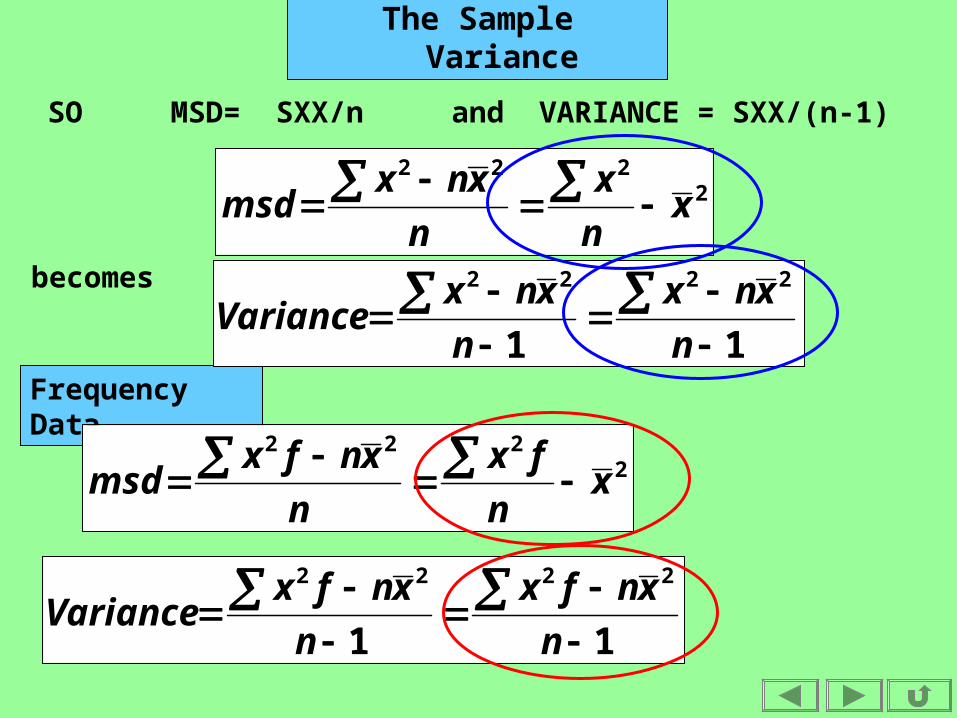
SO MSD= SXX/n and VARIANCE = SXX/(n-1)
2222
xn
x
n
xnxmsd
becomes
Frequency Data
11
2222
n
xnx
n
xnxVariance
2222
xn
fx
n
xnfxmsd
11
2222
n
xnfx
n
xnfxVariance
The Sample Variance
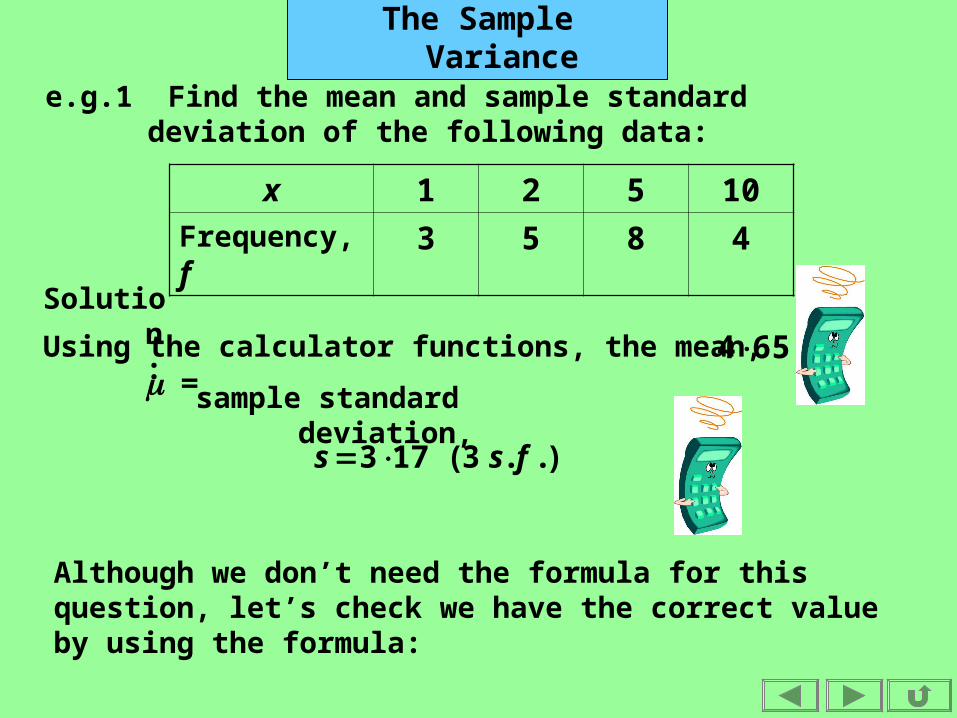
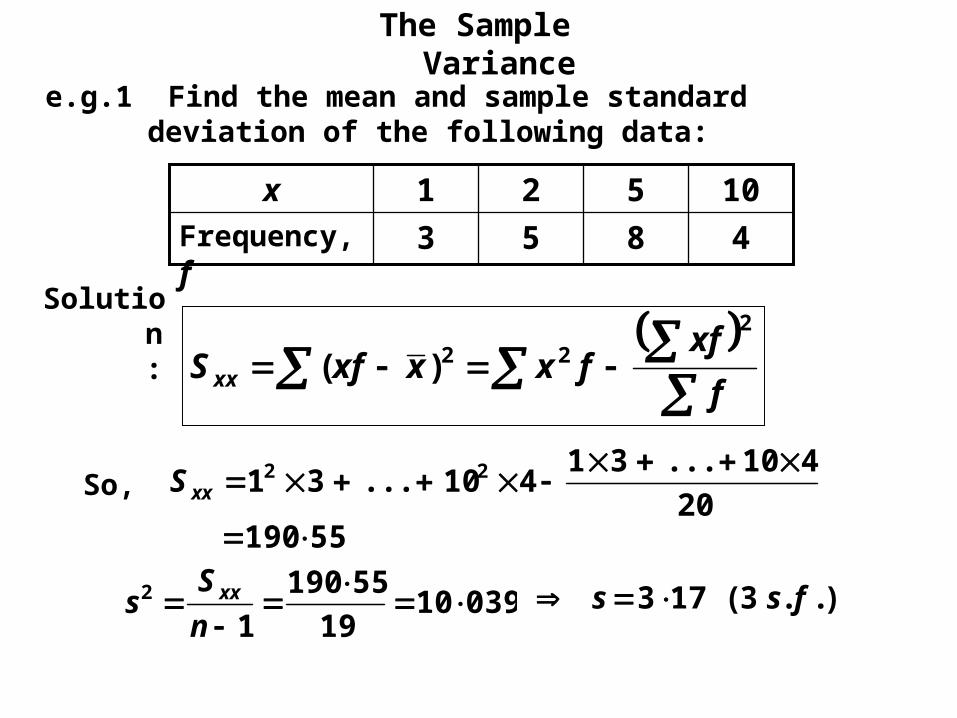
e.g.1 Find the mean and sample standard deviation of the following data:
x 1 2 5 10
Frequency, f
3 5 8 4
Solution:
654
sample standard deviation,
)..3(173 fss
Using the calculator functions, the mean, =
Although we don’t need the formula for this question, let’s check we have the correct value by using the formula:
The Sample Variance
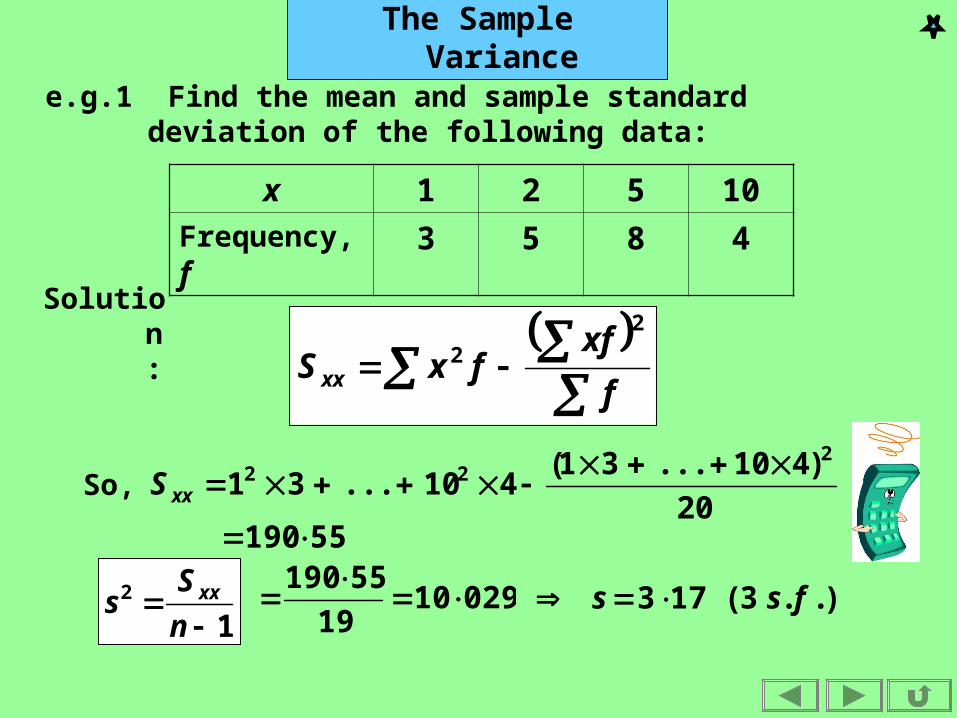
e.g.1 Find the mean and sample standard deviation of the following data:
x 1 2 5 10
Frequency, f
3 5 8 4
Solution:
f
xffxS xx
2
2
20
)410...31(410...31
222
xxSSo,
55190
12
n
Ss xx )..3(173 fss 02910
19
55190
The Sample Variance
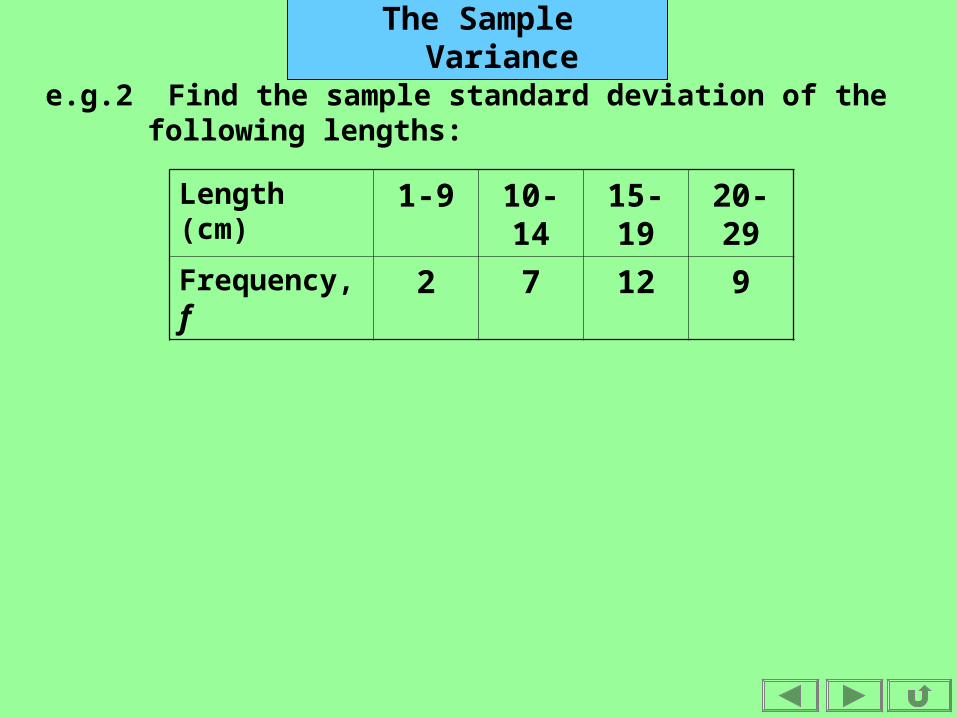
Length (cm)
1-9 10-14 15-19 20-29
Frequency, f
2 7 12 9
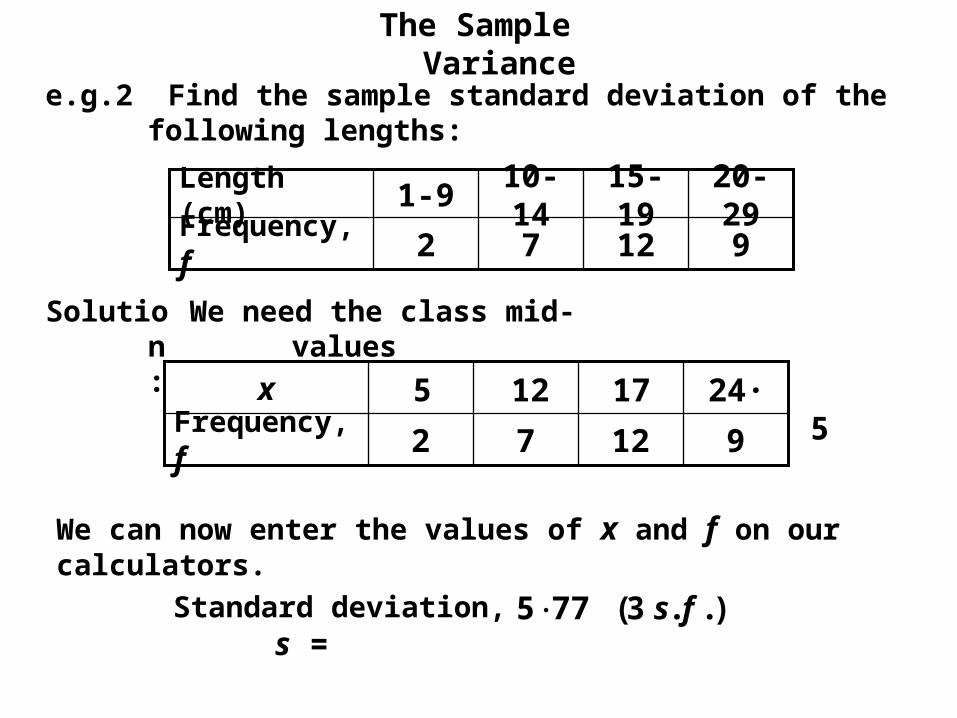
e.g.2 Find the sample standard deviation of the following lengths:
The Sample Variance
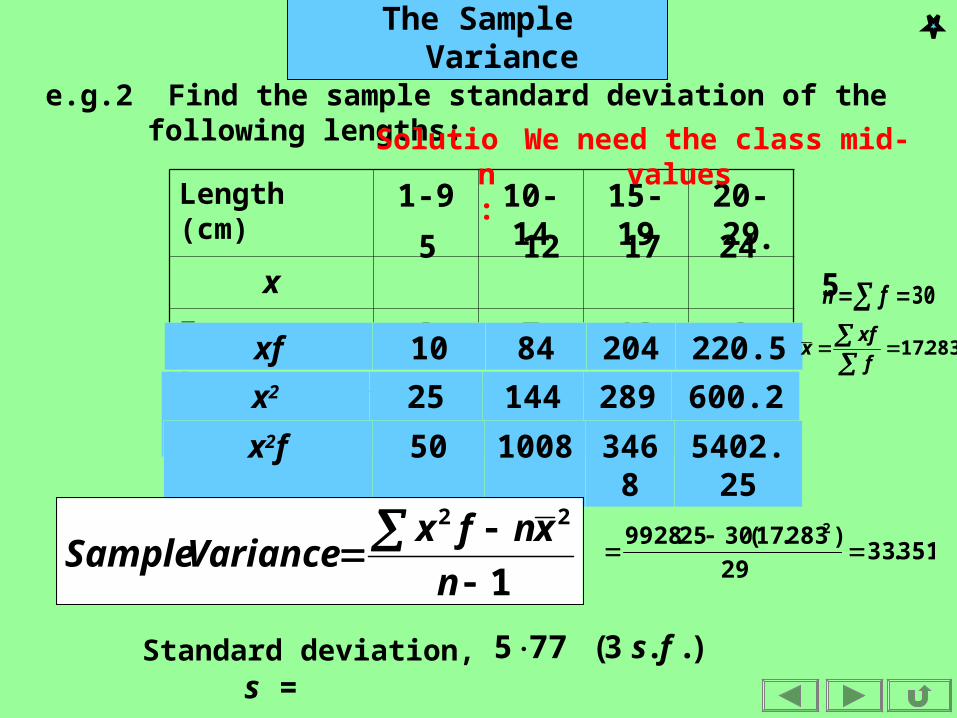
e.g.2 Find the sample standard deviation of the following lengths:
Length (cm)
1-9 10-14 15-19 20-29
x
Frequency, f
2 7 12 9
Solution:
Standard deviation, s =
)..3(775 fs
We need the class mid-values
5 12 17 24·5
x2 25 144 289 600.25
x2f 50 1008 3468 5402.25
xf 10 84 204 220.5 283.17
f
xfx
1
22
n
xnfxVarianceSample 351.33
29
)283.17(3025.9928 2
30 fn
The Sample Variance
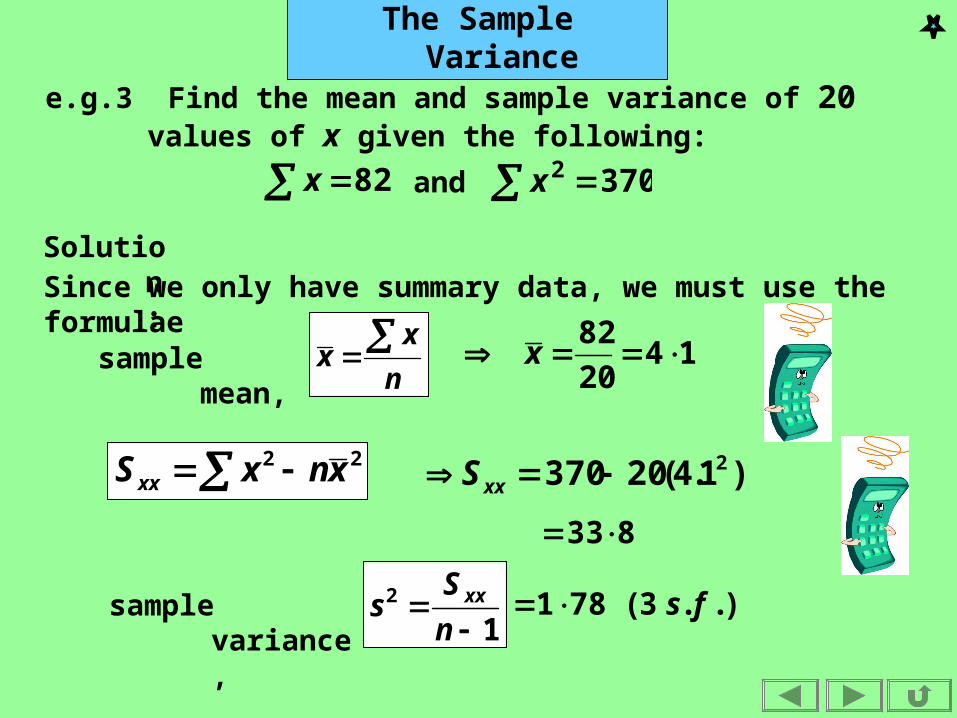
e.g.3 Find the mean and sample variance of 20 values of x given the following:
Solution:
82x 3702 xand
n
xx
sample mean,
1420
82x
Since we only have summary data, we must use the formulae
sample variance,
12
n
Ss xx
22 xnxS xx )1.4(20370 2xxS
833
)..3(781 fs
The Sample Variance
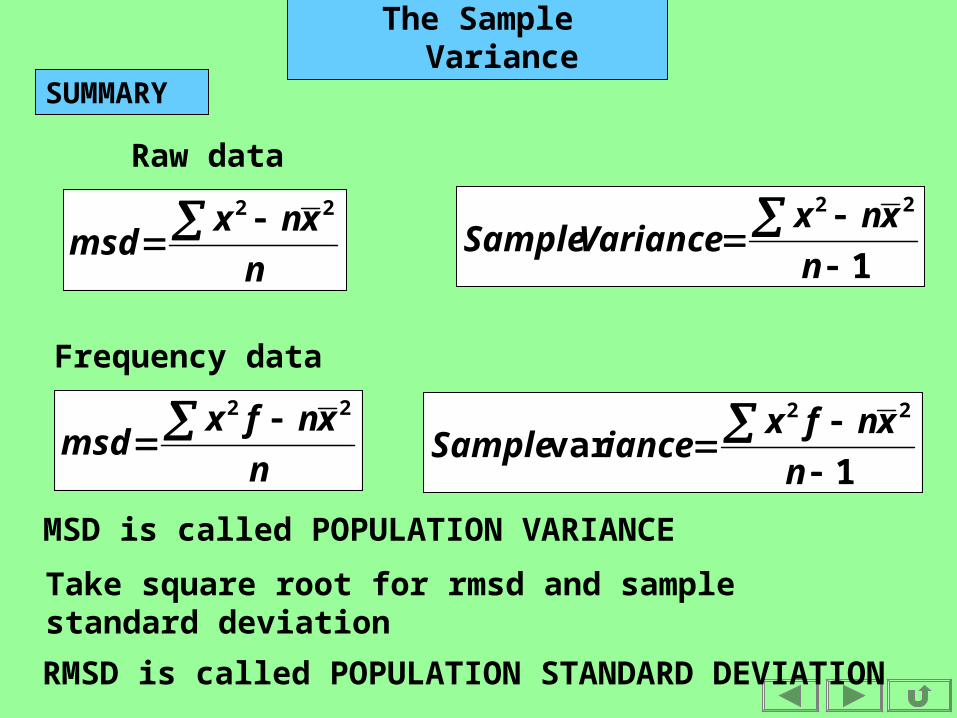
SUMMARY
1var
22
n
xnfxianceSample
1
22
n
xnxVarianceSample
n
xnxmsd
22
n
xnfxmsd
22
Frequency data
Raw data
MSD is called POPULATION VARIANCE
Take square root for rmsd and sample standard deviation
RMSD is called POPULATION STANDARD DEVIATION
The Sample Variance
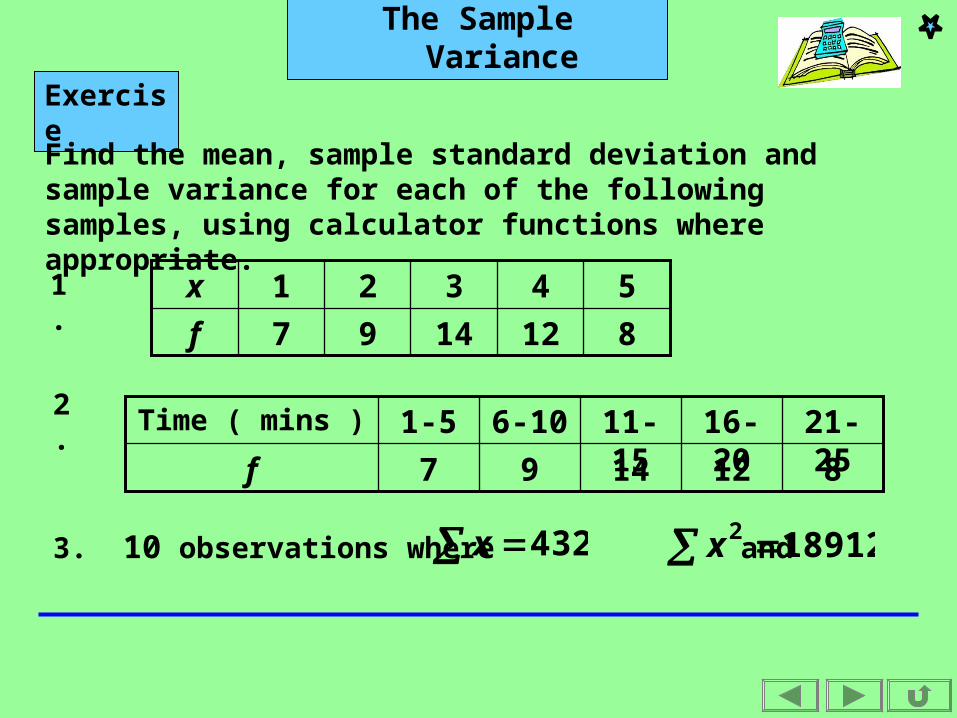
ExerciseFind the mean, sample standard deviation and sample variance for each of the following samples, using calculator functions where appropriate.
1. 8121497f
54321x
2.
8121497f
21-2516-2011-156-101-5Time ( mins )
3. 10 observations where and432 x 189122 x
The Sample Variance
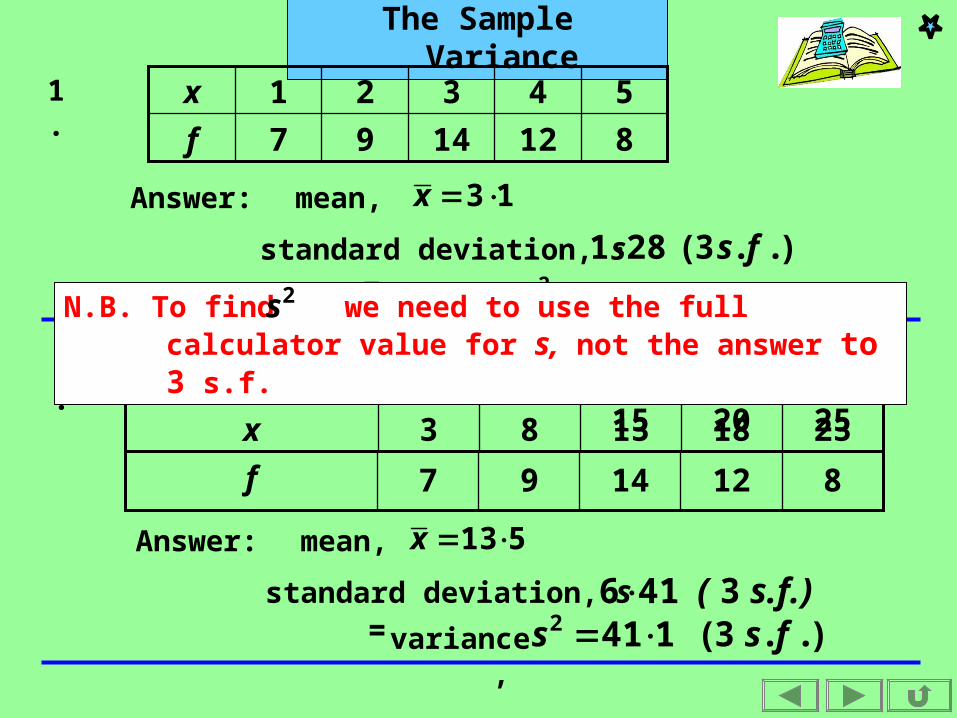
1. 8121497f
54321x
mean, 13x
variance, 6412 s
standard deviation, s = )..3(281 fsAnswer
:
Answer:
mean, 513x
variance, )..3(1412 fss standard deviation, s = )s.f.( 3416
23181383x
Time ( mins )
8121497
2. 21-2516-2011-156-101-5
f
N.B. To find we need to use the full calculator value for s, not the answer to 3 s.f.
2s
The Sample Variance
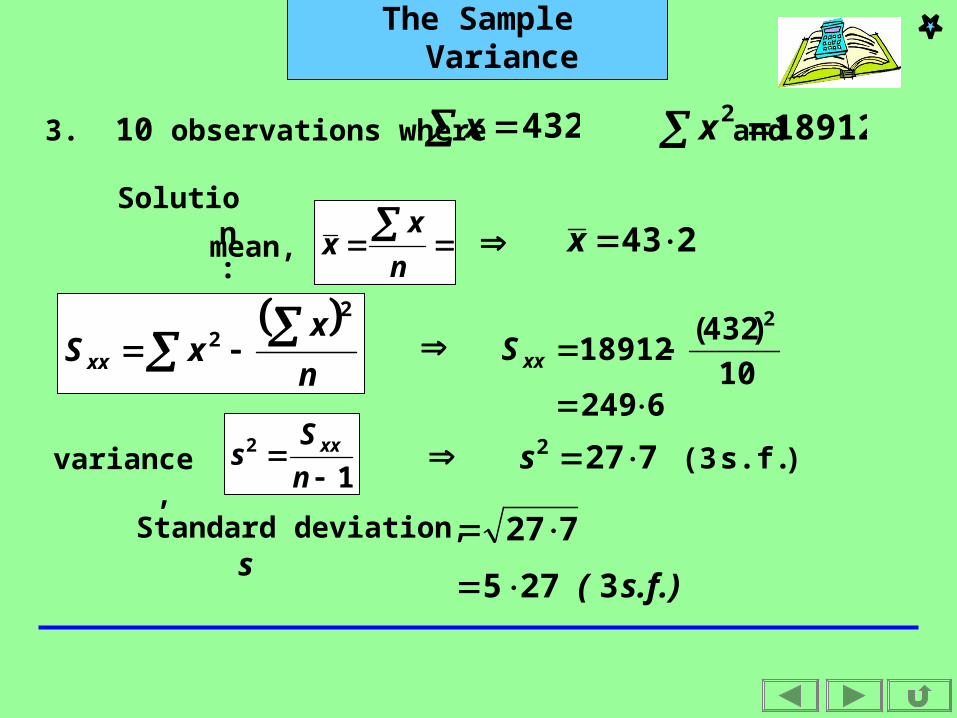
3. 10 observations where and432 x 189122 x
Solution:
Standard deviation, s 727
243 xn
xxmean
,
variance,1
2
n
Ss xx
)s.f.( 3275
) s.f. (3 7272 s
n
xxS xx
2
2 10
)432(18912
2
xxS
6249

The Sample Variance
n
xxmsd
2)(
There are 2 formulae that can be used to measure spread:
1
)( 22
n
xxs
or
the mean square deviation.
the sample variance,
In many books you will find the word variance used for the 1st of these formulae and you may have used it at GCSE.However, our data is nearly always a sample from a large unknown set of data ( the population ) and we take the sample to find out about the population. The 1st formula does not give the best estimate of the variance of the population so is not used.
The Sample Variance
n
xxmsd
2)(
So, there are 2 quantities and their square roots that we need to be clear about
1
)( 22
n
xxs
Also
the mean square deviation
the sample variance,
and
n
xxrmsd
2)( the root mean
square deviation.
and
1
)( 2
n
xxs the sample
standard deviation.
The Sample Variance
,942)( 2
n
xxrmsd 613
1
)( 2
n
xxs
The rmsd is smaller than s ( because we are dividing by a larger number ). Correct to 3 s.f. we have
e.g. Find the root mean square deviation, rmsd, and the sample standard deviation, s, for the following data:
1497x
Use the Statistics function on your calculator and enter the data. Select the list of calculations.You will be able to find the following: ...605553 ...943922 Ignore the calculator notation.
The Sample Variance
Squaring these gives
,678)( 2
n
xxmsd 13
1
)( 22
n
xxs
( variance )
( mean square deviation )
The part of the formula, , is in your
formulae booklet ( see correlation and
regression ), labelled Sxx.
2)( xx
An expanded form of the expression is also given. All you have to do is divide by the correct quantity, n or n 1.
Using the formulae:If summary data are given, you will need to use the formulae instead of the calculator functions.
The Sample Variance
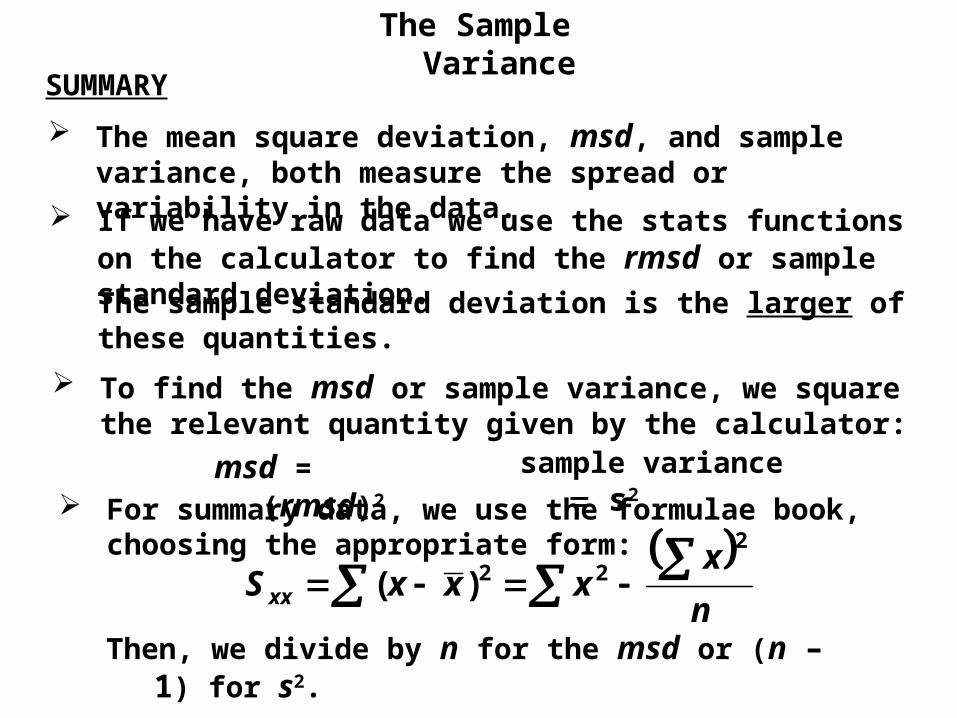
The mean square deviation, msd, and sample variance, both measure the spread or variability in the data.
SUMMARY
To find the msd or sample variance, we square the relevant quantity given by the calculator:
If we have raw data we use the stats functions on the calculator to find the rmsd or sample standard deviation.
msd = (rmsd)2 sample variance s2 For summary data, we use the formulae book,
choosing the appropriate form: n
xxxxS xx
2
22)(
Then, we divide by n for the msd or (n – 1) for s2.
The sample standard deviation is the larger of these quantities.
The Sample Variance
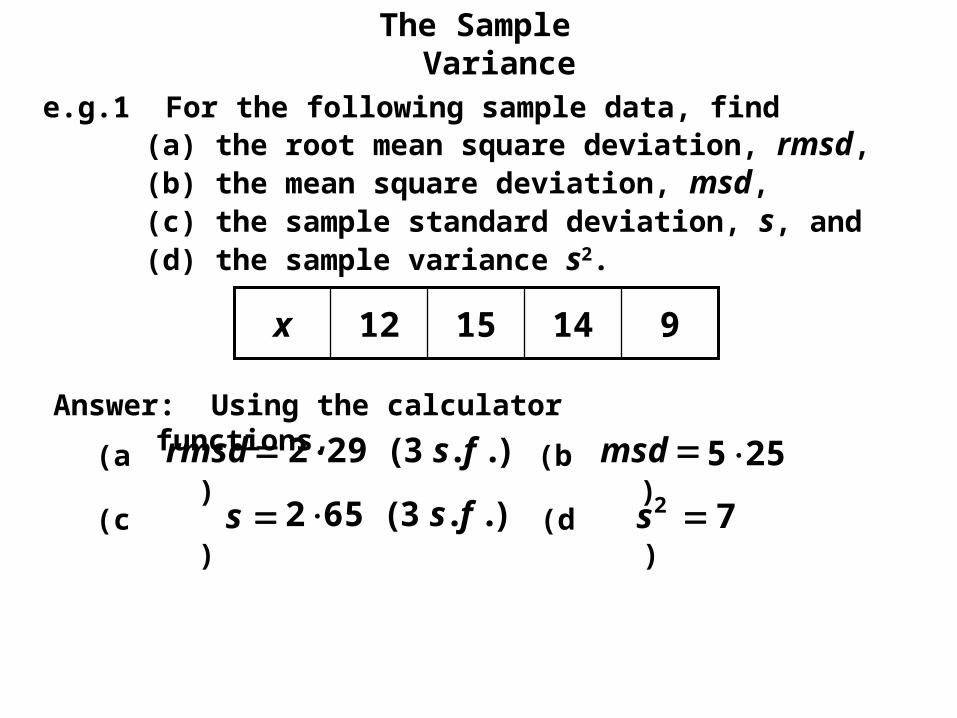
e.g.1 For the following sample data, find (a) the root mean square deviation, rmsd,(b) the mean square deviation, msd, (c) the sample standard deviation, s, and(d) the sample variance s2.
9141512x
Answer: Using the calculator functions,rmsd(a
)msd(b
)s(c) 2s(d
)
)..3(292 fs 255
)..3(652 fs 7
The Sample Variance
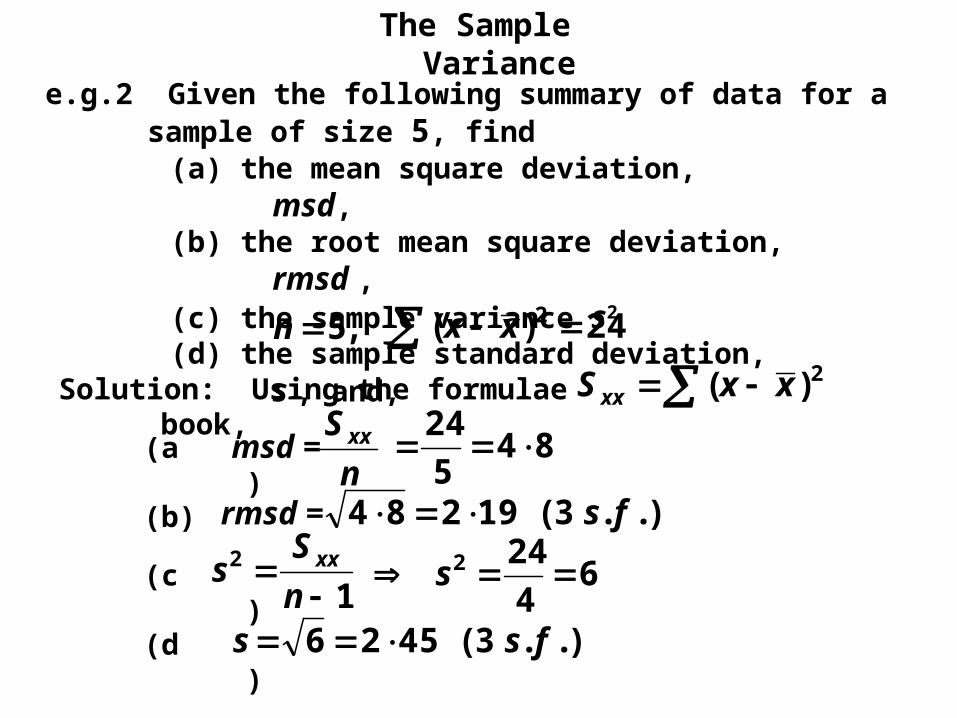
e.g.2 Given the following summary of data for a sample of size 5, find
24)( 2 xx,5n
Solution: Using the formulae book,
n
S xx
64
242 s
)..3(4526 fss
(a) the mean square deviation, msd, (b) the root mean square deviation,
rmsd ,(c) the sample variance s2
(d) the sample standard deviation, s , and,
msd =(a)
(b)
12
n
Ss xx
(c)
(d)
2)( xxS xx
845
24
rmsd = )..3(19284 fs

The Sample Variance
The formula for the variance can be easily adapted to find the variance of frequency data.
n
xxxxS xx
2
22)(
becomes
Frequency Data
f
xffxxxfS xx
2
22)(
As before, we only use the formulae if we are given summary data.
The Sample Variance
e.g.1 Find the mean and sample standard deviation of the following data:
4853Frequency, f
10521x
Solution:
f
xffxxxfS xx
2
22)(
20
410...31410...31 22 xxSSo,
55190
0391019
55190
12
n
Ss xx )..3(173 fss
The Sample Variance
e.g.2 Find the sample standard deviation of the following lengths:
91272Frequency, f
20-2915-1910-141-9Length (cm)
Solution:
Standard deviation, s =
)..3(775 fs
We need the class mid-values
5 12 17 24·5
We can now enter the values of x and f on our calculators.
x
91272Frequency, f
The Sample Variance
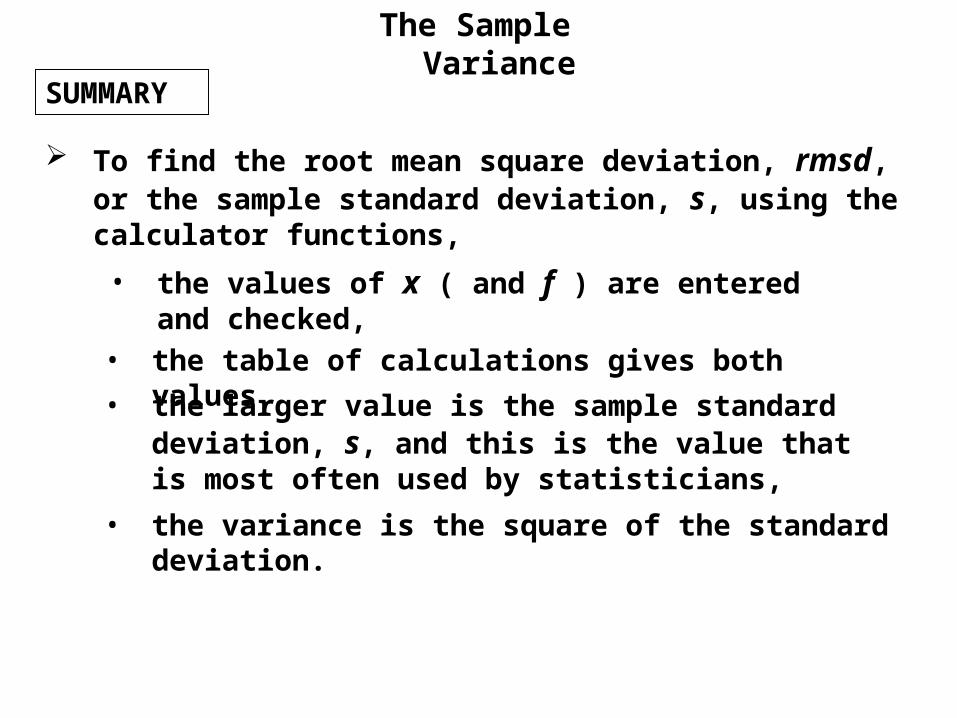
To find the root mean square deviation, rmsd, or the sample standard deviation, s, using the calculator functions,
SUMMARY
• the values of x ( and f ) are entered and checked,
• the table of calculations gives both values,
• the variance is the square of the standard deviation.
• the larger value is the sample standard deviation, s, and this is the value that is most often used by statisticians,
The Sample Variance
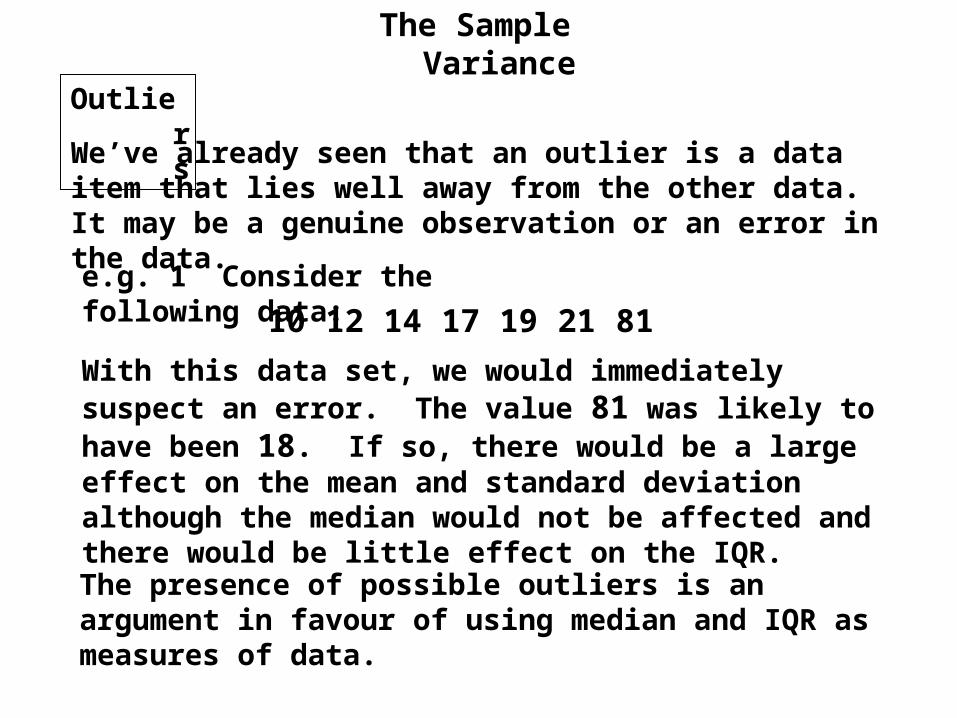
Outliers
We’ve already seen that an outlier is a data item that lies well away from the other data. It may be a genuine observation or an error in the data.
e.g. 1 Consider the following data: 81211917141210
With this data set, we would immediately suspect an error. The value 81 was likely to have been 18. If so, there would be a large effect on the mean and standard deviation although the median would not be affected and there would be little effect on the IQR. The presence of possible outliers is an argument in favour of using median and IQR as measures of data.
The Sample Variance
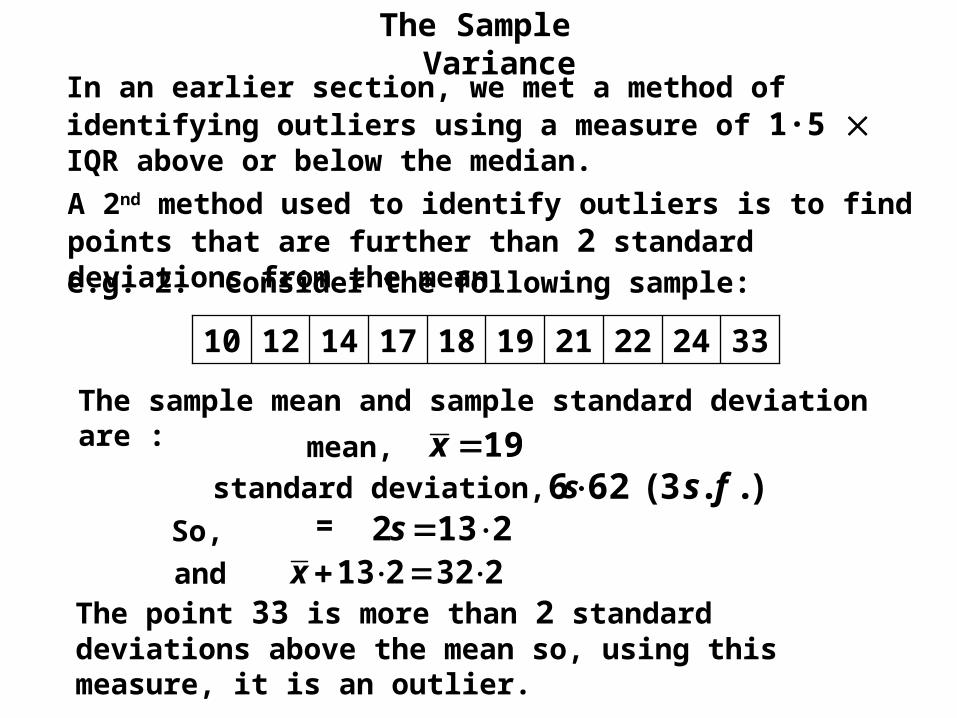
A 2nd method used to identify outliers is to find points that are further than 2 standard deviations from the mean.
The point 33 is more than 2 standard deviations above the mean so, using this measure, it is an outlier.
In an earlier section, we met a method of identifying outliers using a measure of 1·5 IQR above or below the median.
e.g. 2. Consider the following sample:
21 22 24 33191817141210
The sample mean and sample standard deviation are : mean, 19x
standard deviation, s = )..3(626 fs2132 sSo,232213 xand