Embed Size (px)
Citation preview

5th Russia & CIS Petrochemicals Technology Conference & Exhibition25-26 September, 2006, Moscow
Sergey Yaremenko,MRC – Market Report Company
The Russian market of basic polymers:what capacities are essential to satisfy demand?

AgendaAgenda
•• Market is processors!Market is processors!
•• Example Example 1. 1. PVC marketPVC market
•• Example 2Example 2. . PS marketPS market
•• What do we expect from HDPE, LLDPE, PP What do we expect from HDPE, LLDPE, PP markets?markets?

Market is processorsMarket is processors!!
• Oil and naphtha – excellent correlation (prices go simultaneously)
Source: CMAI
• Oil and polymers – good correlation (prices go with short lag)
• Oil and integral margin of polymer production– NO correlation
ExampleExample 1. 1. PVC marketPVC market. . RussiaRussia
100
200
300
400
500
600
0
KT
2000 2001 2002 2003 2004 2005 2006 2007 2008
700
1998 1999
1999-2004, AAGR - 24%
2005-2008, AAGR - 12%
European profile producers
Here and further data for 2006–2010 forecast
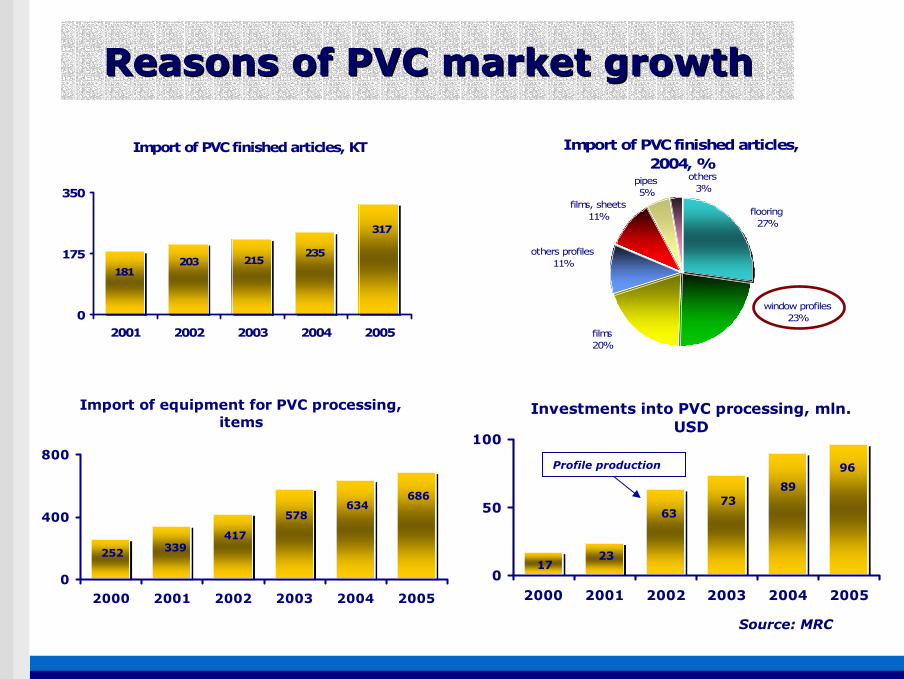
Import of equipment for PVC processing, items
252 339417
686634
578
0
400
800
2000 2001 2002 2003 2004 2005
Investments into PVC processing, mln. USD
89
96
7363
2317
0
50
100
2000 2001 2002 2003 2004 2005
Reasons of PVC market growthReasons of PVC market growth
Import of PVC finished articles, KT
181203 215
235
317
0
175
350
2001 2002 2003 2004 2005
Import of PVC finished articles, 2004, %
flooring27%
films20%
window profiles23%
others profiles11%
films, sheets11%
pipes5%
others3%
Profile production
Source: MRC
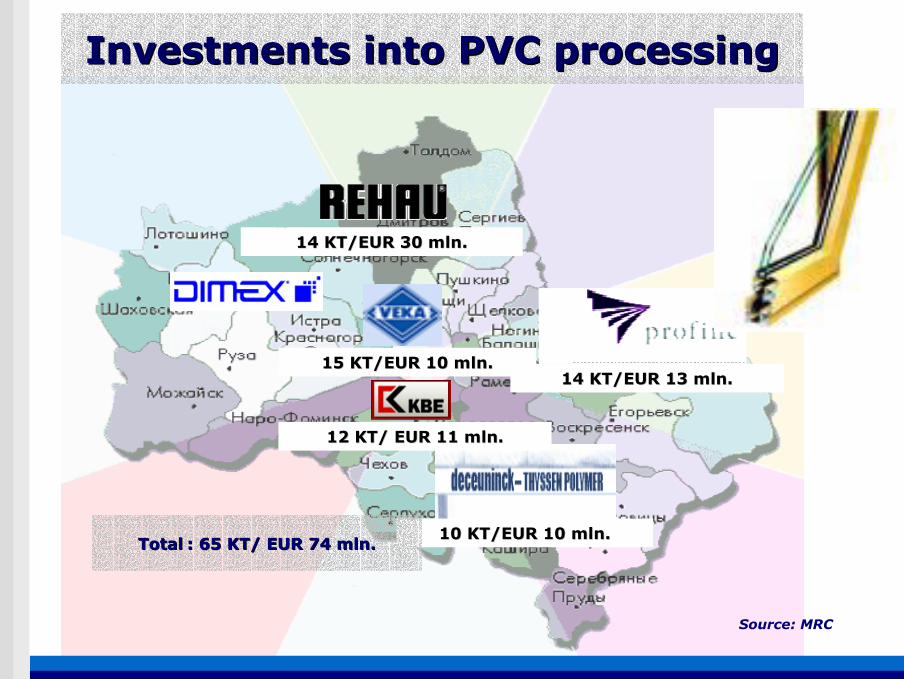
Investments into PVC processingInvestments into PVC processing
14 KT/EUR 30 mln14 KT/EUR 30 mln..
15 KT/EUR 10 mln15 KT/EUR 10 mln..14 KT/EUR 13 mln14 KT/EUR 13 mln..
12 KT/ EUR 11 mln12 KT/ EUR 11 mln..
10 KT/EUR 1010 KT/EUR 10 mlnmln..TotalTotal : 65 KT/ EUR 74 mln: 65 KT/ EUR 74 mln..
Source: MRC

Construction per capita, 2004, m2
2,8
4,2
3,2
1,3
0,6
0,20,3
0
1
2
3
4
5
Poland Hungary CzechRep
Romania Bulgaria Russia Ukraine
PVC consumption per capita, MT
8,0
10,0
7,5
1,8 1,8 2,0
3,4
0
2
4
6
8
10
Poland Hungary CzechRep
Romania Bulgaria Russia Ukraine
Russia and C&EE countriesRussia and C&EE countries
PVC prof iles consumption per 1000 housing, MT
0
4
8
12
16
Poland
Czech R
ep
UK
Lithuania
Ireland
Turkey
Belgium
Slovenia
Latvia
Estonia
Austria
Slovakia
Hungary
Germ
any
France
Russia
Profiles consumption in Europe, 2003
Others21%
UK21%
Poland12%
Russia6%
Germany16%
Turkey11%
Czech Rep3%
France10%
Source: MRC

C&EEC&EE: : PVC consumption, PVC consumption, КТКТ
C&EE 803
Slovakia26
Lithuania15
Estonia3
Ex-Yugoslavia71
Czech Rep55
Poland376
Turkey588
Hungary110
Ukraine61
Bulgaria16 Romania
45
Russia448
Belorus23
0
2
4
6
8
10
12
0% 5% 10% 15% 20% 25% 30% 35% 40% 45% 50%
Market increase, 99-04,%
PVC per capita, kg
2004: 2004: PVC consumption per capita isPVC consumption per capita is 4,4,66 kgkg
in the worldin the world 5,5,66 kgkg
in Chinain China 44,,4 kg4 kg
in Russiain Russia 3,2 3,2 kgkg
Source: Harriman Chemsult, MRC

Poland462
Hungary116
Czech Rep60
Romania89
Bulgaria19
Ukraine142
Belorus38
Estonia5
43Slovakia Ex-Yugoslavia
55
C&EE1 033
Russia839
Turkey862
Lithuania26
0
3
6
9
12
15
0% 5% 10% 15% 20%
Market increase, 05-10,%
PVC per capita, kg
2010: 2010: PVC consumption per capita PVC consumption per capita -- 6,6,33 kgkg
in the worldin the world 77,,00 kgkg
in Chinain China 66,,77 kgkg
in Western Europein Western Europe 14,5 14,5 kgkg
in Russiain Russia 5,9 5,9 kgkg
Source: Harriman Chemsult, MRC
C&EEC&EE: : PVC consumption, PVC consumption, КТКТ

0
100
200
300
400
500
600
700
800
900
1000
1100
2003 2004 2005 2006 2007 2008 2009 2010 2011 2012
Domestic PVC Imported PVC Imported goods from PVC
Capacities300 КТ
Bashchim? LUKoil -Neftechem? Sibmanagement? Sibur? + 300 КТ
100 КТ
Additional impulsefor processors
200 КТ
КТ
* PVC capacities utilization in 2005 - 98%
* Current additional margin of PVC producer - 150 USD
Source: MRC
PVCPVC--SS. . Market development till 2012Market development till 2012

PVC-S prices
884
837
767808
894915
875 865840
975 974 973956 963 967 963
920925
695709723
986966949
1230121512201190
700
800
900
1 000
1 100
1 200
1 300
1 400
1 500
Jan.05 Feb.05 Mar.05 Apr.05 May 05 Jun.05 Jul.05 Aug.05 Sep.05 Oct.05 Nov.05 Dec.05 Jan.06 Feb.06
FOB NWE, USD/ MT average ICIS-LOR/ Platts Domestic market, Russia, including duty without VAT, USD/MT
PVC in Russia: shortage timesPVC in Russia: shortage times
+USD 200 !!!
Source: MRC

LDPE consumption and prices
0
200
400
600
800
2000 2001 2002 2003 2004 2005 2006 2007 2008
KT
0
600
1200USD
PS consumption and prices
0
150
300
2000 2001 2002 2003 2004 2005 2006 2007 2008
KT
0
700
1400USD
PP consumption and prices
0
200
400
600
800
2000 2001 2002 2003 2004 2005 2006 2007 2008
KT
0
650
1300USD
HDPE consumption and prices
0
200
400
600
800
2000 2001 2002 2003 2004 2005 2006 2007 2008
KT
0
650
1300
USD
ExampleExample 22. . PS marketPS market
+ USD 41*
* Russia: domestic prices without VAT in 1H2006 compared to prices in Western Europe (CMAI)
** GPPS prices in Russia and Western Europe
+ USD 151*
+ USD 94* - USD 10**
Source: MRC

0
100
200
300
400
500
2002 2003 2004 2005 2006 2007 2008 2009 2010
Domestic PS PS export PS import
Capacities
PS:PS: market development till 20market development till 201010
120 КТ
+100 КТ
60 КТ
КТ
* PS capacities utilization in 2005 - 60%
* PS producers don’t get the additional margin
+50 КТ
Styrovit? + 50 КТ?
Consumption
Salavat? + 70 КТ?
Source: MRC

Import of equipment for PS processing, items
73 89
152
190
165169
0
100
200
2000 2001 2002 2003 2004 2005
Investments into equipment for PS processing, mln. USD
23
3034
21
480
25
50
2000 2001 2002 2003 2004 2005
Investments into PS processingInvestments into PS processing
Investments into PS processing, 2005, %
EPS sheets28%
sheet extrusion
32%
IM11%
films4%
others25%
- Containers: Huhtamaki CIS, Aktiv-Greiner, Оmsk Chemical Company
- New investments into BOPS: Alkopack, Marta
- Market needs freon stable brands (Stinol, Atlant, Nord - 50 КТ)
- EPS/XPS sheets: Penoplex, Dow
Source: MRC

0
100
200
300
400
500
600
700
800
2002 2003 2004 2005 2006 2007 2008 2009 2010
Domestic HDPE HDPE export HDPE import
Capacities
HDPEHDPE: : market development till 20market development till 201010
160 КТ
Kazanorgsyntez + 170 Кт ?
10 КТ
КТ
* HDPE capacities utilization in 2005 - 95%
* Current additional margin of HDPE producers is about 100 USD
SIBUR, Nizhnekamskneftechem + 240 Кт ?
Consumption
Salavat + 120 Кт ?
Source: MRC
0
100
200
300
2002 2003 2004 2005 2006 2007 2008 2009 2010
Domestic LLDPE LLDPE export LLDPE import
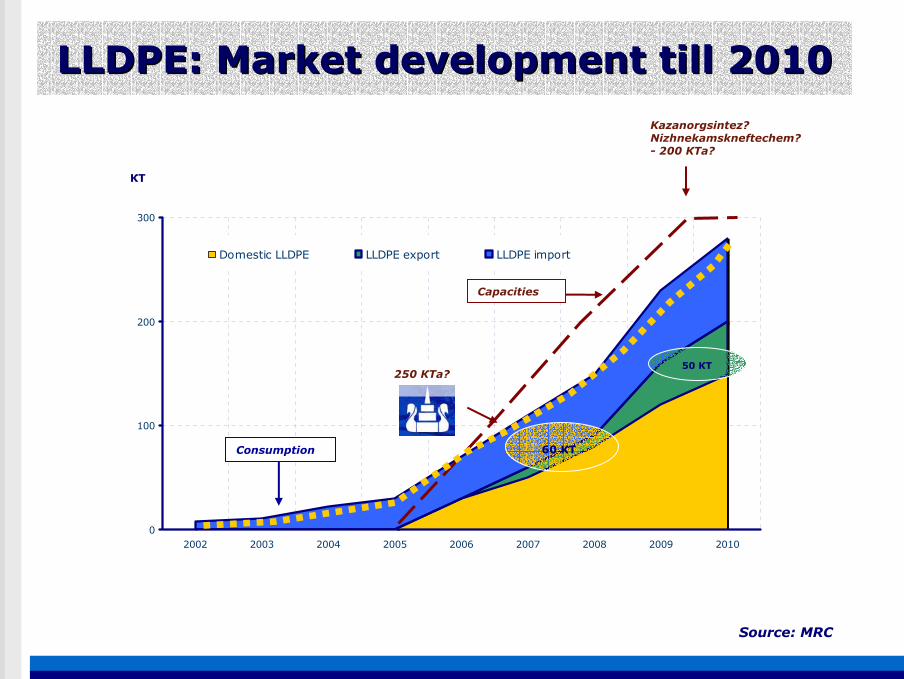
LLDPELLDPE: : Market development till 20Market development till 201010
60 КТ
250 КТа?50 КТ
КТ
Kazanorgsintez? Nizhnekamskneftechem? - 200 КТа?
Consumption
Capacities
Source: MRC

Import of equipment for PE processing, items
280 263
539
305
176172
0
300
600
2000 2001 2002 2003 2004 2005
Investments into equipment for PE processing, mln. USD
35
76
382723
140
50
100
2000 2001 2002 2003 2004 2005
Investments into PE processingInvestments into PE processing
- Pipes: Eurotrubplast (Russia, Ukraine, Belarus), Kazanorgsintez
Investments into PE processing, 2005 , %
Coatings2%
IM16%
EBM13%
Films22%
Pipes24%
Others23%
- LLDPE -Ukraine: Khekro, Vozko, Plastmodern, Ukrplastic, (almost 25 КТ)
- Films: DPО Plastic, Polimer, Uralplastic, Multiflex, stretch – Regent, Papirus
- ЕВМ: WBD (Lianozovskiy МC, Sibirskoe moloko, Plant of children milk products), Suzdalskiy МP, Procter and Gamble Novomoskovsk, Mib-lising
- Pipes: KWH. Who is next? – Pipelife, Wavin, Uponor?
Source: MRC

0
100
200
300
400
500
600
700
800
2002 2003 2004 2005 2006 2007 2008 2009 2010
Domestic PP PP export PP import
Capacities
PPPP: : market development till 20market development till 201010
+180 КТ
60 КТ
КТ
* PP capacities utilization in 2005 - 95% * Additional margin of PP producers is about USD 100
+120 КТ
Titan? Тomsk? Tobolsk? +300 КТ?
Consumption
130 КТ
Source: MRC

Import of equipment for PP processing, items
75 90 65
281
237
750
200
400
2000 2001 2002 2003 2004 2005
Investments into equipment for PP processing, mln. USD
28
105
6101710
0
60
120
2000 2001 2002 2003 2004 2005
Investments into PP processingInvestments into PP processing
Investments into PP processing, 2005 , %
BOPP-films49%
IM15%
Bags, filaments5%
Pipes3%
Sheet extrusion
6%
Other films6%
Others16%
- Ukraine: BOPP-films (Ukrplastic, Chemosvit), IM (Aleana, Atem, Ista, Office-mebel)
- Pipes: Plastikor, Stroypolimer, Plastika-Tyumen, Pereval
- Filaments, bags: Aleko, Chimpack, Isratek, МНМ
- BOPP - films: Novatek, Grinn, Bepack, Roseuroplast, Biaksplen (130 КТ)
- IM: Plastic, AvtoVAZ, Polad, Technoplast, Euromoulding, Berikap
Source: MRC

Sergey Yaremenko, Managing Director, Market Report Company
[email protected]; www.mrcchemical.com
Moscow +7 495 543 91 94; Kiev +38 044 240 82 35
Thank you for your timeThank you for your time!!