Embed Size (px)
Citation preview
University of Tennessee, KnoxvilleTrace: Tennessee Research and CreativeExchange
Doctoral Dissertations Graduate School
8-2014
The Roles Boards Play in CEO SuccessionPlanningYi Li RivoltaUniversity of Tennessee - Knoxville, [email protected]
This Dissertation is brought to you for free and open access by the Graduate School at Trace: Tennessee Research and Creative Exchange. It has beenaccepted for inclusion in Doctoral Dissertations by an authorized administrator of Trace: Tennessee Research and Creative Exchange. For moreinformation, please contact [email protected].
Recommended CitationRivolta, Yi Li, "The Roles Boards Play in CEO Succession Planning. " PhD diss., University of Tennessee, 2014.https://trace.tennessee.edu/utk_graddiss/2850
To the Graduate Council:
I am submitting herewith a dissertation written by Yi Li Rivolta entitled "The Roles Boards Play in CEOSuccession Planning." I have examined the final electronic copy of this dissertation for form and contentand recommend that it be accepted in partial fulfillment of the requirements for the degree of Doctor ofPhilosophy, with a major in Business Administration.
Tracie Woidtke, Major Professor
We have read this dissertation and recommend its acceptance:
Mike Ehrhardt, Ray DeGenaro, Bruce Behn
Accepted for the Council:Dixie L. Thompson
Vice Provost and Dean of the Graduate School
(Original signatures are on file with official student records.)
The Roles Boards Play in CEO Succession Planning
A Dissertation Presented for the
Doctor of Philosophy
Degree
The University of Tennessee, Knoxville
Yi Li Rivolta
August 2014
ii
ABSTRACT
A lack of CEO succession planning increases business risk as disruption is more likely
during a CEO transition. One difficulty of examining the importance of CEO succession
planning is that the planning process is difficult to observe and evaluate. The main
purposes of this dissertation are two-fold. First is to investigate whether CEO succession
planning matters by comparing disruption costs in firms with planned departure and those
with unexpected CEO departures due to death and illness. The second purpose is to
investigate whether inside or outside directors improve organizational resiliency using the
context of sudden CEO departures when CEO succession planning is not possible and the
former CEO is not available for consultation. Using a unique hand-collected data set of
CEO turnovers from 1996 to 2009, I find evidence that firms with unexpected CEO
departures have significantly shorter lead time and greater disruption costs, compared to
firms with planned CEO departures. Specifically, shorter lead time is associated with less
favorable cumulative stock performance and greater reduction in capital expenditure
around the incumbent CEO’s departure. These results may indicate that a lack of CEO
succession planning is associated with greater disruption costs. In fact, a lack of
succession planning could cost firms approximately $136 million if the incumbent CEO
departs unexpectedly. In addition, firms with both inside directors other than the CEO
and well-connected outside directors are most resilient, whereas firms with neither non-
CEO inside directors nor connected outside directors are least resilient and suffer the
most. In addition, firms with greater inside director presence are less likely to engage in
big bath accounting, i.e., taking advantage of the departure to largely write off assets.
iii
TABLE OF CONTENTS
INTRODUCTION .................................................................................................................................... 1 CHAPTER I DOES LEAD TIME IN CEO SUCCESSION MATTER? ................................. 5
Abstract .................................................................................................................................................................... 6 1. Introduction .................................................................................................................................................... 7 2. Prior Literature and Hypotheses Development ................................................................................ 12 3. Data and Summary Statistics ................................................................................................................. 15 4. Analysis ........................................................................................................................................................ 18 5. Multivariate analysis ................................................................................................................................ 25 6. Conclusion ................................................................................................................................................... 29 References ............................................................................................................................................................ 31 Appendix A1 ........................................................................................................................................................ 35 Appendix A2 ........................................................................................................................................................ 37
CHAPTER 2 BOARD COMPOSITION AND ORGANIZATIONAL RESILIENCE:
EVIDENCE FROM SUDDEN CEO DEPARTURES ............................................................... 51 Abstract ................................................................................................................................................................. 52 1. Introduction ................................................................................................................................................. 53 2. Prior Literature and Hypotheses Development ................................................................................ 57 3. Data and Summary Statistics ................................................................................................................. 61 4. Analysis Using the Sudden CEO Departures ................................................................................... 65 5. Additional analysis using a stricter definition of sudden CEO departures .............................. 76 6. Conclusion ................................................................................................................................................... 79 References ............................................................................................................................................................ 81 Appendix B1 ........................................................................................................................................................ 85 Appendix B2 ........................................................................................................................................................ 87
CONCLUSION .................................................................................................................................... 103 VITA ....................................................................................................................................................... 104
iv
LIST OF TABLES
Table 1 Planned retirement and unexpected CEO departure by time ..................................... 37 Table 2 Firm, corporate governance, and departing CEO characteristics ............................. 38 Table 3 Comparison of transitional characteristics and disruption costs between planned
and unexpected CEO departures ....................................................................................................... 39 Panel A. Comparison of CEO transitional characteristics ................................................................... 40 Panel B: Cumulative abnormal stock returns ........................................................................................... 40
Panel C. Change in firm performance related measures ................................................................. 40
Table 4 Firm and board adjustment comparison .......................................................................... 41 Table 5 Differences in transitional costs between with above versus below median lead
time when Planned retirement............................................................................................................ 42 Panel A. Comparison of firm and corporate governance characteristics ........................................ 42 Panel B. Comparison of CEO transitional characteristics ................................................................... 43 Panel C: Cumulative abnormal stock returns ........................................................................................... 43 Panel D. Change in sales and capital expenditure .................................................................................. 43
Table 6 Firm and board adjustments by firms with above versus below lead time when
Planned retirement ................................................................................................................................. 44 Table 7 Multivariate Analysis on Excess Stock Returns after Incumbent CEO Departure
..................................................................................................................................................................... 45 Table 8 Multivariate analysis: Change in Sales around Incumbent CEOs’ Actual
Departure .................................................................................................................................................. 46 Table 9 Multivariate analysis: Change in capital expenditures around incumbent CEOs’
actual departure in firms ...................................................................................................................... 48 Table 10 The Cost of CEO Succession Planning ......................................................................... 49 Table 11 Comparison of firm and corporate governance characteristics based on inside
director presentation.............................................................................................................................. 87 Table 12 Comparison of CEO transition characteristics based on inside director
presentation.............................................................................................................................................. 88 Panel A. Permanent Replacement CEO Characteristics ....................................................................... 88 Panel B. Replacement Transitional Characteristics ............................................................................... 88
Table 13 Comparison of changes in stock and firm performance around sudden CEO
departures based on inside director presence ................................................................................. 89 Panel A Cumulative abnormal returns around the departure announcement ................................ 89 Panel B. Change in industry and performance adjusted performance around departure
announcement ...................................................................................................................................................... 89 Panel C: Big bath hypothesis ......................................................................................................................... 89
Table 14 Multivariate analysis on the determinants of inside succession and the
appointment of an inside director as the new CEO ...................................................................... 91 Table 15 Do outside directors with connections influence resilience in firms with sudden
CEO departures? .................................................................................................................................... 92 Panel A. Firm and Permanent Replacement CEO Characteristics .................................................... 93 Panel B. CEO Transitional Characteristics .............................................................................................. 93 Panel C. Change in stock and firm performance around sudden departures ................................. 94 Panel D Percentage of firms taking a big bath ......................................................................................... 94
v
Table 16 Multivariate analysis: Change in firm performance around sudden CEO
departures ................................................................................................................................................. 95 Table 17 Multivariate analysis: firms taking a big bath after sudden CEO departures ..... 97 Table 18 Comparison of changes in stock and firm Performance around unexpected CEO
departures based on inside director presence ................................................................................. 99 Panel A Cumulative abnormal returns around the departure announcement ................................ 99 Panel B. Change in industry and performance adjusted performance around departure .......... 99 Panel C. Big bath hypothesis .......................................................................................................................... 99
Table 19 Multivariate analysis: Change in firm performance around unexpected CEO
departures ............................................................................................................................................... 101
vi
LIST OF FIGURES
Figure 1. Time line of planned successions ............................................................................... 50 Figure 2. Time line of unexpected CEO departures ................................................................ 50
1
INTRODUCTION
CEO succession planning is the process by which the board of directors prepares
for the transition of leadership from one CEO to the next. It is cited as one of the most
important yet challenging roles of the board (Biggs, 2004). A lack of CEO succession
planning is disruptive and increases business risk. Furthermore, this disruption in
business activities creates costs that adversely affect shareholder wealth (Vancil 1987).
The perceived importance of CEO succession planning is underscored by the new SEC
rule (SEC Staff Legal Bulletin 14E, 2009), which recommends firms to include a CEO
succession planning proposal in their proxy statements. Despite the apparent importance
of CEO succession planning, literature on its necessity and process during the transition
has been scarce, possibly because firms are hesitant to disclose detailed succession
planning information.
There are two papers in my dissertation. The purpose of the first paper is two-
fold. First, I examine whether CEO succession planning matters. Second, I investigate
which actions board of directors take to prepare for the transition. Because the succession
planning process is difficult to observe, I use lead time – the time between the incumbent
CEO’s departure announcement and the actual departure date to proxy the possibility of
succession planning. Specifically, I examine whether firms with planned CEO departures
(i.e., through retirement) have longer lead time and lower disruption costs compared to
firms with unexpected CEO departures (i.e., due to death, illness, and sudden
resignation). Presumably, firms with planned CEO retirement will have time to make
changes to their board in preparation for the succession, resulting in a smoother transition
and lower disruption costs. By contrast, firms with unexpected CEO departures may not
2
have time to make adjustments to their boards, leading them to experience greater
disruption costs. Albeit not a perfect measure for the actual length or depth of the
succession planning process, I argue that lead time is a close proxy for the likelihood of
succession planning in that it allows firms to compose a succession plan even if there is
none in place.
The purpose of the second paper is to investigate whether certain board
characteristics are related to a firm’s resilience by examining sudden CEO departures,
when CEO succession planning is not possible. Understanding the relation between board
composition and a firm’s ability to quickly recover from shocks such as a sudden CEO
departure is important in understanding a firm’s ability to manage risk. Specifically, I
examine whether non-CEO inside directors improve a firm’s ability to quickly recover
from a sudden loss in executive leadership. Inside directors may possess superior firm
specific knowledge and experience which may allow firms to recover from shocks more
quickly. For instance, inside directors may be better able to assume the role of CEO in
either a permanent role for a quick recovery or in a temporary role to provide stability
during the search for a new CEO. Agrawal, Knoeber, and Tsoulouhas (2006) indicate that
it is less costly for firms to replace a CEO with an internal candidate, and thus, firms only
choose external candidates when they are superior. Moreover, Masulis and Mobbs (2009)
suggest that inside directors can provide higher quality internal candidates. In contrast,
too many inside directors on a firm’s board is often associated with ineffective boards
and entrenchment.
I further examine whether outside directors with numerous connections enhance a
firm’s resilience, or mitigate the costs associated with sudden CEO departures. Coles,
3
Daniel, and Naveen, and Omer, Shelley, and Tice (2012) indicate that outside directors
may add value through their networks. Thus, well-connected outside directors may be
better able to quickly identify through their networks highly qualified replacements to
lead the recovery. In contrast, Fich and Shivdasani (2006) argue that outside directors
sitting on numerous boards are too busy to effectively fulfill their responsibilities as
directors. In this case, outside directors may quickly choose replacements through their
connections, but the replacements may not be well qualified to lead a recovery.
I find evidence that firms with unexpected CEO departures have significantly
shorter lead time and greater disruption costs, compared to firms with planned CEO
departures. Specifically, shorter lead time is associated with less favorable cumulative
stock performance and greater reduction in capital expenditure around the incumbent
CEO’s departure. These results may indicate that a lack of CEO succession planning is
associated with greater disruption costs. In fact, a lack of succession planning could cost
firms approximately $136 million if the incumbent CEO departs unexpectedly. In
addition, firms with both inside directors other than the CEO and well-connected outside
directors are most resilient, whereas firms with neither non-CEO inside directors nor
connected outside directors are least resilient and suffer the most. In addition, firms with
greater inside director presence are less likely to engage in big bath accounting, i.e.,
taking advantage of the departure to largely write off assets.
This dissertation contributes to the CEO succession planning literature by
investigating whether and how CEO succession planning matters. To my knowledge, this
is the first study to use lead time as a proxy for succession planning and to compare firms
with planned versus unexpected CEO departures in order to evaluate the importance of
4
CEO succession planning. This comparison permits to determine whether a longer lead
time reduces or offsets disruption costs associated with CEO succession planning. To my
knowledge, this paper is also the first to examine the actions firms make to their boards to
prepare for the transition of power prior to a CEO departure.
The findings in this dissertation are of particular importance in light of the new
SEC requirement regarding CEO succession planning (see SEC Staff Legal Bulletin 14E,
2009). Indeed, survey data1 reveals a surprisingly lack of preparedness for top leadership
transitions in US companies. For instance, only about half (51%) of survey respondents
could name a permanent successor if needed, and 39% reported that they had zero viable
internal candidates. If CEO succession matters, perhaps firms need to be better prepared
and have a succession plan in place to ensure a smoother transition. My findings show
that longer lead time in CEO succession planning is highly related to lower disruption
costs, and lend support to the new SEC requirement. CEO succession planning should,
indeed, be a core board responsibility, along with conventional roles such as
compensation, governance, and auditing.
1 Hendrick and Struggle 2010 survey on CEO succession planning of 140 CEOs and directors of North
America public and private companies. Source: http://rockcenter.law.stanford.edu/wp-
content/uploads/2010/06/CEO-Survey-Brochure-Final2.pdf

5
CHAPTER I
DOES LEAD TIME IN CEO SUCCESSION MATTER?
6
Abstract
A lack of CEO succession planning increases business risk as disruption is more likely
during a CEO transition (Vancil 1987). In October 2009, the Securities and Exchange
Commission (SEC) issued Staff Legal Bulletin No. 14E regarding 14a-8(i)(7), which
fully elevated CEO succession planning to the status of a core board responsibility, along
with conventional roles such as compensation, governance, and auditing. One difficulty
of examining the importance of CEO succession planning is that the planning process is
difficult to observe and evaluate. The main purpose of this paper is to use lead time (the
number of days between the incumbent CEOs’ departure announcement date and their
actual departure date) to proxy the possibility of CEO succession planning, and to
investigate whether CEO succession planning matters by comparing disruption costs in
firms with planned departure and those with unexpected CEO departures due to death and
illness. Using a unique hand-collected data set of 919 CEO turnovers from 1999 to 2008,
I find evidence that firms with unexpected CEO departures have significantly shorter lead
time and greater disruption costs, compared to firms with planned CEO departures.
Specifically, shorter lead time is associated with less favorable cumulative stock
performance and greater reduction in capital expenditure around the incumbent CEO’s
departure. These results indicate that a lack of CEO succession planning is associated
with greater disruption costs. In fact, a lack of succession planning could cost firms
approximately $136 million if the incumbent CEO departs unexpectedly.
7
1. Introduction
CEO succession planning is the process by which the board of directors prepares
for the transition of leadership from one CEO to the next. It is cited as one of the most
important yet challenging roles of the board (Biggs, 2004). A lack of CEO succession
planning is disruptive and increases business risk. Furthermore, this disruption in
business activities creates costs that adversely affect shareholder wealth (Vancil 1987).
The perceived importance of CEO succession planning is underscored by the new SEC
recommendation (SEC Staff Legal Bulletin 14E, 2009), which encourages firms to
include a CEO succession planning proposal in their proxy statements.
Despite the apparent importance of CEO succession planning, literature on its
necessity and process during the transition has been scarce, possibly because firms are
hesitant to disclose detailed succession planning information. Consider for instance the
recent change in leadership at Ford Motor Co. When announcing that Mark Field will
succeed Allan Mulally as new Chief Executive Officer, Ford’s spokeswoman mentioned
that the “company takes succession planning very seriously and has succession plans in
place for each of the key leadership positions. However, for competitive reasons, Ford
does not discuss succession plans externally”2. This example highlights how difficult it
can be for researchers to investigate whether and how CEO succession planning matters,
mainly because the planning process is difficult to observe and evaluate.
The purpose of this paper is two-fold. First, I examine whether CEO succession
planning matters. Second, I investigate which actions board of directors take to prepare
for the transition. Because the succession planning process is difficult to observe, I use
2 Keith Naughton, April 21, 2014, Ford said to decide on Fields as CEO as Mulally plans departure
(Bloomberg)
8
lead time – the time between the incumbent CEO’s departure announcement and the
actual departure date to proxy for succession planning. Specifically, I examine whether
firms with planned CEO departures (i.e., through retirement) have longer lead time and
lower disruption costs compared to firms with unexpected CEO departures (i.e., due to
death, illness, and sudden resignation). Presumably, firms with planned CEO retirement
will have time to make changes to their board in preparation for the succession, resulting
in a smoother transition and lower disruption costs. By contrast, firms with unexpected
CEO departures may not have time to make adjustments to their boards, leading them to
experience greater disruption costs. Albeit not a perfect measure for the actual length or
depth of the succession planning process, I argue that lead time is a close proxy for the
likelihood of succession planning in that it allows firms to compose a succession plan
even if there is none in place.
A few papers have attempted to investigate the importance of CEO succession
planning by examining shareholder reactions during heir apparent successions. For
instance, Behn, Riley Jr. and Yang (2005) examine whether shareholders value firms
with a succession plan in place. Specifically, they use whether firms have an heir
apparent (i.e. an officer holding the title of COO and/or President and is at least five years
younger than the incumbent CEO) as a proxy for succession planning and investigate
shareholder reactions at the announcement of a sudden CEO death. The authors find that
the cumulative announcement returns on the date of death are higher in firms with an heir
apparent successor. The major difference between my paper and Behn et al. (2005) is that
I use a much cleaner proxy for succession by hand collecting firms with a clear indication
of planned CEO departure. The issue with using general CEO turnover event to examine
9
the importance of CEO succession planning is that shareholder reactions are impacted by
the cause of turnovers. For instance, after a forced CEO turnover, it will be difficult to
disentangle whether shareholders react positively because the company may have a
succession plan in place or because it fired an incompetent CEO.
A CEO departure is categorized as a planned departure if the incumbent CEO’s
departure announcement contains key terms indicating that the departure is part of an
orderly transition of power.3 Unexpected CEO departures, by contrast, may include
departures due to sudden death, illness, or resignation. I used three measures to proxy
disruption costs: (1) one-, two-, and three-month cumulative market-adjusted stock
returns; (2) change in sales scaled by sales the year prior to departure; and (3) change in
capital expenditure scaled by sales the year prior to departure. Change in sales and
change in capital expenditure are measured up to three years after the incumbent CEOs’
actual departure date.
My sample consists of 919 CEO departures, including 843 planned and 76
unexpected CEO departures, during the period of 1999 to 2008. I find that firms with
unexpected departures have significantly shorter lead time than those with planned CEO
departures. They also have significantly more negative excess stock returns during a 90-
day period. Within the planned departure subsample, firms with above-median lead time
experience significantly lower disruption costs and a smoother transition. Specifically,
while there is no difference in the cumulative market-adjusted stock returns within 3
3 Key words indicating an orderly transition of power include, but are not limited to: “succession”,
“succession planning”, “succession plan”, “natural transition”, “retirement age”, “retirement”, and “orderly
transition of power”.
10
months of the transition, firms with above-median lead time have significantly more
favorable change in sales after the departure.
When examining the changes directors make to their firm, and to their board, in
anticipation of the CEO departure, I find that firms with planned departures typically do
two things. First of all, they are more likely to use relay successions with an heir
apparent—typically the COO and/or president (Canalla and Shen 2001, Shen and Canalla
Jr. 2003, Zhang and Rajagopalan 2004, Behn, Riley Jr. and Yang 2005). Specifically, the
heir apparent is appointed as COO and/or president approximately two years (692 days)
before the planned departure. The new CEO candidates typically are appointed to the
board two to three years in advance in those firms with planned departure. Such findings
are consistent with prior literature that posits that when a CEO nears retirement, the
potential successor is “groomed” as the COO and/or president, while joining the board to
facilitate the succession (Mace 1971, Vancil 1987, Hermalin and Waisbacj 1988).
Second, new CEOs are appointed to the board as part of the succession planning. In the
planned departure subsample, more than two-third (35.7%) of the new CEOs joined the
board two years prior, and nearly 50% of the new CEOs joined the board one year prior
to the transition.
On the other hand, there is no evidence of “grooming” or “preparing” in firms
with unexpected CEO departures. Not only are these firms less likely to use relay
successions, but also should a COO or president be promoted to CEO after an unexpected
departure, data shows that they have been in the COO/president position for at least four
years prior to the departure. Additionally, new CEOs have significantly longer board
tenure, and nearly 90% of them have been a director for at least three years prior to the
11
incumbent CEO’s departure. These findings suggest that, when faced with an unexpected
CEO departure when there is no time for succession planning, firms tend to appoint a
successor with lengthy firm and board experience to weather the storm.
This paper contributes to the CEO succession planning literature by investigating
whether and how CEO succession planning matters. To my knowledge, this is the first
study to use lead time as a proxy for succession planning and to compare firms with
planned versus unexpected CEO departures in order to evaluate the importance of CEO
succession planning. This comparison permits to determine whether a longer lead time
reduces or offsets disruption costs associated with CEO succession planning. To my
knowledge, this paper is also the first to examine the actions firms make to their boards to
prepare for the transition of power prior to a CEO departure. My findings indicate that the
new CEO candidate is more likely to be the designated successor and usually appointed
to the board approximately two years in advance prior to the planned departure to smooth
transition.
The findings in this paper are of particular importance in light of the new SEC
requirement regarding CEO succession planning (see SEC Staff Legal Bulletin 14E,
2009). Indeed, survey data4 reveals a surprisingly lack of preparedness for top leadership
transitions in US companies. For instance, only about half (51%) of survey respondents
could name a permanent successor if needed, and 39% reported that they had zero viable
internal candidates. If CEO succession matters, perhaps firms need to be better prepared
and have a succession plan in place to ensure a smoother transition. My findings show
4 Hendrick and Struggle 2010 survey on CEO succession planning of 140 CEOs and directors of North
America public and private companies. Source: http://rockcenter.law.stanford.edu/wp-
content/uploads/2010/06/CEO-Survey-Brochure-Final2.pdf
12
that a lack of succession planning could cost firms approximately $136 million if the
incumbent CEO departs unexpectedly, therefore lend support to the new SEC
recommendation. CEO succession planning should, indeed, be elevated to a core aspect
of a firm’s corporate governance regime.
The remainder of the paper is organized as follows. Section 2 discusses the prior
literature and develops my hypotheses. Section 3 describes the data and provides
summary statistics. Section 4 presents univariate and multivariate results using
unexpected CEO departures. Section 5 provides a summary and conclusion.
2. Prior Literature and Hypotheses Development
2.1. Importance of CEO succession planning
Since it is difficult to disentangle whether firms have a succession planning in
place or not, existing literature on the importance of succession planning has mainly
focused on shareholder reactions and changes in firm performance around the
sudden/unexpected death of the CEO or other senior managers. Studies as early as
Johnson, Magee, Nagrajan, and Newman (1985) examine the relationship between CEO
death and shareholder wealth through announcement returns. They find that senior
executive sudden death may have different impact on shareholder wealth, depending
upon the characteristics of employment relationship of the passing and replacing
executives. The net excess return is positively associated with the passing of a founder
CEO, and negatively associated with the passing executive’s position other than founder
in the company.
Worrell, Davidson III, Chandy and Garrison (1986) attempt to investigate the
consequence of senior executive turnover by examining announcement returns of death.
13
They find that shareholders are indifferent towards general senior executive death, but
react negatively if the CEO died, if death is sudden, and if founder died. And they react
positively towards chairman death (chairmen in their sample were in the age of 70s, 80s,
and 90s).
Behn, Dawley, Riley and Yang (2006) find that delay in appointing a successor
after unexpected senior executive death is associated with decreasing operating
performance, measured by change in sales, change in income before extraordinary items
scaled by sales, calculated over one-year and two-year period, and lower cumulative
returns around the death of the CEO. In a more recent paper, Salas 2010 argues that
stock price reaction towards senior executive sudden death could be a proxy of
entrenchment. Positive shareholder reaction may indicate death removed entrenched
management, yet negative reaction may indicate the passing of a highly effective and
hard to replace executive.
In general, these studies find that sudden/unexpected CEO departures are
detrimental to shareholder wealth. When faced with sudden/unexpected CEO departures,
firms and their boards may not have sufficient time to compose a succession plan, hence
experience higher disruption costs reflected by negative shareholder reactions. I predict
that firms with planned departure may experience lower disruption costs partially proxied
by short-term cumulative market-adjusted stock performance.
2.2. Succession type and outcome
Prior literature categorizes CEO succession into relay, horse race, or outside
succession based on whether there exists an heir apparent successor (Canalla and Shen
2001, Shen and Canalla Jr. 2003, Zhang and Rajagopalan 2004, Behn, Riley Jr. and Yang
14
2005). A firm is identified to have an heir apparent if an executive is holding the title of
COO and/or president. Behn et al. (2005) uses heir apparent successor to proxy for CEO
succession planning, and find that shareholders react less negatively at the announcement
of sudden CEO death if firms have identified an heir apparent. The authors then argue
that CEO succession planning seems to add value to companies engaged in the transition
of power.
Shen and Cannella Jr (2003A) find that shareholders prefer heir succession to
non-heir inside succession. In addition, outside successions are associated with poorer
firm performance and positive announcement returns, reflecting shareholders’
dissatisfaction towards the incumbent CEO and desire for a change in firm management.
However, the authors recommend that firms carefully select and groom heirs, and
monitor them first. If firm performance continues to be good, firms should ensure
promotion. If not, then board of directors should consider outside succession. Shen and
Cannella Jr (2003B) also specifically examine relay succession. Their findings suggest
that shareholders prefer relay succession over non-relay succession. Although there is
insignificant stock price reaction towards the initiation of heir apparent appointment,
shareholders react positively towards the promotion, and negatively towards the
departure. Outside succession is also associated with a positive stock price reaction.
Zhang and Rajaopalan (2004) also find relay succession to add value.
Specifically, they find that relay succession is associated with higher pre and post
succession firm performance. However, the more internal candidates in a firm, the lower
the likelihood of relay succession. Firms may opt for horse race succession when there
are more qualified internal candidates. In a more recent paper, Mobbs and Raheja (2012)
15
argue that succession planning is not one-type-fits-all, compared to tournaments
promotion (horse race), successor-incentive promotion is associated with higher pay-for-
performance sensitivity to the designated successor. They authors find that relay
successions are more common in firms or industries where firm specific knowledge is
more important to the CEO position and where the supply of potential outside CEO
replacements is limited.
Overall, firms with a succession plan in place seem more likely to use relay
successions. I predict that firms with planned departure have longer lead time and are
more likely to use relay successions. Presumably a longer-lead time may allow firms to
compose a plan and start grooming an heir apparent, even if there is no plan in place.
Longer lead time may also allow firms to have lower disruption costs and smoother
transition. I use long-term (from one year before to three years after the departure)
industry and performance adjusted operating performance, as well as change in capital
expenditure to partially proxy disruption costs.
3. Data and Summary Statistics
I use data from eight different sources. I first identify the initial sample of CEO
departures during the period 1991-2009 from Execucomp, which covers S&P 1500 firms.
CRSP and Compustat provide stock returns and accounting information. CEO successor
board experience and corporate governance data are identified through the Investor
Responsibility Research Center (IRRC) Director Database5
. Institutional ownership
information is obtained through Thomson Reuters Institutional Ownership Data. I hand
5 This database is now called Risk Metrics
16
collect data to fill in any observations where CEO appointment date or the date he/she
joined the company is missing in Execucomp, for the purpose of identifying CEO tenure.
The initial sample contains 2,522 CEO departures identified from Execucomp
during the period of 1991-2009. I use the fiscal year as unit of time and merge the initial
sample with CRSP and Compustat, then merge with IRRC Director Database by
matching each annual shareholder meeting date for a firm with the fiscal year in which
the meeting is held. I exclude dual class firms and any observations where there was no
actual succession; for instance, the change of CEO captured is due to the change of their
last name, but the two observations are actually the same person. After the merging
process, there were around 2,300 CEO departures during the 1991-2009 period.
For all 2,300 CEO departures, I use Factiva, Lexis Nexis and proxy statements to
hand collect the following information: (1) CEO successor origin. This information is
missing for some observations due to the missing data in Execucomp on the date the
CEO joined the company. I follow Parrino’s (1997) definition on insider versus outsiders.
Insiders are successors that have been with the company for at least one year prior to
becoming CEO; and outsiders are successors that have been with the company for less
than a year prior to becoming CEO. (2) Interim CEOs. Whether the news release states
that the successor is an interim or permanent CEO. (3) Cause of departure. I categorize
the departure of the CEO into natural retirement, forced resignation, unexpected
departures, M&A activity, restructuring, proxy fight, and the separation of CEO/chairman
duality. (4) The earliest announcement date of incumbent CEO departure and permanent
replacement CEO appointment. (5) The actual incumbent CEO departure and new CEO
takeover date. (6) Whether the replacement CEO has been on the appointing company’s
17
board of directors at least six months before the appointment announcement. (7) Cause of
the unexpected departure. Whether the unexpected departure is due to sudden death,
illness, or is due to incumbent CEO being hired away either by a better company, or
accepted a government job. (8) Whether the replacement CEO has had CEO experience
before in other companies. (9) Whether the retiring CEO is the founder of the company,
and whether the company is a family company. (10) The previous positions held by
replacement CEOs.
After collecting data for the whole CEO departure sample, I narrow my focus
onto planned departures and unexpected CEO departures. A CEO departure is
categorized as a planned departure if the incumbent CEOs’ departure announcement
contains key terms indicating that the departure is part of an orderly transition of power.
The key terms include “succession”, “succession planning”, “succession plan”, “natural
transition”, “retirement age, “retirement”, “required retirement” and” orderly transition of
power. A CEO departure is categorized as unexpected when the CEO departure (or
decision to leave) is neither a result of poor performance, nor of regulatory and/or
criminal investigation. It should be a genuinely unexpected event. Although a CEO’s
departure may have come to a surprise to the market, it will not be included in my sample
if the board was aware of the departure (or decision to leave), or if it was under the
mutual agreement between the CEO and the board. The final sample consists of 921 CEO
departures, out of which 843 are planned departure and 78 are unexpected departures
from 1999 to 20086.
6 Financial and utility firms are excluded from my sample
18
I used three measures to proxy disruption costs: (1) one-, two-, and three-month
cumulative market-adjusted stock returns after the departure announcement (2) Change in
firm performance from one year before to three years after the incumbent CEO departure
announcement and (3) change in capital expenditure from one year before to three years
after the departure announcement. I use change in sales scaled by sales the year before
incumbent CEO’s departure as a measure of performance.
4. Analysis
4.1. Univariate Analysis
4.1.1. CEO departures through time
--INSERT TABLE 1 ABOUT HERE--
Table 1 shows both planned departure and unexpected CEO departures through
time from 1999 to 2008. I also tabulate lead time and departing CEO age. There seems to
be no systematic clustering over time. Both planned and unexpected CEO departures are
randomly distributed through time. However, there is a fairly strong difference in lead
time between the two subsamples. On average, firms have a 76-day lead time when the
incumbent CEO plans to retire; whereas when faced with an unexpected CEO departure,
firms only have a 3.5-day lead time. In addition to lead time, there is also a difference in
departing CEO age between the two subsamples. CEOs typically near retirement age
(reference) of 62-65 in the planned departure subsample. On the other hand, the age of
CEOs unexpected left the firm ranges from 51 to 75, indicating that unexpected
departures happen fairly randomly across difference age groups.
19
4.2. Descriptive statistics in firms with planned departure and unexpected CEO
departures
--INSERT TABLE 2 ABOUT HERE--
Table 2 provides summary statistics of firm, departing CEO, and corporate
governance characteristics on firms with planned departure and unexpected CEO
departures. There is no systematic difference between the two subsamples except for free
cash flows. Firms with planned departure have greater Free Cash Flow (4.12% versus
2.58%) compared to firms with unexpected CEO departures. Prior literature uses Free
Cash Flow (FCF) as a measure of managerial discretion on the use of internally generated
cash flows (Jensen 1986, Stulz 1990, Richardson 2006, Chen Chen and Wei 2011).
Another difference between the two subsamples is the percentage of inside directors.
Although board size and independence are similar in both samples, firms with planned
departure have lower percentage of inside directors on board (20.32% versus 22.86%).
This result indicates that firms with planned departure have a greater presence of
affiliated/grey directors on board.
4.3. Comparison of disruption/transitional characteristics between firms with
planned departure and unexpected CEO departures
--INSERT TABLE 3 ABOUT HERE--
Panel A in Table 3 shows the comparison of CEO transitional characteristics
between firms with planned departure and unexpected CEO departures. The delay
between incumbent CEOs’ departure announcement date and their actual departure date
(lead time) is 75 days when the departure is planned. On the other hand, when the
departure is unexpected due to death, illness, and sudden resignation, the lead time is
significantly shorter at 3.53 days. This result is consistent with my earlier prediction that
20
firms with planned departure have longer lead time. In addition, new CEO successors are
identified twice as quickly in firms with planned departure, compared to unexpected
departures (approximately 15 days versus 30 days). This is an indication that when a
CEO nears retirement, he/she may have already identified the successor; whereas when a
CEO unexpected departs, it may take firms longer to find a replacement. Another
interesting result is that on the same day the incumbent CEO leaves a firm, a new CEO
will take over, hence the transition time is zero when the retirement is planned in
advance. However, firms with unexpected CEO departure experience approximately 60
days without a permanent CEO in place, measured by the difference between days before
new CEO takeover and lead time.
Although lead time proxies the likelihood either CEO succession plan in place or
succession planning, it may not be an accurate measure for how long firms have been
succession planning. An alternative measure for the length of succession planning,
particularly relay succession, is the number of days since the new CEO was appointed as
a COO and/or President. I hand-collect the date the new CEO was appointed to the
position of COO and/or President from Lexis-Nexis and Factiva for firms who seemingly
used relay succession. Anecdotal evidence indicates that firms typically appoint the heir
apparent to the COO/President position one or two years in advance for “grooming”
purpose. The two-year period will allow the to-be CEO gain hands-on experience firms’
day-to-day operations, and be familiar with the board of directors and other senior
managers. Consider, for instance, the recent CEO power transition in Ford Motor Co.
Ford announced on April 21, 2014 that it is to name Mark Field as the new CEO,
effective on July 1. News release reported “Fields emerged as Mulally’s likely successor
21
when he was promoted to COO in December 2012. Ford had said that Mulally would stay
through 2014”.7
Consistent with Ford Motor’s example, I find that 341(40.45%)
companies with planned departure used relay succession. The average “grooming period”
is 692.72 days, approximately two years, before the COO and/or President becomes the
new CEO. Yet this is not the case in firms with unexpected CEO departures. Not only are
these firms less likely to use relay succession (28.20%), if a COO/President was
appointed as the new CEO, their tenure as the COO/President is between three and four
years. Similarly, the new CEOs have board tenure of 2.8 years in firms with planned
departure, compared to 7.06 years in those with unexpected CEO departures. These
findings indicate that when firms are faced with a shock such as the unexpected departure
of its CEO, they tend to appoint executives who are familiar to operating and have longer
board tenure to weather the storm.
Panel B in Table 3 provides comparison of shareholder reactions at the
announcement of incumbent CEO departures. I use Eventus to generate cumulative
abnormal returns (CARs) three days around the departure announcement using both the
market model and market adjusted returns (not tabulated). For the cumulative returns up
to 90 days after the departure announcement, I use valuated market adjusted returns from
CRSP. Consistent with planning, shareholders react insignificantly at the announcement
of incumbent CEO retirement, but negatively (p<=0.01) at the announcement of
unexpected CEO departures. This negative reaction indicates investor uncertainty
towards the future of a company when its CEO left due to death, illness and sudden
7 Keith Naughton, April 21, 2014, Ford said to decide on Fields as CEO as Mulally plans departure
(Bloomberg)
22
resignation. The differences in shareholder reaction at the departure announcement are
statistically significant at 1% level between the two subsamples.
Panel C in Table 3 shows the comparison of long term change in firm
performance and firm investment opportunities measured by change in sales and change
in capital expenditure, respectively. Firms with planned departure have significantly less
change in sales for up to two years after the year of the actual departure. This is contrary
to my prediction that firms with planned retirement may have more positive or less
negative change in sales around the incumbent CEO’s departure. However, this result
may be caused by the fact that firms with unexpected departures have significantly lower
sales the year prior to departure, therefore, when scaled, they show a larger change in
sales compared to firms with planned departure. In the later part of the paper, I show that
when the departure is planned, firms with above-median lead time have significantly
greater change in sales. There is no significant difference in change in capital expenditure
between the two subsamples.
4.4. Comparison of board adjustments
--INSERT TABLE 4 ABOUT HERE--
Based on my earlier assumption that when firms have longer lead time, they may
be able to compose a succession plan even when there is none in place. In this section, I
examine board adjustments firms make in order to prepare for succession planning. Table
4 shows the comparison of board characteristics over a three-year period prior to CEO
departure in firms with planned departure and unexpected departures. Both firms have
similar board size and independence, as well as the change in board size and
independence. From two years to one year before the power transition, both subsamples
23
experience an increase in existing director turnover, possibly caused by the shift in board
composition, when firms start putting the successor on board. Specifically, 28.23% of the
CEO successor joined the board at least three years before the planned departure, and
nearly half of the new CEOs have board tenure of at least one year before they pick up
the baton in firms with planned departure; where as almost all new CEOs have been on
the board for at least three years before an unexpected CEO departure. The new CEO
board tenure differences between the two subsamples are economically and statistically
significant. This result demonstrates that when firms have a succession plan in place or in
progress, appointing the new CEO to the board at least two years in advance may be part
of the actions firms make to the board in anticipation of the transition of power.
4.5. Comparison of above and below median lead time in the subsample of firms
with planned departure
In the previous analysis, I compared firms with planned departure and unexpected
CEO departure. I find that firms with planned departure have longer lead time and lower
disruption costs. In this section, I focus on planned departure and compare firms with
above and below median lead time. The purpose of this comparison is to investigate
within planned departure, whether firms with longer lead time have similar disruption
costs and make similar adjustment to the board with firms with shorter lead time. The
median lead time in firms with planned departure is 34 days, and out of the 843
retirements, 420 have above-, and 423 have below-median lead time. Table 5 Panel A
shows the descriptive statistics and comparison in firm, departing CEO and corporate
governance characteristics for both subsamples. There seems to be a difference between
firms with longer (above median) and shorter (below median) lead time. Specifically,
24
firms with longer lead time are larger and older firms with higher institutional investors
and lower stock price volatility the prior fiscal year. In addition, they have larger boards
with greater board independence and are more clustered in the post 2001 period. They
also have better connected outside directors and lower percentage of departing founder
CEOs. Notice that it is not the intention of this paper to examine the determinants of
longer or shorter lead time. The focus of this paper is to investigate whether longer lead
time is associated with a smoother transition.
--INSERT TABLE 5 ABOUT HERE--
Panel B in Table 5 shows the comparison of CEO transitional characteristics in
firms with above or below median lead time (34 days). The average lead time in the
above median subsample is 142 days and 9 days in the below median subsample.
Although there is a dramatic difference in lead time, both subsamples experience very
short period of no CEO in place (difference between days in new CEO takeover and lead
time). However, firms with longer lead time are more likely to use relay successions and
are more likely to appoint an insider, or an existing director as the new permanent CEO,
which is consistent with succession planning.
Both subsamples have insignificant abnormal returns around the announcement
dates of planned departures. This result may indicate that investors have been aware of
the upcoming retirement and the stock price incorporated this information. However,
there is a significant difference in firms’ long-term performance and capital expenditure
between the two subsamples. Panel D in Table 5 shows the differences. In particular,
firms with above-median lead time have significantly more favorable change in industry-
and-performance adjusted ROAs for up to two year after the year of retirement. The
25
mean differences in change in performance are 1.29% and 1.08%, respectively, and are
both economically and statistically significant.
4.6. Board adjustments made by firms with above or below-median lead time
--INSERT TABLE 6 ABOUT HERE--
Table 6 shows the potential board adjustment up to three year prior to the planned
departure in firms with above or below median lead time. The purpose of this comparison
is to examine whether firms with longer lead time plan for succession differently from
firms with shorter lead time. Similar to the comparison between planned and unexpected
CEO departures, firms with longer lead time start decreasing existing director turnover
from three to two years, possibly to reduce director turnover costs and to prepare for
succession. In addition, a greater proportion of new CEOs were appointed to the board at
least one year in advance when firms have longer lead time. On the contrary, firms with
shorter lead time experience an increase of existing director turnover over the same
period, and have lower proportion of the new CEOs appointed to the board. In summary,
board tenure of at least one year seems to be desirable as part of the succession planning
process.
5. Multivariate analysis
5.1. Cumulative abnormal stock returns after the incumbent CEOs’ actual
departure date
--INSERT TABLE 7 ABOUT HERE--
Univariate analysis does not control for other factors that could impact the change
in performance. In this section, I extend my analysis to a multivariate setting. I rely on
related prior studies, for instance, Yermack (1996), Naveen (2006), Coles et al. (2008),
26
and Coles et al. (2012), for guidance in selecting control variables. Table 7 shows the
multivariate analysis results on the cumulative abnormal stock returns 30, 60, 90, and 360
days after the incumbent CEOs’ actual departure date. The cumulative returns are
calculated using market-adjusted model. I use Ordinary Least Squares (OLS) regression
with the White Robustness Error, controlling for firm, corporate governance, and
departing CEO characteristics. The dependent variables are all in percentage format.
The result shows that ceteris paribus, unexpected CEO departures are associated
with significantly negative CARs. Specifically, a change from planned departure to
unexpected departure decreases the CARs (0,0), CARs (-1,1), and CARs (-3,3) by
1.77%, 2.97%, and 3.40%, respectively. Furthermore, it decreases the excess stock
returns within a 30-day priod after the departure by 5.99%.
5.2. Change in firm performance
--INSERT TABLE 8 ABOUT HERE--
Table 8 shows the multivariate analysis results on change in firm performance
around the fiscal year of the actual departure date. The dependent variable in columns (1)
to (6) is the change in sales from one year before to three years after the actual departure.
I control for whether firms unexpectedly lost its CEO, whether firms used a horse race
succession, as well as whether a firms have above or below median lead time, in addition
to other firm and corporate governance variables. The coefficients are estimated using the
Ordinary Least Squares (OLS) with the White robustness error. Columns (1), (3), and (5)
do not include any interaction terms, and columns (2), (4), and (6) take into consideration
of the interaction between unexpected departure and horse race succession. The
dependent variables are all in percentage format.
27
The results show that an unexpected departures decreases change in sales by
2.15%, but this impact only shows up three years after the incumbent CEO’s departure.
In addition, firms with above median lead time have greater change in sales from one
year before to up to three years after the departure. Specially, a change from having
below to above median lead time increases the change in sales by 6.70%, 6.00%, and
8.40%, respectively. This result indicates that firms with longer lead time may be better
preparing/prepared for the CEO transition, therefore have better change in firm
performance. As mentioned in the earlier part of this paper, although lead time may not
be an accurate measure of the length or depth of succession planning, it proxies for the
likelihood of succession planning, and firms with longer lead time are more likely to have
a succession in place or compose one. The interaction between unexpected CEO
departure and horse race succession is not significantly related to change in sales.
5.3. Change in capital expenditure
--INSERT TABLE 9 ABOUT HERE--
Table 9 shows the results of the coefficients using OLS regression with the White
robustness errors. The dependent variables are changes in CAPEX from one year before
to three years after the departure. The multivariate results show that unexpected CEO
departures are associated with decreases in change in CAPEX for at least three years after
the CEO departure. A change from planned to unexpected CEO departure decreases
CAPEX by 3.42%, 1.97% and 3.92% from one year to three years after the departure,
respectively. An interesting result is that horse race succession seems to be associated
with a disruption of capital expenditure. Specifically, when firms use horse race
succession, change in CapEx decreases approximately 3-4% from one year before to
28
three years after the departure. This result may be an indication that having internal
candidates competing for the CEO position may cause a delay in firms’ on-going project.
However, when taking into consideration of the interaction terms, when the CEO
departure is unexpected, having a horse race succession increases capital expenditure.
This indicates the horse race may be more beneficial when CEO suddenly departs, rather
than in planned departures. If a firm allows its internal talent to compete for the CEO
position rather than appointing a default person as the new CEO after an unexpected
departure, the winner may be able to better continue with corporate expansion.
5.4. The costs of not planning for succession
--INSERT TABLE 10 ABOUT HERE--
CEO succession is not free. So far my findings indicate that a lack of CEO
succession may be detrimental to shareholder value and to long term firm performance.
However, it may be beneficial for certain firms to not plan for succession, if the benefit
outweights the costs of planning. In this section, I intend to calculate the costs of firms
not having a plan for succession and show the impact of CEO succession planning on
change in firm value. Table 10 shows the results. Based on the CARs calculated in the
earlier sections, firms with planned departure have an average CAR of 0.11% across the
three event windows around the incumbent CEO’s departure announcement. Given that
their market capitalization is on avergae $10,273 million, the dollar change of their
market value is $11.30 million. In comparison, firms with unexpected CEO departures
have an avergae CAR of -2.18% across the three event windows around the departure

29
announcement. Given that their average market capitalization is $5,717 million, the dollar
change of their market capitalization is -$124.63 million. The change in firm value
potentially due to succession planning is therefore $135.93 million.
The 2014 report on senior executive succession planning and talent development by
IED and Stanford University shows that a CEO succession plan is reviewed by the board
of directors from once a year to once a quarter. When boards do meet to discuss
succession plans, they typically allott an hour for succession planning. Therefore, given
that a typical board in a public traded company in the US has 10 members (Coles, Daniel
and Naveen 2008) and that board members are compensated $100 per hour for their time,
the total costs to have directors discuss CEO succession planning will range from
$10,000 to $40,000. For the sake of the argument in this section, I treat this cost as
negligible. Therefore, the costs of not planning for succession is about $136 million.
Given the large magnitute of the change in firm value associated with a lack of
succession planning, I argue that it is doubtful that the costs of not planning for
succession will outweigh the benefits. Although it is not the intention of this paper to
investigate whether all firms should have a succession plan, it will certainly be interesting
for future research to examine why firms will choose to not plan for succession, and what
types of firms benefit the most from having a succcession plan.
6. Conclusion
While CEO succession planning has received a lot of attention recently—
particularly in social media, there has been a dearth of studies evaluating its necessity.
Moreover, the succession planning process itself has not been clearly described, possibly
because this process is difficult to observe and evaluate. In this paper, I determine
30
whether CEO succession planning matters and I examine which actions board of directors
take to prepare for a succession in the company’s top executive leadership. To do so, I
use lead time—a proxy measure for CEO succession planning representing the number of
days between the incumbent CEO’s departure announcement and their actual departure
date. I also use this measure to compare firms with planned departure (i.e. retirement) to
firms with unexpected CEO departures and find that firms with planned departure have
significantly longer lead time and lower disruption costs. Specifically, when the CEO
departure is expected, firms tend to experience less negative excess stock returns, more
favorable change in firm performance, as well as continued capital expenditures. This
paper contributes to the CEO succession planning literature by showing that longer lead
time in CEO succession planning is critical to lower disruption costs and ensure a
smoother transition. Thus, the new SEC requirement that CEO succession planning be
fully elevated to the status of core board responsibility is empirically supported.
31
References
Adams, Renée B., Almeida, H, Ferreira, D., 2005, Powerful CEO and their impact on
corporate policies, Review of Financial Studies, 18(4):1403-1432.
Adams, Renée B., and Ferreira, D., 2007, A theory of friendly boards, The Journal of
Finance, 62: 217-250.
Agrawal, A.; C. Knoeber; and T. Tsoulouhas, 2006. Are Outsiders Handicapped in CEO
Successions? Journal of Corporate Finance.
Barber B.M., Lyon, J.D., 1996, Detecting abnormal performance. The empirical power
and specification of test statistics. Journal of Financial Economics 41, 359-399.
Bacon, J., Brown.J, 1974, Corporate directorship practices: role, selection, and legal
status of the board, a joint research report from the Conference Board and the
American Society of Corporate Secretaries, Inc. (New York, NY).
Baranchuk, N., Dybvig, Philip H., 2009, Consensus in diverse corporate boards, Review
of Financial Studies, 22: 715 – 747.
Bruce K. Behn, David D. Dawley, Richard Riley and Ya-wen Yang, 2005, The value of
an heir apparent in succession planning. Corporate Governance 13:168-177.
Bruce K. Behn, Richard A. Riley Jr and Ya-wen Yang, 2006, Deaths of CEOs: are delays
in naming successors and insider/outsider succession associated with subsequent
firm performance? Journal of Managerial Issues 18:32-46.
Booth, James R., Deli, Daniel N., 1996, Factors affecting the number of outside
directorships held by CEOs, Journal of Financial Economics 40: 81-104.
Booth, James R., Deli, Daniel N., 1999, On executives of financial institutions as outside
directors, Journal of Corporate Finance, 5:227-250.
Borokhovich, K., R. Parrino, T. Trapani, 1996, Outside Directors and CEO Selection.
Journal of Financial and Quantitative Analysis, 31 (1996), 337–355.
Brickley, J.; J. Coles; and G. Jarrell, 1997, Leadership Structure: Separating the CEO and
Chairman of the Board.” Journal of Corporate Finance, 3 (1997), 189–220.
Brickley, James, Linck, James, S., Coles, Jeffrey L., 1998, What happens to CEOs after
they retire? New evidence on career concerns, horizon problems, and CEO
incentives. Journal of Financial Economics 52:341–77.
Brickley, James, 2003, Empirical research on CEO turnover and firm-performance: a
discussion. Journal of Accounting and Economics 36:227-233.
Byrne, John, William A., Symonds, C., Siler, Julia F., 1991, CEO disease: Egoism can
breed corporate disaster, and the malady is spreading, Business Week, April 1,
52-60.
Cannella, A., Jr., and M. Lubatkin, 1993, Succession as a sociopolitical process: Internal
impediments to outsider selection, Academy of Management Journal, 36: 763-
793.
Coles, Jeffrey L. Daniel, Naveen D. Naveen, Lalitha, 2008, Boards: does one size fit all?
Journal of Financial Economics, 82: 329-356.
Cowling, M., 2007, Small firm CEOs and outside directorships: Tenure, demonstration
and synergy effect, working paper.
Dahya, Jay, McConnell, John J., 2005, Outside directors and corporate board decisions,
Journal of Corporate Finance 11: 37-60.
Davis, G. 1996, The significance of board interlocks for corporate governance, Corporate
Governance, Vol. 4, Issue 3, 154-159.
32
Davis, Sandra, D. Nosal, 2009, Smart planning for CEO succession, the Corporate Board.
De Long, J.B. 1991, Did J.P. Morgan’s men add value? An Economist’s perspective on
financial capitalism, In Inside the business enterprise: Historical perspectives on
the use of information, ed. Peter Temin. National Bureau of Economic Research
conference report, Chicago: University of Chicago Press.
Duchin R., J. G. Matsusaka, and O. Ozbas, 2010, When are outside directors effective?
Journal of Financial Economics 96, 195-214.
Denis, David and D. Denis, 1995, Performance changes following top management
dismissals, Journal of Finance 50, 1029 – 1057.
Fahlencrach, Rudiger, Low, Angie and Stulz, Rene, 2010, Why do firms appoint CEOs as
outside directors? Journal of Financial Economics, 97 (2010) 12–32.
Fahlencrach, Rudiger, B. Minton, C. Pan, 2010, Former CEO directors: lingering CEOs
or valuable resources? Working paper.
Fama, Eugene F.,1980, Agency problem and the theory of the firm. Journal of Political
Economy, 88:288-307.
Fama, Eugene F. and Jensen, Michael C., 1983, Separation of ownership and control,
Journal of Law and Economics, 26, 301-325.
Ferris, Stephen P, Jagannathan, M., Pritchard, A.C., 2003, Too busy to mind the
business? Monitoring by directors with multiple board appointments. The Journal
of Finance, 58:1087-1112.
Ferris, Stephen P, Jagannathan, M., 2001, The incidence and determinants of multiple
corporate directorships, Applied Economics Letters, 8: 1, 31-35.
Farrell, Kathleen A, Whidbee D., 2003, Impact of firm performance expectations n CEO
turnover and replacement decisions, Journal of Accounting and Economics,
36:165-196.
Fich, Eliezer M. 2005, Are some outside director better than others? Evidence from
Director Appointments by Fortune 1000 Firms, The Journal of Business, Vol. 78,
No. 5.
Fich, E.M., and A. Shivdasani. 2006. Are Busy Boards Effective Monitors? The Journal
of Finance 61:689–724.
Gilson, Stuart, 1990, Bankruptcy, boards, banks, and blockholders, Journal of Financial
Economics, 27, 355-387.
Guner, A. Burak, Malmendier, U., Tate, Geoffrey, 2008, Financial expertise of directors,
Journal of Financial Economics, 88:323-354.
Harris, M., Raviv, A., 2008, A theory of board control and size, Review of Financial
Studies, 21(4):1797-183.
Hermalin, B.E. and M. S. Weisbach, 2003, Endogenously chosen boards of directors and
their monitoring of the CEO, American Economic Review 88, 96-118.
Huson M., Malatesta, P., and Parrino, R., 2004, Managerial succession and firm
performance Journal of Financial Economics Vol. 74, 237-275.
Hwang, B. and S. Kim, July 2009, “It pays to have friends,” Journal of Financial
Economics 93, 138-158.
Jensen, Michael C, Meckling, William H., 1976, Theory of the Firm: Managerial
Behavior, Agency Costs and Ownership Structure Journal of Financial
Economics, 3:305-360.
33
Lee, S., Persson, P., 2010, Authority versus loyalty: social incentives and modes of
governance, working paper, 2010 WFA Conference.
Linck, J. S., J. M. Netter, and T. Yang, 2009, “The Effects and Unintended Consequences
of the Sarbanes-Oxley Act on the Supply and Demand for Directors,” Review of
Financial Studies 22: 3297-3323.
Lorsch, J., E. MacIver. 1989. Pawns or potentates: The reality of America’s corporate
boards. Boston: Harvard Business School Press.
Mace, M. 1986. Directors: Myth and reality. Boston: Harvard Business School Press.
Malmendier, Ulrike and Tate, Geoffrey, 2005, Superstar CEOs, working paper.
Masulis, R,. Shawn M, 2009, Are all inside directors the same? Evidence from external
directorship market, the Journal of Finance, 66:823-872.
Mian, Shehzad, 2001, On the choice and replacement of CFOs, Journal of Financial
Economics 60: 143-175.
Mobbs, S., 2012, CEOs Under Fire: Pressure From Within–The Effects of Inside
Directors on CEO Compensation and Turnover, Journal of Financial and
Quantitative Analysis, forthcoming.
Omer, T.C., Marjorie, S., Frances, T., Do well-connected directors improve firm
performance?, 2012 SSRN working paper.
Parrino, R., 1997, CEO Turnover and Outside Succession: A Cross-Sectional Analysis,
Journal of Financial Economics, 46: 165–197.
Parrino, Robert, R. Sias, and L. Starks, 2003, Voting with their feet: institutional
ownership changes around forced CEO turnover, Journal of Financial Economics
68, 3-46.
Perry, T., Peyer, U. 2005, Board seat accumulation by executives: A shareholder’s
perspective, The Journal of Finance, 60, 2083-2123.
Raheja, C., 2005, Determinants of board size and composition: A theory of corporate
boards, Journal of Financial and Quantitative Analysis, 40: 283-306.
Rosenstein, Stuart, Wyatt, Jeffrey G., 1990, Outside directors, board independence, and
shareholder wealth, Journal of Financial Economics, 26:175-191.
Ryan Jr., Harley E., Wiggins III, Roy A., 2004, Who is in whose pocket? Director
compensation, board independence, and barriers to effective monitoring, Journal
of Financial Economics 73: 497-424.
Salas, J.M., 2010, Entrenchment, governance and the stock price reaction to sudden
executive deaths, Journal of Business and Finance 34, 656-666.
Shen, Wei, A.A. Cannella, Jr, 2002, Revisiting the performance consequences of CEO
succession: the impacts of successor type, post succession senior executive
turnover, and departing CEO tenure, The Academy of Management Journal, Vol.
45, No. 4, pp. 717-733
Shivdasani, A., and D., Yermack, 1999, “CEO Involvement in the Selection of New
Board Members: An Empirical Analysis,” Journal of Finance 54, 1829-1853.
Weisbach, M. 1988. Outside directors and CEO turnover, Journal of Financial
Economics 20:431–60
Worrell, D.L., Davidson III, W.N., Chandy, P.R., Garrison, S.L., 1986, Management
turnover through deaths of key executives: effects on investor wealth, Academy
of Management 29, 674-694.

34
Yeo, Hee-Jung, Pochet, C., Alcouffe, A., 2003, CEO reciprocal interlocks in French
corporations, Journal of Management and Governance 7: 87–108.
Zhang, Yan and N. Rajagopalan, 2004, When the known devil is better than an unknown
god: an empirical study of the antecedents and consequences of relay CEO
successions, Academy of Management, Vol. 47, No. 4, 483–500.
Zhang, Yan and N. Rajagopalan, 2010, CEO succession planning: Finally at the center
stage of the boardroom, Business Horizons 53: 455-462.
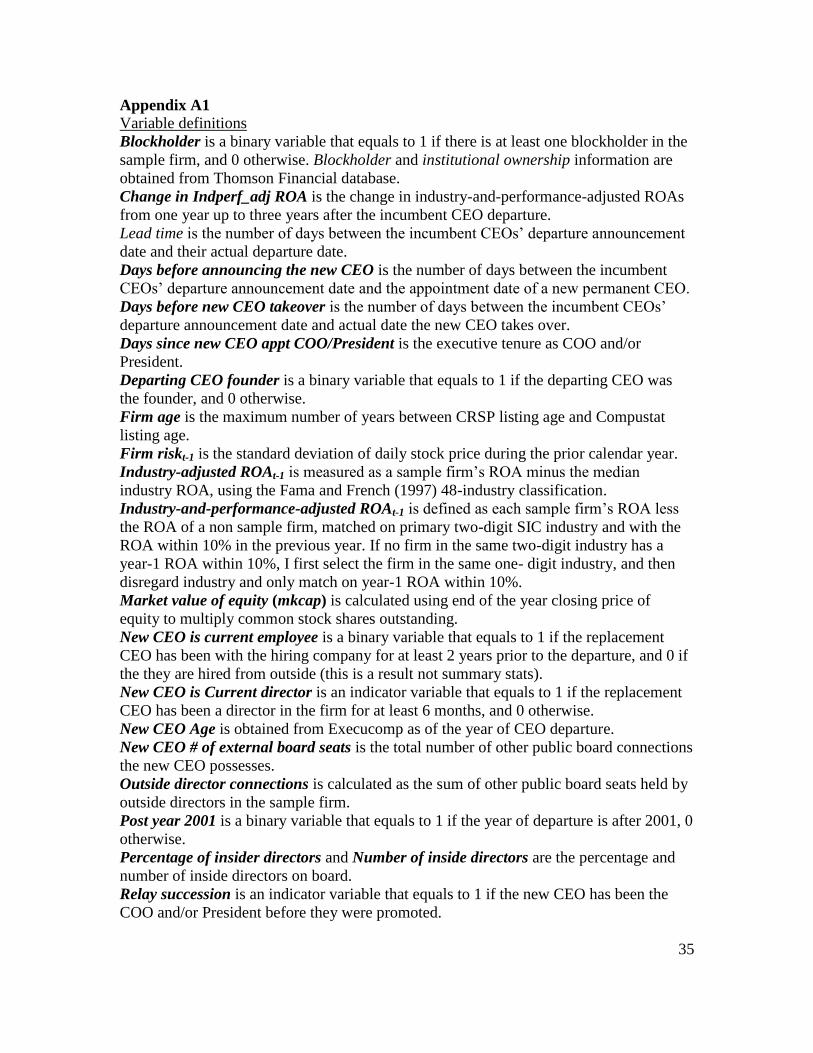
35
Appendix A1
Variable definitions
Blockholder is a binary variable that equals to 1 if there is at least one blockholder in the
sample firm, and 0 otherwise. Blockholder and institutional ownership information are
obtained from Thomson Financial database.
Change in Indperf_adj ROA is the change in industry-and-performance-adjusted ROAs
from one year up to three years after the incumbent CEO departure.
Lead time is the number of days between the incumbent CEOs’ departure announcement
date and their actual departure date.
Days before announcing the new CEO is the number of days between the incumbent
CEOs’ departure announcement date and the appointment date of a new permanent CEO.
Days before new CEO takeover is the number of days between the incumbent CEOs’
departure announcement date and actual date the new CEO takes over.
Days since new CEO appt COO/President is the executive tenure as COO and/or
President.
Departing CEO founder is a binary variable that equals to 1 if the departing CEO was
the founder, and 0 otherwise.
Firm age is the maximum number of years between CRSP listing age and Compustat
listing age.
Firm riskt-1 is the standard deviation of daily stock price during the prior calendar year.
Industry-adjusted ROAt-1 is measured as a sample firm’s ROA minus the median
industry ROA, using the Fama and French (1997) 48-industry classification.
Industry-and-performance-adjusted ROAt-1 is defined as each sample firm’s ROA less
the ROA of a non sample firm, matched on primary two-digit SIC industry and with the
ROA within 10% in the previous year. If no firm in the same two-digit industry has a
year-1 ROA within 10%, I first select the firm in the same one- digit industry, and then
disregard industry and only match on year-1 ROA within 10%.
Market value of equity (mkcap) is calculated using end of the year closing price of
equity to multiply common stock shares outstanding.
New CEO is current employee is a binary variable that equals to 1 if the replacement
CEO has been with the hiring company for at least 2 years prior to the departure, and 0 if
the they are hired from outside (this is a result not summary stats).
New CEO is Current director is an indicator variable that equals to 1 if the replacement
CEO has been a director in the firm for at least 6 months, and 0 otherwise.
New CEO Age is obtained from Execucomp as of the year of CEO departure.
New CEO # of external board seats is the total number of other public board connections
the new CEO possesses.
Outside director connections is calculated as the sum of other public board seats held by
outside directors in the sample firm.
Post year 2001 is a binary variable that equals to 1 if the year of departure is after 2001, 0
otherwise.
Percentage of insider directors and Number of inside directors are the percentage and
number of inside directors on board.
Relay succession is an indicator variable that equals to 1 if the new CEO has been the
COO and/or President before they were promoted.
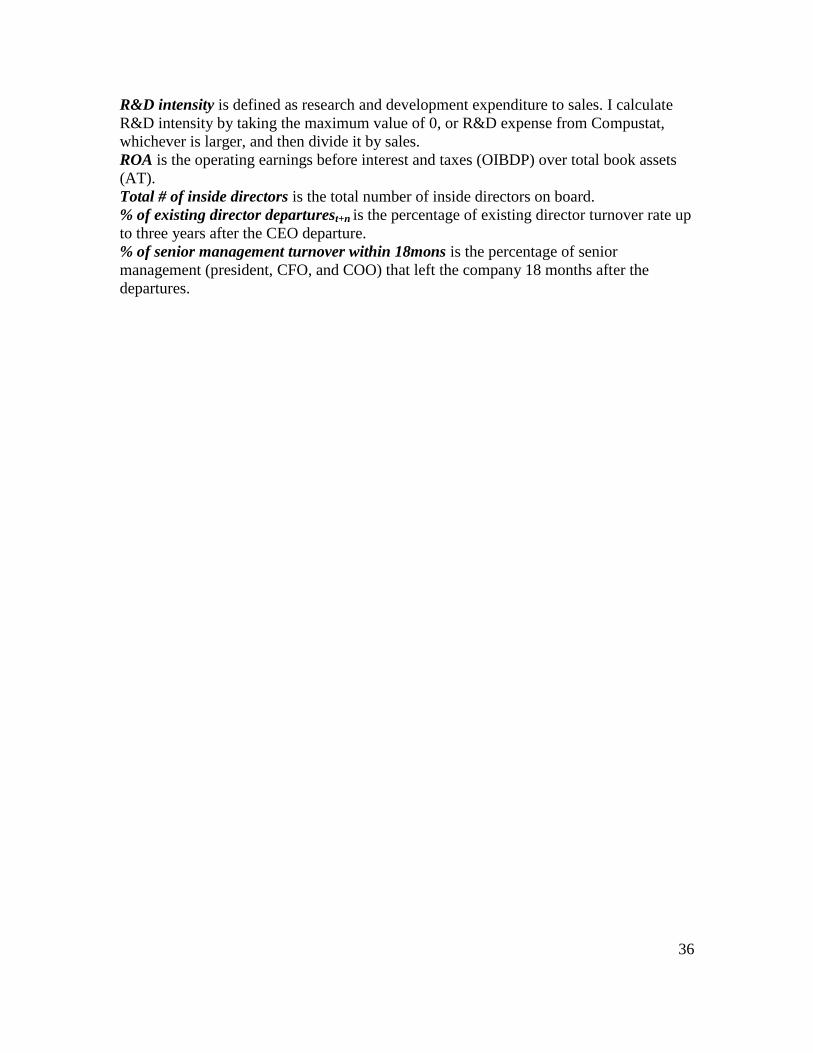
36
R&D intensity is defined as research and development expenditure to sales. I calculate
R&D intensity by taking the maximum value of 0, or R&D expense from Compustat,
whichever is larger, and then divide it by sales.
ROA is the operating earnings before interest and taxes (OIBDP) over total book assets
(AT).
Total # of inside directors is the total number of inside directors on board.
% of existing director departurest+n is the percentage of existing director turnover rate up
to three years after the CEO departure.
% of senior management turnover within 18mons is the percentage of senior
management (president, CFO, and COO) that left the company 18 months after the
departures.
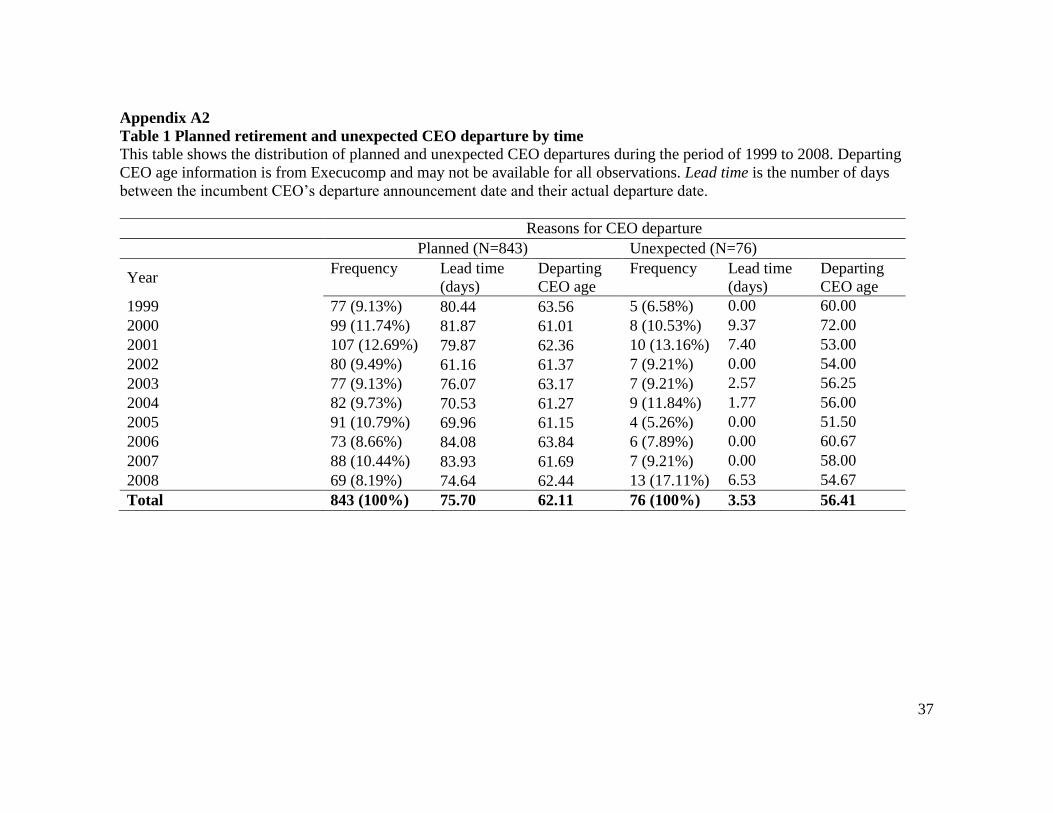
37
Appendix A2
Table 1 Planned retirement and unexpected CEO departure by time
This table shows the distribution of planned and unexpected CEO departures during the period of 1999 to 2008. Departing
CEO age information is from Execucomp and may not be available for all observations. Lead time is the number of days
between the incumbent CEO’s departure announcement date and their actual departure date.
Reasons for CEO departure
Planned (N=843) Unexpected (N=76)
Year Frequency Lead time
(days)
Departing
CEO age
Frequency Lead time
(days)
Departing
CEO age
1999 77 (9.13%) 80.44 63.56 5 (6.58%) 0.00 60.00
2000 99 (11.74%) 81.87 61.01 8 (10.53%) 9.37 72.00
2001 107 (12.69%) 79.87 62.36 10 (13.16%) 7.40 53.00
2002 80 (9.49%)
61.16
61.37 7 (9.21%) 0.00 54.00
2003 77 (9.13%)
76.07
63.17 7 (9.21%) 2.57 56.25
2004 82 (9.73%) 70.53 61.27 9 (11.84%) 1.77 56.00
2005 91 (10.79%)
69.96
61.15 4 (5.26%) 0.00 51.50
2006 73 (8.66%) 84.08 63.84 6 (7.89%) 0.00 60.67
2007 88 (10.44%)
83.93
61.69 7 (9.21%) 0.00 58.00
2008 69 (8.19%)
74.64
62.44 13 (17.11%) 6.53 54.67
Total 843 (100%)
75.70
62.11 76 (100%)
3.53 56.41
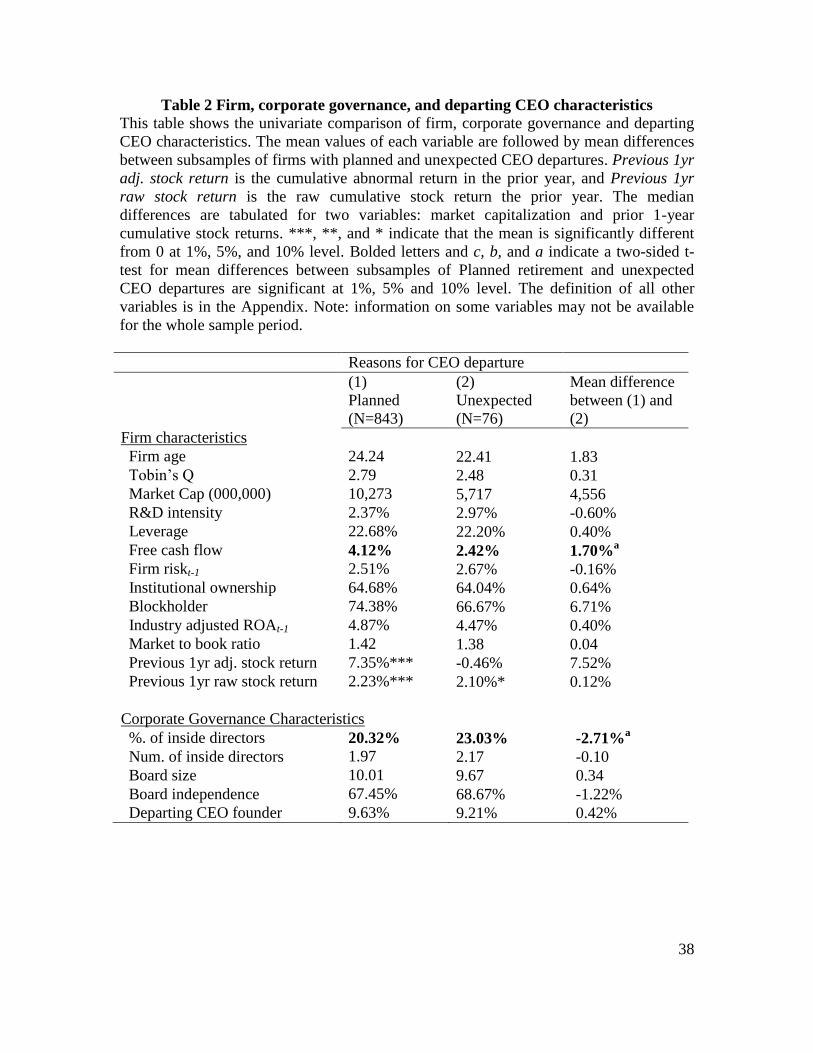
38
Table 2 Firm, corporate governance, and departing CEO characteristics
This table shows the univariate comparison of firm, corporate governance and departing
CEO characteristics. The mean values of each variable are followed by mean differences
between subsamples of firms with planned and unexpected CEO departures. Previous 1yr
adj. stock return is the cumulative abnormal return in the prior year, and Previous 1yr
raw stock return is the raw cumulative stock return the prior year. The median
differences are tabulated for two variables: market capitalization and prior 1-year
cumulative stock returns. ***, **, and * indicate that the mean is significantly different
from 0 at 1%, 5%, and 10% level. Bolded letters and c, b, and a indicate a two-sided t-
test for mean differences between subsamples of Planned retirement and unexpected
CEO departures are significant at 1%, 5% and 10% level. The definition of all other
variables is in the Appendix. Note: information on some variables may not be available
for the whole sample period.
Reasons for CEO departure
(1)
Planned
(N=843)
(2)
Unexpected
(N=76)
Mean difference
between (1) and
(2)
Firm characteristics
Firm age 24.24 22.41 1.83
Tobin’s Q 2.79 2.48 0.31
Market Cap (000,000) 10,273 5,717 4,556
R&D intensity 2.37% 2.97% -0.60%
Leverage 22.68% 22.20% 0.40%
Free cash flow 4.12% 2.42% 1.70%a
Firm riskt-1 2.51% 2.67% -0.16%
Institutional ownership 64.68% 64.04% 0.64%
Blockholder 74.38% 66.67% 6.71%
Industry adjusted ROAt-1 4.87% 4.47% 0.40%
Market to book ratio 1.42 1.38 0.04
Previous 1yr adj. stock return 7.35%*** -0.46% 7.52%
Previous 1yr raw stock return 2.23%*** 2.10%* 0.12%
Corporate Governance Characteristics
%. of inside directors 20.32% 23.03% -2.71%a
Num. of inside directors 1.97 2.17 -0.10
Board size 10.01 9.67 0.34
Board independence 67.45% 68.67% -1.22%
Departing CEO founder 9.63% 9.21% 0.42%
39
Table 3 Comparison of transitional characteristics and disruption costs between
planned and unexpected CEO departures
This table shows the univariate comparison of CEO transitional characteristics and
disruption costs between firms with Planned retirement and unexpected CEO departures.
Panel A shows the comparison of CEO transitional characteristics. Lead time is the
number of days between the incumbent CEO’s departure announcement date and their
actual departure date. Days before announcing the new CEO is the number of days
between the incumbent CEOs’ departure announcement date and the appointment date of
a new permanent CEO. Days before new CEO takeover is the number of days between
the incumbent CEOs’ departure announcement date and actual date the new CEO takes
over. Relay succession is an indicator variable that equals to 1 if the new CEO has been
the COO and/or President before they were promoted. Days since new CEO appt
COO/President is the executive tenure as COO and/or President. Panel B shows the
comparison of market reaction (cumulative abnormal returns) at the announcement of the
incumbent CEO departure, as well as excess stock returns within 30, 60, and 90 days
after the incumbent CEOs’ actual departure date. The announcement CARs are computed
in Eventus using both market adjusted (untabulated) and market model, and the excess
returns are the market-adjusted cumulative stock returns within 30, 60, and 90 days of
actual departure date. Stock return data is from CRSP. Panel C shows the comparison of
changes in firm performance. I calculate both industry-adjusted ROAs (not tabulated, but
available by request), as well as industry-and-performance adjusted ROAs. Definitions of
all other variables are in the Appendix. ***, **, and * indicate that the mean is
significantly different from 0 at 1%, 5%, and 10% level. Bolded letters c, b, and a
indicate a two-sided t-test for mean differences between Planned retirement and
unexpected CEO departure subsamples are significant at 1%, 5% and 10% level. Changes
in performance are winsorized at 1%.
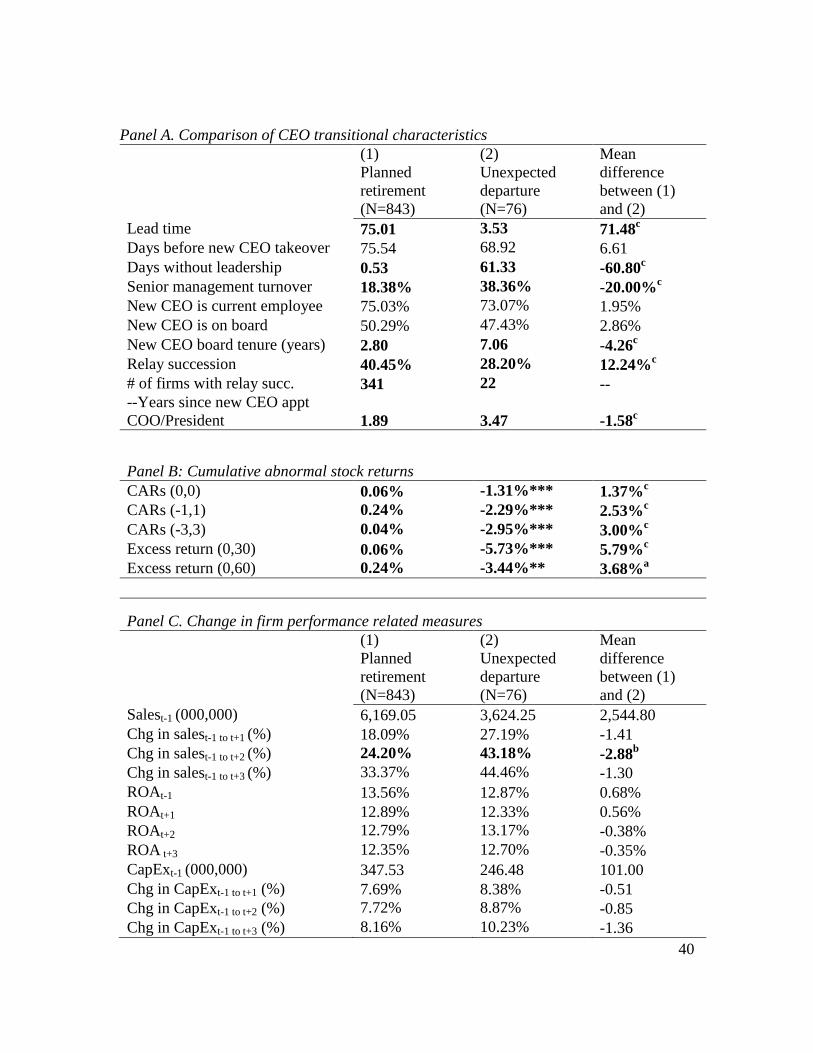
40
Panel A. Comparison of CEO transitional characteristics
(1)
Planned
retirement
(N=843)
(2)
Unexpected
departure
(N=76)
Mean
difference
between (1)
and (2)
Lead time 75.01 3.53 71.48c
Days before new CEO takeover 75.54 68.92
6.61
Days without leadership 0.53 61.33 -60.80c
Senior management turnover 18.38% 38.36%
-20.00%c
New CEO is current employee 75.03% 73.07% 1.95%
New CEO is on board 50.29% 47.43% 2.86%
New CEO board tenure (years) 2.80 7.06 -4.26c
Relay succession 40.45% 28.20% 12.24%c
# of firms with relay succ. 341 22 --
--Years since new CEO appt
COO/President 1.89
3.47 -1.58c
Panel B: Cumulative abnormal stock returns
CARs (0,0) 0.06% -1.31%***
1.37%c
CARs (-1,1) 0.24%
-2.29%***
2.53%c
CARs (-3,3) 0.04%
-2.95%***
3.00%c
Excess return (0,30) 0.06% -5.73%***
5.79%c
Excess return (0,60) 0.24%
-3.44%**
3.68%a
Panel C. Change in firm performance related measures
(1)
Planned
retirement
(N=843)
(2)
Unexpected
departure
(N=76)
Mean
difference
between (1)
and (2)
Salest-1 (000,000) 6,169.05 3,624.25
2,544.80
Chg in salest-1 to t+1 (%) 18.09% 27.19%
-1.41
Chg in salest-1 to t+2 (%) 24.20%
43.18%
-2.88b
Chg in salest-1 to t+3 (%) 33.37%
44.46%
-1.30
ROAt-1 13.56% 12.87%
0.68%
ROAt+1 12.89% 12.33%
0.56%
ROAt+2 12.79%
13.17%
-0.38%
ROA t+3 12.35%
12.70%
-0.35%
CapExt-1 (000,000) 347.53 246.48
101.00
Chg in CapExt-1 to t+1 (%) 7.69% 8.38%
-0.51
Chg in CapExt-1 to t+2 (%) 7.72%
8.87%
-0.85
Chg in CapExt-1 to t+3 (%) 8.16%
10.23%
-1.36
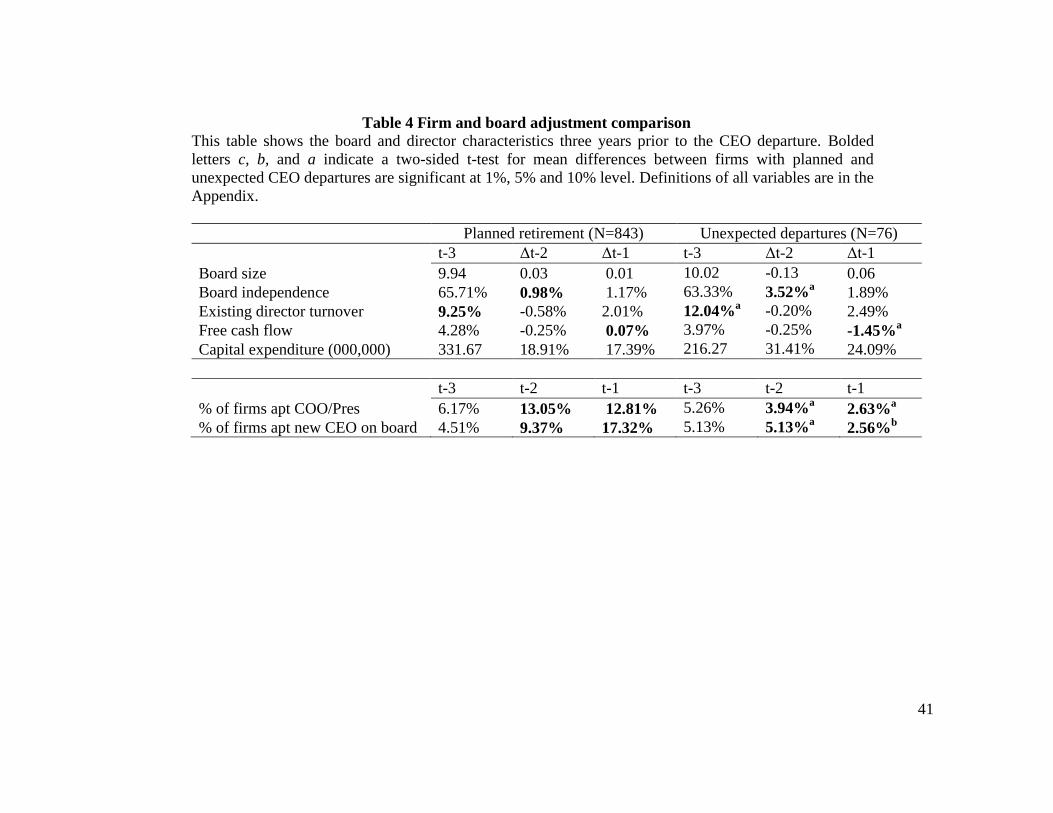
41
Table 4 Firm and board adjustment comparison
This table shows the board and director characteristics three years prior to the CEO departure. Bolded
letters c, b, and a indicate a two-sided t-test for mean differences between firms with planned and
unexpected CEO departures are significant at 1%, 5% and 10% level. Definitions of all variables are in the
Appendix.
Planned retirement (N=843) Unexpected departures (N=76)
t-3 Δt-2 Δt-1 t-3 Δt-2 Δt-1
Board size 9.94 0.03 0.01 10.02 -0.13 0.06
Board independence 65.71% 0.98% 1.17% 63.33% 3.52%a
1.89%
Existing director turnover 9.25% -0.58% 2.01% 12.04%a -0.20% 2.49%
Free cash flow 4.28% -0.25% 0.07% 3.97% -0.25% -1.45%a
Capital expenditure (000,000) 331.67 18.91% 17.39% 216.27 31.41% 24.09%
t-3 t-2 t-1 t-3 t-2 t-1
% of firms apt COO/Pres 6.17% 13.05% 12.81% 5.26% 3.94%a
2.63%a
% of firms apt new CEO on board 4.51% 9.37% 17.32% 5.13% 5.13%a
2.56%b
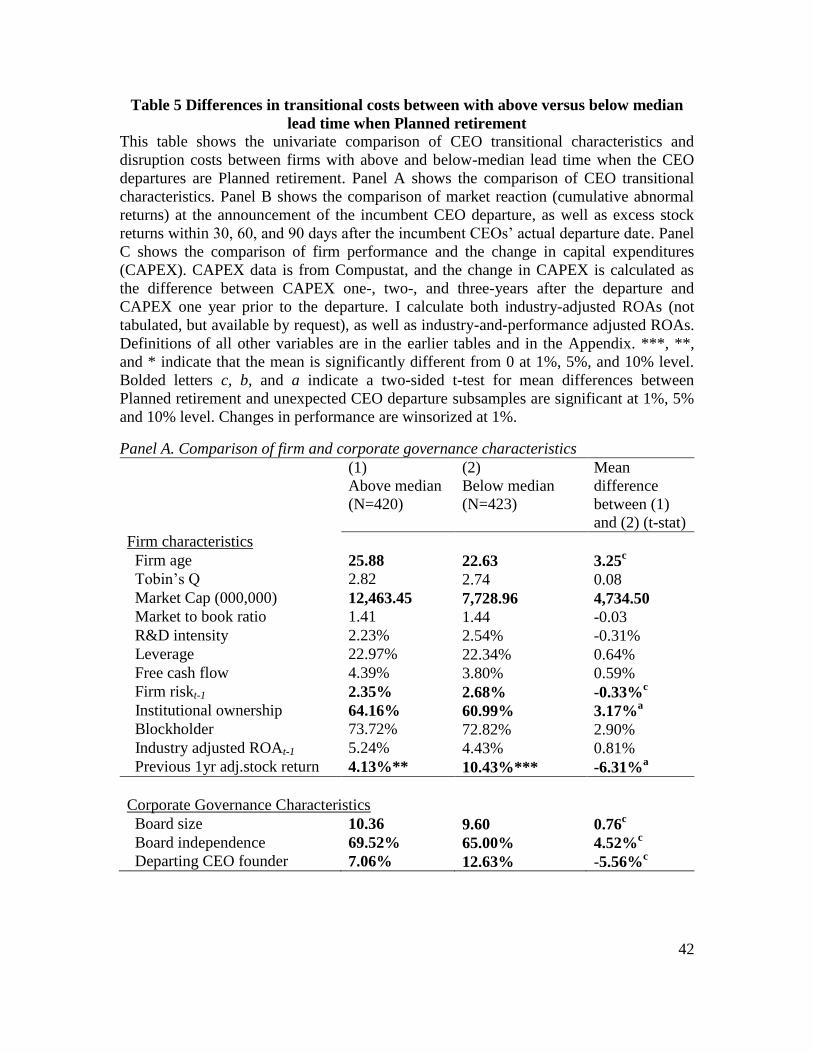
42
Table 5 Differences in transitional costs between with above versus below median
lead time when Planned retirement
This table shows the univariate comparison of CEO transitional characteristics and
disruption costs between firms with above and below-median lead time when the CEO
departures are Planned retirement. Panel A shows the comparison of CEO transitional
characteristics. Panel B shows the comparison of market reaction (cumulative abnormal
returns) at the announcement of the incumbent CEO departure, as well as excess stock
returns within 30, 60, and 90 days after the incumbent CEOs’ actual departure date. Panel
C shows the comparison of firm performance and the change in capital expenditures
(CAPEX). CAPEX data is from Compustat, and the change in CAPEX is calculated as
the difference between CAPEX one-, two-, and three-years after the departure and
CAPEX one year prior to the departure. I calculate both industry-adjusted ROAs (not
tabulated, but available by request), as well as industry-and-performance adjusted ROAs.
Definitions of all other variables are in the earlier tables and in the Appendix. ***, **,
and * indicate that the mean is significantly different from 0 at 1%, 5%, and 10% level.
Bolded letters c, b, and a indicate a two-sided t-test for mean differences between
Planned retirement and unexpected CEO departure subsamples are significant at 1%, 5%
and 10% level. Changes in performance are winsorized at 1%.
Panel A. Comparison of firm and corporate governance characteristics (1)
Above median
(N=420)
(2)
Below median
(N=423)
Mean
difference
between (1)
and (2) (t-stat)
Firm characteristics
Firm age 25.88 22.63 3.25c
Tobin’s Q 2.82 2.74 0.08
Market Cap (000,000) 12,463.45 7,728.96 4,734.50
Market to book ratio 1.41 1.44 -0.03
R&D intensity 2.23% 2.54% -0.31%
Leverage 22.97% 22.34% 0.64%
Free cash flow 4.39% 3.80% 0.59%
Firm riskt-1 2.35% 2.68% -0.33%c
Institutional ownership 64.16% 60.99% 3.17%a
Blockholder 73.72% 72.82% 2.90%
Industry adjusted ROAt-1 5.24% 4.43% 0.81%
Previous 1yr adj.stock return 4.13%** 10.43%*** -6.31%a
Corporate Governance Characteristics
Board size 10.36 9.60 0.76c
Board independence 69.52% 65.00% 4.52%c
Departing CEO founder 7.06% 12.63% -5.56%c
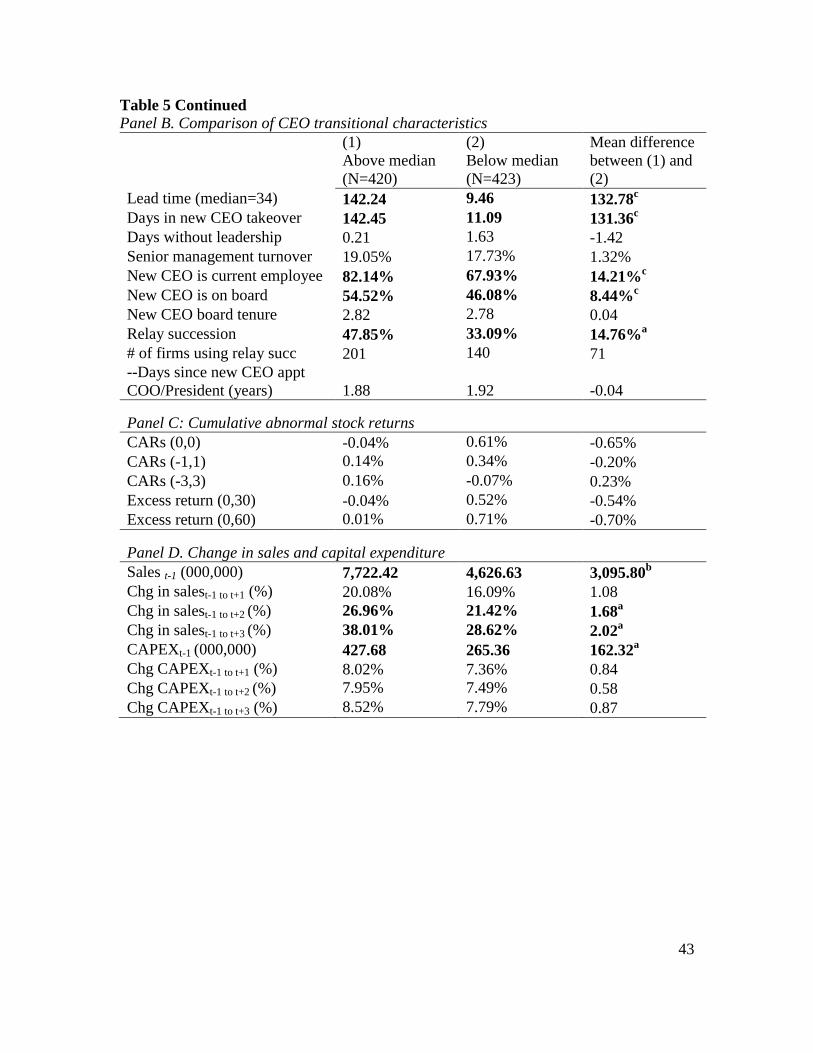
43
Table 5 Continued
Panel B. Comparison of CEO transitional characteristics
(1)
Above median
(N=420)
(2)
Below median
(N=423)
Mean difference
between (1) and
(2)
Lead time (median=34) 142.24 9.46 132.78c
Days in new CEO takeover 142.45 11.09
131.36c
Days without leadership 0.21 1.63
-1.42
Senior management turnover 19.05% 17.73%
1.32%
New CEO is current employee 82.14% 67.93% 14.21%c
New CEO is on board 54.52% 46.08% 8.44%c
New CEO board tenure 2.82 2.78 0.04
Relay succession 47.85% 33.09% 14.76%a
# of firms using relay succ 201 140 71
--Days since new CEO appt
COO/President (years) 1.88
1.92 -0.04
Panel C: Cumulative abnormal stock returns
CARs (0,0) -0.04% 0.61%
-0.65%
CARs (-1,1) 0.14%
0.34%
-0.20%
CARs (-3,3) 0.16%
-0.07%
0.23%
Excess return (0,30) -0.04% 0.52%
-0.54%
Excess return (0,60) 0.01%
0.71%
-0.70%
Panel D. Change in sales and capital expenditure
Sales t-1 (000,000) 7,722.42 4,626.63 3,095.80b
Chg in salest-1 to t+1 (%) 20.08% 16.09%
1.08
Chg in salest-1 to t+2 (%) 26.96%
21.42%
1.68a
Chg in salest-1 to t+3 (%) 38.01%
28.62%
2.02a
CAPEXt-1 (000,000) 427.68 265.36
162.32a
Chg CAPEXt-1 to t+1 (%) 8.02% 7.36%
0.84
Chg CAPEXt-1 to t+2 (%) 7.95%
7.49%
0.58
Chg CAPEXt-1 to t+3 (%) 8.52%
7.79%
0.87
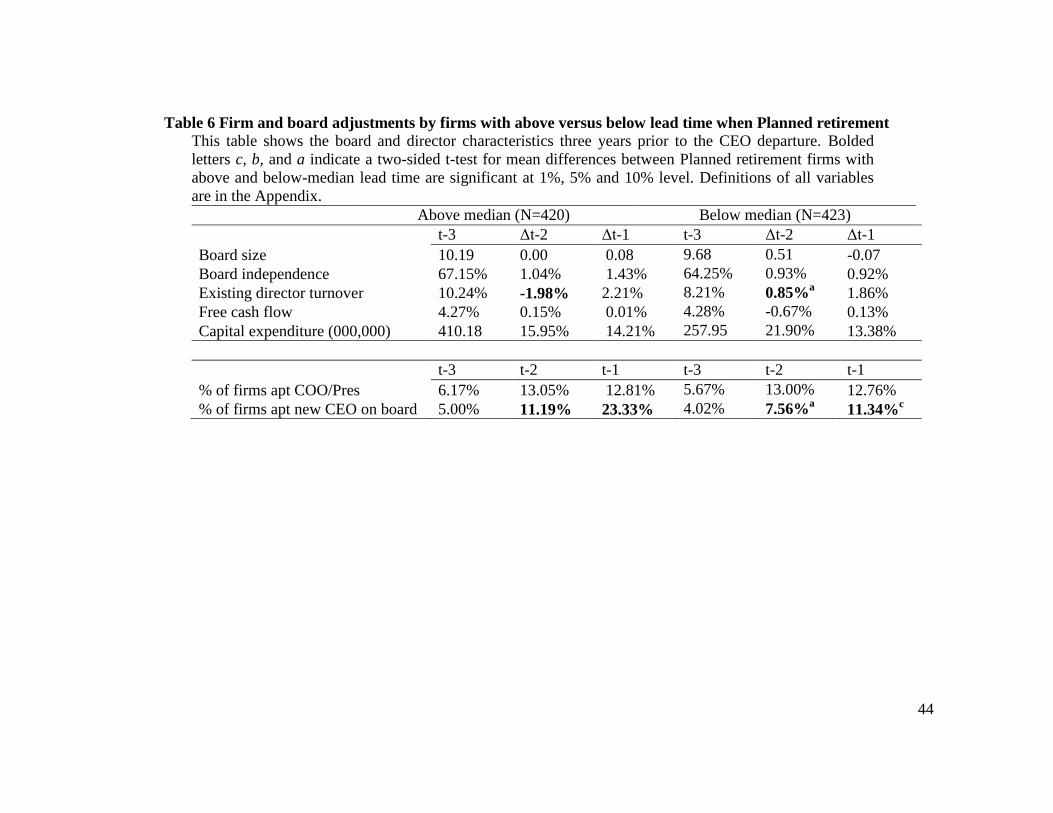
44
Table 6 Firm and board adjustments by firms with above versus below lead time when Planned retirement
This table shows the board and director characteristics three years prior to the CEO departure. Bolded
letters c, b, and a indicate a two-sided t-test for mean differences between Planned retirement firms with
above and below-median lead time are significant at 1%, 5% and 10% level. Definitions of all variables
are in the Appendix.
Above median (N=420) Below median (N=423)
t-3 Δt-2 Δt-1 t-3 Δt-2 Δt-1
Board size 10.19 0.00 0.08 9.68 0.51 -0.07
Board independence 67.15% 1.04% 1.43% 64.25% 0.93%
0.92%
Existing director turnover 10.24% -1.98% 2.21% 8.21%
0.85%a
1.86%
Free cash flow 4.27% 0.15% 0.01% 4.28% -0.67% 0.13%
Capital expenditure (000,000) 410.18 15.95% 14.21% 257.95 21.90% 13.38%
t-3 t-2 t-1 t-3 t-2 t-1
% of firms apt COO/Pres 6.17% 13.05% 12.81% 5.67% 13.00%
12.76%
% of firms apt new CEO on board 5.00% 11.19% 23.33% 4.02% 7.56%a
11.34%c
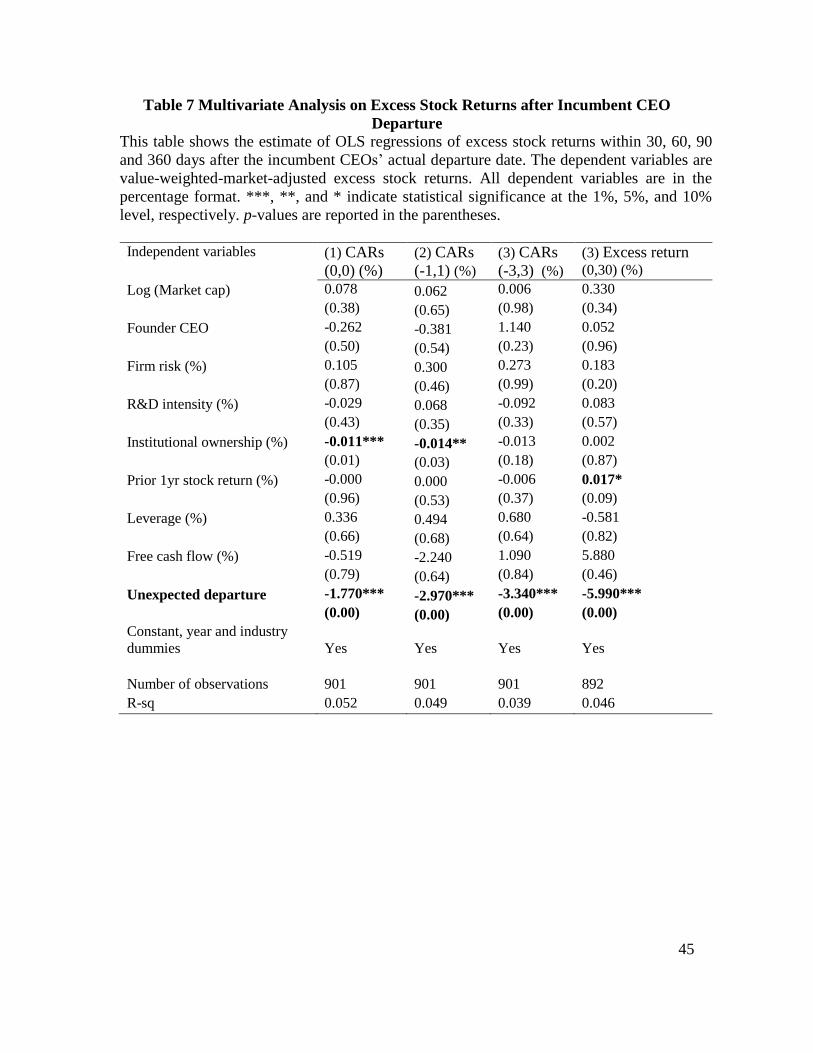
45
Table 7 Multivariate Analysis on Excess Stock Returns after Incumbent CEO
Departure
This table shows the estimate of OLS regressions of excess stock returns within 30, 60, 90
and 360 days after the incumbent CEOs’ actual departure date. The dependent variables are
value-weighted-market-adjusted excess stock returns. All dependent variables are in the
percentage format. ***, **, and * indicate statistical significance at the 1%, 5%, and 10%
level, respectively. p-values are reported in the parentheses.
Independent variables (1) CARs
(0,0) (%)
(2) CARs
(-1,1) (%)
(3) CARs
(-3,3) (%)
(3) Excess return (0,30) (%)
Log (Market cap) 0.078 0.062 0.006 0.330
(0.38) (0.65) (0.98) (0.34)
Founder CEO -0.262 -0.381 1.140 0.052
(0.50) (0.54) (0.23) (0.96)
Firm risk (%) 0.105 0.300 0.273 0.183
(0.87) (0.46) (0.99) (0.20)
R&D intensity (%) -0.029 0.068 -0.092 0.083
(0.43) (0.35) (0.33) (0.57)
Institutional ownership (%) -0.011*** -0.014** -0.013 0.002
(0.01) (0.03) (0.18) (0.87)
Prior 1yr stock return (%) -0.000 0.000 -0.006 0.017*
(0.96) (0.53) (0.37) (0.09)
Leverage (%) 0.336 0.494 0.680 -0.581
(0.66) (0.68) (0.64) (0.82)
Free cash flow (%) -0.519 -2.240 1.090 5.880
(0.79) (0.64) (0.84) (0.46)
Unexpected departure -1.770*** -2.970*** -3.340*** -5.990***
(0.00) (0.00) (0.00) (0.00)
Constant, year and industry
dummies Yes Yes Yes Yes
Number of observations 901 901 901 892
R-sq 0.052 0.049 0.039 0.046
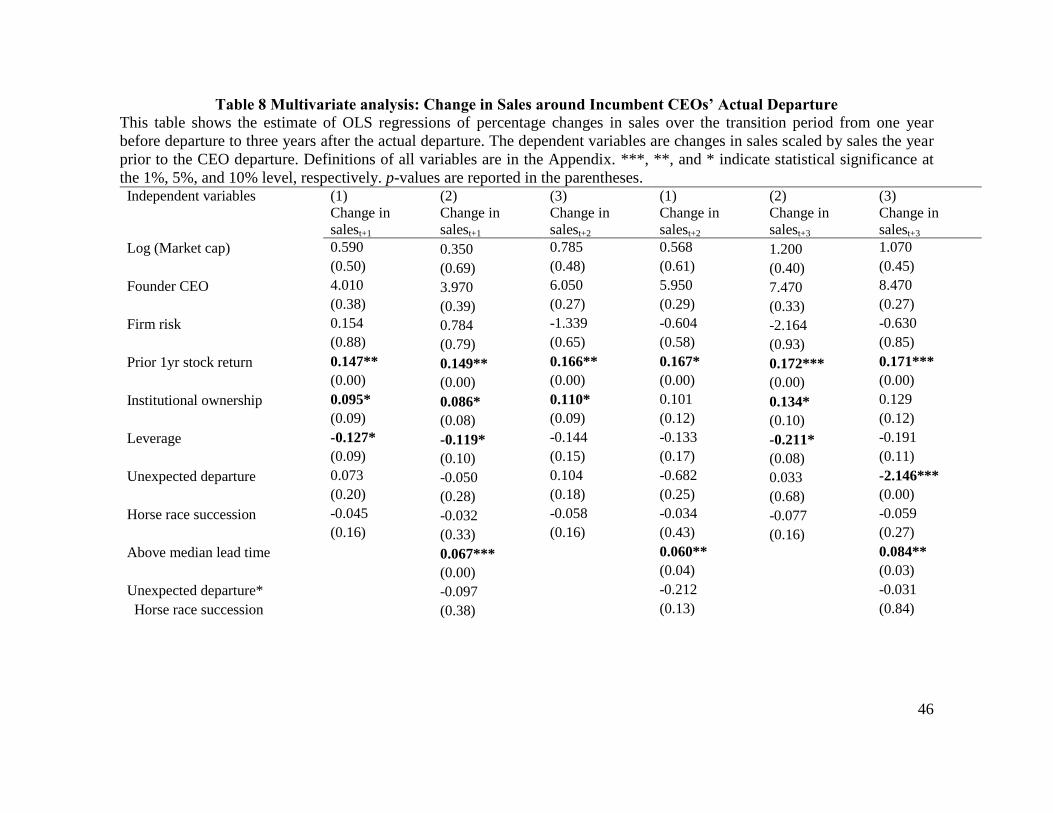
46
Table 8 Multivariate analysis: Change in Sales around Incumbent CEOs’ Actual Departure
This table shows the estimate of OLS regressions of percentage changes in sales over the transition period from one year
before departure to three years after the actual departure. The dependent variables are changes in sales scaled by sales the year
prior to the CEO departure. Definitions of all variables are in the Appendix. ***, **, and * indicate statistical significance at
the 1%, 5%, and 10% level, respectively. p-values are reported in the parentheses. Independent variables (1)
Change in
salest+1
(2)
Change in
salest+1
(3)
Change in
salest+2
(1)
Change in
salest+2
(2)
Change in
salest+3
(3)
Change in
salest+3
Log (Market cap) 0.590 0.350 0.785 0.568 1.200 1.070
(0.50) (0.69) (0.48) (0.61) (0.40) (0.45)
Founder CEO 4.010 3.970 6.050 5.950 7.470 8.470
(0.38) (0.39) (0.27) (0.29) (0.33) (0.27)
Firm risk 0.154 0.784 -1.339 -0.604 -2.164 -0.630
(0.88) (0.79) (0.65) (0.58) (0.93) (0.85)
Prior 1yr stock return 0.147** 0.149** 0.166** 0.167* 0.172*** 0.171***
(0.00) (0.00) (0.00) (0.00) (0.00) (0.00)
Institutional ownership 0.095* 0.086* 0.110* 0.101 0.134* 0.129
(0.09) (0.08) (0.09) (0.12) (0.10) (0.12)
Leverage -0.127* -0.119* -0.144 -0.133 -0.211* -0.191
(0.09) (0.10) (0.15) (0.17) (0.08) (0.11)
Unexpected departure 0.073 -0.050 0.104 -0.682 0.033 -2.146***
(0.20) (0.28) (0.18) (0.25) (0.68) (0.00)
Horse race succession -0.045 -0.032 -0.058 -0.034 -0.077 -0.059
(0.16) (0.33) (0.16) (0.43) (0.16) (0.27)
Above median lead time 0.067*** 0.060** 0.084**
(0.00) (0.04) (0.03)
Unexpected departure* -0.097 -0.212 -0.031
Horse race succession (0.38) (0.13) (0.84)
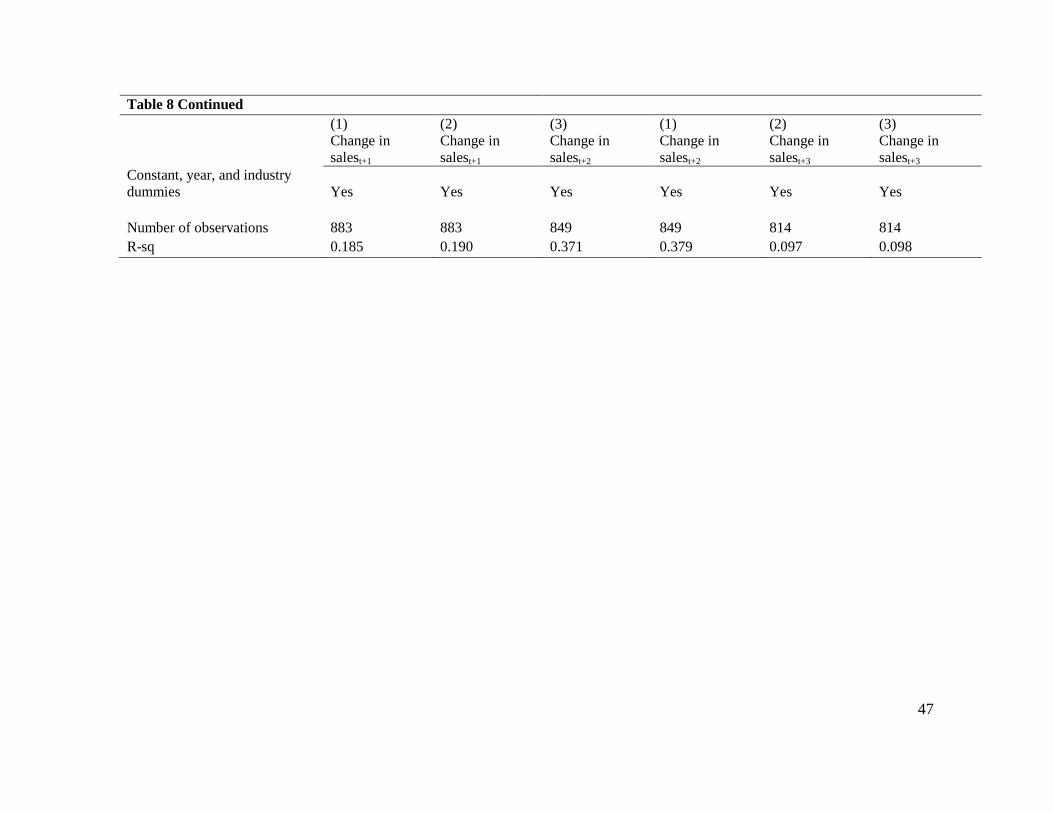
47
Table 8 Continued
(1)
Change in
salest+1
(2)
Change in
salest+1
(3)
Change in
salest+2
(1)
Change in
salest+2
(2)
Change in
salest+3
(3)
Change in
salest+3
Constant, year, and industry
dummies Yes Yes Yes Yes Yes Yes
Number of observations 883 883 849 849 814 814
R-sq 0.185 0.190 0.371 0.379 0.097 0.098
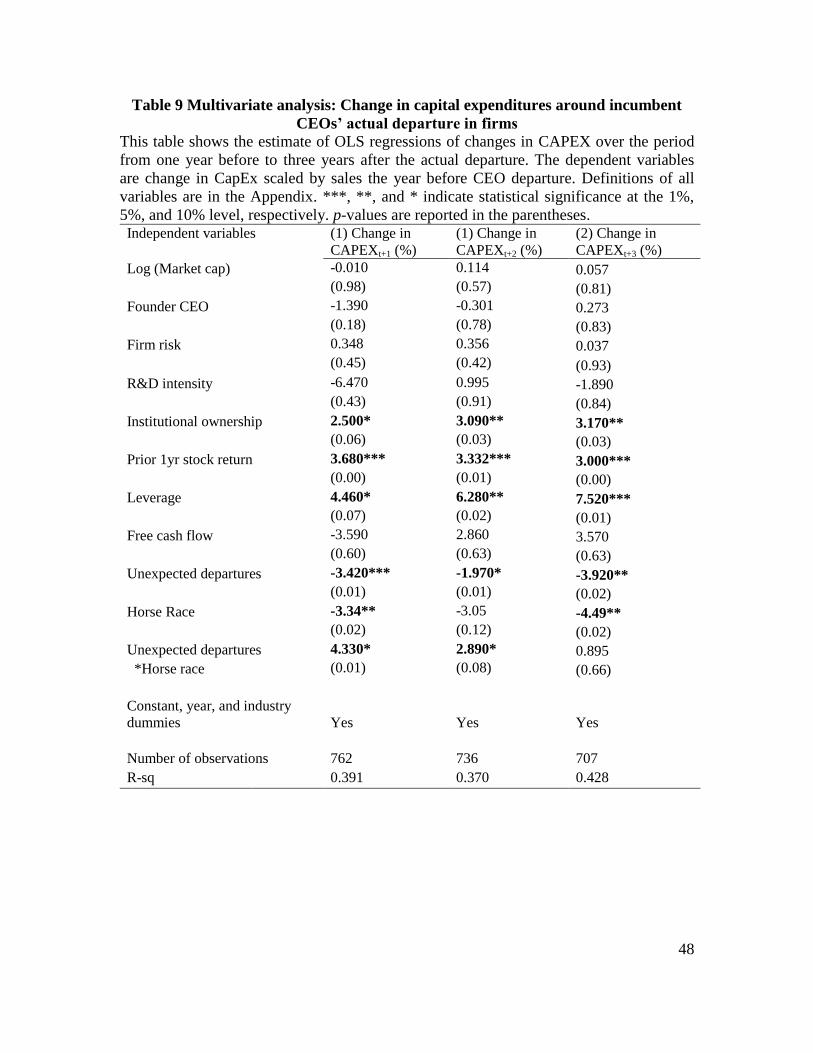
48
Table 9 Multivariate analysis: Change in capital expenditures around incumbent
CEOs’ actual departure in firms
This table shows the estimate of OLS regressions of changes in CAPEX over the period
from one year before to three years after the actual departure. The dependent variables
are change in CapEx scaled by sales the year before CEO departure. Definitions of all
variables are in the Appendix. ***, **, and * indicate statistical significance at the 1%,
5%, and 10% level, respectively. p-values are reported in the parentheses. Independent variables (1) Change in
CAPEXt+1 (%)
(1) Change in
CAPEXt+2 (%)
(2) Change in
CAPEXt+3 (%)
Log (Market cap) -0.010 0.114 0.057
(0.98) (0.57) (0.81)
Founder CEO -1.390 -0.301 0.273
(0.18) (0.78) (0.83)
Firm risk 0.348 0.356 0.037
(0.45) (0.42) (0.93)
R&D intensity -6.470 0.995 -1.890
(0.43) (0.91) (0.84)
Institutional ownership 2.500* 3.090** 3.170**
(0.06) (0.03) (0.03)
Prior 1yr stock return 3.680*** 3.332*** 3.000***
(0.00) (0.01) (0.00)
Leverage 4.460* 6.280** 7.520***
(0.07) (0.02) (0.01)
Free cash flow -3.590 2.860 3.570
(0.60) (0.63) (0.63)
Unexpected departures -3.420*** -1.970* -3.920**
(0.01) (0.01) (0.02)
Horse Race -3.34** -3.05 -4.49**
(0.02) (0.12) (0.02)
Unexpected departures 4.330* 2.890* 0.895
*Horse race (0.01) (0.08) (0.66)
Constant, year, and industry
dummies
Yes Yes Yes
Number of observations 762 736 707
R-sq 0.391 0.370 0.428
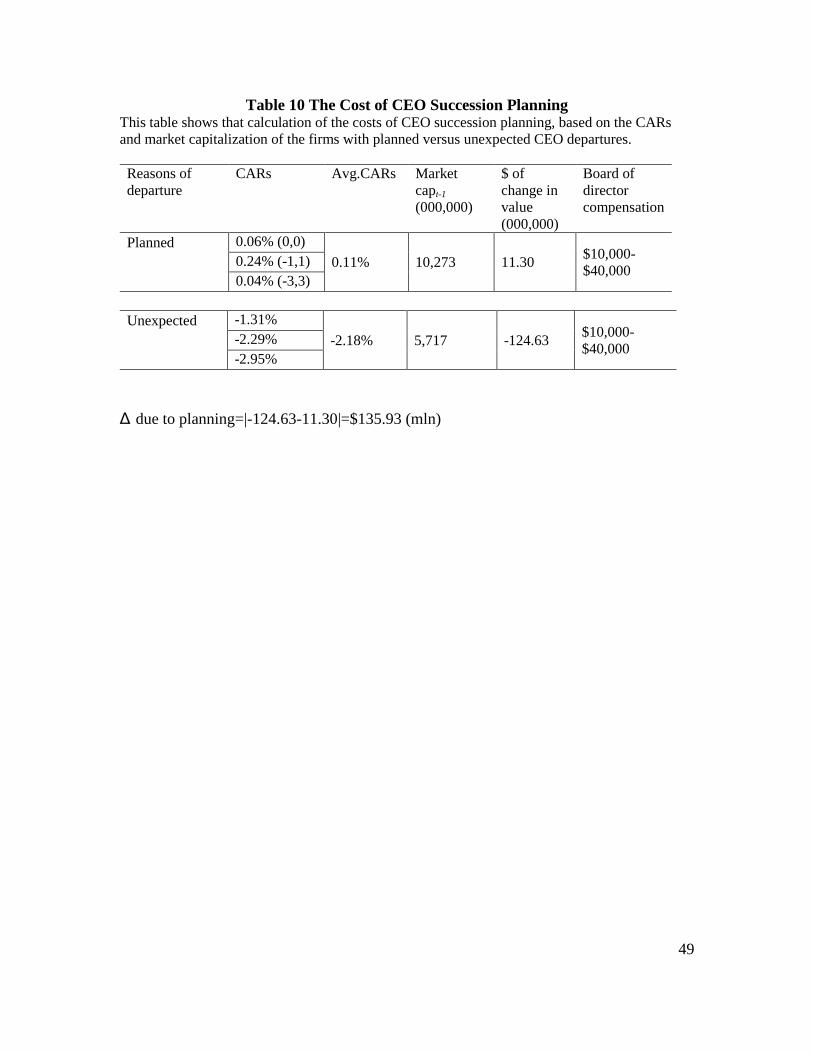
49
Table 10 The Cost of CEO Succession Planning This table shows that calculation of the costs of CEO succession planning, based on the CARs
and market capitalization of the firms with planned versus unexpected CEO departures.
Reasons of
departure
CARs Avg.CARs Market
capt-1
(000,000)
$ of
change in
value
(000,000)
Board of
director
compensation
Planned 0.06% (0,0)
0.11% 10,273 11.30 $10,000-
$40,000 0.24% (-1,1)
0.04% (-3,3)
Unexpected -1.31%
-2.18% 5,717 -124.63 $10,000-
$40,000 -2.29%
-2.95%
Δ due to planning=|-124.63-11.30|=$135.93 (mln)
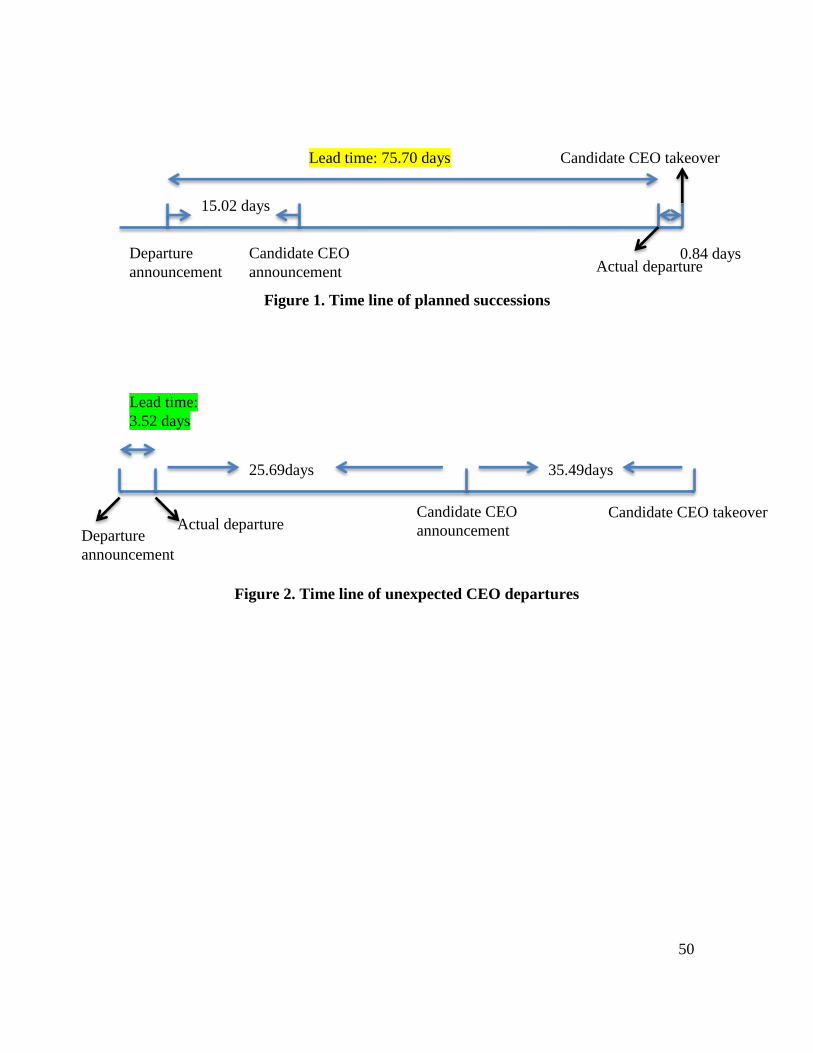
50
Figure 1. Time line of planned successions
Figure 2. Time line of unexpected CEO departures
Departure
announcement
Candidate CEO
announcement Actual departure
Candidate CEO takeover Lead time: 75.70 days
15.02 days
0.84 days
Departure
announcement
Actual departure Candidate CEO
announcement
Candidate CEO takeover
Lead time:
3.52 days
25.69days 35.49days

51
CHAPTER 2
BOARD COMPOSITION AND ORGANIZATIONAL RESILIENCE: EVIDENCE
FROM SUDDEN CEO DEPARTURES
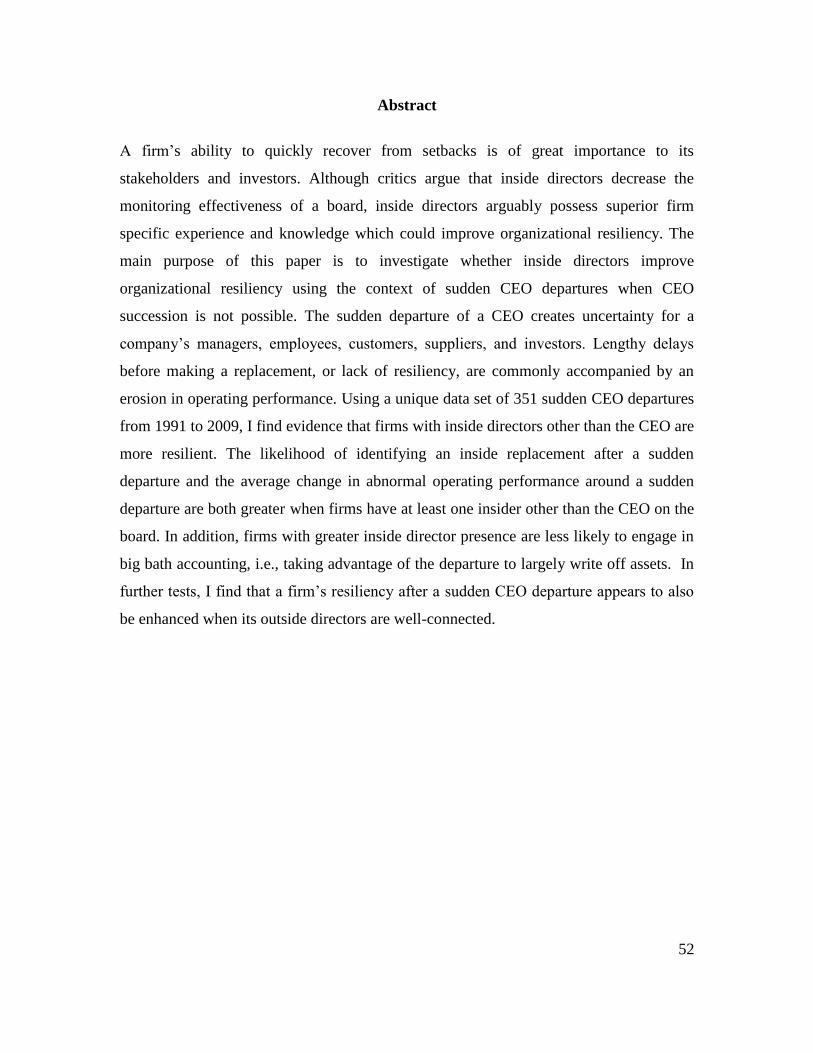
52
Abstract
A firm’s ability to quickly recover from setbacks is of great importance to its
stakeholders and investors. Although critics argue that inside directors decrease the
monitoring effectiveness of a board, inside directors arguably possess superior firm
specific experience and knowledge which could improve organizational resiliency. The
main purpose of this paper is to investigate whether inside directors improve
organizational resiliency using the context of sudden CEO departures when CEO
succession is not possible. The sudden departure of a CEO creates uncertainty for a
company’s managers, employees, customers, suppliers, and investors. Lengthy delays
before making a replacement, or lack of resiliency, are commonly accompanied by an
erosion in operating performance. Using a unique data set of 351 sudden CEO departures
from 1991 to 2009, I find evidence that firms with inside directors other than the CEO are
more resilient. The likelihood of identifying an inside replacement after a sudden
departure and the average change in abnormal operating performance around a sudden
departure are both greater when firms have at least one insider other than the CEO on the
board. In addition, firms with greater inside director presence are less likely to engage in
big bath accounting, i.e., taking advantage of the departure to largely write off assets. In
further tests, I find that a firm’s resiliency after a sudden CEO departure appears to also
be enhanced when its outside directors are well-connected.
53
1. Introduction
Firms can face several shocks during their life cycle. A firm’s ability to quickly
recover from setbacks is of great importance to its stakeholders and investors. One
particularly critical shock to a firm is the sudden departure of its CEO (Worrell, Davidson
III, Chandy and Garrison, 1986; Behn, Dawley, Riley and Yang, 2006; Salas, 2010). The
sudden loss of a CEO has the potential to throw a company into a tailspin. Consider, for
example, the unanticipated resignation of Hewlett-Packard’s (HP) former CEO Mark
Hurd on August 6, 2010.8 Its press release reported that Hurd’s decision was made
following an investigation surrounding a claim of sexual harassment against Hurd and HP
by a former contractor to the company. HP’s market value fell by $10 billion, close to a
10 percent decline following Hurd’s resignation. The perceived importance of being
resilient when faced with a sudden CEO departure is underscored by the new requirement
that firms must include a CEO succession planning proposal in their proxy statements
(SEC Staff Legal Bulletin 14E).
The purpose of this paper is to investigate whether certain board characteristics are
related to a firm’s resilience by examining sudden CEO departures, when CEO
succession is not possible. Understanding the relation between board composition and a
firm’s ability to quickly recover from shocks such as a sudden CEO departure is
important in understanding a firm’s ability to manage risk. Specifically, I examine
whether non-CEO inside directors improve a firm’s ability to quickly recover from a
sudden loss in executive leadership. Inside directors may possess superior firm specific
knowledge and experience which may allow firms to recover from shocks more quickly.
8 “HP CEO Mark Hurd resigns; CFO Cathie Lesjak Appointed Interim CEO; HP Announces Preliminary
Results and Raises Full-year Outlook”, HP press release, August 2010.
54
For instance, inside directors may be better able to assume the role of CEO in either a
permanent role for a quick recovery or in a temporary role to provide stability during the
search for a new CEO. Agrawal, Knoeber, and Tsoulouhas (2006) indicate that it is less
costly for firms to replace a CEO with an internal candidate, and thus, firms only choose
external candidates when they are superior. Moreover, Masulis and Mobbs (2009)
suggest that inside directors can provide higher quality internal candidates. In contrast,
too many inside directors on a firm’s board is often associated with ineffective boards
and entrenchment.
A CEO departure is categorized as sudden if it is unanticipated by the board of
directors, hence no adjustments to the board have been made to prepare for the departure.
Sudden CEO departures may consist of the unexpected CEO departures due to death and
illness, as well as sudden forced CEO departures due to lawsuits and criminal
investigations. In the first half of the paper, I use the whole sample of 351 sudden CEO
departures9 between 1991 and 2009, and find that firms with more non-CEO inside
directors are associated with lower disruption and transitional costs, or greater resilience.
Specifically, the likelihood of identifying an internal replacement is significantly greater
when firms have at least one non-CEO insider on the board. Additionally, the average
change in industry-and-performance adjusted operating performance from one year
before to three years after the sudden CEO departure is economically greater in firms
with non-CEO inside directors. In addition, firms with greater inside director presence are
less likely to engage in large write-offs of assets, i.e., taking a big bath after the CEO
departure. In the second part of the paper, I use the stricter sample of 119 unexpected
9 Financial and utility firms are excluded in my sample.
55
departures due to death, illness, and sudden resignation over the same period, to make
sure that the results are not subjected to sample construction. The results are consistent
with those in the broader sample of sudden CEO departures.
I further examine whether outside directors with numerous connections enhance a
firm’s resilience, or mitigate the costs associated with sudden CEO departures. Coles,
Daniel, and Naveen, and Omer, Shelley, and Tice (2012) indicate that outside directors
may add value through their networks. Thus, well-connected outside directors may be
better able to quickly identify through their networks highly qualified replacements to
lead the recovery. In contrast, Fich and Shivdasani (2006) argue that outside directors
sitting on numerous boards are too busy to effectively fulfill their responsibilities as
directors. In this case, outside directors may quickly choose replacements through their
connections, but the replacements may not be well qualified to lead a recovery. I find that
well-connected outside directors are associated with greater resilience after sudden CEO
departures, and that they play both the identification and certification roles in the
replacement CEO selection process through their network. In fact, firms with both non-
CEO inside directors and well-connected outside directors appear to be more resilient to
sudden CEO departures; whereas firms with no non-CEO inside directors and not
connected outside directors are least resilient. Specifically, well-connected outside
directors are associated with more experienced replacement CEOs. Moreover,
replacement CEOs tend to be appointed within a shorter time period, are more likely to
be part of an outside director’s network, and are better connected themselves. The results
are robust to controlling for other factors that may influence the CEO selection process
and to using different criteria when identifying a CEO departure as sudden.
56
To my knowledge this is the first study to examine the relation between certain
board characteristics and a firm’s ability to recover after a potentially disruptive shock,
i.e., a sudden CEO departure. Prior literature (Worrell, Davidson III, Chandy and
Garrison, 1986; Behn, Dawley, Riley and Yang, 2006; Salas, 2010, Rivolta 2014)
suggests that CEO succession planning is important. This paper sheds light on the
important roles inside directors play in crisis management and organizational resilience
when succession planning is not possible. In addition, consistent with the argument in
Coles et al. (2012), the results provide another avenue through which well-connected
outside directors can add value identifying and certifying the new CEO through their
connections/networks. Given the importance of both non-CEO inside directors and well-
connected outside directors, the findings in this paper help inform the debate on uniform
mandates for boards. Numerous studies examine the monitoring role of boards, but the
advisory role is not as well-explored. Consistent with Linck et al., Coles et al., and Boone
et al., the results in this paper provide another avenue through which inside directors and
well-connected outside directors may add value advising firms in the new CEO selection
process after sudden CEO departures. Last but not least, this paper contributes to the
literature of earning management in the form of large write-offs of assets, i.e., big bath.
Moehrle (2002) and Christensen et al. (2008) argue that large negative special charges
can be an extreme form of earnings management. The results in this paper show that
firms with inside directors are less likely to engage in big bath accounting.
The remainder of the paper is organized as follows. Section 2 discusses the prior
literature and develops my hypotheses. Section 3 describes the data and provides
summary statistics. Section 4 presents univariate and multivariate results using sudden
57
CEO departures. Section 5 provides additional analysis using the stricter sample of
unexpected CEO departures. Section 6 provides a summary and conclusion.
2. Prior Literature and Hypotheses Development
2.1. Inside/outside Successions
The existing literature on the succession type reflects a common theme: inside
successions are associated with maintenance strategies, and outside successions are
associated with changes in corporate culture and resource allocation. Agrawal, et al.
(2006) find that firms prefer inside succession to outside succession, unless the outside
replacements are significantly better than the insiders. Naveen (2006) argues that the
likelihood of inside succession is dependent upon firm complexity and industry
homogeneity. Specifically, inside successions are more common in larger, more
diversified firms, and firms in more heterogeneous industries, in which the costs of
information transfer is higher. Behn et al. (2006) report that firms who choose inside
successors outperform those who choose outside successors. I predict that boards with a
greater number of non-CEO inside directors prior to the departure may be more prone to
appoint an insider after a sudden CEO departure given that firms have a larger pool of
internal candidate and that it may take boards less time to appoint a candidate from inside
than outside the company.
2.2. Firm specific information, R&D intensity and board structure
Current corporate governance studies on inside directors have found that they
possess superior firm specific information than outside directors. Studies as early as
58
Fama and Jensen (1983) argue that though independent of the CEO, outsider directors
lack information on firm projects. Along the same line, Raheja, C. (2005) suggests that
high R&D intensive firms benefit from having more insiders on board, and that board
size and composition is a function of the “trade-off between maximizing the incentive for
insiders to reveal their private information, minimizing coordination costs among
outsiders and maximizing the ability of outsiders to reject inferior projects” (p.283).
Adams and Ferreira (2007) advocate “friendly” board structures with insiders, as they
argue that insiders possess more firm specific information than outsiders, and that a
friendly board facilitates the transfer of information from insiders to outside board
members. Masulis and Mobbs (2009) conclude that insiders possess more firm specific
information. They find that outside directorships provide incentives for inside directors to
facilitate the transfer of information to other directors, hence improving board
performance and firm performance. Following Raheja, C. (2005) and Coles et al. (2008),
I use R&D intensity to proxy for the importance of firm specific knowledge. I predict that
high R&D intensity firms are more likely to choose a new permanent CEO from inside
the company.
2.3. Inside director as the new CEO
Musulis and Mobbs (2009) define inside directors holding outside board seats as
certified inside directors (CIDs), and argue that the knowledge and skills possessed by
these CIDs provide incentives for the current CEO to improve performance, or they may
be replaced by the CIDs. Current literature has not provided much information regarding
inside directors’ potential as the new CEO. Given the earlier discussion that inside
directors possess firm specific knowledge, and that they are already familiar with other
59
board members and senior managers, the transition should be smoother. Therefore, I
hypothesize that the appointment of an inside director as the new CEO is associated with
lower costs in the transition, and better change in firm performance.
2.4. Board structure and change in firm performance after the departure
Sudden CEO departures generate disruption costs during the transitional period. I
proxy these costs using the new CEO’s tenure, as well as the delay between incumbent
CEO departure and the successor appointment. Existing literature has found that the new
CEO, especially those hired from the outside, typically have about 18 months to prove
their competency to shareholders (Zhang 2008, Conlin 2009, and Zhang and Rajagopalan
2010). This argument is grounded in the information asymmetry theory that board of
directors may have incomplete information about the CEO candidate. Hence, it is
possible that the board may have hired the wrong executive and subsequently fires the
new CEO to correct the mistake, which leads to greater new CEO turnover. The new
CEO turnover could be a huge cost to the company given the average severance pay the
companies are offering to their executives (Huang 2011). I test whether the new CEO
turnover could be lower (longer tenure) if they were appointed by with strong insider
presences.
Behn et al. 2006 find that delay in appointing a successor after unexpected senior
executive death is associated with decreasing operating performance, measured by
change in sales, change in income before extraordinary items scaled by sales, calculated
over one-year and two-year period, and lower cumulative returns around the death of the
CEO. Following their study, I hypothesize that firms with strong insider presence boards,
60
as well as better-connected boards, experience shorter delays, hence shorter periods of
uncertainty.
The arguments above also suggest that if certain boards are effective at managing
the information they possess, and lowering transitional cost after a sudden event, then
they should be associated with better change in firm performance, or at least maintain
continuity. In more R&D intensive firms, having more insiders on board may be
associated with greater change in performance.
2.5. Can well-connected outside director enhance firm resilience?
Outside directors may also play a role in choosing the new CEO, via their
connections to other public boards. Omer et al. (2012) argues that well-connected
directors may not be associated with lower firm performance, as busy director hypothesis
predicted. These directors may be beneficial to firms with greater investment
opportunities, because they facilitate the transfer of useful information. In addition, Coles
et al. (2012) argue that outside director connections proxy for derived demand for their
experience, expertise, and service. Firms that have greater advising needs benefit from
having well connected outside directors. I predict that well connected outside directors
may also be exposed to a larger pool of qualified outside CEO candidates. Therefore,
they may enhance firm resilience via their network, after a sudden CEO departure. Their
roles may be particularly important in firms with no non-CEO inside directors before the
departure.
2.6. Big bath hypothesis
Big bath accounting has been described as firms having large write-offs in their
profit and loss statement in order to create more favorable returns in the subsequent years
61
(Healy 1985, Watts and Zimmerman 1986, Walsh, Craig, and Clarke 1991, Moehrle
2002). Moehrle (2002) argues that big bath can be seen as an extreme form of earnings
management. Christensen, Paik, and Stice (2008) relate big bath to a firm’s deferred tax
allowance. They use large negative special items charges (Compustat Annual Data Item
17) to proxy big bath, and identify all firms reporting special charges that exceeds 10% of
their total assets the same fiscal year. The authors hypothesize that big bath firms will
have lower operating performance the year after. They reason that if managers possess
private information about a firm’s future perspective, the performance next year should
reflect this information. I use the same measure to proxy big bath. Big bath is a binary
variable that equals to 1 if firms report negative special item charges that equals to or
exceeds 10% of their total asset, and 0 otherwise. Since inside directors may possess
more firm specific information, I predict that firms with greater insider presence are more
likely take advantage of the CEO departure and write off bad assets, i.e., taking a big
bath.
3. Data and Summary Statistics
I use data from eight different sources. I first identify the initial sample of CEO
departures during the period 1991-2009 from Execucomp, which covers S&P 1500 firms.
CRSP and Compustat provide stock returns and accounting information. CEO successor
board experience and corporate governance data are identified through the Investor
Responsibility Research Center (IRRC) Director Database10
. For the time period not
covered by IRRC (1991-995), I use Compact Disclosure data to gather board size and
10 This database is now called Risk Metrics
62
independence information11
. Institutional ownership information is obtained through
Thomson Reuters Institutional Ownership Data. I hand collect data to fill in any
observations where CEO appointment date or the date he/she joined the company is
missing in Execucomp, for the purpose of identifying CEO tenure.
The initial sample contains 2,522 CEO departures identified from Execucomp
during the period of 1991-2009. I use the fiscal year as unit of time and merge the initial
sample with CRSP and Compustat, then merge with IRRC Director Database by
matching each annual shareholder meeting date for a firm with the fiscal year in which
the meeting is held. I exclude dual class firms and any observations where there was no
actual succession; for instance, the change of CEO captured is due to the change of their
last name, but the two observations are actually the same person. After the merging
process, there were around 2,300 CEO departures during the 1991-2009 period.
For all 2,300 CEO departures, I use Factiva, Lexis Nexis and proxy statements to
hand collect the following information: (1) CEO successor origin. This information is
missing for some observations due to the missing data in Execucomp on the date the
CEO joined the company. I follow Parrino (1997) definition on insider versus outsiders.
Insiders are successors that have been with the company for at least one year prior to
becoming CEO; and outsiders are successors that have been with the company for less
than a year prior to becoming CEO. (2) Interim CEOs. Whether the news release states
that the successor is an interim or permanent CEO. (3) Cause of departure. I categorize
the departure of the CEO into natural retirement, forced resignation, unexpected
11 I am grateful for Tina Yang at Villanova University for generously sharing director
data with me.
63
departures, M&A activity, restructuring, proxy fight, and the separation of CEO/chairman
duality. (4) The earliest announcement date of incumbent CEO departure and permanent
replacement CEO appointment. (5) The actual incumbent CEO departure and new CEO
takeover date. (6) Whether the replacement CEO has been on the appointing company’s
board of directors at least six months before the appointment announcement. (7) Cause of
the unexpected departure. Whether the unexpected departure is due to sudden death,
illness, or is due to incumbent CEO being hired away either by a better company, or
accepted a government job. (8) Whether the replacement CEO has had CEO experience
before in other companies. (9) Whether the retiring CEO is the founder of the company,
and whether the company is a family company. (10) The previous positions held by
replacement CEOs.
After collecting data for the whole CEO departure sample, I narrow my focus
onto sudden CEO departures. In the first half of the paper, I examine my research
questions by using the whole sample. A CEO departure is categorized as sudden if it is
unanticipated by the board of directors, hence no adjustments to the board have been
made to prepare for the departure. Sudden CEO departures may consist of the unexpected
CEO departures due to death and illness, as well as sudden forced CEO departures due to
lawsuits and criminal investigations. A CEO departure is categorized as unexpected when
the CEO departure (or decision to leave) is neither a result of poor performance, nor of
regulatory and/or criminal investigation. It should be a genuinely unexpected event.
Although a CEO’s departure may have come to a surprise to the market, it will not be
included in my sample if the board was aware of the departure (or decision to leave), or if
it was under the mutual agreement between the CEO and the board. In the second part of
64
the paper, I use a stricter sample of unexpected CEO departures to make sure that my
results are not subjected to sample construction. The final sample consists of 351 sudden
CEO departures from 1991 to 2009, out of which 119 are unexpected departures.
I use two measures of performance. The first is the industry-adjusted ROA,
measured as a sample firm’s ROA minus the median industry ROA, using the Fama and
French (1997) 48-industry classification. To control for potential mean reversion in
accounting returns for poorly performing firms, I follow the methodology of Barber and
Lyon (1996) to compute changes in industry-and-performance adjusted ROA. Each
sample firm with a sudden CEO departure is matched to a control firm with no CEO
departures. Industry-and-performance adjusted ROA is then defined as each sample
firm’s ROA less the ROA of a control firm, matched on primary two-digit SIC industry
and with the ROA within 10% in the previous year. If no firm in the same two-digit
industry has a year-1 ROA within 10%, I first select the firm in the same one- digit
industry, and then disregard industry and only match on year-1 ROA within 10%.
In order to demonstrate that firms that experience sudden CEO departures are
comparable to the universe of firms that experienced general CEO departures, I compare
summary statistics on firm, corporate governance and departing CEO characteristics to
Coles et al. 2008 (JFE) (untabulated). Their sample consists of 8,125 CEO turnovers over
the period of 1992-2001.The definition of all variables is provided in the Appendix. The
average board size in my sample is nine members, with two insiders and seven outsiders.
The insider percentage is 20.63%. These numbers are comparable to those in Coles et al.
Boards on average have two insiders and eight outsiders, with insider percentage 22% for
firm year observations from Execucomp over the period of 1992-2001. Using data over
65
the period 1989-1994, Huson et al. (2001) find that the median board size is 12, with
median insider percentage of 21%. The mean firm age in my sample is 20 years, R&D
intensity is 3.74%, and stock price volatility is 3.29%. These results are a bit different
from those of Coles et al.. They report an average of 28 years in firm age, R&D intensity
of 1.9%, and firm risk 2.6%. Compared to their general sample, firms that experience
sudden CEO departures are younger, more R&D intensive, and experienced greater stock
volatility during the prior year.
4. Analysis Using the Sudden CEO Departures
4.1. Comparison of CEO transitional characteristics
--INSERT TABLE 1 ABOUT HERE--
To provide an initial assessment of my hypotheses, I compare sudden CEO
departure replacement decisions for two categories of firms: (1) firms with at least one
non-CEO inside director and (2) firms with no non-CEO inside director. Table 1
illustrates the comparison of the firm and corporate governance characteristics based on
inside director presence. There seems to be no systematic differences in firm
characteristics in the two subsamples, except for Tobin’ Q. Firms with greater inside
director presence have higher firm valuation. However, the differences in corporate
governance characteristics are significant. Specifically, firms with at least one non-CEO
inside director have greater insider presence by design. They also have larger boards with
lower board independence, are more likely to be clustered during the time period before
2001. These results indicate that since there is no significant difference in firm
characteristics between the two subsamples ex ante, any performance differences ex post
to the departure may be associated with the difference in board composition.
66
--INSERT TABLE 2 ABOUT HERE--
Table 2 shows the CEO transition characteristic based on inside director presence.
Panel A shows that permanent replacement CEO characteristics. Firms are significantly
more likely to use inside succession and to appoint and inside director as the new CEO if
they have at least one non-CEO inside director on board. Specifically, the likelihood of
inside succession is 64.80% versus 30.85% (p<0.01), and the likelihood of appointing an
inside directors is 45.81% when there is at least one non-CEO inside director. The new
CEOs appointed by both boards are similar in age and possess equal external board seats.
In addition, the proportion of new outside CEOs identified through existing board
members’ network is similar.
Panel B demonstrates the replacement transitional characteristics. On average, the
number of days without permanent or interim CEO leadership is 53.92 days in the
subsample with at least one non-CEO inside director. Although this period without
leadership is shorter in this subsample, the difference is not statistically significant. In
addition, although firms in both subsamples are equally likely to use interim CEOs while
searching for the permanent replacement, 48.97% of the interims are inside directors in
firms with at least one non-CEO inside director. And the vast 75% of these inside director
interims became the permanent replacement later on. In the same subsample, 12.25% of
the interim CEOs are outside directors, and 42.85% of these outside directors eventually
became the permanent CEO. In contrast, in the subsample of firm with no non-CEO
inside directors, 25.00% of the interims are outside directors and 37.50% of them became
the permanent CEO later on. These results indicate that non-CEO inside directors can
play two roles in reducing transitional costs: they can either be appointed as the new
67
permanent CEO, or act as interim to provide stability to the firm, while it searches for a
competent new permanent CEO. This is consistent with the hypotheses in section 2.1 that
firms are more likely to use inside succession and appoint inside directors as the new
CEOs when they have a larger inside director presence.
4.2. Change in stock and firm performance around sudden CEO departures
--INSERT TABLE 3 ABOUT HERE--
Table 3 shows the univariate analysis results for change in stock and firm
performance around the announcement of unexpected CEO departures. I calculate all
three measures of firm performance: raw ROA, Fama French 48 industry-adjusted ROA,
as well as industry-and-performance-adjusted ROA to control for mean reversion. I argue
that change in firm performance one year around the year of sudden CEO departure
announcement measures the costs associated with the transition, as firms adapt to the
shock; whereas changes in performance two years and three years after the departure
announcement may reflect the new CEO quality. Panel A tabulates the Cumulative
Abnormal Returns (CARs) from 3 days before to 3 days after the announcement of
incumbent CEO departure. Panel B shows the comparison of prior fiscal year industry-
and-performance adjusted ROA to up to three years after the departure announcement
based on inside director presence. And Panel C tests the big bath hypothesis and compare
the percentage of firms reporting a largely negative special item charge that equals to or
exceeds 10% of total assets in the same fiscal year.
The results show that investors react negatively at the departure announcements in
both subsamples, indicating that facing sudden CEO departures, shareholders are
concerned with the future perspective of the company. The only difference between the
68
subsamples is that there seems to be information leakage in firms with no non-CEO
inside directors, as the CAR is negative and significant in the event window (-3,3). Firms
with greater inside director presence have significantly higher ROAs from one year
before to up to three years after the departure announcement year. The differences in
ROAs seem to be fairly consistent throughout the three-year period. In addition, there is
no statistical difference in the change in industry-and-performance-adjusted ROA. These
results indicate that there is not a unambiguous relation between inside director presence
and change in firm performance around sudden CEO departure. However, this relation is
fairly significant in the stricter sample of unexpected CEO departures, which will be
discussed in detail later. Last but not least, I test whether firms with greater inside
director presence are more likely to take advantage of the CEO departure and engage in
big bath accounting. Panel C shows that percentage of firms taking a big bath one year
before and up to three years after the departure announcement. I find that contrary to my
prediction, firms with greater inside director presence are significantly less likely to
engage in big bath accounting, compared to their counterparts. Specially, approximately
4-5% of the firms with at least one non-CEO inside director are involved in recording
largely negative (greater than 10% of their total assets) special items. In comparison, 9-
12% of the firms with no non-CEO inside director are involved in taking a big bath after
the incumbent CEO departure. This result may indicate that inside directors can help
firms weather the storm so that firms have less need to manipulate the books to smooth
earnings or to create better returns for the future. Whereas firms without inside directors
other than the CEO may have to write off bad assets to make returns look acceptable in
the near future.
69
4.3. The determinants of inside succession and the appointment of inside director
as the replacement CEO
--INSERT TABLE 4 ABOUT HERE--
In Table 4, I examine the determinants of an inside succession and the
appointment of an inside director as the new permanent CEO. I use both linear
probability model, controlling for industry fixed effects and Probit regressions to estimate
the determinants. I use two measures to capture inside director presence: whether firms
have at least one non-CEO inside director, and the total number of inside directors on
board. Consistent with my prediction, ceteris paribus, firms with more inside directors on
board are more likely to appoint an inside successor. Each additional non-CEO inside
directors increases the likelihood of inside succession by 24.2% (p<0.01). Firms are also
more likely to use inside succession after unexpected CEO departures. A change from
sudden forced to unexpected CEO departure increases the likelihood of inside succession
by 37.1% (p<0.01). In addition, I find that firm size is positively related to the likelihood
of inside succession. This finding indicates that larger firms may have a greater pool of
qualified inside talents, therefore, are more likely to use inside succession to maintain
continuity, rather hiring from outside the company.
The likelihood of boards appointing an inside director as the new CEO
demonstrates a similar pattern as the likelihood of inside succession. Specifically, each
additional inside director increases the likelihood of boards appointing an inside director
as the new permanent CEO by 13.3% (p<0.01). In addition, a change from sudden forced
to unexpected CEO departure increases the likelihood of an inside director appointed as
70
the new CEO by 60.6% (p<0.01). Lastly, firms size also positively impacts the likelihood
of boards appointing an inside director as the new CEO.
4.4. Can outside directors enhance firm resilience?
In this section, I further examine the roles outside directors can play in enhancing
firm resilience. Although the focus of this paper is on the role of inside directors, it is
important to understand whether and how outside directors monitor and advise in the new
CEO selection process. Coles et al. (2012) argue that the number of outside director
connections (the sum of connections that the outside directors of a firm has with directors
at other firms) is a proxy for outside directors’ experience, expertise and services. Similar
to Coles et al., I measure the connectedness of outside directors by calculating the total
number of outside director connections for each sample firm. I then sort sample firms
into terciles based the total number of outside director connections. I created two
variables to capture the ways outside directors could identify qualified CEO successors
via their connections. Outside CEO same board is a binary variable that equals to 1 if the
new CEO is hired from outside, and has been sitting on the same board with at least one
existing director in the departure firm, and 0 otherwise. New outside CEO’s board is a
binary variable that equals to 1 if at least one existing director has been sitting on the
board of the outside replacement CEO’s former company.
--INSERT TABLE 5 ABOUT HERE--
It is important to understand when and how well-connected outside directors add
value. Table 5 shows four combinations of inside director presence and outside directors
connections, (1) LowInside-LowCnct: combination of no non-CEO inside director on
board before departure and low outside director connections (bottom tercile connections).

71
(2) LowInside-HighCnct: combination of no non-CEO inside director on board before
departure and top tercile outside director connections. (3) HighInside-LowCnct:
combination of at least one non-CEO inside director on board before departure and
bottom tercile outside director connections. (4) HighInside-HighCnct: combination of at
least one non-CEO inside director on board before departure and top tercile outside
director connections.
Overall, the results indicate that firms with non-CEO inside director and well-
connected outside directors are more resilient, when faced with sudden CEO departures;
whereas firms with no non-CEO inside directors and poorly connected outside directors
are least resilient. On average, new CEOs appointed by non-CEO inside director and
well-connected outside directors have the highest external board seats (1.20). These
board seats may be a reflection of the new CEO’s quality and reputation. Meanwhile, if
the new CEO is hired from outside the company, they are most likely to be identified
through interlocked directorships with existing directors (30.00%). Overall, firms with at
least one non-CEO inside director seem to be more resilient. On average, they have the
least negative CARs and were able to maintain the highest firm performance around the
departure announcement year.
On the other hand, firms with neither the non-CEO inside director nor well-
connected outside directors suffer the most. Specifically, new permanent CEOs appointed
by the combination non-CEO inside director=0-LowCnct are poorly connected to other
public boards. It takes boards the longest time to appoint a new CEO (136 days), and
these CEOs are the least likely to stay more than 18 months after the replacement
(16.07% new CEO turnover). From the valuation perspective, this combination has the
72
lowest ROA and change in industry-and-performance adjusted ROAs for up to three
years after the departure, which indicates that not only these firms may have higher
transitional costs, the new replacement CEO appointed may also be off worse quality.
The same comparison using a stricter sample of sudden CEO departures are tabulated in
Table 11 in the Appendix, and the results are consistent yet much stronger than using the
broader sample of sudden CEO departures. These results imply that firms may not
weather the storm well if there the incumbent CEO was the only insider on board and the
outside directors are not well connected to other boards. In addition, the roles played by
inside and outside directors in lowering transitional costs are particularly important when
the departure is caused by truly exogenous shocks such as death and illness.
4.5. Multivariate analysis on changes in firm performance around sudden
departures
--INSERT TABLE 6 ABOUT HERE--
Univariate analysis does not control for other factors that could impact the change
in performance. In this section, I extend my analysis to a multivariate setting. I rely on
related prior studies, for instance, Yermack (1996), Naveen (2006), Coles et al. (2008),
and Coles et al. (2012), for guidance in selecting control variables. Out of the 351 firms
in the unexpected CEO departure sample, 69 do not have three consecutive years of
operation after the incumbent CEO departure. They drop out of sample due to
bankruptcy, delisting, and mergers and acquisitions. In order to make sure that I am
comparing the same firms before and after the departure, I only use the 282 firms with at
least three years of ROA after the incumbent CEO’s departure.
73
Table 6 shows the multivariate analysis results on change in firm performance
around the fiscal year of the departure announcement. The dependent variable in columns
(1) to (6) is the change in industry-and-performance-adjusted ROA from one year before
to three years after the fiscal year of departure announcement. I control for whether firms
have at least one non-CEO inside directors, as well as outside director connections, in
addition to other firm and corporate governance variables. The coefficients are estimated
using the Ordinary Least Squares (OLS) with the White robustness error.
Columns (1), (3), and (5) do not include interaction terms, and columns (2), (4),
and (6) include interaction terms between inside director presence and R&D intensity,
between outside director connection and R&D intensity, as well as between inside
director presence and outside director connections. The main finding of this table is that
non-CEO inside directors are only associated with greater change in firm performance
when the departure is unexpected. Their roles after an unexpected CEO departure are
particularly important in R&D intensive firms, in which firm specific knowledge is
important. Specifically, although there is no significant relation between greater inside
director presence alone and change in operating performance, for each additional
percentage increase in R&D intensity, having at least one non-CEO inside director
increases firm performance by 7.50%, and 6.20% two years and three years after the
departure announcement year. This result is consistent with the hypothesis in section 2.3
that non-CEO inside directors are associated with better change in operating
performance, in that the replacement CEOs selected by boards with greater insider
presence may be better quality. It may also indicate that when the sudden CEO departure
74
is forced, firms may be trying to turn around by hiring from outside the company and rely
less on inside directors.
Another interesting result is that outside directors connections are positively
related to change in industry-and-performance adjusted ROAs, which indicates that well-
connected outside directors enhance firm resilience and they play both the identification
and certification roles in the new CEO selection process through their network. Each
additional increase in the connections outside directors possess increases change in
operating performance by 0.50% and 0.60% (p<0.10) two and three years after the
departure announcement. This is consistent with the hypothesis in section 2.5 that well-
connected outside directors may be associated with lower transitional cost around the
sudden CEO departure. Replacement CEOs selected by boards with well-connected
outside directors may also be of better quality.
4.6. Multivariate analysis on the percentage of firms taking a big bath
--INSERT TABLE 7 ABOUT HERE--
Table 7 shows the multivariate analysis on the likelihood of firms taking a big bath
after the CEO departure. I use the same measure as Christensen et al. (2008). The
dependent variables in columns (1)-(6) are binary variables that equals to 1 if firms report
a largely negative special items charge (Compustat annual data item 17) that equals to or
exceeds their total assets over the next three years after a sudden CEO departure. I use
Probit regressions controlling firm, corporate governance, and managerial discretion
characteristics. Columns (1), (3), and (5) are without interaction terms, and (2), (4), and
(6) control for interactions between the cause of the sudden departure and board
composition, as well as between Free Cash Flow (FCF) and board composition.
75
The results show that firms with greater stock price volatility are more likely to
engage in taking a big bath after the sudden CEO departure. Christensen et al. (2008)
argue that if managers have pessimistic private information about the future perspective
of a firm, they are more likely to take a big bath and smooth earnings and try to create
better future returns. Managers in firms with greater risk are already more volatile, and
when faced with a sudden shock of losing their CEO, they may be more likely to engage
in taking a big bath. Similarly, firms with high R&D intensity and greater managerial
discretion over internal capital are more likely to take a big bath after the sudden
departure.
However, firms with at least one non-CEO inside director are less likely to take a
big bath. This is consistent with my earlier findings that inside directors can play
important roles in helping firms weather the storm. They may be more capable of
continue with the ongoing positive NPV project the departure CEO initiated. For
instance, firms with greater inside director presence have economically more positive
change in Capital Expenditure (CAPEX) (untabulated). Therefore firms may have less
incentive to engage in big bath accounting. Furthermore, greater inside director presence
is associated with even lower likelihood of big bath accounting when the CEO departure
is categorized as unexpected. Insider directors’ roles may be particularly important when
the CEO departure is caused by death, illness, and sudden resignation. Section 5 provides
detailed discussion of inside directors’ roles after an unexpected CEO departure.
Firms with greater free cash flow are associated with higher likelihood of big bath
accounting. This relation is even stronger the first year after the departure when FCF
interacts with outside director connection. There are two possible explanations of this
76
stronger relationship. First of all, well connected outside directors may provide access to
external capital for the firm (Coles et al 2012). Therefore managers with greater
discretionary freedom may have greater incentive to engage in big bath accounting to
smooth earnings and create better returns to gain excess to external capital in the near
future. Alternatively, based on the earlier finding that well-connected outside directors
identify qualified outside CEO successors. It is possible that when the outsider becomes
the CEO, he/she demands managers to write off assets. However, it is difficult to
disentangle the two possibilities in the current version of this paper.
In summary, inside directors play important roles in crisis management. They can
either help firms identify qualified inside replacement, or provide stability either as the
new permanent CEO, or as an interim while firms carry out a careful search for a
qualified replacement. They are also associated with lower likelihood of big bath
accounting. In addition, well connected outside directors can also add value by helping
firms both identifying and certifying quality replacement CEOs through their
connections.
5. Additional analysis using a stricter definition of sudden CEO departures
In the previous section, I examined by research questions by using the broader
sudden CEO departures. In this section, I repeat the same analysis by using a stricter
sample of unexpected CEO departure due to death, illness, and sudden resignation. This
sample consists of 119 CEO departures that are genuinely exogenous shocks. When faced
with an unexpected CEO departure, the time for succession planning is next to zero if
firms have no plan in place. Overall, the results are consistent with and much stronger
than those using the broader sample of sudden CEO departures.
77
5.1. Changes in stock and firm performance around unexpected CEO departures
--INSERT TABLE 8 ABOUT HERE--
Comparison of firm and corporate governance characteristics are tabulated in
Table 10 in the Appendix. Firms with greater inside director presence are younger than
their counterpart. The differences in corporate governance characteristics are similar to
the comparison using the broader sample. Table 8 shows the univariate analysis results
for change in stock and firm performance around the announcement of the unexpected
CEO departures. The results are similar to those in the broader sample but statistically are
much stronger. Specifically, investors react negatively at the departure announcements in
both subsamples, indicating that facing unexpected CEO departures, shareholders are
concerned with the future perspective of the company. The differences in CARs are still
statistically insignificant. However, firms with at least one non-CEO inside director are
associated with higher return on assets and change in industry-and-performance-adjusted
ROA two and three years after the incumbent CEO’s departure announcement. The mean
differences are 5.08% and 5.97% (p<0.10) in the second and third year, respectively. This
result indicates that although investors are concerned about the uncertainty created by the
unexpected CEO departures, having non-CEO inside directors may enhance firm reliance
and help them weather the storm better. The positive change in firm performance may
also indicate that firms may have a succession plan in place although the departure
happened unexpectedly. The new CEOs may be able to continue the positive NPV
projects started by the departing CEO.
78
5.2. Multivariate analysis on change in firm performance around unexpected CEO
departure
--INSERT TABLE 9 ABOUT HERE--
Table 9 shows the multivariate analysis results on change in firm performance
around the fiscal year of the unexpected CEO departure announcement. The dependent
variable in columns (1) to (6) is the change in industry-and-performance-adjusted ROA
from one year before to three years after the fiscal year of departure announcement. I use
the same control variables in Table 5. The coefficients are estimated using the Ordinary
Least Squares (OLS) with the White robustness error.
Columns (1), (3), and (5) do not include interaction terms, and columns (2), (4),
and (6) include interaction terms between the cause of departure and inside director
presence, between the cause of departure and outside director connection, and between
inside director presence and R&D intensity. The main finding of this table is that non-
CEO inside directors are associated with greater change in firm performance two and
three years after the departure announcement. Specifically, each additional non-CEO
inside director alone increases change in industry-and-parlance adjusted performance by
7.70% and 9.70% in year 2 and year 3, respectively. This result is consistent with the
earlier findings in Table 5 that the replacement CEOs selected by boards with greater
insider presence may be better quality. In addition, the coefficient on the interaction term
between R&D intensity and non-CEO inside director is positive and significant
throughout the three-year period after the departure announcement. This result indicates
that inside directors play a particularly important role in R&D intensive firms, where firm
specific information is important.
79
Also similar to the results in Table 5, outside directors connections are positively
related to change in industry-and-performance adjusted ROAs, which indicates that well-
connected outside directors enhance firm resilience and they play both the identification
and certification roles in the new CEO selection process through their network. However,
controlling for R&D intensity, each additional increase in the connections outside
directors possess decreases change in operating performance by 13%-20% (p<0.05). This
result may indicate that outside director connection may not be beneficial in R&D
intensive firms after an unexpected CEO departure. These firms may in great need of
inside guidance.
6. Conclusion
I examine the relationship between board composition and organizational
resilience. More specifically, I investigate whether a greater proportion of non-CEO
inside directors and well-connected outside directors improves the firms’ ability to
weather a sudden shift in executive leadership. I find that firms with more non-CEO
inside directors are associated with lower transitional and disruption costs. These
directors possess both superior firm specific information and experience and are thus
better able to either assume the role of CEO or more efficiently identify the replacement
CEO than outside directors. Their roles are particularly important after an unexpected
CEO departure due to death, illness and sudden resignation, as well as in R&D intensive
firms, in which firm specific information is important. In addition, well connected outside
directors appear to enhance the resiliency through their network. In fact, firms with both
non-CEO inside directors and well-connected outside directors appear to be more
resilient to sudden CEO departures than firms with neither directors. These results shed

80
light on the important monitoring and advising roles directors play in crisis management
and organizational resilience when succession planning is not possible.
81
References
Adams, Renée B., Almeida, H, Ferreira, D., 2005, Powerful CEO and their impact on
corporate policies, Review of Financial Studies, 18(4):1403-1432.
Adams, Renée B., and Ferreira, D., 2007, A theory of friendly boards, The Journal of
Finance, 62: 217-250.
Agrawal, A.; C. Knoeber; and T. Tsoulouhas, 2006. Are Outsiders Handicapped in CEO
Successions? Journal of Corporate Finance.
Barber B.M., Lyon, J.D., 1996, Detecting abnormal performance. The empirical power
and specification of test statistics. Journal of Financial Economics 41, 359-399.
Bacon, J., Brown.J, 1974, Corporate directorship practices: role, selection, and legal
status of the board, a joint research report from the Conference Board and the
American Society of Corporate Secretaries, Inc. (New York, NY).
Baranchuk, N., Dybvig, Philip H., 2009, Consensus in diverse corporate boards, Review
of Financial Studies, 22: 715 – 747.
Bruce K. Behn, David D. Dawley, Richard Riley and Ya-wen Yang, 2005, The value of
an heir apparent in succession planning. Corporate Governance 13:168-177.
Bruce K. Behn , David D. Dawley , Richard Riley and Ya-wen Yang, 2006, Deaths of
CEOs: are delays in naming successors and insider/outsider succession associated
with subsequent firm performance? Journal of Managerial Issues. 18:32-46.
Booth, James R., Deli, Daniel N., 1996, Factors affecting the number of outside
directorships held by CEOs, Journal of Financial Economics 40: 81-104.
Booth, James R., Deli, Daniel N., 1999, On executives of financial institutions as outside
directors, Journal of Corporate Finance, 5:227-250.
Borokhovich, K., R. Parrino, T. Trapani, 1996, Outside Directors and CEO Selection.
Journal of Financial and Quantitative Analysis, 31 (1996), 337–355.
Brickley, J.; J. Coles; and G. Jarrell, 1997, Leadership Structure: Separating the CEO and
Chairman of the Board.” Journal of Corporate Finance, 3 (1997), 189–220.
Brickley, James, Linck, James, S., Coles, Jeffrey L., 1998, What happens to CEOs after
they retire? New evidence on career concerns, horizon problems, and CEO
incentives. Journal of Financial Economics 52:341–77.
Brickley, James, 2003, Empirical research on CEO turnover and firm-performance: a
discussion. Journal of Accounting and Economics 36:227-233.
Byrne, John, William A., Symonds, C., Siler, Julia F., 1991, CEO disease: Egoism can
breed corporate disaster, and the malady is spreading, Business Week, April 1,
52-60.
Cannella, A., Jr., and M. Lubatkin, 1993, Succession as a sociopolitical process: Internal
impediments to outsider selection, Academy of Management Journal, 36: 763-
793.
Christensen Theodore E., G. Paik, E. Stice, 2008, Creating a bigger bath using deferred
tax valuation allowance, Journal of Business Finance and Accounting, 35: 601-
625.
Coles, Jeffrey L. Daniel, Naveen D. Naveen, Lalitha, 2008, Boards: does one size fit all?
Journal of Financial Economics, 82: 329-356.
Cowling, M., 2007, Small firm CEOs and outside directorships: Tenure, demonstration
and synergy effect, working paper.
82
Dahya, Jay, McConnell, John J., 2005, Outside directors and corporate board decisions,
Journal of Corporate Finance 11: 37-60.
Davis, G. 1996, The significance of board interlocks for corporate governance, Corporate
Governance, Vol. 4, Issue 3, 154-159.
Davis, Sandra, D. Nosal, 2009, Smart planning for CEO succession, the Corporate Board.
De Long, J.B. 1991, Did J.P. Morgan’s men add value? An Economist’s perspective on
financial capitalism, In Inside the business enterprise: Historical perspectives on
the use of information, ed. Peter Temin. National Bureau of Economic Research
conference report, Chicago: University of Chicago Press.
Duchin R., J. G. Matsusaka, and O. Ozbas, 2010, When are outside directors effective?
Journal of Financial Economics 96, 195-214.
Denis, David and D. Denis, 1995, Performance changes following top management
dismissals, Journal of Finance 50, 1029 – 1057.
Fahlencrach, Rudiger, Low, Angie and Stulz, Rene, 2010, Why do firms appoint CEOs as
outside directors? Journal of Financial Economics, 97 (2010) 12–32.
Fahlencrach, Rudiger, B. Minton, C. Pan, 2010, Former CEO directors: lingering CEOs
or valuable resources? Working paper.
Fama, Eugene F.,1980, Agency problem and the theory of the firm. Journal of Political
Economy, 88:288-307.
Fama, Eugene F. and Jensen, Michael C., 1983, Separation of ownership and control,
Journal of Law and Economics, 26, 301-325.
Ferris, Stephen P, Jagannathan, M., Pritchard, A.C., 2003, Too busy to mind the
business? Monitoring by directors with multiple board appointments. The Journal
of Finance, 58:1087-1112.
Ferris, Stephen P, Jagannathan, M., 2001, The incidence and determinants of multiple
corporate directorships, Applied Economics Letters, 8: 1, 31-35.
Farrell, Kathleen A, Whidbee D., 2003, Impact of firm performance expectations n CEO
turnover and replacement decisions, Journal of Accounting and Economics,
36:165-196.
Fich, Eliezer M. 2005, Are some outside director better than others? Evidence from
Director Appointments by Fortune 1000 Firms, The Journal of Business, Vol. 78,
No. 5.
Fich, E.M., and A. Shivdasani. 2006. Are Busy Boards Effective Monitors? The Journal
of Finance 61:689–724.
Gilson, Stuart, 1990, Bankruptcy, boards, banks, and blockholders, Journal of Financial
Economics, 27, 355-387.
Guner, A. Burak, Malmendier, U., Tate, Geoffrey, 2008, Financial expertise of directors,
Journal of Financial Economics, 88:323-354.
Harris, M., Raviv, A., 2008, A theory of board control and size, Review of Financial
Studies, 21(4):1797-183.
Hermalin, B.E. and M. S. Weisbach, 2003, Endogenously chosen boards of directors and
their monitoring of the CEO, American Economic Review 88, 96-118.
Huson M., Malatesta, P., and Parrino, R., 2004, Managerial succession and firm
performance Journal of Financial Economics Vol. 74, 237-275.
Hwang, B. and S. Kim, July 2009, “It pays to have friends,” Journal of Financial
Economics 93, 138-158.
83
Jensen, Michael C, Meckling, William H., 1976, Theory of the Firm: Managerial
Behavior, Agency Costs and Ownership Structure Journal of Financial
Economics, 3:305-360.
Lee, S., Persson, P., 2010, Authority versus loyalty: social incentives and modes of
governance, working paper, 2010 WFA Conference.
Linck, J. S., J. M. Netter, and T. Yang, 2009, “The Effects and Unintended Consequences
of the Sarbanes-Oxley Act on the Supply and Demand for Directors,” Review of
Financial Studies 22: 3297-3323.
Lorsch, J., E. MacIver. 1989. Pawns or potentates: The reality of America’s corporate
boards. Boston: Harvard Business School Press.
Mace, M. 1986. Directors: Myth and reality. Boston: Harvard Business School Press.
Malmendier, Ulrike and Tate, Geoffrey, 2005, Superstar CEOs, working paper.
Masulis, R,. Shawn M, 2009, Are all inside directors the same? Evidence from external
directorship market, the Journal of Finance, 66:823-872.
Mian, Shehzad, 2001, On the choice and replacement of CFOs, Journal of Financial
Economics 60: 143-175.
Mobbs, S., 2012, CEOs Under Fire: Pressure From Within–The Effects of Inside
Directors on CEO Compensation and Turnover, Journal of Financial and
Quantitative Analysis, forthcoming.
Moehrle, S. 2002, Do Firms Use Restructuring Charge Reversals to Meet Earnings
Targets? The Accounting Review, 77: 397–414.
Omer, T.C., Marjorie, S., Frances, T., Do well-connected directors improve firm
performance?, 2012 SSRN working paper.
Parrino, R., 1997, CEO Turnover and Outside Succession: A Cross-Sectional Analysis,
Journal of Financial Economics, 46: 165–197.
Parrino, Robert, R. Sias, and L. Starks, 2003, Voting with their feet: institutional
ownership changes around forced CEO turnover, Journal of Financial Economics
68, 3-46.
Perry, T., Peyer, U. 2005, Board seat accumulation by executives: A shareholder’s
perspective, The Journal of Finance, 60, 2083-2123.
Raheja, C., 2005, Determinants of board size and composition: A theory of corporate
boards, Journal of Financial and Quantitative Analysis, 40: 283-306.
Rivolta, M.L., 2014, Does lead time in CEO succession planning matter? Working paper.
Rosenstein, Stuart, Wyatt, Jeffrey G., 1990, Outside directors, board independence, and
shareholder wealth, Journal of Financial Economics, 26:175-191.
Ryan Jr., Harley E., Wiggins III, Roy A., 2004, Who is in whose pocket? Director
compensation, board independence, and barriers to effective monitoring, Journal
of Financial Economics 73: 497-424.
Salas, J.M., 2010, Entrenchment, governance and the stock price reaction to sudden
executive deaths, Journal of Business and Finance 34, 656-666.
Shen, Wei, A.A. Cannella, Jr, 2002, Revisiting the performance consequences of CEO
succession: the impacts of successor type, post succession senior executive
turnover, and departing CEO tenure, The Academy of Management Journal, Vol.
45, No. 4, pp. 717-733
Shivdasani, A., and D., Yermack, 1999, “CEO Involvement in the Selection of New
Board Members: An Empirical Analysis,” Journal of Finance 54, 1829-1853.
84
Weisbach, M. 1988. Outside directors and CEO turnover, Journal of Financial
Economics 20:431–60
Worrell, D.L., Davidson III, W.N., Chandy, P.R., Garrison, S.L., 1986, Management
turnover through deaths of key executives: effects on investor wealth, Academy
of Management 29, 674-694.
Yeo, Hee-Jung, Pochet, C., Alcouffe, A., 2003, CEO reciprocal interlocks in French
corporations, Journal of Management and Governance 7: 87–108.
Zhang, Yan and N. Rajagopalan, 2004, When the known devil is better than an unknown
god: an empirical study of the antecedents and consequences of relay CEO
successions, Academy of Management, Vol. 47, No. 4, 483–500.
Zhang, Yan and N. Rajagopalan, 2010, CEO succession planning: Finally at the center
stage of the boardroom, Business Horizons 53: 455-462.
85
Appendix B1
Variable definitions
Blockholder is a binary variable that equals to 1 if there is at least one blockholder in the
sample firm, and 0 otherwise. Blockholder and institutional ownership information are
obtained from Thomson Financial database.
Change in Indperf_adj ROA is the change in industry-and-performance-adjusted ROAs
from one year up to three years after the incumbent CEO departure.
Current employee is a binary variable that equals to 1 if the replacement CEO has been
with the hiring company for at least 2 years prior to the departure, and 0 if the they are
hired from outside (this is a result not summary stats).
Current director is an indicator variable that equals to 1 if the replacement CEO has been
a director in the firm for at least 6 months, and 0 otherwise.
Current employee director is an indicator variable that equals to 1 if the replacement
CEO has been an insider/employee in the firm for at least 2 years and as a director in the
firm for at least 6 months, and 0 otherwise.
Departing CEO founder is a binary variable that equals to 1 if the departing CEO was
the founder, and 0 otherwise.
Firm age is the maximum number of years between CRSP listing age and Compustat
listing age.
Firm riskt-1 is the standard deviation of daily stock price during the prior calendar year.
Industry-adjusted ROAt-1 is measured as a sample firm’s ROA minus the median
industry ROA, using the Fama and French (1997) 48-industry classification.
Industry-and-performance-adjusted ROAt-1 is defined as each sample firm’s ROA less
the ROA of a non sample firm, matched on primary two-digit SIC industry and with the
ROA within 10% in the previous year. If no firm in the same two-digit industry has a
year-1 ROA within 10%, I first select the firm in the same one- digit industry, and then
disregard industry and only match on year-1 ROA within 10%.
Market value of equity (mkcap) is calculated using end of the year closing price of
equity to multiply common stock shares outstanding.
Market to book is the market to book ratio of equity.
New CEO Age is obtained from Execucomp as of the year of CEO departure.
New CEO # of external board seats is the total number of other public board connections
the new CEO possesses.
Outside CEO same board is a binary variable that equals to 1 if the new CEO is hired
from outside, and has been sitting on the same board with at least one existing director in
the turnover firm, and 0 otherwise.
Outside director connections is calculated as the sum of other public board seats held by
outside directors in the sample firm.
Post year 2001 is a binary variable that equals to 1 if the year of departure is after 2001, 0
otherwise.
Percentage of insider directors and Number of inside directors are the percentage and
number of inside directors on board.
R&D intensity is defined as research and development expenditure to sales. I calculate
R&D intensity by taking the maximum value of 0, or R&D expense from Compustat,
whichever is larger, and then divide it by sales.
86
ROA is the operating earnings before interest and taxes (OIBDP) over total book assets
(AT).
Total # of inside directors is the total number of inside directors on board.
# of days without leadership is the number of days between the departure announcement
of the incumbent CEO and the appointment of either an interim or permanent
replacement.
# Days w/o permanent CEO is the number of days between the departure announcement
of the incumbent CEO and the appointment of a permanent replacement CEO.
% of director departurest+n is the percentage of existing director turnover rate up to three
years after the CEO departure.
% of firms taking a big bath is the percentage of firms reporting large negative special
item charges (Compustat annual data item 17) that equals to or exceeds 10% of their otal
assets.
% of interim appointment is the percentage of sample firms that appointed an interim
CEO before appointing a permanent CEO.
% of permanent replacement CEO turnover within 18mons is percentage of firms for
which the new CEO left the company within 18 months after being hired.
% of senior management turnover within 18mons is the percentage of senior
management (president, CFO, and COO) that left the company 18 months after the
departures.
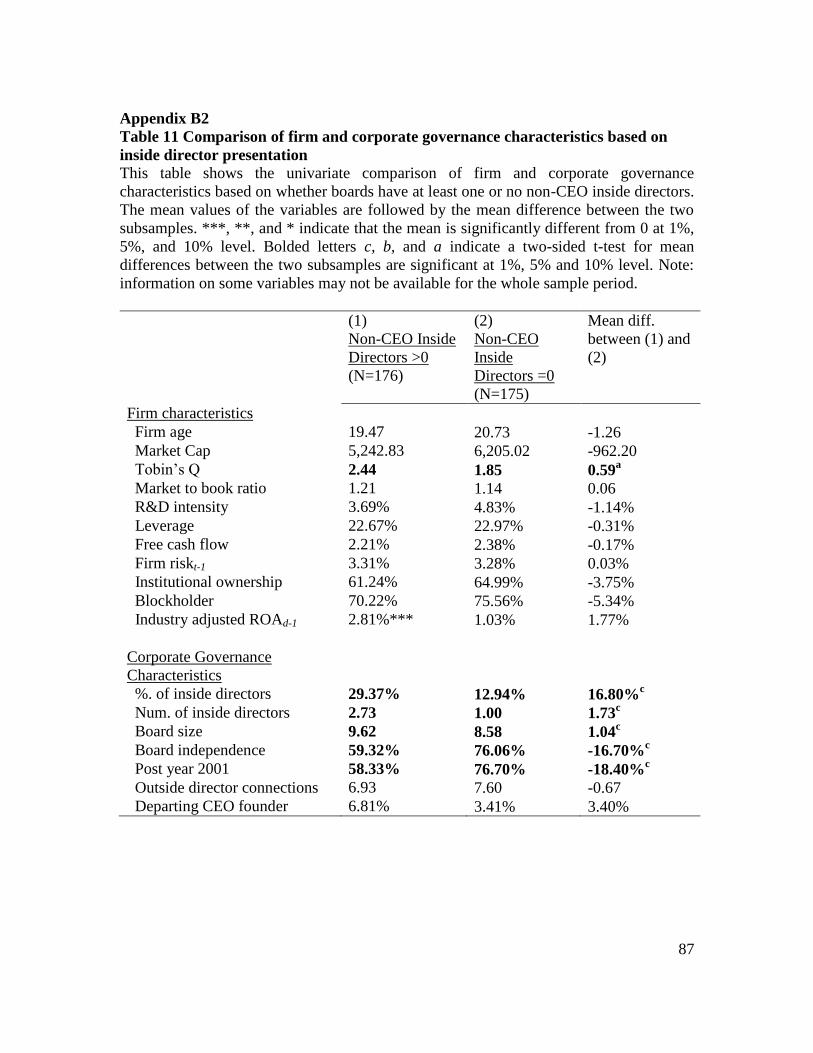
87
Appendix B2
Table 11 Comparison of firm and corporate governance characteristics based on
inside director presentation
This table shows the univariate comparison of firm and corporate governance
characteristics based on whether boards have at least one or no non-CEO inside directors.
The mean values of the variables are followed by the mean difference between the two
subsamples. ***, **, and * indicate that the mean is significantly different from 0 at 1%,
5%, and 10% level. Bolded letters c, b, and a indicate a two-sided t-test for mean
differences between the two subsamples are significant at 1%, 5% and 10% level. Note:
information on some variables may not be available for the whole sample period.
(1)
Non-CEO Inside
Directors >0
(N=176)
(2)
Non-CEO
Inside
Directors =0
(N=175)
Mean diff.
between (1) and
(2)
Firm characteristics
Firm age 19.47 20.73 -1.26
Market Cap 5,242.83 6,205.02 -962.20
Tobin’s Q 2.44 1.85 0.59a
Market to book ratio 1.21 1.14 0.06
R&D intensity 3.69% 4.83% -1.14%
Leverage 22.67% 22.97% -0.31%
Free cash flow 2.21% 2.38% -0.17%
Firm riskt-1 3.31% 3.28% 0.03%
Institutional ownership 61.24% 64.99% -3.75%
Blockholder 70.22% 75.56% -5.34%
Industry adjusted ROAd-1 2.81%*** 1.03% 1.77%
Corporate Governance
Characteristics
%. of inside directors 29.37% 12.94% 16.80%c
Num. of inside directors 2.73 1.00 1.73c
Board size 9.62 8.58 1.04c
Board independence 59.32% 76.06% -16.70%c
Post year 2001 58.33% 76.70% -18.40%c
Outside director connections 6.93 7.60 -0.67
Departing CEO founder 6.81% 3.41% 3.40%
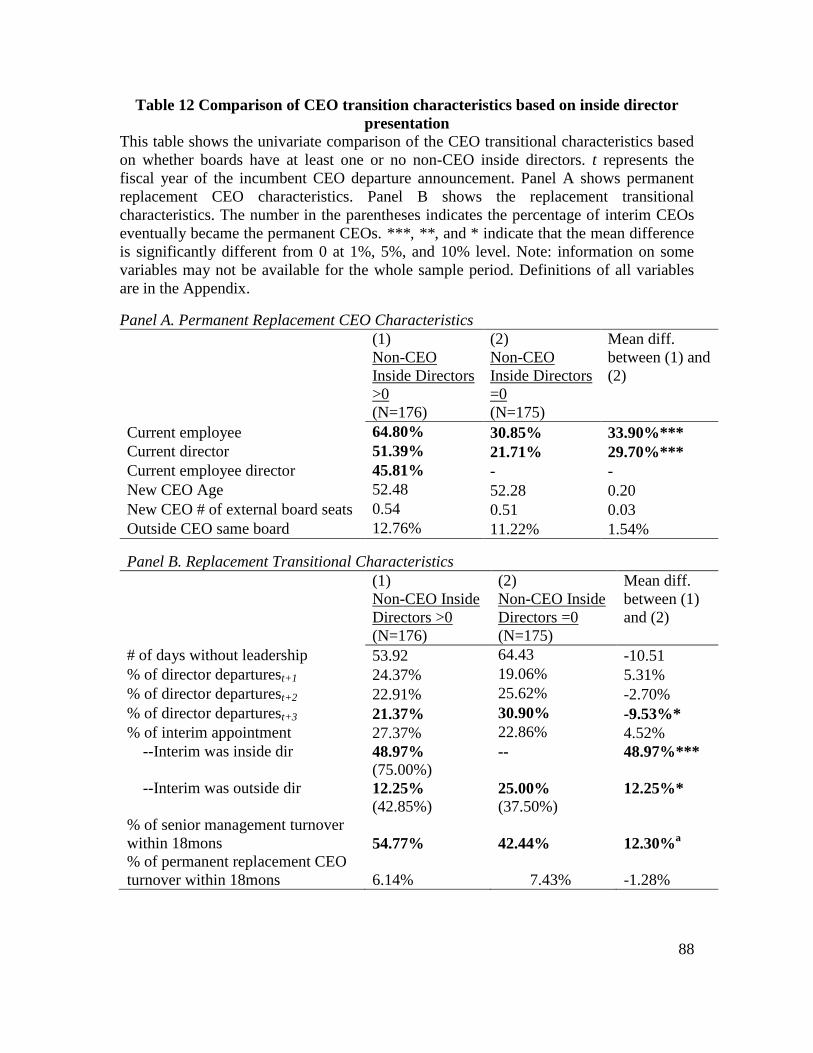
88
Table 12 Comparison of CEO transition characteristics based on inside director
presentation
This table shows the univariate comparison of the CEO transitional characteristics based
on whether boards have at least one or no non-CEO inside directors. t represents the
fiscal year of the incumbent CEO departure announcement. Panel A shows permanent
replacement CEO characteristics. Panel B shows the replacement transitional
characteristics. The number in the parentheses indicates the percentage of interim CEOs
eventually became the permanent CEOs. ***, **, and * indicate that the mean difference
is significantly different from 0 at 1%, 5%, and 10% level. Note: information on some
variables may not be available for the whole sample period. Definitions of all variables
are in the Appendix.
Panel A. Permanent Replacement CEO Characteristics
(1)
Non-CEO
Inside Directors
>0
(N=176)
(2)
Non-CEO
Inside Directors
=0
(N=175)
Mean diff.
between (1) and
(2)
Current employee 64.80% 30.85%
33.90%***
Current director 51.39% 21.71%
29.70%***
Current employee director 45.81% -
-
New CEO Age 52.48 52.28 0.20
New CEO # of external board seats 0.54 0.51 0.03
Outside CEO same board 12.76% 11.22% 1.54%
Panel B. Replacement Transitional Characteristics
(1)
Non-CEO Inside
Directors >0
(N=176)
(2)
Non-CEO Inside
Directors =0
(N=175)
Mean diff.
between (1)
and (2)
# of days without leadership 53.92 64.43 -10.51
% of director departurest+1 24.37% 19.06% 5.31%
% of director departurest+2 22.91% 25.62% -2.70%
% of director departurest+3 21.37% 30.90% -9.53%*
% of interim appointment 27.37% 22.86%
4.52%
--Interim was inside dir
48.97%
(75.00%) --
48.97%***
--Interim was outside dir
12.25%
(42.85%) 25.00%
(37.50%)
12.25%*
% of senior management turnover
within 18mons 54.77%
42.44% 12.30%a
% of permanent replacement CEO
turnover within 18mons 6.14%
7.43% -1.28%
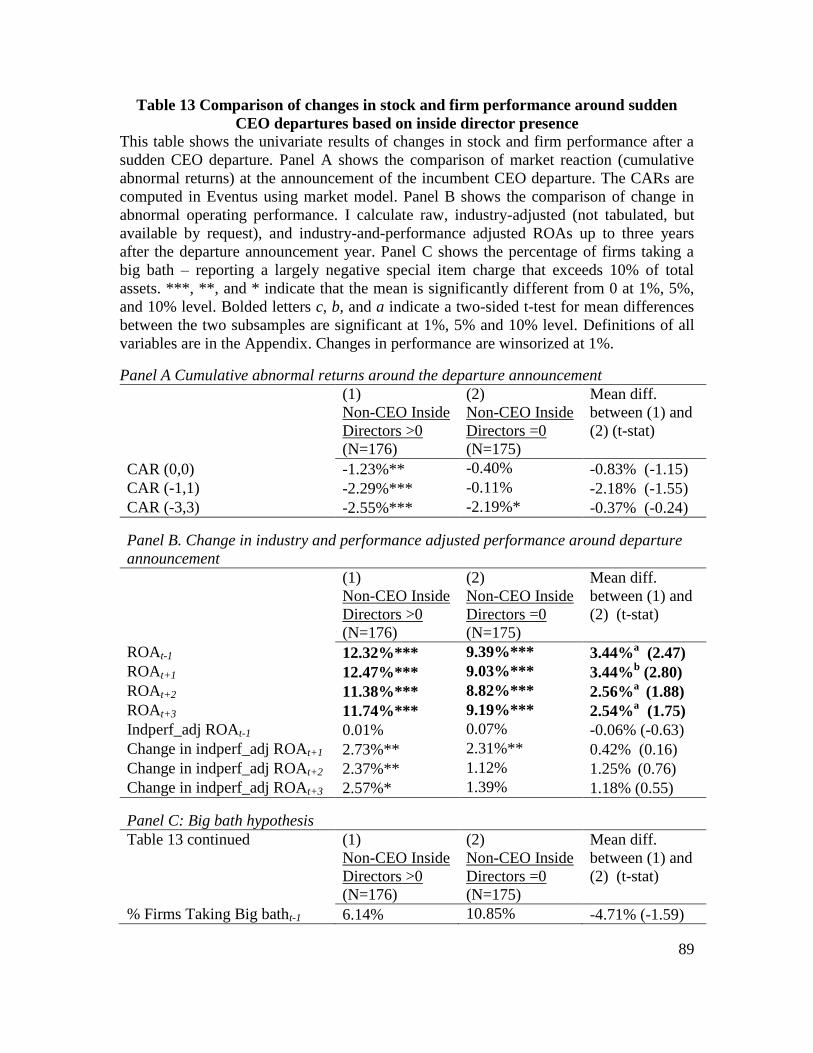
89
Table 13 Comparison of changes in stock and firm performance around sudden
CEO departures based on inside director presence
This table shows the univariate results of changes in stock and firm performance after a
sudden CEO departure. Panel A shows the comparison of market reaction (cumulative
abnormal returns) at the announcement of the incumbent CEO departure. The CARs are
computed in Eventus using market model. Panel B shows the comparison of change in
abnormal operating performance. I calculate raw, industry-adjusted (not tabulated, but
available by request), and industry-and-performance adjusted ROAs up to three years
after the departure announcement year. Panel C shows the percentage of firms taking a
big bath – reporting a largely negative special item charge that exceeds 10% of total
assets. ***, **, and * indicate that the mean is significantly different from 0 at 1%, 5%,
and 10% level. Bolded letters c, b, and a indicate a two-sided t-test for mean differences
between the two subsamples are significant at 1%, 5% and 10% level. Definitions of all
variables are in the Appendix. Changes in performance are winsorized at 1%.
Panel A Cumulative abnormal returns around the departure announcement
(1)
Non-CEO Inside
Directors >0
(N=176)
(2)
Non-CEO Inside
Directors =0
(N=175)
Mean diff.
between (1) and
(2) (t-stat)
CAR (0,0) -1.23%** -0.40%
-0.83% (-1.15)
CAR (-1,1) -2.29%*** -0.11%
-2.18% (-1.55)
CAR (-3,3) -2.55%*** -2.19%*
-0.37% (-0.24)
Panel B. Change in industry and performance adjusted performance around departure
announcement
(1)
Non-CEO Inside
Directors >0
(N=176)
(2)
Non-CEO Inside
Directors =0
(N=175)
Mean diff.
between (1) and
(2) (t-stat)
ROAt-1 12.32%*** 9.39%*** 3.44%a (2.47)
ROAt+1 12.47%*** 9.03%*** 3.44%b (2.80)
ROAt+2 11.38%*** 8.82%***
2.56%
a (1.88)
ROAt+3 11.74%*** 9.19%***
2.54%
a (1.75)
Indperf_adj ROAt-1 0.01% 0.07%
-0.06% (-0.63)
Change in indperf_adj ROAt+1 2.73%** 2.31%** 0.42% (0.16)
Change in indperf_adj ROAt+2 2.37%** 1.12%
1.25%
(0.76)
Change in indperf_adj ROAt+3 2.57%* 1.39%
1.18% (0.55)
Panel C: Big bath hypothesis
Table 13 continued (1)
Non-CEO Inside
Directors >0
(N=176)
(2)
Non-CEO Inside
Directors =0
(N=175)
Mean diff.
between (1) and
(2) (t-stat)
% Firms Taking Big batht-1 6.14% 10.85% -4.71% (-1.59)
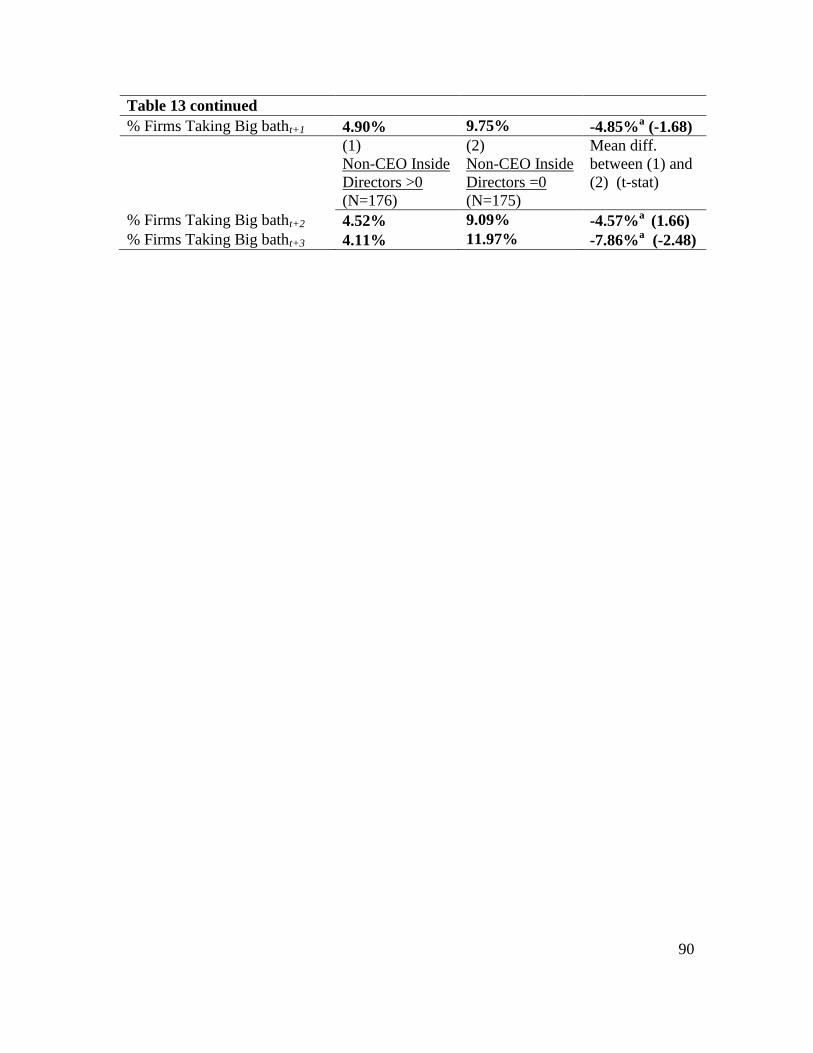
90
Table 13 continued
% Firms Taking Big batht+1 4.90% 9.75% -4.85%a (-1.68)
(1)
Non-CEO Inside
Directors >0
(N=176)
(2)
Non-CEO Inside
Directors =0
(N=175)
Mean diff.
between (1) and
(2) (t-stat)
% Firms Taking Big batht+2 4.52% 9.09%
-4.57%
a (1.66)
% Firms Taking Big batht+3 4.11% 11.97%
-7.86%
a (-2.48)
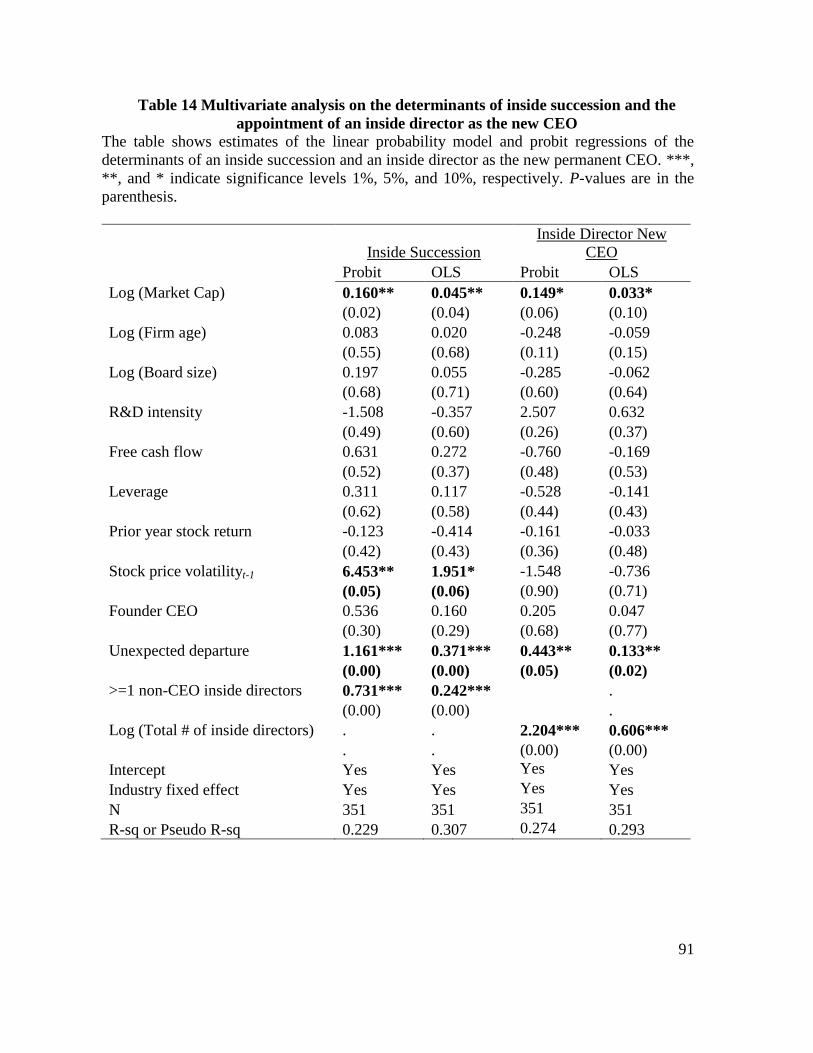
91
Table 14 Multivariate analysis on the determinants of inside succession and the
appointment of an inside director as the new CEO
The table shows estimates of the linear probability model and probit regressions of the
determinants of an inside succession and an inside director as the new permanent CEO. ***,
**, and * indicate significance levels 1%, 5%, and 10%, respectively. P-values are in the
parenthesis.
Inside Succession
Inside Director New
CEO
Probit OLS Probit OLS
Log (Market Cap) 0.160** 0.045** 0.149* 0.033*
(0.02) (0.04) (0.06) (0.10)
Log (Firm age) 0.083 0.020 -0.248 -0.059
(0.55) (0.68) (0.11) (0.15)
Log (Board size) 0.197 0.055 -0.285 -0.062
(0.68) (0.71) (0.60) (0.64)
R&D intensity -1.508 -0.357 2.507 0.632
(0.49) (0.60) (0.26) (0.37)
Free cash flow 0.631 0.272 -0.760 -0.169
(0.52) (0.37) (0.48) (0.53)
Leverage 0.311 0.117 -0.528 -0.141
(0.62) (0.58) (0.44) (0.43)
Prior year stock return -0.123 -0.414 -0.161 -0.033
(0.42) (0.43) (0.36) (0.48)
Stock price volatilityt-1 6.453** 1.951* -1.548 -0.736
(0.05) (0.06) (0.90) (0.71)
Founder CEO 0.536 0.160 0.205 0.047
(0.30) (0.29) (0.68) (0.77)
Unexpected departure 1.161*** 0.371*** 0.443** 0.133**
(0.00) (0.00) (0.05) (0.02)
>=1 non-CEO inside directors 0.731*** 0.242*** .
(0.00) (0.00) .
Log (Total # of inside directors) . . 2.204*** 0.606***
. . (0.00) (0.00)
Intercept Yes Yes Yes Yes
Industry fixed effect Yes Yes Yes Yes
N 351 351 351 351
R-sq or Pseudo R-sq 0.229 0.307 0.274 0.293
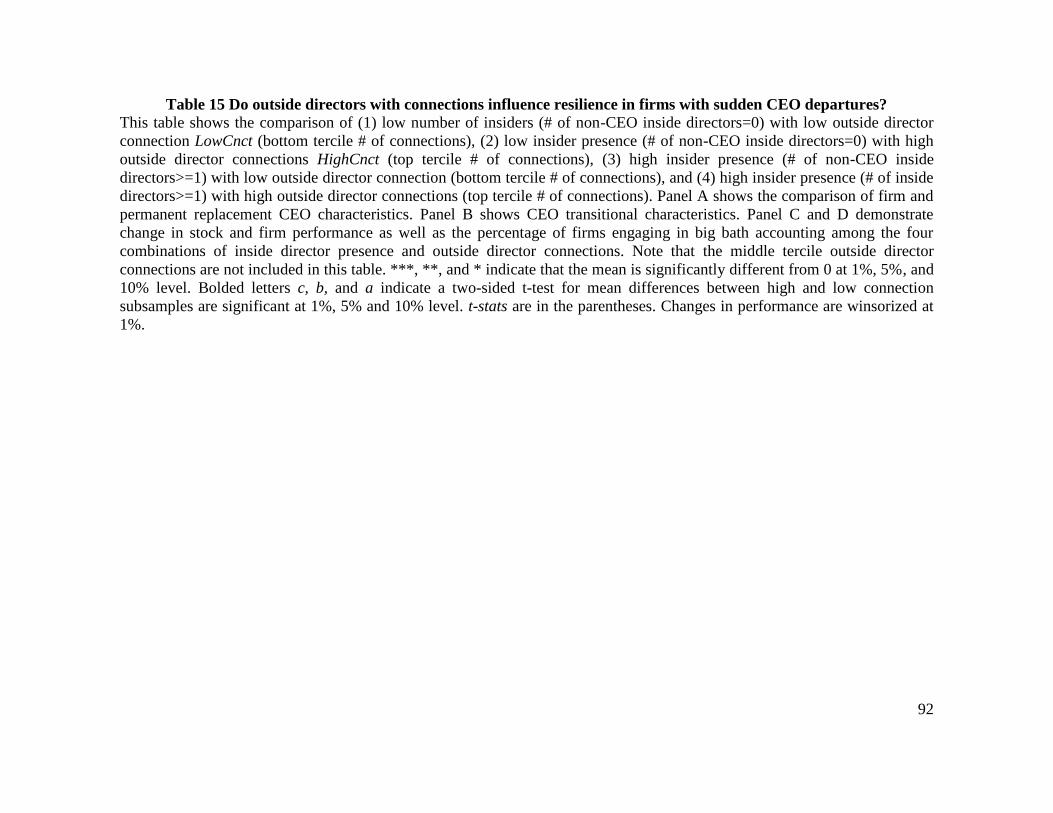
92
Table 15 Do outside directors with connections influence resilience in firms with sudden CEO departures?
This table shows the comparison of (1) low number of insiders (# of non-CEO inside directors=0) with low outside director
connection LowCnct (bottom tercile # of connections), (2) low insider presence (# of non-CEO inside directors=0) with high
outside director connections HighCnct (top tercile # of connections), (3) high insider presence (# of non-CEO inside
directors>=1) with low outside director connection (bottom tercile # of connections), and (4) high insider presence (# of inside
directors>=1) with high outside director connections (top tercile # of connections). Panel A shows the comparison of firm and
permanent replacement CEO characteristics. Panel B shows CEO transitional characteristics. Panel C and D demonstrate
change in stock and firm performance as well as the percentage of firms engaging in big bath accounting among the four
combinations of inside director presence and outside director connections. Note that the middle tercile outside director
connections are not included in this table. ***, **, and * indicate that the mean is significantly different from 0 at 1%, 5%, and
10% level. Bolded letters c, b, and a indicate a two-sided t-test for mean differences between high and low connection
subsamples are significant at 1%, 5% and 10% level. t-stats are in the parentheses. Changes in performance are winsorized at
1%.
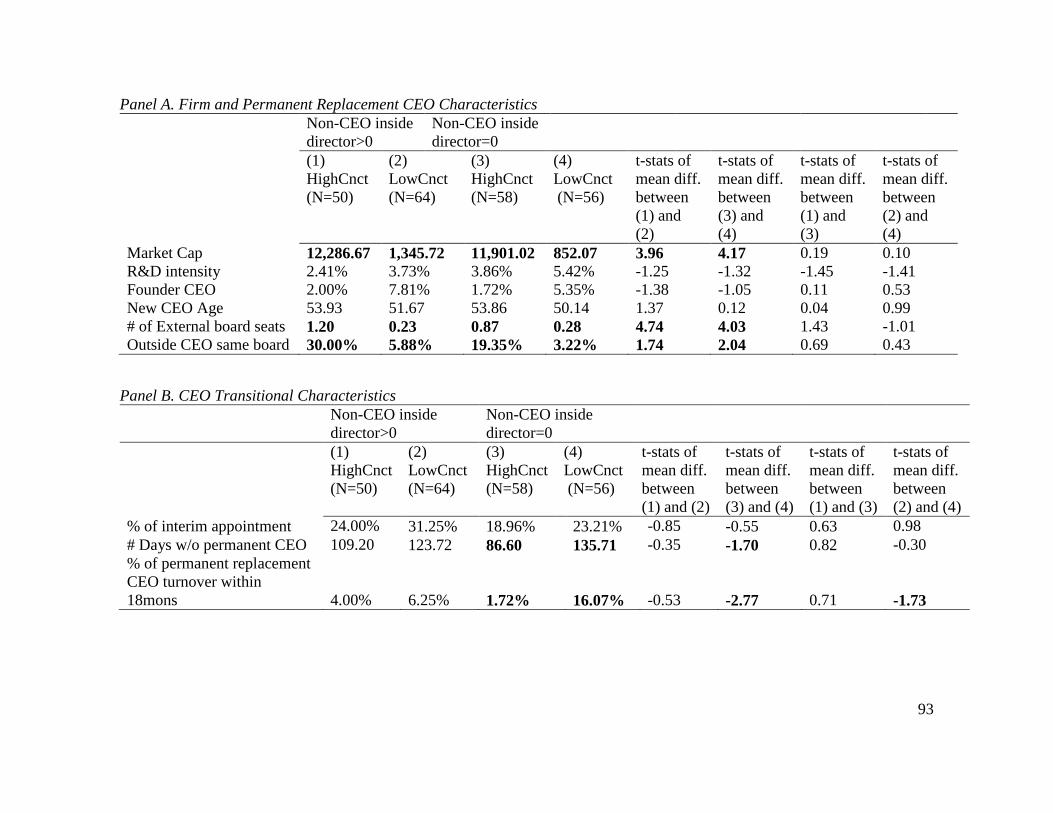
93
Panel A. Firm and Permanent Replacement CEO Characteristics
Non-CEO inside
director>0
Non-CEO inside
director=0
(1)
HighCnct
(N=50)
(2)
LowCnct
(N=64)
(3)
HighCnct
(N=58)
(4)
LowCnct
(N=56)
t-stats of
mean diff.
between
(1) and
(2)
t-stats of
mean diff.
between
(3) and
(4)
t-stats of
mean diff.
between
(1) and
(3)
t-stats of
mean diff.
between
(2) and
(4)
Market Cap 12,286.67 1,345.72 11,901.02
852.07 3.96 4.17 0.19 0.10
R&D intensity 2.41% 3.73% 3.86% 5.42% -1.25 -1.32 -1.45 -1.41
Founder CEO 2.00% 7.81% 1.72% 5.35% -1.38 -1.05 0.11 0.53
New CEO Age 53.93 51.67 53.86 50.14 1.37 0.12 0.04 0.99
# of External board seats 1.20 0.23 0.87 0.28 4.74 4.03 1.43 -1.01
Outside CEO same board 30.00% 5.88% 19.35% 3.22% 1.74 2.04 0.69 0.43
Panel B. CEO Transitional Characteristics
Non-CEO inside
director>0
Non-CEO inside
director=0
(1)
HighCnct
(N=50)
(2)
LowCnct
(N=64)
(3)
HighCnct
(N=58)
(4)
LowCnct
(N=56)
t-stats of
mean diff.
between
(1) and (2)
t-stats of
mean diff.
between
(3) and (4)
t-stats of
mean diff.
between
(1) and (3)
t-stats of
mean diff.
between
(2) and (4)
% of interim appointment 24.00% 31.25% 18.96% 23.21% -0.85 -0.55 0.63 0.98
# Days w/o permanent CEO 109.20 123.72 86.60
135.71 -0.35 -1.70 0.82 -0.30
% of permanent replacement
CEO turnover within
18mons
4.00% 6.25% 1.72%
16.07%
-0.53 -2.77 0.71
-1.73
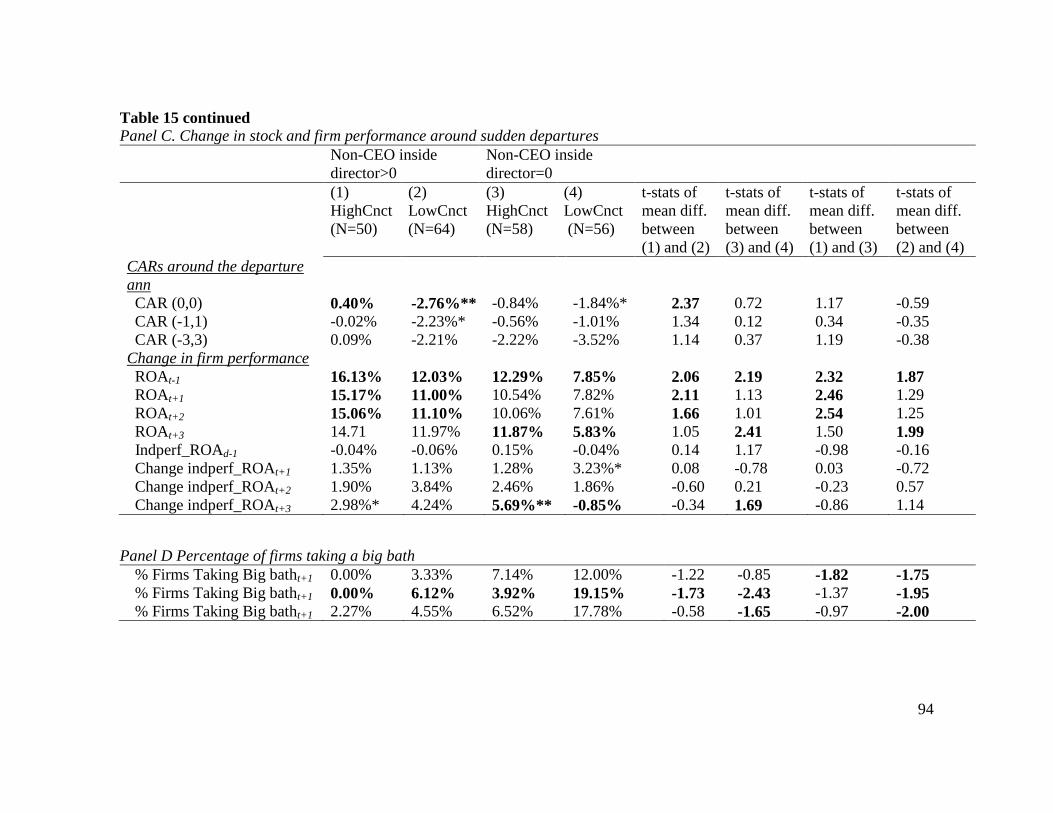
94
Table 15 continued Panel C. Change in stock and firm performance around sudden departures
Non-CEO inside
director>0
Non-CEO inside
director=0
(1)
HighCnct
(N=50)
(2)
LowCnct
(N=64)
(3)
HighCnct
(N=58)
(4)
LowCnct
(N=56)
t-stats of
mean diff.
between
(1) and (2)
t-stats of
mean diff.
between
(3) and (4)
t-stats of
mean diff.
between
(1) and (3)
t-stats of
mean diff.
between
(2) and (4)
CARs around the departure
ann
CAR (0,0) 0.40% -2.76%** -0.84% -1.84%* 2.37 0.72 1.17 -0.59
CAR (-1,1) -0.02% -2.23%* -0.56% -1.01% 1.34 0.12 0.34 -0.35
CAR (-3,3) 0.09% -2.21% -2.22% -3.52% 1.14 0.37 1.19 -0.38
Change in firm performance
ROAt-1 16.13% 12.03% 12.29% 7.85% 2.06 2.19 2.32 1.87
ROAt+1 15.17% 11.00% 10.54% 7.82% 2.11 1.13 2.46 1.29
ROAt+2 15.06% 11.10% 10.06% 7.61% 1.66 1.01 2.54 1.25
ROAt+3 14.71 11.97% 11.87% 5.83% 1.05 2.41 1.50 1.99
Indperf_ROAd-1 -0.04% -0.06% 0.15% -0.04% 0.14 1.17 -0.98 -0.16
Change indperf_ROAt+1 1.35% 1.13% 1.28% 3.23%* 0.08 -0.78 0.03 -0.72
Change indperf_ROAt+2 1.90% 3.84% 2.46% 1.86% -0.60 0.21 -0.23 0.57
Change indperf_ROAt+3 2.98%* 4.24% 5.69%** -0.85% -0.34 1.69 -0.86 1.14
Panel D Percentage of firms taking a big bath
% Firms Taking Big batht+1 0.00% 3.33% 7.14% 12.00% -1.22 -0.85 -1.82 -1.75
% Firms Taking Big batht+1 0.00% 6.12% 3.92% 19.15% -1.73 -2.43 -1.37 -1.95
% Firms Taking Big batht+1 2.27% 4.55% 6.52% 17.78% -0.58 -1.65 -0.97 -2.00
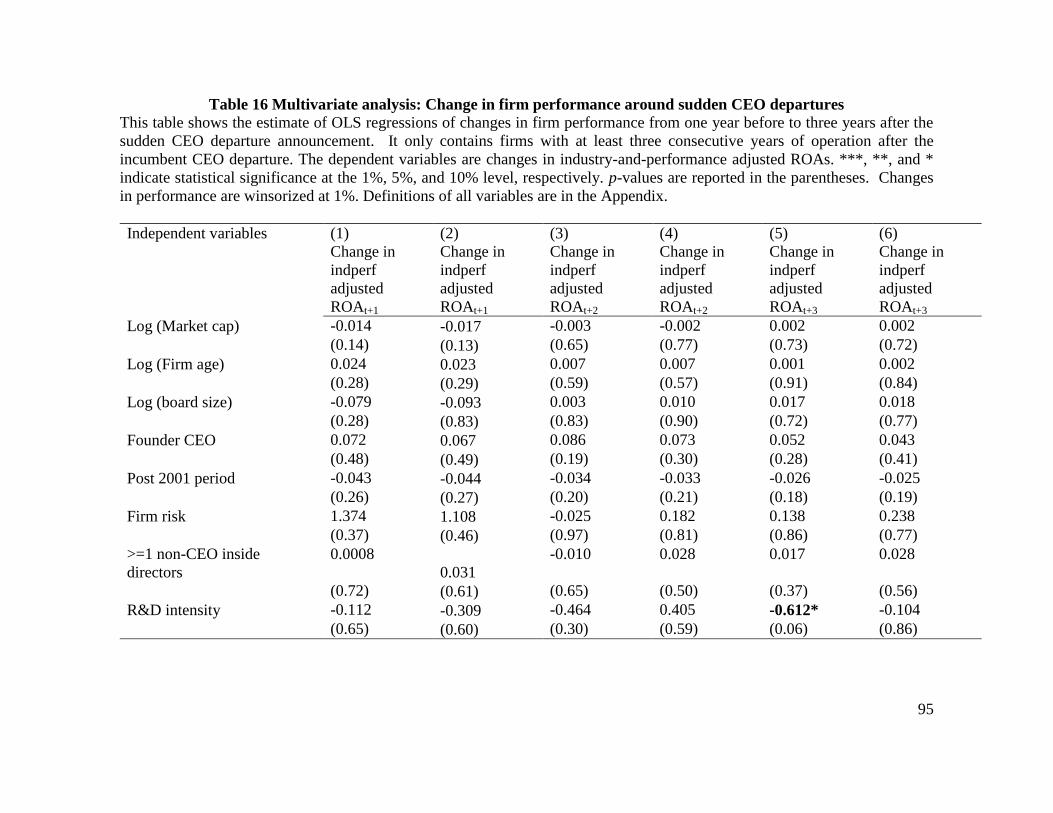
95
Table 16 Multivariate analysis: Change in firm performance around sudden CEO departures
This table shows the estimate of OLS regressions of changes in firm performance from one year before to three years after the
sudden CEO departure announcement. It only contains firms with at least three consecutive years of operation after the
incumbent CEO departure. The dependent variables are changes in industry-and-performance adjusted ROAs. ***, **, and *
indicate statistical significance at the 1%, 5%, and 10% level, respectively. p-values are reported in the parentheses. Changes
in performance are winsorized at 1%. Definitions of all variables are in the Appendix.
Independent variables (1)
Change in
indperf
adjusted
ROAt+1
(2)
Change in
indperf
adjusted
ROAt+1
(3)
Change in
indperf
adjusted
ROAt+2
(4)
Change in
indperf
adjusted
ROAt+2
(5)
Change in
indperf
adjusted
ROAt+3
(6)
Change in
indperf
adjusted
ROAt+3
Log (Market cap) -0.014 -0.017 -0.003 -0.002 0.002 0.002
(0.14) (0.13) (0.65) (0.77) (0.73) (0.72)
Log (Firm age) 0.024 0.023 0.007 0.007 0.001 0.002
(0.28) (0.29) (0.59) (0.57) (0.91) (0.84)
Log (board size) -0.079 -0.093 0.003 0.010 0.017 0.018
(0.28) (0.83) (0.83) (0.90) (0.72) (0.77)
Founder CEO 0.072 0.067 0.086 0.073 0.052 0.043
(0.48) (0.49) (0.19) (0.30) (0.28) (0.41)
Post 2001 period -0.043 -0.044 -0.034 -0.033 -0.026 -0.025
(0.26) (0.27) (0.20) (0.21) (0.18) (0.19)
Firm risk 1.374 1.108 -0.025 0.182 0.138 0.238
(0.37) (0.46) (0.97) (0.81) (0.86) (0.77)
>=1 non-CEO inside
directors
0.0008
0.031
-0.010 0.028 0.017 0.028
(0.72) (0.61) (0.65) (0.50) (0.37) (0.56)
R&D intensity -0.112 -0.309 -0.464 0.405 -0.612* -0.104
(0.65) (0.60) (0.30) (0.59) (0.06) (0.86)
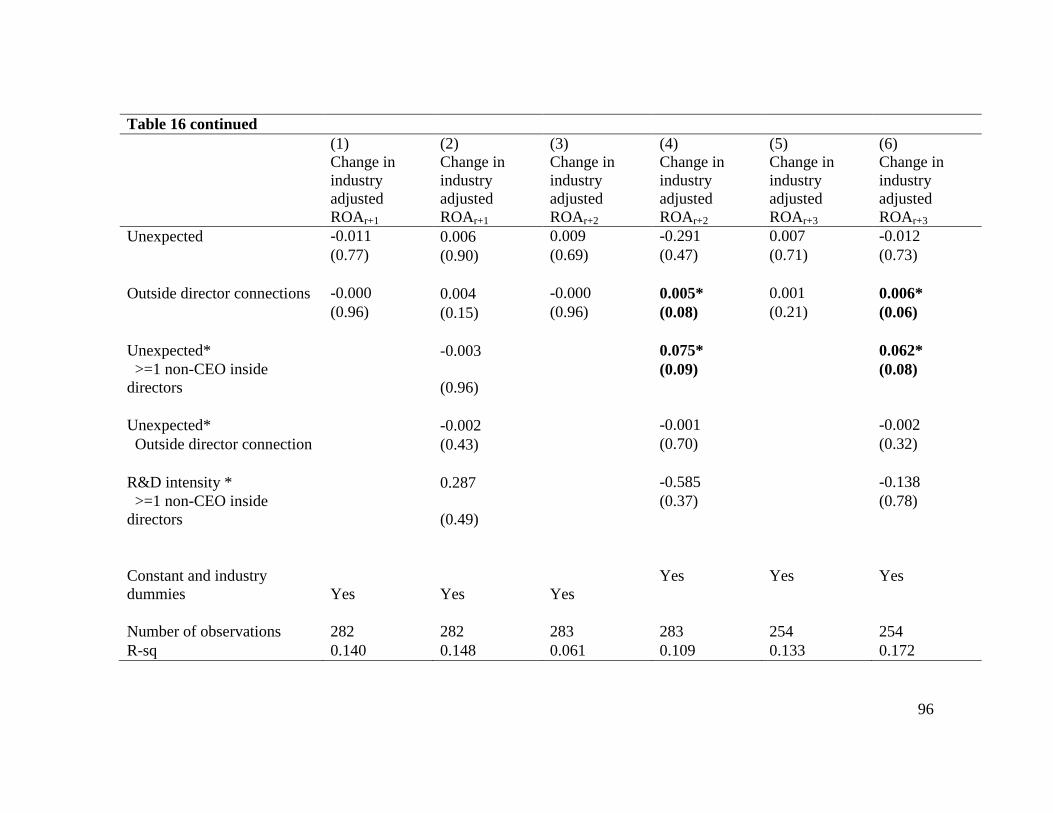
96
Table 16 continued
(1)
Change in
industry
adjusted
ROAr+1
(2)
Change in
industry
adjusted
ROAr+1
(3)
Change in
industry
adjusted
ROAr+2
(4)
Change in
industry
adjusted
ROAr+2
(5)
Change in
industry
adjusted
ROAr+3
(6)
Change in
industry
adjusted
ROAr+3
Unexpected -0.011 0.006 0.009 -0.291 0.007 -0.012
(0.77) (0.90) (0.69) (0.47) (0.71) (0.73)
Outside director connections -0.000 0.004 -0.000 0.005* 0.001 0.006*
(0.96) (0.15) (0.96) (0.08) (0.21) (0.06)
Unexpected* -0.003 0.075* 0.062*
>=1 non-CEO inside
directors
(0.96)
(0.09) (0.08)
Unexpected* -0.002 -0.001 -0.002
Outside director connection (0.43) (0.70) (0.32)
R&D intensity * 0.287 -0.585 -0.138
>=1 non-CEO inside
directors
(0.49)
(0.37) (0.78)
Constant and industry
dummies Yes Yes Yes
Yes Yes Yes
Number of observations 282 282 283 283 254 254
R-sq 0.140 0.148 0.061 0.109 0.133 0.172
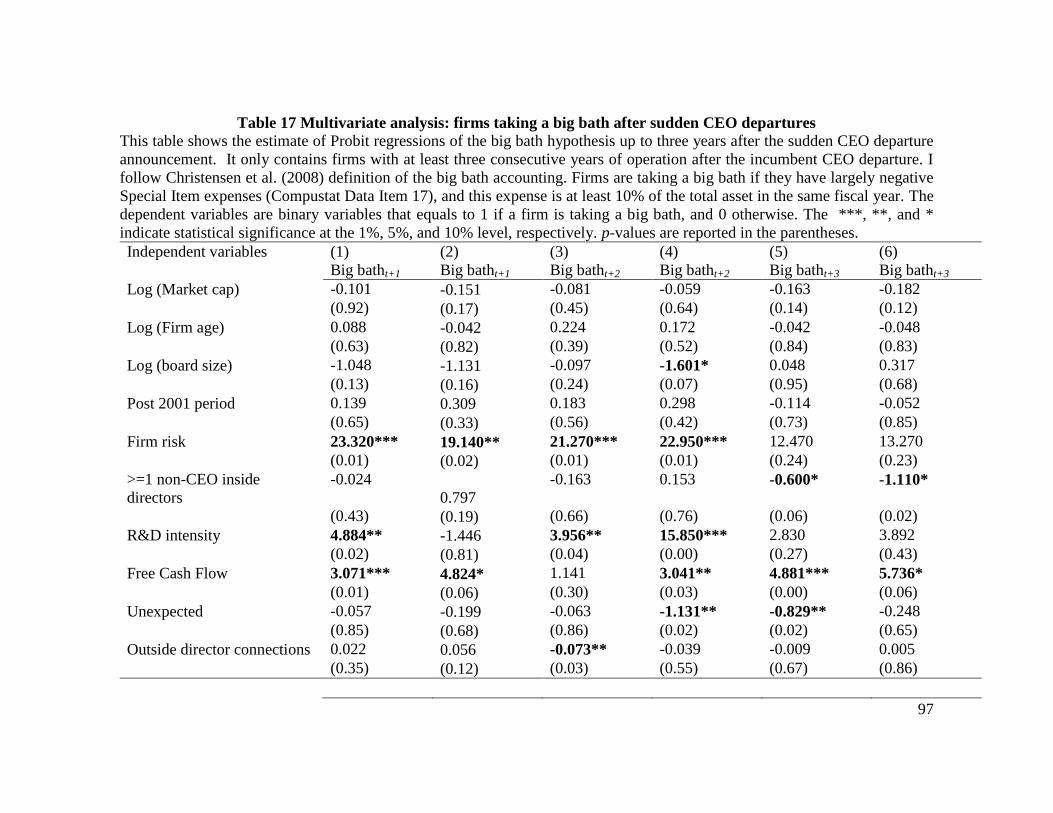
97
Table 17 Multivariate analysis: firms taking a big bath after sudden CEO departures
This table shows the estimate of Probit regressions of the big bath hypothesis up to three years after the sudden CEO departure
announcement. It only contains firms with at least three consecutive years of operation after the incumbent CEO departure. I
follow Christensen et al. (2008) definition of the big bath accounting. Firms are taking a big bath if they have largely negative
Special Item expenses (Compustat Data Item 17), and this expense is at least 10% of the total asset in the same fiscal year. The
dependent variables are binary variables that equals to 1 if a firm is taking a big bath, and 0 otherwise. The ***, **, and *
indicate statistical significance at the 1%, 5%, and 10% level, respectively. p-values are reported in the parentheses.
Independent variables (1)
Big batht+1
(2)
Big batht+1
(3)
Big batht+2
(4)
Big batht+2
(5)
Big batht+3
(6)
Big batht+3
Log (Market cap) -0.101 -0.151 -0.081 -0.059 -0.163 -0.182
(0.92) (0.17) (0.45) (0.64) (0.14) (0.12)
Log (Firm age) 0.088 -0.042 0.224 0.172 -0.042 -0.048
(0.63) (0.82) (0.39) (0.52) (0.84) (0.83)
Log (board size) -1.048 -1.131 -0.097 -1.601* 0.048 0.317
(0.13) (0.16) (0.24) (0.07) (0.95) (0.68)
Post 2001 period 0.139 0.309 0.183 0.298 -0.114 -0.052
(0.65) (0.33) (0.56) (0.42) (0.73) (0.85)
Firm risk 23.320*** 19.140** 21.270*** 22.950*** 12.470 13.270
(0.01) (0.02) (0.01) (0.01) (0.24) (0.23)
>=1 non-CEO inside
directors
-0.024
0.797
-0.163 0.153 -0.600* -1.110*
(0.43) (0.19) (0.66) (0.76) (0.06) (0.02)
R&D intensity 4.884** -1.446 3.956** 15.850*** 2.830 3.892
(0.02) (0.81) (0.04) (0.00) (0.27) (0.43)
Free Cash Flow 3.071*** 4.824* 1.141 3.041** 4.881*** 5.736*
(0.01) (0.06) (0.30) (0.03) (0.00) (0.06)
Unexpected -0.057 -0.199 -0.063 -1.131** -0.829** -0.248
(0.85) (0.68) (0.86) (0.02) (0.02) (0.65)
Outside director connections 0.022 0.056 -0.073** -0.039 -0.009 0.005
(0.35) (0.12) (0.03) (0.55) (0.67) (0.86)
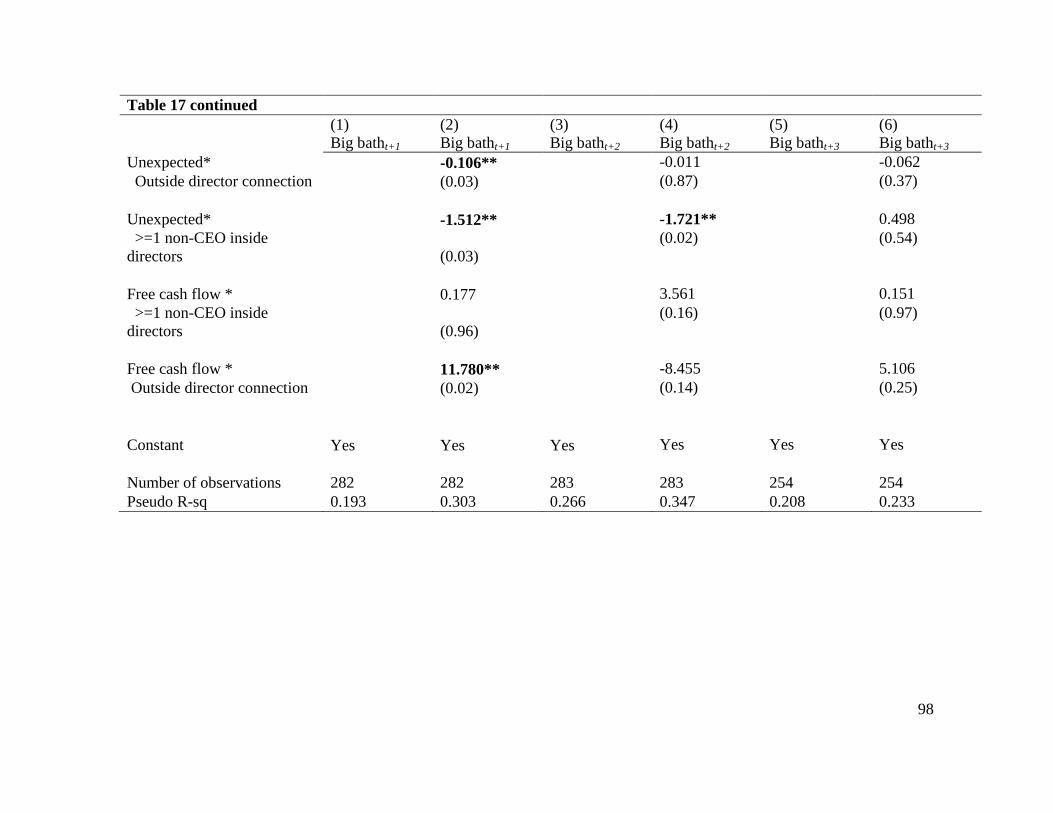
98
Table 17 continued
(1)
Big batht+1
(2)
Big batht+1
(3)
Big batht+2
(4)
Big batht+2
(5)
Big batht+3
(6)
Big batht+3
Unexpected* -0.106** -0.011 -0.062
Outside director connection (0.03) (0.87) (0.37)
Unexpected* -1.512** -1.721** 0.498
>=1 non-CEO inside
directors
(0.03)
(0.02) (0.54)
Free cash flow * 0.177 3.561 0.151
>=1 non-CEO inside
directors
(0.96)
(0.16) (0.97)
Free cash flow * 11.780** -8.455 5.106
Outside director connection (0.02) (0.14) (0.25)
Constant Yes Yes Yes Yes Yes Yes
Number of observations 282 282 283 283 254 254
Pseudo R-sq 0.193 0.303 0.266 0.347 0.208 0.233
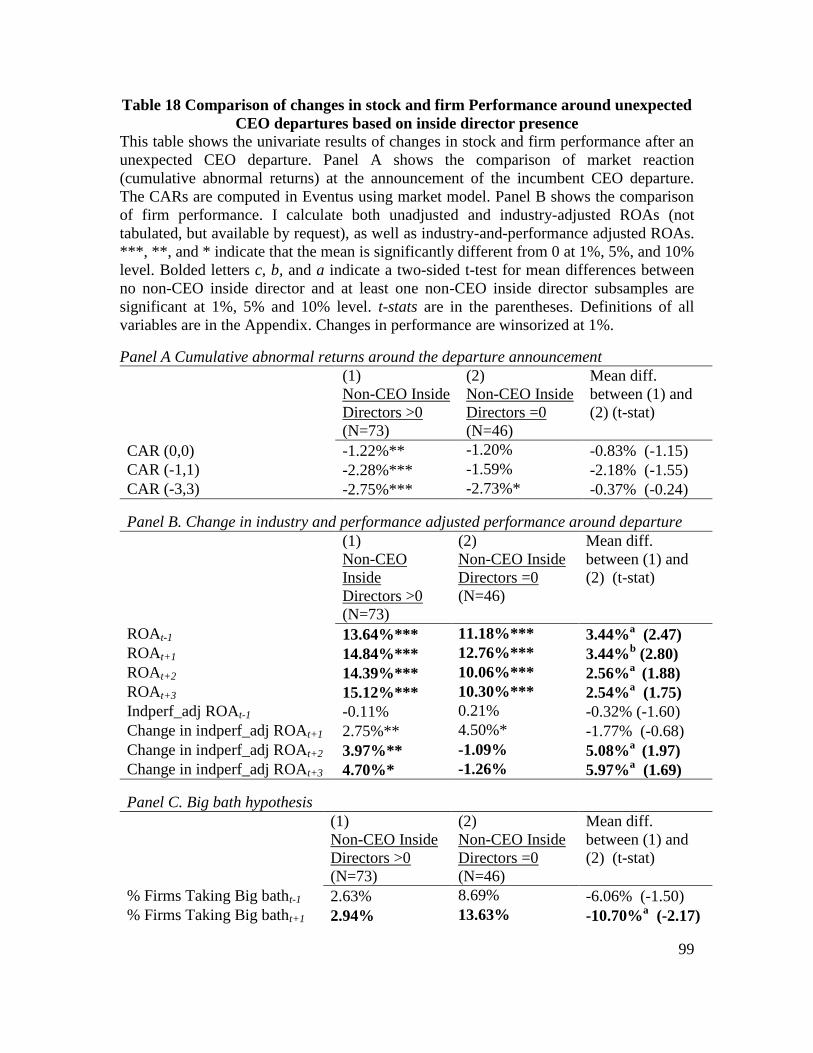
99
Table 18 Comparison of changes in stock and firm Performance around unexpected
CEO departures based on inside director presence
This table shows the univariate results of changes in stock and firm performance after an
unexpected CEO departure. Panel A shows the comparison of market reaction
(cumulative abnormal returns) at the announcement of the incumbent CEO departure.
The CARs are computed in Eventus using market model. Panel B shows the comparison
of firm performance. I calculate both unadjusted and industry-adjusted ROAs (not
tabulated, but available by request), as well as industry-and-performance adjusted ROAs.
***, **, and * indicate that the mean is significantly different from 0 at 1%, 5%, and 10%
level. Bolded letters c, b, and a indicate a two-sided t-test for mean differences between
no non-CEO inside director and at least one non-CEO inside director subsamples are
significant at 1%, 5% and 10% level. t-stats are in the parentheses. Definitions of all
variables are in the Appendix. Changes in performance are winsorized at 1%.
Panel A Cumulative abnormal returns around the departure announcement
(1)
Non-CEO Inside
Directors >0
(N=73)
(2)
Non-CEO Inside
Directors =0
(N=46)
Mean diff.
between (1) and
(2) (t-stat)
CAR (0,0) -1.22%** -1.20%
-0.83% (-1.15)
CAR (-1,1) -2.28%*** -1.59%
-2.18% (-1.55)
CAR (-3,3) -2.75%*** -2.73%*
-0.37% (-0.24)
Panel B. Change in industry and performance adjusted performance around departure
(1)
Non-CEO
Inside
Directors >0
(N=73)
(2)
Non-CEO Inside
Directors =0
(N=46)
Mean diff.
between (1) and
(2) (t-stat)
ROAt-1 13.64%*** 11.18%*** 3.44%a (2.47)
ROAt+1 14.84%*** 12.76%*** 3.44%b (2.80)
ROAt+2 14.39%*** 10.06%***
2.56%
a (1.88)
ROAt+3 15.12%*** 10.30%***
2.54%
a (1.75)
Indperf_adj ROAt-1 -0.11% 0.21%
-0.32% (-1.60)
Change in indperf_adj ROAt+1 2.75%** 4.50%* -1.77% (-0.68)
Change in indperf_adj ROAt+2 3.97%** -1.09%
5.08%
a (1.97)
Change in indperf_adj ROAt+3 4.70%* -1.26%
5.97%
a (1.69)
Panel C. Big bath hypothesis
(1)
Non-CEO Inside
Directors >0
(N=73)
(2)
Non-CEO Inside
Directors =0
(N=46)
Mean diff.
between (1) and
(2) (t-stat)
% Firms Taking Big batht-1 2.63% 8.69% -6.06% (-1.50)
% Firms Taking Big batht+1 2.94% 13.63% -10.70%a (-2.17)
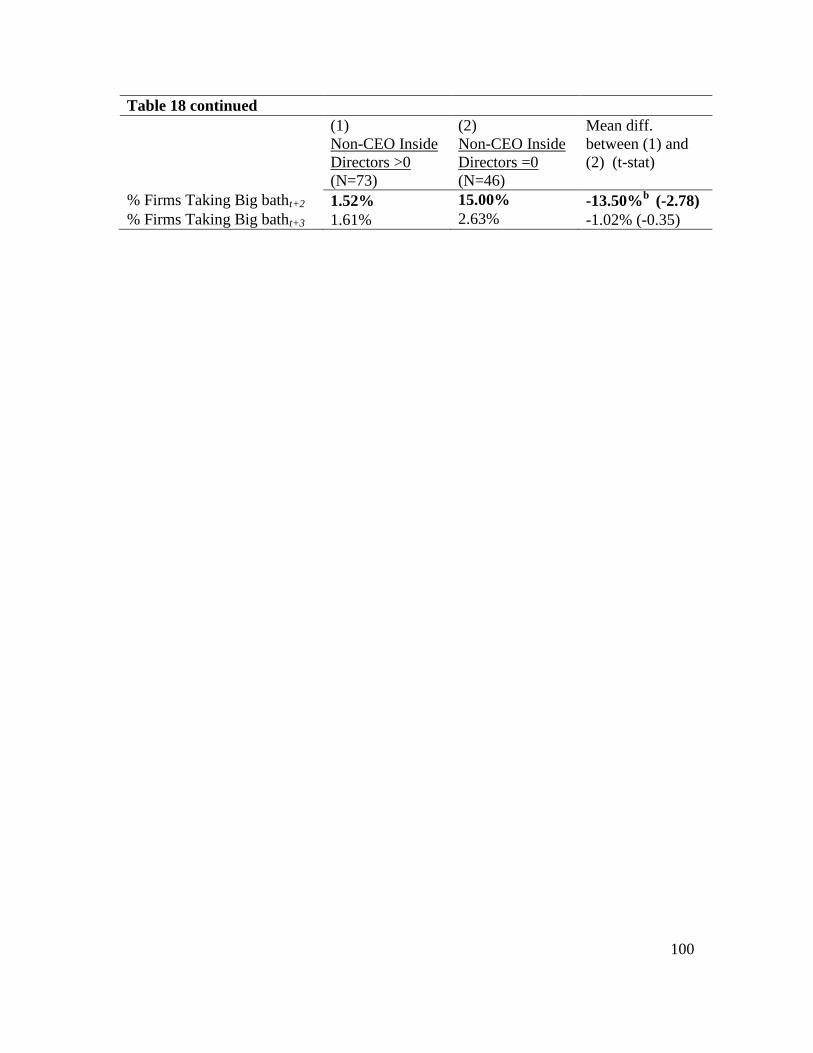
100
Table 18 continued
(1)
Non-CEO Inside
Directors >0
(N=73)
(2)
Non-CEO Inside
Directors =0
(N=46)
Mean diff.
between (1) and
(2) (t-stat)
% Firms Taking Big batht+2 1.52% 15.00%
-13.50%
b (-2.78)
% Firms Taking Big batht+3 1.61% 2.63%
-1.02% (-0.35)
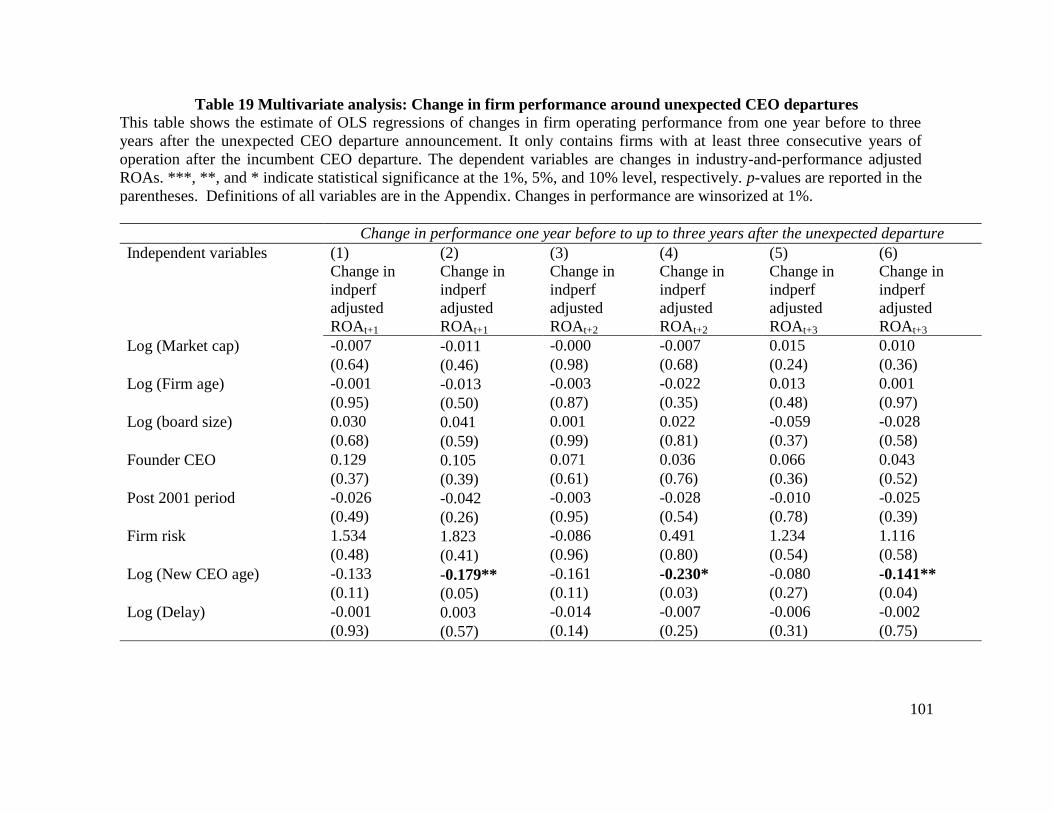
101
Table 19 Multivariate analysis: Change in firm performance around unexpected CEO departures
This table shows the estimate of OLS regressions of changes in firm operating performance from one year before to three
years after the unexpected CEO departure announcement. It only contains firms with at least three consecutive years of
operation after the incumbent CEO departure. The dependent variables are changes in industry-and-performance adjusted
ROAs. ***, **, and * indicate statistical significance at the 1%, 5%, and 10% level, respectively. p-values are reported in the
parentheses. Definitions of all variables are in the Appendix. Changes in performance are winsorized at 1%.
Change in performance one year before to up to three years after the unexpected departure
Independent variables (1)
Change in
indperf
adjusted
ROAt+1
(2)
Change in
indperf
adjusted
ROAt+1
(3)
Change in
indperf
adjusted
ROAt+2
(4)
Change in
indperf
adjusted
ROAt+2
(5)
Change in
indperf
adjusted
ROAt+3
(6)
Change in
indperf
adjusted
ROAt+3
Log (Market cap) -0.007 -0.011 -0.000 -0.007 0.015 0.010
(0.64) (0.46) (0.98) (0.68) (0.24) (0.36)
Log (Firm age) -0.001 -0.013 -0.003 -0.022 0.013 0.001
(0.95) (0.50) (0.87) (0.35) (0.48) (0.97)
Log (board size) 0.030 0.041 0.001 0.022 -0.059 -0.028
(0.68) (0.59) (0.99) (0.81) (0.37) (0.58)
Founder CEO 0.129 0.105 0.071 0.036 0.066 0.043
(0.37) (0.39) (0.61) (0.76) (0.36) (0.52)
Post 2001 period -0.026 -0.042 -0.003 -0.028 -0.010 -0.025
(0.49) (0.26) (0.95) (0.54) (0.78) (0.39)
Firm risk 1.534 1.823 -0.086 0.491 1.234 1.116
(0.48) (0.41) (0.96) (0.80) (0.54) (0.58)
Log (New CEO age) -0.133 -0.179** -0.161 -0.230* -0.080 -0.141**
(0.11) (0.05) (0.11) (0.03) (0.27) (0.04)
Log (Delay) -0.001 0.003 -0.014 -0.007 -0.006 -0.002
(0.93) (0.57) (0.14) (0.25) (0.31) (0.75)
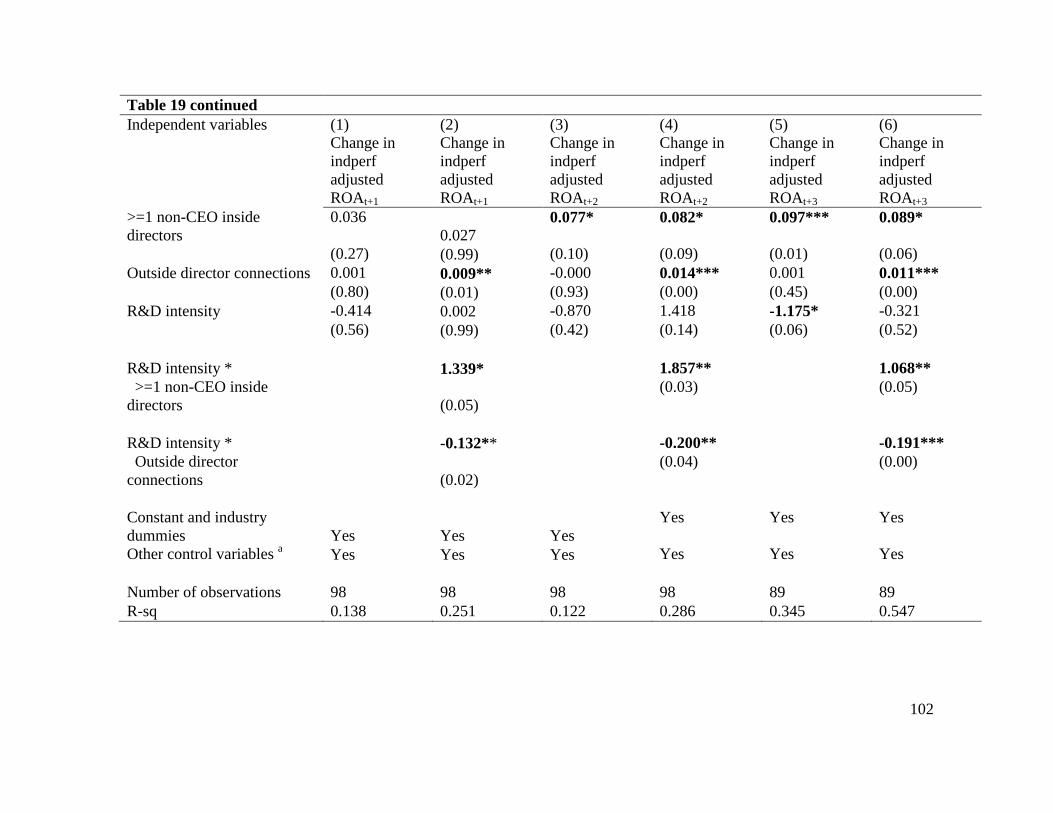
102
Table 19 continued
Independent variables (1)
Change in
indperf
adjusted
ROAt+1
(2)
Change in
indperf
adjusted
ROAt+1
(3)
Change in
indperf
adjusted
ROAt+2
(4)
Change in
indperf
adjusted
ROAt+2
(5)
Change in
indperf
adjusted
ROAt+3
(6)
Change in
indperf
adjusted
ROAt+3
>=1 non-CEO inside
directors
0.036
0.027
0.077* 0.082* 0.097*** 0.089*
(0.27) (0.99) (0.10) (0.09) (0.01) (0.06)
Outside director connections 0.001 0.009** -0.000 0.014*** 0.001 0.011***
(0.80) (0.01) (0.93) (0.00) (0.45) (0.00)
R&D intensity -0.414 0.002 -0.870 1.418 -1.175* -0.321
(0.56) (0.99) (0.42) (0.14) (0.06) (0.52)
R&D intensity * 1.339* 1.857** 1.068**
>=1 non-CEO inside
directors
(0.05)
(0.03) (0.05)
R&D intensity * -0.132** -0.200** -0.191***
Outside director
connections
(0.02)
(0.04) (0.00)
Constant and industry
dummies Yes Yes Yes
Yes Yes Yes
Other control variables a
Yes Yes Yes Yes Yes Yes
Number of observations 98 98 98 98 89 89
R-sq 0.138 0.251 0.122 0.286 0.345 0.547
103
CONCLUSION
While CEO succession planning has received a lot of attention recently—
particularly in social media, there has been a dearth of studies evaluating its necessity.
Moreover, the succession planning process itself has not been clearly described, possibly
because this process is difficult to observe and evaluate. In this dissertation, I determine
whether CEO succession planning matters and I examine which actions board of directors
take to prepare for a succession in the company’s top executive leadership. I also
investigate whether certain board composition help firms weather the storm better when
their CEO suddenly departs. I find that when the CEO departure is planned, firms tend to
experience less negative excess stock returns, more favorable change in firm
performance, as well as continued capital expenditures. In addition, firms with both
inside directors other than the CEO and well-connected outside directors are most
resilient, whereas firms with neither non-CEO inside directors nor connected outside
directors are least resilient and suffer the most. In addition, firms with greater inside
director presence are less likely to engage in big bath accounting, i.e., taking advantage of
the departure to largely write off assets. This paper contributes to the CEO succession
planning literature by showing that longer lead time in CEO succession planning is
critical to lower disruption costs and ensure a smoother transition. Thus, the new SEC
requirement that CEO succession planning be fully elevated to the status of core board
responsibility is empirically supported.
104
VITA
Mia L. Rivolta is a Visiting Assistant Professor in the Finance Division. Prior to coming
to Babson College, Dr. Rivolta received a Ph.D. in Finance from the University of
Tennessee Knoxville, and a M.S. in Finance from Sam Houston State University. She
has taught Financial Management and Integrated Process Management at the University
of Tennessee, and will be teaching undergraduate Investment classes at Babson College.
Dr. Rivolta’s research expertise lies in CEO succession planning and Corporate
Governance. Specifically, she examines whether succession planning matters and the
roles boards play in the succession planning process. Dr. Rivolta has presented her
research at major Finance conferences. Her other areas of research interests include CEO
compensation, Corporate Finance and Financial Intermediaries.