Embed Size (px)
Citation preview
www.issgovernance.com
Boardroom Refreshment A Review of Trends at U.S. Firms
Report Author: Edward Kamonjoh, Head, U.S. Strategic Research Analysis and Studies
Published: January 22, 2015
About This Analysis
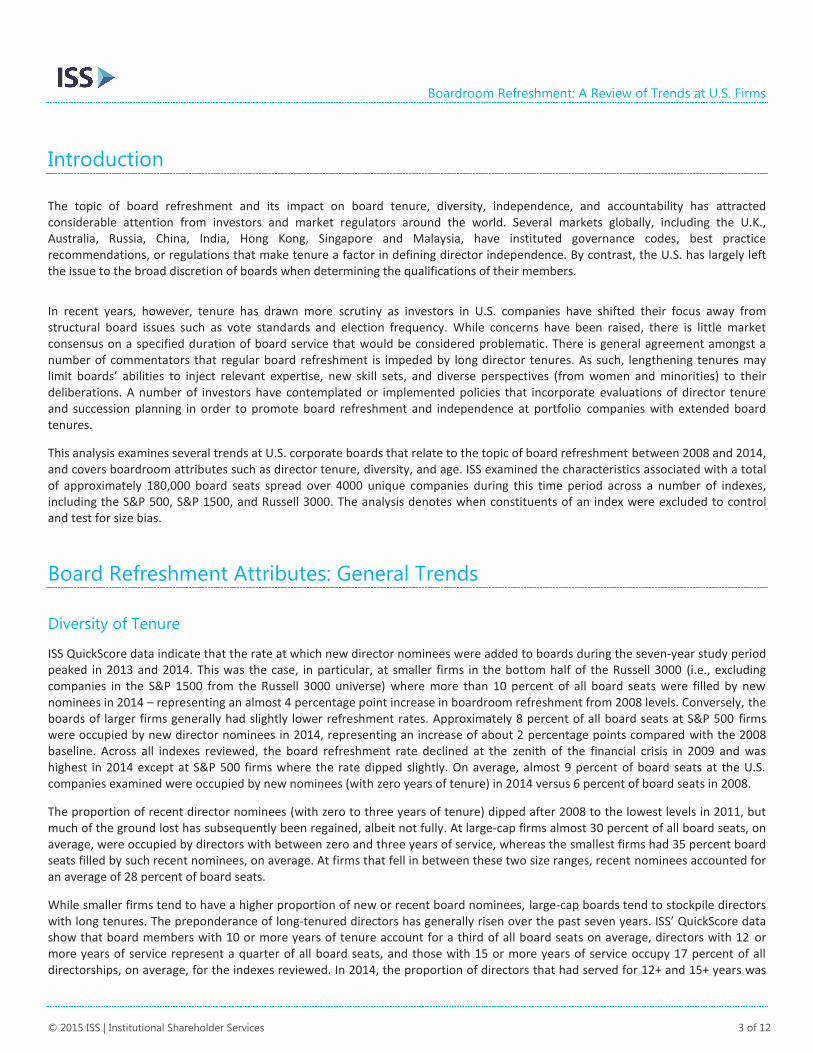
Concerns over lengthy director tenure, low boardroom turnover rates, and slow progress on the diversity front—to include gender, race, ethnicity, and experience—are coming together under the broad banner of “refreshment.” Investors’ calls to refresh boards reflect widespread concerns over the apparent absence of robust boardroom succession planning. While most directors cite the critical importance of robust boardroom evaluations to manage turnover, many boards still appear to use mandatory retirement ages as the primary impetus for bringing in fresh faces and new perspectives. Long-simmering concerns over issues related to refreshment came to a boil in the wake of the financial crisis as many boards sought to hold onto their most experienced members for guidance in weathering the market storm. For seven consecutive years, the average age of directors and the typical board’s tenure jumped as many companies postponed scheduled exits of experienced directors. Over the same period, boards began to boost their retirement ages—with, for example, 75 becoming the new 72—to reflect rising life expectancies and better health. Some investors took notice of the boardroom logjam created by the resulting slowdown in turnover and openly expressed concerns (sometimes via votes against long-tenured directors) that lengthening tenures would weaken directors’ independence—due to capture—and allow board members’ skills and knowledge to atrophy as their actual workplace experience became more remote. Notably, many investors recalled that several of the failed financial firms’ boards were packed with long-tenured directors whose stellar biographies masked the absence of recent relevant industry work experience. In response to clients’ requests for data on refreshment trends, ISS undertook this in-depth analysis of its QuickScore database to provide a multiyear view into boardroom succession efforts and trends.
Key Findings
› As expected, board tenure generally increased during the seven-year period (2008-2014) under review. Board members with 10+, 12+, and 15+ years of service accounted for a third, a quarter, and 17 percent of board seats at U.S. firms respectively, on average, over this period.
› Contrary to common wisdom, however, the board refreshment rate (defined as the ratio of new director nominees to all board nominees) for U.S. corporate boards has been on the rise since 2008. Approximately 9 percent of corporate board seats at U.S. firms, on average, were filled by new nominees in 2014 versus an average of 6 percent of board seats in 2008.
› Board refreshment accelerated in 2013 and 2014 as investors grew more vocal about their concerns over excessive tenures. Smaller firms led the way on board refreshment as they filled more than 10 percent of their total board seats with “new” nominees in 2014.
› Accelerated rates of refreshment are engendering greater board diversity. Between 2008 and 2014, the proportion of “new” female nominees has jumped by 81 percent at large-cap companies and more than doubled at firms in the bottom half of the Russell 3000. During this period, the appointment of new minority directors on board seats increased by 38 percent on average, with the largest percentage increase of almost 70 percent witnessed at large-cap firms.
› In relative terms, new nominees are injecting youthful blood into boardrooms. Nominees aged 50 - 59 years represented the largest age group of new board appointments accounting for 43 percent of all new nominees on average between 2008 and 2014. Directors in their 60s accounted for almost a third of all new board nominations on an average basis over this period.
Boardroom Refreshment: A Review of Trends at U.S. Firms
© 2015 ISS | Institutional Shareholder Services 2 of 12
Table of Contents
Introduction ............................................................................................................................................................ 3
Board Refreshment Attributes: General Trends ..................................................................................................... 3
Diversity of Tenure ................................................................................................................................................................................. 3
Gender Diversity .................................................................................................................................................................................... 6
Ethnic Diversity ...................................................................................................................................................................................... 8
Age Diversity .......................................................................................................................................................................................... 9
Attributes of New Director Nominees .................................................................................................................. 11
Gender ................................................................................................................................................................................................. 11
Ethnicity ............................................................................................................................................................................................... 11
Age ....................................................................................................................................................................................................... 12
Boardroom Refreshment: A Review of Trends at U.S. Firms
© 2015 ISS | Institutional Shareholder Services 3 of 12
Introduction
The topic of board refreshment and its impact on board tenure, diversity, independence, and accountability has attracted considerable attention from investors and market regulators around the world. Several markets globally, including the U.K., Australia, Russia, China, India, Hong Kong, Singapore and Malaysia, have instituted governance codes, best practice recommendations, or regulations that make tenure a factor in defining director independence. By contrast, the U.S. has largely left the issue to the broad discretion of boards when determining the qualifications of their members.
In recent years, however, tenure has drawn more scrutiny as investors in U.S. companies have shifted their focus away from structural board issues such as vote standards and election frequency. While concerns have been raised, there is little market consensus on a specified duration of board service that would be considered problematic. There is general agreement amongst a number of commentators that regular board refreshment is impeded by long director tenures. As such, lengthening tenures may limit boards’ abilities to inject relevant expertise, new skill sets, and diverse perspectives (from women and minorities) to their deliberations. A number of investors have contemplated or implemented policies that incorporate evaluations of director tenure and succession planning in order to promote board refreshment and independence at portfolio companies with extended board tenures.
This analysis examines several trends at U.S. corporate boards that relate to the topic of board refreshment between 2008 and 2014, and covers boardroom attributes such as director tenure, diversity, and age. ISS examined the characteristics associated with a total of approximately 180,000 board seats spread over 4000 unique companies during this time period across a number of indexes, including the S&P 500, S&P 1500, and Russell 3000. The analysis denotes when constituents of an index were excluded to control and test for size bias.
Board Refreshment Attributes: General Trends
Diversity of Tenure
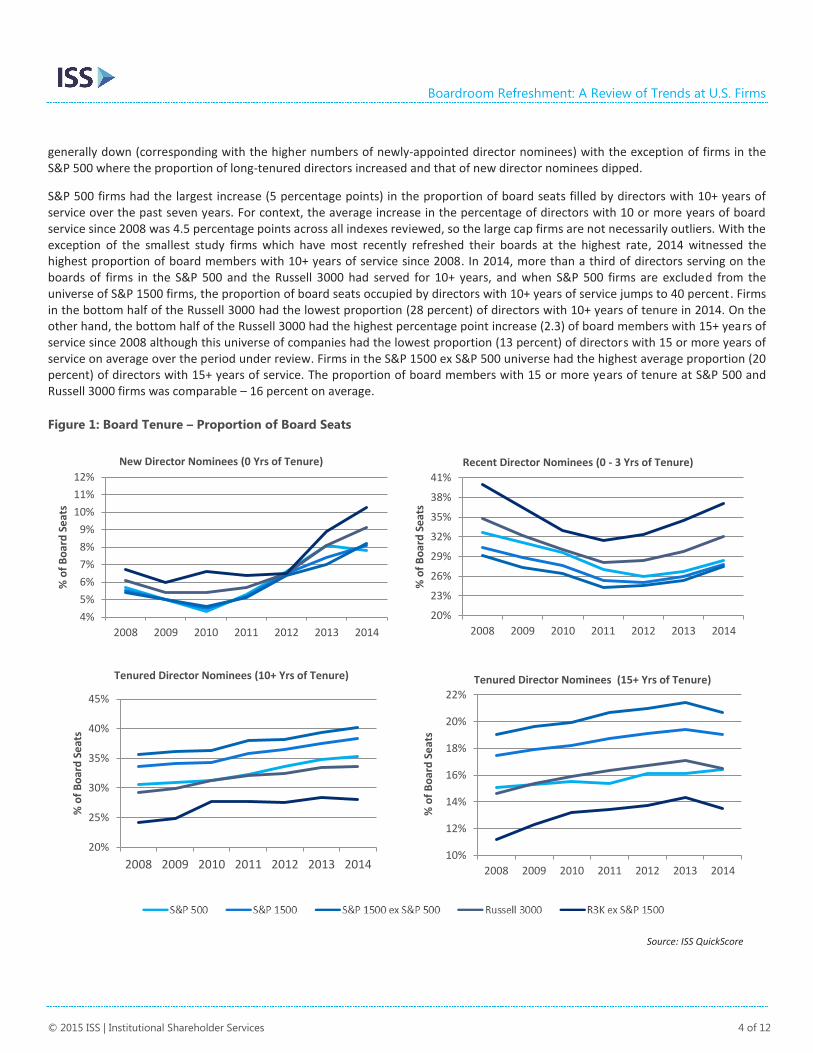
ISS QuickScore data indicate that the rate at which new director nominees were added to boards during the seven-year study period peaked in 2013 and 2014. This was the case, in particular, at smaller firms in the bottom half of the Russell 3000 (i.e., excluding companies in the S&P 1500 from the Russell 3000 universe) where more than 10 percent of all board seats were filled by new nominees in 2014 – representing an almost 4 percentage point increase in boardroom refreshment from 2008 levels. Conversely, the boards of larger firms generally had slightly lower refreshment rates. Approximately 8 percent of all board seats at S&P 500 firms were occupied by new director nominees in 2014, representing an increase of about 2 percentage points compared with the 2008 baseline. Across all indexes reviewed, the board refreshment rate declined at the zenith of the financial crisis in 2009 and was highest in 2014 except at S&P 500 firms where the rate dipped slightly. On average, almost 9 percent of board seats at the U.S. companies examined were occupied by new nominees (with zero years of tenure) in 2014 versus 6 percent of board seats in 2008.
The proportion of recent director nominees (with zero to three years of tenure) dipped after 2008 to the lowest levels in 2011, but much of the ground lost has subsequently been regained, albeit not fully. At large-cap firms almost 30 percent of all board seats, on average, were occupied by directors with between zero and three years of service, whereas the smallest firms had 35 percent board seats filled by such recent nominees, on average. At firms that fell in between these two size ranges, recent nominees accounted for an average of 28 percent of board seats.
While smaller firms tend to have a higher proportion of new or recent board nominees, large-cap boards tend to stockpile directors with long tenures. The preponderance of long-tenured directors has generally risen over the past seven years. ISS’ QuickScore data show that board members with 10 or more years of tenure account for a third of all board seats on average, directors with 12 or more years of service represent a quarter of all board seats, and those with 15 or more years of service occupy 17 percent of all directorships, on average, for the indexes reviewed. In 2014, the proportion of directors that had served for 12+ and 15+ years was
Boardroom Refreshment: A Review of Trends at U.S. Firms
© 2015 ISS | Institutional Shareholder Services 4 of 12
generally down (corresponding with the higher numbers of newly-appointed director nominees) with the exception of firms in the S&P 500 where the proportion of long-tenured directors increased and that of new director nominees dipped.
S&P 500 firms had the largest increase (5 percentage points) in the proportion of board seats filled by directors with 10+ years of service over the past seven years. For context, the average increase in the percentage of directors with 10 or more years of board service since 2008 was 4.5 percentage points across all indexes reviewed, so the large cap firms are not necessarily outliers. With the exception of the smallest study firms which have most recently refreshed their boards at the highest rate, 2014 witnessed the highest proportion of board members with 10+ years of service since 2008. In 2014, more than a third of directors serving on the boards of firms in the S&P 500 and the Russell 3000 had served for 10+ years, and when S&P 500 firms are excluded from the universe of S&P 1500 firms, the proportion of board seats occupied by directors with 10+ years of service jumps to 40 percent. Firms in the bottom half of the Russell 3000 had the lowest proportion (28 percent) of directors with 10+ years of tenure in 2014. On the other hand, the bottom half of the Russell 3000 had the highest percentage point increase (2.3) of board members with 15+ years of service since 2008 although this universe of companies had the lowest proportion (13 percent) of directors with 15 or more years of service on average over the period under review. Firms in the S&P 1500 ex S&P 500 universe had the highest average proportion (20 percent) of directors with 15+ years of service. The proportion of board members with 15 or more years of tenure at S&P 500 and Russell 3000 firms was comparable – 16 percent on average.
Figure 1: Board Tenure – Proportion of Board Seats
4%
5%
6%
7%
8%
9%
10%
11%
12%
2008 2009 2010 2011 2012 2013 2014
% o
f B
oar
d S
eat
s
New Director Nominees (0 Yrs of Tenure)
20%
23%
26%
29%
32%
35%
38%
41%
2008 2009 2010 2011 2012 2013 2014
% o
f B
oar
d S
eat
s
Recent Director Nominees (0 - 3 Yrs of Tenure)
20%
25%
30%
35%
40%
45%
2008 2009 2010 2011 2012 2013 2014
% o
f B
oar
d S
eat
s
Tenured Director Nominees (10+ Yrs of Tenure)
10%
12%
14%
16%
18%
20%
22%
2008 2009 2010 2011 2012 2013 2014
% o
f B
oar
d S
eat
s
Tenured Director Nominees (15+ Yrs of Tenure)
Source: ISS QuickScore
Boardroom Refreshment: A Review of Trends at U.S. Firms
© 2015 ISS | Institutional Shareholder Services 5 of 12
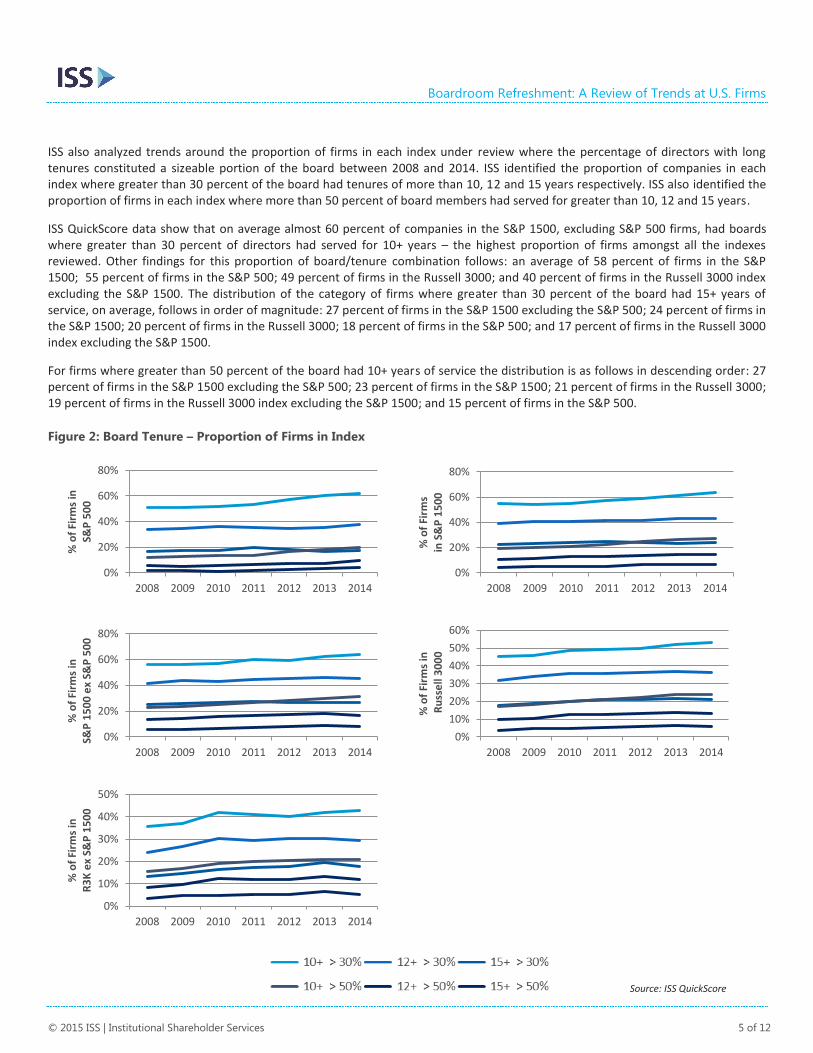
ISS also analyzed trends around the proportion of firms in each index under review where the percentage of directors with long tenures constituted a sizeable portion of the board between 2008 and 2014. ISS identified the proportion of companies in each index where greater than 30 percent of the board had tenures of more than 10, 12 and 15 years respectively. ISS also identified the proportion of firms in each index where more than 50 percent of board members had served for greater than 10, 12 and 15 years.
ISS QuickScore data show that on average almost 60 percent of companies in the S&P 1500, excluding S&P 500 firms, had boards where greater than 30 percent of directors had served for 10+ years – the highest proportion of firms amongst all the indexes reviewed. Other findings for this proportion of board/tenure combination follows: an average of 58 percent of firms in the S&P 1500; 55 percent of firms in the S&P 500; 49 percent of firms in the Russell 3000; and 40 percent of firms in the Russell 3000 index excluding the S&P 1500. The distribution of the category of firms where greater than 30 percent of the board had 15+ years of service, on average, follows in order of magnitude: 27 percent of firms in the S&P 1500 excluding the S&P 500; 24 percent of firms in the S&P 1500; 20 percent of firms in the Russell 3000; 18 percent of firms in the S&P 500; and 17 percent of firms in the Russell 3000 index excluding the S&P 1500.
For firms where greater than 50 percent of the board had 10+ years of service the distribution is as follows in descending order: 27 percent of firms in the S&P 1500 excluding the S&P 500; 23 percent of firms in the S&P 1500; 21 percent of firms in the Russell 3000; 19 percent of firms in the Russell 3000 index excluding the S&P 1500; and 15 percent of firms in the S&P 500.
Figure 2: Board Tenure – Proportion of Firms in Index
0%
20%
40%
60%
80%
2008 2009 2010 2011 2012 2013 2014
% o
f Fi
rms
in
S&P
50
0
0%
20%
40%
60%
80%
2008 2009 2010 2011 2012 2013 2014
% o
f Fi
rms
in
S&
P 1
50
0
0%
20%
40%
60%
80%
2008 2009 2010 2011 2012 2013 2014
% o
f Fi
rms
in
S&P
15
00
ex
S&P
50
0
0%
10%
20%
30%
40%
50%
60%
2008 2009 2010 2011 2012 2013 2014
% o
f Fi
rms
in
Ru
sse
ll 3
00
0
0%
10%
20%
30%
40%
50%
2008 2009 2010 2011 2012 2013 2014
% o
f Fi
rms
in
R3
K e
x S&
P 1
50
0
Source: ISS QuickScore
Boardroom Refreshment: A Review of Trends at U.S. Firms
© 2015 ISS | Institutional Shareholder Services 6 of 12
Gender Diversity
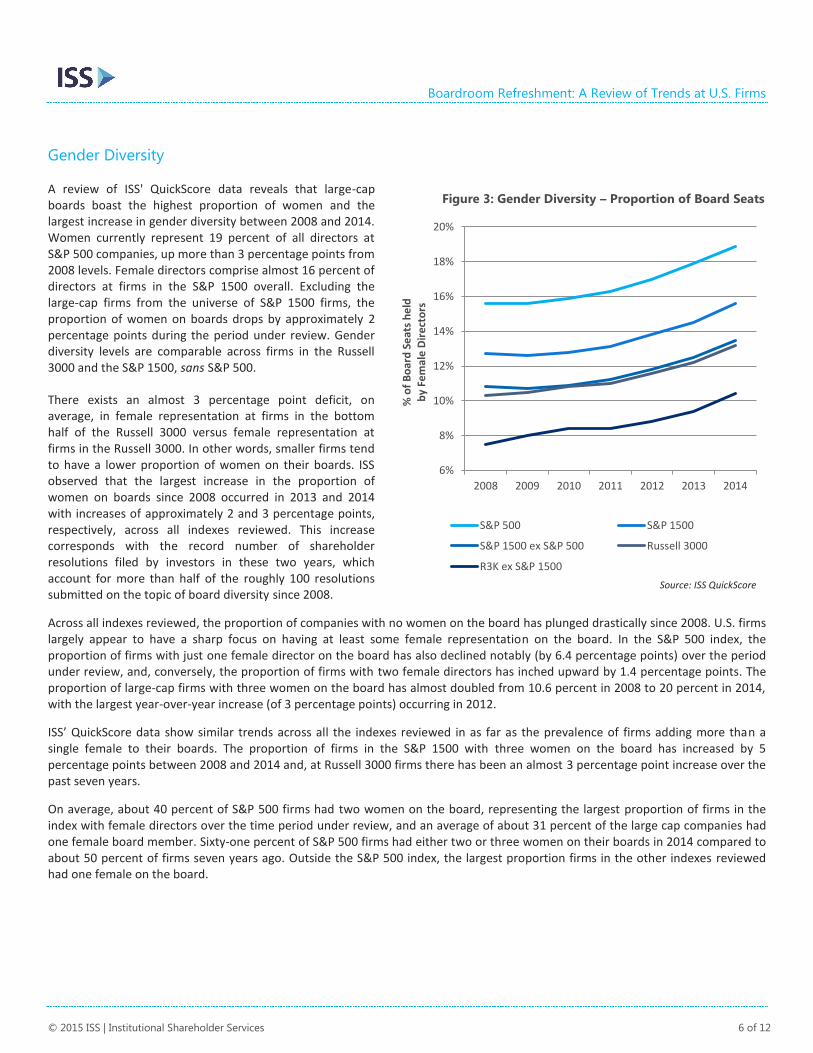
A review of ISS' QuickScore data reveals that large-cap boards boast the highest proportion of women and the largest increase in gender diversity between 2008 and 2014. Women currently represent 19 percent of all directors at S&P 500 companies, up more than 3 percentage points from 2008 levels. Female directors comprise almost 16 percent of directors at firms in the S&P 1500 overall. Excluding the large-cap firms from the universe of S&P 1500 firms, the proportion of women on boards drops by approximately 2 percentage points during the period under review. Gender diversity levels are comparable across firms in the Russell 3000 and the S&P 1500, sans S&P 500.
There exists an almost 3 percentage point deficit, on average, in female representation at firms in the bottom half of the Russell 3000 versus female representation at firms in the Russell 3000. In other words, smaller firms tend to have a lower proportion of women on their boards. ISS observed that the largest increase in the proportion of women on boards since 2008 occurred in 2013 and 2014 with increases of approximately 2 and 3 percentage points, respectively, across all indexes reviewed. This increase corresponds with the record number of shareholder resolutions filed by investors in these two years, which account for more than half of the roughly 100 resolutions submitted on the topic of board diversity since 2008.
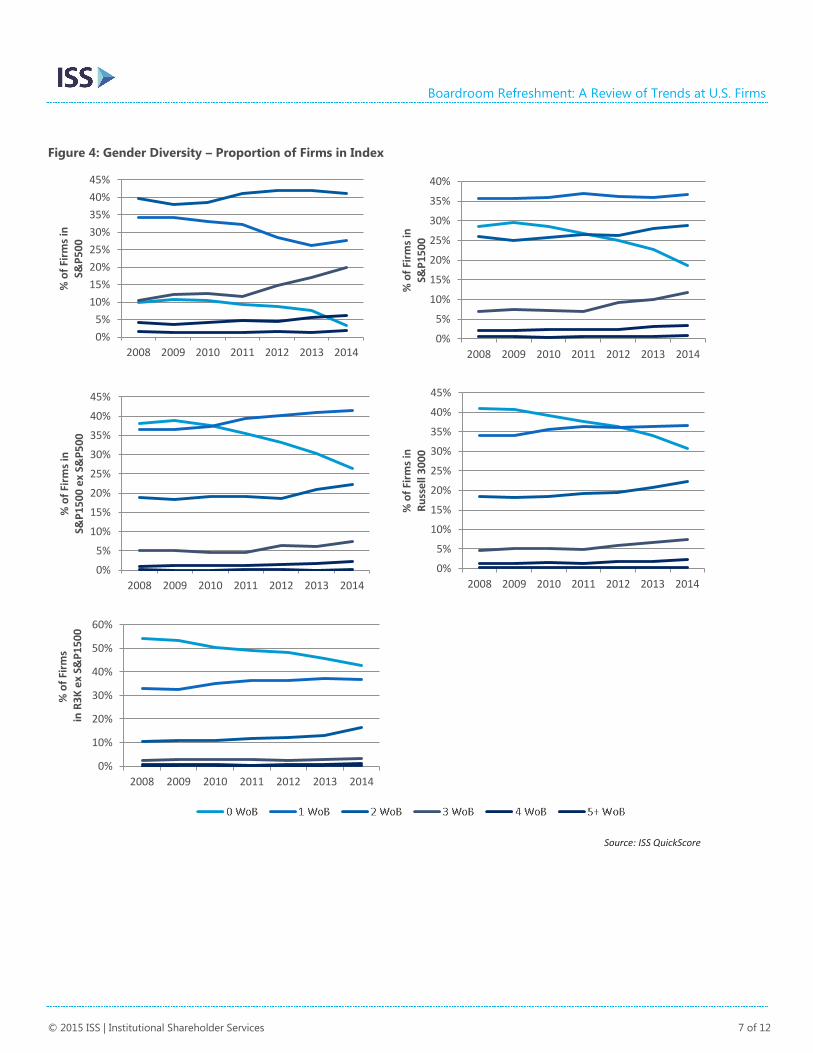
Across all indexes reviewed, the proportion of companies with no women on the board has plunged drastically since 2008. U.S. firms largely appear to have a sharp focus on having at least some female representation on the board. In the S&P 500 index, the proportion of firms with just one female director on the board has also declined notably (by 6.4 percentage points) over the period under review, and, conversely, the proportion of firms with two female directors has inched upward by 1.4 percentage points. The proportion of large-cap firms with three women on the board has almost doubled from 10.6 percent in 2008 to 20 percent in 2014, with the largest year-over-year increase (of 3 percentage points) occurring in 2012.
ISS’ QuickScore data show similar trends across all the indexes reviewed in as far as the prevalence of firms adding more than a single female to their boards. The proportion of firms in the S&P 1500 with three women on the board has increased by 5 percentage points between 2008 and 2014 and, at Russell 3000 firms there has been an almost 3 percentage point increase over the past seven years.
On average, about 40 percent of S&P 500 firms had two women on the board, representing the largest proportion of firms in the index with female directors over the time period under review, and an average of about 31 percent of the large cap companies had one female board member. Sixty-one percent of S&P 500 firms had either two or three women on their boards in 2014 compared to about 50 percent of firms seven years ago. Outside the S&P 500 index, the largest proportion firms in the other indexes reviewed had one female on the board.
6%
8%
10%
12%
14%
16%
18%
20%
2008 2009 2010 2011 2012 2013 2014
% o
f B
oar
d S
eat
s h
eld
b
y Fe
mal
e D
ire
cto
rs
S&P 500 S&P 1500
S&P 1500 ex S&P 500 Russell 3000
R3K ex S&P 1500
Figure 3: Gender Diversity – Proportion of Board Seats
Source: ISS QuickScore
Boardroom Refreshment: A Review of Trends at U.S. Firms
© 2015 ISS | Institutional Shareholder Services 7 of 12
Figure 4: Gender Diversity – Proportion of Firms in Index
0%
5%
10%
15%
20%
25%
30%
35%
40%
45%
2008 2009 2010 2011 2012 2013 2014
% o
f Fi
rms
in
S&P
50
0
0%
5%
10%
15%
20%
25%
30%
35%
40%
2008 2009 2010 2011 2012 2013 2014
% o
f Fi
rms
in
S&P
15
00
0%
5%
10%
15%
20%
25%
30%
35%
40%
45%
2008 2009 2010 2011 2012 2013 2014
% o
f Fi
rms
in
S&P
15
00
ex
S&P
50
0
0%
5%
10%
15%
20%
25%
30%
35%
40%
45%
2008 2009 2010 2011 2012 2013 2014
% o
f Fi
rms
in
Ru
sse
ll 3
00
0
0%
10%
20%
30%
40%
50%
60%
2008 2009 2010 2011 2012 2013 2014
% o
f Fi
rms
in R
3K
ex
S&P
15
00
Source: ISS QuickScore
Boardroom Refreshment: A Review of Trends at U.S. Firms
© 2015 ISS | Institutional Shareholder Services 8 of 12
Ethnic Diversity
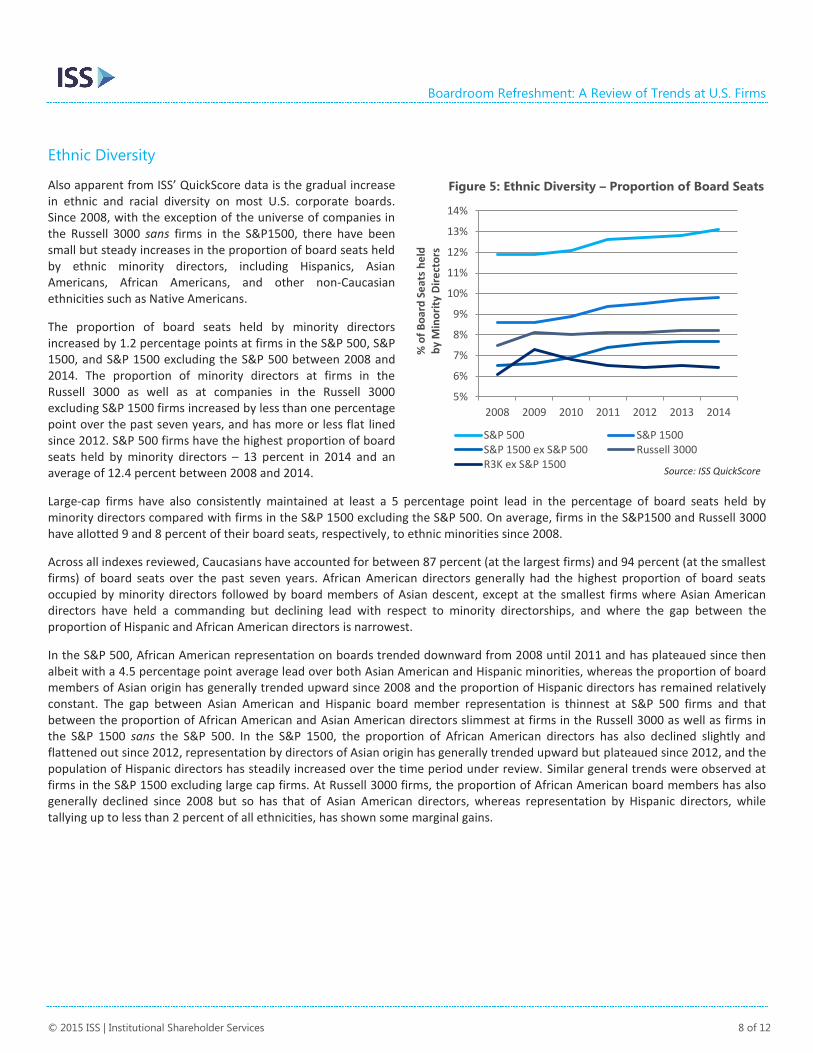
Also apparent from ISS’ QuickScore data is the gradual increase in ethnic and racial diversity on most U.S. corporate boards. Since 2008, with the exception of the universe of companies in the Russell 3000 sans firms in the S&P1500, there have been small but steady increases in the proportion of board seats held by ethnic minority directors, including Hispanics, Asian Americans, African Americans, and other non-Caucasian ethnicities such as Native Americans.
The proportion of board seats held by minority directors increased by 1.2 percentage points at firms in the S&P 500, S&P 1500, and S&P 1500 excluding the S&P 500 between 2008 and 2014. The proportion of minority directors at firms in the Russell 3000 as well as at companies in the Russell 3000 excluding S&P 1500 firms increased by less than one percentage point over the past seven years, and has more or less flat lined since 2012. S&P 500 firms have the highest proportion of board seats held by minority directors – 13 percent in 2014 and an average of 12.4 percent between 2008 and 2014.
Large-cap firms have also consistently maintained at least a 5 percentage point lead in the percentage of board seats held by minority directors compared with firms in the S&P 1500 excluding the S&P 500. On average, firms in the S&P1500 and Russell 3000 have allotted 9 and 8 percent of their board seats, respectively, to ethnic minorities since 2008.
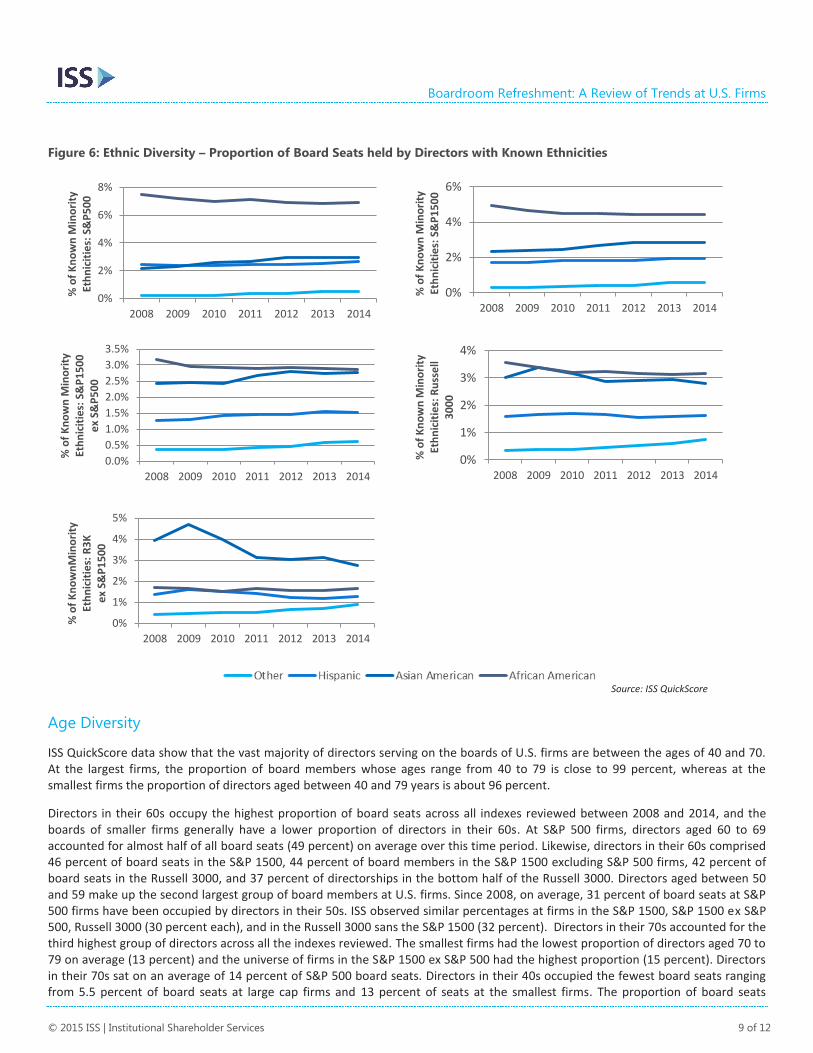
Across all indexes reviewed, Caucasians have accounted for between 87 percent (at the largest firms) and 94 percent (at the smallest firms) of board seats over the past seven years. African American directors generally had the highest proportion of board seats occupied by minority directors followed by board members of Asian descent, except at the smallest firms where Asian American directors have held a commanding but declining lead with respect to minority directorships, and where the gap between the proportion of Hispanic and African American directors is narrowest.
In the S&P 500, African American representation on boards trended downward from 2008 until 2011 and has plateaued since then albeit with a 4.5 percentage point average lead over both Asian American and Hispanic minorities, whereas the proportion of board members of Asian origin has generally trended upward since 2008 and the proportion of Hispanic directors has remained relatively constant. The gap between Asian American and Hispanic board member representation is thinnest at S&P 500 firms and that between the proportion of African American and Asian American directors slimmest at firms in the Russell 3000 as well as firms in the S&P 1500 sans the S&P 500. In the S&P 1500, the proportion of African American directors has also declined slightly and flattened out since 2012, representation by directors of Asian origin has generally trended upward but plateaued since 2012, and the population of Hispanic directors has steadily increased over the time period under review. Similar general trends were observed at firms in the S&P 1500 excluding large cap firms. At Russell 3000 firms, the proportion of African American board members has also generally declined since 2008 but so has that of Asian American directors, whereas representation by Hispanic directors, while tallying up to less than 2 percent of all ethnicities, has shown some marginal gains.
5%
6%
7%
8%
9%
10%
11%
12%
13%
14%
2008 2009 2010 2011 2012 2013 2014%
of
Bo
ard
Se
ats
he
ld
by
Min
ori
ty D
ire
cto
rs
S&P 500 S&P 1500S&P 1500 ex S&P 500 Russell 3000R3K ex S&P 1500
Figure 5: Ethnic Diversity – Proportion of Board Seats
Source: ISS QuickScore
Boardroom Refreshment: A Review of Trends at U.S. Firms
© 2015 ISS | Institutional Shareholder Services 9 of 12
Figure 6: Ethnic Diversity – Proportion of Board Seats held by Directors with Known Ethnicities
Age Diversity
ISS QuickScore data show that the vast majority of directors serving on the boards of U.S. firms are between the ages of 40 and 70. At the largest firms, the proportion of board members whose ages range from 40 to 79 is close to 99 percent, whereas at the smallest firms the proportion of directors aged between 40 and 79 years is about 96 percent.
Directors in their 60s occupy the highest proportion of board seats across all indexes reviewed between 2008 and 2014, and the boards of smaller firms generally have a lower proportion of directors in their 60s. At S&P 500 firms, directors aged 60 to 69 accounted for almost half of all board seats (49 percent) on average over this time period. Likewise, directors in their 60s comprised 46 percent of board seats in the S&P 1500, 44 percent of board members in the S&P 1500 excluding S&P 500 firms, 42 percent of board seats in the Russell 3000, and 37 percent of directorships in the bottom half of the Russell 3000. Directors aged between 50 and 59 make up the second largest group of board members at U.S. firms. Since 2008, on average, 31 percent of board seats at S&P 500 firms have been occupied by directors in their 50s. ISS observed similar percentages at firms in the S&P 1500, S&P 1500 ex S&P 500, Russell 3000 (30 percent each), and in the Russell 3000 sans the S&P 1500 (32 percent). Directors in their 70s accounted for the third highest group of directors across all the indexes reviewed. The smallest firms had the lowest proportion of directors aged 70 to 79 on average (13 percent) and the universe of firms in the S&P 1500 ex S&P 500 had the highest proportion (15 percent). Directors in their 70s sat on an average of 14 percent of S&P 500 board seats. Directors in their 40s occupied the fewest board seats ranging from 5.5 percent of board seats at large cap firms and 13 percent of seats at the smallest firms. The proportion of board seats
0%
2%
4%
6%
8%
2008 2009 2010 2011 2012 2013 2014
% o
f K
no
wn
Min
ori
ty
Eth
nic
itie
s: S
&P
50
0
0%
2%
4%
6%
2008 2009 2010 2011 2012 2013 2014
% o
f K
no
wn
Min
ori
ty
Eth
nic
itie
s: S
&P
15
00
0.0%
0.5%
1.0%
1.5%
2.0%
2.5%
3.0%
3.5%
2008 2009 2010 2011 2012 2013 2014
% o
f K
no
wn
Min
ori
ty
Eth
nic
itie
s: S
&P
15
00
e
x S&
P5
00
0%
1%
2%
3%
4%
2008 2009 2010 2011 2012 2013 2014
% o
f K
no
wn
Min
ori
ty
Eth
nic
itie
s: R
uss
ell
30
00
0%
1%
2%
3%
4%
5%
2008 2009 2010 2011 2012 2013 2014
% o
f K
no
wn
Min
ori
ty
Eth
nic
itie
s: R
3K
e
x S&
P1
50
0
Source: ISS QuickScore
Boardroom Refreshment: A Review of Trends at U.S. Firms
© 2015 ISS | Institutional Shareholder Services 10 of 12
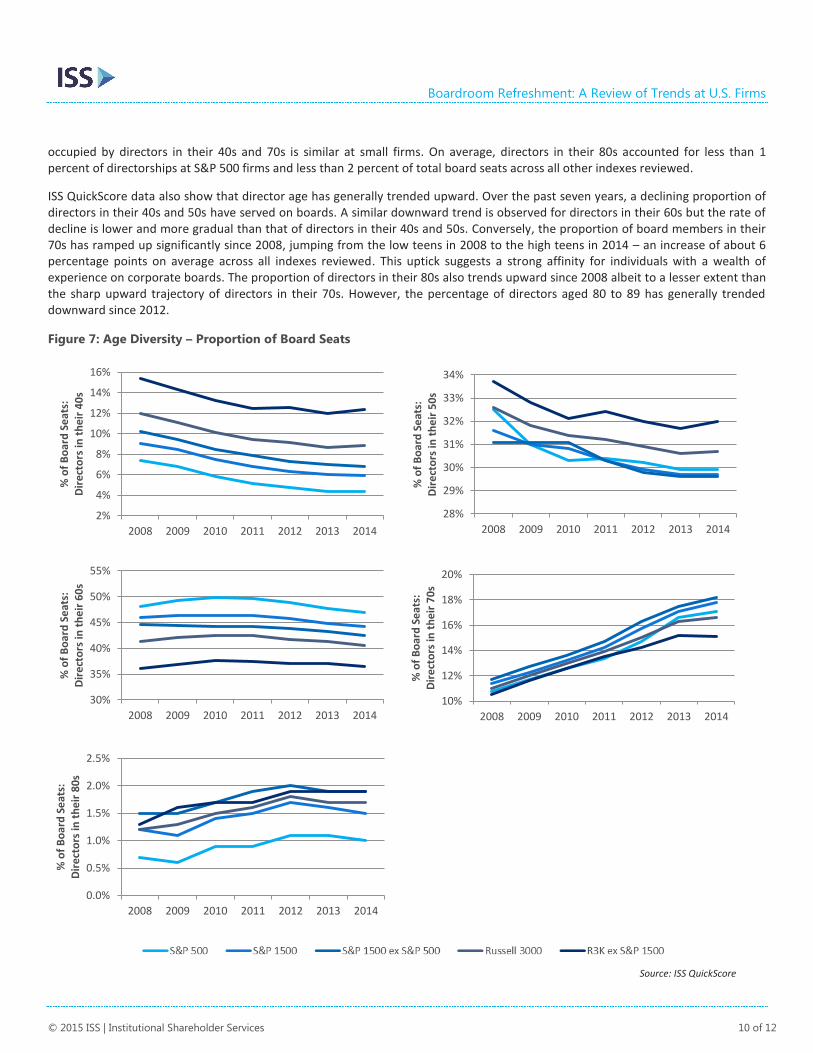
occupied by directors in their 40s and 70s is similar at small firms. On average, directors in their 80s accounted for less than 1 percent of directorships at S&P 500 firms and less than 2 percent of total board seats across all other indexes reviewed.
ISS QuickScore data also show that director age has generally trended upward. Over the past seven years, a declining proportion of directors in their 40s and 50s have served on boards. A similar downward trend is observed for directors in their 60s but the rate of decline is lower and more gradual than that of directors in their 40s and 50s. Conversely, the proportion of board members in their 70s has ramped up significantly since 2008, jumping from the low teens in 2008 to the high teens in 2014 – an increase of about 6 percentage points on average across all indexes reviewed. This uptick suggests a strong affinity for individuals with a wealth of experience on corporate boards. The proportion of directors in their 80s also trends upward since 2008 albeit to a lesser extent than the sharp upward trajectory of directors in their 70s. However, the percentage of directors aged 80 to 89 has generally trended downward since 2012.
Figure 7: Age Diversity – Proportion of Board Seats
2%
4%
6%
8%
10%
12%
14%
16%
2008 2009 2010 2011 2012 2013 2014
% o
f B
oar
d S
eat
s:
Dir
ect
ors
in t
he
ir 4
0s
28%
29%
30%
31%
32%
33%
34%
2008 2009 2010 2011 2012 2013 2014
% o
f B
oar
d S
eat
s:
Dir
ect
ors
in t
he
ir 5
0s
30%
35%
40%
45%
50%
55%
2008 2009 2010 2011 2012 2013 2014
% o
f B
oar
d S
eat
s:
Dir
ect
ors
in t
he
ir 6
0s
10%
12%
14%
16%
18%
20%
2008 2009 2010 2011 2012 2013 2014
% o
f B
oar
d S
eat
s:
Dir
ect
ors
in t
he
ir 7
0s
0.0%
0.5%
1.0%
1.5%
2.0%
2.5%
2008 2009 2010 2011 2012 2013 2014
% o
f B
oar
d S
eat
s:
Dir
ect
ors
in t
he
ir 8
0s
Source: ISS QuickScore
Boardroom Refreshment: A Review of Trends at U.S. Firms
© 2015 ISS | Institutional Shareholder Services 11 of 12
Attributes of New Director Nominees
ISS examined the records of approximately 11,700 new board appointments (i.e. where nominee tenure was equal to zero) across all the indexes reviewed during the period 2008 to 2014. Close to 98 percent of these new nominees were unique individuals, suggesting that the overwhelming majority of new directors were appointed to single board at the time of their nomination.
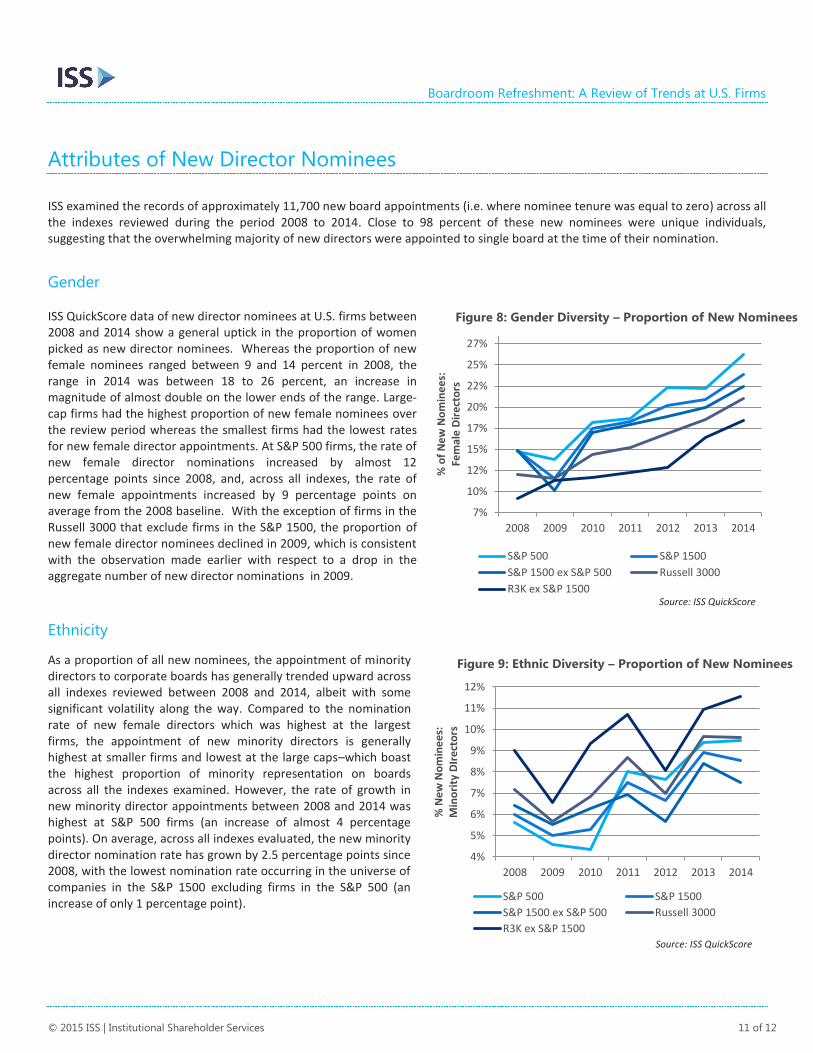
Gender ISS QuickScore data of new director nominees at U.S. firms between 2008 and 2014 show a general uptick in the proportion of women picked as new director nominees. Whereas the proportion of new female nominees ranged between 9 and 14 percent in 2008, the range in 2014 was between 18 to 26 percent, an increase in magnitude of almost double on the lower ends of the range. Large-cap firms had the highest proportion of new female nominees over the review period whereas the smallest firms had the lowest rates for new female director appointments. At S&P 500 firms, the rate of new female director nominations increased by almost 12 percentage points since 2008, and, across all indexes, the rate of new female appointments increased by 9 percentage points on average from the 2008 baseline. With the exception of firms in the Russell 3000 that exclude firms in the S&P 1500, the proportion of new female director nominees declined in 2009, which is consistent with the observation made earlier with respect to a drop in the aggregate number of new director nominations in 2009.
Ethnicity
As a proportion of all new nominees, the appointment of minority directors to corporate boards has generally trended upward across all indexes reviewed between 2008 and 2014, albeit with some significant volatility along the way. Compared to the nomination rate of new female directors which was highest at the largest firms, the appointment of new minority directors is generally highest at smaller firms and lowest at the large caps–which boast the highest proportion of minority representation on boards across all the indexes examined. However, the rate of growth in new minority director appointments between 2008 and 2014 was highest at S&P 500 firms (an increase of almost 4 percentage points). On average, across all indexes evaluated, the new minority director nomination rate has grown by 2.5 percentage points since 2008, with the lowest nomination rate occurring in the universe of companies in the S&P 1500 excluding firms in the S&P 500 (an increase of only 1 percentage point).
7%
10%
12%
15%
17%
20%
22%
25%
27%
2008 2009 2010 2011 2012 2013 2014
% o
f N
ew
No
min
ee
s:
Fem
ale
Dir
ect
ors
S&P 500 S&P 1500
S&P 1500 ex S&P 500 Russell 3000
R3K ex S&P 1500
4%
5%
6%
7%
8%
9%
10%
11%
12%
2008 2009 2010 2011 2012 2013 2014
% N
ew
No
min
ee
s:
Min
ori
ty D
Ire
cto
rs
S&P 500 S&P 1500
S&P 1500 ex S&P 500 Russell 3000
R3K ex S&P 1500
Figure 8: Gender Diversity – Proportion of New Nominees
Figure 9: Ethnic Diversity – Proportion of New Nominees
Source: ISS QuickScore
Source: ISS QuickScore
Boardroom Refreshment: A Review of Trends at U.S. Firms
© 2015 ISS | Institutional Shareholder Services 12 of 12
Age
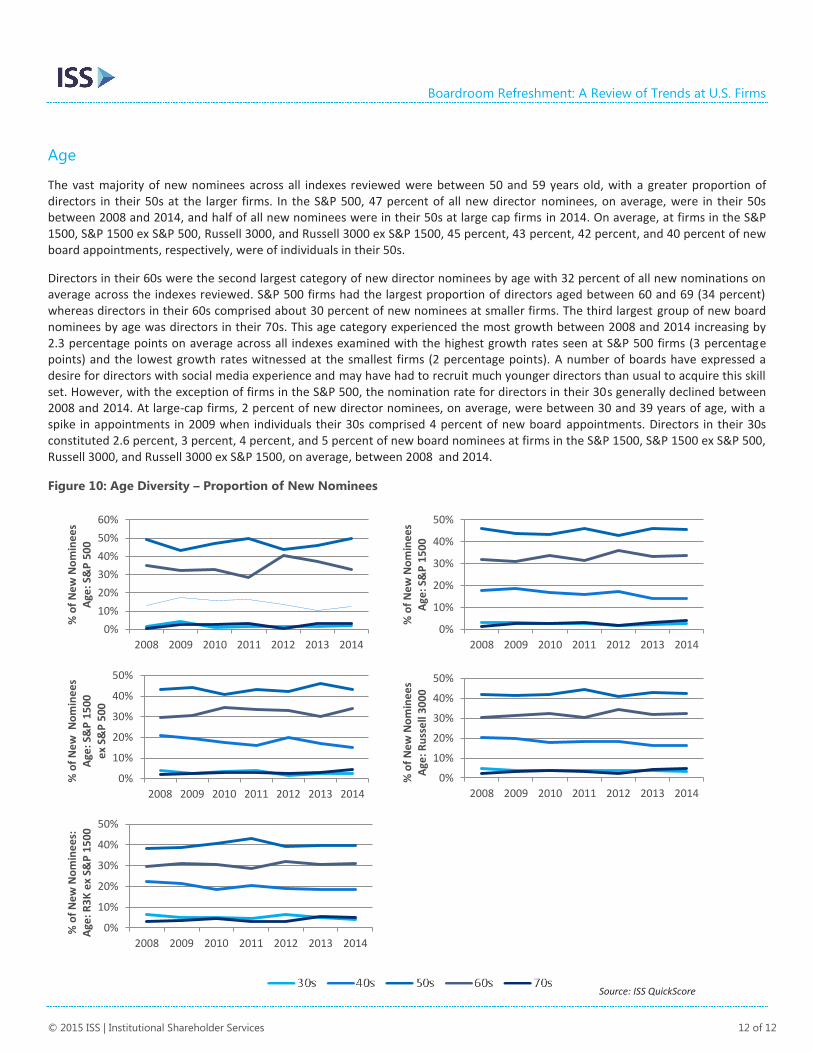
The vast majority of new nominees across all indexes reviewed were between 50 and 59 years old, with a greater proportion of directors in their 50s at the larger firms. In the S&P 500, 47 percent of all new director nominees, on average, were in their 50s between 2008 and 2014, and half of all new nominees were in their 50s at large cap firms in 2014. On average, at firms in the S&P 1500, S&P 1500 ex S&P 500, Russell 3000, and Russell 3000 ex S&P 1500, 45 percent, 43 percent, 42 percent, and 40 percent of new board appointments, respectively, were of individuals in their 50s.
Directors in their 60s were the second largest category of new director nominees by age with 32 percent of all new nominations on average across the indexes reviewed. S&P 500 firms had the largest proportion of directors aged between 60 and 69 (34 percent) whereas directors in their 60s comprised about 30 percent of new nominees at smaller firms. The third largest group of new board nominees by age was directors in their 70s. This age category experienced the most growth between 2008 and 2014 increasing by 2.3 percentage points on average across all indexes examined with the highest growth rates seen at S&P 500 firms (3 percentage points) and the lowest growth rates witnessed at the smallest firms (2 percentage points). A number of boards have expressed a desire for directors with social media experience and may have had to recruit much younger directors than usual to acquire this skill set. However, with the exception of firms in the S&P 500, the nomination rate for directors in their 30s generally declined between 2008 and 2014. At large-cap firms, 2 percent of new director nominees, on average, were between 30 and 39 years of age, with a spike in appointments in 2009 when individuals their 30s comprised 4 percent of new board appointments. Directors in their 30s constituted 2.6 percent, 3 percent, 4 percent, and 5 percent of new board nominees at firms in the S&P 1500, S&P 1500 ex S&P 500, Russell 3000, and Russell 3000 ex S&P 1500, on average, between 2008 and 2014.
Figure 10: Age Diversity – Proportion of New Nominees
0%
10%
20%
30%
40%
50%
60%
2008 2009 2010 2011 2012 2013 2014
% o
f N
ew
No
min
ee
s A
ge: S
&P
50
0
0%
10%
20%
30%
40%
50%
2008 2009 2010 2011 2012 2013 2014
% o
f N
ew
No
min
ee
s A
ge: S
&P
15
00
0%
10%
20%
30%
40%
50%
2008 2009 2010 2011 2012 2013 2014
% o
f N
ew
No
min
ee
s A
ge: S
&P
15
00
e
x S&
P 5
00
0%
10%
20%
30%
40%
50%
2008 2009 2010 2011 2012 2013 2014
% o
f N
ew
No
min
ee
s A
ge: R
uss
ell
30
00
0%
10%
20%
30%
40%
50%
2008 2009 2010 2011 2012 2013 2014
% o
f N
ew
No
min
ee
s:
Age
: R3
K e
x S&
P 1
50
0
Source: ISS QuickScore