Embed Size (px)
Citation preview
The Role of Transportation Networking Companies in
Megaregion Mobility
PI: Junfeng Jiao,
Co-PI: Erick Guerra, Qisheng Pan
GRA: Chris Bischak and Yefu Chen
December 2019
A publication of the USDOT Tier 1 Center:
Cooperative Mobility for Competitive Megaregions
At the University of Texas at Austin

DISCLAIMER: The contents of this report reflect the views of the authors, who are
responsible for the facts and the accuracy of the information presented herein. This
document is disseminated in the interest of information exchange. The report is funded,
partially or entirely, by a grant from the U.S. Department of Transportation’s University
Transportation Centers Program. However, the U.S. Government assumes no liability
for the contents or use thereof.
1
Technical Report Documentation Page
1. Report No. CM2- #38 2. Government
Accession No.
3. Recipient’s Catalog No.
ORCID: /0000-0002-7272-
8805
4. Title and Subtitle
The Role of Transportation Networking Companies in
Megaregion Mobility
5. Report Date:
December 2019
6. Performing Organization Code
7. Author(s) Junfeng Jiao, Chris Bischak, Yefu Chen,
Erick Guerra, Qisheng Pan
8. Performing Organization Report No.
CM2-#38
9. Performing Organization Name and Address
The University of Texas at Austin
School of Architecture
310 Inner Campus Drive, B7500
Austin, TX 78712
10. Work Unit No. (TRAIS)
11. Contract or Grant No.
USDOT 69A3551747135
12. Sponsoring Agency Name and Address
U.S. Department of Transportation
Federal Transit Administration
Office of the Assistant Secretary for Research and
Technology, UTC Program
1200 New Jersey Avenue, SE
Washington, DC 20590
13. Type of Report and Period Covered
Technical Report conducted: Sep 2018-
Sep 2019
14. Sponsoring Agency Code
15. Supplementary Notes
Project performed under a grant from the U.S. Department of Transportation’s University
Transportation Center’s Program.
16. Abstract
Transportation Network Companies (TNCs) like Uber and Lyft have become popular forms of
transportation in recent years. Researchers have worked to understand the qualitative impacts of
these services, such as effects on the taxi industry, spatial and temporal distribution in cities, and
effects on public transit; however, few studies have examined user attitudes towards TNCs and
differences between heavy and lighter users of these. Additionally, few studies attempted the
segmentation of users. To fill these research gaps, we conducted a megaregional survey of TNC
users in the Texas Triangle Megaregion. Results indicated that most users who are motivated by the
convenience of service take TNCs a few times a week or less. Those who take TNCs more regularly
do so mainly for commuting purposes. Result also pointed out that these more frequent users are
wealthier and are better educated.
17. Key Words
Transportation Network Company
(TNC), Texas Triangle Megaregion
18. Distribution Statement
No restrictions.
19. Security Classify. (of
report) Unclassified
20. Security Classify. (of this page)
Unclassified
21. No. of
pages
20
22. Price
Form DOT F 1700.7 (8-72) Reproduction of completed page authorized

2
Acknowledgements
The authors are grateful to all those who supported this work. They especially wish to thank Dr.
Ming Zhang and Ms. Inessa Ach.
3
Table of Contents (this can populate automatically with
“CM2” formatting styles)
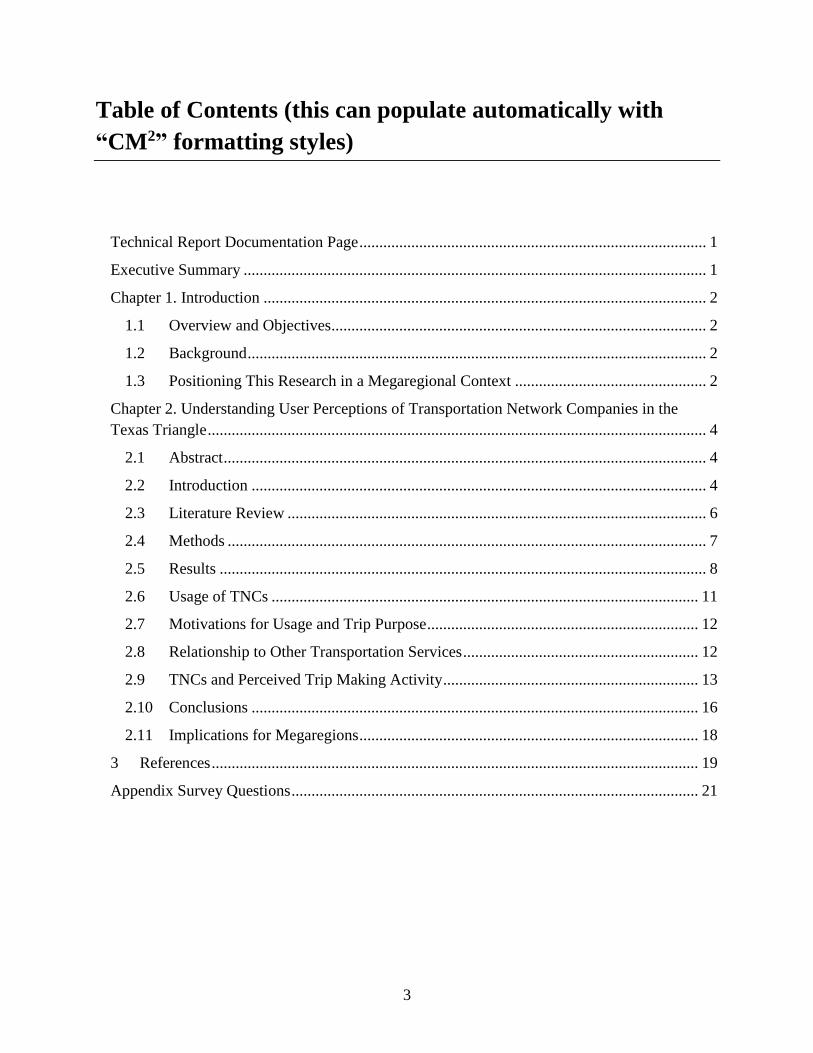
Technical Report Documentation Page ....................................................................................... 1
Executive Summary .................................................................................................................... 1
Chapter 1. Introduction ............................................................................................................... 2
1.1 Overview and Objectives .............................................................................................. 2
1.2 Background ................................................................................................................... 2
1.3 Positioning This Research in a Megaregional Context ................................................ 2
Chapter 2. Understanding User Perceptions of Transportation Network Companies in the
Texas Triangle ............................................................................................................................. 4
2.1 Abstract ......................................................................................................................... 4
2.2 Introduction .................................................................................................................. 4
2.3 Literature Review ......................................................................................................... 6
2.4 Methods ........................................................................................................................ 7
2.5 Results .......................................................................................................................... 8
2.6 Usage of TNCs ........................................................................................................... 11
2.7 Motivations for Usage and Trip Purpose .................................................................... 12
2.8 Relationship to Other Transportation Services ........................................................... 12
2.9 TNCs and Perceived Trip Making Activity ................................................................ 13
2.10 Conclusions ................................................................................................................ 16
2.11 Implications for Megaregions ..................................................................................... 18
3 References .......................................................................................................................... 19
Appendix Survey Questions ...................................................................................................... 21
1
Executive Summary
Transportation Network Companies (TNCs) like Uber and Lyft have become popular forms of
transportation in recent years. Researchers have worked to understand the qualitative impacts of
these services, such as effects on the taxi industry, spatial and temporal distribution in cities, and
effects on public transit; however, few studies have examined user attitudes towards TNCs and
differences between heavy and lighter users of these. Additionally, few studies attempted the
segmentation of users. To fill these research gaps, we conducted a megaregional survey of TNC
users in the Texas Triangle Megaregion. Results indicated that most users who are motivated by
the convenience of service take TNCs a few times a week or less. Those who take TNCs more
regularly do so mainly for commuting purposes. Result also pointed out that these more frequent
users are wealthier and are better educated.
Dr. Junfeng Jiao led the project and designed the survey. Dr. Guerra and Dr. Pan assisted project
design and survey. Mr. Bischak and Ms. Hyden analyzed the data and drafted the report. Mr. Chen
assisted report drafting.
2
Chapter 1. Introduction
1.1 Overview and Objectives
This research stemmed from the desire to better understand the more qualitative aspects of
Transportation Network Company (TNC) usage. The aim was to gain some insight into why people
utilize TNCs, how they value TNCs, and how they judge TNCs in relation to similar options such
as conventional taxis and public transport. To that end, we conducted a large-scale survey of TNC
users in the Texas Triangle Megaregion (Figure 1). This report proceeds as follows. First, in
Chapter 1, we situate this research in the broader context of transportation planning and
megaregional planning more specifically. Next, in Chapter 2, we detail our methods and overall
findings. Then Chapter 3 discusses the implications of findings for urban planning. Finally, in the
appendix, we provide a copy of our survey and other supplemental information.
1.2 Background
Since their inception, roughly around 2008, Uber and Lyft have achieved significant
market penetration. According to the Pew Research Center nationwide survey, slightly more than
one-third (36 percent) of U.S adults have used a TNC service (Jiang, 2019); however, TNCs’
increasing popularity has presented cities with numerous challenges ranging from regulatory issues
to congestion issues (Flores & Rayle, 2017; Schaller, 2018).
Within this context, researchers and policymakers have sought to understand how these
services are functioning, mostly in a quantitative sense (a detailed overview of the current literature
is presented in Chapter 2), but few studies have addressed one of the more critical questions about
TNCs, namely why people are choosing to use them over other forms of transportation.
Understanding why people prefer these types of services to other, potentially competing
services, like conventional taxis or public transit is critical for urban planning and policy. If the
value of these services and user perceptions of these services can be understood, planners and
policy makers can better understand where existing transport services are failing to meet user needs.
1.3 Positioning This Research in a Megaregional Context
Understanding how user value and perceive TNC service is not just valuable for planning
at the city level, it is also important for planning at the megaregional scale. Within megaregional
3
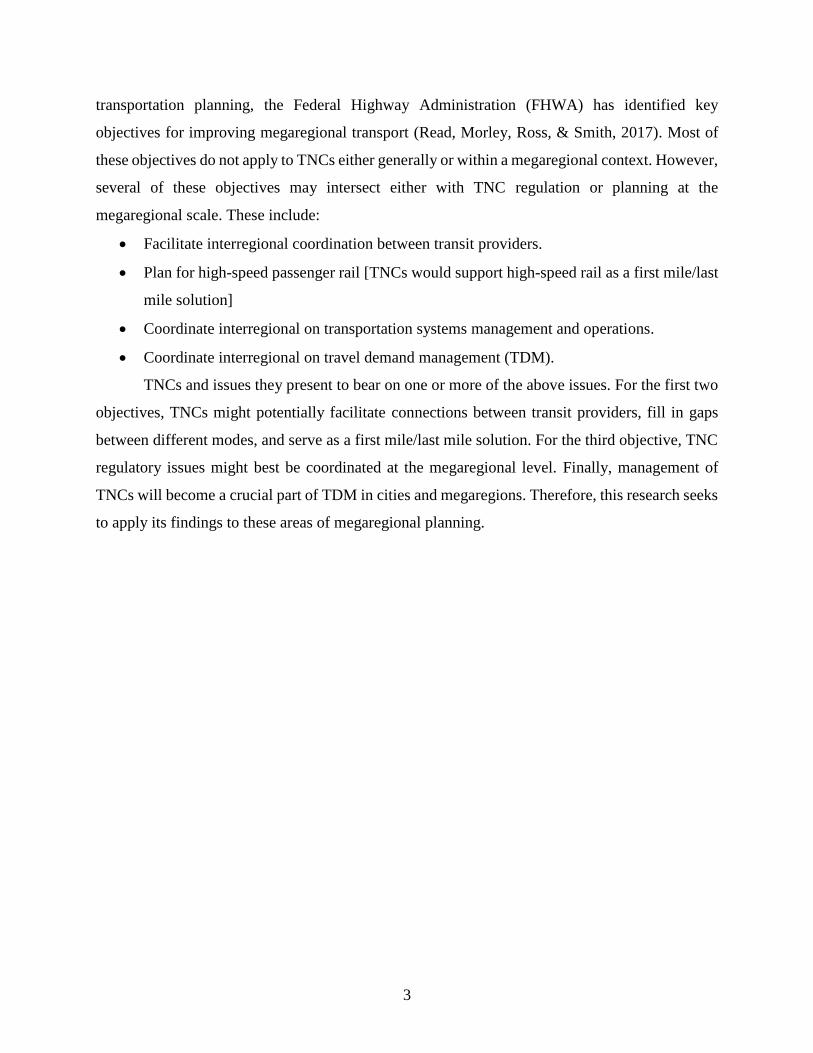
transportation planning, the Federal Highway Administration (FHWA) has identified key
objectives for improving megaregional transport (Read, Morley, Ross, & Smith, 2017). Most of
these objectives do not apply to TNCs either generally or within a megaregional context. However,
several of these objectives may intersect either with TNC regulation or planning at the
megaregional scale. These include:
Facilitate interregional coordination between transit providers.
Plan for high-speed passenger rail [TNCs would support high-speed rail as a first mile/last
mile solution]
Coordinate interregional on transportation systems management and operations.
Coordinate interregional on travel demand management (TDM).
TNCs and issues they present to bear on one or more of the above issues. For the first two
objectives, TNCs might potentially facilitate connections between transit providers, fill in gaps
between different modes, and serve as a first mile/last mile solution. For the third objective, TNC
regulatory issues might best be coordinated at the megaregional level. Finally, management of
TNCs will become a crucial part of TDM in cities and megaregions. Therefore, this research seeks
to apply its findings to these areas of megaregional planning.
4
Chapter 2. Transportation Network Companies to TNCs
2.1 Abstract
Transportation Network Companies (TNCs) have become popular in recent years because of their
ease of use and relative cost-efficiency; however, these services are significantly under-researched
from the perspective of what user value and how they perceive these services. Additionally, there
has been little academic research on the differences between heavy users of these services and
more regular users of these services. We surveyed 1000 users in the Texas Triangle (Austin, Dallas,
Houston, and San Antonio) to help answer these questions. We found that most users of these
services are using them intermittently, on weekends, and to travel for leisure purposes. Heavy users,
however, are far more likely to use them to commute, to connect to public transport, and to use
these services on weekdays. Heavy users also tended to be wealthier and better educated. This
research is one of the first studies that reveal different TNC user groups and their usage differences.
It also contributes to the literature of users’ perceptions on TNCs.
2.2 Introduction
In recent years, Transportation Network Companies (TNCs) have disrupted long-stable
urban transportation markets (Berger, Chen, & Frey, 2018; Cramer & Krueger, 2016; Hampshire,
Simek, Fabusuyi, Di, & Chen, 2017). At the intersection of technological advancement, the
ubiquity of internet access, and increasing urbanization, TNC usage has snowballed since the
introductions around 2008. These services allow for the arrangement of rides between drivers,
offering the use of their vehicles for fares set by third-party providers, and riders (National
Association of Insurance Companies, 2019). Platforms such as Uber and Lyft allow users to track
the location of their drivers, see the route to be taken, and pay online through a connected credit
card. On their own, TNCs symbolize critical characteristics of modern society – integration of
technology into daily tasks, the priority that automobiles have in urban life, and the prevalence of
freelance work.
TNCs have presented cities with both significant challenges and tremendous opportunities.
On the one hand, they are providing users a convenient and relatively cost-effective to move
around urban areas, which is especially true for areas further from the Central Business District,
where public transport and conventional taxis are least available, and on-demand ride services like
5
TNCs are more competitive (Schwieterman, 2019). TNCs, however, have also been controversial
and presented cities with numerous challenges. Critics charge that TNCs are causing more
congestion, are primarily used by a young, privileged, urban elite, and represent a dystopian future
for labor where all workers are contracted without traditional employment benefits (Mulholland,
2016; Schaller, 2018).
Despite the intense debate surrounding TNCs, limited studies have focused on these
services. Part of this is because it is hard to obtain data on TNC activities due to the companies
themselves being reluctant to share it. Much of the research on TNCs have relied on web scrapping
or even first-hand usage of TNCs themselves to obtain data (SFCTA, 2017; Henao & Marshall,
2018). However, the relative newness of TNCs has also meant that much research has not been
conducted. This further complicates things for cities, as reliable data and a solid understanding of
all stakeholders in urban transportation are necessary to craft sound policy and regulation. By
gaining a clearer understanding of what these services are offering users and how individuals use
them, policymakers and planners can better regulate them to maximize their benefits while
minimizing their negative externalities such as increased traffic or safety concerns. Additionally,
one central aspect of understanding the growth of TNCs is the user perception of these services.
They have proven quite popular, a trend that is interesting because conventional taxis offer a
similar service to consumers.
This paper aims to fill the knowledge gaps around users’ perceptions of TNCs. We use a
survey-based approach to understand TNC users in the four largest MSAs in Texas: Dallas,
Houston, San Antonio, and Austin. A survey-based approach to TNC research has been used in
numerous ways, such as investigating the comparison between ridesharing and other forms of
shared transit (Rayle et al., 2015). Others have surveyed to determine motivations for use, allowing
for modeling the perceived usefulness of ridesharing apps and the role that consumer agency and
choice play in the success of TNCs (Zhu, Fung So, & Hudson 2016). Few studies, however, have
explicitly examined how users are valuing these services, especially compared to conventional
taxis and public transport. This study makes an original contribution by explicitly looking at user
values and habits with regards to TNCs in Texas.
Additionally, this study makes a further and significant contribution in that we use our
survey data to assess how TNC usage varies among different types of users. There may be
differences among different types of users. To examine these distinctions, we segment our findings
6
based on gender, income, age, and user frequency (heavy vs. ‘regular’ users), to better understand
how different types of users are taking advantage of these services. This paper proceeds in the
following manner. First, we present a literature review of research on TNCs, with a particular
emphasis on perceptions of TNCs and other survey-based work on TNCs. Then we detail our
methods, followed by a descriptive analysis of our results. We then present our analysis of our
findings segmented by gender, income, usage status, and age. Lastly, we discuss the implications
of our research concerning both policy and planning practice.
2.3 Literature Review
The majority of TNC research typically looked at their impacts on other transport modes
(e.g. bus, taxi) and urban environments overall. For example, studies have extensively examined
how TNCs are impacting existing taxi markets, how TNCs are affecting traffic, where TNC usage
takes place etc. But this literature review focuses on the two issues of research most germane to
this study namely how users perceive TNCs and TNCs compare to public transit and conventional
taxis.
First, many researchers have examined TNCs in contrast to other shared transportation
services such as public transit and taxis. When measuring how riders evaluate their choice to use
TNCs, many studies have found that users view ridesharing apps as a more convenient way to
navigate around cities compared to other options (Rayle et al 2015; Nie 2017). Pew Research
Center has identified an overwhelmingly positive view among TNC users as well. Based on their
gathered responses, TNCs offer a more convenient option for those who have limited mobility or
trouble accessing public transit, as more cost-effective than taxis, and as overall stress-reducers in
commutes (Smith 2016). Though this data reflects the opinions of people who already choose to
use these services, and thus may be skewed more positive than average, it offers insight that reveals
patterns in the factors that cause people to choose TNCs.
Compared to public transit, the greater perceived choice and convenience that these P2P
options offer, are major factors that draws riders to use TNC services (Zhu, Fung So, & Hudson,
2016). In this way, there is a significant difference between TNC and public transit. Transit is
managed top-down by an entity such as transit agencies and thus requires riders to conform to the
structure of the transit whereas TNCs conform to the users’ desires. Therefore, consumers view
7
TNCs as providing them more freedom of choice (Wolfson & Tavor, 2018). This element of choice
and self-determination is arguably a strong motivation for consumers, and many have identified
the greater agency that products within the sharing economy provide as a positive characteristic
(Bellotti et al., 2015; Hamari, Sjöklint, & Ukkonen, 2015; Zhu et al., 2016).
In terms of how users value TNCs, studies utilizing a variety of methodologies, including
demand data from TNCs and surveys, have yielded an understanding of typical user demographics
which is directly tied to how much demand users have for TNCs (Gerte, Konduri, & Eluru 2018;
Rayle et al 2015). More affluent populations that are likely to have access to smartphones and the
internet have easier necessary access to TNC platforms, which likely influences the accessibility
of these platforms. Users that are drawn to these services also tend to be younger, often more so
than the average taxi or transit user in respective cities (Rayle et al, 2015). TNC users are also
more educated, a finding that is replicated across studies (Gerte, Konduri, & Eluru 2018; Rayle et
al 2015; Smith 2016). Many riders surveyed by Rayle et al (2015) reported having personal
vehicles at home, and thus their decision to utilize a TNC was often not motivated by necessity or
dependence.
2.4 Methods
Based on the above literature review we concluded that research into users’ perception
about TNCs is sparse and no studies have explored the differences between heavy and lighter TNC
users. Thus, we developed a 20 questions survey that aimed to answer how users make use of
TNCs, what their motivations for using TNCs are, and how users perceive TNCs as compared to
taxis and public transport.
We then distributed this sample survey to students at the University of Texas at Austin by
group-emailing. The purpose of this survey was to test the validity and clarity of the survey
questions and design. This sample survey generated over 300 responses. We also shared the sample
survey among selected transportation researchers to get their feedback on questions. These results
were then used to inform the design of a final survey. Based on the feedback, some questions in
the final survey were changed, and a few of the questions were cut as they were unclear.
The professional survey firm QuestionPro conducted the second online survey. The survey
population was drawn from QuestionPro’s 4 million eligible panelists in the United States
8
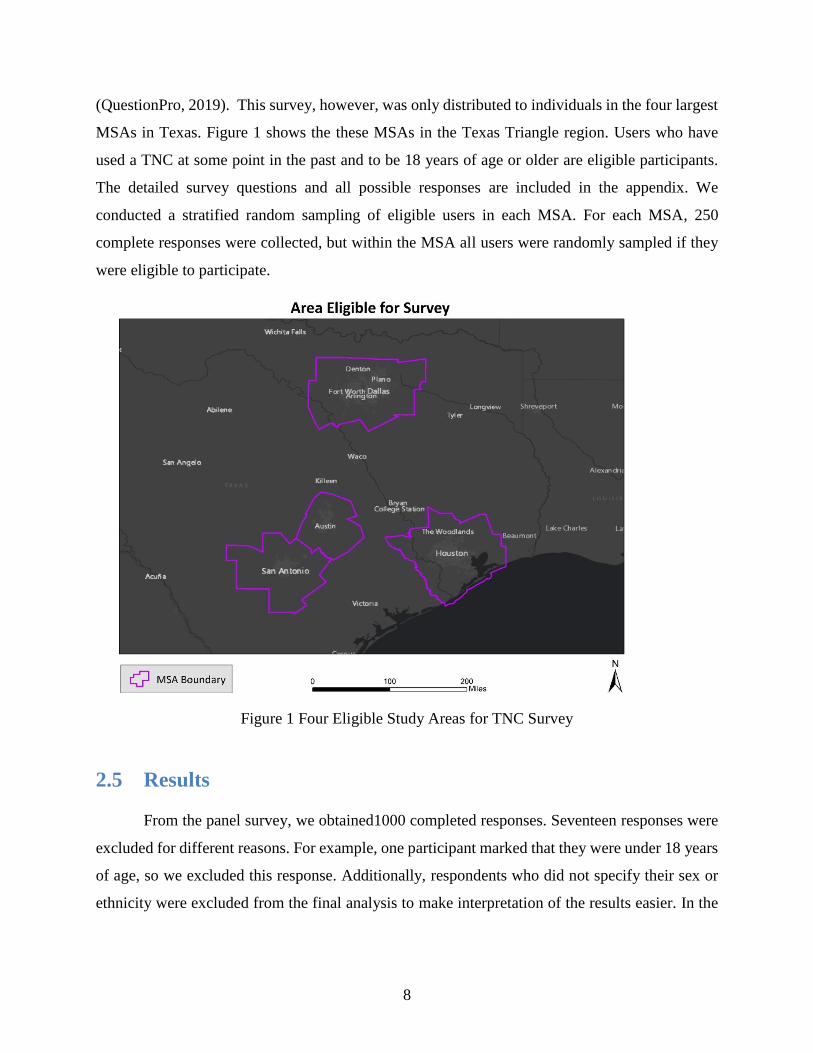
(QuestionPro, 2019). This survey, however, was only distributed to individuals in the four largest
MSAs in Texas. Figure 1 shows the these MSAs in the Texas Triangle region. Users who have
used a TNC at some point in the past and to be 18 years of age or older are eligible participants.
The detailed survey questions and all possible responses are included in the appendix. We
conducted a stratified random sampling of eligible users in each MSA. For each MSA, 250
complete responses were collected, but within the MSA all users were randomly sampled if they
were eligible to participate.
Figure 1 Four Eligible Study Areas for TNC Survey
2.5 Results
From the panel survey, we obtained1000 completed responses. Seventeen responses were
excluded for different reasons. For example, one participant marked that they were under 18 years
of age, so we excluded this response. Additionally, respondents who did not specify their sex or
ethnicity were excluded from the final analysis to make interpretation of the results easier. In the
9
end 983 valid samples were included in the analysis. Detailed questions of the final survey were
presented in the Appendix.
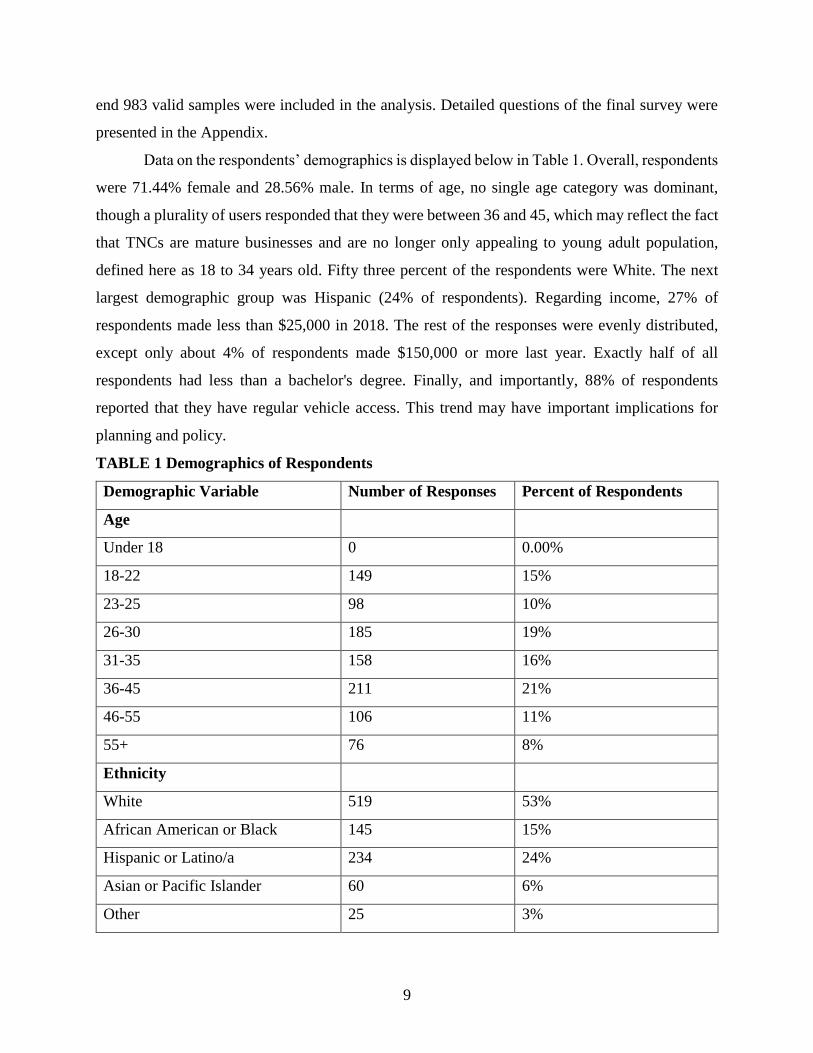
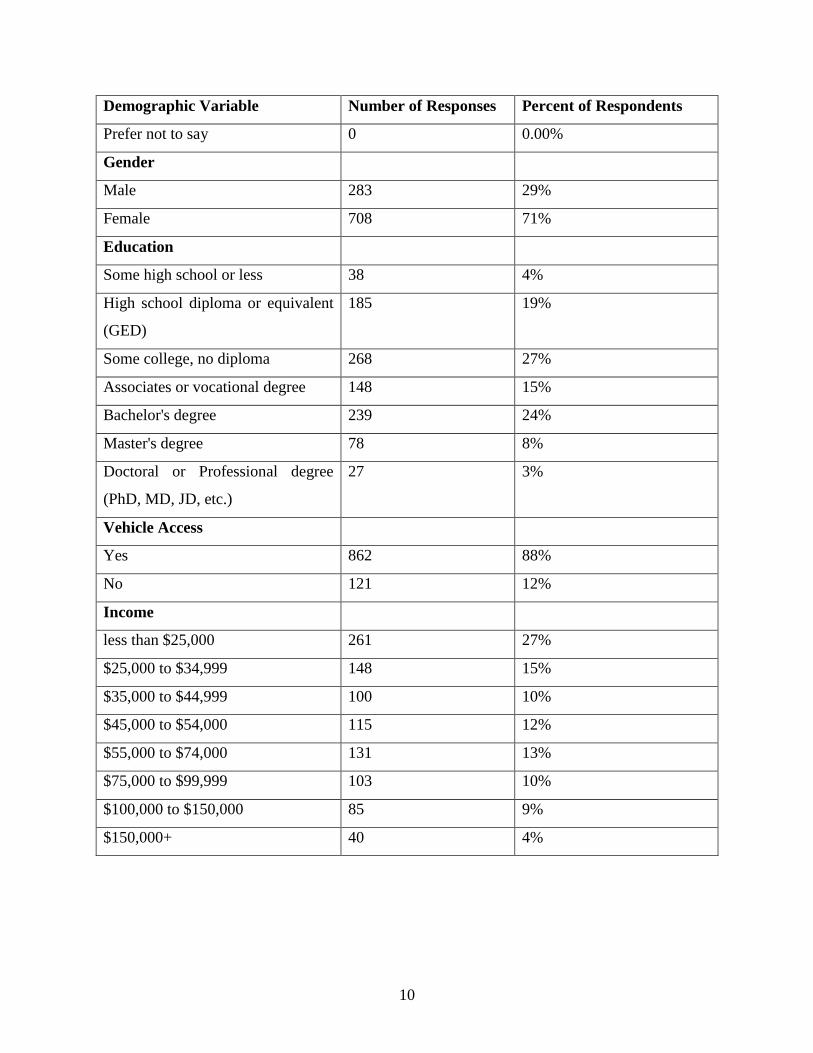
Data on the respondents’ demographics is displayed below in Table 1. Overall, respondents
were 71.44% female and 28.56% male. In terms of age, no single age category was dominant,
though a plurality of users responded that they were between 36 and 45, which may reflect the fact
that TNCs are mature businesses and are no longer only appealing to young adult population,
defined here as 18 to 34 years old. Fifty three percent of the respondents were White. The next
largest demographic group was Hispanic (24% of respondents). Regarding income, 27% of
respondents made less than $25,000 in 2018. The rest of the responses were evenly distributed,
except only about 4% of respondents made $150,000 or more last year. Exactly half of all
respondents had less than a bachelor's degree. Finally, and importantly, 88% of respondents
reported that they have regular vehicle access. This trend may have important implications for
planning and policy.
TABLE 1 Demographics of Respondents
Demographic Variable Number of Responses Percent of Respondents
Age
Under 18 0 0.00%
18-22 149 15%
23-25 98 10%
26-30 185 19%
31-35 158 16%
36-45 211 21%
46-55 106 11%
55+ 76 8%
Ethnicity
White 519 53%
African American or Black 145 15%
Hispanic or Latino/a 234 24%
Asian or Pacific Islander 60 6%
Other 25 3%
10
Demographic Variable Number of Responses Percent of Respondents
Prefer not to say 0 0.00%
Gender
Male 283 29%
Female 708 71%
Education
Some high school or less 38 4%
High school diploma or equivalent
(GED)
185 19%
Some college, no diploma 268 27%
Associates or vocational degree 148 15%
Bachelor's degree 239 24%
Master's degree 78 8%
Doctoral or Professional degree
(PhD, MD, JD, etc.)
27 3%
Vehicle Access
Yes 862 88%
No 121 12%
Income
less than $25,000 261 27%
$25,000 to $34,999 148 15%
$35,000 to $44,999 100 10%
$45,000 to $54,000 115 12%
$55,000 to $74,000 131 13%
$75,000 to $99,999 103 10%
$100,000 to $150,000 85 9%
$150,000+ 40 4%
11
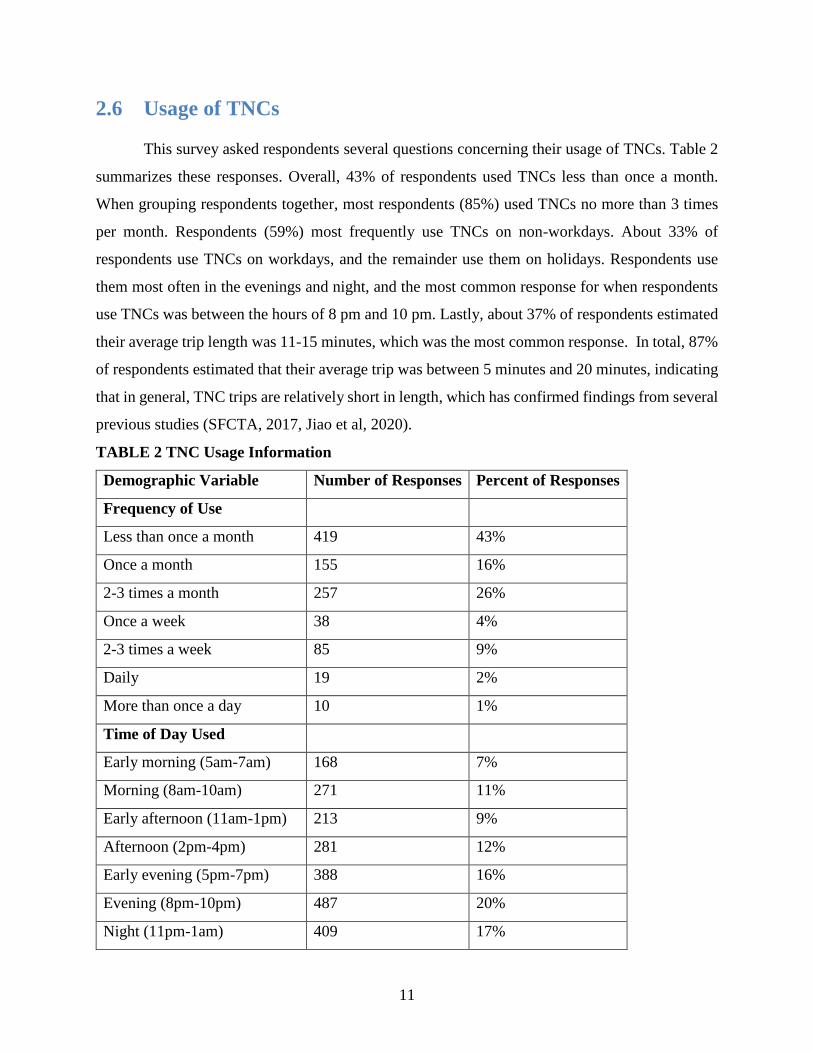
2.6 Usage of TNCs
This survey asked respondents several questions concerning their usage of TNCs. Table 2
summarizes these responses. Overall, 43% of respondents used TNCs less than once a month.
When grouping respondents together, most respondents (85%) used TNCs no more than 3 times
per month. Respondents (59%) most frequently use TNCs on non-workdays. About 33% of
respondents use TNCs on workdays, and the remainder use them on holidays. Respondents use
them most often in the evenings and night, and the most common response for when respondents
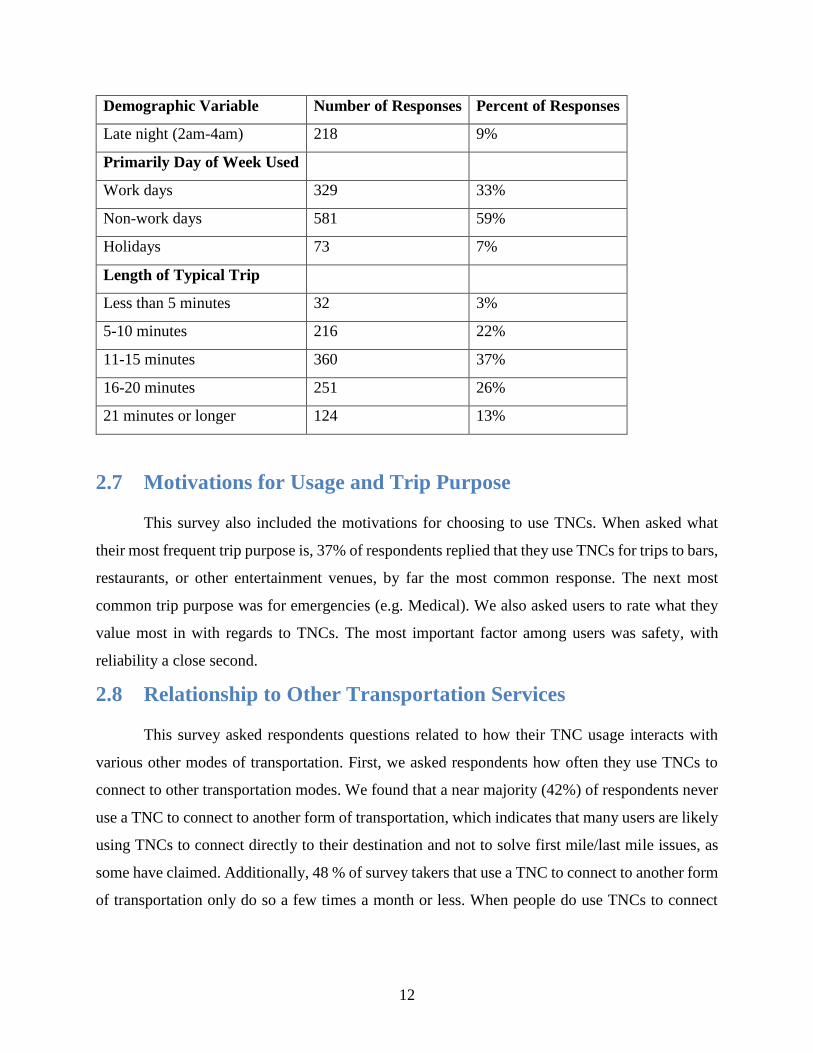
use TNCs was between the hours of 8 pm and 10 pm. Lastly, about 37% of respondents estimated
their average trip length was 11-15 minutes, which was the most common response. In total, 87%
of respondents estimated that their average trip was between 5 minutes and 20 minutes, indicating
that in general, TNC trips are relatively short in length, which has confirmed findings from several
previous studies (SFCTA, 2017, Jiao et al, 2020).
TABLE 2 TNC Usage Information
Demographic Variable Number of Responses Percent of Responses
Frequency of Use
Less than once a month 419 43%
Once a month 155 16%
2-3 times a month 257 26%
Once a week 38 4%
2-3 times a week 85 9%
Daily 19 2%
More than once a day 10 1%
Time of Day Used
Early morning (5am-7am) 168 7%
Morning (8am-10am) 271 11%
Early afternoon (11am-1pm) 213 9%
Afternoon (2pm-4pm) 281 12%
Early evening (5pm-7pm) 388 16%
Evening (8pm-10pm) 487 20%
Night (11pm-1am) 409 17%
12
Demographic Variable Number of Responses Percent of Responses
Late night (2am-4am) 218 9%
Primarily Day of Week Used
Work days 329 33%
Non-work days 581 59%
Holidays 73 7%
Length of Typical Trip
Less than 5 minutes 32 3%
5-10 minutes 216 22%
11-15 minutes 360 37%
16-20 minutes 251 26%
21 minutes or longer 124 13%
2.7 Motivations for Usage and Trip Purpose
This survey also included the motivations for choosing to use TNCs. When asked what
their most frequent trip purpose is, 37% of respondents replied that they use TNCs for trips to bars,
restaurants, or other entertainment venues, by far the most common response. The next most
common trip purpose was for emergencies (e.g. Medical). We also asked users to rate what they
value most in with regards to TNCs. The most important factor among users was safety, with
reliability a close second.
2.8 Relationship to Other Transportation Services
This survey asked respondents questions related to how their TNC usage interacts with
various other modes of transportation. First, we asked respondents how often they use TNCs to
connect to other transportation modes. We found that a near majority (42%) of respondents never
use a TNC to connect to another form of transportation, which indicates that many users are likely
using TNCs to connect directly to their destination and not to solve first mile/last mile issues, as
some have claimed. Additionally, 48 % of survey takers that use a TNC to connect to another form
of transportation only do so a few times a month or less. When people do use TNCs to connect
13
with other transport modes, many users (27%) use TNCs to connect the airport with bus stations
or parked personal vehicles.
Next, we asked respondents to compare TNCs to both conventional taxis and public
transport. A clear majority of people find that TNCs are more convenient than public transport,
with 79% of people choosing this option. The same is true of TNCs compared to conventional
taxis, with about 69% of people rating TNCs as more convenient than conventional taxis. About
28% of people consider TNCs more expensive than public transport, and about 40% of people
considered TNCs less expensive than conventional taxis. Finally, along the last dimension,
reliability, 28% of people consider TNCs more reliable than public transport, and 30% of people
consider them more reliable than conventional taxis.
2.9 TNCs and Perceived Trip Making Activity
Finally, we asked respondents to detail what they believed the relationship between their
usage of TNCs and their trip making habits to be. In total, 61% of respondents said that they
believed that TNCs were convenient for traveling. We also found that 48% of respondents believed
that they made more trips because of the availability of TNCs. Even though this merely self-
reported data, this finding suggests that there is significant induced demand because of TNCs.
To further contribute to our collective understanding of TNCs, we separated user survey
data by usage frequency. As discussed above, little if any research has been done looking at the
difference between heavy TNC users and more regular-frequency users. First, we developed a
classification scheme based on the frequency of usage among surveyed users and our intuition.
Most users (88%) of respondents use a TNC once a week or less. Thus, we classified a heavy user
as someone who used a TNC two times a week or more. While based strictly on the data, it might
be possible to argue that a heavy user is some who uses a TNC at least once a week, we opted to
include these people in the regular user category, which is because it would make sense intuitively
that using a TNC once a week, particularly on weekend nights, would be a regular use case for
many people that are not habitually heavy users. We found that that 88.5% of users were non-
heavy users, and 11.5% of users were heavy users. We then compared our survey results between
the two groups.
14
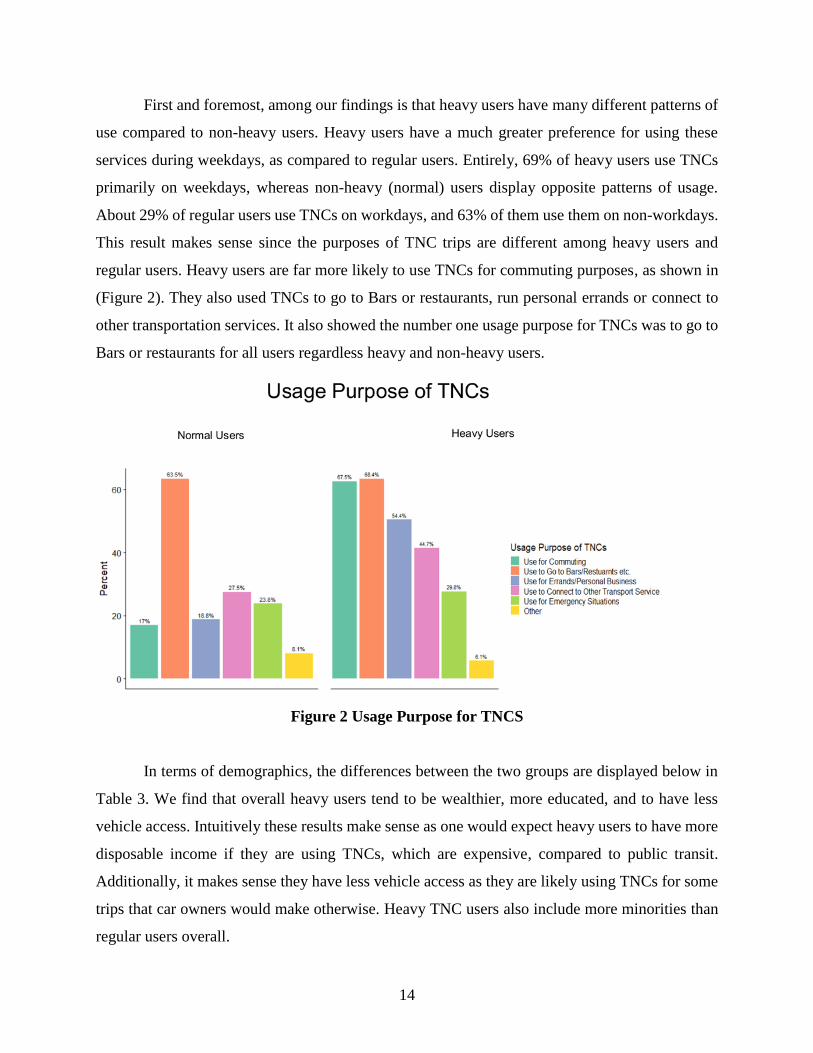
First and foremost, among our findings is that heavy users have many different patterns of
use compared to non-heavy users. Heavy users have a much greater preference for using these
services during weekdays, as compared to regular users. Entirely, 69% of heavy users use TNCs
primarily on weekdays, whereas non-heavy (normal) users display opposite patterns of usage.
About 29% of regular users use TNCs on workdays, and 63% of them use them on non-workdays.
This result makes sense since the purposes of TNC trips are different among heavy users and
regular users. Heavy users are far more likely to use TNCs for commuting purposes, as shown in
(Figure 2). They also used TNCs to go to Bars or restaurants, run personal errands or connect to
other transportation services. It also showed the number one usage purpose for TNCs was to go to
Bars or restaurants for all users regardless heavy and non-heavy users.
Figure 2 Usage Purpose for TNCS
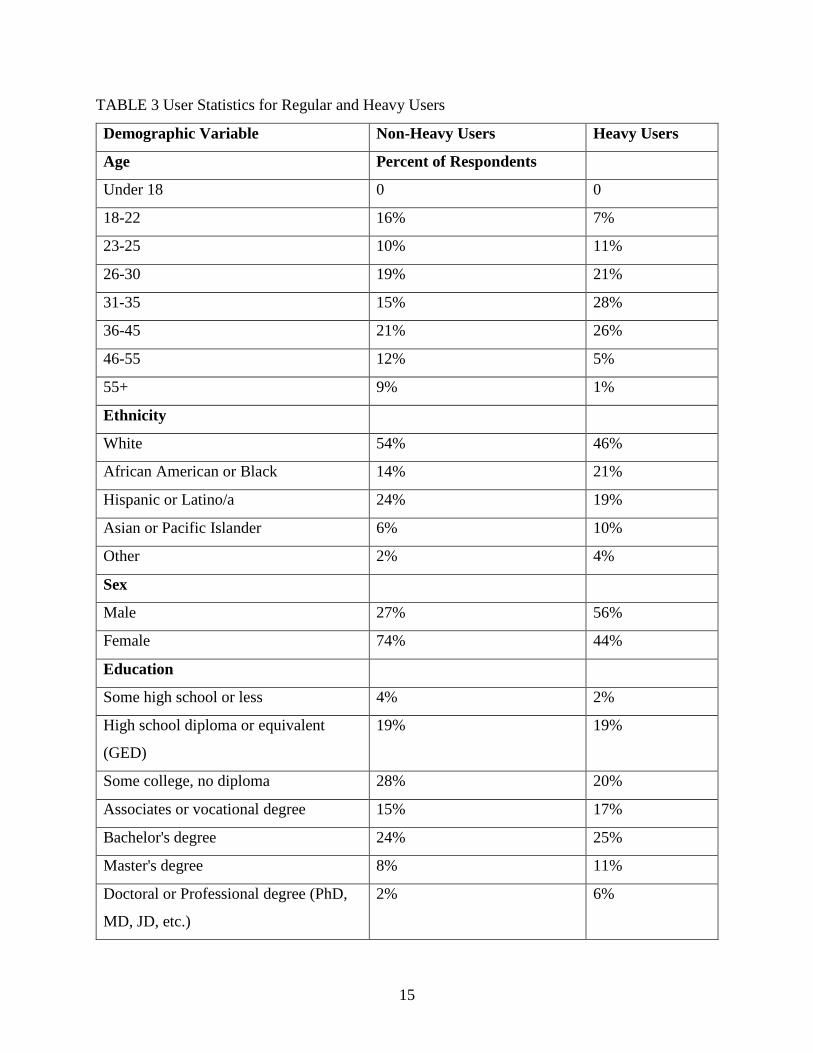
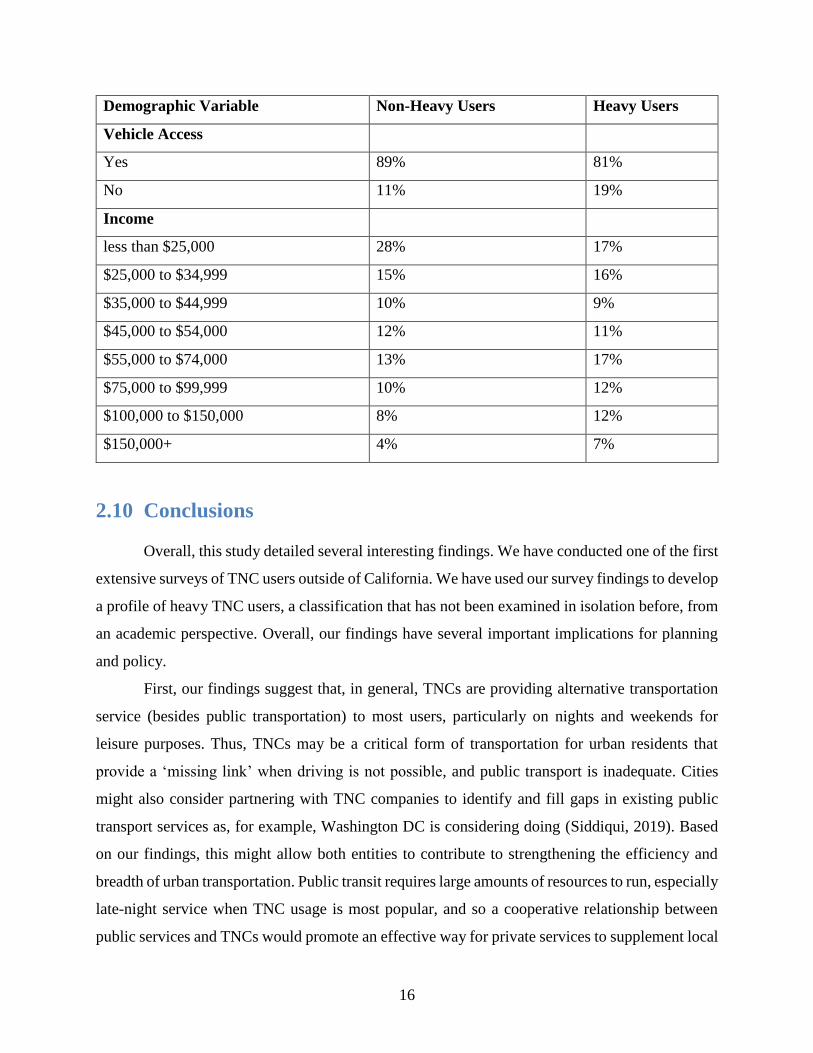
In terms of demographics, the differences between the two groups are displayed below in
Table 3. We find that overall heavy users tend to be wealthier, more educated, and to have less
vehicle access. Intuitively these results make sense as one would expect heavy users to have more
disposable income if they are using TNCs, which are expensive, compared to public transit.
Additionally, it makes sense they have less vehicle access as they are likely using TNCs for some
trips that car owners would make otherwise. Heavy TNC users also include more minorities than
regular users overall.
15
TABLE 3 User Statistics for Regular and Heavy Users
Demographic Variable Non-Heavy Users Heavy Users
Age Percent of Respondents
Under 18 0 0
18-22 16% 7%
23-25 10% 11%
26-30 19% 21%
31-35 15% 28%
36-45 21% 26%
46-55 12% 5%
55+ 9% 1%
Ethnicity
White 54% 46%
African American or Black 14% 21%
Hispanic or Latino/a 24% 19%
Asian or Pacific Islander 6% 10%
Other 2% 4%
Sex
Male 27% 56%
Female 74% 44%
Education
Some high school or less 4% 2%
High school diploma or equivalent
(GED)
19% 19%
Some college, no diploma 28% 20%
Associates or vocational degree 15% 17%
Bachelor's degree 24% 25%
Master's degree 8% 11%
Doctoral or Professional degree (PhD,
MD, JD, etc.)
2% 6%
16
Demographic Variable Non-Heavy Users Heavy Users
Vehicle Access
Yes 89% 81%
No 11% 19%
Income
less than $25,000 28% 17%
$25,000 to $34,999 15% 16%
$35,000 to $44,999 10% 9%
$45,000 to $54,000 12% 11%
$55,000 to $74,000 13% 17%
$75,000 to $99,999 10% 12%
$100,000 to $150,000 8% 12%
$150,000+ 4% 7%
2.10 Conclusions
Overall, this study detailed several interesting findings. We have conducted one of the first
extensive surveys of TNC users outside of California. We have used our survey findings to develop
a profile of heavy TNC users, a classification that has not been examined in isolation before, from
an academic perspective. Overall, our findings have several important implications for planning
and policy.
First, our findings suggest that, in general, TNCs are providing alternative transportation
service (besides public transportation) to most users, particularly on nights and weekends for
leisure purposes. Thus, TNCs may be a critical form of transportation for urban residents that
provide a ‘missing link’ when driving is not possible, and public transport is inadequate. Cities
might also consider partnering with TNC companies to identify and fill gaps in existing public
transport services as, for example, Washington DC is considering doing (Siddiqui, 2019). Based
on our findings, this might allow both entities to contribute to strengthening the efficiency and
breadth of urban transportation. Public transit requires large amounts of resources to run, especially
late-night service when TNC usage is most popular, and so a cooperative relationship between
public services and TNCs would promote an effective way for private services to supplement local
17
transit; however, our findings also suggest that there is a small group of people who are using
TNCs at high levels. These people, as outlined in the results section, are far more likely to use
TNCs to commute and to use them on weekdays, presumably integrating them into their regular
routines.
Additionally, our research raises some interesting questions and directions for further
research. It is worth investigating why heavy users are choosing to use TNCs for commuting
purposes, as TNCs are expensive on a cost per minute basis (Schwieterman, 2019). It would also
be worth examining what percent of overall TNC trips were generated by these heavy users, as
they may contribute to additional overall VMT. Cities and planning officials should better attempt
to understand why these people are using TNCs regularly instead of opting for more cost-effective
options like public transport.
The main challenge for cities and regulatory officials with regards to TNCs is how to
maximize their benefits while minimizing drawbacks. Cities need to understand why some people
are using TNCs, a more expensive options than public transit, for commute purpose. Policymakers
should help to maximize the number of people in each TNC vehicle, such as subsidizing shared
TNC rides and working with the TNC provider companies to encourage the usage of services like
UberPool and Lyft Line. Promoting these carpooling options can further minimize the congestion
TNCs often add. Cities should consider the fact that TNCs can provide valuable supplemental
service for public transit. TNCs can likely provide quick and relatively cheap service to people in
parts of the city or times of day when public transport is inadequate.
Overall, our study finds several things. TNCs are mostly being used for occasional travel,
on weekends, and for leisure-oriented trips, at least in Texas Triangle. They also are likely adding
more VMTs to the transport system in Texas and inducing travel, as nearly half of respondents
believe they make more trips because they have access to TNCs. Finally, a small group of heavy
users appear to be using TNCs for regular commuting, which does not appear to be the case with
most regular users. These heavy users present special issues for the management of TNCs in cities
and should be treated as a distinct group in further studies.
18
2.11 Implications for Megaregions
First, our primary finding with this study is that few people are regular users of TNCs, and
most people use them for leisure travel on weekends. This implies that TNCs are a sort of
supplemental urban transport service, very similar to taxis. Additionally, most of the trips (over
50%) were 20 minutes or less in length, which implies most trips are relatively local in nature.
Thus, TNCs are likely an alternative tool for linking major areas within megaregions.
Second, based on the above findings we see that most TNCs trip are unlinked leisure trips.
Thus, within this study context, TNCs might not be an effective first/last mile solution for public
transport services. Again, as mentioned above our results imply that TNCs are an alternative form
of transportation. Few people appear to be regularly using to connect to public transport or other
transportation services. Therefore, policymakers must consider how much they want to encourage
TNC travel if many of the trips are unlinked in nature. Additionally, policies should be crafted to
ensure that TNCs are providing this supplemental service in the most effective manner possible.
Third, from our survey we found that the vast majority of people (near 80% for some
questions) responded that TNCs were more convenient and/or more reliable than public transport.
This suggest that public transport is not adequate for much of the general public or at least many
people perceive public transit to be inadequate. Therefore, planners and policy makers should work
to better understand why public transport is not meeting users. Overall, this study provides some
useful insight into how people are utilizing TNCs, how they value TNCs compared to public
transportation and conventional taxis, and how heavy and light users compared to each other within
the Texas Triangle. Our study finds the most people use TNCs at night and for leisure purposes.
Heavy users are much more likely to use these services to connect to public transit or for
commuting purposes, however.
19
3 References
1. Bellotti, V., Turner, D., Ambard, A., & Gossman, C. (2015). A Muddle of Models of
Motivation for Using Peer-to-Peer Economy Systems. Retrieved October, 19,2019, from
ACM Digital Library
2. Cramer, J., & Krueger, A. B. (2016). Disruptive Change in the Taxi Business: The Case
of Uber, National Bureau of Economic Research, Working Paper 22083, Retrieved
October, 19,2019, from NBER Papers
3. Flores, O., & Rayle, L. (2017). How cities use regulation for innovation: The case of
Uber, Lyft and Sidecar in San Francisco. Transportation Research Procedia, 25, 3756–
3768. https://doi.org/10.1016/j.trpro.2017.05.232
4. Gerte, R., Konduri, K. C., & Eluru, N. (2018). Is There a Limit to Adoption of Dynamic
Ridesharing Systems? Evidence from Analysis of Uber Demand Data from New York
City. Transportation Research Record: Journal of the Transportation Research Board,
2672(42), 127–136.
5. Hall, J. D., Palsson, C., & Price, J. (2018). Is Uber a substitute or complement for public
transit? Journal of Urban Economics, 108, 36–50.
6. Hamari, J., Sjöklint, M., & Ukkonen, A. (2015). The sharing economy: Why people
participate in collaborative consumption Rochester, NY, Social Science Research
Network. Retrieved October, 19, 2019 from SSRN Papers
7. Henao, A., & Marshall, W. E. (2018). The Impact of Ride-Hailing on Vehicle Miles
Traveled. Transportation. Transportation Paper
8. Hughes, R., & MacKenzie, D. (2016). Transportation network company wait times in
Greater Seattle, and relationship to socioeconomic indicators. Journal of Transport
Geography, 56, 36–44. Science Direct
9. Jiang, J (2019). More Americans are using ride-hailing apps. Factank: News in the
Numbers, Pew Research Center, Retrieved October, 19,2019, from Pew Research Center
Paper
10. Jiao, J., Bischak, C., & Hyden, S., (2020), The impact of shared mobility on trip
generation behavior in the US: Findings from the 2017 National Household Travel
Survey. Travel Behavior and Society. 19(2020) 1-7.
20
11. Mulholland, E. (2016). Uber Markets. Review, Institute of Public Affairs; Retrieved
October, 19,2019, from IPA Review
12. National Association of Insurance Companies. (2019). Commercial Ride-Sharing.
Retrieved March 3, 2019, from NAIC Webpage
13. Nie, Y. (Marco). (2017). How can the taxi industry survive the tide of ridesourcing?
Evidence from Shenzhen, China. Transportation Research Part C: Emerging
Technologies, 79, 242–256.
14. QuestionPro. (2019). QuestionPro Audience - Research Panel | Online Panel | Online
Survey Panels. Retrieved March 15, 2019, from QuestionPro Website
15. Rayle, L., Dai, D., Chan, N., Cervero, R., & Shaheen, S. (2016). Just a Better Taxi? A
Survey-Based Comparison of Taxis, Transit, and Ridesourcing Services in San Francisco.
Transport Policy, 45, 168–178.
16. San Francisco County Transportation Authority. (2017). TNCs Today: A Profile of San
Francisco Transportation Network Company Activity. Retrieved October 15, 2019, from
https://www.sfcta.org/sites/default/files/2019-02/TNCs_Today_112917_0.pdf.
17. Schaller, B. (2018). The New Automobility: Lyft, Uber and the Future of American Cities.
Retrieved October 15, 2019, from Full PDF
18. Schwieterman, J., & Livingston, M. (2018). Uber Economics, Retrieved from Full PDF
19. Siddiqui, F. (2019). Metro plan would subsidize Uber and Lyft fares to fill late-night
service gap. Retrieved March 4, 2019, from Washington Post Article
20. Wolfson, A., & Tavor, D. (2018). Sustainability Via Servicing: From Individual Action
to Institutional Action. Journal of Service Science, 11(1), 1–10.
21. Zhu, G., Fung So, K. K., & Hudson, S. (2016). Inside the Sharing Economy:
Understanding Consumer Motivations Behind the Adoption of Mobile Applications.
International Journal of Contemporary Hospitality Management, 29(9), 2218–2239.
21
Appendix Survey Questions
1. Have you ever used a ride-hailing service like Uber or Lyft?
(Yes/No)
2. What is your age?
(Under 18; 18-22; 23-25; 26-30; 31-35; 36-45; 46-55; 55+)
3. What is your ethnicity?
(White; African American; Hispanic or Latino; Asian or Pacific Islander; Other; Prefer not Say)
4. What is the highest level of education you have completed?
(Some high school or less; High school diploma or equivalent (GED); Some college, no diploma;
Associates or vocational degree; Bachelor; Master; Doctoral or Professional degree (PhD, MD,
JD, etc))
5. Do you own or have regular access to a personal vehicle?
(Yes/No)
6. What was your income last year?
(Less than $25,000; $25,000 to $34,999; $35,000 to $44,999; $45,000 to $54,999; $55,000 to
$74,999; $75,000 to $99,999; $100,000 to $149,999; $150,000+)
7. What is your sex?
(Male; Female; Prefer not Say)
8. Which of the following cities do you live in or closest to?
(Austin; Dallas-Fort Worth; Houston; San Antonio)
9. Approximately how often do you use ride-hailing services like Uber or Lyft?
(Less than once a month; Once a month; A few times a month; Once a week; 2-3 times a week;
Daily; More than once a day)
10. Which of the following most accurately describes your usage of ride-hailing services
like Uber and Lyft? (Check all that apply)
(Use for commuting to work or school; Use for trips to bars, restaurants, and other entertainment
venues; Use for errands or personal business; Use to connect to other transportation services (trains,
airport, bus, etc…); Use for emergency situations; Others)
11. What time of day do you use ride-hailing services like Uber and Lyft (check all that
apply)?

22
(Early morning 5-7am; Morning 8-10am; Early afternoon 11-1pm; Afternoon 2-4pm; Early
evening 5-7pm; Evening 8-10pm, Night 11-1am; Late night 2-4am)
12. When do you primarily use ride-hailing services like Uber and Lyft?
(Workdays; Non-workdays; Holidays)
13. In your estimation, how long is your typical ride-hailing (Uber/Lyft) trip?
(Less than 5 minutes; 5-10 minutes; 11-15 minutes; 16-20 minutes; 21 minutes or longer)
14. How often do you use ride-hailing services like Uber or Lyft to connect to another
mode of transportation (such as a bus, rail line, personal vehicle, airport etc.)?
(Never, Once a month; A few times a month; Once a week; 2-3 times a week; Daily; More than
once a day)
15. If you use ride-hailing services like Uber or Lyft to connect to another mode of
transportation, which mode do you most frequently connect to?
(Bus; Rail Line; Parked personal vehicle; Bicycle; Airport; Other; I do not use these services to
connect to other transportation modes)
16. How important are the following factors to you when using ride-hailing services like
Uber and Lyft?
16.1 Cost; (Not important; Slightly important; Neutral; Important; Extremely Important)
16.2 Reliability of service; (Not important; Slightly important; Neutral; Important; Extremely
Important)
16.3 Travel time; (Not important; Slightly Important; Neutral; Important; Extremely Important)
16.4 Safety; (Not Important; Slightly Important; Neutral; Important; Extremely Important)
16.5 Comfort; (Not Important; Slightly Important; Neutral; Important; Extremely Important)
17. What is your primary motivation for using ride-hailing services like Uber/Lyft?
(Cost; Convenience; Total travel time; Safety; Other)
18. In your opinion, compared to public transit, ride-hailing services like Uber and Lyft
are:
(More convenient; Less convenient; More expensive; Less expensive; More reliable, Less reliable)
19. In your opinion, compared to traditional taxis, ride-hailing services like Uber and
Lyft are:
(More convenient; Less convenient; More expensive; Less expensive; More reliable, Less reliable)
23
20. Do you believe you make more trips because of ride-hailing services like Uber and
Lyft?
(Yes; No; Unsure)
21. Do you believe that ride-hailing services like Uber and Lyft help you go to places that
you would not otherwise go to if Uber/Lyft did not exist?
(Yes; No; Unsure)