Embed Size (px)
Citation preview
The role of the organic matter for
hydrophobicity in urban soils
Dissertation
zur Erlangung des akademischen Grades eines
Doktors der Naturwissenschaften
Fachbereich 7: Natur- und Umweltwissenschaften
Universität Koblenz-Landau
vorgelegt von
Dipl.-Ing.
Dörte Diehl
1. Gutachter: Prof. Dr. Gabriele Schaumann (Universität Koblenz-Landau, Germany)
2. Gutachter: Dr. Stefan Doerr (Swansea University, United Kingdom)
Promotionsausschuss:
Vorsitzender: Prof. Dr. Wieland Müller
Berichter: Prof. Dr. Ralf Schulz
Berichter: Prof. Dr. Andreas Müller
Tag der wissenschaftlichen Aussprache: 03.09.2009
Landau 2009

Declaration
Declaration
I herewith declare that I autonomously carried out the PhD-thesis entitled “The role of
the organic matter for hydrophobicity in urban soils”. All used assistances are declared
and parts of involved contributors and other authors are clearly indicated.
This or another thesis has never been submitted elsewhere for an exam, as thesis or
for evaluation in a similar context; neither to any department of this university nor to any
other scientific institution.
________________________________________________________________________
Place, date signature
The following parts of this thesis are published or submitted for publication:
Chapter 3 and the subsections 2.2.4 (par. 1-2), 2.3.1, 2.3.2 (par. 1-5), 2.2.4 and 2.5
(par. 2-4) are published:
Diehl, D. & G.E. Schaumann. (2007). Wetting mechanism assessed from time dependent
sessile drop shape. Hydrological Processes, 21, 2255 - 2265.
Chapter 4 is published as:
Diehl, D., R.H. Ellerbrock & G.E. Schaumann. (2009). Influence of drying conditions on
wettability and DRIFT spectroscopic C-H band of soil samples. European Journal of Soil
Science, 60, 557-566.
I had the opportunity to conduct the DRIFT measurements at “ZALF” in Müncheberg
by courtesy of Dr. Ruth H. Ellerbrock, who supported the evaluation of the spectra. My
own contribution to Chapter 4 consists of > 90%.
Chapter 5 is submitted to the journal “Geoderma” as:
Diehl, D., J.V. Bayer, S.K. Woche, R. Bryant, S.H. Doerr & G.E. Schaumann. (subm.).
Reaction of soil water repellency on artificially induced changes in soil pH. Geoderma.
Beside my own results, Chapter 5 comprises additional results of investigations
carried out by Julia Bayer with samples from Netherlands, the UK and Australia, which
were supervised by Prof. Dr. R. Bryant and Dr. S.H. Doerr from the University Swansea.
Julia Bayer developed the method to artificially increase soil pH by addition of gaseous
ammonia and I developed the method to artificially decrease soil pH by addition of
gaseous hydrochloric acid. The measurements of titrable surface charges were carried out
by Dr. Susanne Woche from the Institut of Soil Science at the University of Hannover.
Some data of a long-term study of Buch and Tiergarten site were provided by the
subproject SOIL from the Interurban research group by courtesy of Prof. Dr. Gerd
Wessolek (Department of Soil Protection, TU-Berlin). My own contribution to Chapter 5
consists therefore of ~ 75%.
Additionally, this thesis benefited from the supervision by Prof. Dr. Gabriele
Schaumann as well as from numerous discussions within the research group which
helped me by suggestions, advices and ideas and which cannot be numeralized.

Acknowledgements
Achkowledgements
The present work is part of the subproject HUMUS of the interdisciplinary research
project Interurban. I am grateful for the financial support granted from the German
Research Foundation (DFG SCHA 849/4-3).
This work would not have been possible without the contribution of many people.
First of all I wish to express my sincere appreciation and gratitude to my supervisor
Prof. Dr. Gabriele Schaumann for her confidence shown to me with the provision of this
topic and the opportunity of working in her research group. Without her inspirational
guidance, her enthusiasm, her encouragements and her unselfish help, I could never have
finished my doctoral work. She always created a stimulating atmosphere that made me enjoy
my work very much. I did not only find an excellent scientific advisor, but also a dear friend
in her.
The present work started in Berlin at the department of Environmental Chemistry of
the TU-Berlin. I would like to thank all the people who created a pleasant working
atmosphere: My special thank goes to Julia Bayer, who introduced me to the contact
angle tensiometer and the DRIFT measurement. She finished her diploma thesis in this
time, which was, together with the PhD thesis of Julia Hurrass, a valuable base for my
own work. My thanks go to the laboratory technicians Jeanette Regnéry and Katharina
Knobel, as well as the student assistants Jenni Frank and Nils Meyer, who helped me
measuring countless Wilhelmy plate contact angles, cared for the right humidity in the
dessicators, fitted ellipses and evaluated DRIFT spectra. I also want to thank secretary
Herta Klein who managed the project account and always knew what was going on in the
department and of course my colleagues Daniela Gildemeister and Fabian Jäger who
encouraged me to accompany Prof. Dr. Gabriele Schaumann to her new place of activity
in Koblenz. A thank you also goes to all members of the research group Interurban and
especially of the working group HUMUS for lively discussions and constructive
teamwork. My thanks also goes to Dr. Ruth Ellerbrock from ZALF Müncheberg, where I
measured DRIFT spectra, to Prof. Dr. Gerd Wessolek from the department of Soil
Protection of the TU-Berlin for providing data from a long-term sampling in Tiergarten
and Buch and to Dr. Susanne Woche from the institute of Soil Science of the University
Hannover who measured particle charge.
I am grateful for the time with my collegue Daniela and her children as flatmates in
Koblenz. The shared organisation of the daily routine as well as the trips with our
children made the new beginning in Koblenz, without the former circle of friends, much
easier. I also like to thank for the help which I got at the University in Koblenz from the
technical assistants Andrea Schwarz, Claudia Stolze and Reimo Hagner, from the
secretary Silvia Schuller as well as from my student assistant Lidiya Shemotyuk who
measured numerous soil sample pH values. Although far too short, I enjoyed the time
together with my colleagues Jenny Langbein and Irene Kamprad who left a gap in our
working group when they parted.

Acknowledgements
I like to thank my current collegues at the University in Landau Lars Düster, Jette
Schwarz, Nicole Bandow, Sina Egerer and again Juliua Bayer for their cooperative
teamwork. My thanks also goes to Dr. Rob Bryant and Dr. Stefan Doerr from Swansea
University who enabled a joint publication with Julia Bayer with data obtained in their
institutes.
I also want to thank my parents who I could always rely on, even with a second move
within 3 years. Finally, I am deeply indebted to my daughter Saïda who voluntarily made
the sacrifice of changing school twice and leaving behind her circle of friends. Without
her patience and love, particularly in those many days in which I spent more time with
my computer than with her, this work would not have been possible.
Table of contents
i
Table of contents
1 GENERAL INTRODUCTION .................................................................................... 5
1.1 ENVIRONMENTAL RELEVANCE OF SOIL WATER REPELLENCY ............................................ 5
1.2 FACTORS AFFECTING SOIL WATER REPELLENCY ............................................................... 5
1.3 OBJECTIVES ..................................................................................................................10
1.4 SAMPLE SITES ...............................................................................................................13
2 THEORETICAL BACKGROUND ............................................................................16
2.1 WATER REPELLENCY .....................................................................................................16
2.2 DETERMINATION OF REPELLENCY ..................................................................................18
2.3 INFLUENCE OF GRAVITY, SURFACE ROUGHNESS AND CHEMICAL HETEROGENEITY ON
CONTACT ANGLE DETERMINATION OF SOIL SAMPLES .......................................................22
2.4 WETTING KINETICS BY TIME DEPENDENT SESSILE DROP METHOD ....................................26
2.5 SINKING AND SPREADING ..............................................................................................27
3 THE NATURE OF WETTING ON URBAN SOIL SAMPLES - WETTING
KINETICS AND EVAPORATION ASSESSED FROM SESSILE DROP SHAPE ..28
3.1 ABSTRACT ....................................................................................................................28
3.2 INTRODUCTION ..............................................................................................................28
3.3 MATERIAL AND METHODS .............................................................................................29
3.4 RESULTS AND DISCUSSION ............................................................................................33
3.5 CONCLUSIONS ...............................................................................................................40
4 INFLUENCE OF DRYING CONDITIONS ON WETTABILITY AND DRIFT
SPECTROSCOPIC C-H BAND OF SOIL SAMPLES ................................................42
4.1 SUMMARY .....................................................................................................................42
4.2 INTRODUCTION ..............................................................................................................42
4.3 MATERIALS AND METHODS ............................................................................................44
4.4 RESULTS & DISCUSSION .................................................................................................47
4.5 CONCLUSIONS ...............................................................................................................55
5 REACTION OF SOIL WATER REPELLENCY ON ARTIFICIALLY INDUCED
CHANGES IN SOIL PH .............................................................................................57
5.1 ABSTRACT ....................................................................................................................57
5.2 INTRODUCTION ..............................................................................................................57
5.3 MATERIAL AND METHODS .............................................................................................60
5.4 RESULTS .......................................................................................................................66
5.5 DISCUSSION ..................................................................................................................73
5.6 CONCLUSIONS ...............................................................................................................78
5.7 ACKNOWLEDGMENTS ....................................................................................................79
6 SYNTHESIS AND GENERAL CONCLUSIONS ......................................................80
6.1 SUMMARY OF OBSERVATIONS ........................................................................................80
6.2 CHEMICAL NATURE OF REPELLENCY IN BUCH SAMPLES ..................................................82
6.3 PHYSICOCHEMICAL NATURE OF REPELLENCY IN TIERGARTEN .........................................84
6.4 SITE DEPENDENT CAUSES FOR THE NATURE OF SWR .......................................................87
6.5 FINAL CONCLUSION .......................................................................................................88
6.6 OUTLOOK ......................................................................................................................90
7 REFERENCES ............................................................................................................92

Table of contents
ii
8 ANNEX ..................................................................................................................... 103
8.1 LIST OF ABREVIATIONS ................................................................................................ 103
8.2 LIST OF FIGURES ......................................................................................................... 105
8.3 LIST OF TABLES .......................................................................................................... 108
8.4 CURRICULUM VITAE .................................................................................................... 110
8.5 PUBLICATIONS ............................................................................................................ 111

Abstract
iii
Abstract
The present work investigates the wetting characteristics of soils with regard to their dependence on
environmental parameters such as water content (WC), pH, drying temperature and wetting
temperature of wettable and repellent soils from two contrasting anthropogenic sites, the former
sewage disposal field Berlin-Buch and the inner-city park Berlin-Tiergarten. The aim of this thesis is
to deepen the understanding of processes and mechanisms leading to changes in soil water
repellency. This helps to gain further insight into the behaviour of soil organic matter (SOM) and
identifying ways to prevent or reduce the negative effects of soil water repellency (SWR).
The first focus of this work is to determine whether chemical reactions are required for wetting
repellent samples. This hypothesis was tested by time and temperature dependence of sessile drop
spreading on wettable and repellent samples. Additionally, diffuse reflectance infrared Fourier
transform (DRIFT) spectroscopy was used to determine whether various drying regimes cause
changes in the relative abundance of hydrophobic and hydrophilic functional groups in the outer layer
of soil particles and whether these changes can be correlated with water content and the degree of
SWR. Finally, by artificially altering the pH in dried samples applying acidic and alkaline reagents in
a gaseous state, the influence of only pH on the degree of SWR was investigated separately from the
influence of changes in moisture status.
The investigation of the two locations Buch and Tiergarten, each exceptionally different in the
nature of their respective wetting properties, leads to new insights in the variety of appearance of
SWR. The results of temperature, water content and pH dependency of SWR on the two contrasting
sites resulted in one respective hypothetical model of nature of repellency for each site which
provides an explanation for most of the observations made in this and earlier studies:
At the Tiergarten site, wetting characteristics are most likely determined by micelle-like
arrangement of amphiphiles which depends on the concentration of water soluble amphiphilic
substances, pH and ionic strength in soil solution. At low pH and at high ionic strength, repulsion
forces between hydrophilic charged groups are minimized allowing their aggregation with outward
orientated hydrophobic molecule moieties. At high pH and low ionic strength, higher repulsion forces
between hydrophilic functional groups lead to an aggregation of hydrophobic groups during drying,
which results in a layer with outward oriented hydrophilic moieties on soil organic matter surface
leading to enhanced wettability.
For samples from the Buch site, chemical reactions are necessary for the wetting process. The
strong dependence of SWR on water content indicates that hydrolysis-condensation reactions are the
controlling mechanisms. Since acid catalyzed hydrolysis is an equilibrium reaction dependent on
water content, an excess of water favours hydrolysis leading to an increasing number of hydrophilic
functional groups. In contrast, water deficiency favours condensation reactions leading to a reduction
of hydrophilic functional groups and thus a reduction of wettability.
The results of the present investigation and its comparison with earlier investigations clearly
show that SWR is subject to numerous antagonistically and synergistically interacting environmental
factors. The degree of influence, which a single factor exerts on SWR, is site-specific, e.g., it is
dependent on special characteristics of mineral constituents and SOM which underlies the influence
of climate, soil texture, topography, vegetation and the former and current use of the respective site.
Zusammenfassung
iv
Zusammenfassung
In der vorliegenden Arbeit wurden Benetzungseigenschaften zweier stark anthropogen beeinflusster
Böden in Abhängigkeit von Einflussfaktoren wie Wassergehalt, pH, Trocknungs- und
Benetzungstemperatur untersucht. Ziel war es die Prozesse und Mechanismen, die zu Veränderungen
der Benetzungseigenschaften von Böden führen, besser zu verstehen. Erkenntnisse über diese
Prozesse und Mechanismen lassen zum einen Rückschlüsse auf das generelle Verhalten von
organischer Bodensubstanz zu, können zum anderen aber auch helfen, vorsorgliche Maßnahmen zu
ergreifen um Bodenhydrophobie zu verhindern oder deren negative Effekte zu reduzieren.
Anhand der Zeit- und Temperaturabhängigkeit der Spreitung von liegenden Tropfen (TISED)
auf hydrophoben und benetzbaren Bodenproben beider Standorte wurde die Hypothese getestet, dass
der Benetzungsprozess durch chemische Reaktionen kontrolliert wird. Mithilfe von DRIFT (Diffuse
Reflectance Infrared Fourier Transform) Spektren wurde überprüft, ob unterschiedliche Trocknungs-
bedingungen (Temperatur, Dauer, Luftfeuchte) zu Unterschieden in der Anzahl hydrophober und
hydrophiler funktioneller Gruppen in den äußeren Molekülschichten führen die sich im Grad der
Benetzungshemmung widerspiegeln. Durch künstliche pH-Wert Änderung über die Gasphase konnte
die pH-Wert Abhängigkeit der Benetzungshemmung unabhängig vom Wassergehaltseinfluss beider
Standorte verglichen werden.
Die beiden Standorte weisen extreme Unterschiede in der Art der Benetzungshemmung auf und
sind dadurch beispielhaft für die Bandbreite der möglichen Ursachen und Mechanismen der
Benetzungshemmung in Böden. Die Ergebnisse der Untersuchungen zur Temperatur- Wassergehalts-
und pH-Abhängigkeit der Benetzungshemmung aus dieser Arbeit im Vergleich mit Ergebnissen
vorhergehender Arbeiten lassen sich am besten mit jeweils einem konzeptionellen Modell pro
Standort zur Natur der Benetzungshemmung erklären:
Am Standort Tiergarten werden die Benetzungseigenschaften vermutlich durch mizellartige
Anordnung amphiphiler Substanzen an der Oberfläche der organischen Bodensubstanz bestimmt, die
abhängig vom Gehalt wasserlöslicher amphiphiler Substanzen, dem pH-Wert und der Ionenstärke in
der Bodenlösung im Verlaufe der Trocknung zu einer unterschiedlichen Orientierung der hydrophilen
funktionellen Gruppen führt. Bei niedrigen pH-Werten und hoher Ionenstärke herrschen schwache
Abstoßungskräfte zwischen den hydrophilen Gruppen, diese können aggregieren und hydrophobe
Molekülketten sind nach außen gerichtet. Bei höheren pH-Werten und niedrigerer Ionenstärke sind
die abstoßenden Kräfte zwischen den hydrophilen Gruppen groß und führen zu einer Aggregation
hydrophober Gruppen, wobei die hydrophilen Gruppen nach der Trocknung nach außen gerichtet sind
und für eine bessere Benetzbarkeit sorgen.
Am Standort Buch sind chemische Reaktionen zur Benetzung nötig. Aufgrund der starken
Wassergehaltsabhängigkeit der Benetzungshemmung könnte es sich dabei um Hydrolysereaktionen
handeln, die säurekatalysiert reversible wassegehaltsabhängige Gleichgewichtsreaktionen und im
Basischen irreversibel sind.
Die beiden Modelle können eine Vielzahl von Beobachtungen erklären, die im Verlaufe dieser
Untersuchung aber auch in vorhergehenden Untersuchungen gemacht wurden. Die Ergebnisse dieser
Untersuchungen und ihr Vergleich mit vorherigen Untersuchungen auf denselben Standorten zeigten,
dass Benetzungshemmung in Böden durch eine Vielzahl von Faktoren und Prozessen beeinflusst ist,
die sowohl synergistisch als auch antagonistisch wirken können. Welche Faktoren den größten
Einfluss ausüben bzw. welche Prozesse die vorherrschenden sind, hängt von lokalen Größen wie der
Art des Mineralbodens und der organischen Bodensubstanz ab, die wiederum dem Einfluss von
Klima, Textur, Topografie, Vegetation und der Nutzungsgeschichte unterliegen.
1 General introduction
5
1 General introduction
1.1 Environmental relevance of soil water repellency
Soil water repellency (SWR) is a surface property of soil particles which reduces or
prevents water infiltration into the soil (Doerr & Ritsema, 2005). When it comes into
contact with a wettable soil, water spontaneously penetrates. In contrast, water balls up
into spherical droplets on a repellent soil. These surface properties of soil particles have a
high impact on soil hydrology (Doerr et al., 2000) and thereby on processes like
mobilisation, transport and immobilisation of substances within a soil. The resistance
against wetting of a repellent soil may last for periods between seconds and weeks. This
reduced infiltration capacity leads to increased surface run off, increased erosion of top
soil components (Shakesby et al., 2000) and thus an increased risk of surface waters
pollution. In contrast, the filter function may be significantly reduced in repellent soils by
the development of uneven wetting patterns (Ritsema & Dekker, 1994). In this case, the
vertical water flow is concentrated on a small part of the soil cross-section, such as
cracks, macro pores or regions with discontinuities in texture or wettability. An increased
water flux is channelled through these preferential flow paths. Thus, the travel time of
soluble nutrients or pollutants - and also of colloids and substances adsorbed on them - is
significantly shortened, and the risk of groundwater contamination increases (Nguyen et
al., 1999; Ritsema & Dekker, 2000). Additionally, soil moisture conditions affect
sorption properties of soil organic matter and the pore size distribution of a soil and are
therefore expected to have an impact on the availability of pollutants and nutrients within
the soil (Schaumann et al., 2005). Furthermore, microbial activity and agriculture
production are strongly influenced by hydrological soil properties, i.e., by the
availability, distribution and storage of soil water. Repercussions of SWR on crops are
reduced seed emergence and plant growth caused by water deficiency in the root zone
(Blackwell, 2000). In contrast, positive effects of SWR have been reported with regard to
the stability of soil aggregates (Piccolo & Mbagwu, 1999; Mataix-Solera & Doerr, 2004;
Goebel et al., 2005) and sequestering organic carbon (Piccolo et al., 1999; Spaccini et
al., 2002). Furthermore, SWR leads to a reduced loss of soil water by evaporation
(Imeson et al., 1992; Yang et al., 1996).
1.2 Factors affecting soil water repellency
1.2.1 Nature of soil organic matter and humic substances
The understanding of the role of soil organic matter (SOM) for the appearance of SWR
requires a general knowledge about composition and functionality of SOM. In addition to
living biomass, SOM consists of undecayed plant and animal tissues and their partial
decomposition and transformation products, or humus. Humus can be divided into non-
humic substances (e.g. sugars, amino acids, fats, polysaccharides and proteins) and humic
1 General introduction
6
substances (HS), which have a high molecular weight, are brown to black in colour and
are formed by secondary synthesis reactions. HS are a heterogeneous mixture of
compounds and cannot be described by one specific structural formula. They can be
divided into typical humic-fractions according to their solubility under acidic or alkaline
conditions: (i) the light yellow to yellow-brown fulvic acids (FA) which are soluble in
water under all pH conditions, (ii) the dark brown to grey black humic acids (HA) which
are not soluble in water under acidic conditions (pH < 2) but are soluble at higher pH
values and (iii) the black humins (HU) which are not soluble in water at any pH value
(Stevenson, 1994). These operationally based classes are characterised by heterogeneous
molecular weight and structure but show a general tendency in chemical and physical
properties from FA over HA to HU as follows: an increasing intensity of colour, degree
of polymerisation, molecular weight and carbon content and a decreasing oxygen content,
exchange acidity, and solubility (Stevenson, 1985). This includes a decreasing polarity
and therefore an increasing hydrophobic character from FA over HA to HU. The
composition of humus varies considerably among different soil types and vegetation. The
humus of forest soils is characterized by high fulvic acid content, while the humus of
peat and grassland soils is high in humic acids (Stevenson, 1985). The HA to FA ratio
usually, but not always, decreases with increasing depth.
Formation and molecular structure of HS are far from being fully explained.
Currently, three main pathways of humification, including several sub-pathways, are
under debate. (i) The lignin theory views lignins as the source of HS, which are more or
less modified by soil microbes (Akim et al., 1998). Repolymerisation of lignin monomers
or of larger lignin structures occurs (e.g., via demethylation of phenolic esters, oxidation
of propanol side chains, cleavage of aromatic rings and condensation reactions with
amino compounds and quinones (Waksman & Reuszer, 1932)) forming the relatively
oxygen-poor polymeric HUs. During continuous oxidation they become enriched with
functional groups and develop into HAs and ultimately into FAs. (ii) The polyphenol
theory considers all biopolymers to be decomposed to their monomeric units before
repolymerisation (Stevenson, 1994). In contrast to lignin theory, increasing humification
leads to increasing complexity of HS, i.e. in the earlier stages FAs develop into HAs and
upon further humification into HUs. (iii) A third theory, the sugar-amine condensation
theory, suggests that sugar, amines and/or glycine may be abiotically converted into
melanine or glycosylamine which may undergo a complex series of chemical processes
including polymerisation and condensation reactions forming HSs (Abadi Ghadim,
2000). Since this theory does not require lignin, it is a probable pathway for humic matter
formation in marine environments.
The described theories of humification end up in hypothesised macromolecular
polymeric structures (e.g. Graber & Borisover, 1998; LeBoeuf & Weber, 2000;
Pignatello, 2003) with numerous cross-linkages formed by condensation reactions
involving strong covalent C-C and C-N bonds (Essington, 2003). Some aspects of SOM
behaviour like swelling and gel-like properties (Schaumann et al., 2000) as well as
nonlinearity, competition and hysteresis effects of sorption are currently best explained
by the polymeric model.

1 General introduction
7
An alternative paradigm, the self aggregation theory, considers humic substances as
supramolecular associations formed by relatively small molecules which are self-
organising into relatively large entities (e.g. Schulten & Schnitzer, 1997; Wershaw, 1999;
Piccolo, 2002). These molecules derive from enzymatic and oxidative depolymerisation
of biopolymers into tannins, cutins and carboxyl groups and contain relatively unaltered
hydrophobic portions like aromatic and aliphatic structures as well as hydrophilic
portions with carboxylic and phenolic groups (Essington, 2003). The amphiphilic,
surfactant-like molecules may be aggregated at mineral surfaces, dispersed in soil
solution at low concentrations, or forming micelles if critical micelle concentration (cmc)
is exceeded (Wershaw, 1986). The micelles are stabilised by weak non-covalent forces
like van der Waals forces, hydrogen bonds, π–π interactions, electrostatic effects and/or
hydrophobic interactions (Conte & Piccolo, 1999). The enormous flexibility of dissolved
SOM in response to changes in environmental conditions and the cross-linking effects of
multivalent cations or water molecules in dissolved and undissolved SOM can be best
explained by supramolecular associations of SOM (Schaumann & Bertmer, 2008).
Therefore, probably neither macromolecules nor smaller molecules forming
supramolecular associations can be fully excluded in SOM, but SOM is suggested to be
regarded as amorphous material with a wide range of molecular mass and microregions
with various properties (Schaumann, 2006).
1.2.2 The role of soil organic matter composition for soil water repellency
Since most mineral compounds of soils are hydrophilic (Tschapek, 1984), it is generally
accepted that SWR is mainly caused by organic compounds in the form of more or less
continuous coatings on mineral surfaces (Ma'shum et al., 1988; Bisdom et al., 1993) or
as interstitial particulate organic material (McGhie & Posner, 1981; Franco et al., 2000).
Attempts to find correlations between SOM content and SWR have produced
inconsistent results: some studies found positive correlations (McKissock et al., 1998;
Mataix-Solera & Doerr, 2004), others having a negative (Teramura, 1980) or no
relationship (DeBano, 1992; Wallis et al., 1993). This shows that rather the quality than
the quantity of soil organic matter determines the degree of SWR (Wallis & Horne,
1992). Hydrophobic compounds in SOM relevant for inducing SWR may derive directly
from the decomposition of organic matter (McGhie & Posner, 1981) via accumulation of
hydrophobic organic acids released as root exudates (Stevenson, 1985) or by fungal or
microbial by-products (Savage et al., 1969; Jex et al., 1985; Hallett & Young, 1999).
SWR has been observed in almost every part of the world in various climates, with
various types of vegetation and in soils with various textures (Jaramillo et al., 2000;
Doerr et al., 2007). Specific vegetation types, like certain types of evergreen trees
(Mataix-Solera & Doerr, 2004), trees with considerable amounts of resins, waxes or
aromatic oils (Doerr et al., 2000; Ferreira et al., 2000) shrubs and chaparral vegetation
(Scholl, 1975) as well as certain grass species (Holzhey, 1968; DeBano, 2000) seem to
favour the development of repellency which in turn may be associated with a specific
microbial community.
1 General introduction
8
Compounds most suspected to cause SWR among others are alkanes (Savage et al.,
1972; Ma'shum et al., 1988; Roy et al., 1999), amphiphilic compounds, mainly long-
chained fatty acids (Ma'shum et al., 1988; Hudson et al., 1994; Roy et al., 1999; Franco
et al., 2000; Horne & McIntosh, 2000), insoluble Ca and Mg fatty acid salts (Wander,
1949; Graber & S. Taggera, 2009), waxes (Franco et al., 2000; Horne & McIntosh,
2000), phytanes, phytones or sterols (Franco et al., 2000). In order to identify chemical
compounds causing water repellency, numerous investigations have been carried out
(Ma'shum et al., 1988; Horne & McIntosh, 2000; Doerr et al., 2005b). Most of the
various extraction procedures showed no differences in amount of hydrophobic
extractable compounds between wettable and repellent samples (Hudson et al., 1994;
Horne & McIntosh, 2000; Mainwaring et al., 2004; Doerr et al., 2005b; Morley et al.,
2005). In contrast, Morley et al.(2005) and Mainwaring et al.(2004) found a greater
abundance of high molecular mass polar compounds in the water repellent samples which
were essentially absent in wettable samples. Wettability of acid washed sand was
modified in the same manner by extracts of wettable as well as by extracts of repellent
samples (Horne & McIntosh, 2000). Furthermore, alternating extraction with polar and
non-polar solvents leads to marked fluctuations in repellency (Horne & McIntosh, 2000).
These and comparable results suggest that water repellency is determined by the
composition and nature of the outermost layer of organic material rather than by the
characteristics of the bulk of the organic matter (Horne & McIntosh, 2000). Suggested
mechanisms for changes in the arrangement of molecules and functional groups may be
conformational changes, hydration or spatial rearrangement of organic molecules in the
surfaces of organic coatings as a result of contact with water (Tschapek, 1984; Ma'shum
& Farmer, 1985; Horne & McIntosh, 2000; Doerr et al., 2005b). An alternative
mechanism for enhanced wettability that suggests the reduction of surface tension via
dissolution of soil-borne surface active organic compounds into the wetting water (Chen
& Schnitzer, 1978; Tschapek, 1984; Barrett & Slaymaker, 1989; Doerr et al., 2000;
Hurraß & Schaumann, 2006) was rejected by Graber et al. (2007).
1.2.3 Water content
The relation between SWR and water content (WC) has been investigated in many studies
with some contradictory results. Under field conditions, sub-soils are subjected to short-
term and seasonal moisture variations. Repellency is generally considered to increase
with increasing dryness of soil (Berglund & Persson, 1996; Doerr & Thomas, 2000).
Thus, Dekker & Ritsema (1994) measured actual SWR in field moist state and potential
SWR after air drying or oven drying and defined a critical water content (WCcrit) above
which a soil sample is wettable and below which it becomes repellent. Täumer et al
(2005) found that SWR in the former sewage disposal field at the Buch site can be
predicted with data of SOM content using a linear function to calculate WCcrit.
However, other studies investigating soil water repellency in dependency of WC
found an apparently contradictory SWR-WC relation especially at WCs around and below
the wilting point. Ziogas et al (2003) showed that oven drying might render samples fully
wettable. Other studies found repellency maxima at intermediate to small water content
1 General introduction
9
between air-dried states and wilting points (King, 1981; Goebel et al., 2004; Bayer &
Schaumann, 2007) and a decrease in repellency with further drying to lower WCs.
Contrary to this, equilibration of dry soils at high relative humidity resulted in an
increase of repellency (Hurraß & Schaumann, 2006; Wallach & Graber, 2007). As
changes in repellency are not fully reversible after rewetting (Doerr & Thomas, 2000;
Bayer & Schaumann, 2007) water content alone seems to be an inadequate characteristic
to predict soil water repellency. Soil texture (de Jonge et al., 1999) and SOM content and
quality as well as additional factors such as drying duration and temperature (Bayer &
Schaumann, 2007) together with equilibration time (Hurraß & Schaumann, 2006;
Wallach & Graber, 2007) seem to influence changes in SWR.
1.2.4 Soil pH
Soil pH or better soil solution pH depends on various environmental factors, e.g., parent
rock material, climate, organic matter composition, degree of degradation and vegetation.
In turn, soil pH determines soil characteristics like charge of mineral and organic
surfaces, exchange capacity, availability of nutrients and contaminants, plant growth,
microbial activity as well as stability and structure of organic matter. Several studies
found alkaline soils to be less prone to SWR compared to acidic soils (Dekker &
Jungerius, 1990; Cerdà & Doerr, 2007; Mataix-Solera et al., 2007). Furthermore, SWR
has been successfully reduced in acidic soils by increasing soil pH via liming (van't
Woudt, 1959; Karnok et al., 1993; Roper, 2005). However, SWR has also been reported
in calcareous soils in the Netherlands (Dekker & Jungerius, 1990), California, USA
(Holzhey, 1968) and Spain (Mataix-Solera & Doerr, 2004).
This study focuses in particular on pH since the results of earlier studies point to a
general difference in the nature of repellency between the two investigated sites, among
others, regarding pH dependent SWR. Hurraß & Schaumann (2006) found that only for
one of the two investigated sites, repellency of closely neighbouring wettable and
repellent samples were interrelated with differences in pH. Bayer & Schaumann (2007)
confirmed this assumption by artificially changing pH in samples from the same sample
sites. However, in contrast to the expectation that increasing pH will improve the
wettability and decreasing pH will intensify water repellency, they found a maximum in
water repellency at a pH above the original pH.
1.2.5 Temperature
Temperature has an influence on many processes in soils. Changes in temperature are
linked with changes in surface tension and viscosity of liquids, in solubility of salts and
gases, in evaporation rates and rates of chemical reactions. Thus temperature may play an
important role in appearance of SWR and changes in its degree.
Several studies investigated the influence of the drying temperature on potential
SWR with contradictory results. Dekker et al (2001) found an increasing potential SWR
with increasing drying temperature for 75 Dutch dune sand samples, whereas Ziogas et
al. (2005) found the contrary relation in 35 Greek sandy soil samples. The importance of
pre-treatment temperatures for SWR determination was also emphasised by de Jonge et

1 General introduction
10
al.(1999) who compared freeze-dried and oven-dried samples and found a significantly
higher degree of SWR in samples after oven drying. In contrast to that, Ziogas et al.
(2003) showed that oven drying might render samples fully wettable. King (1981)
investigated the temperature influence on log10 of infiltration rate and on contact angle at
a temperature between 0 and 45°C. He found a positive linear relationship between
temperature and SWR with a stronger temperature effect on samples with a higher degree
of SWR and no significant temperature effect in ignited samples emphasising the major
contribution of organic matter on the temperature dependency. Lichner et al. (2002)
tested the re-establishment of SWR in model repellent sands after intermixing with
kaolinite. When these samples are dried at 30 and 60°C most of them exhibit SWR again.
Following drying at 120°C, SWR only reappears in a few samples which contained a
high amount of humid acids. However, drying at 90, 150 and 270°C does not re-induce
repellency. Bachmann et al. (2002) studied the temperature dependence of water
retention curves and found a six times higher temperature dependence of capillary
pressure than predicted by the temperature dependence of pure water only. They
suggested 3 possible mechanisms: (i) temperature-induced changes in contact angle, (ii)
changes in liquid-gas in interfacial tension because of solute effects and (iii) changes of
the enthalpy of immersion with temperature or capillary pressure. By calculating the
activation energy, temperature dependency of the rate of a depicted process may also
give information about the nature of the rate limiting step of the respective process.
Todoruk et al (2003a) used proton nuclear magnetic resonance spectroscopy (1H-NMR)
to measure the temperature dependence of pore-scale redistribution of water during
wetting in repellent soils contaminated with crude oil and obtained an activation energy
within the range of chemical reactions.
The influence of higher temperatures, which under field conditions may be expected
only during wildland fires, are intensively investigated since burnt soils are especially
prone to SWR (Scholl, 1975; Doerr, 1997; Robichaud, 2000; Shakesby et al., 2003;
Varela et al., 2005). Suggested mechanisms are the volatilisation of hydrophobic organic
substances and a concentrated condensation in cooler soil regions (Savage, 1974).
Between 175 and 200°C SWR is intensified (DeBano, 1981), around 250°C hydrophobic
substances are fixed on soil particles (Doerr et al., 2000) and between 280 and 400°C
SWR is destroyed (DeBano, 2000).
1.3 Objectives
Part of the experimental workings for this thesis originated from the interdisciplinary
research project Interurban “Water and Organic Matter in Anthropogenic Soils:
Dynamics and Processes“. This project is aimed at a systematic understanding of water
and matter cycles in soils of urban sites. In the first phase of the project, soil water
repellency (SWR) turned out to be one of the most important controlling factors of these
cycles in both of the investigated sites. Therefore, the second phase focused mainly on
causes and effects of SWR at these sites. The objective of the present study is to clarify
1 General introduction
11
the role of soil organic matter (SOM) for the appearance of SWR and its dynamics and
dependency on environmental conditions in two anthropogenically influenced urban sites
in Berlin, Germany. Earlier investigations showed that mechanisms controlling SWR
may significantly differ from location to location and that drying conditions such as
temperature and relative humidity, WC and pH are probably the influencing factors with
the highest relevance for SWR at the investigated sites (Bayer, 2004; Hurraß, 2006).
Therefore, the following hypothesises should be tested:
(i) Wetting of water repellent soils is controlled by chemical processes.
(ii) The relative abundance of hydrophobic molecular parts in the outer layer of
soil organic matter increases with water content and drying temperature
dependent degree of repellency.
(iii) The degree of repellency decreases with increasing pH caused by increasing
negative surface charge of deprotonated functional groups of SOM molecules.
In order to prevent measurement artefacts, methods for determination of contact
angle had to be adapted to an application in soil science. In this context, special
properties of soil samples like the surface roughness had to be considered in sessile drop
and Wilhelmy plate contact angle measurement. A theoretical introduction into the
measurements of surface characteristics of solids and an approach to approximate
influence of distortion variables on repellency measurement at soil samples are presented
in Chapter 2.
(i) Chapter 3 describes the investigation of the influence of temperature on the
wetting process of soil samples. The wetting rate as a function of temperature may give
information about the nature of the rate limiting step of this process. Therefore, the
activation energy of wetting of repellent samples can describe the nature of repellency
and distinguish between chemical reactions and physical processes as rate limiting steps.
We tested the hypothesis previously suggested by Todoruk et al. (2003a) that wetting of
repellent soil samples is controlled by chemical processes. Therefore, the spreading
kinetics of sessile drops on wettable and water repellent sample pairs has been
investigated. Under controlled conditions, which prevent evaporation and infiltration, the
rate limiting step of wetting was assessed via the activation energy, which was obtained
from the temperature dependence of spreading.
(ii) The studies described in Chapter 4 are aimed at the interaction of three
influencing factors: SOM surface properties, WC and various drying regimes. Several
authors suggested that changes in SWR may be caused by changes in the spatial
arrangement of molecules or moieties in the outer-most layer of SOM (e.g., Tschapek,
1984; Horne & McIntosh, 2000; Doerr et al., 2005b). Previous studies at the investigated
sites showed that not only changes in WC but also the conditions of drying, like
temperature and relative humidity, have an influence on the degree of SWR (Hurraß &
Schaumann, 2006; Bayer & Schaumann, 2007). Therefore, the hypothesis that increased
SWR caused by drying is related to an increase in the relative abundance of outward
orientated hydrophobic organic moieties was tested. The relative abundance of functional
groups in the SOM can be determined by diffuse reflectance infrared fourier transform
spectroscopy (DRIFT) which, in contrast to infrared spectroscopy in transmission mode,
1 General introduction
12
provides information about the outer layers of a sample and gives information about
hydrophobicity of SOM (Capriel et al., 1995). The DRIFT spectra were obtained from
wettable and repellent samples treated by various drying procedures in order to verify the
extent to which changes in water repellency are (a) related to changes in the relative
abundance of hydrophobic molecular parts in the outer layer of soil organic matter and
(b) caused solely by changes in water content.
(iii) The studies described in Chapter 5 aimed at the influence of pH on SWR.
Hurraß & Schaumann (2006) found that at one of the two investigated sites repellency
appears only at a pH below a certain value whereas wettable samples are not restricted to
a special pH range. For the other site, no relation between pH and repellency could be
observed. Bayer & Schaumann (2007) investigated the influence of addition of liquid
acid and base solution with increasing concentration to wettable and repellent samples
from both sites and found a strong pH dependency of SWR in samples from one site but
no response on pH changes at the other site. However, all samples significantly changed
in degree of repellency even when treated with pure water. This led to the conclusion that
the results of this investigation were partly caused by changes in the moisture status of
the samples and could not exclusively be related to changes in pH. Therefore, in
collaboration with Julia Bayer who investigated wettable and repellent samples from UK,
Netherlands and Australia at the University of Wales Swansea, an advanced experiment
was developed and carried out contemporaneously. This experimental design was aimed
at a further understanding of the direct influence of soil pH on SWR excluding the
influence of soil moisture changes on SWR. The new method allows changing pH in soil
samples without altering soil moisture by subjecting the samples to varying
concentrations of gaseous hydrochloric acid or ammonia. Using three different methods
of SWR determination, the hypothesis was tested that artificially increasing pH decreases
the degree of repellency caused by increasing negative surface charge of deprotonated
functional groups of SOM molecules. Furthermore, the results of the three applied
methods of repellency determination i.e. sessile drop contact angle, Wilhelmy plate
contact angle and water drop penetration time should be compared regarding their
expressiveness and sensitivity in various repellency ranges.
Finally, the experimental results are summarized in Chapter 6 and a comprehensive
interpretation is presented which includes nearly all observations of this study obtained
from the two investigated sites. With special consideration for the differences in the
nature of repellency between the two sites, a schematic concept is suggested as to how
SWR may develop at these two sites and which environmental conditions may especially
favour or impede its appearance. The final conclusion aimed at the transfer of results and
new insights drawn from the investigations of the two Berlin sites into a more general
comprehension of SWR and behaviour of SOM under various environmental conditions.
Furthermore, open questions for which further research is needed and suggestions for
approaching these questions are presented in the outlook.

1 General introduction
13
1.4 Sample sites
1.4.1 Berlin-Tiergarten
The city park Tiergarten is located in the centre of Berlin and has been in use as a natural
park since the 17th century. After the Second World War, between 1945 and 1950, it was
totally deforested for firewood production. After 1950, the bomb and shell craters were
filled with rubble and construction waste and covered by a top soil to start reforestation
(Wendland, 1993). The area investigated by INTERURBAN is a highly frequented lawn
for sunbathing with a light slope (Figure 1-1). In spring and summer, the grass is
periodically cut, fertilized and irrigated. The soil is classified as Cambisol (Klitzke &
Lang, 2007).
Figure 1-1 Sample site Berlin-Tiergarten (photo: K. Täumer, Department of Soil Protection, TU-Berlin)
The variety of anthropogenic influences
leads to high small-scale heterogeneity
of soil properties. E.g., water content and
SWR reveal major differences even in
closely adjacent sectors. In field moist
state wettable and repellent samples
were taken at a depth of 10 - 20 cm at
distances of about 10 cm and named as
TW for initially wettable samples with
water drop penetration times (WDPT)
< 10 s and TR for initially repellent
samples with WDPT > 10 s.
Besides differences in WC and WDPT, 95% of the repellent samples appear only at
pH < 4.6 whereas wettable samples appear at pH values above and below 4.6.
Furthermore, 95% of the wettable samples only appear with electrical conductivity of soil
solution EC < 270 µS/m, whereas repellent samples cover a range of
100 < EC < 1300 µS/m. Loss on ignition (LoI) and C to N ratio (C/N) (Table 1-1) as well
as soil texture with 85% sand, 11% silt and 5% clay (Schaumann et al., 2005) is
comparable for wettable and repellent samples.
Table 1-1 Water content (WC), loss on ignition (LoI), pH, electrical conductivity, C to N ratio (C/N) and water drop penetration time in field moist state (WDPTfm) and in air dried state (WDPTad) of wettable and repellent samples from Tiergarten TW and TR, respectively.
WC LoI pH EC C/N WDPTfm WDPTad
% % (CaCl2) µS/m h h
TW N 34 34 34 28 29 37 30
mean (SD) 20 (8) 10 (4) 4.8 (0.6) 140 (130) 14 (2) 0 (0) 0 (0)
TR N 24 23 23 20 18 25 20
mean (SD) 17 (12) 10 (4) 4.1 (0.3) 480 (490) 14 (1) 6 (4) 6 (4)
1 General introduction
14
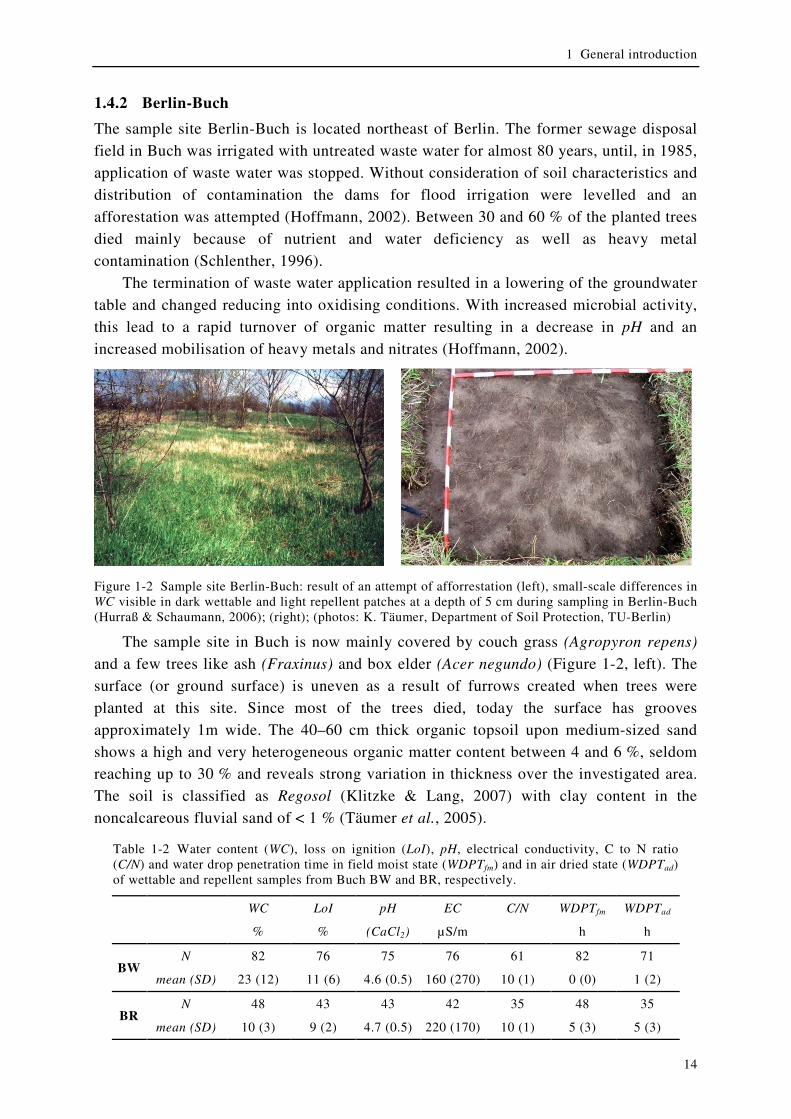
1.4.2 Berlin-Buch
The sample site Berlin-Buch is located northeast of Berlin. The former sewage disposal
field in Buch was irrigated with untreated waste water for almost 80 years, until, in 1985,
application of waste water was stopped. Without consideration of soil characteristics and
distribution of contamination the dams for flood irrigation were levelled and an
afforestation was attempted (Hoffmann, 2002). Between 30 and 60 % of the planted trees
died mainly because of nutrient and water deficiency as well as heavy metal
contamination (Schlenther, 1996).
The termination of waste water application resulted in a lowering of the groundwater
table and changed reducing into oxidising conditions. With increased microbial activity,
this lead to a rapid turnover of organic matter resulting in a decrease in pH and an
increased mobilisation of heavy metals and nitrates (Hoffmann, 2002).
Figure 1-2 Sample site Berlin-Buch: result of an attempt of afforrestation (left), small-scale differences in WC visible in dark wettable and light repellent patches at a depth of 5 cm during sampling in Berlin-Buch (Hurraß & Schaumann, 2006); (right); (photos: K. Täumer, Department of Soil Protection, TU-Berlin)
The sample site in Buch is now mainly covered by couch grass (Agropyron repens)
and a few trees like ash (Fraxinus) and box elder (Acer negundo) (Figure 1-2, left). The
surface (or ground surface) is uneven as a result of furrows created when trees were
planted at this site. Since most of the trees died, today the surface has grooves
approximately 1m wide. The 40–60 cm thick organic topsoil upon medium-sized sand
shows a high and very heterogeneous organic matter content between 4 and 6 %, seldom
reaching up to 30 % and reveals strong variation in thickness over the investigated area.
The soil is classified as Regosol (Klitzke & Lang, 2007) with clay content in the
noncalcareous fluvial sand of < 1 % (Täumer et al., 2005).
Table 1-2 Water content (WC), loss on ignition (LoI), pH, electrical conductivity, C to N ratio (C/N) and water drop penetration time in field moist state (WDPTfm) and in air dried state (WDPTad) of wettable and repellent samples from Buch BW and BR, respectively.
WC LoI pH EC C/N WDPTfm WDPTad
% % (CaCl2) µS/m h h
BW N 82 76 75 76 61 82 71
mean (SD) 23 (12) 11 (6) 4.6 (0.5) 160 (270) 10 (1) 0 (0) 1 (2)
BR N 48 43 43 42 35 48 35
mean (SD) 10 (3) 9 (2) 4.7 (0.5) 220 (170) 10 (1) 5 (3) 5 (3)
1 General introduction
15
Comparable to the sampling from Tiergarten, wettable and repellent samples in a
field moist state were taken at a depth of 10-20 cm at distances of about 10 cm apart and
named as BW for initially wettable samples with water drop penetration times (WDPT)
< 10 s and BR for initially repellent samples with WDPT > 10 s. Samples of each
sampling differed significantly in field moist WC and WDPT (Figure 1-2, right) but
revealed comparable values of LoI, pH, EC and C/N. In contrast to Tiergarten samples,
which kept the differences in WDPT, initially wettable Buch samples lost their
wettability and reached a degree of SWR comparable to that of initially repellent samples
(Table 1-2).
2 Theoretical background
16
2 Theoretical background
2.1 Water repellency
Water repellency is a surface property of a solid which impedes complete wetting, i.e. it
prevents water from spreading on its surface and forming a continuous water layer.
Instead, a water repellent surface causes partial wetting, i.e. the water is forced to ball up
as droplets with a finite contact angle. To understand the physical background, the
interfacial tensions of the three adjacent phases vapour (v), liquid (l) and solid (s) have to
be considered. The surface tension of a substance (i.e., the interfacial tension between
this substance and the surrounding vapour phase) is based on the difference in energetic
state between molecules in the bulk phase and the molecules at the surface. The
molecules at the surface are attracted by a reduced number of neighbours and therefore in
an energetically unfavourable state. The creation of new surfaces is thus energetically
costly, and a fluid system will act to minimize surface areas. Principally, the same is
valid for solid surfaces although solid surfaces cannot react in minimizing surface areas
like fluids. The interfacial tension γab between the phases a and b can be described (a) by
the energy E that is needed to increase the surface area As (Schwuger, 1996):
knVT
abs
ab
A
E
,,
∂
∂=γ (2-1)
or (b) by the force F that is needed to increase the length of the perimeter ls of the
respective surface area:
knVT
abs
ab
l
F
,,
∂
∂=γ (2-2)
Consequently interfacial tension has the dimension of [N m-1] or [J m-2].
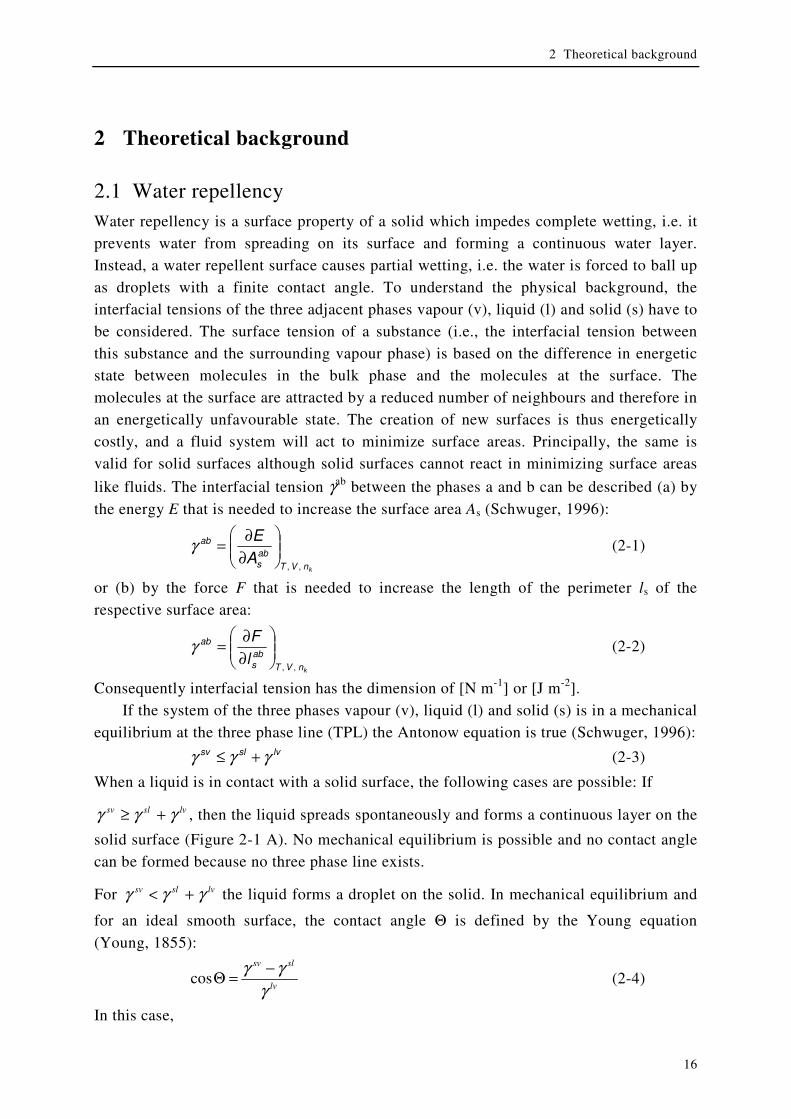
If the system of the three phases vapour (v), liquid (l) and solid (s) is in a mechanical
equilibrium at the three phase line (TPL) the Antonow equation is true (Schwuger, 1996): lvslsv γγγ +≤ (2-3)
When a liquid is in contact with a solid surface, the following cases are possible: If
lvslsv γγγ +≥ , then the liquid spreads spontaneously and forms a continuous layer on the
solid surface (Figure 2-1 A). No mechanical equilibrium is possible and no contact angle
can be formed because no three phase line exists.
For lvslsv γγγ +< the liquid forms a droplet on the solid. In mechanical equilibrium and
for an ideal smooth surface, the contact angle Θ is defined by the Young equation
(Young, 1855):
lv
slsv
γ
γγ −=Θcos (2-4)
In this case,
2 Theoretical background
17
if slsv γγ < then cos Θ < 0, i.e., Θ < 90° (Figure 2-1 B),
if slsv γγ = then cos Θ = 0, i.e., Θ = 90° (Figure 2-1 C),
if slsv γγ > then cos Θ > 0, i.e., Θ > 90° (Figure 2-1 D).
If lvslsv γγγ += then, according to Equation (2-4), Θ = 0 and the limit case between
complete wetting (spontaneous spreading) and partial wetting is reached.
γsl γ
sl γsl
γsv
γsv γ
sv
γlv γ
lv
γlv
Θ ΘΘ
Θ < 90° Θ
= 90° Θ > 90°Θ
= 0°
B C DA
Figure 2-1 Interfacial tensions at the three phase line (TPL) of the adjacent liquid, solid and vapour phase for various contact angles Θ.
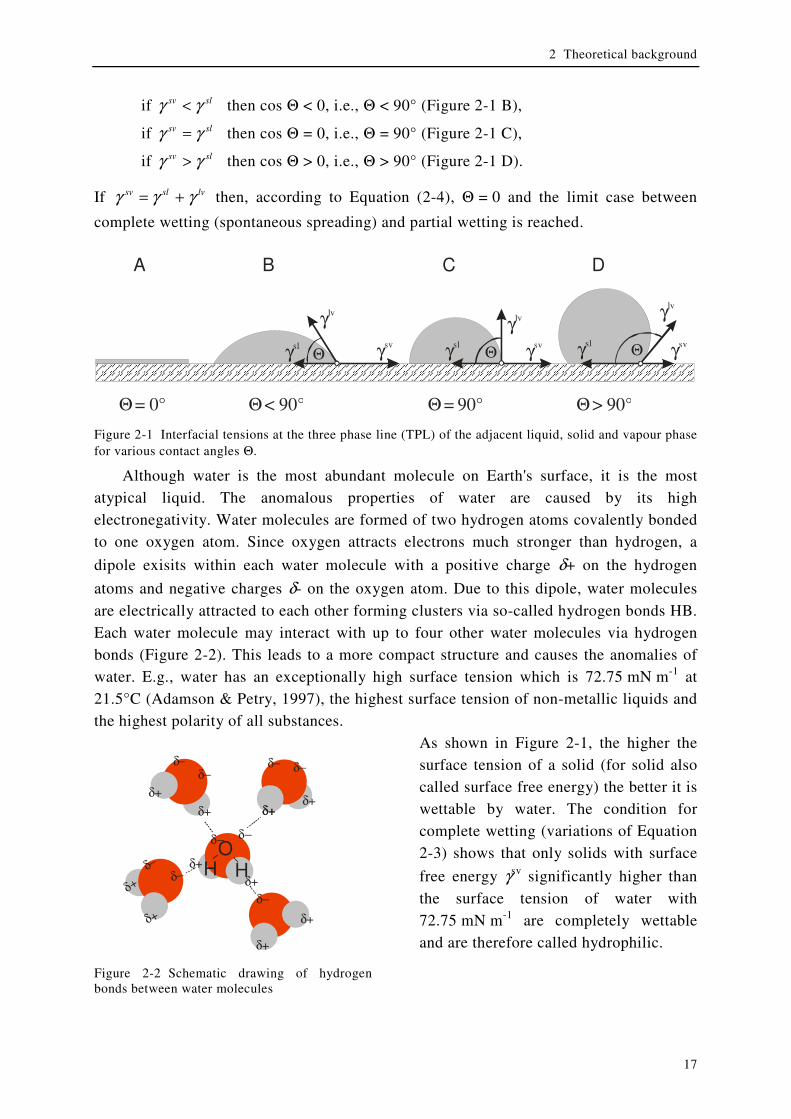
Although water is the most abundant molecule on Earth's surface, it is the most
atypical liquid. The anomalous properties of water are caused by its high
electronegativity. Water molecules are formed of two hydrogen atoms covalently bonded
to one oxygen atom. Since oxygen attracts electrons much stronger than hydrogen, a
dipole exisits within each water molecule with a positive charge δ+ on the hydrogen
atoms and negative charges δ- on the oxygen atom. Due to this dipole, water molecules
are electrically attracted to each other forming clusters via so-called hydrogen bonds HB.
Each water molecule may interact with up to four other water molecules via hydrogen
bonds (Figure 2-2). This leads to a more compact structure and causes the anomalies of
water. E.g., water has an exceptionally high surface tension which is 72.75 mN m-1 at
21.5°C (Adamson & Petry, 1997), the highest surface tension of non-metallic liquids and
the highest polarity of all substances.
HO
Hδ+
δ+
δ− δ−
δ+
δ−
δ+
δ−
δ+δ+
δ+
δ+
δ+
δ−
δ+
δ+
δ−δ−δ−
δ−
Figure 2-2 Schematic drawing of hydrogen bonds between water molecules
As shown in Figure 2-1, the higher the
surface tension of a solid (for solid also
called surface free energy) the better it is
wettable by water. The condition for
complete wetting (variations of Equation
2-3) shows that only solids with surface
free energy γsv significantly higher than
the surface tension of water with
72.75 mN m-1 are completely wettable
and are therefore called hydrophilic.
2 Theoretical background
18
Since the so-called high energy solids are substances which are held together by
strong chemical bonds (e.g. covalent, ionic, or metallic bonds), they are very hard and
have a high melting point like in metals, glass, ceramics or minerals. Low energy solids
like non-polar organic substances are much softer, have a lower melting point and are
held together by weaker non-covalent bonds (e.g. Van der Waals bonds). All of these
partially wettable substances have a surface free energy lower than 72.75 mN m-1 and are
therefore called hydrophobic.
2.2 Determination of repellency
2.2.1 Water drop penetration time (WDPT)
Water drop penetration time is a very simple and rapid method to obtain a measure of the
resistance of repellency. A drop of water is placed on a flattened soil surface and the time
needed for the drop to penetrate into the soil is recorded (Letey, 1969). For a better
reproducibility, soil samples are sieved, placed on a dish, and the surface is smoothed to
provide comparable conditions (Wallis & Horne, 1992) because surface roughness and
pore geometry have an effect on the penetration process (Wessel, 1988). In many studies,
the applied drop volume is not reported or varies, e.g, between 0.035 mL (Kostka, 2000)
and 0.200 mL (Wallach & Graber, 2007). Drops of higher volumes underlie the influence
of gravity and their penetration may be accelerated by hydrological pressure. At the same
time, they are larger than the largest pores in the soil sample (Roy & McGill, 2002) and
by covering a larger area they are better in considering the heterogeneity of soil material.
Even the number of repetitions differs between several studies. Most often, however,
three drops for each sample are applied and considered as sufficient for SWR
determination (e.g. Dekker & Ritsema, 1994; Doerr et al., 2006; Wallach & Graber,
2007). As temperature and ambient relative humidity affect the penetration time a
constant defined temperature, e.g. between 18 and 23°C (Richardson, 1984), and a
calibration to a defined ambient relative humidity (Bisdom et al., 1993) enhance
comparability of results.
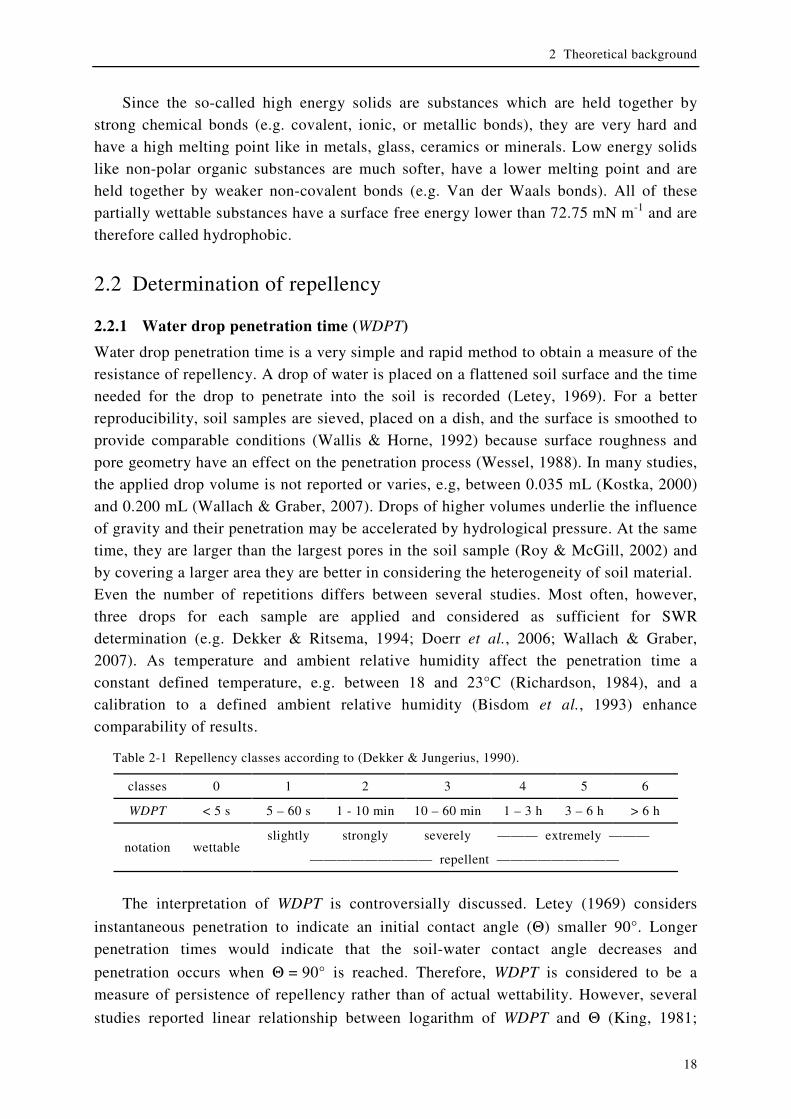
Table 2-1 Repellency classes according to (Dekker & Jungerius, 1990).
classes 0 1 2 3 4 5 6
WDPT < 5 s 5 – 60 s 1 - 10 min 10 – 60 min 1 – 3 h 3 – 6 h > 6 h
notation wettable slightly strongly severely ——— extremely ———
————————— repellent —————————
The interpretation of WDPT is controversially discussed. Letey (1969) considers
instantaneous penetration to indicate an initial contact angle (Θ) smaller 90°. Longer
penetration times would indicate that the soil-water contact angle decreases and
penetration occurs when Θ = 90° is reached. Therefore, WDPT is considered to be a
measure of persistence of repellency rather than of actual wettability. However, several
studies reported linear relationship between logarithm of WDPT and Θ (King, 1981;
2 Theoretical background
19
Wessel, 1988; Buczko et al., 2006). WDPT related to 90° of these studies, however, are
ranging between < 1 s and several minutes. Therefore, the distinction between wettable
and repellent soils using WDPT can be only arbitrary. A widely accepted practise is the
interpretation of WDPT using repellency classes (Table 2-1) as suggested by (Dekker &
Jungerius, 1990).
2.2.2 Contact angle by Capillary Rise Method
The capillary rise method (CRM) is a common method to determine wettability of porous
material (e.g., Siebold et al., 1997; Michel et al., 2001; Goebel et al., 2004) which is at
least partially wettable, i.e., with Θ < 90°. The measurement principle is based on the
Washburn equation for rising flow in a vertical thin cylindrical capillary (Washburn,
1921):
trhlv
adv
η
γ
2
cos2 Θ= (2-5)
By means of capillary forces, a liquid with a surface tension γlv and a viscosity η in a
capillary with the advancing contact angle Θadv and the radius r reaches height h at the
time t. In porous media the pores where liquid can penetrate are not ideally cylindrical.
Thus r is substituted by a geometrical factor C reflecting porosity and tortuosity of the
pores. This factor depends on particle size and packing density of the measured medium.
Since in porous media the height h is difficult to measure it is substituted by:
C
wh
πρ= (2-6)
where w is the weight of risen water, which can easily be detected by a balance, and ρ is
the density of the liquid. The substitution of the height in Equation (2-5) by Equation
(2-6) and solving for cos Θadv leads to:
=Θ
22
2 2cos
ρπγ
η
Ct
wlvadv (2-7)
For applications in soil science, the samples are filled in tubes with a liquid permeable
bottom, e.g., a glass frit. In order to obtain reproducible results, the samples have to be
compacted in a defined way and kept at a controlled temperature during measurement.
The tubes are suspended from a balance and the glass frit bottom brought into contact to
the surface of the wetting liquid. The rate of liquid rise can be measured by recording the
increase in weight as a function of time. The geometry factor C has to be determined for
each sample by additional measurements with an optimally wetting liquid, e.g., n-hexane,
whose advancing angle is virtually 0°, i.e., cos Θadv = 1. The factor C can be calculated in
the range of linear increase of ∆w2 by the slope of w2 as a function of t with the constant
term in brackets of Equation (2-8), where η, γlv and ρ are the properties of the optimally
wetting liquid, e.g., n-hexane.
=
22
2 2
ρπγ
ηlvt
wC (2-8)

2 Theoretical background
20
The advancing contact angle is calculated based on Equation (2-7) in the range of
linear increase of ∆w2 by multiplying the slope of w2 as a function of t with the constant
term in brackets of Equation (2-7). Measurements are generally carried out by a special
device, a contact angle tensiometer, with sensitive balances, motor driven plates for the
liquid vessel with precise programmable positions, temperature control and software
which records weight changes in the sample, temperature and position of the liquid table
and offers the calculation of the respective parameter.
However, besides restriction of this method to samples with Θadv < 90°, many
researchers recognized additional disadvantages of CRM. Marmur (1992) and Siebold et
al. (2000) reported that Θadv measured by CRM is often overestimated in comparison
with corresponding equilibrium contact angles. Furthermore, contact time of the sample
with the testing liquid depends on Θadv and may lead to systematic errors, e.g., due to
sorption kinetics of the vapour on the solid surface (Bachmann et al., 2006).
2.2.3 Contact angle by Wilhelmy Plate Method
An additional method of contact angle determination is the Wilhelmy plate method. This
method is based on the following principle (Wilhelmy, 1863): the weight of a solid plate
immersed into a liquid is subjected to gravitational force acting vertically downwards;
the buoyancy acting vertically upwards and the surface force acting along the liquid
vapour interface directly at the three phase line (Figure 2-3). The acting gravitational
force depends on weight wp of the plate
ppg wgmF == (2-9)
and the buoyancy on density ρl and volume Vl of the displaced liquid which can be
expressed by the immersion depth of the plate z and the cross sectional area of the plate
Ap:
gzAF plb ρ= (2-10)
Θ
Fb
FgFs
z
ΘFb
Fg
Fs
z
Θ < 90° Θ > 90°
Figure 2-3 Gravitational force Fg, buoyancy Fb and surface force Fs acting at the three phase line of a Wilhelmy plate immersed into a liquid with liquid-solid contact angle below and above 90°.
The surface force depends on the surface tension of the liquid and the wetted length Lw,
i.e., the perimeter of the plate, ls. Since the surface force does not act in the same
direction as gravitation and buoyancy, the resulting force is the surface force multiplied
by cos Θadv.
2 Theoretical background
21
wlv
s LF γΘ= cos (2-11)
When balanced, the sum of these forces (Equation (2-9), (2-10), and (2-11) is zero:
0cos =+−Θ pplwlv
adv wgzAL ργ (2-12)
and can be expressed as the change of weight of the plate as a function of immersion
depth z with Fs as the intercept:
wlv
advplp LzgAw γρ Θ−=∆ cos (2-13)
In order to measure the advancing contact angle Θadv by a tensiometer, a plate of the
sample material is suspended from a balance, the vessel with the respective liquid is
lifted with a defined speed and the plate immerses while the balance records changes in
weight ∆wp as a function of immersion depth z. The cos Θadv can be calculated by
dividing the intercept of this function, i.e., Fs, by Lw γlv. When maximum immersion
depth is reached the vessel with the liquid is lowering and the plate emerges from the
liquid. The receding contact angle is calculated in the same way with ∆wp as a function of
z during emersion. An important advantage of the Wilhelmy Plate Method is that it
theoretically covers the whole Θ range between 0 and 180° and that the measurement is
comparably fast.
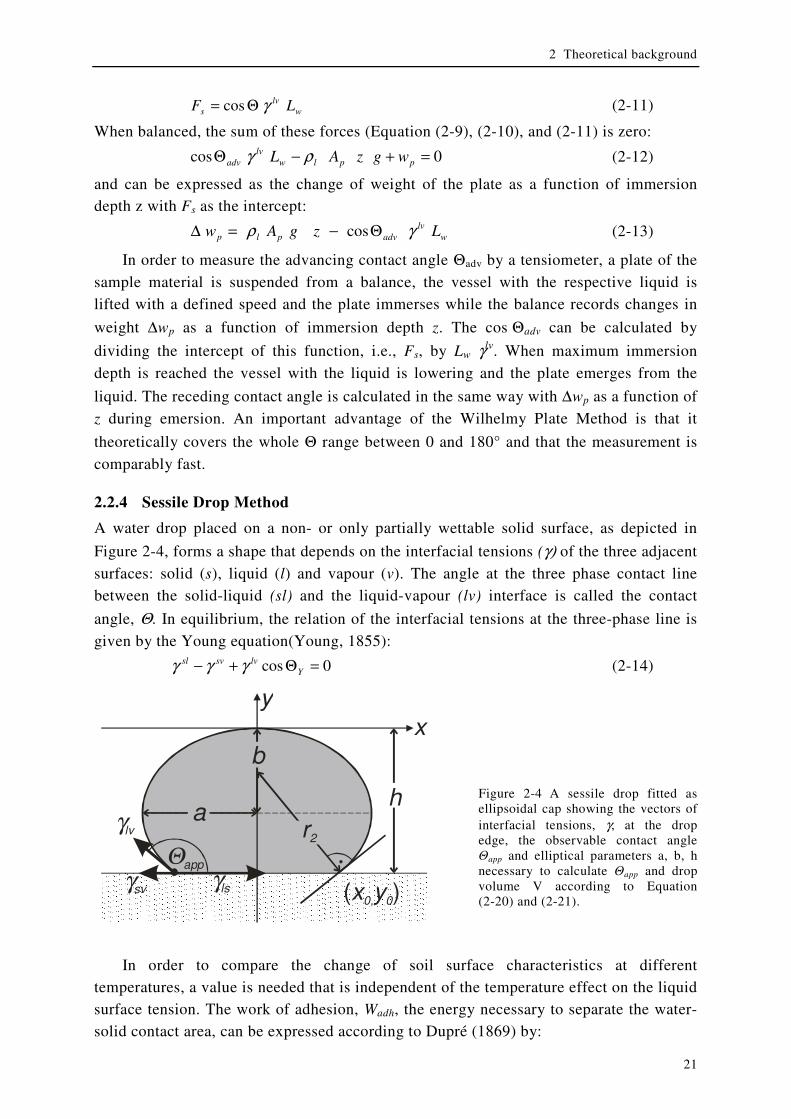
2.2.4 Sessile Drop Method
A water drop placed on a non- or only partially wettable solid surface, as depicted in
Figure 2-4, forms a shape that depends on the interfacial tensions (γ) of the three adjacent
surfaces: solid (s), liquid (l) and vapour (v). The angle at the three phase contact line
between the solid-liquid (sl) and the liquid-vapour (lv) interface is called the contact
angle, Θ. In equilibrium, the relation of the interfacial tensions at the three-phase line is
given by the Young equation(Young, 1855):
0cos =Θ+− Ylvsvsl γγγ (2-14)
y
( )x y0, 0
Θapp
x
γlv
γsv γls
r2
a
b
h
Figure 2-4 A sessile drop fitted as ellipsoidal cap showing the vectors of interfacial tensions, γ, at the drop edge, the observable contact angle Θapp and elliptical parameters a, b, h necessary to calculate Θapp and drop volume V according to Equation (2-20) and (2-21).
In order to compare the change of soil surface characteristics at different
temperatures, a value is needed that is independent of the temperature effect on the liquid
surface tension. The work of adhesion, Wadh, the energy necessary to separate the water-
solid contact area, can be expressed according to Dupré (1869) by:

2 Theoretical background
22
( )Ylv
adhW Θ+= cos1γ (2-15)
For determination of Θ for a sessile drop, various techniques are applied. Using the
static method, equilibrium contact angle Θ is measured for a drop on a solid surface with
a constant volume. Using the dynamic method the largest advancing contact angle Θadv
and the smallest receding contact angle Θrec are determined by increasing or decreasing
drop volume, respectively. In the simplest method, the user measures the contact angle
visually by a microscope equipped with a goniometer scale. Currently available software-
driven systems with high resolution cameras make it possible to automatically capture
and analyse sessile drop contact angles under various environmental conditions.
A simplified method is used in this study; the soil samples are fixed by double sided
adhesive tape on a glass slide (Bachmann et al., 2000b). Pictures of droplets on soil
samples taken by a digital camera are used for geometrical analysis of drop shape and
calculation of the respective contact angles. In contrast to Bachmann et al. (2000b), who
applied drop volumes of 2 – 10 µL and used a microscope for determination of sessile
drop contact angle, in this study the drops contain a volume of 100 µL. The large area
covered by one drop better considers the high inhomogeneity of the investigated humus
sandy samples.
2.3 Influence of gravity, surface roughness and chemical
heterogeneity on contact angle determination of soil samples
2.3.1 Influence of gravity on static sessile drop contact angle
Equation (2-14) and (2-15) are dealing with the Young´s law contact angle ΘY and are
therefore only applicable for ideally smooth surfaces and drop sizes smaller than a tenth
of the capillary length (κ -1)
2
1
1
∆=−
g
lv
ρ
γκ (2-16)
so that gravity can be neglected and the drop shape can be assumed as spherical cap
(McHale et al., 2001).
In order to consider the inhomogeneity of soil samples, this study deals with drop
volumes of 100 µl. Initial drop heights up to 4 mm are significantly larger than
κ -1 ≈ 2.7 mm (for water). In this case, under consideration of the hydrostatic pressure,
the Young – Laplace equation (Stenius, 1994):
+=∆
21
11
rrp lvγ (2-17)
changes according to Schwuger (1996) to
+=∆+=∆
21
0
0
112
rryg
rp lv
lv
γργ
(2-18)
where r0 is the radius of curvature at the drop apex at y = 0, where the hydrostatic
pressure p is zero, and r1 and r2 are the radii of curvature of the drop surface at (x0, y0)
2 Theoretical background
23
(Schwuger, 1996). A transformation into a set of three differential equations as
formulated by Bashforth and Adams (1882) allows a numerical solution for the drop
shape, as used by various authors in combination with image analysis software
(Bashforth & Adams, 1883; Lin et al., 1996; de Ruijter et al., 1998; Spiros & Savvas,
1998).
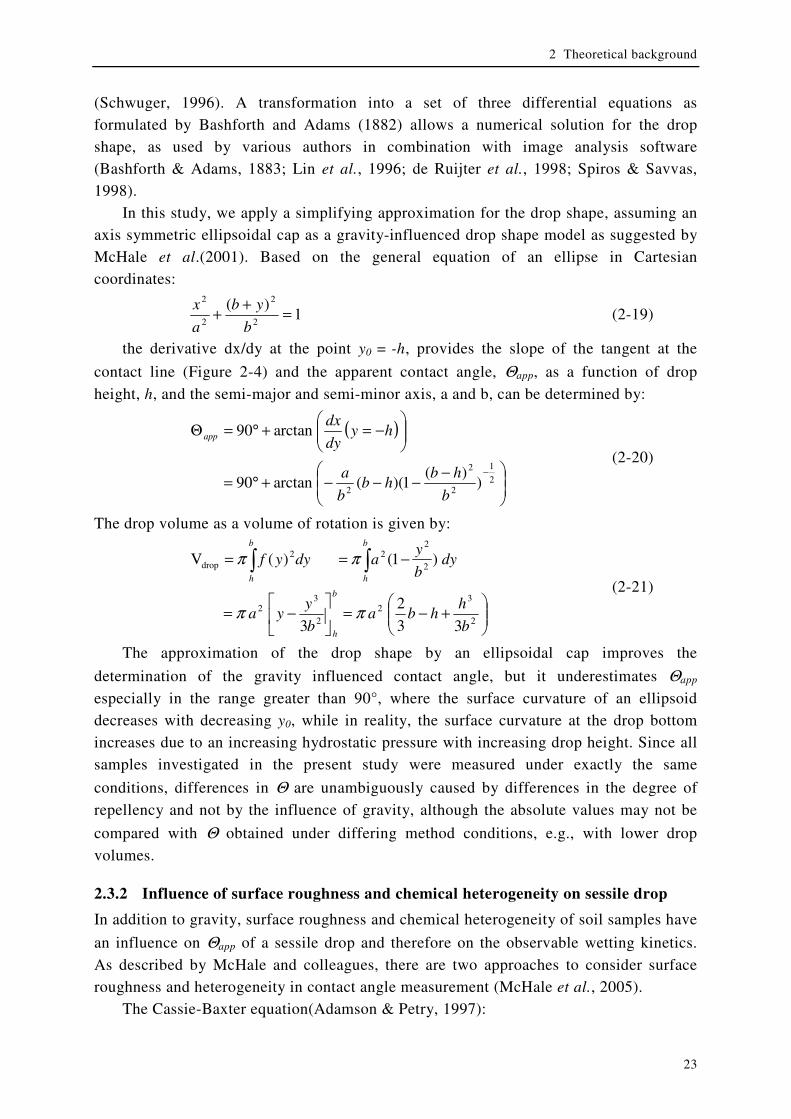
In this study, we apply a simplifying approximation for the drop shape, assuming an
axis symmetric ellipsoidal cap as a gravity-influenced drop shape model as suggested by
McHale et al.(2001). Based on the general equation of an ellipse in Cartesian
coordinates:
1)(
2
2
2
2
=+
+b
yb
a
x (2-19)
the derivative dx/dy at the point y0 = -h, provides the slope of the tangent at the
contact line (Figure 2-4) and the apparent contact angle, Θapp, as a function of drop
height, h, and the semi-major and semi-minor axis, a and b, can be determined by:
( )
−−−−+°=
−=+°=Θ
−2
1
2
2
2)
)(1)((arctan90
arctan90
b
hbhb
b
a
hydy
dxapp
(2-20)
The drop volume as a volume of rotation is given by:
+−=
−=
−== ∫∫
2
32
2
32
2
222
drop
33
2
3
)1()(V
b
hhba
b
yya
dyb
yadyyf
b
h
b
h
b
h
ππ
ππ
(2-21)
The approximation of the drop shape by an ellipsoidal cap improves the
determination of the gravity influenced contact angle, but it underestimates Θapp
especially in the range greater than 90°, where the surface curvature of an ellipsoid
decreases with decreasing y0, while in reality, the surface curvature at the drop bottom
increases due to an increasing hydrostatic pressure with increasing drop height. Since all
samples investigated in the present study were measured under exactly the same
conditions, differences in Θ are unambiguously caused by differences in the degree of
repellency and not by the influence of gravity, although the absolute values may not be
compared with Θ obtained under differing method conditions, e.g., with lower drop
volumes.
2.3.2 Influence of surface roughness and chemical heterogeneity on sessile drop
In addition to gravity, surface roughness and chemical heterogeneity of soil samples have
an influence on Θapp of a sessile drop and therefore on the observable wetting kinetics.
As described by McHale and colleagues, there are two approaches to consider surface
roughness and heterogeneity in contact angle measurement (McHale et al., 2005).
The Cassie-Baxter equation(Adamson & Petry, 1997):
2 Theoretical background
24
∑ Θ≡Θ iytot
ism A
A,coscos (2-22)
applies for the contact angle Θsm of a smooth chemically heterogeneous surface, which is
composed by different materials with different respective Young´s law contact angles,
Θy,i, where Ai is the area of the material i and Atot is the total area.
Wenzel’s equation (Wenzel, 1949)
smgeo
actr A
AΘ=Θ coscos
(2-23)
applies for the contact angle Θr of a rough surface of an chemical homogenous material,
where the liquid follows the profile at any point of the contact area so that the actual
contact area, Aact, is greater than its planar projection, the geometric area, Ageo. At the so-
called Wenzel state, an increasing roughness results in an increase of Θr for materials
with Θy > 90 and in a decrease of Θr for materials with Θy < 90°.
Gaps between dry particles smaller than a tenth of κ-1 may be bridged by the water,
so that a fraction of the water-soil contact area is represented by the included air, which
has the contact angle of 180° against water (McHale et al., 2005). Simplifying a
horizontal interface between included air and water with Equation (2-22) the effective
contact angle Θeff can be expressed according to McHale and co-workers (McHale et al.,
2005) by:
( )
−−Θ=Θ
tot
sgeor
tot
sgeoeff A
A
A
A ,,1coscos , (2-24)
where Ageo,s is the water covered solid area. The state of a water-“rough solid” interface,
where the effect of included air dominates the Wenzel effect on Θeff, is called Cassie-
Baxter state (McHale et al., 2005).
In natural soil samples, a combination of all the above described effects has to be
assumed, and the observable effective contact angle, Θeff, can be expressed as a
combination of Equations (2-22), (2-23) and (2-24)
tot
geo
iiY
tot
i
tot
act
tot
geosm
geo
act
tot
geoeff
A
A
A
A
A
A
A
A
A
A
A
A
+−Θ=
+−Θ=Θ
∑ 1cos
1coscos
,
(2-25)
A recent study (Bachmann & McHale, in press) approaches the influence of surface
roughness on sessile drop contact angle by considering soil particles as ideally smooth
spheres with a uniform radius r and a constant distance 2 ε r between each other. Then
the planar projection of soil surface can be divided into identical subunits in the form of
equilateral triangles with a side length of 2 (1 + ε) r and with the top point of one of three
adjacent spheres at each angle (McHale et al., 2007). By this model,
( )( )2
2
132
sin,
ε
πε
+
Θ=Θ= Y
Ytot
geo fA
A (2-26)
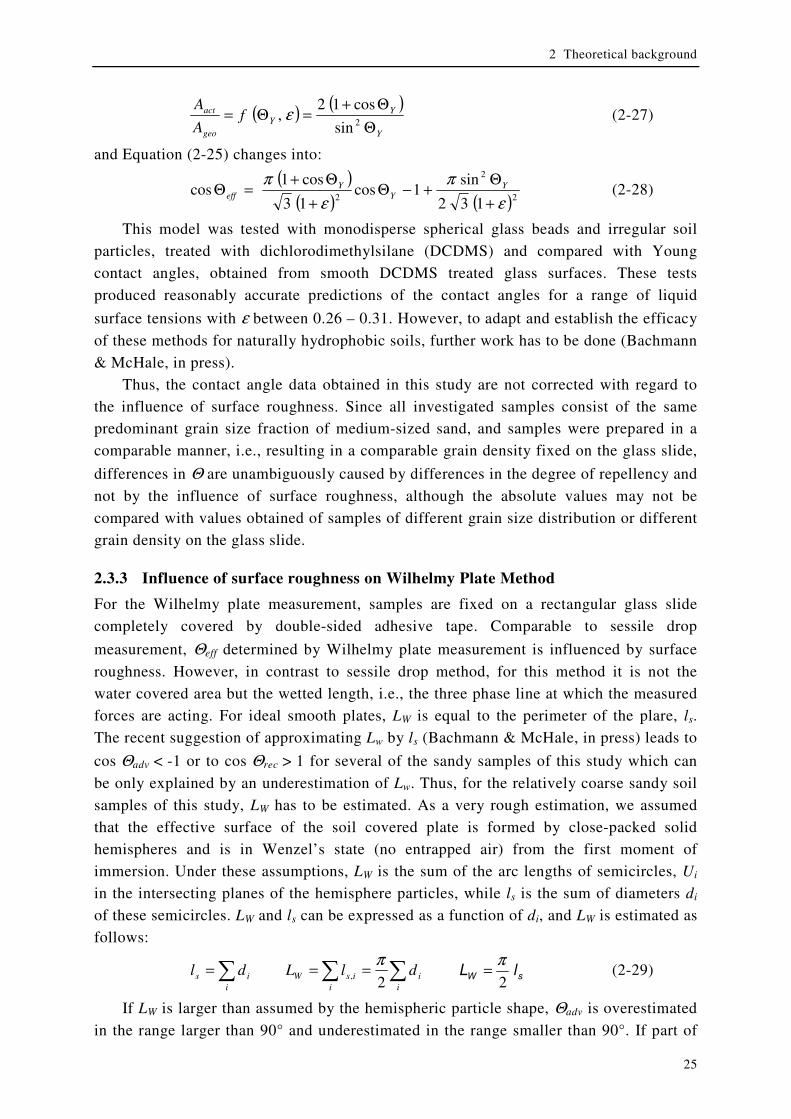
2 Theoretical background
25
( )( )
Y
YY
geo
act fA
A
Θ
Θ+=Θ=
2sin
cos12, ε (2-27)
and Equation (2-25) changes into:
( )( ) ( )2
2
2 132
sin1cos
13
cos1cos
ε
π
ε
π
+
Θ+−Θ
+
Θ+=Θ Y
YY
eff (2-28)
This model was tested with monodisperse spherical glass beads and irregular soil
particles, treated with dichlorodimethylsilane (DCDMS) and compared with Young
contact angles, obtained from smooth DCDMS treated glass surfaces. These tests
produced reasonably accurate predictions of the contact angles for a range of liquid
surface tensions with ε between 0.26 – 0.31. However, to adapt and establish the efficacy
of these methods for naturally hydrophobic soils, further work has to be done (Bachmann
& McHale, in press).
Thus, the contact angle data obtained in this study are not corrected with regard to
the influence of surface roughness. Since all investigated samples consist of the same
predominant grain size fraction of medium-sized sand, and samples were prepared in a
comparable manner, i.e., resulting in a comparable grain density fixed on the glass slide,
differences in Θ are unambiguously caused by differences in the degree of repellency and
not by the influence of surface roughness, although the absolute values may not be
compared with values obtained of samples of different grain size distribution or different
grain density on the glass slide.
2.3.3 Influence of surface roughness on Wilhelmy Plate Method
For the Wilhelmy plate measurement, samples are fixed on a rectangular glass slide
completely covered by double-sided adhesive tape. Comparable to sessile drop
measurement, Θeff determined by Wilhelmy plate measurement is influenced by surface
roughness. However, in contrast to sessile drop method, for this method it is not the
water covered area but the wetted length, i.e., the three phase line at which the measured
forces are acting. For ideal smooth plates, LW is equal to the perimeter of the plare, ls.
The recent suggestion of approximating Lw by ls (Bachmann & McHale, in press) leads to
cos Θadv < -1 or to cos Θrec > 1 for several of the sandy samples of this study which can
be only explained by an underestimation of Lw. Thus, for the relatively coarse sandy soil
samples of this study, LW has to be estimated. As a very rough estimation, we assumed
that the effective surface of the soil covered plate is formed by close-packed solid
hemispheres and is in Wenzel’s state (no entrapped air) from the first moment of
immersion. Under these assumptions, LW is the sum of the arc lengths of semicircles, Ui
in the intersecting planes of the hemisphere particles, while ls is the sum of diameters di
of these semicircles. LW and ls can be expressed as a function of di, and LW is estimated as
follows:
∑ ∑∑ ===i i
iisWi
is dlLdl2
,
πsW lL
2
π= (2-29)
If LW is larger than assumed by the hemispheric particle shape, Θadv is overestimated
in the range larger than 90° and underestimated in the range smaller than 90°. If part of

2 Theoretical background
26
the gaps between the soil particles remains air filled after immersion, what probably
happens in the range > 90° is that Θadv is overestimated as well. J. Bachmann (personal
communication, 2006) obtained a factor of 0.7-0.8 to reduce the cosΘadv measured by
Wilhelmy plate method and calculated the possible consequences for the wetted length
and included air. The good accordance of Equation (2-29) with the estimation by J.
Bachmann shows that our assumption is applicable, and therefore we corrected the
geometric circumference ls with the factor π / 2 according to Equation (2-29). This leads
invariably to reasonable results of cos Θadv and cos Θrec. In contrast to Bachmann &
McHale (in press), who considered the mean of cos Θadv and cos Θrec as equilibrium
contact angle, in this study, only Θadv is considered since it cannot be excluded that
surface properties have been changed during the immersion and emersion time. With an
immersion depth of 10 mm and an immersion speed of 0.2 mm s-1, the samples are in
contact with water for 100 s. The results of time dependent sessile drop measurement
suggest that the strongest change in surface properties occur especially in the first
minutes.
2.4 Wetting kinetics by time dependent sessile drop method
Thermodynamics and kinetics in chemistry are often confused. Thermodynamic, other
than indicated by the word “dynamic”, describes how stable a system is in one state
versus another state. In contrast, kinetics describes how quickly or slowly the system
changes from one state to another state. Generally, systems are only spontaneously
changing from a less stable state into a more stable state with a reduction in free energy
(∆G). But even if the products have a significantly lower free energy than the reactants, a
reaction will not happen in practice if the reaction is too slow. This is for instance the
case if an activated transition state during the reaction has a higher free energy than the
reactants. Such an energy barrier which has to overcome by input of energy before a
reaction occurs is called activation energy EA. Kinetic investigations allow the
determination of EA.
To investigate wetting kinetics, a depicted parameter of surface characteristic is
monitored as function of time and rate constants are extracted from the respective time
law. The parameter of interest in this study is the Young contact angle and the work of
adhesion (Equation (2-15)). According to the Arrhenius equation, the temperature
dependence of the rate constant, k, of this time law allows the calculation of the
activation energy, EA, which is the minimum energy necessary for a specific process to
occur (Wedler, 1987):
RT
EAk A−= lnln (2-30)
The activation energy gives information about nature of the rate limiting step of the
investigated process. Chemical reactions are characterised by EA > 60 kJ mol-1, while
physically controlled processes require EA < 42 kJ mol-1 (Sparks, 1985).
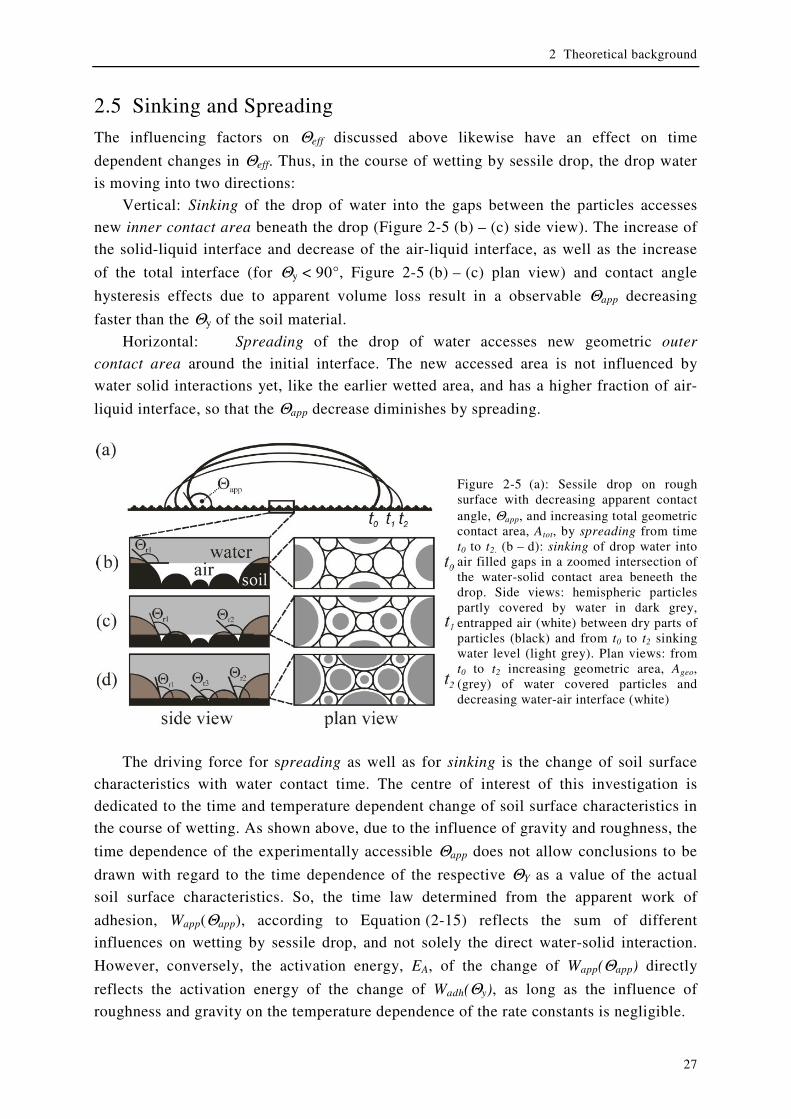
2 Theoretical background
27
2.5 Sinking and Spreading
The influencing factors on Θeff discussed above likewise have an effect on time
dependent changes in Θeff. Thus, in the course of wetting by sessile drop, the drop water
is moving into two directions:
Vertical: Sinking of the drop of water into the gaps between the particles accesses
new inner contact area beneath the drop (Figure 2-5 (b) – (c) side view). The increase of
the solid-liquid interface and decrease of the air-liquid interface, as well as the increase
of the total interface (for Θy < 90°, Figure 2-5 (b) – (c) plan view) and contact angle
hysteresis effects due to apparent volume loss result in a observable Θapp decreasing
faster than the Θy of the soil material.
Horizontal: Spreading of the drop of water accesses new geometric outer
contact area around the initial interface. The new accessed area is not influenced by
water solid interactions yet, like the earlier wetted area, and has a higher fraction of air-
liquid interface, so that the Θapp decrease diminishes by spreading.
Figure 2-5 (a): Sessile drop on rough surface with decreasing apparent contact angle, Θapp, and increasing total geometric contact area, Atot, by spreading from time t0 to t2. (b – d): sinking of drop water into air filled gaps in a zoomed intersection of the water-solid contact area beneeth the drop. Side views: hemispheric particles partly covered by water in dark grey, entrapped air (white) between dry parts of particles (black) and from t0 to t2 sinking water level (light grey). Plan views: from t0 to t2 increasing geometric area, Ageo, (grey) of water covered particles and decreasing water-air interface (white)
The driving force for spreading as well as for sinking is the change of soil surface
characteristics with water contact time. The centre of interest of this investigation is
dedicated to the time and temperature dependent change of soil surface characteristics in
the course of wetting. As shown above, due to the influence of gravity and roughness, the
time dependence of the experimentally accessible Θapp does not allow conclusions to be
drawn with regard to the time dependence of the respective ΘY as a value of the actual
soil surface characteristics. So, the time law determined from the apparent work of
adhesion, Wapp(Θapp), according to Equation (2-15) reflects the sum of different
influences on wetting by sessile drop, and not solely the direct water-solid interaction.
However, conversely, the activation energy, EA, of the change of Wapp(Θapp) directly
reflects the activation energy of the change of Wadh(Θy), as long as the influence of
roughness and gravity on the temperature dependence of the rate constants is negligible.

3 The nature of wetting on urban soil samples
28
3 The nature of wetting on urban soil samples - Wetting
kinetics and evaporation assessed from sessile drop shape
3.1 Abstract
The understanding of soil water repellency in its complexity requires knowledge of the
mechanisms leading to changes in surface characteristics. Wetting kinetics may serve as
means to investigate the origin of soil water repellency, but have been scarcely
investigated yet. We observed the wetting kinetics of soil samples from two locations via
the time-dependent shape of sessile drop (TISED) at three temperatures.
Our study showed that drop penetration may be exceeded by evaporation for high
WDPT. The time-dependent change of drop shape and apparent contact angle was
explained by surface hydrophilisation including the change from Cassie-Baxter into
Wenzel’s state. We identified principal differences in the nature of water repellency
between the two investigated locations: Only the samples from the former sewage
disposal field Buch lost most initial differences in wettability upon air drying and
storage. Wetting of these samples required activation energy of 65-94 kJ mol-1, indicating
chemical reactions as rate-limiting step. In contrast, wetting of the samples from the
inner city park Tiergarten required activation energy of 42 kJ mol-1 for the repellent and
8-20 kJ mol-1 for the wettable samples, which suggests physico-chemical and physical
processes as rate-limiting steps.
Our study showed for the first time that the process of soil wetting can be monitored
by TISED assessment, and that assessment of the temperature dependence of the wetting
kinetics allows distinguishing between different natures of wetting and soil water
repellency. It therefore represents a novel approach to investigate wetting processes.
Combination of such approaches with spectroscopic investigations will help to deepen
our understanding on possible causes of water repellency. They further help to
understand the great variety of suggested causes of repellency and indicate locational
material-specific effects rather than one general cause for water repellency.
3.2 Introduction
It is widely accepted that soil water repellency is, among others, caused by hydrophobic
organic compounds as coating on mineral surfaces (Bisdom et al., 1993; Doerr et al.,
2000) as well as organic interstitial material (Franco et al., 2000). Numerous
investigations in order to identify chemical compounds causing water repellency
(Ma'shum et al., 1988; Horne & McIntosh, 2000; Doerr et al., 2005b) had been carried
out. Many of these investigations suggest that rather the structural composition and the
arrangement of molecules and functional groups than the amount of certain organic
substances affect water repellency (Doerr et al., 2005b). The factors, however, that
establish the structural composition and arrangement of molecules on the outer side of
3 The nature of wetting on urban soil samples
29
the organic coatings, and which lead to water repellency, are still poorly understood.
Generally, repellent soils become wettable, if they stay long enough in contact with water
(Doerr et al., 2000). In consequence of this, it can be assumed that molecules at organic
matter-water interfaces undergo conformational or structural rearrangement. Differences
of wetting kinetics between wettable and water repellent soil samples may give
information about processes, which break down the repellent character. They may
therefore also allow conclusions about processes inducing water repellency in soils.
Despite the high potential, wetting kinetics of soils has been scarcely investigated
yet. Todoruk and co-workers and Schaumann and co-workers used 1H-NMR Relaxometry
to monitor wetting and swelling kinetics of soil samples (Todoruk et al., 2003a;
Schaumann et al., 2005). The results indicate a pore-scale redistribution of water in the
soil samples, which is, most probably, due to changes in the wettability of pore. Todoruk
and co-workers suggested ester hydrolysis as rate limiting step of water redistribution
(Todoruk et al., 2003a). In contrast to this, Hurraß and Schaumann (2006) suggest, from
drying-remoistening experiments, slow conformational changes as dominating process in
the course of wetting. The results obtained by 1H-NMR Relaxometry do not allow
distinguishing between the processes of water redistribution and changes in surface
characteristics. For a deeper understanding of the wetting process, it is necessary to
directly assess the change in surface characteristics induced by soil-water contact.
We tested the hypothesis, previously suggested by Todoruk and co-workers, that the
process of wetting is controlled by chemical processes like ester hydrolysis. Based on the
assumption, that the contact angle of sessile drops on a soil sample surface reflects the
respective surface characteristics, we compared the spreading kinetics of sessile drops on
wettable and water repellent sample pairs of two highly anthropogenically influenced
urban sites. Under controlled conditions, which prevent evaporation and infiltration, we
assessed the rate limiting step of wetting via the activation energy, obtained from the
temperature dependence of spreading.
3.3 Material and Methods
3.3.1 Sample sites
The research group Interurban has been investigating two strongly anthropogenically
influenced locations on the former sewage disposal fields Buch in the north east of Berlin
and on the inner city park Tiergarten.
The sewage disposal fields in Buch had been irrigated with untreated waste water for
about 80 years, until, in 1985, they stopped to run. Without consideration of soil
characteristics and distribution of contamination the dams were levelled and trees were
planted(Hoffmann, 2002). Between 30 and 60 % of the planted trees died because of
nutrient and water deficiency as well as heavy metal contamination (Schlenther, 1996).
The sample site in Buch is now mainly covered by couch grass (Agropyron repens) and a
few trees like ash (Fraxinus) and box elder (Acer negundo). The surface is slightly wavy
due to the furrows of plantation. The top soil consists of medium sized sand and is

3 The nature of wetting on urban soil samples
30
characterized by high and very heterogeneous organic content. It reveals a strong
variation in thickness over the investigated area. The soil is classified as hortic anthrosol
(Täumer et al., 2005).
The Tiergarten has been in use as a natural park since the 17th century. Between
1945 and 1950, it was totally deforested for firewood production. After 1950, the bomb
and shell craters were filled by rubble and covered by a top soil to start a reforestation
(Wendland, 1993). The area investigated by Interurban is a high frequented meadow with
a light slope. In spring and summer, the grass is periodically cut, fertilized and irrigated.
3.3.2 Sample preparation and characterization
In the present study, one sample pair of each site was taken in a depth of 15-20 cm. It
consists of two neighboured samples (maximal 20 cm of distance), which differ strongly
in actual wettability and actual field moisture, while soil characteristics like texture and
organic content were comparable within each sample pair (see Table 3-1).
Table 3-1 Characteristics of the field moist and air-dried initially water repellent (B1, T1) and initially wettable samples (B2, T2) from Buch and Tiergarten (a - by Wilhelmy Plate Method, b - by Capillary Rise Method)
sample B1 B2 T1 T2
pH 5.1 5.2 4.6 5.3
ignition loss / % dry mass 11 18 6 7
water content / % field moist 13 33 7 13
WDPT / h field moist 3 0 5 0
Θadv / ° field moist 121
a 85
b 124
a 87
b
Θsess / ° field moist 110 85 103 67
water content / % dried 2 3 1 1
WDPT / h dried 6 5 2,3 0,1
Θadv / ° dried 132
a 118
a 126
a 122
a
Θsess / ° dried 123 117 112 86
We used field samples which were air dried and stored at room temperature over
saturated CaCl2 solution in desiccators (31-35 % RH). The water content was determined
gravimetrically by drying at 105°C, and the organic content was assessed by ashing for
5 h at 550°C. All measurements of this study were performed with samples sieved
< 1 mm.
Between the two sample sites the following differences could be observed (Table
3-1): The sample pair from Buch had a higher organic and water content than the pair
from Tiergarten. As shown in Table 3-1, contact angle and WDPT of the field moist
sample B2 from Buch increased by air drying and storage and the sample became as
water repellent as its repellent neighboured sample B1. In contrast, contact angle and
WDPT of the repellent sample T1 from Tiergarten decreased only slightly, so that the
sample pair from Tiergarten kept its differences in wettability after drying. In order to
consider the effect of drying and storage conditions on the wetting characteristics, in the
3 The nature of wetting on urban soil samples
31
following, the dried samples, which were wettable in field moist state, are named
“initially wettable”, and dried samples, which were water repellent in field moist state,
are named “initially repellent” samples.
3.3.3 Determination of repellency
Water drop penetration time (WDPT)
The wetting resistance of the soil samples was determined by the water drop penetration
time (WDPT). The samples were filled in small containers, the surface smoothed without
pressure by a spatula and the containers posed in a temperature regulated incubator at
20°C. Three drops containing 100 µl of distilled water were placed on each sample. For
WDPT > 1 min, the points of time, when the droplets penetrate into the soil samples,
were observed by magnified digital photographs automatically taken in increasing time
intervals from 12 s up to 10 min, so that the relative error of WDPT did not exceed 5 %.
Advancing contact angle by Wilhelmy Plate Method
The initial contact angle was measured as advancing contact angle, Θadv, with the
Dynamic Contact Angle Meter and Tensiometer (DCAT 21, DataPhysics, Filderstadt,
Germany). Field moist repellent (Θadv > 90°) and air dried samples were measured by the
dynamic Wilhelmy Plate Method (WPM) (Wilhelmy, 1863). The soil samples were fixed
on a rectangular glass slide (76 x 26 x 1 mm) completely covered by double sided
adhesive tape and suspended from a balance (± 0.01 mg). By lifting a container with
destilled water with a speed of 0.2 mm s-1, the soil covered plates were continually
immersed up to a maximal immersion depth zmax of 10 mm, while the balance records the
development of the effective sample weight, weff, as function of the immersion depth, z.
The change of weff depends on the plate mass, mP, the buoyancy (Fb (z)), the surface force
(Fs) and the advancing contact angle, Θadv , and can be expressed as:
( )
zgALgmw
zFFww
pwadvlvwpeff
badvspeff
ργ −Θ=−
−Θ=
cos
cos
( ) zL
gAz
L
gmw
lvw
pwadv
lvw
peff
γ
ρ
γ−Θ=
−cos (3-1)
where wp is the plate weight, LW is the wetted length, γlv is the liquid-vapor interfacial
tension, ρW is the density of water and g is the acceleration of gravity. Then cosΘadv can
be calculated from the axis intercept of Equation (3-1). For ideal smooth plates, LW is
equal to the geometric circumference of the plate, UP. For coarse surfaces (e.g., soil
samples), LW has to be estimated. We assumed that the effective surface of the soil
covered plate is formed by close-packed solid hemispheres and is in Wenzel’s state (no
entrapped air) from the first moment of immersion. Under these assumptions, LW is the
sum of the arc lengths of semicircles, Ui, (in the intersecting planes of the hemisphere
particles), while UP is the sum of diameters, di, of these semicircles. LW and UP can be
expressed as a function of di and LW estimated as following:
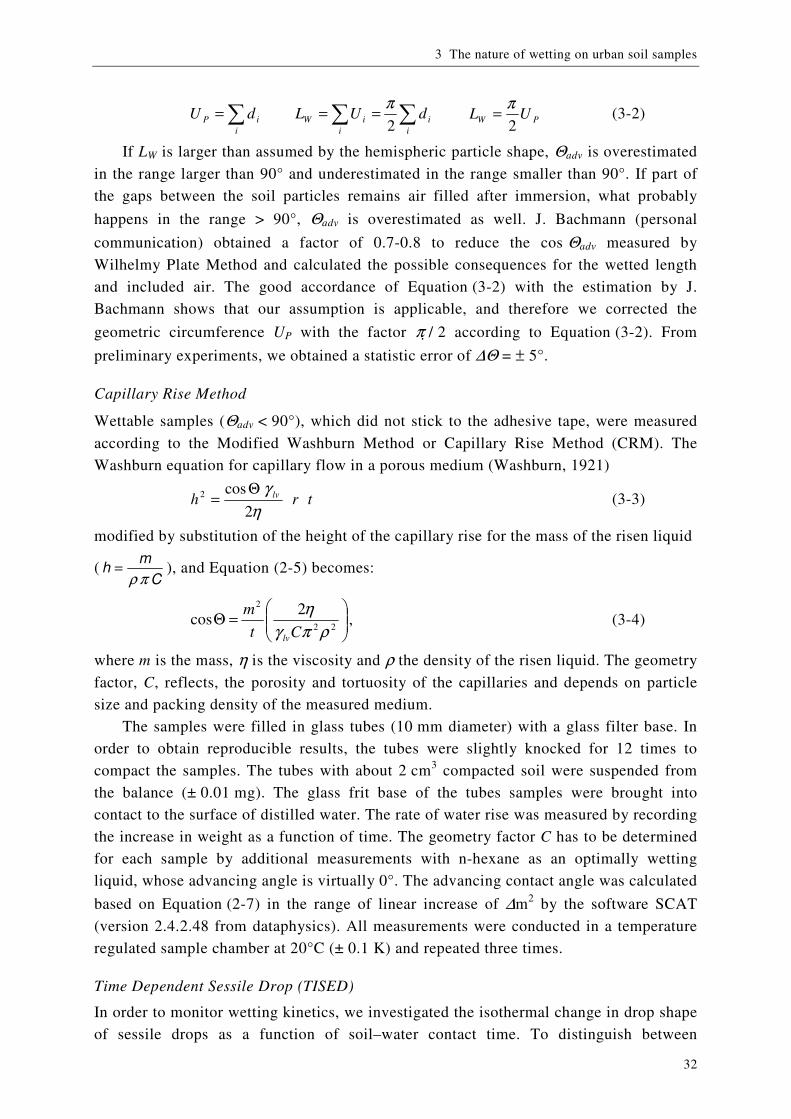
3 The nature of wetting on urban soil samples
32
∑ ∑∑ ===i i
iiWi
iP dULdU2
πPW UL
2
π= (3-2)
If LW is larger than assumed by the hemispheric particle shape, Θadv is overestimated
in the range larger than 90° and underestimated in the range smaller than 90°. If part of
the gaps between the soil particles remains air filled after immersion, what probably
happens in the range > 90°, Θadv is overestimated as well. J. Bachmann (personal
communication) obtained a factor of 0.7-0.8 to reduce the cos Θadv measured by
Wilhelmy Plate Method and calculated the possible consequences for the wetted length
and included air. The good accordance of Equation (3-2) with the estimation by J.
Bachmann shows that our assumption is applicable, and therefore we corrected the
geometric circumference UP with the factor π / 2 according to Equation (3-2). From
preliminary experiments, we obtained a statistic error of ∆Θ = ± 5°.
Capillary Rise Method
Wettable samples (Θadv < 90°), which did not stick to the adhesive tape, were measured
according to the Modified Washburn Method or Capillary Rise Method (CRM). The
Washburn equation for capillary flow in a porous medium (Washburn, 1921)
trh lv
η
γ
2
cos2 Θ= (3-3)
modified by substitution of the height of the capillary rise for the mass of the risen liquid
(C
mh
πρ= ), and Equation (2-5) becomes:
=Θ
22
2 2cos
ρπγ
η
Ct
m
lv
, (3-4)
where m is the mass, η is the viscosity and ρ the density of the risen liquid. The geometry
factor, C, reflects, the porosity and tortuosity of the capillaries and depends on particle
size and packing density of the measured medium.
The samples were filled in glass tubes (10 mm diameter) with a glass filter base. In
order to obtain reproducible results, the tubes were slightly knocked for 12 times to
compact the samples. The tubes with about 2 cm3 compacted soil were suspended from
the balance (± 0.01 mg). The glass frit base of the tubes samples were brought into
contact to the surface of distilled water. The rate of water rise was measured by recording
the increase in weight as a function of time. The geometry factor C has to be determined
for each sample by additional measurements with n-hexane as an optimally wetting
liquid, whose advancing angle is virtually 0°. The advancing contact angle was calculated
based on Equation (2-7) in the range of linear increase of ∆m2 by the software SCAT
(version 2.4.2.48 from dataphysics). All measurements were conducted in a temperature
regulated sample chamber at 20°C (± 0.1 K) and repeated three times.
Time Dependent Sessile Drop (TISED)
In order to monitor wetting kinetics, we investigated the isothermal change in drop shape
of sessile drops as a function of soil–water contact time. To distinguish between
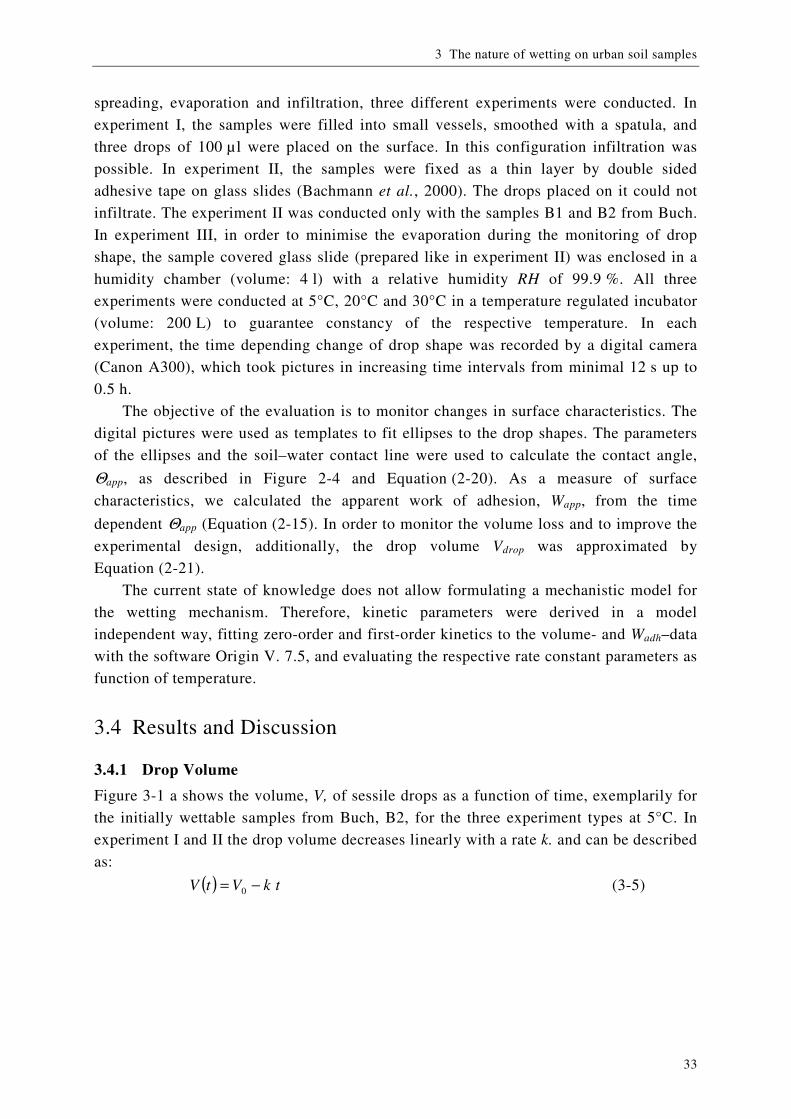
3 The nature of wetting on urban soil samples
33
spreading, evaporation and infiltration, three different experiments were conducted. In
experiment I, the samples were filled into small vessels, smoothed with a spatula, and
three drops of 100 µl were placed on the surface. In this configuration infiltration was
possible. In experiment II, the samples were fixed as a thin layer by double sided
adhesive tape on glass slides (Bachmann et al., 2000). The drops placed on it could not
infiltrate. The experiment II was conducted only with the samples B1 and B2 from Buch.
In experiment III, in order to minimise the evaporation during the monitoring of drop
shape, the sample covered glass slide (prepared like in experiment II) was enclosed in a
humidity chamber (volume: 4 l) with a relative humidity RH of 99.9 %. All three
experiments were conducted at 5°C, 20°C and 30°C in a temperature regulated incubator
(volume: 200 L) to guarantee constancy of the respective temperature. In each
experiment, the time depending change of drop shape was recorded by a digital camera
(Canon A300), which took pictures in increasing time intervals from minimal 12 s up to
0.5 h.
The objective of the evaluation is to monitor changes in surface characteristics. The
digital pictures were used as templates to fit ellipses to the drop shapes. The parameters
of the ellipses and the soil–water contact line were used to calculate the contact angle,
Θapp, as described in Figure 2-4 and Equation (2-20). As a measure of surface
characteristics, we calculated the apparent work of adhesion, Wapp, from the time
dependent Θapp (Equation (2-15). In order to monitor the volume loss and to improve the
experimental design, additionally, the drop volume Vdrop was approximated by
Equation (2-21).
The current state of knowledge does not allow formulating a mechanistic model for
the wetting mechanism. Therefore, kinetic parameters were derived in a model
independent way, fitting zero-order and first-order kinetics to the volume- and Wadh–data
with the software Origin V. 7.5, and evaluating the respective rate constant parameters as
function of temperature.
3.4 Results and Discussion
3.4.1 Drop Volume
Figure 3-1 a shows the volume, V, of sessile drops as a function of time, exemplarily for
the initially wettable samples from Buch, B2, for the three experiment types at 5°C. In
experiment I and II the drop volume decreases linearly with a rate k. and can be described
as:
( ) tkVtV −= 0 (3-5)
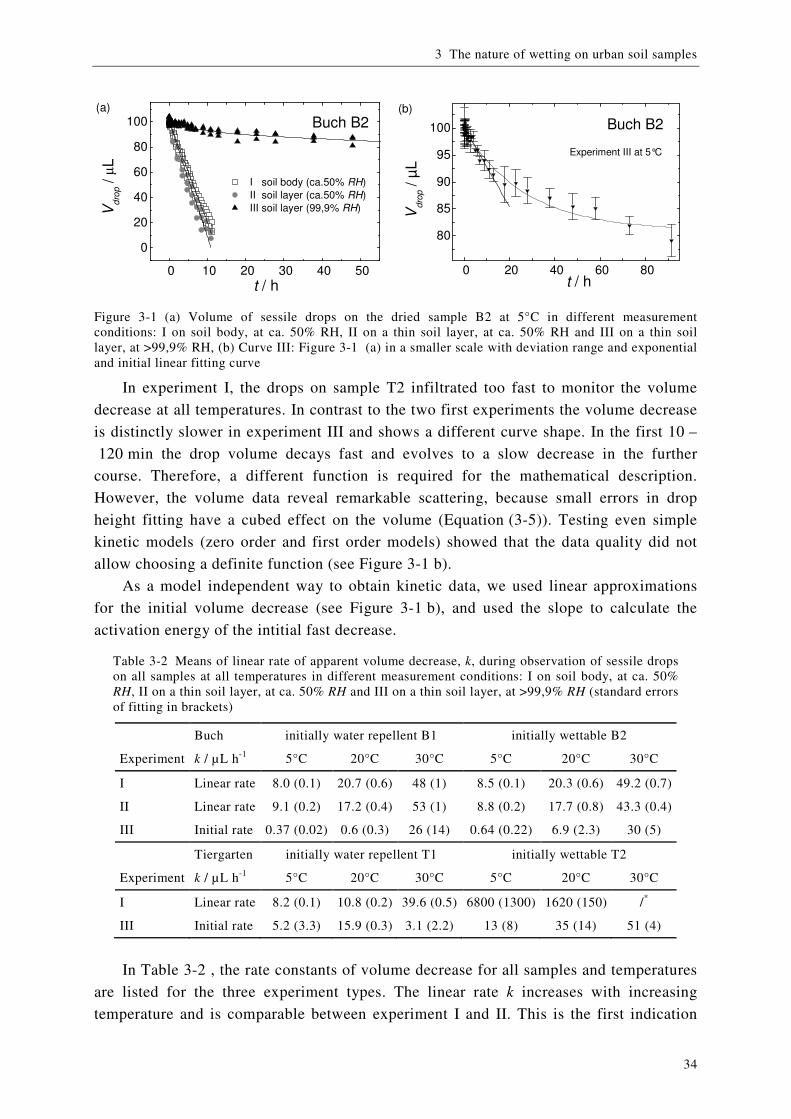
3 The nature of wetting on urban soil samples
34
0 10 20 30 40 50
0
20
40
60
80
100
I soil body (ca.50% RH)
II soil layer (ca.50% RH)
III soil layer (99,9% RH)
Buch B2
t / h
Vd
rop / µ
L(a)
0 20 40 60 80
80
85
90
95
100
Experiment III at 5°C
Buch B2
t / h
Vdro
p / µ
L
(b)
Figure 3-1 (a) Volume of sessile drops on the dried sample B2 at 5°C in different measurement conditions: I on soil body, at ca. 50% RH, II on a thin soil layer, at ca. 50% RH and III on a thin soil layer, at >99,9% RH, (b) Curve III: Figure 3-1 (a) in a smaller scale with deviation range and exponential and initial linear fitting curve
In experiment I, the drops on sample T2 infiltrated too fast to monitor the volume
decrease at all temperatures. In contrast to the two first experiments the volume decrease
is distinctly slower in experiment III and shows a different curve shape. In the first 10 –
120 min the drop volume decays fast and evolves to a slow decrease in the further
course. Therefore, a different function is required for the mathematical description.
However, the volume data reveal remarkable scattering, because small errors in drop
height fitting have a cubed effect on the volume (Equation (3-5)). Testing even simple
kinetic models (zero order and first order models) showed that the data quality did not
allow choosing a definite function (see Figure 3-1 b).
As a model independent way to obtain kinetic data, we used linear approximations
for the initial volume decrease (see Figure 3-1 b), and used the slope to calculate the
activation energy of the intitial fast decrease.
Table 3-2 Means of linear rate of apparent volume decrease, k, during observation of sessile drops on all samples at all temperatures in different measurement conditions: I on soil body, at ca. 50% RH, II on a thin soil layer, at ca. 50% RH and III on a thin soil layer, at >99,9% RH (standard errors of fitting in brackets)
Buch initially water repellent B1 initially wettable B2
Experiment k / µL h-1 5°C 20°C 30°C 5°C 20°C 30°C
I Linear rate 8.0 (0.1) 20.7 (0.6) 48 (1) 8.5 (0.1) 20.3 (0.6) 49.2 (0.7)
II Linear rate 9.1 (0.2) 17.2 (0.4) 53 (1) 8.8 (0.2) 17.7 (0.8) 43.3 (0.4)
III Initial rate 0.37 (0.02) 0.6 (0.3) 26 (14) 0.64 (0.22) 6.9 (2.3) 30 (5)
Tiergarten initially water repellent T1 initially wettable T2
Experiment k / µL h-1 5°C 20°C 30°C 5°C 20°C 30°C
I Linear rate 8.2 (0.1) 10.8 (0.2) 39.6 (0.5) 6800 (1300) 1620 (150) /*
III Initial rate 5.2 (3.3) 15.9 (0.3) 3.1 (2.2) 13 (8) 35 (14) 51 (4)
In Table 3-2 , the rate constants of volume decrease for all samples and temperatures
are listed for the three experiment types. The linear rate k increases with increasing
temperature and is comparable between experiment I and II. This is the first indication

3 The nature of wetting on urban soil samples
35
suggesting comparable mechanisms responsible for drop volume reduction on a soil body
and on the thin soil layer. On the samples from Tiergarten, the drop volume decreases
slower on the initially repellent sample T1 than on the initially wettable sample T2,
whereas the rate constants of volume decrease are comparable for the initial wettable and
repellent samples from Buch.
Table 3-3 shows the activation energy EA of the drop volume decrease calculated
from the temperature dependence of k according to Equation (2-30). In experiment I and
II, EA of the linear volume decrease ranges for all investigated samples between 40 and
50 kJ mol-1, whereas in experiment III, EA of volume decrease is higher for the samples
from Buch with 86-120 kJ mol-1 than for the samples from Tiergarten. with -14 -
44 kJ mol-1. The negative EA of the repellent sample from Tiergarten makes no physical
sense and in view of the large error it has to be interpreted as close to zero.
Table 3-3 Activation energy, EA, of the apparent decrease of drop volume during the spreading under 3 different conditions on the initially repellent samples B1 and T1 and the initially wettable samples B2 and T2 from Buch (B) and Tiergarten (T), (standard errors of fitting in brackets; n.d. - not determined; a - Infiltration was too fast to monitor.)
Experiment EA / kJ mol-1 B1 B2 T1 T2
I linear decrease 48 (1) 49 (1) 41 (1) /*
II linear decrease 43 (1) 47 (1) n.d. n.d.
III Initial rate 120 (36) 86 (12) -14 (24) 44 (11)
The comparability of k in experiments I and II (Table 3-2) leads to the conclusion,
that the infiltration of drop water into the soil body is improbable for the repellent
samples, and evaporation of the drop water is probably the main process observed in
experiments I and II. This assumption is further supported by the activation energy
(Table 3-3), which is comparable to the latent heat of evaporation of water of
40.5 kJ mol-1 (Franks, 2000). As expected, in experiment III, evaporation was drastically
reduced due to high relative humidity (99.9 %) and a different curve shape of the volume
decrease as a function of time was observed (Figure 3-1 ). The observed influence of
evaporation on sessile drops leads to a critical view on WDPT measurement. The
comparison of high WDPT has to be regarded carefully. If the measurement conditions
like air movement, RH and temperature as well as drop size are not standardised and
evaporation cannot be prevented, penetration time might be comparable or higher and,
thus, not distinguishable from evaporation time.
In order to minimize the effect of evaporation based volume decrease on shape and
contact angle of a sessile drop, we conducted the further studies only under the condition
of the experiment III at 99.9 % RH. In experiment III, the volume decrease starts with a
faster decay (Figure 3-1 a) with an activation energy obtained by linear rate constants
significantly higher than the latent heat of evaporation (Table 3-3) This leads to the
conclusion that the observed fast initial volume decrease during the experiment III can
not be caused by evaporation. Consequently, the volume decrease can only be explained
by a transition of the water-solid contact area of the drops from the Cassie-Baxter state
into the Wenzel’s state driven by a continuous change in ΘY, as described in paragraph
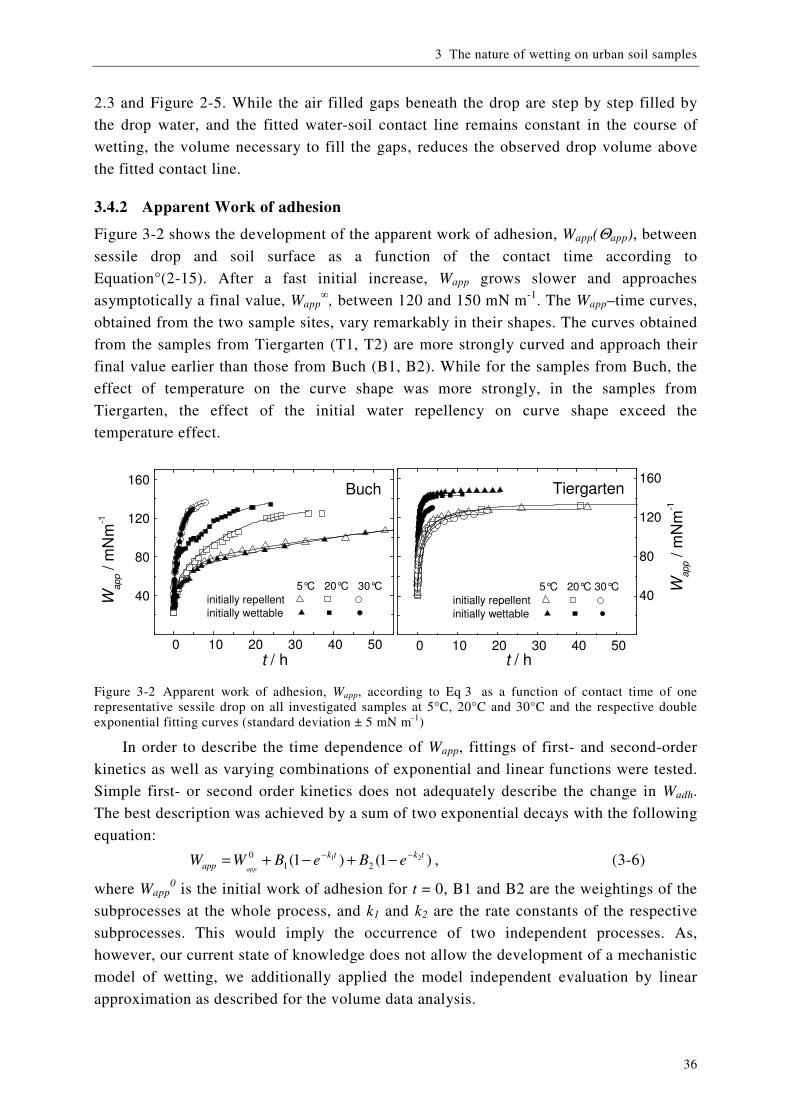
3 The nature of wetting on urban soil samples
36
2.3 and Figure 2-5. While the air filled gaps beneath the drop are step by step filled by
the drop water, and the fitted water-soil contact line remains constant in the course of
wetting, the volume necessary to fill the gaps, reduces the observed drop volume above
the fitted contact line.
3.4.2 Apparent Work of adhesion
Figure 3-2 shows the development of the apparent work of adhesion, Wapp(Θapp), between
sessile drop and soil surface as a function of the contact time according to
Equation°(2-15). After a fast initial increase, Wapp grows slower and approaches
asymptotically a final value, Wapp∞, between 120 and 150 mN m-1. The Wapp–time curves,
obtained from the two sample sites, vary remarkably in their shapes. The curves obtained
from the samples from Tiergarten (T1, T2) are more strongly curved and approach their
final value earlier than those from Buch (B1, B2). While for the samples from Buch, the
effect of temperature on the curve shape was more strongly, in the samples from
Tiergarten, the effect of the initial water repellency on curve shape exceed the
temperature effect.
0 10 20 30 40 50
40
80
120
160
5°C 20°C 30°C
initially repellent
initially wettable
Buch
t / h
Wa
pp / m
Nm
-1
0 10 20 30 40 50
40
80
120
160
5°C 20°C 30°C
initially repellent
initially wettable
Wapp / m
Nm
-1
Tiergarten
t / h
Figure 3-2 Apparent work of adhesion, Wapp, according to Eq 3 as a function of contact time of one representative sessile drop on all investigated samples at 5°C, 20°C and 30°C and the respective double exponential fitting curves (standard deviation ± 5 mN m-1)
In order to describe the time dependence of Wapp, fittings of first- and second-order
kinetics as well as varying combinations of exponential and linear functions were tested.
Simple first- or second order kinetics does not adequately describe the change in Wadh.
The best description was achieved by a sum of two exponential decays with the following
equation:
)1()1( 21
210 tktk
app eBeBWWapp
−− −+−+= , (3-6)
where Wapp0 is the initial work of adhesion for t = 0, B1 and B2 are the weightings of the
subprocesses at the whole process, and k1 and k2 are the rate constants of the respective
subprocesses. This would imply the occurrence of two independent processes. As,
however, our current state of knowledge does not allow the development of a mechanistic
model of wetting, we additionally applied the model independent evaluation by linear
approximation as described for the volume data analysis.
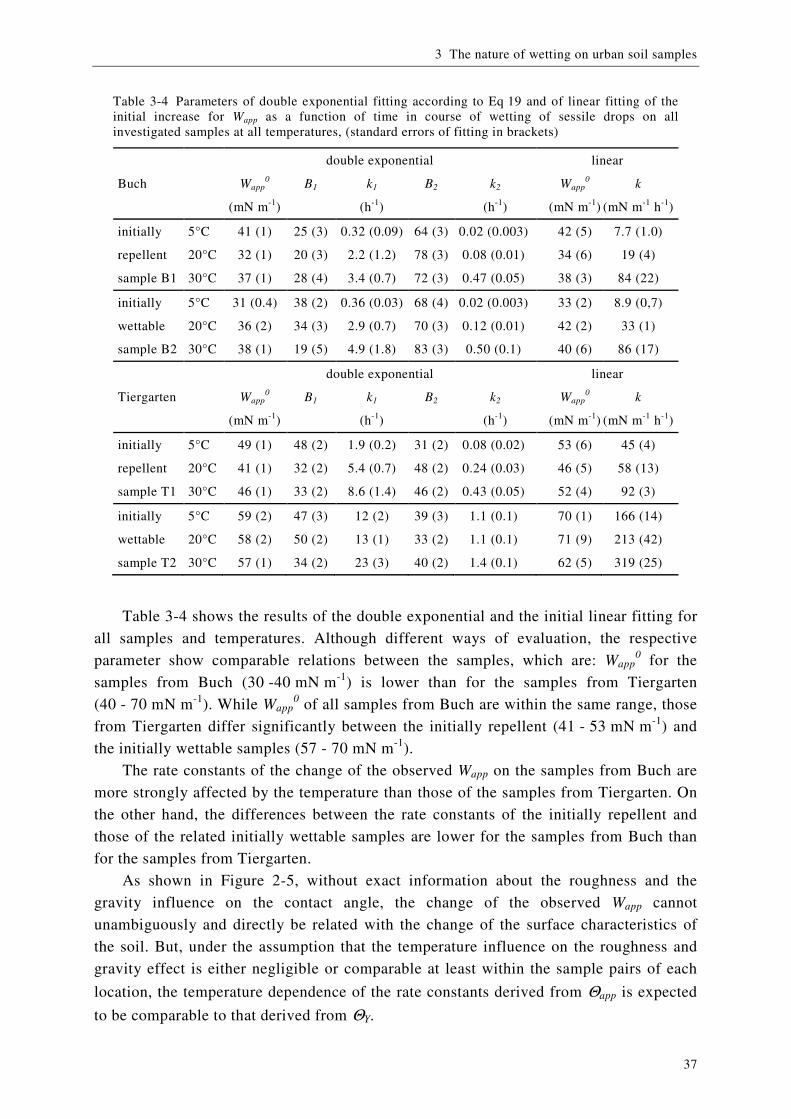
3 The nature of wetting on urban soil samples
37
Table 3-4 Parameters of double exponential fitting according to Eq 19 and of linear fitting of the initial increase for Wapp as a function of time in course of wetting of sessile drops on all investigated samples at all temperatures, (standard errors of fitting in brackets)
double exponential linear
Buch Wapp0 B1 k1 B2 k2 Wapp
0 k
(mN m-1) (h-1) (h-1) (mN m-1) (mN m-1 h-1)
initially 5°C 41 (1) 25 (3) 0.32 (0.09) 64 (3) 0.02 (0.003) 42 (5) 7.7 (1.0)
repellent 20°C 32 (1) 20 (3) 2.2 (1.2) 78 (3) 0.08 (0.01) 34 (6) 19 (4)
sample B1 30°C 37 (1) 28 (4) 3.4 (0.7) 72 (3) 0.47 (0.05) 38 (3) 84 (22)
initially 5°C 31 (0.4) 38 (2) 0.36 (0.03) 68 (4) 0.02 (0.003) 33 (2) 8.9 (0,7)
wettable 20°C 36 (2) 34 (3) 2.9 (0.7) 70 (3) 0.12 (0.01) 42 (2) 33 (1)
sample B2 30°C 38 (1) 19 (5) 4.9 (1.8) 83 (3) 0.50 (0.1) 40 (6) 86 (17)
double exponential linear
Tiergarten Wapp0 B1 k1 B2 k2 Wapp
0 k
(mN m-1) (h-1) (h-1) (mN m-1) (mN m-1 h-1)
initially 5°C 49 (1) 48 (2) 1.9 (0.2) 31 (2) 0.08 (0.02) 53 (6) 45 (4)
repellent 20°C 41 (1) 32 (2) 5.4 (0.7) 48 (2) 0.24 (0.03) 46 (5) 58 (13)
sample T1 30°C 46 (1) 33 (2) 8.6 (1.4) 46 (2) 0.43 (0.05) 52 (4) 92 (3)
initially 5°C 59 (2) 47 (3) 12 (2) 39 (3) 1.1 (0.1) 70 (1) 166 (14)
wettable 20°C 58 (2) 50 (2) 13 (1) 33 (2) 1.1 (0.1) 71 (9) 213 (42)
sample T2 30°C 57 (1) 34 (2) 23 (3) 40 (2) 1.4 (0.1) 62 (5) 319 (25)
Table 3-4 shows the results of the double exponential and the initial linear fitting for
all samples and temperatures. Although different ways of evaluation, the respective
parameter show comparable relations between the samples, which are: Wapp0 for the
samples from Buch (30 -40 mN m-1) is lower than for the samples from Tiergarten
(40 - 70 mN m-1). While Wapp0 of all samples from Buch are within the same range, those
from Tiergarten differ significantly between the initially repellent (41 - 53 mN m-1) and
the initially wettable samples (57 - 70 mN m-1).
The rate constants of the change of the observed Wapp on the samples from Buch are
more strongly affected by the temperature than those of the samples from Tiergarten. On
the other hand, the differences between the rate constants of the initially repellent and
those of the related initially wettable samples are lower for the samples from Buch than
for the samples from Tiergarten.
As shown in Figure 2-5, without exact information about the roughness and the
gravity influence on the contact angle, the change of the observed Wapp cannot
unambiguously and directly be related with the change of the surface characteristics of
the soil. But, under the assumption that the temperature influence on the roughness and
gravity effect is either negligible or comparable at least within the sample pairs of each
location, the temperature dependence of the rate constants derived from Θapp is expected
to be comparable to that derived from ΘY.
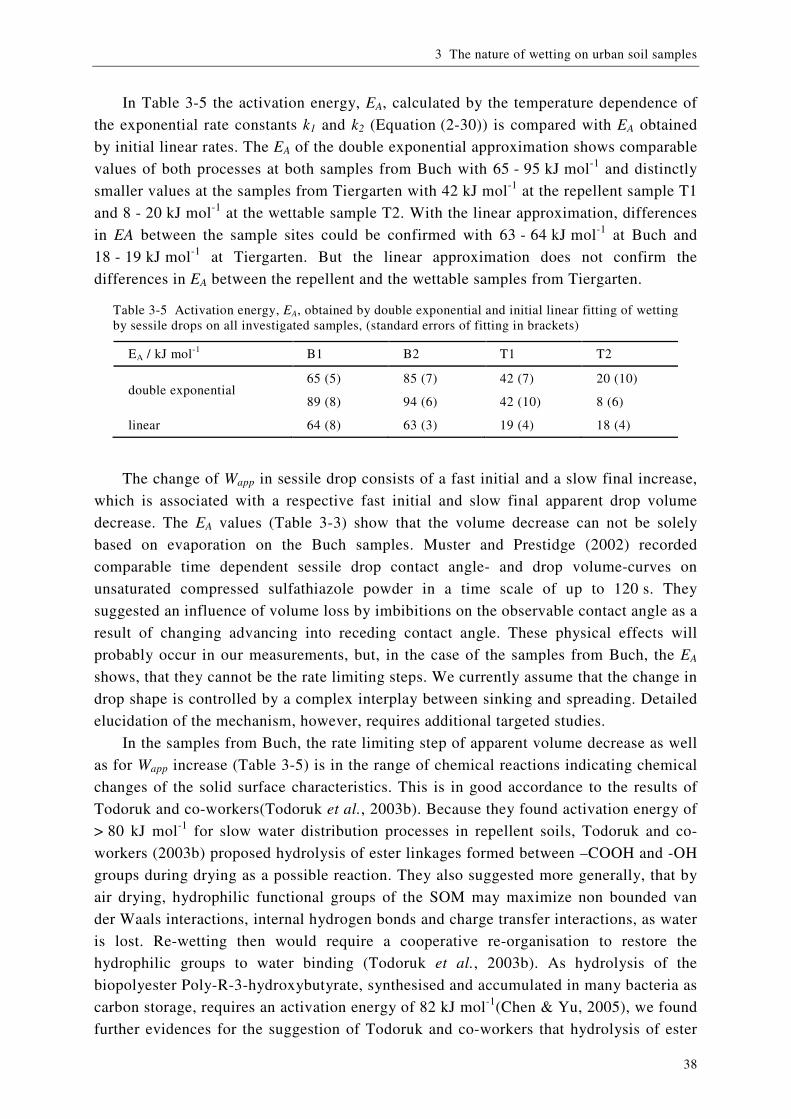
3 The nature of wetting on urban soil samples
38
In Table 3-5 the activation energy, EA, calculated by the temperature dependence of
the exponential rate constants k1 and k2 (Equation (2-30)) is compared with EA obtained
by initial linear rates. The EA of the double exponential approximation shows comparable
values of both processes at both samples from Buch with 65 - 95 kJ mol-1 and distinctly
smaller values at the samples from Tiergarten with 42 kJ mol-1 at the repellent sample T1
and 8 - 20 kJ mol-1 at the wettable sample T2. With the linear approximation, differences
in EA between the sample sites could be confirmed with 63 - 64 kJ mol-1 at Buch and
18 - 19 kJ mol-1 at Tiergarten. But the linear approximation does not confirm the
differences in EA between the repellent and the wettable samples from Tiergarten.
Table 3-5 Activation energy, EA, obtained by double exponential and initial linear fitting of wetting by sessile drops on all investigated samples, (standard errors of fitting in brackets)
EA / kJ mol-1 B1 B2 T1 T2
double exponential 65 (5) 85 (7) 42 (7) 20 (10)
89 (8) 94 (6) 42 (10) 8 (6)
linear 64 (8) 63 (3) 19 (4) 18 (4)
The change of Wapp in sessile drop consists of a fast initial and a slow final increase,
which is associated with a respective fast initial and slow final apparent drop volume
decrease. The EA values (Table 3-3) show that the volume decrease can not be solely
based on evaporation on the Buch samples. Muster and Prestidge (2002) recorded
comparable time dependent sessile drop contact angle- and drop volume-curves on
unsaturated compressed sulfathiazole powder in a time scale of up to 120 s. They
suggested an influence of volume loss by imbibitions on the observable contact angle as a
result of changing advancing into receding contact angle. These physical effects will
probably occur in our measurements, but, in the case of the samples from Buch, the EA
shows, that they cannot be the rate limiting steps. We currently assume that the change in
drop shape is controlled by a complex interplay between sinking and spreading. Detailed
elucidation of the mechanism, however, requires additional targeted studies.
In the samples from Buch, the rate limiting step of apparent volume decrease as well
as for Wapp increase (Table 3-5) is in the range of chemical reactions indicating chemical
changes of the solid surface characteristics. This is in good accordance to the results of
Todoruk and co-workers(Todoruk et al., 2003b). Because they found activation energy of
> 80 kJ mol-1 for slow water distribution processes in repellent soils, Todoruk and co-
workers (2003b) proposed hydrolysis of ester linkages formed between –COOH and -OH
groups during drying as a possible reaction. They also suggested more generally, that by
air drying, hydrophilic functional groups of the SOM may maximize non bounded van
der Waals interactions, internal hydrogen bonds and charge transfer interactions, as water
is lost. Re-wetting then would require a cooperative re-organisation to restore the
hydrophilic groups to water binding (Todoruk et al., 2003b). As hydrolysis of the
biopolyester Poly-R-3-hydroxybutyrate, synthesised and accumulated in many bacteria as
carbon storage, requires an activation energy of 82 kJ mol-1(Chen & Yu, 2005), we found
further evidences for the suggestion of Todoruk and co-workers that hydrolysis of ester
3 The nature of wetting on urban soil samples
39
linkages may explain the high activation energy of the wetting process of the Buch
samples.
On the other hand, the EA values of apparent drop volume decrease and Wapp increase
of the samples from Tiergarten (Table 3-3 and Table 3-5) are distinctly lower than those
from Buch and indicate physical or physico-chemical processes as rate limiting steps like
diffusion and water film formation or conformational changes in molecules.
The processes occurring on the repellent sample from Tiergarten differ strongly from
those proceeding on the samples from Buch. We therefore conclude that the repellency of
the sample from Tiergarten has other origins than those from Buch. The samples from
Buch have higher organic content, their wettability seems to depend mainly on water
content (the wettable sample became repellent by drying), and wetting is controlled by
chemical reactions. In contrast, the samples from Tiergarten with lower organic content
kept their difference in wettability after air-drying, and even the repellent samples require
a distinctly lower activation energy for re-wetting than the samples from Buch. Further,
the repellent samples from Tiergarten did not reach the Wapp values of the corresponding
wettable sample within the observation time of our experiment. In another study, we
found pH-dependence of the WDPT for Tiergarten, but not for Buch (Hurraß &
Schaumann, 2006; Bayer & Schaumann, 2007). The maximum of repellency around
neutral pH found in the study of Bayer and Schaumann (2007) may be indicative for
acid/base catalysed ester hydrolysis reducing repellency at pH below 4 and above 8, but
only for Tiergarten samples. This may indicate that the chemical energy barrier to
overcome repellency at the sample from Tiergarten was not reached under the gentle
conditions of our experiment, but needs to be catalysed. In the absence of chemical
modification of organic soil surface, the rate limiting step of wetting is then only
diffusion and water film formation. In contrast, the organic matter of the samples from
Buch may undergo quasi-reversible hydrolysis-condensation reactions according to the
loss or supply of water. The hypothesis of ester hydrolysis is currently being validated by
spectroscopic methods (1H-NMR and FT-IR).
Figure 3-3 shows the conceptual model we suggest to explain the different drying
and re-wetting behaviour of the investigated samples. According to the suggestion of
Bayer and Schaumann (2007), wettability is controlled by two independent parameters,
which are the surface characteristics and the water coverage. Both parameters may
change in the course of drying and re-wetting. While water coverage changes in Buch
and in Tiergarten, we suggest that surface characteristics change predominantly in the
Buch samples. Here, the water loss due to drying is compensated by an increase of H-
bonds and probably ester linkages of the hydrophilic functional groups towards the
interior, which results in a lower number of hydrophilic molecule domains orientated
outwards. Re-wetting requires high activation energy for the disruption of these linkages
followed by an outward re-orientation, which enhances wettability.

3 The nature of wetting on urban soil samples
40
field moist air dry rewetted
B1
wettableB2
repellent
E A / kJmol-1pH
5.1 64-94
5.2
T1
T2wettable
repellent 4.6
5.3
19-42
8-20
Figure 3-3 A model visualising different re-wetting behaviour of the investigated samples. Buch: Hydrophilic functional groups (black circles) are linked chemically towards the interior of SOM in the air-dried sample. Re-wetting requires high activation energy, EA, to disrupt linkages. Tiergarten: Surface characteristics do change only slightly during drying and re-wetting. Probably, pH-differences result in differing percentage of charged functional groups (uncharged groups as white circles) and persist drying and re-wetting. Re-wetting requires medium EA at repellent samples for conformational re-orientation of some hydrophilic functional groups (physico-chemical process) and low EA at wettable samples for changes in water coverage (physical process).
In contrast, the surface characteristics of the Tiergarten samples do not change
during drying and re-wetting. They differ between repellent and wettable samples,
probably due to differences in pH, which may result in differing percentage of charged
functional groups as suggested by Hurrass and Schaumann (2006) and Bayer and
Schaumann (2007) and/or of ester linkages. These differences persist throughout our
experiments, and changes of wettability are mainly caused by changes in water coverage,
which are of physical nature and therefore require lower activation energy. The
differences in activation energy between the repellent and the wettable Tiergarten sample
(only found with a double exponential fitting), may be due to an additional
conformational re-orientation of a part of the hydrophilic functional groups.
3.5 Conclusions
The comparison of change of sessile drop volume in three different experimental designs
tested in this study, lead to the conclusion, that measurement conditions like air
movement, RH and temperature as well as drop size, strongly affect the value of WDPT.
At high WDPT, it has to be considered, that evaporation may overbalance penetration.
Under the assumption that the temperature dependence of gravity and roughness
influence on the sessile drop shape does not affect the temperature dependence of the rate
constants of wetting, the activation energy can be related to the change of the respective
surface characteristics.
3 The nature of wetting on urban soil samples
41
We found principal differences in the nature of water repellency between the two
investigated locations Buch and Tiergarten: The samples from Buch, which differed
significantly in wettability in the field moist state, lost their differences in wettability
upon air drying and storage in 31 - 35 % RH. The wetting of these samples required
activation energy of 63 - 94 kJ mol-1, which indicates that chemical reactions are the rate
limiting step. In contrast to the samples from Buch, the samples from the inner city park
Tiergarten kept their initial differences in wettability after drying and storage and re-
wetting required activation energy between 19 and 42 kJ mol-1 for the repellent samples
and 8-20 kJ mol-1 for the wettable samples. This indicates that physico-chemical
reactions like conformational changes in molecule structures or physical processes like
diffusion and water film formation represent the rate limiting step for the samples from
Tiergarten.
Our study showed for the first time that the process of wetting on soil samples can be
monitored by sessile drop assessment, and that the temperature dependence of the wetting
kinetics allows distinguishing between different natures of wetting and soil water
repellency. Combination of such approaches with spectroscopic investigations will help
to deepen our understanding on possible causes of water repellency. They further help to
understand the great variety of suggested causes of repellency and indicate locational and
soil-material specific effects rather than one general cause for water repellency.
4 Influence of drying conditions on wettability and DRIFT spectroscopic C-H band of soil samples
42
4 Influence of drying conditions on wettability and DRIFT
spectroscopic C-H band of soil samples
4.1 Summary
This study assesses the effect of various drying procedures on water repellency measured
by water drop penetration time (WDPT) and spectroscopic parameters gauged by Diffuse
Reflectance Infrared Fourier Transform spectroscopy (DRIFT) of two anthropogenically-
influenced soils at sites in Berlin. Wettable and water repellent samples were dried at
various temperatures and at prescribed relative humidity. WDPT and DRIFT
spectroscopic characteristics were obtained from both dried and field-moist subsamples.
Normalization of DRIFT spectral C-H band intensity (‘surface hydrophobicity’)
against the integral absorption intensity over the wave number range 4000 – 400 cm-1
resulted in an apparent resolution between the effects of water content and changes in
C-H absorption at the surface. To our current knowledge, the latter could be best
explained with changes in the three-dimensional re-arrangement of organic molecules or
moieties on inner and outer soil organic matter (SOM) surfaces, whereas the former
could be a direct consequence of the fraction of inner and outer soil surfaces covered
with water and of the mean thickness of the respective water films. Further evidences for
this model are required from other investigations focusing on the surfaces in soil, before
drawing final conclusions. The results show that the method of drying affects WDPT to a
greater extent than soil water content after drying. DRIFT spectra suggest that exposure
to high temperature results in some reorganisation of SOM in the outer layer. It is further
suggested that short exposure may result in a heterogeneous distribution of water leading
to localized variation and inconsistency in WDPTs. Drying for four weeks under
controlled relative humidity at 20°C is suggested as a reference preparation method
combining the benefits of an almost unchanged SOM surface compared with field moist
samples with homogeneous moisture distribution.
4.2 Introduction
Soil water repellency is a world-wide phenomenon with a large impact on plant growth,
transport of nutrients and contaminants through the soil and thereby on soil
function(Doerr et al., 2000). Occurrence of soil water repellency is often linked with
increasing dryness of soil(Doerr & Thomas, 2000). Dekker & Ritsema (1994) defined
actual and potential soil water repellency determined in field-moist and dried samples,
respectively, and concluded that below a critical water content, soil tends to become
repellent. Ziogas et al (2003) showed that oven-drying might render samples fully
wettable. Other studies investigating soil water repellency as a function of water content
upon drying found one, sometimes even two repellency maxima, especially at
intermediate to small water contents between air-dried states and wilting points (King,
4 Influence of drying conditions on wettability and DRIFT spectroscopic C-H band of soil samples
43
1981; Bayer & Schaumann, 2007). Equilibration of soils at high relative humidity
resulted in an increase of repellency (Hurraß & Schaumann, 2006; Wallach & Graber,
2007). As changes in repellency are not fully reversible after rewetting (Doerr &
Thomas, 2000; Bayer & Schaumann, 2007) water content seems to be an inadequate
characteristic to predict soil water repellency. Soil texture (de Jonge et al., 1999) and soil
organic matter (SOM) as well as additional factors such as drying duration and
temperature (Bayer & Schaumann, 2007) together with equilibration time (Hurraß &
Schaumann, 2006; Wallach & Graber, 2007) influence changes in soil water repellency.
Organic coatings on mineral particles or particulate organic material are considered
to be responsible for water repellency (van't Woudt, 1959; DeBano, 1969; Fink, 1970).
Numerous investigations indicate that soil water repellency is not caused by single
substances (McGhie & Posner, 1980; Ma'shum & Farmer, 1985), whereas the amount of
polar and non-polar functional groups in amphiphilic organic substances appear to be of
great importance (Horne & McIntosh, 2000; Doerr et al., 2006).
Infrared spectroscopy (IR) is commonly used to measure the abundance of functional
groups in organic molecules. Infrared measurements of acid washed sand coated with soil
lipids showed a good correlation between lipid concentration, aliphatic C-H absorption
intensity and water repellency (Ma'shum et al., 1988). Capriel et al. (1995) defined the
aliphatic CH / SOC (soil organic carbon content) ratio as an index of hydrophobicity of
soil organic matter. In contrast, other studies of natural soil samples found no correlation
between spectroscopic values and their water repellency (Doerr et al., 2005b; Hurraß &
Schaumann, 2006). Correlations were obtained when spectroscopic data was combined
with clay and/or SOC content (McKissock et al., 2003; Ellerbrock et al., 2005). This led
to the conclusion that the extent of surface coverage and thickness of the organic layer on
soil mineral particles control the effective water repellency of functional groups in SOM
(Ellerbrock et al., 2005). These observations are in accordance with the concept of three-
dimensional re-arrangement of molecules, in whole or in part, in the outer layer of the
organic coatings as suggested by several authors as a mechanism leading to different
wetting characteristics (Tschapek, 1984; Horne & McIntosh, 2000; Hurraß &
Schaumann, 2006). According to this concept, hydrophilic functional groups exposed to
the outside increase wettability, whereas outward directed hydrophobic aliphatic chains
increase water repellency.
In contrast to the transmission Fourrier Transformed IR technique, DRIFT
spectroscopy provides information about the outer 6 – 8 µm layer of a sample, penetrated
by the incident light (Gottwald & Wachter, 1997) and suggests that it has potential for
the investigation of soil water repellency. It has to be kept in mind that soil water
repellency gives information mainly about the outer surfaces of soil particles whereas
DRIFT, within the penetration depth, senses both the outer and inner surfaces of SOM as
well as water. Therefore, a suitable method for normalization of DRIFT spectroscopic
data is required. Normalization against SOC (Capriel, 1997) refers to bulk SOM and so
dilutes the signal from the SOM on the surface. The absorption band at 1081 cm-1 used
by Ellerbrock et al. (1999) in transmission IR is not detectable in our DRIFT spectra, the
C-O stretching absorption at 1720 cm-1 and 1620-1600 cm-1, also used by Ellerbrock in
4 Influence of drying conditions on wettability and DRIFT spectroscopic C-H band of soil samples
44
transmission IR (Ellerbrock et al., 2005), cannot be distinguished from mineral
absorption in DRIFT spectra of undiluted soil material. Therefore, normalization by
various other references was tested in the present study in order to resolve the non-
specific effect of water content.
The objective of our study was to verify the extent to which changes in water
repellency are (i) related to changes in the relative abundance of hydrophobic molecular
parts in the outer layer of soil organic matter and (ii) caused solely by changes in water
content. In this paper we present the relationship between the relative abundance of
hydrophobic moieties in the surface layers of soil, assessed using DRIFT, the WDPT
water repellency and reduction in water content resulting from various drying regimes for
both, wettable and water repellent soil.
4.3 Materials and methods
4.3.1 Sample Sites
Soil samples were obtained from two strongly anthropogenically-influenced sites, a
former sewage disposal field north east of Berlin (Buch) and a city park in Berlin
(Tiergarten). The sample area is homogeneously covered with couch grass (mainly
Elytrigia repens) at Buch and with a grass cover consisting of Festuca rubra rubra,
Lonium Perenne and Poa pratensis at the Tiergarten. At both sites, the topsoil consists of
medium sized sand with low clay content and is characterized by large SOM contents
(Schlenther, 1996; Hoffmann, 2002; Täumer et al., 2005; Diehl & Schaumann, 2007).
Sampling took place in spring after a rainy day following a long dry period. The
grass cover was removed in an area of approximately 1 m2. Samples were taken at a
depth of 10 - 20 cm, directly beneath the dense root network, from clearly separate dry
and wet patches of soil as reported and shown by Hurraß & Schaumann (2006). At both
sites, the dry patches were much smaller than the wet patches, so at each site only two
repellent samples were taken from two separate dry patches. Eight samples were taken
from the wet patches at Buch and four wet patch samples were taken at the Tiergarten.
The wet and dry patch samples differ widely in their degree of repellency, but soil
characteristics such as texture and organic content were comparable (Table 4-1).
Consequently, these 16 individual samples are classified in the following four groups as
follows: the wettable samples from Buch and from the Tiergarten are referred to as BW
(n = 8) and TW (n = 4), respectively, and the repellent samples from Buch and Tiergarten
as BR (n = 2) and TR (n = 2), respectively.
Earlier studies on soils from the specific locations used in the present study showed
(i) “a strong relation between the actual water repellency (which triggers the preferential
flow process on the site) and the water content” (Täumer et al., 2005; Taumer et al.,
2006) and (ii) significant differences in repellency between moist and dry samples chosen
in the same way as in our study (Hurraß & Schaumann, 2006). This clearly showed that
the actual repellency controlled the water content after rainfall. Differences in the water

4 Influence of drying conditions on wettability and DRIFT spectroscopic C-H band of soil samples
45
supply caused by differences in plant canopy are minimal because of the uniform plant
coverage in the sampling area.
Table 4-1 Number (n) of individual samples, water content (WC), soil organic matter content (SOM), pH and water drop penetration time (WDPT) of field moist wettable samples (BW) and repellent samples (BR) from Buch and from the Tiergarten (TW, TR, respectively). Estimates of errors, WC ± 15% and of SOM, pH and WDPT (from triplicate measurements) are shown in parentheses.
n WC SOM pH WDPT
/ % / % / min
BW 8 15 (3) 10 (2) 4.5 (0.3) 0.01 (0.02)
BR 2 10 (1) 11 (1) 4.6 (0.1) 300 (200)
TW 4 14 (2) 7 (2) 3.9 (0.1) 0.05 (0.04)
TR 2 9 (1) 9 (1) 3.9 (0.1) 700 (400)
4.3.2 Sample preparation and characterization
Prior to homogenizing field moist samples, large stones and root material were removed
and large aggregates disrupted. Sample pH was measured using 12 g portions in 25 ml
0.01 M CaCl2-solution (DIN ISO 10390). The water content (WC), was determined
gravimetrically by drying samples for 24 hours at 105°C (DIN ISO 11465) and is
expressed on a dry basis. The dried material is defined as having a WC of zero. The SOM
was assessed by ashing the < 2 mm fraction of dried material for five hours at 550°C
(DIN 18128).
Each of the 16 samples was separated into five subsamples that were subjected to one
of the following treatments: (i) airtight storage at 5°C (“moist”), (ii) drying for seven
days at 35°C (“35°C), (iii) drying for three days at 65°C (“65°C”), (iv) air-drying (open
to atmosphere at approximately 20°C / ~50% RH) for two days and subsequent storage
for > 28 days at 20°C / 31% RH over saturated CaCl2-solution (“31% RH”) and (v) oven-
drying for 24 hours at 105°C, (”105°C”).
For the subsequent WC measurement of the treated subsamples, we took a maximum
relative error of 15% (based on numerous preceding WC measurements from these two
specific locations) into consideration, which is more realistic than the standard error
between replicates of the small and random subsample groups. The 80 subsamples were
then sieved to < 1 mm in order to reduce soil heterogeneity and stored in airtight glass
flasks.
4.3.3 Measurement of soil water repellency
The resistance to wetting of the 80 subsamples of soil was determined using the water
drop penetration time (WDPT) (Letey, 1969). Soil was placed in small containers and the
surface was gently smoothed. They were then placed in an incubator at 20°C. Digital
micrographs of the water droplets were taken automatically at increasing intervals from
12 s to 10 minutes. WDPTs were determined to within ± 5% by inspection of the

4 Influence of drying conditions on wettability and DRIFT spectroscopic C-H band of soil samples
46
micrographs (Diehl & Schaumann, 2007). A minimum WDPT of 0.1 s was used to
provide a finite value for log(WDPT) for readily-wettable soil.
4.3.4 DRIFT spectra
DRIFT spectra were obtained with a BioRad® FTS 135 (Bio-Rad Corp., Hercules, CA)
over a wave number range of 4000 to 400 cm-1 with 16 scans for each replicate at a
resolution of 1 cm-1. Soil material (< 1 mm) was used without any further preparation in
order to maintain the integrity of both SOM and WC. The consequent heterogeneous
particle size distribution and large sample concentration have an adverse effect on DRIFT
spectra. This does not allow absolute quantitative analysis or direct comparison with
pressed KBr disc spectra (Nguyen et al., 1991; Tremblay & Gagne, 2002), but still
permits relative comparison between subsamples with comparable composition and
characteristics drawn from the same location.
Dried, finely ground KBr was used to obtain a background reference spectrum.
Spectra were of five drying treatments with reference spectra obtained within each batch
of three replicates. Because of technical problems, for four of the eight BW samples and
one of the four TW samples, DRIFT spectra could not be obtained with the 35°C and at
65°C treatments. In order to subtract the background including absorption by water
vapour and CO2 in the sample environment, the 210 single spectral data were
automatically corrected for background and transformed into Kubelka-Munk (K.-M.)
units after measurement using Bio-Rad® Win IR Foundation® software (Digilab,
Randolph, MA). Smoothing, baseline correction, identification of peaks and evaluation of
peak heights and peak areas were performed using Origin 7.5 SR6 (v7.5885-B885)
software (OriginLab Corp., Northampton, MA). Linear baselines were created from
minima of the spectra in the regions of 3800 and 480 cm-1.
3000 2900 2800
II
wave number / cm-1
Kub
elk
a-M
un
k u
nit
3500 3000 2500 2000 1500 1000 500
I
TR
BW
TW
Ku
belk
a-M
un
k u
nit
wave number / cm-1
BR
alkyl C-H
Figure 4-1 (I) DRIFT spectra of initially wettable Buch samples (BW) and repellent Buch samples (BR) and initially wettable Tiergarten samples (TW) and repellent Tiergarten samples (TR) dried at 105°C and (II) expanded spectral region showing peaks, associated with selected C-H bands and a typical baseline for evaluation of peak area.
The combined integral area under the peaks at 2930 and 2850 cm−1, which were
superimposed on a broad O-H band at 3800 – 2500 cm−1, were calculated relative to a
linear baseline under that band (See Figure 4-1– II) and denoted as CH. These peaks
4 Influence of drying conditions on wettability and DRIFT spectroscopic C-H band of soil samples
47
represent the asymmetric and symmetric C-H-stretching vibrations of aliphatic CH3 and
CH2 groups (Capriel et al., 1995; Celi et al., 1997; Ellerbrock & Kaiser, 2005).
Furthermore, the integral area under the broad O-H band between 3800 and 2500 cm−1
and under the spectra between 4000 and 400 cm−1 were calculated and denoted as OH
and Ref, respectively. As explained in detail in the Result section, a normalization of CH
and OH areas was necessary and performed by dividing the respective areas by the Ref
area, denoting the normalized values as CHN and OHN, respectively.
4.4 Results & discussion
4.4.1 Normalization of DRIFT spectra
DRIFT spectra typical of BW, BR, TW and TR samples dried at 105°C, show CH
absorption bands at 2930 cm-1 and at 2850 cm-1 superimposed on the broad OH
absorption band between 3800 and 2500 cm-1 (Figure 4-1 – I). The spectra possess two
additional absorption bands located between 2000 cm-1 and 1200 cm-1.
The Ref area showed no correlation with corresponding sample SOM (Table 4-2) but
did show a weak correlation with the sample WC whereas the OH area did not correlate
with WC; however the CH area did have a weak negative correlation with WC (Table
4-2). It is assumed that the expected, but not found, SOM effect on the Ref area and the
specific WC effect on the OH area are outweighed by a broad non-specific interference
and contribution to absorption over the entire reference band arising from the presence of
water.
A significant correlation was found between OHN and WC, indicating a specific
effect of WC on the O-H band, whereas CHN had no significant correlation with WC
(Table 4-2). These correlations show that the use of normalized spectra provides
information that reflects better the links between soil properties and the vibrational
modes of the chemical constituents that they represent.
Table 4-2 Correlation coefficient (R), number (n), and probability of error (P) for the integral area under the DRIFT spectra from 4000 to 400 cm−1 (Ref) against soil organic matter (SOM) and water content (WC) and the areas under the OH and CH peaks against WC and, similarly, for the normalized peak areas OHN and CHN.
Ref - SOM OH - WC CH - WC
R n P R n P R n P
BT 0.06 70 0.6115 BT 0.04 72 0.7575 BT -0.40 72 0.0013
B -0.05 42 0.7473 B 0.01 42 0.9294 B -0.50 42 0.0020
T 0.22 28 0.2602 T 0.02 30 0.9069 T -0.40 30 0.0405
Ref - WC OHN - WC CHN - WC
R n P R n P R n P
BT -0.50 70 <0.0001 BT 0.68 72 <0.0001 BT 0.09 72 0.4757
B -0.49 42 0.0011 B 0.84 42 <0.0001 B 0.02 42 0.9236
T -0.53 28 0.0039 T 0.62 30 0.0003 T 0.24 30 0.2067

4 Influence of drying conditions on wettability and DRIFT spectroscopic C-H band of soil samples
48
4.4.2 Effect of drying
In Figure 4-2, WC, WDPT and CHN are depicted as functions of the applied drying
treatments where the connecting lines trace the data of each original sample and can help
to indicate the variety of effects of drying procedure on WC, WDPT and CHN in
individual samples which were dried in parallel.
moist 35°C 65°C 20°C 105°C0
5
10
15
20
25
31%RH
CH
N /
10
-5
moist 35°C 65°C 20°C 105°C0
5
10
15
20
25
31%RH
CH
N / 1
0-5
moist 35°C 65°C 20°C 105°C
100
101
102
103
104
105
31%RH 0
WD
PT
/ s
moist 35°C 65°C 20°C 105°C
100
101
102
103
104
105
31%RH
WD
PT
/ s
0
moist 35°C 65°C 20°C 105°C
0
5
10
15
20
31%RH
WC
/ %
Tiergarten
moist 35°C 65°C 20°C 105°C
0
5
10
15
20
31%RH
WC
/ %
Buch
Figure 4-2 Effect of drying conditions on water drop penetration time (WDPT), water content (WC) and normalized C-H band intensity (CHN) of initially wettable and repellent samples from Buch (BW � and BR � ) and the Tiergarten (TW � and TR �, respectively) for field moist and dried samples. Lines connect the data points of subsamples drawn from the same soil sample. Error bars are WC ± 15% and estimates of the standard deviation from triplicate measurements of WDPT and DRIFT peak areas.
Buch field samples had a wider range of WC than those from Tiergarten (Figure 4-2,
top). Drying at 35°C reduced WC in all samples with generally greater reductions in BR
and TR than BW and TW. Drying at 65°C seemed to have the same effect as drying at
35°C on T samples, whereas the WCs of B samples were almost indistinguishable from
each other. Drying at 20°C (31% RH) and at 105°C reduced the WC of all sample to
similar values with the latter producing the smallest values.
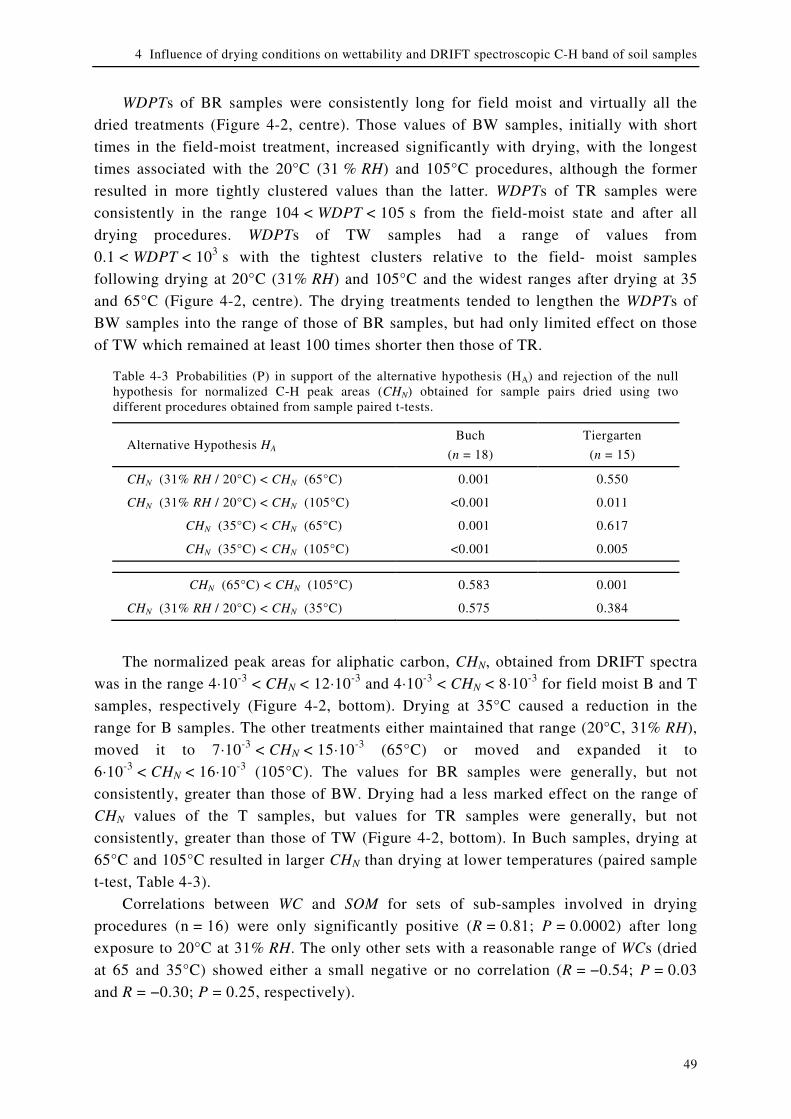
4 Influence of drying conditions on wettability and DRIFT spectroscopic C-H band of soil samples
49
WDPTs of BR samples were consistently long for field moist and virtually all the
dried treatments (Figure 4-2, centre). Those values of BW samples, initially with short
times in the field-moist treatment, increased significantly with drying, with the longest
times associated with the 20°C (31 % RH) and 105°C procedures, although the former
resulted in more tightly clustered values than the latter. WDPTs of TR samples were
consistently in the range 104 < WDPT < 105 s from the field-moist state and after all
drying procedures. WDPTs of TW samples had a range of values from
0.1 < WDPT < 103 s with the tightest clusters relative to the field- moist samples
following drying at 20°C (31% RH) and 105°C and the widest ranges after drying at 35
and 65°C (Figure 4-2, centre). The drying treatments tended to lengthen the WDPTs of
BW samples into the range of those of BR samples, but had only limited effect on those
of TW which remained at least 100 times shorter then those of TR.
Table 4-3 Probabilities (P) in support of the alternative hypothesis (HA) and rejection of the null hypothesis for normalized C-H peak areas (CHN) obtained for sample pairs dried using two different procedures obtained from sample paired t-tests.
Alternative Hypothesis HA Buch
(n = 18)
Tiergarten
(n = 15)
CHN (31% RH / 20°C) < CHN (65°C) 0.001 0.550
CHN (31% RH / 20°C) < CHN (105°C) <0.001 0.011
CHN (35°C) < CHN (65°C) 0.001 0.617
CHN (35°C) < CHN (105°C) <0.001 0.005
CHN (65°C) < CHN (105°C) 0.583 0.001
CHN (31% RH / 20°C) < CHN (35°C) 0.575 0.384
The normalized peak areas for aliphatic carbon, CHN, obtained from DRIFT spectra
was in the range 4·10-3 < CHN < 12·10-3 and 4·10-3 < CHN < 8·10-3 for field moist B and T
samples, respectively (Figure 4-2, bottom). Drying at 35°C caused a reduction in the
range for B samples. The other treatments either maintained that range (20°C, 31% RH),
moved it to 7·10-3 < CHN < 15·10-3 (65°C) or moved and expanded it to
6·10-3 < CHN < 16·10-3 (105°C). The values for BR samples were generally, but not
consistently, greater than those of BW. Drying had a less marked effect on the range of
CHN values of the T samples, but values for TR samples were generally, but not
consistently, greater than those of TW (Figure 4-2, bottom). In Buch samples, drying at
65°C and 105°C resulted in larger CHN than drying at lower temperatures (paired sample
t-test, Table 4-3).
Correlations between WC and SOM for sets of sub-samples involved in drying
procedures (n = 16) were only significantly positive (R = 0.81; P = 0.0002) after long
exposure to 20°C at 31% RH. The only other sets with a reasonable range of WCs (dried
at 65 and 35°C) showed either a small negative or no correlation (R = −0.54; P = 0.03
and R = −0.30; P = 0.25, respectively).
4 Influence of drying conditions on wettability and DRIFT spectroscopic C-H band of soil samples
50
4.4.3 Evaluation of the effects of drying
The smaller CHN in Buch samples after drying at 31% RH at 20°C and at 35°C suggests a
smaller surface concentration of hydrophobic structural elements than after drying at
greater temperatures. This does not explain the larger WDPT after drying at 31% RH for
more than four weeks, irrespectively of whether WCs were the same, smaller or larger
than after drying at 35°C and 65°C for seven and three days, respectively.
The greater scatter of WC data of the latter drying treatments indicates that drying for
seven and three days were not sufficient to overwhelm the differences in moisture
content between individual samples. In contrast, the protracted drying at 31% RH at 20°C
resulted in WCs which were in a narrow range for all samples from each site and which
significantly correlate with SOM. It is likely that this drying procedure allows the
samples to equilibrate better with the imposed conditions because of the longer period
and the constant RH. The question remains as to whether this could be the cause for the
increased extent of repellency.
Similar phenomena were observed in previous studies which observed changes in
repellence during a protracted exposure to a particular drying regime (Bayer &
Schaumann, 2007) or re-moistening regime (King, 1981; Wallach & Graber, 2007). The
changes in repellence continued unexpectedly even after the WCs reached constant
values. This suggests that a redistribution of soil moisture within the porous SOM
structure may alter its surface characteristics and leads to changes in repellency. The
equilibration at a constant RH and thereby the moisture redistribution without changes in
WC may lead to (i) a more homogeneous moisture distribution with an increase in the
area covered with water and a decrease in the mean thickness of the water cover or (ii) a
more heterogeneous moisture distribution with a decrease in the area covered with water
and an increase in the mean thickness of water cover. In this case local moist micro-spots
or even micro-droplets would be concentrated on hydrophilic regions whereas
hydrophobic regions would be water-depleted. The latter case does not explain the effect
of drying at 31% RH at 20°C in Buch samples since because larger WDPTs after this
treatment are coincident with smaller CHN than after treatments at 65°C. It is therefore
more likely that drying at 31% RH at 20°C leads to a more homogeneous moisture
distribution with a smaller amount of water-depleted hydrophobic regions explaining the
lower CHN and a thinner water film.
The Frumkin-Derjaguin theory (Derjaguin & Churaev, 1986) explains the reduced
wettability of a thin film with a bulk liquid of the same liquid. Below a certain thickness
of water layers, interphase transition zones overlap, and the layer is exposed to an
equilibrium pressure, the so-called ‘disjoining pressure’, exerted by long–range surface
forces of the two confining phases. Theoretical calculations of the isotherm for disjoining
pressure of water films on quartz surfaces indicate negative disjoining pressures for film
thickness ranging between 60 and 7 nm resulting in increased Θ which was demonstrated
experimentally (Derjaguin & Churaev, 1986).
Assuming a uniform water film on an inner and outer soil surface of 3.7 m2 g-1, as
measured by BET for the Tiergarten site (Jaeger et al., under revision), a water molecule
size of 0.27 nm and a water content of 1%, the respective water film would have a
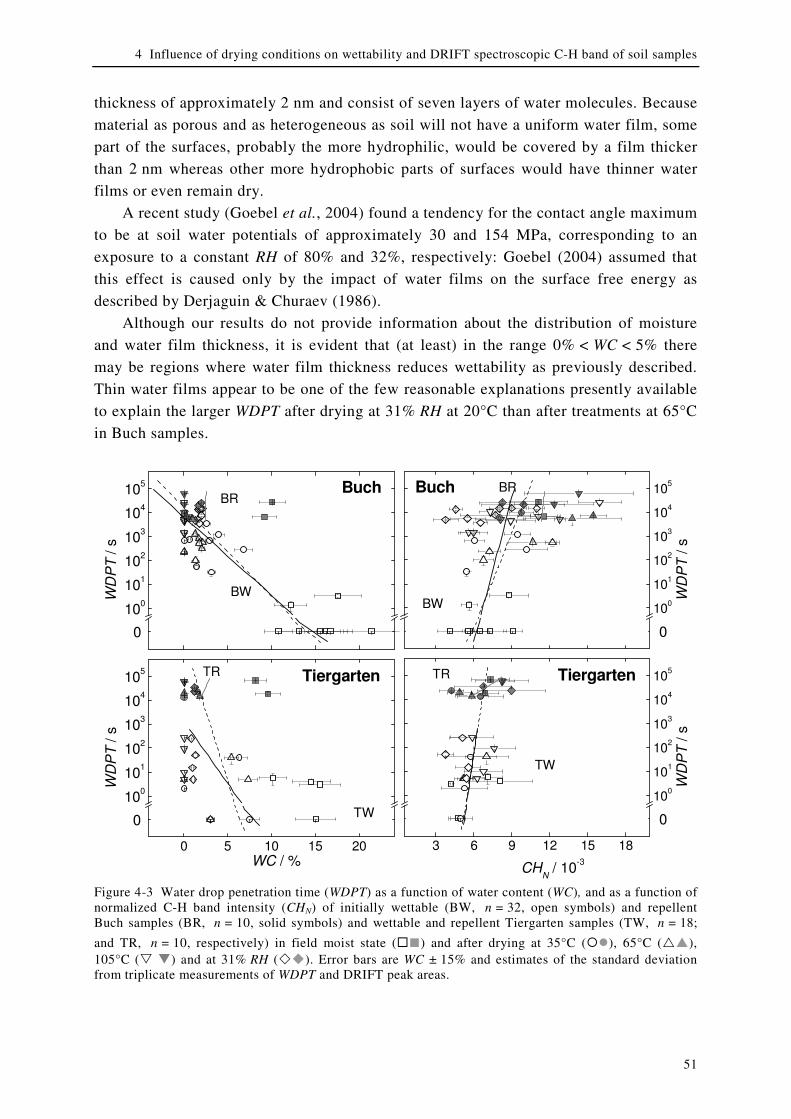
4 Influence of drying conditions on wettability and DRIFT spectroscopic C-H band of soil samples
51
thickness of approximately 2 nm and consist of seven layers of water molecules. Because
material as porous and as heterogeneous as soil will not have a uniform water film, some
part of the surfaces, probably the more hydrophilic, would be covered by a film thicker
than 2 nm whereas other more hydrophobic parts of surfaces would have thinner water
films or even remain dry.
A recent study (Goebel et al., 2004) found a tendency for the contact angle maximum
to be at soil water potentials of approximately 30 and 154 MPa, corresponding to an
exposure to a constant RH of 80% and 32%, respectively: Goebel (2004) assumed that
this effect is caused only by the impact of water films on the surface free energy as
described by Derjaguin & Churaev (1986).
Although our results do not provide information about the distribution of moisture
and water film thickness, it is evident that (at least) in the range 0% < WC < 5% there
may be regions where water film thickness reduces wettability as previously described.
Thin water films appear to be one of the few reasonable explanations presently available
to explain the larger WDPT after drying at 31% RH at 20°C than after treatments at 65°C
in Buch samples.
0 5 10 15 20
100
101
102
103
104
105
WC / %
WD
PT
/ s
0
TR Tiergarten
TW
3 6 9 12 15 18
100
101
102
103
104
105
CHN / 10
-3
WD
PT
/ s
0
TR Tiergarten
TW
100
101
102
103
104
105
WD
PT
/ s
0
BRBuch
BW
100
101
102
103
104
105
WD
PT
/ s
0
BRBuch
BW
Figure 4-3 Water drop penetration time (WDPT) as a function of water content (WC), and as a function of normalized C-H band intensity (CHN) of initially wettable (BW, n = 32, open symbols) and repellent Buch samples (BR, n = 10, solid symbols) and wettable and repellent Tiergarten samples (TW, n = 18;
and TR, n = 10, respectively) in field moist state (�■) and after drying at 35°C (��), 65°C (��), 105°C (� �) and at 31% RH (��). Error bars are WC ± 15% and estimates of the standard deviation from triplicate measurements of WDPT and DRIFT peak areas.
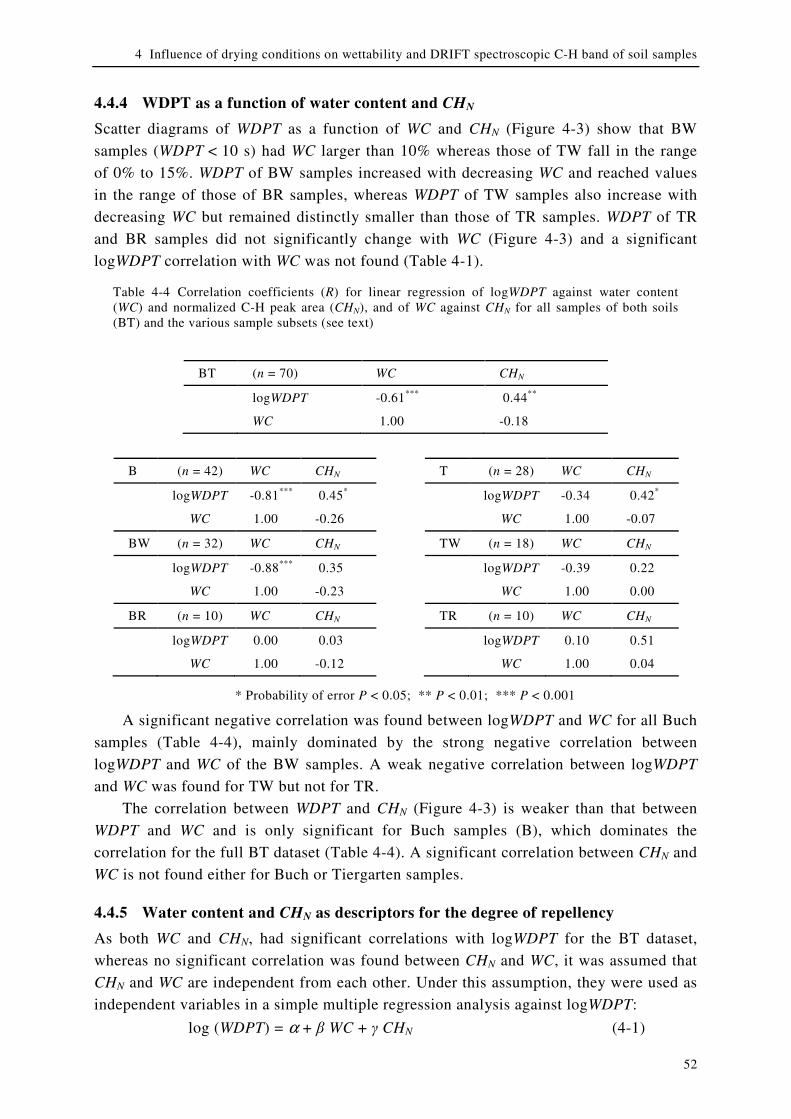
4 Influence of drying conditions on wettability and DRIFT spectroscopic C-H band of soil samples
52
4.4.4 WDPT as a function of water content and CHN
Scatter diagrams of WDPT as a function of WC and CHN (Figure 4-3) show that BW
samples (WDPT < 10 s) had WC larger than 10% whereas those of TW fall in the range
of 0% to 15%. WDPT of BW samples increased with decreasing WC and reached values
in the range of those of BR samples, whereas WDPT of TW samples also increase with
decreasing WC but remained distinctly smaller than those of TR samples. WDPT of TR
and BR samples did not significantly change with WC (Figure 4-3) and a significant
logWDPT correlation with WC was not found (Table 4-1).
Table 4-4 Correlation coefficients (R) for linear regression of logWDPT against water content (WC) and normalized C-H peak area (CHN), and of WC against CHN for all samples of both soils (BT) and the various sample subsets (see text)
BT (n = 70) WC CHN
logWDPT -0.61*** 0.44**
WC 1.00 -0.18
B (n = 42) WC CHN
logWDPT -0.81*** 0.45*
WC 1.00 -0.26
BW (n = 32) WC CHN
logWDPT -0.88*** 0.35
WC 1.00 -0.23
BR (n = 10) WC CHN
logWDPT 0.00 0.03
WC 1.00 -0.12
T (n = 28) WC CHN
logWDPT -0.34 0.42*
WC 1.00 -0.07
TW (n = 18) WC CHN
logWDPT -0.39 0.22
WC 1.00 0.00
TR (n = 10) WC CHN
logWDPT 0.10 0.51
WC 1.00 0.04
* Probability of error P < 0.05; ** P < 0.01; *** P < 0.001
A significant negative correlation was found between logWDPT and WC for all Buch
samples (Table 4-4), mainly dominated by the strong negative correlation between
logWDPT and WC of the BW samples. A weak negative correlation between logWDPT
and WC was found for TW but not for TR.
The correlation between WDPT and CHN (Figure 4-3) is weaker than that between
WDPT and WC and is only significant for Buch samples (B), which dominates the
correlation for the full BT dataset (Table 4-4). A significant correlation between CHN and
WC is not found either for Buch or Tiergarten samples.
4.4.5 Water content and CHN as descriptors for the degree of repellency
As both WC and CHN, had significant correlations with logWDPT for the BT dataset,
whereas no significant correlation was found between CHN and WC, it was assumed that
CHN and WC are independent from each other. Under this assumption, they were used as
independent variables in a simple multiple regression analysis against logWDPT:
log (WDPT) = α + β WC + γ CHN (4-1)
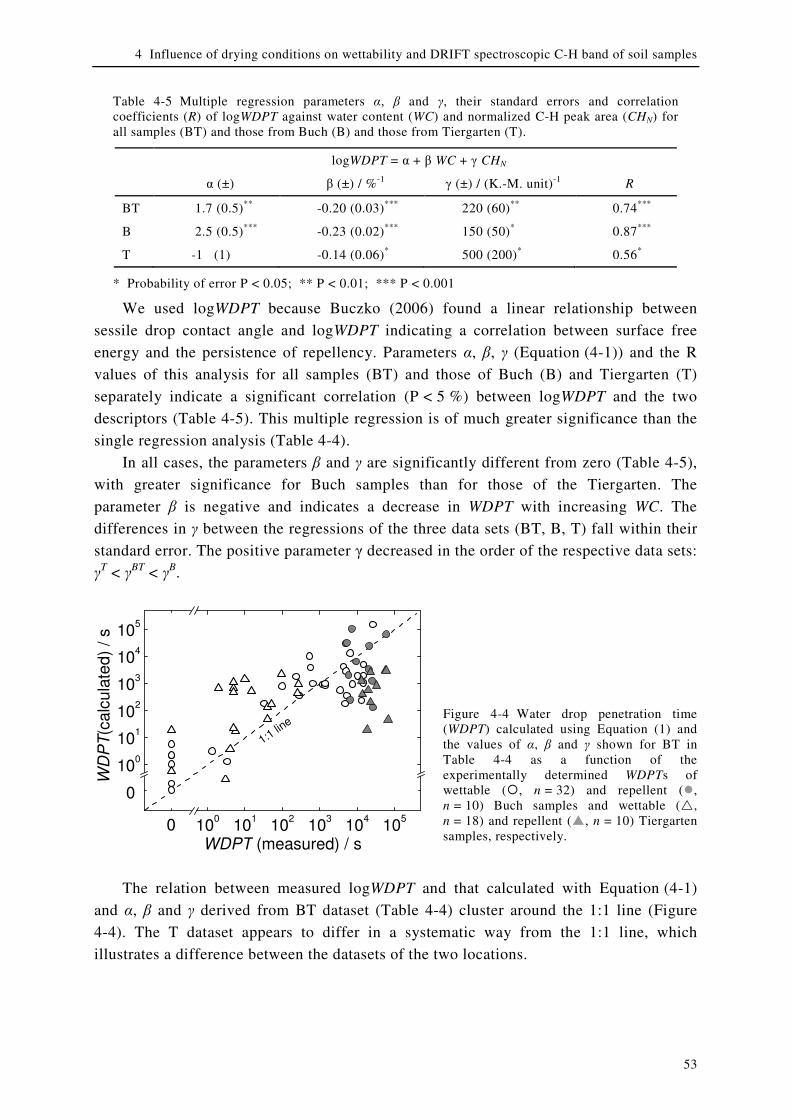
4 Influence of drying conditions on wettability and DRIFT spectroscopic C-H band of soil samples
53
Table 4-5 Multiple regression parameters α, β and γ, their standard errors and correlation coefficients (R) of logWDPT against water content (WC) and normalized C-H peak area (CHN) for all samples (BT) and those from Buch (B) and those from Tiergarten (T).
logWDPT = α + β WC + γ CHN
α (±) β (±) / %-1 γ (±) / (K.-M. unit)-1 R
BT 1.7 (0.5)** -0.20 (0.03)*** 220 (60)** 0.74***
B 2.5 (0.5)*** -0.23 (0.02)*** 150 (50)* 0.87***
T -1 (1) -0.14 (0.06)* 500 (200)* 0.56*
* Probability of error P < 0.05; ** P < 0.01; *** P < 0.001
We used logWDPT because Buczko (2006) found a linear relationship between
sessile drop contact angle and logWDPT indicating a correlation between surface free
energy and the persistence of repellency. Parameters α, β, γ (Equation (4-1)) and the R
values of this analysis for all samples (BT) and those of Buch (B) and Tiergarten (T)
separately indicate a significant correlation (P < 5 %) between logWDPT and the two
descriptors (Table 4-5). This multiple regression is of much greater significance than the
single regression analysis (Table 4-4).
In all cases, the parameters β and γ are significantly different from zero (Table 4-5),
with greater significance for Buch samples than for those of the Tiergarten. The
parameter β is negative and indicates a decrease in WDPT with increasing WC. The
differences in γ between the regressions of the three data sets (BT, B, T) fall within their
standard error. The positive parameter γ decreased in the order of the respective data sets:
γT < γBT < γB.
100
101
102
103
104
105
100
101
102
103
104
105
0
0
WD
PT
(ca
lcu
late
d)
/ s
WDPT (measured) / s
1:1 line
Figure 4-4 Water drop penetration time (WDPT) calculated using Equation (1) and the values of α, β and γ shown for BT in Table 4-4 as a function of the experimentally determined WDPTs of wettable (�, n = 32) and repellent (�, n = 10) Buch samples and wettable (�, n = 18) and repellent (�, n = 10) Tiergarten samples, respectively.
The relation between measured logWDPT and that calculated with Equation (4-1)
and α, β and γ derived from BT dataset (Table 4-4) cluster around the 1:1 line (Figure
4-4). The T dataset appears to differ in a systematic way from the 1:1 line, which
illustrates a difference between the datasets of the two locations.
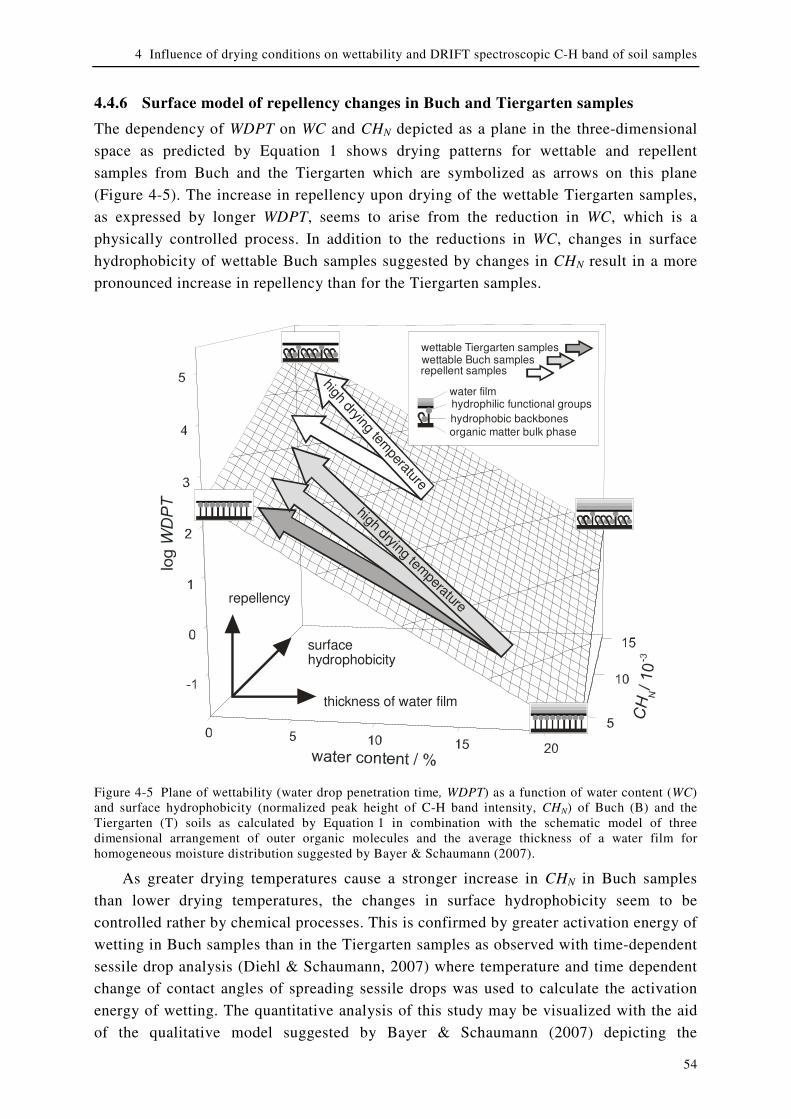
4 Influence of drying conditions on wettability and DRIFT spectroscopic C-H band of soil samples
54
4.4.6 Surface model of repellency changes in Buch and Tiergarten samples
The dependency of WDPT on WC and CHN depicted as a plane in the three-dimensional
space as predicted by Equation 1 shows drying patterns for wettable and repellent
samples from Buch and the Tiergarten which are symbolized as arrows on this plane
(Figure 4-5). The increase in repellency upon drying of the wettable Tiergarten samples,
as expressed by longer WDPT, seems to arise from the reduction in WC, which is a
physically controlled process. In addition to the reductions in WC, changes in surface
hydrophobicity of wettable Buch samples suggested by changes in CHN result in a more
pronounced increase in repellency than for the Tiergarten samples.
repellency
thickness of water film
surface hydrophobicity
high drying temperature
high drying temperature
hydrophilic functional groups
hydrophobic backbones
organic matter bulk phase
water film
repellent samples wettable Buch sampleswettable Tiergarten samples
Figure 4-5 Plane of wettability (water drop penetration time, WDPT) as a function of water content (WC) and surface hydrophobicity (normalized peak height of C-H band intensity, CHN) of Buch (B) and the Tiergarten (T) soils as calculated by Equation 1 in combination with the schematic model of three dimensional arrangement of outer organic molecules and the average thickness of a water film for homogeneous moisture distribution suggested by Bayer & Schaumann (2007).
As greater drying temperatures cause a stronger increase in CHN in Buch samples
than lower drying temperatures, the changes in surface hydrophobicity seem to be
controlled rather by chemical processes. This is confirmed by greater activation energy of
wetting in Buch samples than in the Tiergarten samples as observed with time-dependent
sessile drop analysis (Diehl & Schaumann, 2007) where temperature and time dependent
change of contact angles of spreading sessile drops was used to calculate the activation
energy of wetting. The quantitative analysis of this study may be visualized with the aid
of the qualitative model suggested by Bayer & Schaumann (2007) depicting the

4 Influence of drying conditions on wettability and DRIFT spectroscopic C-H band of soil samples
55
interactions between molecular arrangements and mean thickness of the water film
(Figure 4-5).
The effect of increasing water content on the degree of repellency may be interpreted
as the formation of an increasing film thickness where the water film properties
continuously tend towards those of bulk water (Goebel et al., 2004; Bayer & Schaumann,
2007) or by an increasing degree of surface covered by a water layer. In contrast, an
increase in the parameter CHN would be indicative of an increase in the proportion of
outward-oriented hydrophobic moieties, because of changes in orientation of amphiphilic
compounds in the outer SOM layers with increasing dryness (Kleber et al., 2007).
Although the description of WDPT via a WC-dependent term and a surface-specific term
(CHN) has significantly improved the correlation, the deviation between measured and
calculated WDPT is still up to three orders of magnitude. This indicates that additional
factors affecting soil water repellency, such as a heterogeneous moisture distribution as
suspected in the samples dried at 35°C and 65°C need to be considered.
4.4.7 Evaluation of the DRIFT method to detect drying-dependent surface changes
The results show that changes in the surface of SOM relevant to water repellency are
detectable. However, the penetration depth of IR radiation exceeds the surface-active
molecular layer and so the signal is diluted by the additional contribution from bulk SOM
over that depth. The scatter of DRIFT spectral data may further arise from spectral
distortions because of the use of untreated samples and interference from soil moisture
and minerals. This scatter could be reduced by an IR technique with a lower penetration
depth of IR radiation (e.g. ATR-IR technique) or by greater sample homogeneity in finer-
sieved or ground samples. The latter would, however, require a detailed evaluation of the
effect of grinding and sieving on SOM surface, the creation of new surfaces and therefore
on soil water repellency dynamics.
Interference from minerals may be compensated by subtracting some proportion of a
suitable reference spectrum of the sample’s minerals obtained after the removal of
organic material by oxidation or acid treatment. Reduction of interference by dilution of
the sample with an inert solid seems impractical as the commonly used KBr and KCl are
likely to affect the moisture content and distribution and most other materials absorb in
the IR region. The small changes in IR absorption, following various drying procedures,
reported here correspond with subtle modifications to soil surface chemistry. The
differences between the IR absorption of samples from the different locations are much
larger. This renders precise quantification of the small changes difficult with standard
DRIFT technology.
4.5 Conclusions
DRIFT spectroscopy has been found to be qualitatively useful, but not precise in
quantifying hydrophobicity in untreated, un-fractionated soil samples. The scattering of
the data indicates that the technique needs to be improved. The variations in CHN suggest
that there are changes in SOM surface structure, which correlate with water repellency.
4 Influence of drying conditions on wettability and DRIFT spectroscopic C-H band of soil samples
56
As DRIFT probes a relatively thick outer layer of the sample, its sensitivity to the outer
most layers is too low to confirm that changes in the conformation of SOM at the surface
have actually occurred. However, this appears to be one of the few reasonable
explanations presently available to account for changes in soil water repellency.
The drying procedure has more influence on the WDPT than the water content of the
soil samples. Care and control is required when assessments of some reference soil water
repellency follow drying. High temperatures may increase hydrophobicity, but short
drying events may be not sufficient to overwhelm initial differences in moisture content.
Reproducible repellency under laboratory conditions requires a drying procedure which
allows equilibrating the WC of all samples with the same imposed conditions. Drying at
20°C at a constant RH of 31% for periods in excess of four weeks seems to best to
preserve some characteristics of the field moist samples with relevance to soil
hydrophobicity. This procedure is therefore recommended as a means to maintain a
reference estimate of water repellency which is insensitive to minor changes in the soil
moisture content. In contrast to this reference repellency, the currently used potential
repellency is measured on samples dried at greater temperatures, where more energy is
available to promote conformational rearrangements of SOM components.
An improved correlation between WDPT, as an indicator of water of repellency, and
WC together with CHN, estimated using DRIFT spectroscopy, provides some resolution
of the contributions made by these properties to soil water repellency. Accordingly,
changes in soil water repellency result from an interplay between (i) water content driven
changes, probably induced by changes in micro-scale moisture distribution and thickness
of the water film, and (ii) changes in SOM surface chemistry, promoted by re-orientation
of amphiphilic moieties.
5 Reaction of soil water repellency on artificially induced changes in soil pH
57
5 Reaction of soil water repellency on artificially induced
changes in soil pH
5.1 Abstract
Few studies have systematically investigated the relationship between soil water
repellency (SWR) and soil pH. The hypothesis that the pH may control repellency via
changes in the variable surface charge of soil material has not yet been tested. Previously
it has been shown that it is necessary to eliminate the direct influence of changes in soil
moisture content so that the unique relationship between pH and SWR can be isolated.
A method has been developed which allows adjustment of the pH of soils with low
moisture content via the gas phase with minimal change in moisture content. The method
was applied to 14 soil samples from Germany, Netherlands, the UK and Australia, using
the water drop penetration time (WDPT) as the indicator of SWR. Sessile drop and
Wilhelmy plate contact angles (Θsess and ΘWPM resp.) were measured on the four samples
from Germany and the data correlated with those of WDPT. The titratable surface charge
of these four soils was measured at selected pH values using a particle charge detector
(PCD).
The comparison of repellency determination by WDPT, Θsess and ΘWPM highlights the
advantages and constrains of each individual method.
Changes in SWR with soil pH were found to be influenced by the density and type of
sites able to interact with protons at the available surfaces of organic and mineral
materials in soil. The maximum SWR occurred for soil at natural pH and where the
charge density was minimal. As pH increased, negative surface charge increased due to
deprotonation of sites and WDPT decreased. Two types of behaviour were observed:
Those in which (i) WDPT shortened with decreasing pH and ii) WDPT was sensibly
constant with decreasing pH. The data suggest that the availability and relative
abundance of proton active sites at mineral surfaces, and those at organic functional
groups influence the behaviour.
5.2 Introduction
Soil water repellency (SWR) is a world wide phenomenon leading to uneven water
distribution in soils, preferential flow and enhanced surface runoff, which in turn may
result in a lack of water to support plant growth, accelerated leaching and transport of
surface nutrients and contaminants toward groundwater, top soil degradation and erosion.
The causes and mechanisms affecting SWR are many fold and not fully understood. Soil
wettability was observed to improve following addition of lime, kaolinite clay, ammonia
and sodium hydroxide solution (van't Woudt, 1959; Karnok et al., 1993; Roper, 2005)
This led to the general acceptance that, among others, soil pH influences SWR (Wallis &
Horne, 1992). Roberts & Carbon (1971) found that water repellent sandy soils from
5 Reaction of soil water repellency on artificially induced changes in soil pH
58
south-western Australia were more likely to have a lower pH than wettable soils. Similar
trends were reported for 3000 garden and agricultural samples from New York State by
Steenhuis et al. (2001) for 66 samples from calcareous forest soils with a generally very
narrow range of pH (Mataix-Solera et al., 2007) and for soils from ants’ nests
(Cammeraat et al., 2002). Hurrass & Schaumann (2006) observed that, from a batch of 46
soil samples from an inner city park “Tiergarten” in Berlin, repellency was only detected
in those with pH below 4.5. However, they did not find any correlation between pH and
water repellency of samples drawn from a former sewage disposal field in Berlin.
Several mechanisms for the pH – SWR relationship have been proposed:
I) Changes in the surface charge of organic material: The hydrophobicity of humic acids
(HA) was observed to increase with decreasing pH in the ranges 8 < pH < 11, caused by
protonation of phenolic groups (MacCarthy et al., 1979; Duval et al., 2005) and
4 < pH < 7 by protonation of carboxylic groups (Terashima et al., 2004). In these ranges
this results in a reduction of negative surface charge which in turn leads to a less polar
and, therefore, less wettable surface. Holmes-Farley et al. (1985) observed the same pH
effect on sessile drop contact angle (Θsess) at a polymer surface (PE) with covalently
attached carboxylic acid groups. The same mechanisms could be responsible for a
decrease of soil water repellency as observed in field studies after increasing the pH via
lime addition (van't Woudt, 1959; Roper, 2005) or the application of 0.1 M NaOH to
repellent soils (Karnok et al., 1993). A further decrease in pH may lead to positive
charge, e.g. by protonation of amine groups. On heptylamine plasma polymer surfaces
this leads to an increasing wettability of the material (Chatelier et al., 1997).
II) Conformational changes in the organic matter: HA are not completely hydrophobic,
but have amphiphilic character, and can render a soil water repellent when orienting the
non-polar groups towards the pore space (Tschapek, 1984). Changes in pH may result in
the rearrangement of moieties, fragments or entire molecules of SOM, which may
influence their hydrophobicity (Ohashi & Nakazawa, 1996; Terashima et al., 2004; Duval
et al., 2005). Deo et al (2005) observed, that at low pH, carboxylic groups on organic
macromolecules with hydrophobic side chains, were orientated toward the bulk water,
protecting the hydrophobic groups by encasing them in the inner part of coiled
macromolecules. As pH increased and carboxylic groups were deprotonated, electrostatic
repulsion was considered responsible for the observed swelling, loosening and/or chain
expansion of hydrophobic nano-domains leading to an increased outward orientation of
hydrophobic groups. Similar mechanisms were also suggested for water repellent soils
(Ma'shum & Farmer, 1985; Valat et al., 1991). A decrease in pH from 7 to 5 was found
to facilitate a membrane-like aggregation of HA on mineral surfaces by hemimicelle or
admicelle-like formations with increasing hydrophobicity of HA (Terashima et al., 2004).
This was caused by protonation of carboxylic and phenolic groups leading to a reduction
in repulsion forces between these moieties (Ohashi & Nakazawa, 1996) and to the
formation of H-bridges and a more compact structure of HA with a maximum
compaction around the pKa of carboxylic sites.
III) Leaching of fulvic acid (FA)s: The relatively high solubility of FA at low pH, in
comparison with those of HA, provide opportunities for preferential dissolution and
5 Reaction of soil water repellency on artificially induced changes in soil pH
59
transport that do not arise at higher pH (>7). These high solubilities reflect a wettable
character to FA so the quantities of FA and HA, and their relative abundances, may
influence SWR (Chen & Schnitzer, 1978; Tschapek, 1984; Babejova, 2001); high FA/HA
may confer wettability and low FA/HA may lead to SWR. Generally, the addition of HA
to soil samples has been shown to increase their water repellency, and stable humic acid
complexes were identified as an important contribution to water repellency in some
sandy soils (Roberts & Carbon, 1972). The contact angle of FA and HA extracts was
found to be the inversely related to their pH, indicating that pH might be an indicator for
the hydrophobic potential of these materials (Lin et al., 2006).
IV) Changes in bacterial and fungal communities: Fungal exudates could be an agent for
local pH reduction. This could lead to polymerization and/or precipitation of FA and HA
and, therefore, be responsible for the resulting SWR observed in areas of high fungal
activity (Lin et al., 2006). Liming may increase soil wettability not only by increasing its
pH directly, but also by promoting microbial activity of wax degrading bacteria (Roper,
2005). However, some studies (Hurraß & Schaumann, 2006; Bayer & Schaumann, 2007)
did not find increased fungal growth within water repellent areas of soil.
Few studies have systematically investigated the influence of pH changes on soil sample
wettability. Instead of changing the soil pH directly, Graber et al. (2009) used Na+ and
Ca2+ solutions at various pHs to measure drop penetration times (a modified form of the
WDPT test). The maximum time occurred using drops in the range 7 < pH < 9 near to the
original soil pH ( ~7.3 - 7.7) which was not adjusted. Only in the presence of Ca2+ did the
water repellency of their samples increase with increasing pH. This was explained as the
complexation of free undissociated fatty acids with the mineral surface via Ca2+ bridges
leading to a higher density of fatty acid groups on the mineral surface and hydrocarbon
tails left to express water repellency above them.
Bayer & Schaumann (2007) investigated the change of pH and its influence on soil
wettability following the addition of aqueous HCl and NaOH solutions to soils. These
actions only affected the wettability of samples from “Tiergarten” with a distinct
maximum in SWR occurring in the range 4.5 < pH < 6.5 and a similar wettability when
brought to similar pH by addition of liquid NaOH. However, they found no such effect
on samples from “Buch”. As soil moisture content is altered by the addition of aqueous
reagents, this approach provides opportunities for partial solvation and re-arrangement of
large organic molecules or flexible side-chains, which would not arise in the field where
SWR has developed through natural drying. It is, therefore, difficult to resolve the effects
of the imposed pH change from the impact of the method on soil moisture content on
SWR (Bayer & Schaumann, 2007). Differences in repellency following drying have been
observed between Buch and Tiergarten soils. Some mechanisms for the influence of
water content on repellency in them (such as conformational changes in SOM at the
surface, together with water coverage) were suggested by Diehl et al. (2009). Diehl &
Schaumann (2007) discussed this in the context of several chemical reactions with
activation energies of 65 – 94 kJ mol-1, 42 kJ mol-1 and 8 - 20 kJ mol-1 for the wetting
process of dried Buch, repellent and wettable Tiergarten samples respectively.
5 Reaction of soil water repellency on artificially induced changes in soil pH
60
This study presents an alternative approach to the investigation of the relationships
between soil pH and SWR where the soil moisture content is essentially unaffected so
that the mobility of organic material is not enhanced by solvation effects. The method
involves exposing samples to various concentrations of gaseous hydrogen chloride or
ammonia (drawn from the headspace gas above their respective concentrated solutions)
for 24 h. The outcomes of the method are compared with those of previous studies
(Täumer et al., 2005; Hurraß & Schaumann, 2006; Diehl & Schaumann, 2007)
concerning SWR of soils from “Buch” and “Tiergarten” sites, in Berlin, Germany, and
the differences between them. The method was also applied to soil samples from the
Netherlands, the UK and Australia and correlated with WDPT data. The pH data, from
processed German soils, are compared with those from water drop penetration times
(WDPT), water contact angles, estimates of both surface charge density and potential
cation exchange capacity (CECpot) and an assessment of the influence of interactions
between surface sites and protons in relation to pH and SWR is presented.
5.3 Material and Methods
5.3.1 Soil samples
German soil samples originate from two strongly anthropogenically influenced sites, a
former sewage field in the north east of Berlin “Buch” and an inner city park in Berlin
“Tiergarten”. The locations are in a transition zone between temperate oceanic and
continental climates with moderate precipitation (< 500 mm a-1) and highest yield in the
summer months.
At both sites the topsoil consists of medium sized sand with clay content below 5 %
and is characterized by high soil organic matter content (SOM) between 5 and 20 %
(Schlenther, 1996; Hoffmann, 2002; Täumer et al., 2005; Diehl & Schaumann, 2007).
Samples were collected at the sites in spring 2007. The grass cover was removed
(~ 1 m2) and four individual samples taken in a depth of 10-20 cm from visibly
distinguishable dry or wet patches known to reflect different SWRs (Hurraß &
Schaumann, 2006). The wet and dry soil samples differ strongly in actual wettability
(Table 5-1 and Table 5-2). Samples are identified by their source locations and SWRs as
initially determined in their field moist states: Buch-wettable (BW), Buch- repellent
(BR), Tiergarten-wettable (TW) and Tiergarten-repellent (TR).
Samples from the Netherlands were obtained from an individual profile (4). Samples of
topsoils were collected from the UK (3) and Australia (3) between October 1999 and
May 2001. Each set consisted of 2 or 3 water repellent samples (NLR, UKR and AUR)
and one wettable sample (NLW, UKW and AUW, respectively). Wettable samples were
collected as close as possible to the sites of water repellent soils to eliminate, insofar as
possible, variations in soil type and land use. Sample information (Table 5-1) was
obtained from Llewellyn (2004) and Mainwaring (2004) and further details of precise
locations are available (Doerr et al., 2002; Doerr et al., 2005a; Doerr et al., 2005b;
Morley et al., 2005; Douglas et al., 2007).

Table 5-1: Sample characteristics
Code Country Region Site Vegetation Depth
(cm)
Soil particle size
mean diameter /
distribution width (mm)
TOC
(g kg-1)
pH
WDPT
air dried
(s)
TR
Germany Berlin
Tiergarten turf grass 0-10 0.23 / 0.08 26.2 (±0.7)* 4.0 3,500 (±1,100)
TW turf grass 0-10 0.23 / 0.08 48 (±1) * 4.4 5 (±1)
BR Buch
couch grass 0-10 0.24 / 0.08 47 (±1) * 4.6 9,900 (±1,000)
BW couch grass 0-10 0.24 / 0.08 50 (±1) * 4.6 1,200 (±100)
NLR1
Nether-
lands
Zuid
Holland Ouddorp
grass, moss 0-10 0.27 / 0.22 36 (±3) 4.7 6,700 (± 700)
NLR2 grass, moss 10-20 0.23 / 0.10 5.9 (±0.3) 3.9 6,900 (± 700)
NLR3 grass, moss 20-30 0.22 / 0.08 0.8 (±0.2) 3.9 1,600 (± 400)
NLW grass, moss 30-40 0.22 / 0.07 n. d. 4.1 0.1 (± 0.1)
UKR1
UK Gower
Nicholaston
Dunes dune herbs, grasses 0- 5 0.33 / 0.08 11 (±3) 4.1 6,000 (± 1,000)
UKR2 Pennard Golf
Course turf grass 0- 5 0.30 / 0.08 8 (±1.0) 4.5 90 (± 10)
UKW Nicholaston
Dunes unvegetated 0- 5 0.39 / 0.12 3.1 (±0.6) 7.0 0.1 (± 0.1)
AUR1
Australia Nara-
coorte
Pine Views paddock 0-10 0.25 / 0.16 11.7 (±1.0) 4.8 450 (± 40)
AUR2 paddock 0-10 0.29 / 0.23 14.4 (±0.5) 4.3 1000 (± 200)
AUW Myome paddock 0-10 0.24 / 0.14 2.2 (±0.4) 5.1 0.1 (± 0.1)
* TOC values are estimated from SOM content (loss of ignition)
5 R
eaction
of so
il water rep
ellency
on
artificially in
du
ced ch
ang
es in so
il pH
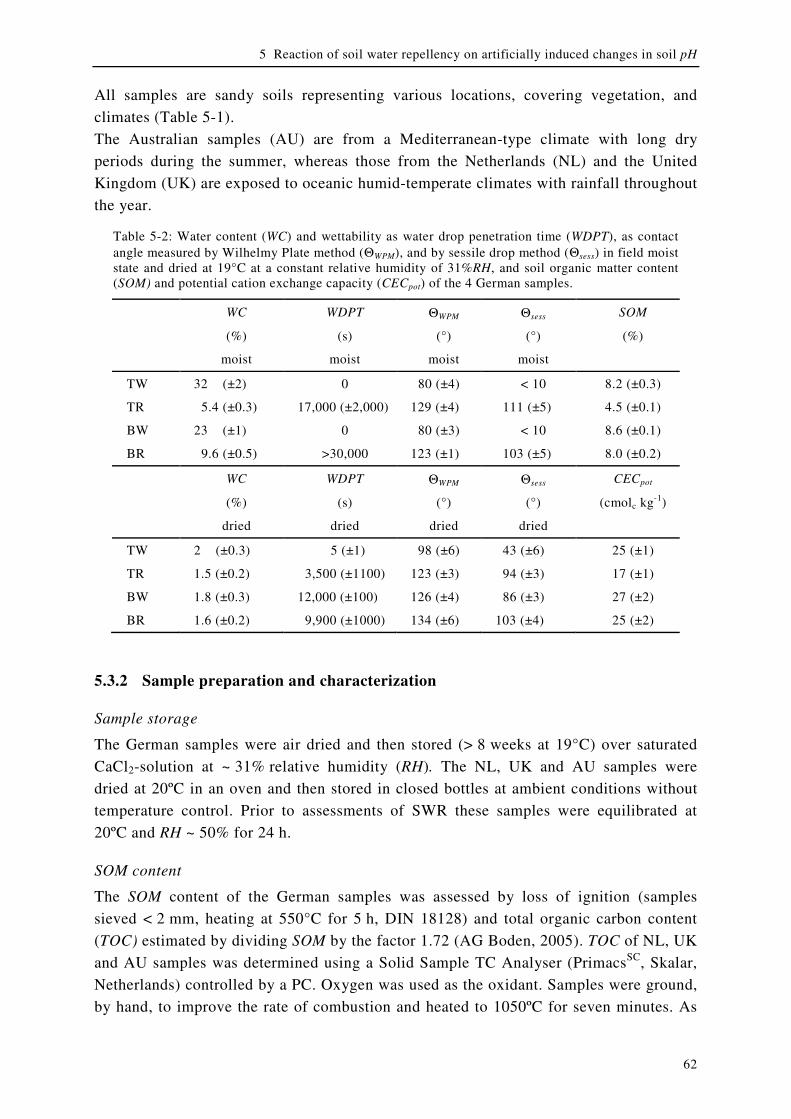
5 Reaction of soil water repellency on artificially induced changes in soil pH
62
All samples are sandy soils representing various locations, covering vegetation, and
climates (Table 5-1).
The Australian samples (AU) are from a Mediterranean-type climate with long dry
periods during the summer, whereas those from the Netherlands (NL) and the United
Kingdom (UK) are exposed to oceanic humid-temperate climates with rainfall throughout
the year.
Table 5-2: Water content (WC) and wettability as water drop penetration time (WDPT), as contact angle measured by Wilhelmy Plate method (ΘWPM), and by sessile drop method (Θsess) in field moist state and dried at 19°C at a constant relative humidity of 31%RH, and soil organic matter content (SOM) and potential cation exchange capacity (CECpot) of the 4 German samples.
WC WDPT ΘWPM Θsess SOM
(%) (s) (°) (°) (%)
moist moist moist moist
TW 32 (±2) 0 80 (±4) < 10 8.2 (±0.3)
TR 5.4 (±0.3) 17,000 (±2,000) 129 (±4) 111 (±5) 4.5 (±0.1)
BW 23 (±1) 0 80 (±3) < 10 8.6 (±0.1)
BR 9.6 (±0.5) >30,000 123 (±1) 103 (±5) 8.0 (±0.2)
WC WDPT ΘWPM Θsess CECpot
(%) (s) (°) (°) (cmolc kg-1)
dried dried dried dried
TW 2 (±0.3) 5 (±1) 98 (±6) 43 (±6) 25 (±1)
TR 1.5 (±0.2) 3,500 (±1100) 123 (±3) 94 (±3) 17 (±1)
BW 1.8 (±0.3) 12,000 (±100) 126 (±4) 86 (±3) 27 (±2)
BR 1.6 (±0.2) 9,900 (±1000) 134 (±6) 103 (±4) 25 (±2)
5.3.2 Sample preparation and characterization
Sample storage
The German samples were air dried and then stored (> 8 weeks at 19°C) over saturated
CaCl2-solution at ~ 31% relative humidity (RH). The NL, UK and AU samples were
dried at 20ºC in an oven and then stored in closed bottles at ambient conditions without
temperature control. Prior to assessments of SWR these samples were equilibrated at
20ºC and RH ~ 50% for 24 h.
SOM content
The SOM content of the German samples was assessed by loss of ignition (samples
sieved < 2 mm, heating at 550°C for 5 h, DIN 18128) and total organic carbon content
(TOC) estimated by dividing SOM by the factor 1.72 (AG Boden, 2005). TOC of NL, UK
and AU samples was determined using a Solid Sample TC Analyser (PrimacsSC, Skalar,
Netherlands) controlled by a PC. Oxygen was used as the oxidant. Samples were ground,
by hand, to improve the rate of combustion and heated to 1050ºC for seven minutes. As
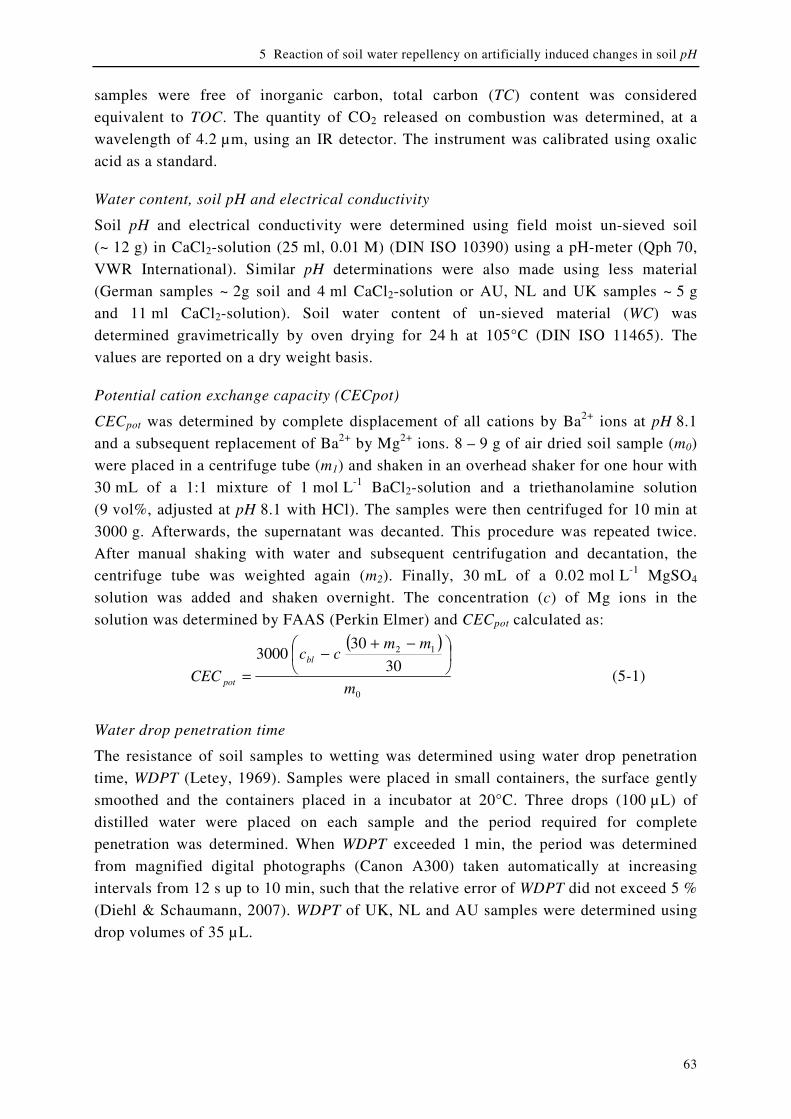
5 Reaction of soil water repellency on artificially induced changes in soil pH
63
samples were free of inorganic carbon, total carbon (TC) content was considered
equivalent to TOC. The quantity of CO2 released on combustion was determined, at a
wavelength of 4.2 µm, using an IR detector. The instrument was calibrated using oxalic
acid as a standard.
Water content, soil pH and electrical conductivity
Soil pH and electrical conductivity were determined using field moist un-sieved soil
(~ 12 g) in CaCl2-solution (25 ml, 0.01 M) (DIN ISO 10390) using a pH-meter (Qph 70,
VWR International). Similar pH determinations were also made using less material
(German samples ~ 2g soil and 4 ml CaCl2-solution or AU, NL and UK samples ~ 5 g
and 11 ml CaCl2-solution). Soil water content of un-sieved material (WC) was
determined gravimetrically by oven drying for 24 h at 105°C (DIN ISO 11465). The
values are reported on a dry weight basis.
Potential cation exchange capacity (CECpot)
CECpot was determined by complete displacement of all cations by Ba2+ ions at pH 8.1
and a subsequent replacement of Ba2+ by Mg2+ ions. 8 – 9 g of air dried soil sample (m0)
were placed in a centrifuge tube (m1) and shaken in an overhead shaker for one hour with
30 mL of a 1:1 mixture of 1 mol L-1 BaCl2-solution and a triethanolamine solution
(9 vol%, adjusted at pH 8.1 with HCl). The samples were then centrifuged for 10 min at
3000 g. Afterwards, the supernatant was decanted. This procedure was repeated twice.
After manual shaking with water and subsequent centrifugation and decantation, the
centrifuge tube was weighted again (m2). Finally, 30 mL of a 0.02 mol L-1 MgSO4
solution was added and shaken overnight. The concentration (c) of Mg ions in the
solution was determined by FAAS (Perkin Elmer) and CECpot calculated as:
( )
0
12
30
303000
m
mmcc
CECbl
pot
−+−
= (5-1)
Water drop penetration time
The resistance of soil samples to wetting was determined using water drop penetration
time, WDPT (Letey, 1969). Samples were placed in small containers, the surface gently
smoothed and the containers placed in a incubator at 20°C. Three drops (100 µL) of
distilled water were placed on each sample and the period required for complete
penetration was determined. When WDPT exceeded 1 min, the period was determined
from magnified digital photographs (Canon A300) taken automatically at increasing
intervals from 12 s up to 10 min, such that the relative error of WDPT did not exceed 5 %
(Diehl & Schaumann, 2007). WDPT of UK, NL and AU samples were determined using
drop volumes of 35 µL.

5 Reaction of soil water repellency on artificially induced changes in soil pH
64
Contact Angle: Wilhelmy Plate Method
Advancing contact angles (ΘWPM) were determined by the Wilhelmy Plate Method using
a Dynamic Contact Angle Meter and Tensiometer (DCAT 21, Data Physics, Filderstadt,
Germany). Half a glass microscope slide (76 x 26 x 1 mm) was covered completely with
double sided adhesive tape and a thin layer of soil attached to it. The ΘWPM of the slide
was measured as an advancing contact angle (Diehl & Schaumann, 2007).
Contact Angle: Sessile Drop Method
A thin layer of the soil sample was attached to one side of a glass microscope slide using
double sided adhesive tape (Bachmann et al., 2000a). Three drops of water (100 µl) were
placed on the surface. After one minute a digital image was taken (Canon A300) and the
sessile drop contact angle (Θsess) was calculated from the tangent to the three-phase
contact point associated with the ellipse that best fitted the drop shape (Diehl &
Schaumann, 2007).
Modification of soil pH
Soil samples were exposed to various concentrations of gaseous HCl and NH3 in air to
change their pH.
pH increase: Ammonia solutions 32% and 35% were obtained from Carl Roth and Fisher
Scientific Ltd (Germany and UK, respectively). A known sample volume of ammonia gas
(5 - 100 mL) was drawn from the headspace of an ammonia solution using a glass syringe
via a silicone septum fitted in the screw cap of a containing bottle. The sample was then
injected through a similar septum in the cap of a small bottle containing soil (~10 or 40g)
(Figure 5-1 A). AU, NL, UK soil samples were treated with ammonia from the 35%
solution and those from Germany with that from the 32% solution). After 24 h, the bottle
containing the soil was opened and the wettability and then pH and of the soil were
determined.
pH reduction: Hydrochloric acid solutions, 37%, and 36%, were obtained from Carl
Roth, Germany and 36 % Fisher Scientific Ltd., UK resp. A known sample volume
between (25 - 500 mL) of air was introduced into a dispersion tube and passed through a
gas wash bottle (250 mL) filled with HCl. The air enriched in HCl was passed through
flexible silicone tubes and glass stopcocks into a second wash bottle (250 mL) containing
soil (~10 g) (Figure 5-1 B). AU, NL and UK soil samples were treated with fumes from
the 36% solution and those from Germany with fumes from the 37% solution. After 24 h,
the bottle containing the soil was opened and the wettability and the pH of the soil were
determined.
pH range: Both procedures were applied to known masses of soil and various volumes of
HCl and NH3 fumes to determine the range of adjustment possible to soil pH.
Surface charge
Particle surface charge of selected soil samples (sieve fraction < 0.063 mm), at native and
adjusted pH (as described above), were determined by titration following dispersion of

5 Reaction of soil water repellency on artificially induced changes in soil pH
65
the samples in laboratory water (prepared by deionisation and reverse osmosis;
5.4 < pH < 6.6; specific conductivity < 2 µS) using a particle charge detector (PCD 02,
Mütek company, Germany). Stepwise additions of cationic polyelectrolyte (polydiallyl-
dimethylammonium chloride, 0.01, 0.1 or 1 mmol L-1) were made in for negatively
charged particles, and anionic polyelectrolyte (sodium polyethylene-sulfonate, 0.1 mmol
L-1), for positively charged particles, using an automatic titrator (Mettler Toledo DL 25)
to effect neutralization of electrokinetic charge. The amount of polyelectrolyte of charge
(c) in volume (V) required to reach the isoelectric point (IEP) of a sample mass (w), was
detected by the PCD as an electrokinetic potential of zero. The titratable charge (Q) of
the sample was calculated as:
w
qVQ
⋅= (5-2)
Provided that the PCD signal is only used in combination with polyelectrolyte
titration to detect the sign of particle charge and to indicate the isoelectric point (IEP),
PCD technique is reported to produce reasonable results for titratable surface charge
(Böckenhoff & Fischer, 2001).
AldrichSure/Seal
AldrichSure/Seal
soil
NH3
A mL air
soil
NaOH HCl
B
Figure 5-1: Experimental design of modification of soil-pH. A Exposition of soil to gaseous ammonia enriched atmosphere. B Exposition of soil to HCl enriched atmosphere.
Long-term investigation of Buch and Tiergarten site
Between spring 2002 and spring 2004, the sample sites Tiergarten and Buch (Germany)
were subjected to a long-term study of seasonal sampling and characterisation of wettable
and repellent samples, amongst others, pH, electrical conductivity (EC), C/N ratio and
“Mehlich” extractable iron (Mehlich, 1984). Some EC and pH data were presented by

5 Reaction of soil water repellency on artificially induced changes in soil pH
66
Hurraß & Schaumann (2006). C/N ratio was determined by combustion and
quantification of CO2 and N2 using gas chromatography and thermal conductivity
detector (C/N NA 1500 N Carlo Erba).
5.4 Results
5.4.1 General sample characteristics
The long-term investigations showed that repellent samples in Tiergarten were restricted
to a range 3.5 < pH < 4.5 whereas wettable Tiergarten samples and all Buch samples
were found in a range of 3.5 < pH < 5.5 (Figure 5-2 A). Wettable samples from both sites
had EC values < 350 µS cm-1, whereas repellent samples had maximum EC values of
< 1300 µS cm-1 and < 550 µS cm-1 for Tiergarten and Buch sites, respectively (Figure
5-2 B). Although Tiergarten samples have higher C/N ratios than Buch samples (Figure
5-2 C), absolute N content is comparable in both sites (data not shown). Tiergarten
samples possessed significantly higher contents of “Mehlich” extractable iron than Buch
samples, in absolute values (Figure 5-2 D) as well as related to SOM content (data not
shown).
10
12
14
16
18
20 C
C / N
BRTRTW BW
29
3561
18
0.0
0.5
1.0
1.5
2.0D
c
Fe /
mg
kg
-1
BRTRTW BW
15
2031
10
0
200
400
600
800
B
EC
/ µ
S m
-1
BRTRTW BW
28
42
76
20
4.0
4.5
5.0
5.5
BRTRTW
pH
(C
aC
l 2)
BW
A
32
4375
23
Figure 5-2: A pH, B electrical conductivity (EC), C Soil C/N ratio, and D “Mehlich”-extractable iron measured in wettable and repellent soil samples from Tiergarten (TW, TR) and from Buch (BW, BR, respectively) from a study of seasonally sampling between spring 2002 and spring 2004.

5 Reaction of soil water repellency on artificially induced changes in soil pH
67
Water repellency (WDPT) of the originally wettable samples from Germany (TW, BW)
changed significantly after drying at 19°C at constant relative humidity of 31%RH.
Values for BW samples increased from 0 s in field moist state up to 1200 s following
drying (Table 5-2). In contrast, values for TW samples increased from 0 s in field moist
state to 5 s following drying and so the soil remained wettable. The effect of drying on
WDPT of the repellent samples (TR, BR) was the inverse: After drying WDPTs were
shorter than those for field moist samples (Table 5-2).
CECpot was significantly lower (17 cmolc kg-1) in the TR sample than in the other 3
German samples (25-37 cmolc kg-1) which may reflect the low SOM content in the TR
samples, 26 g kg-1 in comparison with ~ 50 g kg-1 TOC of the others (Table 5-2). The TR
sample also has a noticeably lower pH (4.0) in comparison with the others (4.4 - 4.6)
(Table 5-1).
TOC in the NL samples decreased with increasing depth from 36 g kg-1 in the topsoil
(0-10 cm) down to 0 (the detection limit) at a depth of 30-40 cm. The TOC of UK and
AU samples varied between 2 and 14 g kg-1. Original pH values of the samples from
vegetated sites ranged between 3.9 in NLR2 and NLR3 (in a depth of 10-30 cm of the NL
soil profile) and 5.1 in sample AUR2. Only the pH of the UKW sample, from a
vegetation-free site, was distinctly higher (7.0) than those of the others (Table 5-1).
5.4.2 Effects of exposure to gaseous NH3 and HCl
As the volumes of gaseous ammonia or hydrogen chloride, added to soil samples B and T
increased, the resulting pH changes increased and decreased respectively away from the
initial value and form sigmoidal curve (Figure 5-3 D). The slope of pH increase /
decrease is steepest around pH 4 – 5 (untreated samples) and flattens with increased gas
volume. The pH approaches a value of 8.8 – 9.3 after addition of 10 mL/g of NH3-
enriched air and to a value of 1.8 – 2.4 after addition of 50 mL/g of HCl-enriched air.
The pH of the TR sample was slightly more sensitive to increases in concentration of
NH3 in comparison with its wettable counterpart (TW). In order to increase pH of TW
sample from 5.2 to 8.1, ~ 4 mL/g of NH3 enriched air is needed, whereas TR sample
requires only ~ 3 mL/g to increase pH from 5.3 to 8.3. The difference between pH of this
pair vanished after the addition of 1 mL/g NH3 (pH 5.3) and reappears clearly inverted
after the addition of 4 mL/g NH3.
The initial pH of untreated BW and BR were identical, but addition of NH3 (up to
4 mL/g) resulted in slightly higher pH change for BR than for BW. With further additions
of NH3, the pH of the TR-TW pair converged at 9.3 and at 8.8 – 9.0 (Figure 5-3 D).
The pH of the repellent sample TR decreased with a steeper slope, than that of TW
after addition of HCl (up to 15 mL/g). Within this range, the pH of the TW sample is
higher than that of TR, whereas the pH of BW is slightly lower than that of BR. Only
after addition of volumes (20 and 50 mL/g) of HCl enriched air, did the pH of all samples
converge to specific values of 1.8 for T and 2.4 for B pairs (Figure 5-3 D). In order to
decrease the pH of TW from its original value (4.4) to that of TR (4.0), it was necessary
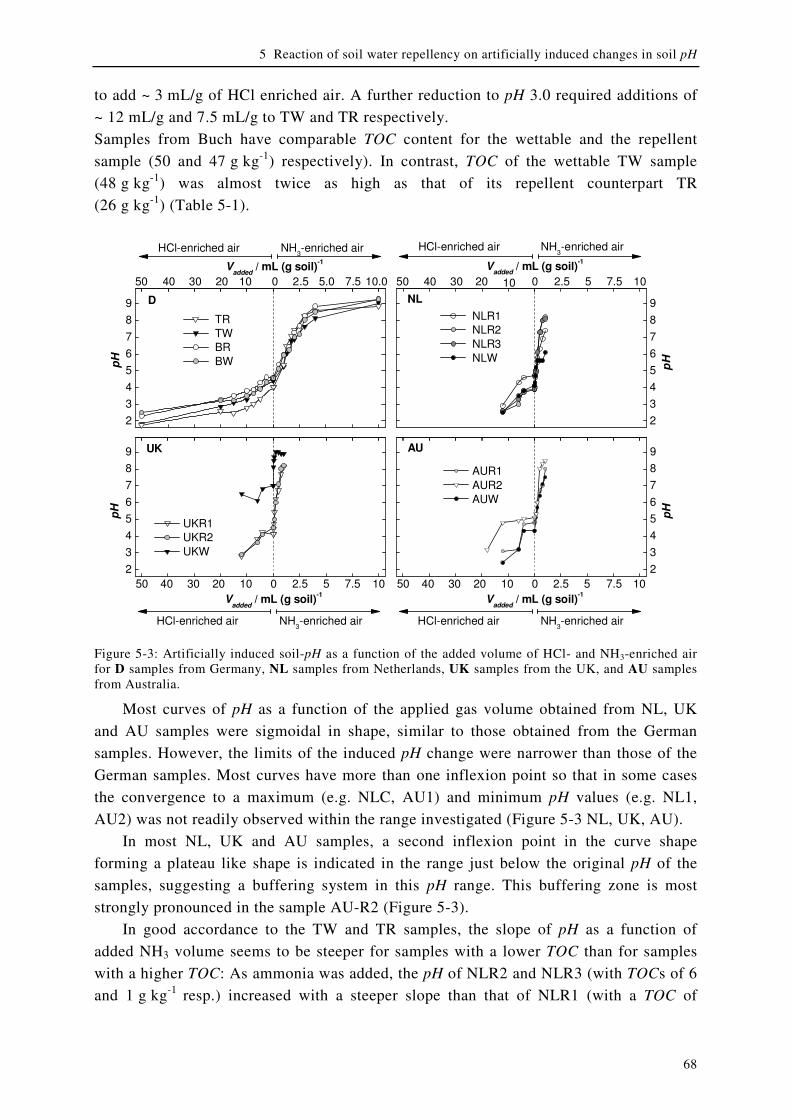
5 Reaction of soil water repellency on artificially induced changes in soil pH
68
to add ~ 3 mL/g of HCl enriched air. A further reduction to pH 3.0 required additions of
~ 12 mL/g and 7.5 mL/g to TW and TR respectively.
Samples from Buch have comparable TOC content for the wettable and the repellent
sample (50 and 47 g kg-1) respectively). In contrast, TOC of the wettable TW sample
(48 g kg-1) was almost twice as high as that of its repellent counterpart TR
(26 g kg-1) (Table 5-1).
2
3
4
5
6
7
8
9
pH
UK
UKR1
UKR2
UKW
40 30 20 7.552.550 10 0 10
Vadded
/ mL (g soil)-1
HCl-enriched air NH3-enriched air
2
3
4
5
6
7
8
9
pH
NL
NLR1
NLR2
NLR3
NLW
40 30 20 7.552.550 10 0 10
Vadded
/ mL (g soil)-1
HCl-enriched air NH3-enriched air
2
3
4
5
6
7
8
9
40 30 20 7.55.0
TR
TW
BR
BW
2.550 10 0 10.0
Vadded
/ mL (g soil)-1
HCl-enriched air NH3-enriched air
pH
D
2
3
4
5
6
7
8
9AU
AUR1
AUR2
AUW
pH
40 30 20 7.552.550 10 0 10
Vadded
/ mL (g soil)-1
HCl-enriched air NH3-enriched air
Figure 5-3: Artificially induced soil-pH as a function of the added volume of HCl- and NH3-enriched air for D samples from Germany, NL samples from Netherlands, UK samples from the UK, and AU samples from Australia.
Most curves of pH as a function of the applied gas volume obtained from NL, UK
and AU samples were sigmoidal in shape, similar to those obtained from the German
samples. However, the limits of the induced pH change were narrower than those of the
German samples. Most curves have more than one inflexion point so that in some cases
the convergence to a maximum (e.g. NLC, AU1) and minimum pH values (e.g. NL1,
AU2) was not readily observed within the range investigated (Figure 5-3 NL, UK, AU).
In most NL, UK and AU samples, a second inflexion point in the curve shape
forming a plateau like shape is indicated in the range just below the original pH of the
samples, suggesting a buffering system in this pH range. This buffering zone is most
strongly pronounced in the sample AU-R2 (Figure 5-3).
In good accordance to the TW and TR samples, the slope of pH as a function of
added NH3 volume seems to be steeper for samples with a lower TOC than for samples
with a higher TOC: As ammonia was added, the pH of NLR2 and NLR3 (with TOCs of 6
and 1 g kg-1 resp.) increased with a steeper slope than that of NLR1 (with a TOC of

5 Reaction of soil water repellency on artificially induced changes in soil pH
69
36 g kg-1), similarly the pH of UKW (with a TOC of 3 g kg-1) increased with a steeper
slope than those of UKR1 and UKR2 (with TOCs of 11 and 8 g kg-1 resp.) and the pH of
AUR2 (with a TOC of with 2 g kg-1) increased with a steeper slope than those of AUR1
and AUW (with TOCs of 12 and 14 g kg-1 resp.) (Figure 5-3 NL, UK and AU).
The sparse array of data (3-4 points) available for acidified samples is not sufficient
to provide a detailed description of the behaviour of NL, UK and AU samples. Whilst
this method of soil acidification appears useful, the experimental design does not provide
a relationship between the added HCl-enriched air volume and the specific HCl
concentration in the wash bottle containing the soil sample.
5.4.3 Reaction of repellency on changes in soil pH
WDPTs of the German samples whose pH was adjusted were found to fall in the range
0 < WDPT < 14400 s with increasing maxima (TR 1 h, BW 2 h and BR 3 h) and minima
(at 2, 12 and 90 s respectively). Data for TW fell in the range 0 < WDPT < 5 s indicating
a minimal influence of pH in the range 2 < pH < 9. WDPT decreased with increasing pH
for all samples ((Figure 5-4 D). Slopes of the best fit linear regression lines of log WDPT
vs pH in the alkaline direction were -0.36 ± 0.02 and -0.42 ± 0.03 (p < 0.0001, both)
comparable for BW and BR, respectively, but significantly steeper (-0.66 ± 0.04,
p < 0.0001) for the TR. This sample became wettable (WDPT < 10 s) above pH 8.3,
whereas both Buch samples remain repellent (WDPT > 10 s) up to the limit of pH 9.3
((Figure 5-4 D).
As pH was reduced, WDPT behaved in an inconsistent manner: The WDPT of TR
decreased with a maximum at the original pH. Variations in the relatively short WDPTs
of TW are probably of little practical significance (with little net change in relation to the
value at the original pH). Contact angles measured either from sessile drops or using the
Wilhelmy Plate method decrease with decreasing pH for all Tiergarten samples (Figure
5-4 B, C). In contrast, WDPTs of both Buch samples did not decrease upon pH
reduction, but remained within a range of 2 < WDPT < 4 h for BR and increased from
0.3 h to 1 h for BW.
Changes in WDPT arising from adjustment of soil pH of the repellent NL, UK, and
AU samples follow the trends shown by the repellent German samples (BR and TR): In
all cases, WDPT decreased with increasing pH (Figure 5-4).
Two types of behaviour were observed as pH decreased: I) samples with a maximum
WDPT in the region of the original pH and WDPT decreasing with decreasing pH (TR,
NLR1, UKR2, AUR1 and AUR2) and II) samples with constant or increasing WDPT
(BW, BR and UK-R1) after reduction of pH. Samples NLR2 and NLR3 possessed local
maxima in WDPT at the original pH, and WDPT decreased with pH, except for the lowest
induced pH, where WDPT reached a second maximum with a value comparable with or
higher than, that at the original pH (Figure 5-4 NL).
In contrast to TW, all wettable NL, UK, and AU sets exhibited instant penetration
(WDPT ~ 1 s) over the pH range examined. Sample BW became repellent after drying
and, suffered a reclassification as repellent.
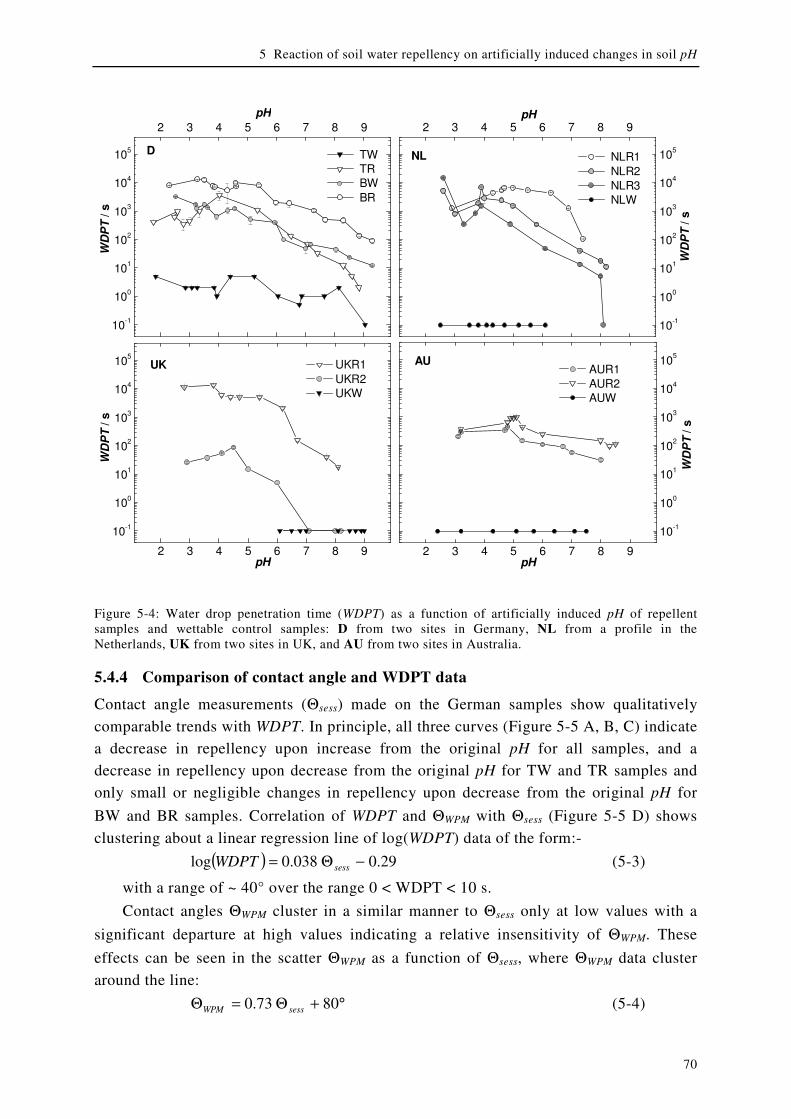
5 Reaction of soil water repellency on artificially induced changes in soil pH
70
2 3 4 5 6 7 8 9
10-1
100
101
102
103
104
105
AUR1
AUR2
AUW
AU
pH
WD
PT
/ s
2 3 4 5 6 7 8 9
10-1
100
101
102
103
104
105
UKR1
UKR2
UKW
UK
WD
PT
/ s
pH
2 3 4 5 6 7 8 9
10-1
100
101
102
103
104
105
NLR1
NLR2
NLR3
NLW
NL
WD
PT
/ s
pH
10-1
100
101
102
103
104
105
2 3 4 5 6 7 8 9
TW
TR
BW
BR
D
pH W
DP
T / s
Figure 5-4: Water drop penetration time (WDPT) as a function of artificially induced pH of repellent samples and wettable control samples: D from two sites in Germany, NL from a profile in the Netherlands, UK from two sites in UK, and AU from two sites in Australia.
5.4.4 Comparison of contact angle and WDPT data
Contact angle measurements (Θsess) made on the German samples show qualitatively
comparable trends with WDPT. In principle, all three curves (Figure 5-5 A, B, C) indicate
a decrease in repellency upon increase from the original pH for all samples, and a
decrease in repellency upon decrease from the original pH for TW and TR samples and
only small or negligible changes in repellency upon decrease from the original pH for
BW and BR samples. Correlation of WDPT and ΘWPM with Θsess (Figure 5-5 D) shows
clustering about a linear regression line of log(WDPT) data of the form:-
( ) 29.0038.0log −Θ= sessWDPT (5-3)
with a range of ~ 40° over the range 0 < WDPT < 10 s.
Contact angles ΘWPM cluster in a similar manner to Θsess only at low values with a
significant departure at high values indicating a relative insensitivity of ΘWPM. These
effects can be seen in the scatter ΘWPM as a function of Θsess, where ΘWPM data cluster
around the line:
°+Θ=Θ 8073.0 sessWPM (5-4)

5 Reaction of soil water repellency on artificially induced changes in soil pH
71
in the range 0° < ΘWPM < 120°, whereas in the range 120° < ΘWPM < 130°, where
Θsess > 60° scatter is random about the horizontal. The regions of low sensitivity of the
WDPT method and Wilhelmy plate method, in relation to sessile drop method, are shown
shaded in Figure 5-5 A and C, respectively.
The WPM method did not resolve the differences between BW and BR detected in
the WDPT and Θsess data. There is little clustering of data in the vertical direction to
suggest regions where Θsess is insensitive to WDPT or ΘWPM. The boundary between
wettable and repellent samples defined as WDPT ~ 5 s (Dekker et al., 1998) correspond
with Θsess of ~ 26° and ΘWPM of ~ 100° using Equation (5-4) and (5-3), respectively.
0 20 40 60 80 100 120
0
20
40
60
80
100
120
140
10-1
100
101
102
103
104
105
106
ΘΘ ΘΘW
PM /
°
ΘWPM
ΘΘΘΘsess
/ °
D
WD
PT
/ s
WDPT
2 3 4 5 6 7 8 9
0
20
40
60
80
100
120
140
TW BW
TR BR
pH
C
ΘΘ ΘΘW
PM
2 3 4 5 6 7 8 9
0
20
40
60
80
100
120
pH
ΘΘ ΘΘs
es
s/
°
TW BW
TR BR
B
10-1
100
101
102
103
104
105
2 3 4 5 6 7 8 9pH
TW BW
TR BR
WD
PT
/ s
A
Figure 5-5: Wettability of the German Tiergarten (TW, TR) and Buch (BW, BR) samples as a function of artificial induced soil pH: A as contact angle measured by Wilhelmy Plate Method (ΘWPM), B as contact angle measured by sessile drop method (Θsess), and C measured as water drop penetration time (WDPT). D WDPT and ΘWPM as a function of the respective Θsess.
5.4.5 Surface charge changes of German samples
Negative surface charge (Q) strongly increased with increasing pH in all samples (Figure
5-6). and data from repellent and wettable samples from Buch (BW, BR) did not differ
significantly from each other in surface charge over the range of pH investigated. At the
lowest investigated pH (1.7 for BW and 2.3 for BR), both revealed minima in Q of
-0.9 (±0.9) cmolc kg-1 and -0.5 (±0.6) cmolc kg-1, respectively. Both samples had

5 Reaction of soil water repellency on artificially induced changes in soil pH
72
maximum Q of -20 cmolc kg-1 at the highest pH (9.3) (Figure 5-6). Both Tiergarten
samples had positive Q (1.1 (±0.2) cmolc kg-1 for TW and 3.5 (±0.4) cmolc kg-1 for TR) at
their lowest pH (1.7 and 1.8, respectively). At their highest pH of 9 and 8.8 (TW and TR,
respectively) both had more negative charge than the Buch samples at similar pH (TW:
-39 (±4) cmolc kg-1, TR: -30 (±3) cmolc kg-1, Figure 5-6). The slope of Q as a function of
pH showed a minimum between pH ~ 3 and pH ~ 6 for all samples (Figure 5-6),
suggesting the elements of a sigmoidal shaped curve, with at least one inflexion point,
whose detail is not made clear by the sparse data points. As Q data were available for
four only pH values, estimates of Q values at intermediate pH were made by linear
interpolation between these (Figure 5-6).
2 3 4 5 6 7 8 9
-40
-30
-20
-10
0
10
BW
BR
Q /
cm
ol c
kg
-1
pH
B
2 3 4 5 6 7 8 9
-40
-30
-20
-10
0
10 A
Q / c
mo
l c k
g-1
TW
TR
pH
Figure 5-6: Particle surface charge (Q) of soil fraction < 63 µm of selected pH-treated sub-samples with highest, lowest and medium artificially induced pH from the wettable and repellent Buch samples (BW, BR) and Tiergarten samples (TW, TR, respectively).
The pH of isoelectric point (pHiep), at which negative and positive surface charge are
equal, resulting in a net zero surface charge, was found to be higher for TW and TR
(~ 2 < pH < ~ 3) than for BW and BR (~ 1 < pH < ~ 2), respectively and below the pH
region of maximum repellency (pH(max. Repell)) for TW and TR (Table 5-3)
Table 5-3: Point of zero charge, pHpzc (PCD) suggested by PCD measurement, pH of maximum repellency (pH(max Repell) and particle charge of maximum repellency (Q(max Repell).
TW TR BW BR
pHpzc (PCD) 2.0 2.6 < 1.7 < 2.3
pH(max Repell) 3.5 … 5.5 3 …4.5 < 5 < 5
Q(max Repell) / cmolc kg-1 -3 … -7 -1 … -4 > -5 > -5
The relationships between Θsess (which was the measure of repellency that exhibited
the highest sensitivity to pH) and (measured and estimated values of) Q show maxima
(Q(max Repell)) (Figure 5-7) at ~ -2 and ~ -5 cmolc kg-1 for TR and TW, respectively (Table
5-3). Above Q(max Repell) Θsess decreases with increasing Q. Compared with TW, Q values
of TR were found to be shifted to higher Θsess and less negative Q values. Θsess of BW
and BR samples decreased with decreasing Q, but remained constant above
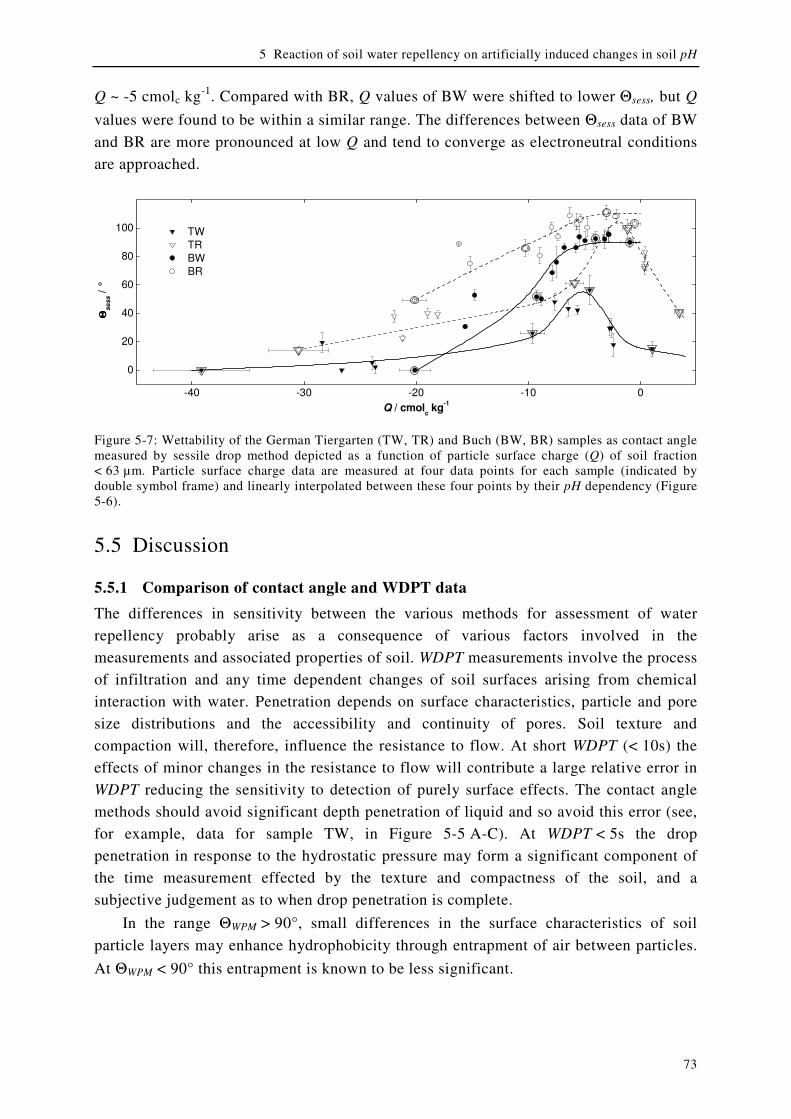
5 Reaction of soil water repellency on artificially induced changes in soil pH
73
Q ~ -5 cmolc kg-1. Compared with BR, Q values of BW were shifted to lower Θsess, but Q
values were found to be within a similar range. The differences between Θsess data of BW
and BR are more pronounced at low Q and tend to converge as electroneutral conditions
are approached.
-40 -30 -20 -10 0
0
20
40
60
80
100 TW
TR
BW
BR
ΘΘ ΘΘs
ess / °
Q / cmolc kg
-1
Figure 5-7: Wettability of the German Tiergarten (TW, TR) and Buch (BW, BR) samples as contact angle measured by sessile drop method depicted as a function of particle surface charge (Q) of soil fraction < 63 µm. Particle surface charge data are measured at four data points for each sample (indicated by double symbol frame) and linearly interpolated between these four points by their pH dependency (Figure 5-6).
5.5 Discussion
5.5.1 Comparison of contact angle and WDPT data
The differences in sensitivity between the various methods for assessment of water
repellency probably arise as a consequence of various factors involved in the
measurements and associated properties of soil. WDPT measurements involve the process
of infiltration and any time dependent changes of soil surfaces arising from chemical
interaction with water. Penetration depends on surface characteristics, particle and pore
size distributions and the accessibility and continuity of pores. Soil texture and
compaction will, therefore, influence the resistance to flow. At short WDPT (< 10s) the
effects of minor changes in the resistance to flow will contribute a large relative error in
WDPT reducing the sensitivity to detection of purely surface effects. The contact angle
methods should avoid significant depth penetration of liquid and so avoid this error (see,
for example, data for sample TW, in Figure 5-5 A-C). At WDPT < 5s the drop
penetration in response to the hydrostatic pressure may form a significant component of
the time measurement effected by the texture and compactness of the soil, and a
subjective judgement as to when drop penetration is complete.
In the range ΘWPM > 90°, small differences in the surface characteristics of soil
particle layers may enhance hydrophobicity through entrapment of air between particles.
At ΘWPM < 90° this entrapment is known to be less significant.
5 Reaction of soil water repellency on artificially induced changes in soil pH
74
However, measurements are influenced, for example, by surface roughness,
temperature and drop volume and useful comparisons arise when these are known and/or
controlled.
5.5.2 Conformational arrangement of SOM molecules
All samples exhibited maximum repellency at pH 3 - 5, in good agreement with the pKa
of carboxylic acids in HA from peat (Duval et al., 2005), at which a reduction in
repulsion forces between these moieties may cause micelle-like aggregation or a more
compact structure of HA with outward orientated hydrophobic moieties (Ohashi &
Nakazawa, 1996; Terashima et al., 2004; Duval et al., 2005). However, such
conformational changes may arise from changes in surface charge density likely to occur
as soil moisture is gained or lost from soil electrolyte solution. Direct evidence of
changes in conformational arrangement of SOM is not available from macroscopic
methods; molecular scale investigations are required.
5.5.3 pH dependent changes in surface charge
Buffer systems in the German samples
The similarity of titration curves for BR, BW and TW (all with similar TOC contents)
and the greater sensitivity of TR to HCl addition may reflect the significantly lower TOC
and an associated lower buffering capacity of this sample.
Increase in pH
The decrease of soil water repellency with increasing pH may arise from an increased
population of dissociated acidic functional groups associated with conjugate acid
(ammonium) ions. NH3 readily hydrolyses on contact with soil moisture, forming
hydroxyl and ammonia ions. The ionic strength will increase, favouring further
dissociation of carboxylic groups at 4 < pH < 7 (Terashima et al., 2004) and of phenolic
groups at 8 < pH < 11 (MacCarthy et al., 1979; Duval et al., 2005). Our results suggest
that sufficient deprotonated sites became available at the surface, to enhance its affinity
for water, as pH was increased.
Decrease in pH
The decrease in repellency observed with reduction of soil pH, for TW, TR, NLR, UKR2,
AUR1 and AUR2 samples, may arise from a surplus of a small quantity of acid, albeit in
a concentrated form, able to maintain local acidic organic functional groups in protonated
forms on contact with water. Basic functional groups such as amine groups, with pKa ~ 5
are protonated with decreasing pH and rendered positively charged. If C/N data (Figure
5-2 C) is used as a surrogate measure of the mass concentration of amine groups,
responsible for positive surface charge at low pH, then, the decrease in wettability with
decreasing pH observed for TR and TW but not with BR and BW suggest that amines
were of little influence.

5 Reaction of soil water repellency on artificially induced changes in soil pH
75
Amphoteric mineral sesqui(hydr)oxides, (like iron, aluminium, manganese or silicon
(hydr)oxides) may contribute to both positive and negative surface charge at high and
low pH respectively. Samples from Tiergarten generally have a higher concentration of
“Mehlich”-extractable iron than those from Buch (Figure 5-2 D). These iron species are
neutral at about pH 4 and become positively charged with decreasing pH. Only in
Tiergarten samples may the availability of surface active mineral proton acceptors (e.g.
sesqui(hydr)oxides) be sufficient to achieve a net positive surface charge density with
decreasing pH and, therefore, contribute to the increased wettability of Tiergarten
samples at low pH.
The development of net positive titratable surface charge in TR and TW (Figure 5-6)
at 2.5 < pH < 3, below the pH where measurements of water repellency reach maxima,
suggests that mineral oxides may be responsible. As samples from Buch, did not develop
net positive charge and exhibited no significant reductions in measurements of water
repellency at low pH, perhaps there was insufficient Fe-oxide available.
Net surface charge and wettability
The close proximity of the maximum WDPTs with the natural pH of the samples suggests
that this coincides with the lowest density of ionisable sites. The presence of pHiep
consistently below pH(max Repell) for all B and T samples suggests that both, negatively and
positively charged sites are present and some negative sites may be permanent. The net
surface charge is then determined by the sum of (i) permanent charge (Qperm.), (ii)
variable charge caused by protonation/deprotonation reactions of organic functional
groups (QSOM) and (iii) mineral compounds (Qmineral) and can be expressed in a simplified
form on the basis of averaged pKi as follows:
( )
110110110 )(
minmax,
)(
minmax,
)(
max,
.
min.
min,2min,1 ++
+−
++=
++=
−−−
∑
eraleralSOM pKpH
eral
pHpK
eral
pHpK
SOM
perm
eralSOMpermi
QQQQ
QQQpHQ
(5-5),
where Qmax,SOM is the maximum negative charge from deprotonation of the organic
functional groups, Qmax,mineral is the maximum negative or positive charge from
deprotonation or protonation of mineral compounds, pKSOM is the deprotonation constant
of SOM surfaces and pK1,mineral and pK2,mineral are the deprotonation and the protonation
constants of mineral surfaces, respectively. At pHiep, positive and negative charges have
the same value and the net surface charge becomes zero. However, maximum repellency
is probably not related to the zero net surface charge but rather with a minimum of the
absolute equivalent number of charged sites (Σ 2iQ ), which is expressed as follows:
( ) ( )[ ] ( )[ ]2
min
222 pHQpHQQpHQ eralSOMpermi ++=∑ (5-6)
Equations (5-5) and (5-6), and the measured ΣQi as a function of pH, allow a search
of pH dependent contributions of QSOM, Qmineral and Qperm to the net surface charge
fulfilling the condition that a minimum Σ 2iQ coincides with pH(max repell) (Figure 5-8,
Table 5-4).

5 Reaction of soil water repellency on artificially induced changes in soil pH
76
Figure 5-8 shows a combination of the measured net surface charge values (ΣQ) and
a suggestion, how QSOM and Qmineral may change with pH resulting in a sum of absolute
equivalent charge values (Σ 2iQ ) which could explain the measured pH dependent
wettability. At pH(max Repell) the lowest total number of charged sites is reached and at this
pH, negatively charged sites dominate in all samples. In Tiergarten samples, below
pH(max Repell), with the total number of charged sites, wettability increased with increasing
Q and decreasing pH (Figure 8 TW, TR). This led to the assumption that in these samples
mineral surfaces are probably available, where the positive surface charge increases with
decreasing pH, exceeding the negative permanent charge. In contrast, in Buch samples,
the lack of changes in wettability in the range of pH(max Repell) with < 5 indicates a nearly
constant total number of charged sites (Figure 8 BW, BR). The number of protonable
mineral surface sites is probably not high enough to increase wettability with decreasing
pH.
-30
-20
-10
0
10
20
30
1 2 3 4 5 6 7 8 9 10
Qmeasured
ΣQ
QSOM
Qmineral
∑ 2QTW pH(max.Repell)
pH
Q /
cm
ol c
kg
-1
pHpzc
Qperm.
1 2 3 4 5 6 7 8 9 10
-30
-20
-10
0
10
20
30
Qmeasured
Qperm.
Qmineral
QSOM
ΣQ
∑ 2Q
Q / c
mo
l c k
g-1
pH
BR
pHpzc
1 2 3 4 5 6 7 8 9 10
-30
-20
-10
0
10
20
30
Qmeasured
Qperm.
Qmineral
QSOM
ΣQ
∑ 2Q
BW
pHpzc
pH
Q /
cm
ol c
kg
-1
1 2 3 4 5 6 7 8 9 10
-30
-20
-10
0
10
20
30
Qperm.
ΣQ
QSOM
Qmineral
Qmeasured
∑ 2QTR
pH
Q / c
mo
l c k
g-1
pHpzc
pH(max.Repell)
Figure 5-8: Simplified schematic pH dependent interplay of negative and positive surface charge provided by SOM surfaces (QSOM), by mineral surfaces (Qmineral), and by permanent surface charge (Qperm.) using equation 4 and 5 with parameters (Table 5-4) chosen to create a scenario with minimum Σ
2iQ at
pH(max Repell) and a ΣQ-curve crossing the data points of measured net surface charge of the respective German samples.
The parameters of equation 4 and 5 were adapted to create a scenario with minimum
Σ 2iQ at pH(max Repell). A ΣQ-curve was laid through the data points of the measured net
surface charge of the respective German samples (Figure 5-8, Table 5-4).

5 Reaction of soil water repellency on artificially induced changes in soil pH
77
This offers the following hypotheses which are not adequately tested with present
data: (i) The wettable samples have higher Qperm than the repellent samples and (ii)
Tiergarten samples have higher Qmax, SOMl and higher Qmax, mineral than Buch samples
(Table 4). (iii) The values of pKSOM are with ~7 lower for Tiergarten samples than for
Buch samples with ~8. Compared to generally postulated pKa values of 3 – 4 for strong
acidic carboxylic surface groups, 5 – 6.5 for weak acidic groups and 7 – 8 for phenolic
groups (Scheffer and Schachtschabel, 2002), the pKSOM used in the scenario (Table 4) are
rather high, which imples high amounts of weaker acidic functional groups and
considerable amounts of phenolic groups. The chosen values for pKmineral and the
resulting pHiep of Qmineral-curves at pH 4.5 – 5 suggest a higher influence of manganese-
(hydr)oxide surface species which reveal a pHiep of 3 – 5, than of silicium-, aluminium-
or iron-(hydr)oxide surface species with pHiep of 2 – 3.5, 5 – 9 and 7 – 10, respectively
(Scheffer and Schachtschabel, 2002). However, it has to be kept in mind that the
parameters in Table 4 are based on only 4 data points of measured surface net charge.
Further investigations need to focus on distinguishing between different surface species,
e.g. weak and strong acidic carboxylic sites, phenolic sites and the different relevant
minerals compounds as clay minerals and sesqui(hydr)oxides and their contribution to
the surface charge.
Table 5-4: Parameters chosen in order to create a scenario with minimum Σ2iQ at pH(max Repell) and
a ΣQ-curve crossing the data points of measured net surface charge of the respective German samples (Figure 5-6) using equation 4 and 5: permanent charge (Qperm.), maximum negative surface charge obtainable by deprotonation of SOM (Qmax, SOM) and the respective deprotonation constant (pKSOM), maximum negative and positive surface charge obtainable by deprotonation / protonation of mineral surfaces (Qmax, mineral) and the respective deprotonation and protonation constants (pK1, mineral / pK2, mineral).
TW TR BW BR
Qperm. -4.6 -2.5 -3.5 -2.3
Qmax, SOM -27 -22 -14 -14
pKSOM 6.8 7.4 7.6 7.9
Qmax, mineral 7 7 3 4
pK1, mineral 7 7 7 7
pK2, mineral 2.5 2.5 2 2
More detailed information about the contributions of the various surface species (e.g.
weak and strong acidic carboxylic sites, phenolic sites and the fine mineral component
clay minerals and sesqui(hydr)oxides) is required.
The occurrence of the peak in the Θsess-Q curve of TR at higher (more positive) Q
than that of TW (Figure 5-7) may arise from the relatively low CECpot, of the former,
which indicates a generally low negative charge density and, therefore, a generally lower
wettability in TR than in TW. The occurrence of positive charge in the low pH range in T
samples coincides with a decrease in repellency with decreasing pH which indicates a
close relation between surface charge and repellency.
5 Reaction of soil water repellency on artificially induced changes in soil pH
78
5.5.4 Chemical reactions
An alternative explanation for pH dependent changes in repellency is a change of SOM
surface properties caused by chemical reactions. Acidic hydrolysis and condensation
reactions as suggested in earlier studies as mechanisms controlling SWR in Buch samples
(Diehl & Schaumann, 2007) are equilibrium reactions highly related to changes in water
content and their influence maybe therefore minimized in the dried samples of the
present study. Irreversible base catalyzed hydrolysis reactions, however, are less
influenced by water content and may therefore be an additional explanation for
decreasing repellency with increasing pH.
5.5.5 Comparison with former studies
In agreement with the results of Graber et al. (2009), the maximum of WDPT was found
in the range of the original pH of the soil samples.
Previous studies involving adjustment of soil pH by addition of aqueous reagents to
samples from the Buch site (Bayer & Schaumann, 2007) found that, following drying,
samples were completely wettable over the range 3 < pH < 11, whereas pronounced
repellency occurred in these soils when the pH was adjusted using gases, with minimal
effect on soil moisture content. The observed decrease in repellency with increasing pH
of soils from the Netherlands, UK and Australia indicate that it is a soil characteristic
spanning various locations. However, Tiergarten samples, exhibited a maximum
repellency irrespective of how the pH was adjusted, but the repellency of Buch samples
seem to be influenced by changes in water content resulting from the use of liquid
reagents. The maximum repellency of Tiergarten samples reported by Bayer &
Schaumann (2007) was at a higher pH than found in this study, despite a similar original
soil pH. The addition of liquid NaOH may lead to additional SOM alteration which
causes a shift in surface charge (Bayer & Schaumann, 2007) whereas the use of acidic
and basic gases as reagents to modify soil pH without significant impact on soil moisture
content appears to provide a useful route to examine the pH dependency of SWR.
Bayer & Schaumann (2007) observed that wettable and water repellent Tiergarten
samples exhibited similar wettability when brought to similar pH by addition of liquid
NaOH. In contrast, when pH was altered via the gas phase Tiergarten samples kept their
original repellency differences, even at the same pH. The addition of moisture to the soil
which accompanies the addition of liquid NaOH probably caused an equalisation of
repellency differences between wettable and repellent samples. This indicates that the pH
alteration via the gas phase applied in this study provide a new method with reduced side
effects and is, therefore, suitable for changes in soil pH and investigations of those
changes on SWR.
5.6 Conclusions
The comparison of 3 different methods for repellency determination showed the
advantages and disadvantages of each method: In the range below ~ 10 s, WDPT showed
a reduced sensitivity compared to the other two methods. In contrast to that, the
5 Reaction of soil water repellency on artificially induced changes in soil pH
79
Wilhelmy plate method seemed to be less sensitive in the range of very strong repellency
(ΘWPM > 120°) compared to WDPT and sessile drop method. The sessile drop method
seemed to have no repellency range with reduced sensitivity, but revealed higher
standard deviation between measurement repetitions compared to the two other methods.
By using a newly developed method to change the pH in soil samples via the gas
phase without changing the moisture status, the influence of changes in soil pH on
wettability was related to the number and type of protonable and de-protonable surface
sites of organic and mineral surfaces in soils. The highest level of repellency is reached
at the original pH when the number of charged sites is minimal. With increasing pH
repellency decreased and negative surface charge increased caused by de-protonation.
With respect to the repellency reaction on pH decrease, two types of soil can be
distinguished: i) soils, in which repellency decreased with decreasing pH because of a
sufficient number of protonable surface sites with a significant amount of positive
surface charge and ii) soils, with no or not sufficient protonable surface sites to exhibit
significant positive surface charge and, therefore, their repellency did not decrease with
decreasing pH. Evidences suggested, that the protonable sites in case of the two
Tiergarten samples, which are of the soil type I, were rather presented by mineral
surfaces, than by organic functional groups.
5.7 Acknowledgments
The study was financed by the German Research Association DFG (research group
Interurban, subproject HUMUS; SCHA 849/4-3). We thank Lydiya Shemotyuk for her
help with the laboratory work and all members of the research group “U-Chemie” for
lively discussions and constructive teamwork. We also want to thank Marta Casimiro for
the help with lab work on the NL, UK and AU samples. The data of the long-term study
of Buch and Tiergarten site are provided by the subproject SOIL from the Interurban
research group and published here by the courtesy of Prof. Dr. Gerd Wessolek. We
therefore want to thank him and the laboratory staff of Department of Soil Protection
(Technical University Berlin).
6 Synthesis and general conclusions
80
6 Synthesis and general conclusions
6.1 Summary of observations
In order to link the individual results and conclusions of the present studies with each
other and to find a more general explanation for the role of SOM for SWR, Table 6-1
gives an overview of the main observations made in this and in earlier investigations.
Although repellency generally increased with gentle drying, the specific effects of drying
on SWR vary between samples from different sites. In Buch samples, drying resulted in
an approach of SWR of initially wettable and repellent samples. In contrast, the
difference in SWR between initially wettable and repellent samples persists in
Tiergarten. In Buch samples, higher drying temperatures lead to an increased degree of
surface hydrophobicity. Since wetting, the reverse process, requires high activation
energy, the surface hydrophobization is probably controlled by chemical processes. In
Tiergarten samples, higher drying temperatures do not significantly increase surface
hydrophobicity and activation energy of the wetting process is low. In these samples,
water content dependent changes in SWR are thus likely controlled by physical processes
e.g., water evaporation and condensation, or by physicochemical processes, e.g., changes
in orientation of organic molecules without changes in chemical bonds.
Artificially induced pH changes in Buch and Tiergarten samples clearly show that
pH has an effect on SWR At the original pH, the samples reveal the lowest number of
charged surface sites and thus the highest SWR. The same pattern was observed in soil
samples from sites of various geographical origins and with various vegetations. This
indicates that under field conditions, the state with the lowest number of charged sites
and with the highest degree of repellency is an equilibrium state for both initially
wettable and repellent samples. A possible explanation is that at field pH a maximum of
charged sites are occupied by counter ions. With changes in pH, additional charged sites
develop which are not immediately occupied by the respective counter ions.
Only at the Tiergarten site do the aqueous extracts of repellent samples tend to have
lower pH values and higher EC than aqueous extracts of wettable samples. In contrast,
SWR in the Buch samples does not significantly decrease with decreasing pH below the
original pH. This indicates that there is a significantly lower number of protonable and
positively chargeable sites accessible for wetting in the Buch samples than in the
Tiergarten samples.
The pH alteration via the liquid phase and subsequent drying of samples from the
same sites (Bayer & Schaumann, 2007), however, results in complete wettability of both
originally wettable and repellent Buch samples throughout almost the entire pH range. In
contrast, Tiergarten samples show a maximum of SWR at pH 4.5-6.5, which are above
their original pH levels. Furthermore, differences between wettable and repellent samples
are completely compensated for after pH alteration in Tiergarten samples via the liquid
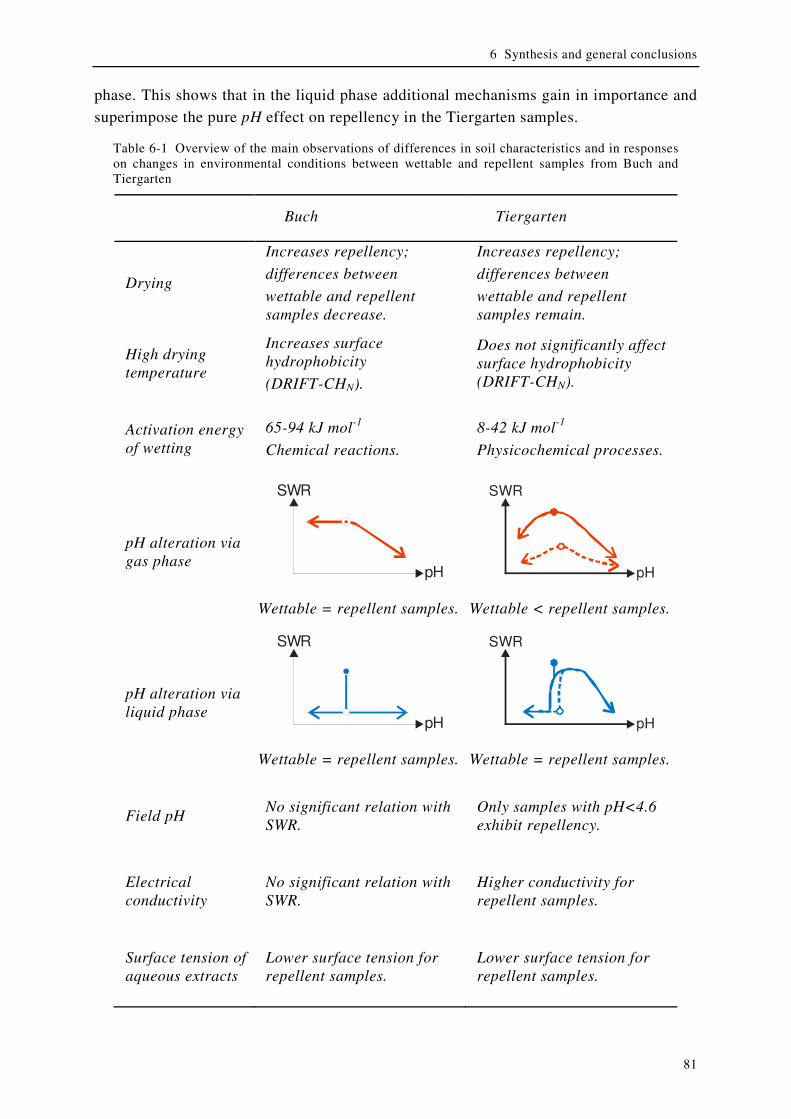
6 Synthesis and general conclusions
81
phase. This shows that in the liquid phase additional mechanisms gain in importance and
superimpose the pure pH effect on repellency in the Tiergarten samples.
Table 6-1 Overview of the main observations of differences in soil characteristics and in responses on changes in environmental conditions between wettable and repellent samples from Buch and Tiergarten
Buch Tiergarten
Drying
Increases repellency;
differences between
wettable and repellent samples decrease.
Increases repellency;
differences between
wettable and repellent samples remain.
High drying temperature
Increases surface hydrophobicity
(DRIFT-CHN).
Does not significantly affect surface hydrophobicity (DRIFT-CHN).
Activation energy of wetting
65-94 kJ mol-1
Chemical reactions.
8-42 kJ mol-1
Physicochemical processes.
pH alteration via gas phase
pH
SWR
pH
SWR
Wettable = repellent samples. Wettable < repellent samples.
pH alteration via liquid phase
pH
SWR
pH
SWR
Wettable = repellent samples. Wettable = repellent samples.
Field pH No significant relation with SWR.
Only samples with pH<4.6 exhibit repellency.
Electrical conductivity
No significant relation with SWR.
Higher conductivity for repellent samples.
Surface tension of aqueous extracts
Lower surface tension for repellent samples.
Lower surface tension for repellent samples.
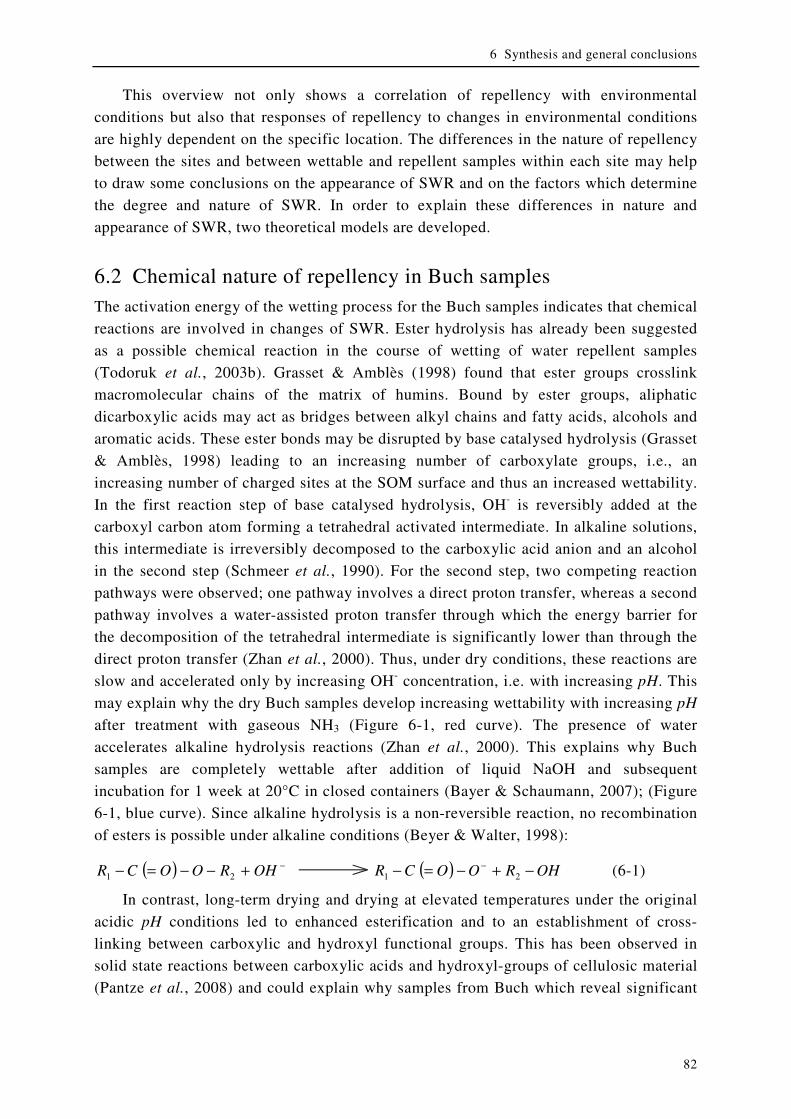
6 Synthesis and general conclusions
82
This overview not only shows a correlation of repellency with environmental
conditions but also that responses of repellency to changes in environmental conditions
are highly dependent on the specific location. The differences in the nature of repellency
between the sites and between wettable and repellent samples within each site may help
to draw some conclusions on the appearance of SWR and on the factors which determine
the degree and nature of SWR. In order to explain these differences in nature and
appearance of SWR, two theoretical models are developed.
6.2 Chemical nature of repellency in Buch samples
The activation energy of the wetting process for the Buch samples indicates that chemical
reactions are involved in changes of SWR. Ester hydrolysis has already been suggested
as a possible chemical reaction in the course of wetting of water repellent samples
(Todoruk et al., 2003b). Grasset & Amblès (1998) found that ester groups crosslink
macromolecular chains of the matrix of humins. Bound by ester groups, aliphatic
dicarboxylic acids may act as bridges between alkyl chains and fatty acids, alcohols and
aromatic acids. These ester bonds may be disrupted by base catalysed hydrolysis (Grasset
& Amblès, 1998) leading to an increasing number of carboxylate groups, i.e., an
increasing number of charged sites at the SOM surface and thus an increased wettability.
In the first reaction step of base catalysed hydrolysis, OH- is reversibly added at the
carboxyl carbon atom forming a tetrahedral activated intermediate. In alkaline solutions,
this intermediate is irreversibly decomposed to the carboxylic acid anion and an alcohol
in the second step (Schmeer et al., 1990). For the second step, two competing reaction
pathways were observed; one pathway involves a direct proton transfer, whereas a second
pathway involves a water-assisted proton transfer through which the energy barrier for
the decomposition of the tetrahedral intermediate is significantly lower than through the
direct proton transfer (Zhan et al., 2000). Thus, under dry conditions, these reactions are
slow and accelerated only by increasing OH- concentration, i.e. with increasing pH. This
may explain why the dry Buch samples develop increasing wettability with increasing pH
after treatment with gaseous NH3 (Figure 6-1, red curve). The presence of water
accelerates alkaline hydrolysis reactions (Zhan et al., 2000). This explains why Buch
samples are completely wettable after addition of liquid NaOH and subsequent
incubation for 1 week at 20°C in closed containers (Bayer & Schaumann, 2007); (Figure
6-1, blue curve). Since alkaline hydrolysis is a non-reversible reaction, no recombination
of esters is possible under alkaline conditions (Beyer & Walter, 1998):
( ) −+−−=− OHROOCR 21 ( ) OHROOCR −+−=− −21 (6-1)
In contrast, long-term drying and drying at elevated temperatures under the original
acidic pH conditions led to enhanced esterification and to an establishment of cross-
linking between carboxylic and hydroxyl functional groups. This has been observed in
solid state reactions between carboxylic acids and hydroxyl-groups of cellulosic material
(Pantze et al., 2008) and could explain why samples from Buch which reveal significant
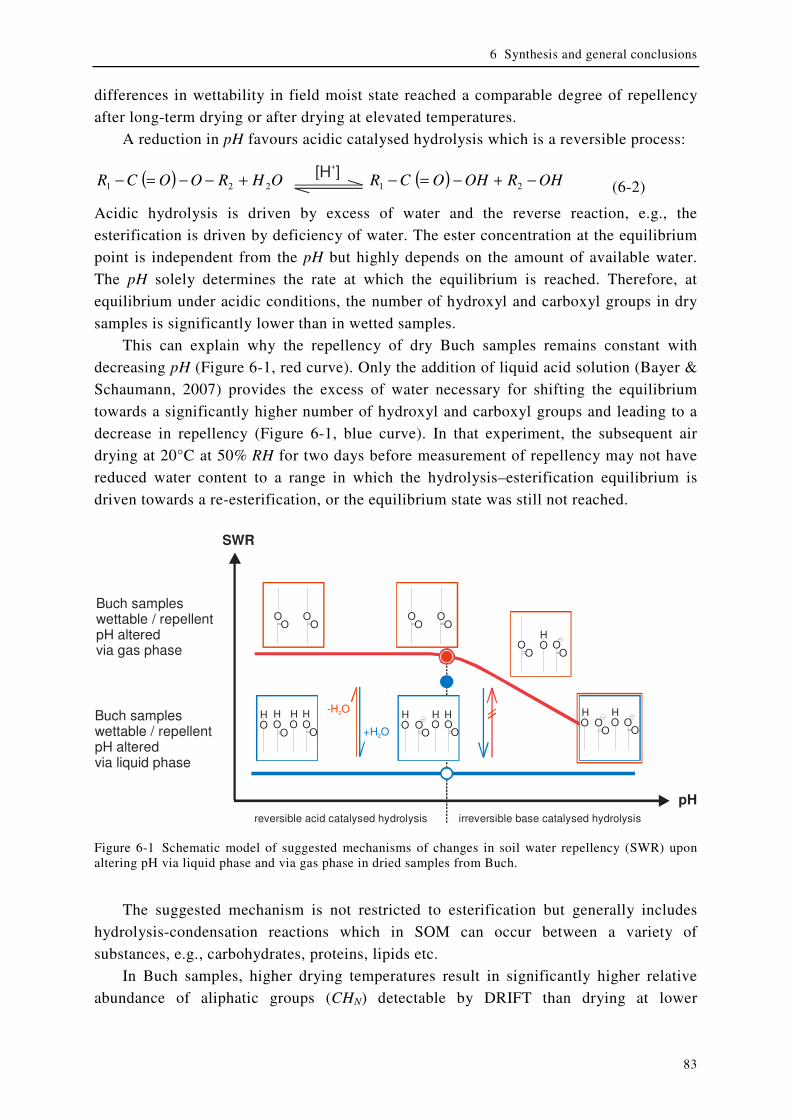
6 Synthesis and general conclusions
83
differences in wettability in field moist state reached a comparable degree of repellency
after long-term drying or after drying at elevated temperatures.
A reduction in pH favours acidic catalysed hydrolysis which is a reversible process:
( ) OHROOCR 221 +−−=− [H ]
+
( ) OHROHOCR −+−=− 21 (6-2)
Acidic hydrolysis is driven by excess of water and the reverse reaction, e.g., the
esterification is driven by deficiency of water. The ester concentration at the equilibrium
point is independent from the pH but highly depends on the amount of available water.
The pH solely determines the rate at which the equilibrium is reached. Therefore, at
equilibrium under acidic conditions, the number of hydroxyl and carboxyl groups in dry
samples is significantly lower than in wetted samples.
This can explain why the repellency of dry Buch samples remains constant with
decreasing pH (Figure 6-1, red curve). Only the addition of liquid acid solution (Bayer &
Schaumann, 2007) provides the excess of water necessary for shifting the equilibrium
towards a significantly higher number of hydroxyl and carboxyl groups and leading to a
decrease in repellency (Figure 6-1, blue curve). In that experiment, the subsequent air
drying at 20°C at 50% RH for two days before measurement of repellency may not have
reduced water content to a range in which the hydrolysis–esterification equilibrium is
driven towards a re-esterification, or the equilibrium state was still not reached.
pH
SWR
OO
OO
HOO
OO
O
HO O
OOH
OO
HHO O
OOH
OO
HH
OO
OO
+H O2
-H O2
reversible acid catalysed hydrolysis irreversible base catalysed hydrolysis
Buch samples wettable / repellent pH altered via gas phase
Buch samples wettable / repellent pH altered via liquid phase
HO O
OOH
OO
Figure 6-1 Schematic model of suggested mechanisms of changes in soil water repellency (SWR) upon altering pH via liquid phase and via gas phase in dried samples from Buch.
The suggested mechanism is not restricted to esterification but generally includes
hydrolysis-condensation reactions which in SOM can occur between a variety of
substances, e.g., carbohydrates, proteins, lipids etc.
In Buch samples, higher drying temperatures result in significantly higher relative
abundance of aliphatic groups (CHN) detectable by DRIFT than drying at lower

6 Synthesis and general conclusions
84
temperatures, and the correlation between WDPT and CHN is of higher significance for
Buch samples than for Tiergarten samples. Hydrolysis-esterification reactions are
expected to occur not only in the outermost layer but also in deeper layers of SOM bulk
phase, which are subjected to changes in water content. Since the penetration depth of IR
radiation of DRIFT measurement exceeds the surface-active molecular layer, potential
changes in the relative abundance of aliphatic groups caused by hydrolysis-condensation
reactions are better detectable by DRIFT than changes of molecule arrangements in the
very outermost layer as suggested for Tiergarten samples.
6.3 Physicochemical nature of repellency in Tiergarten
During gaseous pH alteration in dried Tiergarten samples, changes in wettability can be
attributed to pure pH dependent charge effects as discussed in Chapter 5. The decrease in
repellency with decreasing pH in Tiergarten but not in Buch samples coincides with the
development of positive surface charge. The positive charge could arise from protonation
of mineral surface sites e.g., Si-, Al-, Mn- or Fe-(hydr)-oxides. If this is the case, then
such sites are expected to be less abundant in Buch than in Tiergarten samples which
have a ~4% higher clay content than Buch samples (< 1 %).
The decrease in repellency with increasing pH can be explained by an increasing
deprotonation of carboxylic and phenolic functional groups of humic substances. Base
catalysed hydrolysis of ester bonds which requires activation energy, e.g., between 60
and 110 kJ mol-1 for sucrose laurates at pH 11 (Baker et al., 2000), is not rate limiting in
Tiergarten samples since the activation energy of the wetting process is below the range
of the chemical reactions. Furthermore, increases in pH via the addition of liquid NaOH
as investigated by Bayer & Schaumann (2007) resulted in a repellency-pH curve
completely different from that of Buch samples (compare blue curves in Figure 6-1 and
Figure 6-3, top). This leads to the conclusion that repellency in Tiergarten samples is
controlled by additional mechanisms.
In Tiergarten samples, repellency differences between initially wettable and repellent
samples remain following drying under various conditions as well as following
artificially induced pH changes via gas phase. These differences disappear only after
addition of liquid NaOH (Bayer & Schaumann, 2007). The addition of water and
subsequent incubation and air drying result in a slight decrease of repellency of the
repellent sample and an unchanged complete wettability of the wettable sample at their
original pH (Bayer & Schaumann, 2007). In contrast to this, the addition of 0.05 M
NaOH slightly increased the pH and resulted in a severe repellency for both the wettable
and the repellent sample. This repellency maximum extends over a pH range between 4.5
up to 6.5. At pH ~10, both samples become completely wettable (Bayer & Schaumann,
2007). The broadening of pH range with maximum repellency and the shift toward a
higher value compared to the pH alteration via the gas phase indicate that additional
processes which favour the appearance of repellency in Tiergarten samples are induced
by the addition of NaOH.
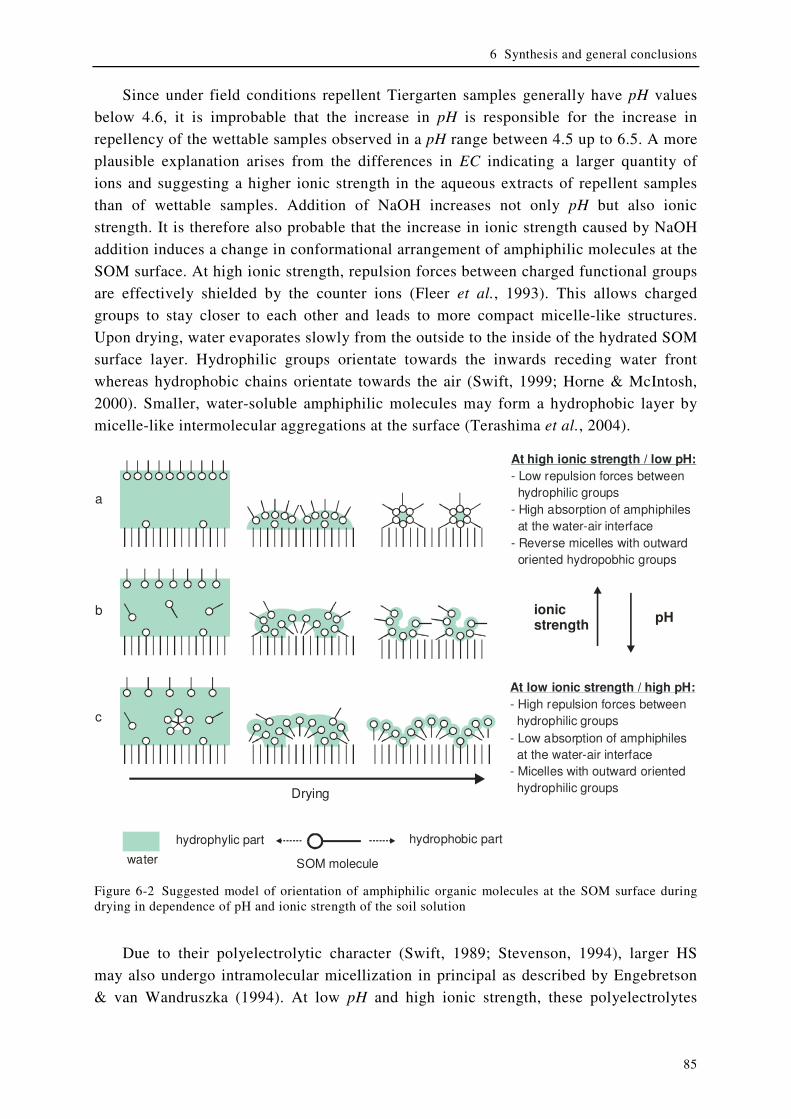
6 Synthesis and general conclusions
85
Since under field conditions repellent Tiergarten samples generally have pH values
below 4.6, it is improbable that the increase in pH is responsible for the increase in
repellency of the wettable samples observed in a pH range between 4.5 up to 6.5. A more
plausible explanation arises from the differences in EC indicating a larger quantity of
ions and suggesting a higher ionic strength in the aqueous extracts of repellent samples
than of wettable samples. Addition of NaOH increases not only pH but also ionic
strength. It is therefore also probable that the increase in ionic strength caused by NaOH
addition induces a change in conformational arrangement of amphiphilic molecules at the
SOM surface. At high ionic strength, repulsion forces between charged functional groups
are effectively shielded by the counter ions (Fleer et al., 1993). This allows charged
groups to stay closer to each other and leads to more compact micelle-like structures.
Upon drying, water evaporates slowly from the outside to the inside of the hydrated SOM
surface layer. Hydrophilic groups orientate towards the inwards receding water front
whereas hydrophobic chains orientate towards the air (Swift, 1999; Horne & McIntosh,
2000). Smaller, water-soluble amphiphilic molecules may form a hydrophobic layer by
micelle-like intermolecular aggregations at the surface (Terashima et al., 2004).
Drying
b
c
a
At low ionic strength / high pH:
- High repulsion forces between
hydrophilic groups
- Low absorption of amphiphiles
at the water-air interface
- Micelles with outward oriented
hydrophilic groups
At high ionic strength / low pH:
- Low repulsion forces between
hydrophilic groups
- H absorption of amphiphiles
at the water-air interface
- Reverse micelles with outward
oriented hydropobhic groups
igh
pH
hydrophobic parthydrophylic part
SOM moleculewater
ionic strength
Figure 6-2 Suggested model of orientation of amphiphilic organic molecules at the SOM surface during drying in dependence of pH and ionic strength of the soil solution
Due to their polyelectrolytic character (Swift, 1989; Stevenson, 1994), larger HS
may also undergo intramolecular micellization in principal as described by Engebretson
& van Wandruszka (1994). At low pH and high ionic strength, these polyelectrolytes

6 Synthesis and general conclusions
86
preferentially form aliphatic loops and tails (Baßmann, 2001), which, together with
aliphatic side chains, are directed outward and mask the inward-directed hydrophilic
groups. SWR
pH
HNO addition3 NaOH addition, increasing EC
HO
HO
HO
HO
OO
OHO
MeMe
++++
MeMe
HO
HO
MeMe MeMe
MeMe
MeMe
altered via liquid phase
repellent samples lower pH,higher EC,more amphiphiles
wettable samples higher pH,lower EC,less amphiphilles
pH
SWR
repellent samples lower pH,higher EC,more amphiphiles
MeMe
HO
HO
OHO
HO
HO
OHO++++
OO
++++
MeMe
MeMe
MeMe
MeMe
MeMe
MeMe
wettable samples higher pH,lower EC,less amphiphilles
increasing positive surface charge increasing negative surface charge altered via gas phase
Figure 6-3 Schematic model of suggested mechanisms of changes in soil water repellency (SWR) in Tiergarten samples upon pH altering via liquid phase (top) and via gas phase in dried samples (bottom)
These spatial re-arrangements of amphiphilic molecules, which may transform
wettable into repellent samples, probably require both a liquid environment and a high
ionic strength as given by the addition of the liquid NaOH solutions. The liquid
environment allows an effective re-arrangement and a water content driven orientation of

6 Synthesis and general conclusions
87
the amphiphilic molecules. High ionic strength weakens the repulsion forces between
negatively charged functional groups and enables an aggregation of hydrophilic groups
(Figure 6-2 c). Despite increasing pH and an increasing number of negatively charged
groups, repellency persists within a certain pH range because the ionic strength also
increases. At a higher pH, deprotonation overbalances the effects of ionic strength. Thus,
in a pH range above 7, repulsion forces cannot be effectively weakened to lead to an
aggregation of hydrophobic groups and surface exposition of hydrophilic groups (Figure
6-2 a).
Repellent Tiergarten samples tend to have a higher concentration or a higher
efficiency of water soluble amphiphilic substances and a higher content of smaller-sized
water soluble molecules than the respective wettable samples (Hurraß, 2006). This may
favour the process of changes in spatial re-arrangements of amphiphilic molecules and
the establishment of repellency. In contrast to this, lower concentration and larger
molecule size of soluble amphiphiles and lower ionic strength in wettable samples inhibit
the establishment of a stable repellent layer (compare curves and respective cartoons of
molecular arrangements Figure 6-3, bottom). However, the addition of liquid NaOH
solution increases ionic strength and thus enables a micelle-like aggregation of
hydrophobic groups even in the originally wettable samples (compare curves and
respective sketches of molecular arrangements in Figure 6-3, top).
The micelle-like aggregation and orientation of hydrophobic or hydrophilic molecule
moieties toward the outside probably occurs only in the very outermost molecule layers
of SOM and, most likely, mainly smaller water soluble molecules (Hurraß, 2006) are
involved in this process. Deeper layers in SOM bulk phase are probably not affected by
these mechanisms. This can explain why the correlation between WDPT and relative
abundance of aliphatic groups (CHN) detectable by DRIFT is significantly weaker in
Tiergarten samples than in Buch samples since the penetration depth of radiation of
DRIFT exceeds the surface-active molecular layer, and the signal from the surface is
diluted by the contribution from deeper layers.
6.4 Site dependent causes for the nature of SWR
The nature of SWR in Buch and Tiergarten strongly differs between the sites. Although
protonation, deprotonation and hydrolysis-condensation reactions as well as the
arrangement of amphiphiles play a role for the appearance of SWR at both sites, different
site-dependent conditions determine which process dominates the nature of SWR. The
abovementioned conceptual models suggest water content and temperature dependent
hydrolysis and condensation reactions in Buch and pH and ionic strength dependent
changes in the arrangement of amphiphiles in Tiergarten as the dominant processes
controlling SWR.
A cause for SWR in the former sewage disposal field at Buch is probably the high
accumulation of organic matter derived from application of untreated mainly municipal
waste water (including ~10 % industrial waste water) between 1905 and 1985. Under
flooded conditions, organic matter could not be decomposed due to oxygen deficiency.
6 Synthesis and general conclusions
88
Once the site was no longer used as a sewage disposal field, the groundwater level sank
and the initiated decomposition of organic matter resulted in acidification of the soil. The
high input of organic matter from the municipal waste water most likely contained,
among others, household chemicals and detergents as well as high loads of nitrogen- and
phosphate-containing organic compounds which are highly reactive and therefore
possible reactants for hydrolysis-condensation reactions. Since the sandy mineral soil
part of the topsoil is likely completely coated by organic material, no free mineral
surfaces are available to provide positive surface charges which would enhance
wettability at this low pH. A high quantity of large pores and a low quantity of medium
and fine pores in the sandy subsoil cause a very limited soil water storage capacity and
fast drainage. The hydraulic conductivity of the sandy soil is extremely high under
saturated conditions but reduced by three orders of magnitude under unsaturated
conditions at pF 1.8 (Täumer, 2007). The physical properties of mineral soil (texture) and
chemical properties of SOM together render this soil especially prone to preferential flow
(Taumer et al., 2006). Once dried, the repellent soil prevents an even infiltration of the
precipitation, but the water collects in depressions, and infiltrates only at several points
where hydraulic pressure sufficiently increased, root or animal channels facilitate
penetration, or chemical reactions increase wettability of SOM. Short-term water
saturated, the so-formed preferential flow paths drain the water very fast, whereas the
adjacent soil zones remain dry, and a vicious cycle ensues.
In contrast to that, there is likely a higher salt content and a lower pH in repellent
samples than in wettable samples at the Tiergarten site, which leads to the development
of a stable amphiphilic layer with outward directed hydrophobic molecule moieties after
drying. Remoistening of a repellent soil may slightly reduce repellency but does not
change it into a wettable one. The Tiergarten soil is not grown naturally but rather an
artificially backfilled topsoil with a clay content of ~5%. Therefore it has a higher water
storage capacity than the Buch soil and not all mineral surfaces are covered with SOM,
and thus free mineral surfaces are available to provide positive surface charge at low pH.
A possible cause for SWR at this site is a mineral fertiliser for the lawn which is
irregularly applied in form of salt grains. This leads to spots with higher salt
concentrations. A low pH in these spots provide favourable conditions to SWR. A lower
wettability in these spots consequently would lead to a reduced leaching of fertiliser and
thus to an accumulation of salt that enhances the repellency effect.
Using the example of the two investigated sites, it can be shown that the nature of
SWR and dominant processes which cause its appearance and dynamics are determined
by the history of the respective site.
6.5 Final conclusion
The main conclusion of the present thesis is that SWR is subject to numerous
antagonistically and synergistically interacting environmental factors. The degree of
influence that a single factor exerts on SWR is site-specific, e.g., it depends on special
characteristics of mineral constituents and SOM which underlies the influence of climate,

6 Synthesis and general conclusions
89
soil texture, topography, vegetation and the former and current use of the respective site.
The investigation of two sites with exceptionally different natures of repellency leads to
new insights in the variety of appearance of SWR since all investigations were carried
out in parallel for both sites and are therefore directly comparable.
The previously debated assumption that changes in the arrangement of molecules and
functional groups in the outer layer of SOM determine the degree of SWR (e.g.,
Tschapek, 1984; Horne & McIntosh, 2000; Doerr et al., 2005b) can only explain the
nature of repellency at the Tiergarten site. The spatial arrangement of these molecules
upon drying is strongly influenced by properties of the soil solution, i.e., pH, EC, and
quality and amount of dissolved organic matter (DOM). Both the macromolecular (e.g.,
Pignatello, 2003) and the supramolecular view of SOM (e.g., Schulten & Schnitzer,
1997) can explain changes in molecular arrangement. However, several observations
suggest smaller water soluble substances are responsible for SWR. E.g., Arye et al. (Arye
et al., 2007) reported a decrease in soil hydrophobicity with increasing amount of DOM
leached out by water. Hurraß & Schaumann (2006) found a higher quantity and a smaller
size of amphiphiles in soil solutions of repellent samples than of wettable samples. Other
authors made the observation that components accumulated in the soil solution serve to
retard the wetting process (Krispil et al., 2006; Graber et al., 2007). These observations
emphasize the role of smaller molecules for SWR and can thus be better explained by a
more flexible supramolecular association of relatively small molecules at the SOM
surface. The influence of ionic strength of soil solution on SWR has barely been
investigated. Graber et al. (2009) varied salt concentration and pH in drop solution for
penetration tests and found a higher influence of CaCl2 than of NaCl concentration on
drop penetration time and thus on repellency. They explained this influence with the
complexation of fatty acid headgroups at positively charged surfaces or via divalent
cation bridges at negatively charged surfaces. Since ionic strength of CaCl2 is three times
higher than that of NaCl at the same concentration, it cannot be excluded from their
experiments that ionic strength may have a relevant influence on spatial arrangement of
amphiphilic molecules at the SOM surface and thus on the penetration time.
Unfortunately, drop penetration times were indicated as ratio of (salt solution) drop
penetration time (DPT) to water drop penetration time (WDPT) and therefore does not
allow for direct comparison with the results from the present investigations.
For the other site investigated in this study (Buch site), the results indicate that SOM
can chemically bind water by hydrolysis reactions as suggested by Todoruk et al.
(2003b). This mechanism is, however, dominant only in one of the two investigated sites.
SOM, which was accumulated during the time when the site was used as a sewage
disposal field, likely contains a high number of reactive functional groups and thus
promotes WC-driven hydrolysis-condensation reactions as the mechanism controlling
SWR. The high WC dependency of acidic hydrolysis-condensation equilibrium can also
serve as an explanation for the concept of critical water content (WCcrit) for SWR
(Dekker & Ritsema, 1994). Depending on SOM properties a WC is required that can
provide an excess of water in the hydrolysis-condensation equilibrium and minimise
6 Synthesis and general conclusions
90
condensation. Below this WC, condensation increases with decreasing WC, and an
increasing number of hydrophilic functional groups are bonded leading to reduced
wettability. Hurraß (2006) reported no significant differences of the intrinsic SOM
quality between wettable and repellent samples for the site with chemical nature of
repellency. Together with the concept of WC-driven hydrolysis-condensation
equilibrium, this can explain why Täumer et al. (2005) found a good correlation between
SOM content and WCcrit for this site. Furthermore, according to this concept, increasing
SWR with increasing drying temperature (Dekker et al., 2001) can be explained by an
increased reaction rate of condensation at an elevated temperature.
The two suggested mechanisms of chemical and physicochemical control of
repellency are probably not restricted to one of the two sites but occur in some degree on
both sites. Specific local soil characteristics determine which mechanism dominates and
controls the nature of repellency. Furthermore, it cannot be excluded that additional
mechanisms play an important role for repellency at other sites. However, the two
suggested mechanisms together with the previous history of the sites allow identifying
critical conditions which may favour SWR. Long hot and dry periods may enhance soil
water repellency especially in soils with high organic accumulation. In these soils
chemically bonded water can be released from organic matter by condensation reactions.
Rewetting requires high activation energy, i.e. it is slow at ambient temperatures but can
be accelerated by elevated temperature as long as the water does not evaporate. Special
care is also needed in soils with a relatively high salt concentration, a low pH, and a
SOM containing a relatively high amount of water soluble low molecular amphiphilic
molecules. The combination of high ionic strength and low pH in the soil solution can
favour the appearance of SWR after drying.
6.6 Outlook
Although the suggested conceptual models can explain most observations made in this
study and many observations of other studies, they need to be verified further. New
measurement techniques are required that enable the investigation of small scale
variations in SOM or mineral surfaces.
IR radiation penetration depth of DRIFT spectroscopy exceeds the molecule layer
relevant for surface characteristics and is disturbed by the high absorbance of water.
Attenuated total reflectance (ATR) FTIR is a more promising method to identify
functional groups in a surface layer of organic or mineral samples under natural
conditions, i.e, with varying water content. Due to the small light penetration depth, the
ATR technique is promising for highly absorbing samples and for surfaces and thin film
measurements (Grdadolnik, 2002) and allows for measurements under various conditions,
e.g., in solid or liquid state, at various WCs, pHs, salt and DOM concentrations, etc. In
combination with the new methods developed in this study, ATR FTIR can help to test
the hypothesis that water content driven SWR changes in the Buch samples are related to
hydrolysis–condensation reactions. The time dependent sessile drop measurement
(TISED) can be improved by the use of a video-based optical contact angle meter instead

6 Synthesis and general conclusions
91
of manual evaluation. Together with the artificial pH alteration via gas or liquid phase,
wetting kinetics obtained by TISED dependent on pH will give further information about
the nature of chemical reactions during the wetting process. ATR-FTIR measurements
are expected to detect changes in the amount of functional groups upon drying and upon
pH changes in the outer surface layer.
Another promising technology is atomic force microscopy (AFM) which can
measure and image forces at surfaces at the nanometer level. Well established in material
sciences, AFM has been used successfully in life sciences for characterisation of
biochemical surfaces, e.g., proteins (Schuck, 2007), cell surfaces (Ahimou et al., 2003),
and organic self-assembled monolayers (SAM) on biological surfaces (Koch et al.,
2004). Its application in soil science has only just started (Ulery & Drees, 2008). A study
of conformations and aggregate structures of sorbed natural organic on mineral surfaces
(Namjesnik-Dejanovic & Maurice, 1997; Namjesnik-Dejanovic & Maurice, 2001)
indicates a possible implication for investigations with respect to SWR. Currently, the
first comprehensive AFM analysis of a natural soil system correlates to nano-scale
observations with established soil science measurements regarding SWR (Cheng et al.,
2008). Thus, AFM measurements can help to verify the hypothesis that surface micelle
formation induces repellency and investigate the relevance of this mechanism in
dependence of pH, ionic strength and DOM content. Attractive or repulsive forces
between chemically functionalized AFM tips and samples can give detailed information
about surface-properties, e.g., hydrophobic or hydrophilic interactions, charge effects etc.
Furthermore, by using AFM, the degree of mineral surfaces covered with organic
coatings (Cheng et al., 2008) can be compared between Buch and Tiergarten samples. To
test the hypothesis that positive charge of mineral surfaces enhances wettability with
decreasing pH in Tiergarten samples, the influence of artificially lowered pH on surface
forces measured by AFM has to be investigated. Therefore, an important future challenge
is the evaluation of specific nano-scale measures and respective methods which can be
directly correlated with the degree of repellency.
Approaches in the described techniques will give new insights in the nature of SWR
and can help in the better understanding of mechanisms leading to changes of SOM
surface on a molecular scale. The knowledge about these mechanisms is closely
connected to a general understanding of structure and behaviour of SOM which becomes
increasingly important in the course of global climate change.
8 Annex
92
7 References
AG Boden, 2005. Bodenkundliche Kartieranleitung. Hannover. 5. Aufl. 438 pp. Abadi Ghadim, A.K. 2000. Water repellency: a whole-farm bio-economic perspective.
Journal of Hydrology, 231-232, 396-405. Adamson, A.W. & A. Petry. 1997. Physical chemistry of surfaces. John Wiley and Sons,
New York. Ahimou, F., A. Touhami & Y.F. Dufrêne. 2003. Real-time imaging of the surface
topography of living yeast cells by atomic force microscopy. Yeast, 20, 25-30. Akim, L.G., G.W. Bailey & S.M. Shevchenko. 1998. A computational chemistry
approach to study the interactions of humic substances with mineral surfaces. Special Publication - Royal Society of Chemistry, 228, 133-145.
Arye, G., I. Nadav & Y. Chen. 2007. Short-term Reestablishment of Soil Water Repellency after Wetting: Effect on Capillary Pressure-Saturation Relationship. Soil Science Society of America Journal, 71, 692-702.
Babejova, N. 2001. An influence of changing the humic acids content on soil water repellency and saturated hydraulic conductivity. Journal of Hydrology and Hydromechanics, 49, 291-300.
Bachmann, J., G. Arye, M. Deurer, Susanne k. Woche, R. Horton, K.-H. Hartge & Y. Chen. 2006. Universality of a surface tension - contact-angle relation for hydrophobic soils of different texture. Journal of Plant Nutrition and Soil Science, 169, 745-753.
Bachmann, J., A. Ellies & K.H. Hartge. 2000a. Development and application of a new sessile drop contact angle method to assess soil water repellency. Journal of Hydrology, 231-232, 66-75.
Bachmann, J., R. Horton, S.A. Grant & R.R. Van Der Ploeg. 2002. Temperature Dependence of Water Retention Curves for Wettable and Water-Repellent Soils. Soil Science Society of America Journal, 66, 44-52.
Bachmann, J., R. Horton, R.R. Van Der Ploeg & S. Woche. 2000b. Modified sessile drop method for assessing initial soil-water contact angle of sandy soil. Soil Science Society of America Journal, 64, 564-567.
Bachmann, J. & G. Mchale. in press. Superhydrophobic surfaces: a model approach to predict contact angle and surface energy of soil particles. European Journal of Soil Science.
Baker, I., D. Furlong, F. Grieser & C. Drummond. 2000. Sugar fatty acid ester surfactants: Base-catalyzed hydrolysis. Journal of Surfactants and Detergents, 3, 29-32.
Barrett, G. & O. Slaymaker. 1989. Identification, characterization, and hydrological implications of water repellency in mountain soils. Catena, 16, 477-489.
Bashforth, S. & J.C. Adams. 1882. An Attempt to Test the Theory of Capillary Action by Comparing the Theoretical and Measured Forms of Drops of Fluid Bell and Co., London.
Bashforth, S. & J.C. Adams. 1883. An Attempt to Test the Theory of Capillary Action by Comparing the Theoretical and Measured Forms of Drops of Fluid. University Press Cambridge.
Baßmann, F. 2001. Hydrophob modifizierte Polyacrylsäuren: Wechselwirkungen mit Bodenmineralen und organischen Schadstoffen. PhD, Heinrich-Heine-Universität Düsseldorf.
Bayer, J.V. 2004. Physikalische, chemische und biologische Einflussfaktoren für die Hydrophobizität auf urbanen Standorten (Physical, chemical and biological
8 Annex
93
factors of influence for water repellency on urban sites). Diploma, TU Berlin, Berlin.
Bayer, J.V. & G.E. Schaumann. 2007. Development of soil water repellency in the course of isothermal drying and upon pH changes in two urban soils. Hydrological Processes, 21, 2266 - 2275.
Berglund, K. & L. Persson. 1996. Water repellence of cultivated organic soils. Acta agriculturae Scandinavica, Section B, Soil and plant science, 46, 145-152.
Beyer, H. & W. Walter. 1998. Lehrbuch der Organischen Chemie. S. Hirzel Verlag, Stuttgart; Leipzig.
Bisdom, E.B.A., L.W. Dekker & J.F.T. Schoute. 1993. Water repellency of sieve fractions from sandy soils and relationships with organic material on soil structure. Geoderma, 56, 105-118.
Blackwell, P.S. 2000. Management of water repellency in Australia, and risks associated with preferential flow, pesticide concentration and leaching. Journal of Hydrology, 231-232, 384-395.
Böckenhoff, K. & W.R. Fischer. 2001. Determination of electrokinetic charge with a particle-charge detector, and its relationship to the total charge. Fresenius' Journal of Analytical Chemistry, 371, 670-674.
Buczko, U. & O. Bens. 2006. Assessing Soil Hydrophobicity and Its Variability through the Soil Profile Using Two Different Methods. Soil Science Society of America Journal, 70, 718-727.
Buczko, U., O. Bens & W. Durner. 2006. Spatial and temporal variability of water repellency in a sandy soil contaminated with tar oil and heavy metals. Journal of Contaminant Hydrology, 88, 249-268.
Cammeraat, L.H., S.J. Willott, S.G. Compton & L.D. Incoll. 2002. The effects of ants' nests on the physical, chemical and hydrological properties of a rangeland soil in semi-arid Spain. Geoderma, 105, 1-20.
Capriel, P. 1997. Hydrophobicity of organic matter in arable soils: influence of management. European Journal of Soil Science, 48, 457-462.
Capriel, P., T. Beck, H. Borchert, J. Gronholz & G. Zachmann. 1995. Hydrophobicity of the organic matter in arable soils. Soil Biology and Biochemistry, 27, 1453-1458.
Celi, L., M. Schnitzer & M. Negre. 1997. Analysis of carboxyl groups in soil humic acids by a wet chemical method, Fourier-transform infrared spectroscopy, and solution-state carbon-13 nuclear magnetic resonance. A comparative study. Soil Science, 162, 189-197.
Cerdà, A. & S.H. Doerr. 2007. Soil wettability, runoff and erodibility of major dry-Mediterranean land use types on calcareous soils. Hydrological Processes, 21, 2325-2336.
Chatelier, R.C., A.M. Hodges, C.J. Drummond, D.Y.C. Chan & H.J. Griesser. 1997. Determination of the Intrinsic Acid-Base Dissociation Constant and Site Density of Ionizable Surface Groups by Capillary Rise Measurements. Langmuir, 13, 3043-3046.
Chen, L.X.L. & J. Yu. 2005. Abiotic hydrolysis of poly[(R)-3-hydroxybutyrate] in acidic and alkaline media. Macromolecular Symposia, 224, 35-46.
Chen, Y. & M. Schnitzer. 1978. The surface tension of aqueous solutions of soil humic substances. Soil Science, 125, 7-15.
Cheng, S., R. Bryant, S.H. Doerr, P.R. Williams & C.J. Wright. 2008. Application of atomic force microscopy to the study of natural and model soil particles. Journal of Microscopy, 231, 384-394.
8 Annex
94
Conte, P. & A. Piccolo. 1999. Conformational Arrangement of Dissolved Humic Substances. Influence of Solution Composition on Association of Humic Molecules. Environmental Science and Technology, 33, 1682-1690.
De Jonge, L.W., O.H. Jacobsen & P. Moldrup. 1999. Soil Water Repellency: Effects of Water Content, Temperature, and Particle Size. Soil Science Society of America Journal, 63, 437-442.
De Ruijter, M., P. Kolsch, M. Voue, J. De Coninck & J.P. Rabe. 1998. Effect of temperature on the dynamic contact angle. Colloids and Surfaces, A: Physicochemical and Engineering Aspects, 144, 235-243.
Debano, L.F. 1969. Water repellent soils: A worldwide concern in management of soil and vegetation. Agricultural Science Review, 7, 11-18.
Debano, L.F. 1981. Water repellent soils: a state-of-the-art. p. 20pp. Pacific Southwest Forest and Range Experiment Station, Berkeley, California.
Debano, L.F. 1992. The effect of fire to soil properties. pp. 151-156. USDA Forest Service General Technical Report, Portland.
Debano, L.F. 2000. Water repellency in soils: a historical overview. Journal of Hydrology, 231-232, 4-32.
Dekker, L.W., S.H. Doerr, K. Oostindie, A.K. Ziogas & C.J. Ritsema. 2001. Water repellency and critical soil water content in a dune sand. Soil Science Society of America Journal, 65, 1667-1674.
Dekker, L.W. & P.D. Jungerius. 1990. Water repellency in the dunes with special reference to the Netherlands. In: Dunes of the European coasts (ed. Bakker, T.W.), pp. 173-183. Catena-Verlag, Cremlingen-Destedt.
Dekker, L.W. & C.J. Ritsema. 1994. How water moves in a water repellent sandy soil: 1. Potential and actual water repellency. Water Resources Research, 30, 2507-2517.
Deo, P., N. Deo, P. Somasundaran, S. Jockusch & N.J. Turro. 2005. Conformational Changes of Pyrene-Labeled Polyelectrolytes with pH: Effect of Hydrophobic Modifications. Journal of Physical Chemistry B, 109, 20714-20718.
Derjaguin, B.V. & N.V. Churaev. 1986. Properties of Water Layers Adjacent to Interfaces. In: Fluid Interfacial Phenomena (ed. Croxton, C.A.), pp. 663-738. Wiley.
Diehl, D., R.H. Ellerbrock & G.E. Schaumann. 2009. DRIFT-Spectroscopy of untreated and dried soil samples of different wettability. European Journal of Soil Science, 60, 557-566.
Diehl, D. & G.E. Schaumann. 2007. Wetting mechanism assessed from time dependent sessile drop shape. Hydrological Processes, 21, 2255 - 2265.
Doerr, S.H. 1997. Soil Hydrophobicity in Wet Mediterranean Pine and Eucalyptus Forests, Águeda Basin, North-Central Portugal. Doctoral, University of Wales Swansea.
Doerr, S.H., L.W. Dekker, C.J. Ritsema, R.A. Shakesby & R. Bryant. 2002. Water repellency of soils: The influence of ambient relative humidity. Soil Science Society of America Journal, 66, 401-405.
Doerr, S.H., P. Douglas, R.C. Evans, C.P. Morley, N.J. Mullinger, R. Bryant & R.A. Shakesby. 2005a. Effects of heating and post-heating equilibration times on soil water repellency. Australian Journal of Soil Research, 43, 261–267.
Doerr, S.H., C.T. Llewellyn, P. Douglas, C.P. Morley, K.A. Mainwaring, C. Haskins, L. Johnsey, C.J. Ritsema, F. Stagnitti, G. Allison, A.J.D. Ferreira, J.J. Keizer, A.K. Ziogas & J. Diamantis. 2005b. Extraction of compounds associated with water repellency in sandy soils of different origin. Australian Journal of Soil Research, 43, 225–237.
8 Annex
95
Doerr, S.H. & C.J. Ritsema. 2005. Water movement in hydrophobic soils. In: Encyclopedia of Hydrological Sciences (eds. Anderson, M.G. & McDonnell, J.). John Wiley & Sons.
Doerr, S.H., C.J. Ritsema, L.W. Dekker, D.F. Scott & D. Carter. 2007. Water repellence of soils: new insights and emerging research needs. Hydrological Processes, 21, 2223-2228.
Doerr, S.H., R.A. Shakesby, L.W. Dekker & C.J. Ritsema. 2006. Occurrence, prediction and hydrological effects of water repellency amongst major soil and land-use types in a humid temperate climate. European Journal of Soil Science, 57, 741-754.
Doerr, S.H., S.H. Shakesby & R.P.D. Walsh. 2000. Soil water repellency: its causes, characteristics and hydro-geomorphological significance. Earth-Science Reviews, 51, 33-65.
Doerr, S.H. & A.D. Thomas. 2000. The role of soil moisture in controlling water repellency: new evidence from forest soils in Portugal. Journal of Hydrology, 231-
232, 134-147. Douglas, P., K.A. Mainwaring, C.P. Morley & S.H. Doerr. 2007. The kinetics and
energetics of transitions between water repellent and wettable soil conditions: a linear free energy analysis of the relationship between WDPT and MED/CST. Hydrological Processes, 21, 2248-2254.
Dupré, A. 1869. Théorie Mecanique de la Chaleur. Gauthier-Villars, Paris. Duval, J.F.L., K.J. Wilkinson, H.P. Van Leeuwen & J. Buffle. 2005. Humic substances
are soft and permeable: Evidence from their electrophoretic mobilities. Environmental Science & Technology, 39, 6435-6445.
Ellerbrock, R.H., H.H. Gerke, J. Bachmann & M.O. Goebel. 2005. Composition of organic matter fractions for explaining wettability of three forest soils. Soil Science Society of America Journal, 69, 57-66.
Ellerbrock, R.H., A. Höhn & J. Rogasik. 1999. Functional Analysis of soil organic matter as affected by long-term manurial treatment. European Journal of Soil Science, 50, 65-71.
Ellerbrock, R.H. & M. Kaiser. 2005. Stability and composition of different soluble soil organic matter fractions-evidence from d13C and FTIR signatures. Geoderma, 128, 28-37.
Engebretson, R.R. & R. Van Wandruszka. 1994. Microorganization in dissolved Humic Acids. Environmental Science and Technology, 28, 1934-1941.
Essington, M.E. 2003. Soil and water chemistry. CRC Press. Ferreira, A.J.D., C.O.A. Coelho, R.P.D. Walsh, R.A. Shakesby, A. Ceballos & S.H.
Doerr. 2000. Hydrological implications of soil water-repellency in Eucalyptus globulus forests, north-central Portugal. Journal of Hydrology, 231-232, 165-177.
Fink, D.H. 1970. Water-repellency and infiltration-resistance of organic-film-coated soils. Soil Science Society of America Proceedings, 34, 189-194.
Fleer, G.J., M.A.C. Stuart, M.H.M. Scheutjens, T. Cosgrove & B. Vincent. 1993. Polymers at interfaces. Chapmann & Hall, London.
Franco, C.M.M., P.J. Clarke, M.E. Tate & J.M. Oades. 2000. Hydrophobic properties and chemical characterisation of natural water repellent materials in Australian sands. Journal of Hydrology, 231-232, 47-58.
Franks, F. 2000. Water-A Matrix of Life. Royal Society of Chemistry, 2nd Edition. Goebel, M.-O., J. Bachmann, S.K. Woche & W.R. Fischer. 2005. Soil wettability,
aggregate stability, and the decomposition of soil organic matter. Geoderma, 128, 80-93.
8 Annex
96
Goebel, M.-O., J. Bachmann, S.K. Woche, W.R. Fischer & R. Horton. 2004. Water potential and aggregate size effects on contact angle and surface energy. Soil Science Society of America Journal, 68, 383-393.
Gottwald, W. & G. Wachter. 1997. IR-Spektroskopie für Anwender. Wiley-VCH, Weinheim.
Graber, E.R. & M.D. Borisover. 1998. Evaluation of the Glassy/Rubbery Model for Soil Organic Matter. Environmental Science and Technology, 32, 3286-3292.
Graber, E.R. & A.R.W. S. Taggera. 2009. Role of Divalent Fatty Acid Salts in Soil Water Repellency. Soil Science Society of America Journal, 73, 541-549.
Graber, E.R., S. Tagger & R. Wallach. 2007. Do surface active substances from water repellent soils aid wetting? European Journal of Soil Science, 58, 1393-1399.
Grasset, L. & A. Amblès. 1998. Structure of humin and humic acid from an acid soil as revealed by phase transfer catalyzed hydrolysis. ORGANIC GEOCHEMISTRY, 29, 881-891.
Grdadolnik, J. 2002. ATR-FTIR Spectroscopy: Its Advantages and Limitations Acta Chimica Slovenica, 49, 631-642.
Hallett, P.D. & I.M. Young. 1999. Changes to water repellence of soil aggregates caused by substrate-induced microbial activity. European Journal of Soil Science, 50, 35-40.
Hoffmann, C. 2002. Schwermetallmobilität und Risikopotential der Rieselfelder Berlin Buch. Bodenökologie und Bodengenese, 35, 226 pp.
Holmes-Farley, S.R., R.H. Reamey, T.J. Mccarthy, J. Deutch & G.M. Whitesides. 1985. Acid-base behavior of carboxylic acid groups covalently attached at the surface of polyethylene: The usefulness of contact angle in following the ionization of surface functionality. Langmuir, 1, 725-740.
Holzhey, C.S. 1968. Water-repellent soils in southern California. In: Symposium on water repellent soils, pp. 31-41, Riverside, California.
Horne, D.J. & J.C. Mcintosh. 2000. Hydrophobic compounds in sands in New Zealand––extraction, characterisation and proposed mechanisms for repellency expression. Journal of Hydrology, 231-232, 35-46.
Hudson, R.A., S.J. Traina & W.W. Shane. 1994. Organic matter comparison of wettable and nonwettable soils from bentgrass sand greens. Soil Science Society of America Journal, 58, 361-367.
Hurraß, J. 2006. Interactios between Soil Organic Matter and Water with special respect to the Glass Transition Behavior. PhD, TU Berlin, Berlin.
Hurraß, J. & G.E. Schaumann. 2006. Properties of soil organic matter and aqueous extracts of actually water repellent and wettable soil samples. Geoderma, 132, 222-239.
Imeson, A.C., J.M. Verstraten, E.J. Van Mullingen & J. Sevink. 1992. The effects of fire and water repellency on infiltration and runoff under Mediterranean type forest. Catena, 19, 345-361.
Jaeger, F., S. Bowe & G.E. Schaumann. under revision. Evaluation of 1H NMR relaxometry for the assessment of pore size distribution in soil samples. European Journal of Soil Science.
Jaramillo, D.F., L.W. Dekker, C.J. Ritsema & J.M.H. Hendrickx. 2000. Occurrence of soil water repellency in arid and humid climates. Journal of Hydrology, 231-232, 105-111.
Jex, G.W., B.H. Bleakley, D.H. Hubbell & L.L. Munro. 1985. High humidity-induced increase in water repellency in some sandy soils. Soil Science Society of America Journal, 49, 1177-1182.

8 Annex
97
Karnok, K.A., E.J. Rowland & K.H. Tan. 1993. High pH treatments and the alleviation of soil hydrophobicity on golf greens. Agronomy Journal, 85, 983-986.
King, P.M. 1981. Comparison of methods for measuring severity of water repellence of sandy soils and assessment of some factors that affect its measurement. Australian Journal of Soil Research, 19, 275-285.
Kleber, M., P. Sollins & R. Sutton. 2007. A conceptual model of organo-mineral interactions in soils: self-assembly of organic molecular fragments into zonal structures on mineral surfaces. Biogeochemistry, 85, 9-24.
Klitzke, S. & F. Lang. 2007. Hydrophobicity of soil colloids and heavy metal mobilization: Effects of drying. Journal of Environmental Quality, 36, 1187-1193.
Koch, K., C. Neinhuis, H.-J. Ensikat & W. Barthlott. 2004. Self assembly of epicuticular waxes on living plant surfaces imaged by atomic force microscopy (AFM). Journal of Experimental Botany, 55, 711-718.
Kostka, S.J. 2000. Amelioration of water repellency in highly managed soils and the enhancement of turfgrass performance through the systematic application of surfactants. Journal of Hydrology, 231-232, 359-368.
Krispil, S.R., R. Wallach & E.R. Graber. 2006. Do surface active substances released from the soil contribute to repellency and wetting dynamics? In: 1st International Conference BIOHYDROLOGY 2006 - Impact of biological factors on soil hydrology, Prague, Czech Republic.
Leboeuf, E.J. & W.J. Weber. 2000. Macromolecular characteristics of natural organic matter. 1. Insights from glass transition and enthalpic relaxation behavior. Environmental Science and Technology, 34, 3623-3631.
Letey, J. 1969. Measurement of contact angle, water drop penetration time, and critical surface tension. In: Water repellent soils - Proceedings of the symposium on water repellent soils, p. 4347, University of California, Riverside, May 6-10, 1968.
Lichner, L., N. Babejova & L.W. Dekker. 2002. Effects of kaolinite and drying temperature on the persistence of soil water repellency induced by humic acids. Rostlinná Výroba, 48, 203-207.
Lin, C.Y., W.C. Chou, J.S. Tsai & W.T. Lin. 2006. Water repellency of Casuarina windbreaks (Casuarina equisetifolia Forst.) caused by fungi in central Taiwan. Ecological Engineering, 26, 283-292.
Lin, S.-Y., H.-C. Chang, L.-W. Lin & P.-Y. Huang. 1996. Measurement of dynamic/advancing/receding contact angle by video-enhanced sessile drop tensiometry. Review of Scientific Instruments, 67, 2852-2858.
Llewellyn, C.T. 2004. Studies of the molecular basis of soil water repellency. Univerisity of Wales, Swansea.
Ma'shum, M. & V.C. Farmer. 1985. Origin and assessment of water repellency of a sandy South Australian Soil. Australian Journal of Soil Research, 23, 623-626.
Ma'shum, M., M.E. Tate, G.P. Jones & J.M. Oades. 1988. Extraction and characterization of water-repellent material from Australian soils. European Journal of Soil Science, 39, 99-110.
Maccarthy, P., M.J. Peterson, R.L. Malcolm & E.M. Thurman. 1979. Separation of humic substances by pH gradient desorption from a hydrophobic resin. Analytical Chemistry, 51, 2041-2043.
Mainwaring, K.A. 2004. Chemical characterisation and repellency-inducing effects of organic compounds isolated from sandy soils. Department of Chemistry. University of Wales, Swansea.
Mainwaring, K.A., C.P. Morley, S.H. Doerr, P. Douglas, C.T. Llewellyn, G. Llewellyn, I. Matthews & B.K. Stein. 2004. Role of heavy polar organic compounds for water repellency of sandy soils. Environmental Chemistry Letters, 2, 35-39.
8 Annex
98
Marmur, A. 1992. Penetration and displacement in capillary systems of limited size. Advances in Colloid and Interface Science, 39, 13-33.
Mataix-Solera, J., V. Arcenegui, C. Guerrero, A.M. Mayoral, J. Morales, J. González, F. García-Orenes & I. Gómez. 2007. Water repellency under different plant species in a calcareous forest soil in a semiarid Mediterranean environment. Hydrological Processes, 21, 2300-2309.
Mataix-Solera, J. & S.H. Doerr. 2004. Hydrophobicity and aggregate stability in calcareous topsoils from fire-affected pine forests in south-eastern Spain. Geoderma, 118, 77-88.
Mcghie, D.A. & A.M. Posner. 1980. Water repellence of heavy textured Western australian surface soil. Australian Journal of Soil Research, 18, 309-323.
Mcghie, D.A. & A.M. Posner. 1981. The effect of plant top material on the water repellence of fired sands and water repellent soils. Australian Journal of Agricultural Research, 32, 609-620.
Mchale, G., H.Y. Erbil, M.I. Newton & S. Natterer. 2001. Analysis of Shape Distortions in Sessile Drops. Langmuir, 17, 6995-6998.
Mchale, G., M.I. Newton & N.J. Shirtcliffe. 2005. Water repellent soils and its relationship to granularity, surface roughness and hydrophobicity: a material science view. European Journal of Soil Science, 56, 445-452.
Mchale, G., N.J. Shirtcliffe, M.I. Newton & F.B. Pyatt. 2007. Implications of ideas on super-hydrophobicity for water repellent soil. Hydrological Processes, 21, 2229-2238.
Mckissock, I., R.J. Gilkes, R.J. Harper & D. Carter, J. 1998. Relationships of water repellence to soil properties for different spatial scales of study. Australian Journal of Soil Research, 36, 495-507.
Mckissock, I., R.J. Gilkes & W. Van Bronswijk. 2003. The relationship of soil water repellency to aliphatic C and kaolin measured using DRIFT. Australian Journal of Soil Research, 41, 851-265.
Mehlich, A. 1984. Mehlich 3 soil test extractant: A modification of Mehlich 2 extractant. Communications in Soil Science and Plant Analysis, 15, 1409 - 1416.
Michel, J.-C., L.M. Rivière & M.N. Bellon-Fontaine. 2001. Measurement of the wettability of organic materials in relation to water content by the capillary rise method. European Journal of Soil Science, 52, 459-467.
Morley, C.P., K.A. Mainwaring, S.H. Doerr, P. Douglas, C.T. Llewellyn & L.W. Dekker. 2005. Organic compounds at different depths in a sandy soil and their role in water repellency. Australian Journal of Soil Research, 43, 239-249.
Namjesnik-Dejanovic, K. & P.A. Maurice. 1997. Atomic force microscopy of soil and stream fulvic acids. Colloids and Surfaces A: Physicochemical and Engineering Aspects, 120, 77-86.
Namjesnik-Dejanovic, K. & P.A. Maurice. 2001. Conformations and aggregate structures of sorbed natural organic matter on muscovite and hematite. Geochimica Et Cosmochimica Acta, 65, 1047-1057.
Nguyen, H.V., J.L. Nieber, C.J. Ritsema, L.W. Dekker & T.S. Steenhuis. 1999. Modeling gravity driven unstable flow in a water repellent soil. Journal of Hydrology, 215, 202-214.
Nguyen, T.T., L.J. Janik & M. Raupach. 1991. Diffuse Reflectance Infrared Fourier-Transform (Drift) Spectroscopy in Soil Studies. Australian Journal of Soil Research, 29, 49-67.
Ohashi, H. & H. Nakazawa. 1996. The microstructure of Humic Acid-Montmorillonite composites. Clay Minerals, 31, 347-354.
8 Annex
99
Pantze, A., O. Karlsson & U. Westermark. 2008. Esterification of carboxylic acids on cellulosic material: Solidstate reactions. Holzforschung, 62, 136–141.
Piccolo, A. 2002. The supramolecular structure of humic substances: A novel understanding of humus chemistry and implications in soil science. Advances in Agronomy, 75, 57-134.
Piccolo, A. & J.S.C. Mbagwu. 1999. Role of Hydrophobic Components of Soil Organic Matter in Soil Aggregate Stability. Soil Science Society of America Journal, 63, 1801-1810.
Piccolo, A., R. Spaccini, G. Haberhauer & M.H. Gerzabek. 1999. Increased Sequestration of Organic Carbon by Hydrophobic Protection. Naturwissenschaften, 86, 496-499.
Pignatello, J.J. 2003. Polymer sorption theory applied to macromolecular forms of natural organic matter. In: Preprints of Extended Abstracts presented at the ACS National Meeting, American Chemical Society, Division of Environmental Chemistry, pp. 883-888.
Richardson, J.L. 1984. Field Observation and measurement of water repellency for soil surveyors. Soil Survey Horizons, 25, 32-36.
Ritsema, C.J. & L.W. Dekker. 1994. Soil moisture and dry bulk density patterns in bare dune sands. Journal of Hydrology, 154, 107-131.
Ritsema, C.J. & L.W. Dekker. 2000. Preferential flow in water repellent sandy soils: principles and modeling implications. Journal of Hydrology, 231-232, 308-319.
Roberts, F.J. & B.A. Carbon. 1971. Water repellence in sandy soils of south-western Australia. I. Some studies related to field occurence. Field station record, 10, 13-20.
Roberts, F.J. & B.A. Carbon. 1972. Water repellence in sandy soils of southwestern Australia. II. Some chemical characteristics of the hydrophobic skins. Australian Journal of Soil Research, 10, 35-42.
Robichaud, P.R. 2000. Fire effects on infiltration rates after prescribed fire in Northern Rocky Mountain forests, USA. Journal of Hydrology, 231-232, 220-229.
Roper, M.M. 2005. Managing soils to enhance the potential for bioremediation of water repellency. Australian Journal of Soil research, 43, 803-810.
Roy, J.L., B. Mcgill & P. Rawluk. 1999. Petroleum residues as water-repellent substances in weathered nonwettable oil-contaminated soils. Canadian Journal of Soil Science, 79, 367-380.
Roy, J.L. & W.B. Mcgill. 2002. Assessing soil water repellency using the molarity of ethanol droplet (MED) test. Soil Science, 167, 83-97.
Savage, S.M. 1974. Mechanism of fire-induced water repellency in soil. Soil Science Society of America Proceedings, 38, 652-657.
Savage, S.M., J.P. Martin & J. Letey. 1969. Contribution of some soil fungi to natural and heat-induced water repellency in sand. Soil Science Society of America Proceedings, 33, 405-409.
Savage, S.M., J. Osborn, J. Letey & C. Heaton. 1972. Substances contributing to fire-induced water repellency in soils. Soil Science Society of America Proceedings, 36, 674-678.
Schaumann, G.E. 2006. Soil organic matter beyond molecular structure. 1. Macromolecular and supramolecular characteristics. Journal of Plant Nutrition and Soil Science, 169, 145-156.
Schaumann, G.E. & M. Bertmer. 2008. Do water molecules bridge soil organic matter molecule segments? European Journal of Soil Science, 59, 423-429.
Schaumann, G.E., E. Hobley, J. Hurraß & W. Rotard. 2005. H-NMR Relaxometry to monitor wetting and swelling kinetics in high organic matter soils. Plant and Soil, 275, 1-20.
8 Annex
100
Schaumann, G.E., C. Siewert & B. Marschner. 2000. Kinetics of the release of dissolved organic matter (DOM) from air-dried and pre-moistened soil material. Journal of Plant Nutrition and Soil Science, 163, 1-5.
Schlenther, L.M., B.; Hoffmann, C.; Renger, M. 1996. Ursachen mangelnder Anwuchserfolge bei der Aufforstung der Rieselfelder in Berlin-Buch. Verhandlungen der Gesellschaft für Ökologie, 25, 349-359.
Schmeer, G., S. Riembauer & J. Barthel. 1990. The influence of hydrophobic solvation on the alkaline hydrolysis of ethyl esters of polar substituted 2-methylpropionic acids in water. Journal of Solution Chemistry, 19, 1175-1189.
Scholl, D.G. 1975. Soil Wettability and Fire in Arizona Chaparral. Soil Science Society of America Journal, 39, 356-361.
Schuck, P. 2007. Protein interactions: biophysical approaches for the study of complex reversible systems. Springer.
Schulten, H.-R. & M. Schnitzer. 1997. Chemical model structures for soil organic matter and soils. Soil Science, 162, 115-130.
Schwuger, M.J. 1996. Lehrbuch der Grenzflächenchemie. Georg Thieme Verlag, Struttgart-New York.
Shakesby, R.A., C.J. Chafer, S.H. Doerr, W.H. Blake, P. Wallbrink, G.S. Humphreys & B.A. Harrington. 2003. Fire severity, water repellency characteristics and hydrogeomorphical changes following the Christmas 2001 Sydney forest fires. Australian Geographer.
Shakesby, R.A., S.H. Doerr & R.P.D. Walsh. 2000. The erosional impact of soil hydrophobicity: current problems and future research directions. Journal of Hydrology, 231-232, 178-191.
Siebold, A., M. Nardin, J. Schultz, A. Walliser & M. Oppliger. 2000. Effect of dynamic contact angle on capillary rise phenomena. Colloids and Surfaces A: Physicochemical and Engineering Aspects, 161, 81-87.
Siebold, A., A. Walliser, M. Nardin, M. Oppliger & J. Schultz. 1997. Capillary Rise for Thermodynamic Characterization of Solid Particle Surface. Journal of Colloid and Interface Science, 186, 60-70.
Spaccini, R., A. Piccolo, P. Conte, G. Haberhauer & M.H. Gerzabek. 2002. Increased soil organic carbon sequestration through hydrophobic protection by humic substances. Soil Biology and Biochemistry, 34, 1839-1851.
Sparks, D.L. 1985. Kinetics of ionic reactions in clay minerals and soils. Adv. Agron., 38, 231-266.
Spiros, H.A. & G.H. Savvas. 1998. The work of adhesion of polymer/wall interfaces and its association with the onset of wall slip. Journal of Rheology (New York), 42, 795-812.
Steenhuis, T.S., J.C. Rivera, C.J.M. Hernández, M.T. Walter, R.B. Bryant & P. Nektarios. 2001. Water Repellency in New York State Soils.
Stenius, P. 1994. Theory of the ring and Wilhelmy plate methods. Helsinki University of Technology, Laboratory of Forest Products Chemistry, Reports, Series C, 2, 22pp.
Stevenson, F.J. 1985. Geochemistry. In: Humic substances in soil, sediment, and water: geochemistry, isolation and characterization. (ed. Aiken, G.R., McKnight, D. M., Wershaw, R. L., MacCarthy, P.), pp. 13-52. John Wiley & Sons, New York.
Stevenson, F.J. 1994. Humus Chemistry : Genesis, Composition, Reactions. Wiley, New York.
Swift, R.S. 1989. Molecular weight, size, shape and charge characterisitcs of humic substances: Some basic considerations. In: Humic substances II: In search of structure (eds. Hayes, M.H.B., MacCarthy, P., Malcolm, R.L. & Swift, R.S.), pp. 449-465. John Wiley & Sons, New York.
8 Annex
101
Swift, R.S. 1999. Macromolecular properties of soil humic substances: fact, fiction, and opinion. Soil Science, 164, 790-802.
Täumer, K. 2007. Analyzing soil water repellency phenomena. PhD, TU Berlin, Berlin. Taumer, K., H. Stoffregen & G. Wessolek. 2006. Seasonal dynamics of preferential flow
in a water repellent soil. Vadose Zone Journal, 5, 405-411. Täumer, K., H. Stoffregen & G. Wessolek. 2005. Determination of repellency
distribution using soil organic matter and water content. Geoderma, 125, 107-115. Teramura, A.H. 1980. Relationships between Stand Age and Water Repellency of
Chaparral Soils. Bulletin of the Torrey Botanical Club, 107, 42-46. Terashima, M., M. Fukushima & S. Tanaka. 2004. Influence of pH on the surface activity
of humic acid. Micelle-like aggregate formation and interfacial adsorption. Colloids and Surfaces, A: Physicochemical and Engineering Aspects, 247, 77-83.
Todoruk, T.R., C.H. Langford & A. Kantzas. 2003a. Pore-Scale Redistribution of Water during Wetting of Air-Dried Soils As Studied by Low-Field NMR Relaxometry. Environmental Science and Technology, 37, 2707-2713.
Todoruk, T.R., M. Litvina, A. Kantzas & C.H. Langford. 2003b. Low-Field NMR Relaxometry: A Study of Interactions of Water with Water-Repellant Soils. Environmental Science and Technology, 37, 2878-2882.
Tremblay, L. & J.P. Gagne. 2002. Fast quantification of humic substances and organic matter by direct analysis of sediments using DRIFT spectroscopy. Analytical Chemistry, 74, 2985-2993.
Tschapek, M. 1984. Criteria for determining the hydrophilicity - hydrophobicity of soils. Zeitschrift für Pflanzenernährung und Bodenkunde, 147, 137-149.
Ulery, A.L. & L.R. Drees. 2008. Methods of Soil Analysis: Part 5 - Mineralogical Methods. American Society of Agronomy.
Valat, B., C. Jouany & L.M. Rivière. 1991. Characterization of the wetting properties of air-dried peats and composts. Soil Science, 152, 100-107.
Van't Woudt, B.D. 1959. Particle coatings affecting the wettability of soils. Journal of Geophysical Research, 64, 263-267.
Varela, M.E., E. Benito & E. De Blas. 2005. Impact of wildfires on surface water repellency in soils of northwest Spain. Hydrological Processes, 19, 3649-3657.
Waksman, S.A. & H.W. Reuszer. 1932. On the origin of the uronic acids in the humus of soil, peat, and composts. Soil Science, 33, 135.
Wallach, R. & E.R. Graber. 2007. Infiltration into effluent irrigation-induced repellent soils and the dependence of repellency on ambient relative humidity. Hydrological Processes, 21, 2346-2355.
Wallis, M.G. & D.J. Horne. 1992. Soil water repellency. Advances in Soil Science, 20, 91-146.
Wallis, M.G., D.J. Horne & A.S. Palmer. 1993. Water-repellency in a New Zealand development sequence of yellow-brown sands. Australian Journal of Soil Research, 31, 641-654.
Wander, I.W. 1949. An interpretation of the cause of restistance to wetting in Florida Soils. Florida State Horticultural Society, 11, 92-94.
Washburn, E.W. 1921. The dynamics of capillary flow. The Physical Review Letters 17, 273–283.
Wedler, G. 1987. Lehrbuch der physikalischen Chemie. VCH Verlagsgesellschaft mbH, Weinheim.
Wendland, F. 1993. Der Große Tiergarten in Berlin : seine Geschichte und Entwicklung in fünf Jahrhunderten. Mann, Berlin.
Wenzel, R.N. 1949. Surface roughness and contact angle. Journal of Physical and Colloid Chemistry, 53, 1466-1467.
8 Annex
102
Wershaw, R.L. 1986. A new model for humic materials and their interactions with hydrophobic organic chemicals in soil-water or sediment-water systems. Journal of Contaminant Hydrology, 1, 29-45.
Wershaw, R.L. 1999. Molecular aggregation of humic substances. Soil Science, 164, 803-813.
Wessel, A.T. 1988. On using the effective contact angle and water drop penetration time for classification of water repellency in dune soils. Earth Surface Processes and Landforms, 13, 555-562.
Wilhelmy, L. 1863. Ueber die Abhängigkeit der Capillaritäts - Constante des Alkohols von Substanz und Gestalt des benetzten festen Körpers. Annalen der Physik und Chemie, 119, 177.
Yang, B., P.S. Blackwell & D.F. Nicholson. 1996. A numerical model of heat and water movement in furrow-sown water repellent sandy soils. Water Resources Research, 32, 3051-3061.
Young, T. 1855. Miscellaneous Works of the Late Thomas Young. Murray, London. Zhan, C.-G., D.W. Landry & R.L. Ornstein. 2000. Reaction Pathways and Energy
Barriers for Alkaline Hydrolysis of Carboxylic Acid Esters in Water Studied by a Hybrid Supermolecule-Polarizable Continuum Approach. Journal of American Chemical Society, 122, 2621-2627.
Ziogas, A.K., L.W. Dekker, K. Oostindie & C.J. Ritsema. 2003. Soil water repellency in northeastern Greece. In: Soil Water Repellency: Occurence, Consequences and Amelioration (eds. Ritsema, C.J. & Dekker, L.W.), p. 325pp. Elsevier, Amsterdam.
Ziogas, A.K., L.W. Dekker, K. Oostindie & C.J. Ritsema. 2005. Soil water repellency in north-eastern Greece with adverse effects of drying on the persistence. Australian Journal of Soil Research, 43, 281–289.

8 Annex
103
8 Annex
8.1 List of abreviations
Latin symbols
a semi-major axis of an ellipse
[m]
Aact actual contact area [m2]
Ageo geometric area, i.e., the planar projection of Aact
[m2]
Ageo,s geometric water covered solid area
[m2]
Ai area of the material i [m2]
Ap cross sectional area of the plate
[m2]
As surface area [m2]
Atot total area [m2]
b semi-minor axis of an ellipse
[m]
B1; B2 weighting factors of the subprocesses at the whole process
[ - ] C geometrical factor [m]
c weight concentration
[mg kg-1 SOM]
C/N C to N ratio [ - ]
CECpot potential cation exchange capacity
[cmolc kg-1]
CH combined integral area under the peaks at 2930 and 2850 cm−1 for intensity of asymmetric and symmetric C-H-stretching vibrations of aliphatic CH3 and
CH2 groups [K.-M. unit cm-1]
CHN; OHN normalized CH and OH by dividing the respective areas by the Ref area
[ - ] E energy [J = kg m2 s-2]
EA activation energy [kJ mol-1]
EC electrical conductivity
[µS cm-1]
F force, gravitational force Fg, buoyancy Fb and
surface force Fs [N = kg m s-2]
g gravitational acceleration (9.80665)
[m s-2]
h height [m]
k rate constant [µL h-1]
k1; k2 rate constants of the subprocesses
[µL h-1]
LoI Loss on ignition [weight %]
ls perimeter [m]
Lw wetted length [m]
OH integral area under the O-H band of DRIFT spectra (3800 and
2500 cm−1) [K.-M. unit cm-1]
p hydrostatical pressure [N m-2]
pH negative decimal logarithm of the hydroxonium ion activity in an aqueous solution
[ - ] pH(max Repel) pH of maximum
repellency
[ - ]
pHpzc pH of point of zero charge [ - ]
pKa deprotonation constant [ - ]
pK1, mineral
pK2, mineral
deprotonation and the protonation constants of mineral surfaces
[ - ] pKSOM deprotonation constant of
SOM surfaces
[ - ] q charge of the titrant [molc L
–1]
Q charge [cmolc kg-1]
Q(max Repell) charge of maximum repellency
[cmolc kg-1]
Qek electrokinetic charge
[cmolc kg-1]
Qmax, mineral maximum negative or positive charge from deprotonation or protonation of mineral
compounds [cmolc kg-1]
Qmax, SOM maximum negative charge from deprotonation of organic
functional groups [cmolc kg-1]
Qmineral charge caused by protonation and deprotonation of mineral
compounds [cmolc kg-1]
Qperm permanent charge [cmolc kg-1]
QSOM charge caused by deprotonation of organic
functional groups [cmolc kg-1]
R universal gas constant (8.32441)
[J K–1 mol–1]
r0 radius of curvature at the drop apex
[m]

8 Annex
104
r1; r2 radii of curvature at (x0, y0) [m]
Ref integral area under DRIFT spectra (4000
and 400 cm−1) [K.-M. unit cm-1]
RH relative air humidity [%]
t time [h; min; s]
T temperature [°C]
TOC total organic carbon content
[g kg-1]
Up perimeter of the plate [m]
V volume: Vl of the displaced liquid, Vp of the plate
[m3]
w weight [kg]
Wadh work of adhesion [J = kg m2 s-2]
Wapp apparent work of adhesion
[J = kg m2 s-2]
Wapp0 initial work of
adhesion for t = 0
[J = kg m2 s-2] WC water content [weight %]
WCcrit critical water content for soil water repellency
[weight %] WDPT water drop penetration
time [h = 60 min = 3600 s]
z immersion depth [m]
Greek symbols
α, β, γ parameters of linear regression
[ - ]
ε model parameter for distance between spherical particles
[ - ]
γαβ interfacial tension between the phases a and b with v for vapour, l for liquid and s for
solid phase [N m-1= J m-2]
η viscosity [kg m−1 s−1]
κ−1 capillary length [mm]
Θ contact angle [°]
Θadv advancing contact angle [°]
Θapp apparent contact angle [°]
Θeff effective contact angle [°]
Θr contact angle of a rough chemically homogenous surface
[°] Θrec receding contact angle [°]
Θsess sessile drop contact angle [°]
Θsm contact angle of a smooth chemically heterogeneous surface
[°] ΘWPM Wilhelmy plate contact angle [°]
ΘY Young´s law contact angle [°]
ρ density [kg m-3]
Statistical measures
n number [ - ]
R correlation coefficient [ - ]
P probability of error [ - ]
Methods
1H-NMR proton nuclear magnetic resonance spectroscopy
AFM atomic force microscopy
ATR FTIR
attenuated total reflectance infrared fourier transform spectroscopy
BET method of determination of the inner surface using the BET theory developed by S. Brunauer, P. Emmett, and E. Teller and called after the initials in their last names
CRM capillary rise method
DRIFT diffuse reflectance infrared fourier transform spectroscopy
PCD particle charge detection
TISED time dependent sessile drop measurement
WPM Wilhelmy plate method
Sample names
NLW originally wettable samples from Ouddorp, Netherlands
NLR originally repellent samples from Ouddorp, Netherlands
UKW originally wettable samples from Pennard Golf Course, United Kingdom
UKR originally repellent samples from Nicholaston Dunes, United Kingdom
AUW originally wettable samples from Myome, Australia
AUR originally repellent samples from Pine Views, Australia
Others
DOC dissolved organic carbon
DOM dissolved organic matter
SOM soil organic matter
SWR soil water repellency
HS humic substances
FA fulvic acids
HA humic acids
HU humins
PHA peat humic acid

8 Annex
105
8.2 List of Figures
Figure 1-1 Sample site Berlin-Tiergarten (photo: K. Täumer, Department of Soil
Protection, TU-Berlin) .................................................................................. 13
Figure 1-2 Sample site Berlin-Buch: result of an attempt of afforrestation (left), small-
scale differences in WC visible in dark wettable and light repellent patches at
a depth of 5 cm during sampling in Berlin-Buch (Hurraß & Schaumann,
2006); (right); (photos: K. Täumer, Department of Soil Protection, TU-Berlin)
..................................................................................................................... 14
Figure 2-1 Interfacial tensions at the three phase line (TPL) of the adjacent liquid, solid
and vapour phase for various contact angles Θ. ............................................ 17
Figure 2-2 Schematic drawing of hydrogen bonds between water molecules ................ 17
Figure 2-3 Gravitational force Fg, buoyancy Fb and surface force Fs acting at the three
phase line of a Wilhelmy plate immersed into a liquid with liquid-solid
contact angle below and above 90°. .............................................................. 20
Figure 2-4 A sessile drop fitted as ellipsoidal cap showing the vectors of interfacial
tensions, γ, at the drop edge, the observable contact angle Θapp and elliptical
parameters a, b, h necessary to calculate Θapp and drop volume V according to
Equation (2-20) and (2-21). .......................................................................... 21
Figure 2-5 (a): Sessile drop on rough surface with decreasing apparent contact angle,
Θapp, and increasing total geometric contact area, Atot, by spreading from time
t0 to t2. (b – d): sinking of drop water into air filled gaps in a zoomed
intersection of the water-solid contact area beneeth the drop. Side views:
hemispheric particles partly covered by water in dark grey, entrapped air
(white) between dry parts of particles (black) and from t0 to t2 sinking water
level (light grey). Plan views: from t0 to t2 increasing geometric area, Ageo,
(grey) of water covered particles and decreasing water-air interface (white) 27
Figure 3-1 (a) Volume of sessile drops on the dried sample B2 at 5°C in different
measurement conditions: I on soil body, at ca. 50% RH, II on a thin soil layer,
at ca. 50% RH and III on a thin soil layer, at >99,9% RH, (b) Curve III: Figure
3-1 (a) in a smaller scale with deviation range and exponential and initial
linear fitting curve ........................................................................................ 34
Figure 3-2 Apparent work of adhesion, Wapp, according to Eq 3 as a function of contact
time of one representative sessile drop on all investigated samples at 5°C,
20°C and 30°C and the respective double exponential fitting curves (standard
deviation ± 5 mN m-1) .................................................................................. 36
Figure 3-3 A model visualising different re-wetting behaviour of the investigated
samples. Buch: Hydrophilic functional groups (black circles) are linked
chemically towards the interior of SOM in the air-dried sample. Re-wetting
requires high activation energy, EA, to disrupt linkages. Tiergarten: Surface
characteristics do change only slightly during drying and re-wetting.
Probably, pH-differences result in differing percentage of charged functional
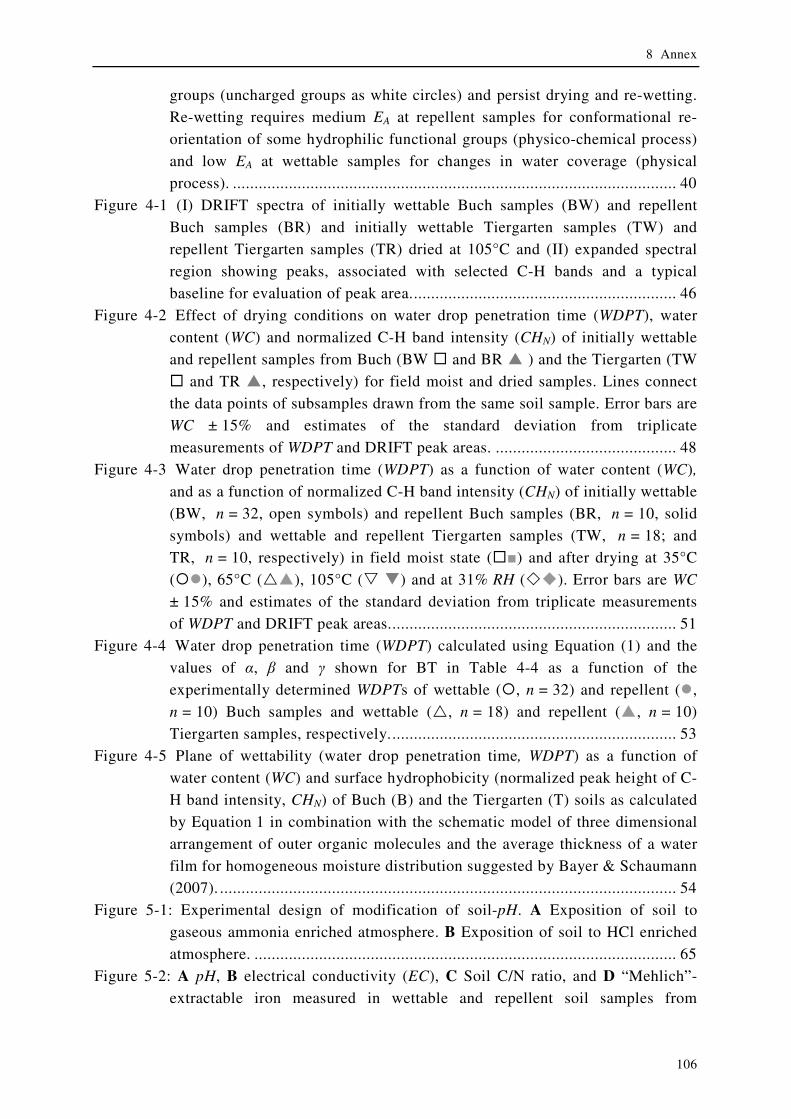
8 Annex
106
groups (uncharged groups as white circles) and persist drying and re-wetting.
Re-wetting requires medium EA at repellent samples for conformational re-
orientation of some hydrophilic functional groups (physico-chemical process)
and low EA at wettable samples for changes in water coverage (physical
process). ....................................................................................................... 40
Figure 4-1 (I) DRIFT spectra of initially wettable Buch samples (BW) and repellent
Buch samples (BR) and initially wettable Tiergarten samples (TW) and
repellent Tiergarten samples (TR) dried at 105°C and (II) expanded spectral
region showing peaks, associated with selected C-H bands and a typical
baseline for evaluation of peak area. ............................................................. 46
Figure 4-2 Effect of drying conditions on water drop penetration time (WDPT), water
content (WC) and normalized C-H band intensity (CHN) of initially wettable
and repellent samples from Buch (BW � and BR � ) and the Tiergarten (TW
� and TR �, respectively) for field moist and dried samples. Lines connect
the data points of subsamples drawn from the same soil sample. Error bars are
WC ± 15% and estimates of the standard deviation from triplicate
measurements of WDPT and DRIFT peak areas. .......................................... 48
Figure 4-3 Water drop penetration time (WDPT) as a function of water content (WC),
and as a function of normalized C-H band intensity (CHN) of initially wettable
(BW, n = 32, open symbols) and repellent Buch samples (BR, n = 10, solid
symbols) and wettable and repellent Tiergarten samples (TW, n = 18; and
TR, n = 10, respectively) in field moist state (�■) and after drying at 35°C
(��), 65°C (��), 105°C (� �) and at 31% RH (��). Error bars are WC
± 15% and estimates of the standard deviation from triplicate measurements
of WDPT and DRIFT peak areas. .................................................................. 51
Figure 4-4 Water drop penetration time (WDPT) calculated using Equation (1) and the
values of α, β and γ shown for BT in Table 4-4 as a function of the
experimentally determined WDPTs of wettable (�, n = 32) and repellent (�,
n = 10) Buch samples and wettable (�, n = 18) and repellent (�, n = 10)
Tiergarten samples, respectively. .................................................................. 53
Figure 4-5 Plane of wettability (water drop penetration time, WDPT) as a function of
water content (WC) and surface hydrophobicity (normalized peak height of C-
H band intensity, CHN) of Buch (B) and the Tiergarten (T) soils as calculated
by Equation 1 in combination with the schematic model of three dimensional
arrangement of outer organic molecules and the average thickness of a water
film for homogeneous moisture distribution suggested by Bayer & Schaumann
(2007). .......................................................................................................... 54
Figure 5-1: Experimental design of modification of soil-pH. A Exposition of soil to
gaseous ammonia enriched atmosphere. B Exposition of soil to HCl enriched
atmosphere. .................................................................................................. 65
Figure 5-2: A pH, B electrical conductivity (EC), C Soil C/N ratio, and D “Mehlich”-
extractable iron measured in wettable and repellent soil samples from

8 Annex
107
Tiergarten (TW, TR) and from Buch (BW, BR, respectively) from a study of
seasonally sampling between spring 2002 and spring 2004. ......................... 66
Figure 5-3: Artificially induced soil-pH as a function of the added volume of HCl- and
NH3-enriched air for D samples from Germany, NL samples from
Netherlands, UK samples from the UK, and AU samples from Australia. .... 68
Figure 5-4: Water drop penetration time (WDPT) as a function of artificially induced pH
of repellent samples and wettable control samples: D from two sites in
Germany, NL from a profile in the Netherlands, UK from two sites in UK,
and AU from two sites in Australia. ............................................................. 70
Figure 5-5: Wettability of the German Tiergarten (TW, TR) and Buch (BW, BR) samples
as a function of artificial induced soil pH: A as contact angle measured by
Wilhelmy Plate Method (ΘWPM), B as contact angle measured by sessile drop
method (Θsess), and C measured as water drop penetration time (WDPT). D
WDPT and ΘWPM as a function of the respective Θsess. .................................. 71
Figure 5-6: Particle surface charge (Q) of soil fraction < 63 µm of selected pH-treated
sub-samples with highest, lowest and medium artificially induced pH from the
wettable and repellent Buch samples (BW, BR) and Tiergarten samples (TW,
TR, respectively). ......................................................................................... 72
Figure 5-7: Wettability of the German Tiergarten (TW, TR) and Buch (BW, BR) samples
as contact angle measured by sessile drop method depicted as a function of
particle surface charge (Q) of soil fraction < 63 µm. Particle surface charge
data are measured at four data points for each sample (indicated by double
symbol frame) and linearly interpolated between these four points by their pH
dependency (Figure 5-6). .............................................................................. 73
Figure 5-8: Simplified schematic pH dependent interplay of negative and positive surface
charge provided by SOM surfaces (QSOM), by mineral surfaces (Qmineral), and
by permanent surface charge (Qperm.) using equation 4 and 5 with parameters
(Table 5-4) chosen to create a scenario with minimum Σ2iQ at pH(max Repell)
and a ΣQ-curve crossing the data points of measured net surface charge of the
respective German samples. ......................................................................... 76
Figure 6-1 Schematic model of suggested mechanisms of changes in soil water
repellency (SWR) upon altering pH via liquid phase and via gas phase in
dried samples from Buch. ............................................................................. 83
Figure 6-2 Suggested model of orientation of amphiphilic organic molecules at the SOM
surface during drying in dependence of pH and ionic strength of the soil
solution ......................................................................................................... 85
Figure 6-3 Schematic model of suggested mechanisms of changes in soil water
repellency (SWR) in Tiergarten samples upon pH altering via liquid phase
(top) and via gas phase in dried samples (bottom) ........................................ 86
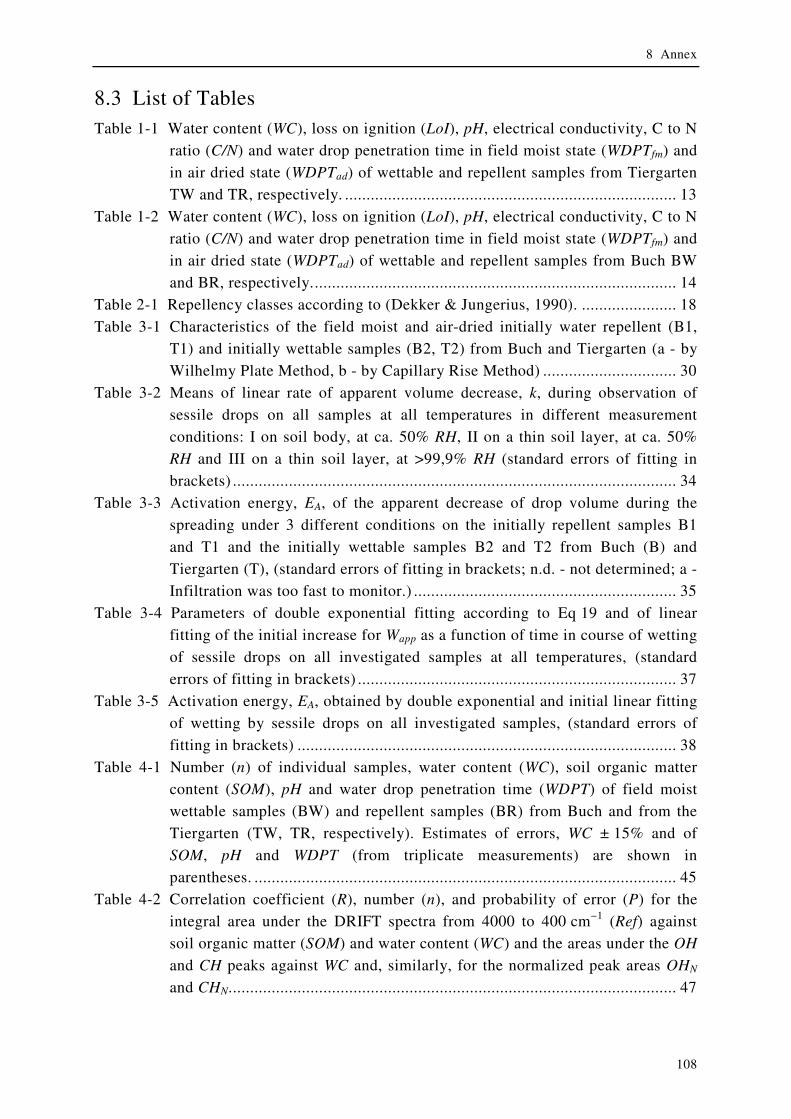
8 Annex
108
8.3 List of Tables
Table 1-1 Water content (WC), loss on ignition (LoI), pH, electrical conductivity, C to N
ratio (C/N) and water drop penetration time in field moist state (WDPTfm) and
in air dried state (WDPTad) of wettable and repellent samples from Tiergarten
TW and TR, respectively. ............................................................................. 13
Table 1-2 Water content (WC), loss on ignition (LoI), pH, electrical conductivity, C to N
ratio (C/N) and water drop penetration time in field moist state (WDPTfm) and
in air dried state (WDPTad) of wettable and repellent samples from Buch BW
and BR, respectively. .................................................................................... 14
Table 2-1 Repellency classes according to (Dekker & Jungerius, 1990). ...................... 18
Table 3-1 Characteristics of the field moist and air-dried initially water repellent (B1,
T1) and initially wettable samples (B2, T2) from Buch and Tiergarten (a - by
Wilhelmy Plate Method, b - by Capillary Rise Method) ............................... 30
Table 3-2 Means of linear rate of apparent volume decrease, k, during observation of
sessile drops on all samples at all temperatures in different measurement
conditions: I on soil body, at ca. 50% RH, II on a thin soil layer, at ca. 50%
RH and III on a thin soil layer, at >99,9% RH (standard errors of fitting in
brackets) ....................................................................................................... 34
Table 3-3 Activation energy, EA, of the apparent decrease of drop volume during the
spreading under 3 different conditions on the initially repellent samples B1
and T1 and the initially wettable samples B2 and T2 from Buch (B) and
Tiergarten (T), (standard errors of fitting in brackets; n.d. - not determined; a -
Infiltration was too fast to monitor.) ............................................................. 35
Table 3-4 Parameters of double exponential fitting according to Eq 19 and of linear
fitting of the initial increase for Wapp as a function of time in course of wetting
of sessile drops on all investigated samples at all temperatures, (standard
errors of fitting in brackets) .......................................................................... 37
Table 3-5 Activation energy, EA, obtained by double exponential and initial linear fitting
of wetting by sessile drops on all investigated samples, (standard errors of
fitting in brackets) ........................................................................................ 38
Table 4-1 Number (n) of individual samples, water content (WC), soil organic matter
content (SOM), pH and water drop penetration time (WDPT) of field moist
wettable samples (BW) and repellent samples (BR) from Buch and from the
Tiergarten (TW, TR, respectively). Estimates of errors, WC ± 15% and of
SOM, pH and WDPT (from triplicate measurements) are shown in
parentheses. .................................................................................................. 45
Table 4-2 Correlation coefficient (R), number (n), and probability of error (P) for the
integral area under the DRIFT spectra from 4000 to 400 cm−1 (Ref) against
soil organic matter (SOM) and water content (WC) and the areas under the OH
and CH peaks against WC and, similarly, for the normalized peak areas OHN
and CHN. ....................................................................................................... 47

8 Annex
109
Table 4-3 Probabilities (P) in support of the alternative hypothesis (HA) and rejection of
the null hypothesis for normalized C-H peak areas (CHN) obtained for sample
pairs dried using two different procedures obtained from sample paired t-tests.
..................................................................................................................... 49
Table 4-4 Correlation coefficients (R) for linear regression of logWDPT against water
content (WC) and normalized C-H peak area (CHN), and of WC against CHN
for all samples of both soils (BT) and the various sample subsets (see text) . 52
Table 4-5 Multiple regression parameters α, β and γ, their standard errors and correlation
coefficients (R) of logWDPT against water content (WC) and normalized C-H
peak area (CHN) for all samples (BT) and those from Buch (B) and those from
Tiergarten (T). .............................................................................................. 53
Table 5-1: Sample characteristics ................................................................................... 61
Table 5-2: Water content (WC) and wettability as water drop penetration time (WDPT),
as contact angle measured by Wilhelmy Plate method (ΘWPM), and by sessile
drop method (Θsess) in field moist state and dried at 19°C at a constant relative
humidity of 31%RH, and soil organic matter content (SOM) and potential
cation exchange capacity (CECpot) of the 4 German samples. ....................... 62
Table 5-3: Point of zero charge, pHpzc (PCD) suggested by PCD measurement, pH of
maximum repellency (pH(max Repell) and particle charge of maximum repellency
(Q(max Repell). .................................................................................................. 72
Table 5-4: Parameters chosen in order to create a scenario with minimum Σ2iQ at
pH(max Repell) and a ΣQ-curve crossing the data points of measured net surface
charge of the respective German samples (Figure 5-6) using equation 4 and 5:
permanent charge (Qperm.), maximum negative surface charge obtainable by
deprotonation of SOM (Qmax, SOM) and the respective deprotonation constant
(pKSOM), maximum negative and positive surface charge obtainable by
deprotonation / protonation of mineral surfaces (Qmax, mineral) and the
respective deprotonation and protonation constants (pK1, mineral / pK2, mineral).77
Table 6-1 Overview of the main observations of differences in soil characteristics and in
responses on changes in environmental conditions between wettable and
repellent samples from Buch and Tiergarten ................................................. 81

8 Annex
110
8.4 Curriculum vitae
Contact
Name: Dörte Diehl Adress: Universität Koblenz-Landau Email: [email protected] Telephone: 0049 6341 280 567
Personal information
Date of Birth: 30.08.1969 Place of Birth Rostock, Germany Nationality: German
Education
Date: 1995-2003 Qualification: Graduated engineer for environmental technology Principle subject: Environmental technology University: Technische Universität Berlin,
Institut of Environmental Technology
Date: 1988-1990 Qualification: Abitur (general qualification for university entrance) Highschool: Volkshochschule Berlin-Mitte
Volkshochschule Rostock (adult evening classes)
Date: 1986-1988 Qualification: Certificate of apprenticeship as a photographer
Employment history
Date: since October 2008 Occupation: scientific assistant Employer: University Koblenz-Landau, Institute of Environmental
Sciences, Department of Environmental and Soil Chemistry Date: September 2006 - September 2008 Occupation: scientific assistant Employer: University Koblenz-Landau, Institute of Natural Sciences,
Department of Organic and Environmental Chemistry Date: May 2004 - July 2006 Occupation: scientific assistant Activity: DFG research project Interurban II: subproject Humus Employer: TU-Berlin, Institut of Environmental Technology,
Department of Environmental Chemistry Date: June - July 2003 Occupation: Internship Employer: Leibnitz-Institute of Freshwater Ecology and Inland Fisheries Date: June 1999 - September 2003 Occupation: student research assistant Employer: TU-Berlin, Institute of Ecology, Department of Soil Science

8 Annex
111
8.5 Publications
Peer-reviewed:
Diehl, D., J.V. Bayer, S.K. Woche, R. Bryant, S.H. Doerr & G.E. Schaumann. (subm.). Reaction of soil water repellency on artificially induced changes in soil pH. Geoderma.
Diehl, D., R.H. Ellerbrock & G.E. Schaumann. (2009). Influence of drying conditions on wettability and DRIFT spectroscopic C-H band of soil samples. European Journal of Soil Science. 60, 557-566.
Diehl, D. & G.E. Schaumann. (2007). Wetting mechanism assessed from time dependent sessile drop shape. Hydrological Processes, 21, 2255 - 2265.
Oral presentations
Diehl, D., G.E. Schaumann, R.H. Ellerbrock. 2008. Drying state and wettability of soil samples assessed by DRIFT-Spectroscopy. Eurosoil Congress. August 2008 in Vienna, Austria.
Diehl, D., G.E. Schaumann, R.H. Ellerbrock. 2007a. Trocknungsmethoden und DRIFT-Spektroskopie in hydrophoben und benetzbaren Bodenproben urbaner Standorte. Jahrestagung der Deutschen Bodenkundlichen Gesellschaft. September 2007 in Dresden, Germany.
Langbein, J., D. Diehl, G.E. Schaumann. 2007b. Characterization of amphiphilic substances in wettable and non-wettable soil samples. Soil Science Society of America Bouyoucos Conference: On the Origin of Water Repellency in Soils. 29th April – 3rd May 2007, Sanibel Island, Florida, USA.
Diehl, D. & G.E. Schaumann. 2006a. Wetting mechanisms assessed from time dependent sessile drop shape. International Conference Biohydrology 2006: "Impact of biological factors on soil hydrology" September 2006 in Prague, Czech Republic.
Diehl, D. & G.E. Schaumann. 2006b. The nature of wetting by sessile drops on urban soil samples. Interurban II: „Water and Organic Matter in Anthropogenic soils: Dynamics and processes“: March 2006 in Berlin, Germany.
Poster presentations
Diehl, D. & G.E. Schaumann. 2006a. Zeitliche Änderung des Boden-Wasser-Kontaktwinkels im Verlaufe der Benetzung. 11. Annual Meeting of the Society of Environmental Toxicology and Chemistry - German-Language-Branch e.V. (SETAC-GLB). September 2006 in Landau (Pfalz), Germany.
Diehl, D. & G.E. Schaumann. 2006b. Water repellency, kinetics and nature of wetting in urban soil samples. IV International Conference Interfaces Against Pollution, IAP’2006, June 2006 in Granada, Spain.
Diehl, D. & G.E. Schaumann. 2005a. Zeitliche Änderung des Boden-Wasser-Kontaktwinkels im Verlaufe der Benetzung. DBG-Jahrestagung. September 2005 in Marburg, Germany.
Diehl, D. & G.E. Schaumann. 2005b. Wetting kinetics determined from contact angle measurement. EGU 2005 – Annual Meeting of the European Geophysical Union. April 2005 in Vienna, Austria.