Embed Size (px)
Citation preview

The role of the Business Register
in a changing environment at Statistics Netherlands
Beijing, 2004, session 2 Nico Heerschap

Old / current situation - changing environment
Ideal situation
Strategy for the short and medium term
The role of the Business Register
25 min.
2/14Content:

Organisation of SN:
Business statistics (BES)
Social statistics (SRS)
Macro economic statistics (MSP)
Technology and facilities (TNF)
Two distant locations

Types of statistics in the Division of Business Statistics:
Production (mainly for NA)
Short term (mainly turnover)
Investments
International trade
Thematical
Energy, Technology, Environment, Health, Agriculture,
Transport, Crime, Culture, Tourism
Business Register / Baseline

ESB
Input
Throughput
Output
Statistic 1 Statistic 2 Statistic 3 Statistic x
Product view
BR
CR3CR2
CR1 CRx
Old situation:

Changing environment:
Changing needs of customers: more integrated, coherent and quicker. New theme’s emerge
Growing competition in the market place
Pressure to reduce the survey burden on enterprises
Smaller budget: pressure to be more efficient: less staff but same or more output
New developments in IT and methodology
ESB
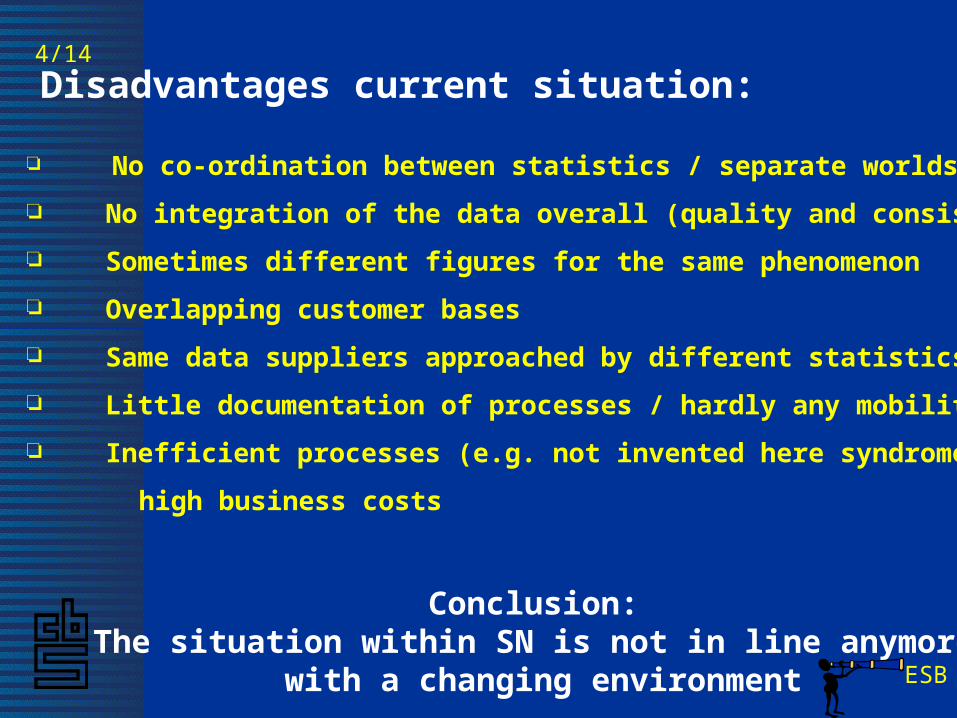
Disadvantages current situation:
No co-ordination between statistics / separate worlds
No integration of the data overall (quality and consistency)
Sometimes different figures for the same phenomenon
Overlapping customer bases
Same data suppliers approached by different statistics
Little documentation of processes / hardly any mobility
Inefficient processes (e.g. not invented here syndrome) /
high business costs
4/14
Conclusion: The situation within SN is not in line anymore
with a changing environment ESB
ESB
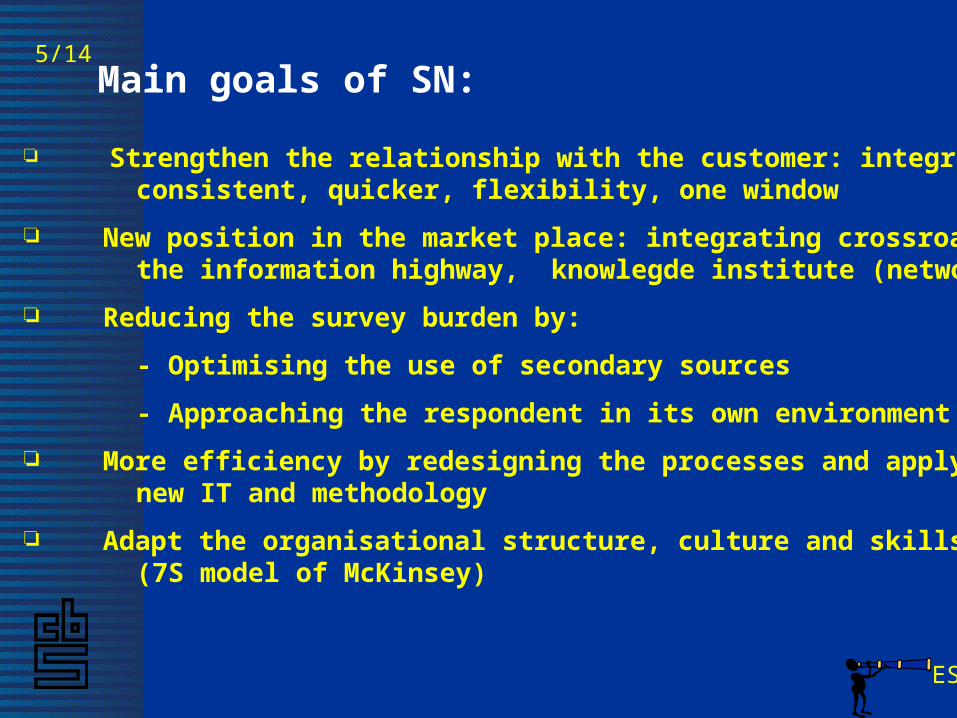
Main goals of SN:5/14
Strengthen the relationship with the customer: integrated, consistent, quicker, flexibility, one window
New position in the market place: integrating crossroad on the information highway, knowlegde institute (networks)
Reducing the survey burden by:
- Optimising the use of secondary sources
- Approaching the respondent in its own environment
More efficiency by redesigning the processes and applying new IT and methodology
Adapt the organisational structure, culture and skills (7S model of McKinsey)

In business terms:
• better and quicker output • lower input costs (SN / Enterprises) • and lower process costs (higher productivity)
Meaning:
• another way of making statistics • with less but more professional staff
ESB

ENTERPRISES
burden
Unanswered Survey needs
Old situation
CUSTOMERS
A
B
burden
UnansweredSurvey
needs
Desired situationENTERPRISES
CUSTOMERS
AB

Input
Throughput
Output
Theme 1 Theme 2 Theme 3 Theme x
One window for data dissemination services
One window for data-collection services
Merge
Merge
Merge
Merge
ESB

Throughput
Output
Input
One window for all data-collection
All input, primary and secondary
CBR
BACKBONES
Making of data-marts (selection, aggregation etc.)
Internal analists
Information development
Coupling data to the
backbone(s)
Transfer data toData warehouse
Data warehouse
Transactional dbase
Datarepository
Checking, editing and micro-inte-
gration
One window for all output services
Customers / data-users
Output forcustomer
L
L
L
WORK FLOW
MANAGEMENT
ESB
ExternalSBR
Output driven process
Data production factory
Knowledge institute- (integrated) publication- information development- customer base
META
DATA
SYSTEM

(1) B A C K B O N E S(BR)
(2) VARIABLES
(3) TIME
Survey-data
Survey-data
Survey-data
7/14
Administrative sources
Administrative sourcesAdministra-tive sources
Dimensions of the data repository:
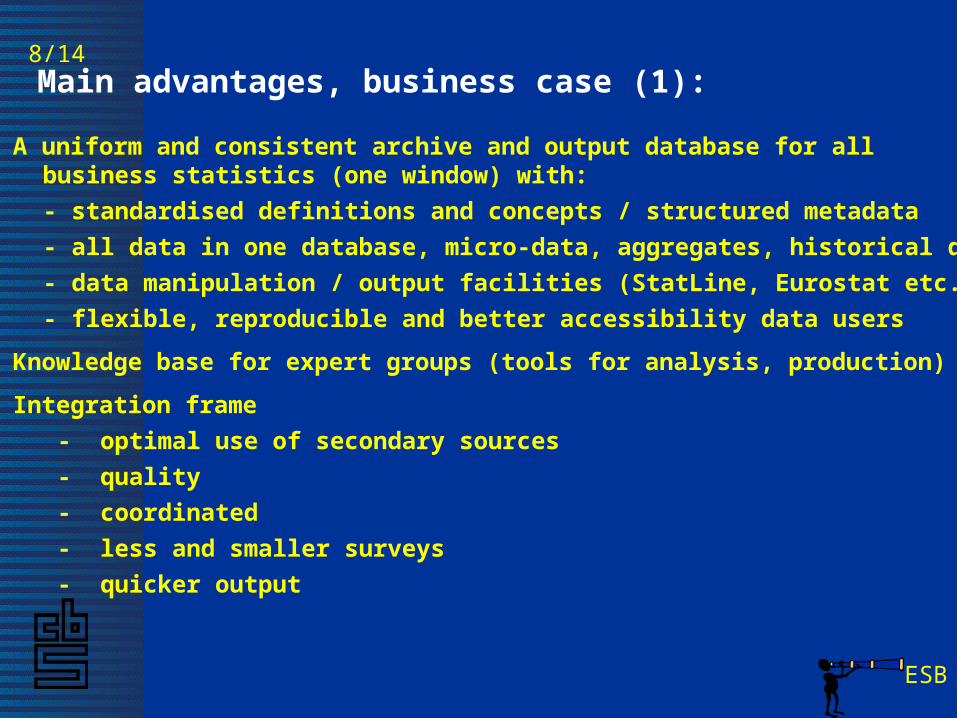
8/14Main advantages, business case (1):
A uniform and consistent archive and output database for all business statistics (one window) with:
- standardised definitions and concepts / structured metadata
- all data in one database, micro-data, aggregates, historical data
- data manipulation / output facilities (StatLine, Eurostat etc.)
- flexible, reproducible and better accessibility data users
Knowledge base for expert groups (tools for analysis, production)
Integration frame
- optimal use of secondary sources
- quality
- coordinated
- less and smaller surveys
- quicker output
ESB

8/14Main advantages, business case (2):
ESB
Tool for analysis:
- longitudinal research
- timeseries
- follow big enterprises or a panel of enterprises
- consistency micro-data and corresponding aggregates
Documented
Basis for an output driven process
In line with organisational developments (hybrid organisation)
Reduced survey burden
Customer database
Efficient process (in potentie groot, lange en korte termijn)
- IT / methodology
- Organisational

Little experience with integration / very complex process of checking, editing, imputation and micro-integration
No coordinated backbones
Still limited use of administrative sources
No centralised meta-data systems
No real experience with consistent weighing of data-marts
Controle of data disclosure
No experience with new technologies like dataware houses
Is it possible to control the total process?
Already made investments in short term process improve- ments (input driven) / quick results
10/14
Bottlenecks:

A step-by-step approach
gaining insight
optimal situation as point on the horizon
using already existing improvement projects as the starting point
no cathedral building avoided.
Strategy for the short and medium term:
Strategy
one centralised BR for (the maintenance of ) all backbones / populations (coordination)
one contact centre for all input activities (coordination)
as less production lines as possible
as much standardisation and generic tools and solutions as possible
one output data warehouse for all business statistics
the optimal use of administrative sources at the cost of surveys
one centralised metadata – infrastructure

ESB-Basis
Data repository layer
Data manipulation layer
Publication layer (incl. statistical disclosure control
Pro
cess
met
a sy
stem
Met
asys
tem
Approach companiesMulti-channel
Inst
itu
tion
al
stat
isti
cs
(Im
pec
t)
Approach regis-tration holders
Bas
elin
e(s
ecu
nd
air)
Fu
nct
ion
al
stat
isti
cs
Input layer
Clean (micro)data (meta)
Clean (micro)data (meta)
Clean (micro)data (meta)
Customers
Determine Statistical needs
Information development
Enterprises
Registrations
BR
StatisticalBackbones
SBR
Integration layer

The (changing?) role of the BR
Determination and derivation of statistical backbones / populations
Sampling and weighting frame for all business statistics
Matching frame (e.g. micro-integration)
The bridge between administrative and statistical data
A benchmark
Source for economic demography
Information source

Mainly a sampling frame
Existence of decentralised BRs
No overall coordination
Processing mainly within SN
No units of functional statistics
No metadata and quality indic.
Basis economic demography
Survey burden
Less accessible
Crucial role in coordination / unam- bigious backbones / no decentralised BRs
Matching frame. Integration
Information to follow businesses over time (longitidinal / transversal)
Attention bigger businesses
Regional aspects
A bridge between adminstrative and statistical data
Processing also outside SN (SBR)
Units functional statistics included
Metadata and quality indicators
User friendly access
Basis economic demography
Survey burden
Old situation Desired situation

Thank you for your attention
Open questions:
Timeliness of updates of the BR
Inclusion of functional statistics
The connection between BR and CPR