Embed Size (px)
Citation preview

The Pennsylvania State University
The Graduate School
College of the Liberal Arts
THE ROLE OF PROSOCIAL MOTIVES IN PREDICTING EMOTIONAL LABOR
STRATEGY AND SERVICE PERFORMANCE:
UNDERSTANDING THE ‘WHY’ AS WELL AS THE ‘HOW’
A Thesis in
Psychology
by
Sarina M. Maneotis
© 2011 Sarina M. Maneotis
Submitted in Partial Fulfillment of the Requirements
for the Degree ofMaster of Science
December 2011
The thesis of Sarina M. Maneotis was reviewed and approved* by the following:
Alicia A. GrandeyAssociate Professor of PsychologyThesis Advisor
James FarrProfessor of Psychology
Karen GasperAssociate Professor of Psychology
Melvin M. MarkProfessor of PsychologyHead of the Department of Psychology
*Signatures are on file in the Graduate School
ii

ABSTRACT
Positive employee displays, or ‘service with a smile,’ predict customer satisfaction.
Thus, it is important to understand how employees create such positive displays. One way of
understanding how employees create positive displays is through the use of emotional labor,
or emotion regulation done for a wage. Two strategies have been focused on in the literature;
surface acting (SA), or expression modification, and deep acting (DA), or feeling
modification. It is often found that DA relates positively to performance and SA has no
relationship. Self Determination Theory and Relational Job Design theory are drawn on to
posit that prosocial motives for work are an important individual difference to help increase
the field’s understanding of when DA and SA are used and when they predict service
performance. It was predicted that prosocial motives would be positively related to DA, and
unrelated to SA (hypothesis 1). It was also predicted that while DA would mediate an indirect
relationship between prosocial motives and rapport (hypothesis 2), prosocial motives would
moderate the negative relationship between SA and rapport (hypothesis 3). Using a field
sample of grocery store clerks to test the hypotheses, it was found that prosocial motives
were positively related to DA and were negatively related to SA. DA was found to be
unrelated to rapport, and thus did not mediate the relationship between prosocial motives and
rapport. Prosocial motives did not have a main effect on rapport. Finally, support was found
for an interaction between SA and prosocial motives when predicting rapport. When SA was
high, performance was nearly the same, regardless of motives. However, when SA was low,
those with high prosocial motives were found to be higher performers than those with low
prosocial motives. The findings suggest that one must either engage in SA or be prosocially
iii

motivated to perform well, but that there is no added benefit of having both. This supports
the notion that researchers need to understand why as well as how employees behave at work
to understand service performance.
iv

TABLE OF CONTENTSList of Tables . . . . . . . . . . . . . . . . . . . . . . . . . . . . . . . . . . . . . . . . . . . . . . . . . . . . . . . . . . . . . viList of Figures . . . . . . . . . . . . . . . . . . . . . . . . . . . . . . . . . . . . . . . . . . . . . . . . . . . . . . . . . . . . viiAcknowledgements . . . . . . . . . . . . . . . . . . . . . . . . . . . . . . . . . . . . . . . . . . . . . . . . . . . . . . . viii
Chapter 1. Introduction . . . . . . . . . . . . . . . . . . . . . . . . . . . . . . . . . . . . . . . . . . . . . . . . . . . . . . 1Prosocial motives . . . . . . . . . . . . . . . . . . . . . . . . . . . . . . . . . . . . . . . . . . . . . . . . . . . . . . . 3
How does prosocial motives influence EL strategy? . . . . . . . . . . . . . . . . . . . . . . . . . 7How do prosocial motives and EL together influence service performance? . . . . . . 9
Deep Acting . . . . . . . . . . . . . . . . . . . . . . . . . . . . . . . . . . . . . . . . . . . . . . . . . . . . . 11Surface Acting . . . . . . . . . . . . . . . . . . . . . . . . . . . . . . . . . . . . . . . . . . . . . . . . . . . 14
Chapter 2. Methods . . . . . . . . . . . . . . . . . . . . . . . . . . . . . . . . . . . . . . . . . . . . . . . . . . . . . . . . 17Participants and procedures . . . . . . . . . . . . . . . . . . . . . . . . . . . . . . . . . . . . . . . . . . . . . . 17Measures . . . . . . . . . . . . . . . . . . . . . . . . . . . . . . . . . . . . . . . . . . . . . . . . . . . . . . . . . . . . . 18
Emotional labor . . . . . . . . . . . . . . . . . . . . . . . . . . . . . . . . . . . . . . . . . . . . . . . . . . . . . 18Work motives . . . . . . . . . . . . . . . . . . . . . . . . . . . . . . . . . . . . . . . . . . . . . . . . . . . . . . 19Employee-customer rapport . . . . . . . . . . . . . . . . . . . . . . . . . . . . . . . . . . . . . . . . . . . 19Demographics and control variables . . . . . . . . . . . . . . . . . . . . . . . . . . . . . . . . . . . . . 20
Personality . . . . . . . . . . . . . . . . . . . . . . . . . . . . . . . . . . . . . . . . . . . . . . . . . . . . . . 21
Chapter 3. Results . . . . . . . . . . . . . . . . . . . . . . . . . . . . . . . . . . . . . . . . . . . . . . . . . . . . . . . . 23Confirmatory Factor Analysis . . . . . . . . . . . . . . . . . . . . . . . . . . . . . . . . . . . . . . . . . . . . 23Descriptive Statistics . . . . . . . . . . . . . . . . . . . . . . . . . . . . . . . . . . . . . . . . . . . . . . . . . . . 24Analytical Approach . . . . . . . . . . . . . . . . . . . . . . . . . . . . . . . . . . . . . . . . . . . . . . . . . . . 24Hypothesis testing . . . . . . . . . . . . . . . . . . . . . . . . . . . . . . . . . . . . . . . . . . . . . . . . . . . . . 26
Hypothesis 1 . . . . . . . . . . . . . . . . . . . . . . . . . . . . . . . . . . . . . . . . . . . . . . . . . . . . . . . 26Hypothesis 2 . . . . . . . . . . . . . . . . . . . . . . . . . . . . . . . . . . . . . . . . . . . . . . . . . . . . . . . 26Hypothesis 3 . . . . . . . . . . . . . . . . . . . . . . . . . . . . . . . . . . . . . . . . . . . . . . . . . . . . . . 28
Additional Analyses . . . . . . . . . . . . . . . . . . . . . . . . . . . . . . . . . . . . . . . . . . . . . . . . . . . . 29
Chapter 4. Discussion . . . . . . . . . . . . . . . . . . . . . . . . . . . . . . . . . . . . . . . . . . . . . . . . . . . . . . 37Predicting emotional labor strategy . . . . . . . . . . . . . . . . . . . . . . . . . . . . . . . . . . . . . . . . 37Service performance: Employee-customer rapport . . . . . . . . . . . . . . . . . . . . . . . . . . . . 40Limitations and strengths . . . . . . . . . . . . . . . . . . . . . . . . . . . . . . . . . . . . . . . . . . . . . . . . 44Future Directions . . . . . . . . . . . . . . . . . . . . . . . . . . . . . . . . . . . . . . . . . . . . . . . . . . . . . . 46Practical Implications . . . . . . . . . . . . . . . . . . . . . . . . . . . . . . . . . . . . . . . . . . . . . . . . . . . 47Conclusion . . . . . . . . . . . . . . . . . . . . . . . . . . . . . . . . . . . . . . . . . . . . . . . . . . . . . . . . . . . 48
References . . . . . . . . . . . . . . . . . . . . . . . . . . . . . . . . . . . . . . . . . . . . . . . . . . . . . . . . . . . . . . 50Appendix . . . . . . . . . . . . . . . . . . . . . . . . . . . . . . . . . . . . . . . . . . . . . . . . . . . . . . . . . . . . . . . 60
v

LIST OF TABLES
Table 1. Means, Standard Deviations, and Correlations between Study Variables . . . . . . . . 31 Table 2. Variance Components and ICCs for Employe-customer Rapport . . . . . . . . . . . . . . 32Table 3. Regression Analysis Predicting Emotional Labor . . . . . . . . . . . . . . . . . . . . . . . . . 33 Table 4. HLM Results Predicting Supervisor-rated Rapport with Customers . . . . . . . . . . . 34
vi

LIST OF FIGURES
Figure 1. Diagram of hypothesis 2: Deep acting mediates the relationship between prosocial motives and rapport . . . . . . . . . . . . . . . . . . . . . . . . . . . . . . . . . . . . . . . . . . . . . 35
Figure 2. Prosocial motives as a moderator of the relationship between surface acting and rapport . . . . . . . . . . . . . . . . . . . . . . . . . . . . . . . . . . . . . . . . . . . . . . . . . . . . . . . . . . . 36
vii

ACKNOWLEDGEMENTS
I would like to express my deepest thanks and appreciation to everyone who has
helped me both directly and indirectly with my thesis. Of note, I would like to thank my
advisor, Alicia Grandey, whose help was integral not only to this project, but also to my
development as a researcher. Jim Farr and Karen Gasper also provided valuable input that
helped this project become better than I could have imagined it could be. I would also like to
thank my friends from both far and near for their support, ready ears, and open arms. Finally,
I would like to thank my parents who have never failed to be in my corner. I am forever
grateful for their unwavering encouragement.
viii

Chapter 1
INTRODUCTION
Service with a smile is expected in most organizations within the customer service
industry. As Hochshild (1983) points out, “the emotional style of offering the service is part
of the service itself” (p. 5). To this point, employee positive displays have been linked to
customer reactions and perceptions of service quality (Mattila & Enz, 2002; Pugh, 2001;
Tsai, 2001). One way that employees are able to provide service with a smile is through the
use of emotional labor (EL) strategies. Service workers utilize EL strategies, or self
management of feelings and emotional expressions, to wear the smile that is often called for
by their customers and organizations. However, not all employees use the same strategies,
and not all employees are equally effective in producing their smiles for ‘service with a
smile.’
Within the EL literature, two key strategies have been the focus of research; surface
acting (SA) and deep acting (DA) (Hochschild, 1983). The tactic of SA involves expression
modification, whereas DA aims to modify internal feelings; the appropriate expression then
follows from the corresponding feelings (Grandey, 2000). One employee may tend to use
DA to try to feel pleasant so as to display a genuine smile to customers, while another may
lean towards using SA to simply paste a fake smile on her face. Given that a recent meta-
analysis found that DA is positively related to emotional performance and customer
satisfaction and that SA is negatively related to these performance indicators (Hülsheger &
Schewe, 2011), it might be useful to be able to differentiate which employees will utilize
which strategy. As such, EL research has aimed to understand how individual differences are
1

associated with each strategy (Bono & Vey, 2007, Chi, Grandey, Diamond, & Krimmel,
2011; Judge, Woolf, & Hurst, 2009). For example, individuals who are extraverted,
agreeable, and conscientious are less likely to use SA as a strategy and more likely to use
DA (Diefendorff, Croyle, & Gosserand, 2005). Even further, individual differences can help
determine whether each EL strategy is related to performance; SA can lead to more extra-role
service behavior and financial gain (tips from customers) if the employee using SA is
extraverted (Chi et al.,2011). Therefore, individual differences can be used to differentially
predict which strategy an employee will be likely to use and whether it will be effective.
While personality traits begin to get at why one EL strategy is chosen over another,
more work-specific individual differences may be even more informational. Personality traits
are broad and predict general tendencies, rather than specific behaviors (Hogan, Hogan &
Roberts, 1996). It might be more useful to understand individual differences more specific to
work, such as worker motives, for example. The reason why an employee is working is likely
to impact the form of EL chosen and its effectiveness. Furthermore, though EL implies that
emotions are part of job performance, very few studies have assessed the link between EL
strategy and performance and those that have tend to be simulations or part time student
samples (Bono & Vey, 2007; Goldberg & Grandey; 2007) or populations that are not typical
customer service workers (Beal, Trougakos, Weiss, & Green, 2006; Grandey, 2003).
Thus, the aim of this research is to further understanding of how individual
differences can be used to predict performance in conjunction with EL strategy. By
examining the role of worker motives, empirical, and practical contributions to the EL
literature will be made. First, I draw on self determination theory (Gagne & Deci, 2005) to
2

propose that prosocial motives for working help explain which strategy is used and whether
or not EL is carried out effectively. Second, this study provides unique empirical evidence of
the EL and performance link by using a field study of adult grocery store workers and
supervisor-rated performance. Thus, this study will empirically expand the literature, which
has generally focused on lab studies. Third, this research contributes in a practical sense by
exploring how the reasons employees work are related to both EL strategy and service
performance. Such motives can be enhanced through human resource practices (e.g. reward
structure), thus this study also contributes to the application of psychology. Finally, directions
for future research will be made.
Prosocial Motives
Motives, or reasons, for working, vary amongst individuals (Ryan & Connell, 1989).
Though to some degree people work to collect a paycheck, they may also work in the
customer service field with the intent of helping others. One way of doing this is by engaging
in EL, to appear friendly and courteous when interacting with customers. However, by
definition EL is done for a wage (Hochschild, 1983), or, financial motives. Recently though,
qualitative research has indicated that customer service employees have prosocial motives for
working with others and managing emotions (Bolton & Boyd, 2003; Lewis, 2005).
Individuals working for prosocial reasons expend effort to benefit other people (Batson,
1987) and see their work as a means to the end of benefitting others (Grant, 2008).
Furthermore, service employees with prosocial motivation for working are “likely to invest
considerable time and energy in their assigned work” (Grant, 2007, p. 404). This begs the
question, does why one works impact how one works, or how well one works,?
3

The self-determination theory (SDT) framework proposes that indeed, not all motives
are created equal. SDT outlines that motives can vary on a continuum of internalization, from
entirely externally controlled motives to internally controlled, or autonomous motives
(Gagne & Deci, 2005). External motives are outcome focused. They drive people towards
desirable consequences (pay) and away from undesirable ones (punishment). Autonomous
motives, on the other hand, stem from enjoyment for the task in and of itself. Motives can
also fall in the middle, being neither completely regulated externally or autonomously. These
middle ground motives are initially derived from external sources, but become internalized
overtime. That is to say, a motive can come from an outside source (e.g., a supervisor, a
parent) but become internalized, but not fully integrated as one’s own (introjected) or, it can
become integrated as one’s own (identified; Ryan & Deci, 2000). As Ryan and Deci explain
it, “internalization refers to people’s ‘taking in’ a value or regulation, and integration refers
to the further transformation of that regulation into their own so that, subsequently, it will
emanate from their sense of self.” (p. 71). Introjected motives may drive behavior through
anticipated guilt or pride, whereas identified motives drive behavior due to a personal value
of the goal or task (Ryan & Deci, 2000).
It has been argued that prosocial motivation is one such type of middle ground motive
(Grant, 2008). Indeed, Gagne and Deci sound as though they are describing prosocial
motivation when they give this example or identified regulation:
“If nurses strongly value their patients’ comfort and health and understand the
importance of doing their share of the unpleasant tasks for the patients’ well-
being, the nurses would feel relatively autonomous while performing such
4

tasks (e.g., bathing patients), even though the activities are not intrinsically
interesting.” (p. 335)
As with bathing patients, EL might be a somewhat unpleasant task that prosocially
motivated employees engage in, with the belief that it will help them fulfill their
larger objective of helping others.
According to SDT, the more autonomous, or intrinsic, the motivation for working the
more effective work performance, psychological well-being, organizational commitment, and
job satisfaction (Gagne & Deci, 2005). It is argued that the reason more internalized motives
have positive outcomes is that they are better at satisfying three psychological needs;
competence, autonomy, and relatedness (Gagne & Deci, 2005). The satisfaction of these
needs fosters well-being, particularly interest, excitement and confidence, which in turn serve
as resources for performance, persistence and creativity (Ryan & Deci, 2000). Put in other
words, work that satisfies these three needs fosters a more autonomous motivation, which in
turn is related to positive outcomes (Gagne & Deci, 2005). Thus, SDT would support that
prosocial motives for working are more desirable than extrinsic, or financial motives, due to
its more autonomously regulated nature.
Prosocial motives, in particular, are of interest to the field of customer service for
several reasons. Generally speaking, in an interpersonal work context, helping others is part
of the job. In such a setting, it is clear how prosocial motives for working (i.e., motivation to
help others) are likely to help one perform well on the job. More specifically, those moved to
work in order to help others may be more likely to develop relationships with customers
(Gutek, Bhappu, Liao-Troth, Cherry, & 1999) to satisfy their own relational needs (Gagne &
5

Deci, 2005). They also should experience less burnout and better well-being than employees
who are less motivated by prosocial reasons (Sheldon, Ryan, Deci & Kasser, 2004) and
burnout is negatively associated with service performance (Low, Cravens, Grant, &
Moncrief, 2001).
Thus, prosocial motivation is thought to be important enough to performance that
recent job design theory has sought to find ways to mold jobs to appeal more to employees’
desire to help others (Grant, 2007). The theory of relational job design recognizes that
individuals vary in the extent to which they are motivated to help others, but that the desire to
do so can be increased by exposing employees to the individuals who benefit from their work
(Grant, 2007). Especially relevant to service work, Grant notes that “the motivation to make
a prosocial difference is an inherently relational phenomenon; interpersonal relationships
both cultivate and result from the motivation to make a prosocial difference” (p. 394).
Several studies have supported relational job design theory’s proposition that appealing to
employee’s prosocial motives increases job performance, persistence, and citizenship
behaviors (Grant, Campbell, Chen, Cottone, Lapedis, & Lee, 2007; Grant & Mayer, 2009;
Grant & Sonnetag, 2010; Grant & Sumanth, 2009; see Grant, 2011 for a summary). However,
a direct relationship between prosocial motivation and performance outcomes is usually not
found. Rather, other factors must be considered such as intrinsic motivation (Grant, 2008),
manager trustworthiness and task significance (Grant & Sumanth, 2009), or anticipation of
helping and proactive behavior (Grant, Parker, & Collins, 2009). An additional factor that has
yet to be considered is the way employees perform, or EL. I propose that employees who are
prosocially motivated may use more effective EL strategies to develop relationships when
6

interacting with customers and that the presence of prosocial motives may enhance the
effectiveness of other EL strategies.
How Does Prosocial Motivation Influence EL Strategy?
As pointed out earlier, the definition of EL, or emotion regulation for a wage, implies
financial motives are associated with EL. However, while customer service may be
motivated in part by financial outcomes, they may also have more prosocial motives for
choosing an occupation that places them so closely with the public. Consider that Rafaeli and
Sutton (1987) posit that there are different reasons for following organizationally set forth
display rules, or standards for appropriate expressions set forth by the organization
(Diefendorff & Richards, 2003) . “Good faith” emotion regulation occurs when “feeling rules
are internalized” (p.32); the employee truly wants to help others and so manages emotions in
a way that will enable that helping to occur most effectively. In contrast, employees may
follow organizational display rules, in ‘bad faith.’ Here, employees may not believe that
managing their emotions should be part of the job (Rafaeli & Sutton, 1987). “People who
fake in bad faith have not internalized feeling rules, they are likely to be poor employees
because they may comply with feeling rules only when monitored closely” (p. 32). Based on
Rafaeli and Sutton’s (1987) definitions, employees with stronger prosocial motives are more
likely to have a good faith approach to managing their emotions. Just as prosocial motives
are internalized motives, the good faith approach to EL internalizes organizational
expectations for emotion displays; both operate on the assumption of internalized values.
Beyond good faith and bad faith, EL strategies are often dichotomized into deep
acting (DA) and surface acting (SA). Recall that employees who engage in DA aim to
7
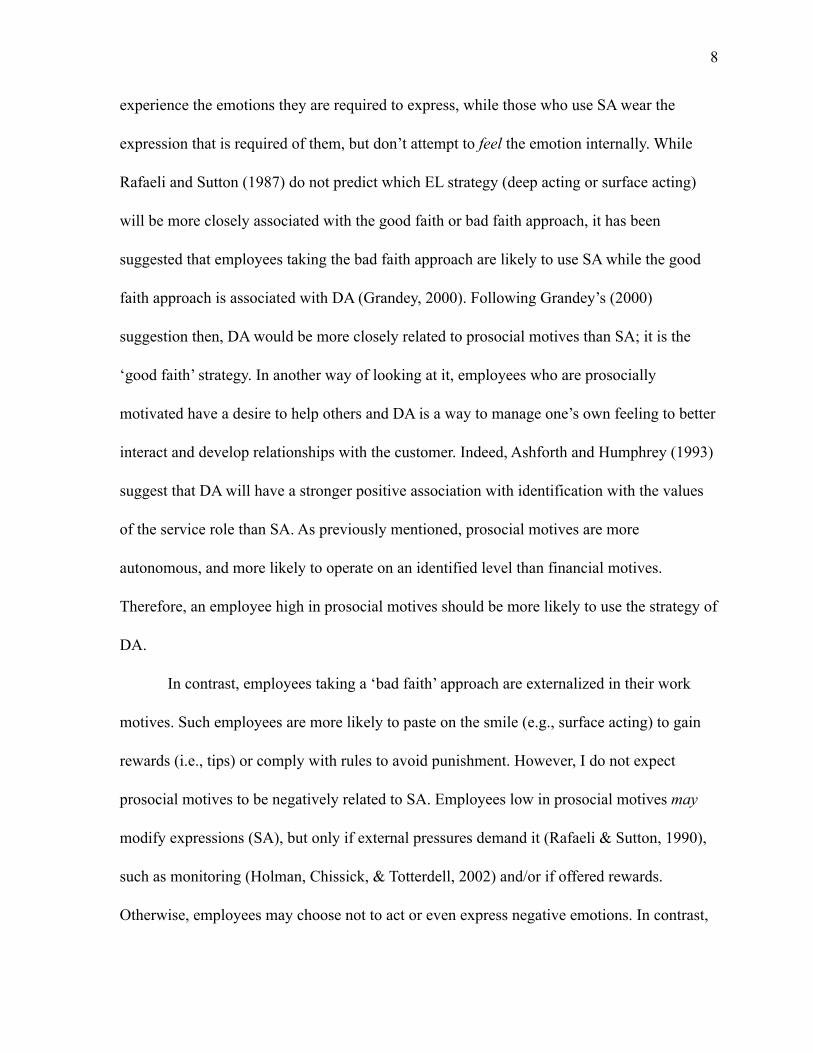
experience the emotions they are required to express, while those who use SA wear the
expression that is required of them, but don’t attempt to feel the emotion internally. While
Rafaeli and Sutton (1987) do not predict which EL strategy (deep acting or surface acting)
will be more closely associated with the good faith or bad faith approach, it has been
suggested that employees taking the bad faith approach are likely to use SA while the good
faith approach is associated with DA (Grandey, 2000). Following Grandey’s (2000)
suggestion then, DA would be more closely related to prosocial motives than SA; it is the
‘good faith’ strategy. In another way of looking at it, employees who are prosocially
motivated have a desire to help others and DA is a way to manage one’s own feeling to better
interact and develop relationships with the customer. Indeed, Ashforth and Humphrey (1993)
suggest that DA will have a stronger positive association with identification with the values
of the service role than SA. As previously mentioned, prosocial motives are more
autonomous, and more likely to operate on an identified level than financial motives.
Therefore, an employee high in prosocial motives should be more likely to use the strategy of
DA.
In contrast, employees taking a ‘bad faith’ approach are externalized in their work
motives. Such employees are more likely to paste on the smile (e.g., surface acting) to gain
rewards (i.e., tips) or comply with rules to avoid punishment. However, I do not expect
prosocial motives to be negatively related to SA. Employees low in prosocial motives may
modify expressions (SA), but only if external pressures demand it (Rafaeli & Sutton, 1990),
such as monitoring (Holman, Chissick, & Totterdell, 2002) and/or if offered rewards.
Otherwise, employees may choose not to act or even express negative emotions. In contrast,
8
employees high in prosocial motives may modify expressions (SA) since showing felt
emotions can go against the goal of helping others and results in lower self perceptions of
performance (Beal et al., 2006).
Supporting this rationale, Ashforth and Humphrey indicate that as a strategy, “surface acting
is consistent with either a strong or weak concern for one’s customers.” (1993, p. 93) As the
literature seems to indicate that prosocially motivated employees may use SA only under
certain conditions (i.e. moderators such as felt negative emotions), there is no clear reason for
a linear relation between prosocial motives and SA. Thus, I predict that prosocial motives
are positively associated with DA, and will not be associated with SA.
Hypothesis 1: Prosocial motives for work will be positively associated with
deep acting with customers; no association is expected with surface acting.
How do Prosocial Motives and EL Together Influence Service Performance?
After examining the manner in which motives predict how one works, I now move on
to examine how prosocial motives explain how well one works. Recall that SDT would
predict that prosocial motives for working, a moderately autonomous motive, would have a
positive relationship with performance. Recent research supports the relationship, but there
are often other conditions that must occur, such as the presence of task significance, for
positive relationship to emerge (Grant, 2008; Grant, et al., 2009; Grant & Sumanth, 2009). I
propose that EL strategy is one such factor that aids in explaining how prosocial motives are
related to performance. First though, I would like to briefly explain what I mean by
performance.
9

Organizational research that draws on SDT has examined job involvement,
supervisor-rated overall performance (Breaugh, 1985), effort, and goal attainment (Sheldon
& Elliot, 1998), while other recent research on fundraisers has looked at number of calls
made to donors and dollars earned (Grant, 2008; Grant & Sumanth, 2009) as well as overall
supervisor-rated performance (Grant, et al., 2009). Even though prosocial motivation by
definition is focused on helping others, these performance measures don’t necessarily capture
this. Placing several calls is different than building a relationship with customers. I believe a
measure that captures the interpersonal nature of interactions between employees and
customers is more appropriate than overall and objective measures for two reasons. First,
SDT posits that motives help fulfill needs, one of which is relatedness (Gagne & Deci, 2005).
If it’s true that individuals have needs for being close to others, it seems quality, not quantity,
of interpersonal interactions may be pertinent. Second, Grant (2008) himself writes, “The
motivation to make a prosocial difference is a timely topic, given that the importance of
relationships increasingly is being emphasized at work.” (p. 392). Therefore, I believe
interpersonal performance is an apt measure when discussing the impact of prosocial motives
on performance.
Within the field of customer service, there is often emphasis on building long lasting
service relationships with customers (Gutek, et al., 1999). The literature on building service
relationships often includes both emotions and motives. Within the service field, sympathy
and empathy have been positively associated with employee-customer relationships (see
Gremler & Gwinner, 2000 for a review). The social psychology literature indicates that
prosocial motives are linked to relationships (Rusbult & Van Lange, 2003).
10

As relationships do not develop between all employees and customers (Gutek, et al.,
1999), this study will explore the interpersonal performance dimension referred to as rapport.
As Gremler and Gwinner (2000) point out, while rapport is expected in service relationships,
it “may be established in a single service encounter between a customer and an employee
who previously have never interacted.” (p. 99). Rapport consists of two parts: customer
enjoyment of the interaction with a service provider, and a personal connection between
customer and employee and has been linked to customer satisfaction, loyalty intent and
word-of-mouth communication (Gremler & Gwinner, 2000). As my study is utilizing
supervisor-ratings of performance, I will focus on the personal connection with customers
aspect of rapport. While this has not typically been measured by supervisors in the past,
rapport has many nonverbal components, such as a directed gaze between individuals,
smiling, head nodding, body orientation and mirrored posture (Tickle-Degnen & Rosenthal.
1990). These components can be reliable rated by outside observers (LaFrance, & Broadbent,
1976). Further, since supervisors observe employees across multiple interactions with
customers, they are in a good position to infer the employee’s rapport with customers on
average, while a customer can only report on how that employee acts with him/her.
Deep Acting
Like prosocial motives, DA should be positively related to rapport based on theory
and prior research. EL theory predicts that DA is related to rapport because the emotional
expression produced by DA tends to be more genuine, or authentic, and is less emotionally
depleting, or exhausting, to employees who tend to use this strategy due to the social gains
from such a performance (Hülshelger et al., 2010). Authenticity matters to the customer;
11

inauthenticity undermines customer reactions to ‘service with a smile’ , even when other
aspects of performance are high (Grandey, Fisk Mattila, Jansen, & Sideman, 2005). Research
shows authenticity is positively related to customer positive affect and employee-customer
rapport (Hennig-Thurau, Groth, Paul, & Gremler, 2006) as well as customer satisfaction
(Grandey et al., 2005). Depletion on the other hand, occurs when finite self regulation
resources are drained (Baumeister, Vohs, & Tice, 2007). In lab studies, participants regulating
emotional expressions show more signs of depletion than those not regulating expressions,
resulting in lower cognitive performance (Richards & Gross, 1999). In regards to customer
service, work simulations show that the regulation required to deal with a negative customer
corresponds to lower self regulation performance on subsequent tasks (Zypher, Warren,
Landis, & Thoresen, 2007). Therefore, relating these findings to the outcome of interest,
rapport, if one is depleted by the self regulation that EL requires or an aggressive customer
earlier in the day, rapport with subsequent customers might suffer.
EL research supports both of these theoretical assumptions; DA is positively
associated with authenticity of emotional displays (Brotheridge & Lee, 2002; Groth, Hennig-
Thurau, & Walsh, 2009) and is unrelated to depletion or exhaustion (Bono & Vey , 2005;
Brotheridge & Grandey, 2002; Brotheridge & Lee, 2002; Liu, Prati, Perreew & Ferris, 2008).
Through these mechanisms DA should also be related to rapport; more genuine expressions
may help build relationships with customers, and a less depleted employee may be able to
focus more on building a personal connection. Prior research has linked DA to a similar
performance outcome, affective delivery, or, the extent to which employees treat customers
with courtesy and friendliness. Several individual studies have supported that DA is related to
12

affective delivery (Beal et al., 2006; Bono & Vey, 2007; Chi et al., 2011; Grandey, 2000;
Totterdell & Holman, 2003). A recent meta-analysis confirms that DA is positively related to
affective delivery, or emotional performance, and also indicates that it is positively associated
with customer satisfaction (Hülsheger & Schewe, 2011). However, many of these studies are
with students (Bono & Vey, 2007; Goldberg & Grandey, 2007), or depend on customer,
coworker, or self ratings (Grandey, 2003; Groth et al., 2009; Totterdell & Holman, 2003),
therefore it is important to expand the literature by examining supervisor ratings of rapport.
One reason is that supervisors see employees act with many customers and may be able to
better gauge how that employees perform on average, whereas customers generally only have
one interaction to rate on.
Though I expect both prosocial motives and DA to be positively related to rapport, I
do not believe their effects will be independent of one another. First, as reviewed above,
prosocial motives often do not have a direct link to performance measures. Second, as
motivation drives behavior, and DA is a behavioral strategy, I expect it to be a more proximal
predictor of rapport. In other words, prosocial work motives explain why an employee works,
but DA explains how employees go about working with employees, which should be more
related to how effective they are at building rapport with customers. Therefore, while
hypothesis 1 predicts that prosocial motives will be positively related to DA and I expect
prosocial motives to also positively predict rapport, I believe that the effect is indirect and
carried through by DA. Thus, it is predicted that there is an indirect relationship between
prosocial motives and service performance through DA:
Hypothesis 2: Deep acting with customers mediates the indirect relationship
between prosocial motives and employee-customer rapport.
13

Surface Acting
In contrast to deep acting, employees who are surface acting are faking their
emotional expressions, and thus SA is expected to be negatively related to authenticity.
Moreover, SA as an effortful form of self-regulation is positively related to depletion states
such as emotional exhaustion and burnout (Hülsheger et al., 2010). Research supports both
theoretical assumptions; SA is negatively related to perceived authenticity of displays
(Brotheridge & Lee, 2002), and positively related to depletion (Brotheridge & Grandey,
2002; Brotheridge & Lee, 2002; Martinez-Inigo, Totterdell, Alcover, & Holman 2007; Seery
& Corrigall, 2009). Given these two assumptions and sets of evidence, SA is typically
assumed to result in lower service performance. That is, employees who are more depleted
by their work and are less authentic in their interaction with customers receive lower
performance ratings (Grandey, 2003).
A recent meta-analysis also supports a negative relationship between SA and affective
delivery, or emotional performance, though this relationship is modest (ρ = -0.14 ;Hülsheger
& Schewe, 2011). This weak meta-analytic relationship is due to the fact that across a variety
of performance measures the relationship is null (Goldberg & Grandey, 2007; Gosserand &
Diefendorff, 2005; Groth et al., 2009; Hülshelger et al 2010; Totterdell & Holman, 2003), or
even positive. In fact, the relationship depends on the situation and individual differences for
how well one is able to fake their emotional expressions (Beal et al., 2006; Bono &Vey,
2007). For example, Chi and colleagues (2011) find that SA positively predicts affective
delivery and customer tipping behavior, an indicator of service effectiveness, but only for
extroverts. For introverts, the relationship is negative. Thus, it may be that engaging in SA is
14

effective performance for some people who can do it well (appear less inauthentic), or who
are less depleted by faking their expressions.
One reason that the relationship between SA and performance has been inconsistent is
that the mechanisms through which it is thought to operate can be overridden. One way is
through the depletion mechanism, though as discussed above, it may also be overridden by
some employees who are bettor actors than others. The literature on depletion indicates that it
can be overcome by humor, positive affect, cash incentives, implementation intentions
(if...then plans) or even social goals such as wanting to help others (Baumeister et al., 2007;
Muraven & Slessarava, 2003; Tice, Baumeister, Shmueli & Muraven, 2007). More
specifically, research has examined the impact of prosocial incentives on the negative
relationship between depletion of resources and self-regulation performance. In a lab study
(Muraven & Slessarava, 2003), when participants were provided with the incentive that their
self regulation can benefit others, they did not show the normal decline in self regulatory
performance that is traditionally observed in the ego depletion literature.
I would expect to see a similar effect on the performance measure of rapport, for
those employees who tend to use SA. In other words, prosocial motives may buffer against
the depletion mechanism by which SA is negatively related to performance; prosocially
motivated employees may override their impulse to conserve resources after exerting self-
regulatory efforts, thus better maintaining their performance over time compared to those
who lack this motive (Muraven, Shmueli, & Brukley, 2006).
When employees with low prosocial motives use SA, they may be less motivated to
override the resource depletion from SA, thus resulting in not only inauthentic expressions
15

but also reduced persistence in helping others. In contrast, an employee using SA who has
high prosocial motives may override depletion effects in order to help others. Therefore it is
predicted that the relationship between SA and performance will depend on the moderating
effect of prosocial motives.
Hypothesis 3: The relationship between surface acting and rapport is moderated
by prosocial motives for work, such that prosocial motives will buffer the
negative effect of surface acting on customer-employee rapport; when prosocial
motives are high, the relationship between surface acting and rapport will be null;
when prosocial motives are low, the relationship will be negative.
In summary, this study tests the predictions that prosocial motives positively predict
DA but not SA (hypothesis 1) and that DA mediates the indirect relationship between
prosocial motives and customer-employee rapport (hypothesis 2). It is further expected that
prosocial motives will moderate the relationship between SA and customer-employee
rapport, such that the relationship is positive when prosocial motives are high and null when
they are low (hypothesis 3).
16

Chapter 2
METHODS
Participants and Procedures
Participants were grocery store employees (N = 214) from 28 different store
locations. Grocery store clerks are an apt sample as they have been shown to use emotional
labor on a frequent basis in response to display demands from management (Rafaeli, 1989;
Tolich, 1993)
The employee sample was 71.5% female, 55.6% white, and had an average age of 32 years
(SD = 14). The employees worked in a variety of positions including department clerk (N =
83), cashier (N = 68), bakery (N = 37), or other positions (N = 26). The data were collected
by an external consulting firm as part of a concurrent validation study of a selection
assessment that measures non-cognitive individual attributes to predict customer service
behaviors. Employees completed scales measuring emotional labor strategies and work
motives. Store supervisors (N = 52) provided ratings of the employees’ customer service
behavior and effectiveness with customers. The supervisor sample was 59.0% female, 67.8%
white, and had an average age of 46 years (SD = 11). As multiple employees were rated by
the same supervisor (on average, about 4 employees per supervisor), and multiple supervisors
belonged to the same store (on average, about two supervisors per store), the data has a three-
level nested structure (employees in supervisors in stores), which I recognize in my multi-
level analytic approach.
It was communicated to all participants that the data were gathered for research, not
administrative decision purposes. Therefore responses are less likely to be inflated from
17

social desirability biases or conflated with organizational politics (Longnecker, Sims, &
Gioia, 1987). Participation in the study was voluntary and the data were collected online by a
third party vendor. Identifying information was only provided to join the employee survey
and supervisor-rated performance information, and participating organizations only received
aggregated and summarized results of the study. Assuring respondent anonymity is an
additional way to combat social desirability, as well as lenient and acquiescent response
styles (Podsakoff, MacKenzie, Lee, & Podsakoff, 2003). Additionally, prior to providing
performance ratings, supervisors completed a computer-based training module to orient them
to the rating process and educate them about ways to avoid common rating errors. Combined,
the rater training and administrative purpose of the study suggests more accuracy, less bias,
and more variance in the ratings (Levy & Williams, 2004). In addition, using a different
rating source for measuring criterion (performance) and predictors (EL and motives) is one
way to reduce common method variance (Podsakoff et al., 2003).
Measures
See Appendix A for EL and motives items. Table 1 shows means, standard deviations
and alpha coefficients for the measures discussed below.
Emotional labor. EL was measured using scales developed by Brotheridge and Lee
(2002) and modified by Grandey (2003). These scales are commonly used in the literature
(e.g. Bono & Vey; Groth et al, 2009; Hülshelger et al., 2010). A 7-point frequency scale (1 =
never, 7 = always) was completed by employees to assess how often they suppressed and
fake emotional expressions (SA, 4 items) and modified feelings (DA, 3 items). The SA scale
18

yielded a mean of 3.11 (SD = 1.35) and the DA scale had a mean of 4.75 (SD = 1.48). Both
scales had a good reliability ((both scales, α = 0.78).
Work motives. Four items from Grant’s (2008) adaption from Ryan and Connell’s
(1989) motivation scales were used. For prosocial motives, employees responded to four
items that answered the question “Why are you motivated to do your work?” As an example,
“Because I care about benefitting others through my work”. In addition, four items that
measured financial motives (“Because I need to support myself and my family”) were also
included as a control and avoid creating demand bias and to test for alternative predictors of
EL. These were also measured on a 7-point scale. However, unlike the EL items, the motives
items were anchored at agree and disagree (1 = disagree strongly, 7 = agree strongly). The
use of different response anchors is an additional step to reduce common method variance of
self-report data (Podsakoff et al., 2003). The prosocial motives scale had a mean of 5.80 (SD
= 1.23) and the financial motives scale was found to have a mean of 6.22 (SD = 1.15). Both
scales had good reliability (prosocial motives, α = 0.89; financial motives, α = 0.91).
Employee-customer Rapport. Supervisors completed service performance measures
developed by a consulting firm as part of a validation study. For the purposes of this study,
four performance ratings were used that captured my focus on rapport. Supervisors were
asked to rate from 1 (“consistently fails to meet minimum job requirements in this
performance area”) to 5 (“consistently performs above and beyond desired standards in this
performance area; frequently ‘goes the extra mile’”) how well the item described the target
employee’s performance. The items measured the ability of the employee to build
19

relationships, show concern, empathize with customers, and overall rapport effectiveness.
The items yielded a mean of 3.64 (SD = 0.96), and showed high reliability (α = 0.94).
Demographics and control variables. Both managers and employees reported their
demographic information, such as age, gender, ethnicity, tenure, and job title. Gender was
included as a control as it has been related to emotion regulation in previous studies
(Grandey, Fisk & Steiner, 2005; Goldberg & Grandey, 2007). Employee ethnicity was also
controlled for as it has been shown to impact performance scores (Roth, Huffcutt, & Bobko,
2003). Ethnicity was coded dichotomously as white or non-white. Further, as the ethnicity of
the sample was fairly diverse, a dummy variable was created for whether or not employee
ethnicity matched supervisor ethnicity, with code of 0 if ethnicity matched, and a code of 1 if
employee and supervisor ethnicity did not match. To determine if ethnicity match had an
impact on the outcome performance variables, a one-way ANOVA using rapport as an
outcome and employee-supervisor ethnicity match as a factor yielded marginally significant
differences (F = 2.65, p = 0.11). Thus, ethnicity match was controlled for in subsequent
analyses.
Tenure was also included because it is associated with increased performance ratings
(Quiñones, Ford, & Teachout,1995). Due to how the company coded employee tenure (i.e. a
categorical variable that, rather than a linear input of number of months) and the distribution
of tenure (71% of employees had worked in the company for more than one year), tenure was
coded as a dichotomous variable (less than one year = 0, more than one year = 1).
As the employees in the sample had several different job titles, it was explored
whether or not title should be controlled for in subsequent analyses. Though all of the
20

employees interact with customers, they may differ in the frequency of their interactions with
customers (as indicated by job description information on O*Net; O*NET Online, 2010). In
turn, the potential for difference in quantity of customer contact could influence both EL and
service performance ratings and thus create spurious relationships. A one-way ANOVA was
conducted using job title as a factor to determine if job title impacted ratings of rapport. It
was found that employee job title was a marginally significant source of variance (F = 1.94, p
< 0.10). Post hoc least significant differences comparisons test indicates that department
clerks had significantly lower scores than cashiers (p < 0.01) and bakery clerks (p < 0.05).
No other differences between job titles were found. Additionally, job title was found to have
no impact on SA (F = 0.47, p > 0.10) or DA (F = 1.56, p > 0.10). As a precaution, a dummy
variable was created which controlled for the job title of department clerk in subsequent
analyses (1= department clerk, 0=all other titles).
Personality. Since part of the aim of this paper is to explore individual difference
predictors of EL and customer service performance beyond personality, efforts were taken to
distinguish motives from personality. More specifically, agreeableness, which captures the
tendency to be friendly, courteous, flexible, and tolerant (Barrick & Mount, 1991), is thought
to be a more traitlike form of prosocial motives (Grant, 2008). In particular, the sub-
dimension of agreeableness, altruism, may be related to prosocial motives. Altruism is a
specific facet of the larger personality trait agreeableness and is meant to measure courtesy
and consideration, as well as concern for others (Costa, McCrae, & Dye, 1991). As such,
altruism was measured to help demonstrate the uniqueness of motives above and beyond
personality and will thus be controlled for in subsequent analyses. Seven items were
21

available in the data set were measured on a 0 (strongly disagree) to 3 (strongly agree) scale.
The items are proprietary, but as a sample, “you anticipate the needs of others at work.” The
mean for the scale was 2.23 (SD = 0.41) and had reasonable reliability (α = 0.72).
22

Chapter 3
RESULTS
Confirmatory Factor Analysis
The measurement model was tested using a Confirmatory Factor Analysis (CFA),
which was conducted to show the self report employee measures are distinct from one
another. This approach helps demonstrate that common method variance is not a substantial
threat to the study (Conway & Lance, 2010). As measured, the self report items should form
five scales: surface acting, deep acting, prosocial motives, financial motives, and altruism. I
started with a one factor model where all items loaded onto one self-report construct. I tested
this against a three factor model where EL items were grouped together, motive items were
grouped together, and altruism was its own construct. Change in the chi-square statistic
indicated that three factors better explained the data than one (Δχ2 = 225.42, Δdf = 3, p <
0.01). Similarly, the anticipated five factor model had better fit than the three factor model
(Δχ2 = 774.18, Δdf = 7, p < 0.01), supporting the use of five distinct scales.
Descriptive Statistics
Table 1 shows the bivariate correlations among the study variables. A positive
association was found between DA and prosocial motives (r = 0.36, p < 0.01), consistent
with hypothesis 1. In contrast to hypothesis 1, SA was negatively associated with prosocial
motives (r = -0.22, p < 0.01). DA and prosocial motives had a non-significant correlation
with rapport. Since these bivariate correlations don’t allow for the control of other variables,
hypothesis 1 will be formally tested with additional analyses.
-------------------------------
Insert table 1 about here
--------------------------------
23

Analytical Approach
According to Luke (2004), there are empirical, statistical and theoretical reasons to
consider using Hierarchical Linear Modeling (HLM) as an analytical approach. Statistically,
data that has lower-level observations nested within higher levels is said to be hierarchical
(Kreft & de Leeuw, 1998). Even if employees were assigned randomly to stores and
supervisors, the hierarchical nature of the data still cannot be ignored. Goldstein puts it well:
Once groupings are established, even if their establishment is effectively random,
they will tend to become differentiated, and this differentiation implies that the group
and its members both influence and are influenced by the group membership. To
ignore this relationship risks overlooking the importance of group effects, and may
also render invalid many of the traditional statistical analysis techniques used for
studying data relationships (1995, p. 12).
Thus, since employees were nested within supervisors, which were nested within
store location, each respondent cannot be treated as an independent source of data, providing
a statistical reason to use HLM in the analysis of the data. In other words, there is non-
independence in the data (e.g., based on rating biases, resources, store climate) that needs to
be accounted for in my analytic approach.
One recommended way to empirically determine if HLM is necessary is to calculate
the intraclass correlation coefficient (ICC), or the proportion of variance in the dependent
measure that is accounted for by higher levels (Luke, 2004), in this case supervisors and
stores. This method seeks to determine if each higher order level actually influences the first
level variables of focus.
24

First, empty, or null, models were created to obtain estimates of level 1, 2, and 3
variance components (σ2). The variance components were then used to calculate the ICCs
using a procedure outlined by Luke (2004). For level 2, the variance in performance
attributed to supervisors is divided by the sum of level 2 (supervisor) and level 1 variance. A
similar calculation was made for level 3 (stores). As can be seen in Table 2, 24.91% (χ2 =
47.93, d.f. = 23, p < 0.01) of the variance in employee-customer rapport could be attributed
to supervisors (Level 2). Next the variance attributed to stores (Level 3) was considered. For
rapport, 8.30% (χ2 = 36.17, d.f. = 27, p = 0.11) of the variance was attributable to stores. As
can be observed, the variance explained does not meet conventional standards of statistical
significance and in addition, it has been recommended that at least 12% of the variance in the
outcome of interest be attributed to an upper level to include said upper level in the model
(James, 1982). Even though store level variance explains less than 12% of the variance in
rapport, I chose to carry out my analyses in three-level HLM as planned to be conservative
since the data are nested and some of the variance can be attributed to store membership,
even if it is a small portion.
-------------------------------
Insert table 2 about here
--------------------------------
It should be briefly noted that hypothesis 1 does not make predictions regarding
performance. As all of the variables in hypothesis 1 are at the employee level, it is not
statistically necessary to use HLM to evaluate it; regression will be used instead. Adding
further evidence to this choice, level 2 accounts for a mere 0.03% of DA variance and level 3
25
accounts for 0.04%. Additionally, 0.18% of SA variance is accounted for by level 2, and
0.03% is accounted for by level 3. Thus, multiple linear regression was used for testing
hypothesis 1 and three-level HLM was used for hypotheses 2 and 3.
Hypothesis Testing
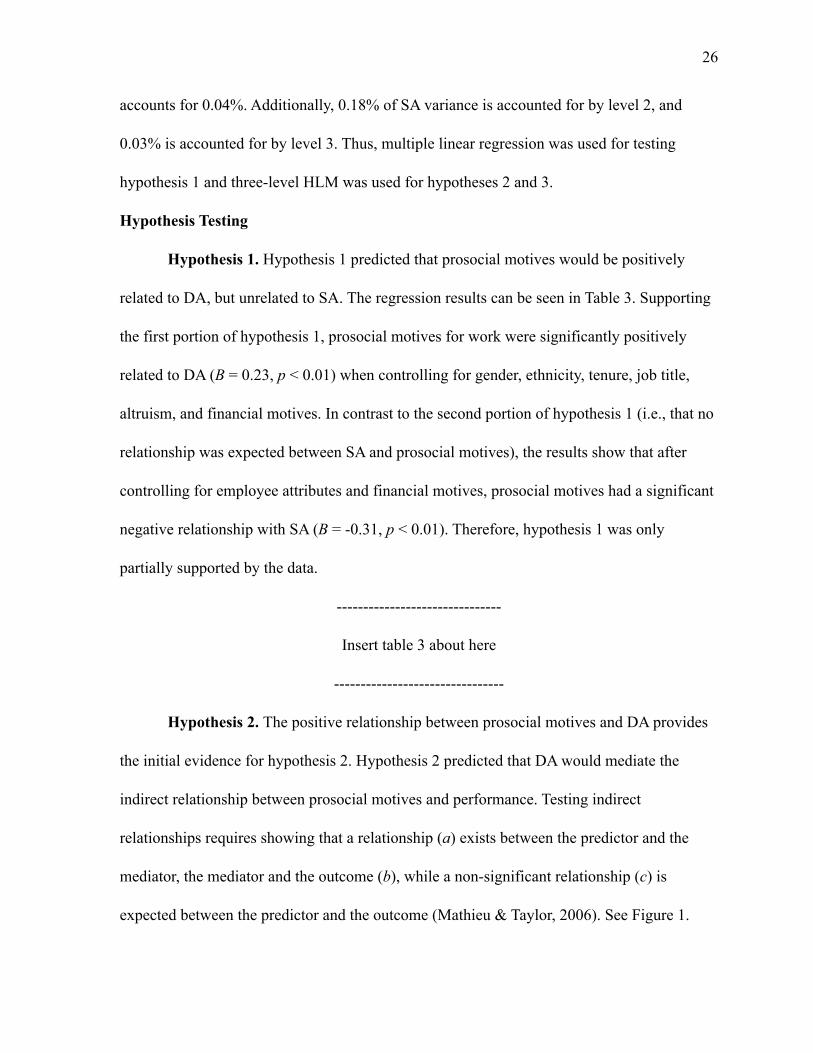
Hypothesis 1. Hypothesis 1 predicted that prosocial motives would be positively
related to DA, but unrelated to SA. The regression results can be seen in Table 3. Supporting
the first portion of hypothesis 1, prosocial motives for work were significantly positively
related to DA (B = 0.23, p < 0.01) when controlling for gender, ethnicity, tenure, job title,
altruism, and financial motives. In contrast to the second portion of hypothesis 1 (i.e., that no
relationship was expected between SA and prosocial motives), the results show that after
controlling for employee attributes and financial motives, prosocial motives had a significant
negative relationship with SA (B = -0.31, p < 0.01). Therefore, hypothesis 1 was only
partially supported by the data.
-------------------------------
Insert table 3 about here
--------------------------------
Hypothesis 2. The positive relationship between prosocial motives and DA provides
the initial evidence for hypothesis 2. Hypothesis 2 predicted that DA would mediate the
indirect relationship between prosocial motives and performance. Testing indirect
relationships requires showing that a relationship (a) exists between the predictor and the
mediator, the mediator and the outcome (b), while a non-significant relationship (c) is
expected between the predictor and the outcome (Mathieu & Taylor, 2006). See Figure 1.
26

-------------------------------
Insert figure 1 about here
--------------------------------
As such, I first sought to determine the nature of the relationship between prosocial
motives and DA. Recall that hypothesis 1 predicted and found support for this positive
relationship. Because hypothesis 2 includes employee-customer rapport as an outcome, and
therefore must be tested using HLM, I re-evaluated the effect of prosocial motives on DA in
HLM. Similar to the multiple regression results, prosocial motives had a positive and
statistically significant relationship to DA (γ = .23, p < 0.05). Thus, there is support for the
relationship between prosocial motives and DA.
Next, I used DA to predict employee-customer rapport. Using the control variables
mentioned previously, as well as controlling for motives, it was determined that DA did not
have a significantly positive relationship with employee-customer rapport (γ = 0.01, p =
0.82). See Table 4. As the relationship was not significant, I could not support continuing to
the next step, to determine if DA carries the relationship between prosocial motives and
performance. Thus, hypothesis 2 was unsupported.
-------------------------------
Insert table 4 about here
--------------------------------
Hypothesis 3. Hypothesis 3 predicted an interaction between prosocial motives and
SA when predicting performance outcomes. To test this hypothesis, I first created a null
model (no predictors) for each of the performance measures (model 0). Next I added my
27

control variables (job title, tenure, gender, ethnicity match, and altruism) as well as the EL
measures and motives (model 1). Finally, I added the interaction term to the model (model 2),
which was also allowed to vary by supervisor. For all variables, I allowed the level 1
intercept (average performance) to vary across supervisors and stores, while keeping the
slopes (effect of study variables) fixed. This procedure follows Luke’s (2004)
recommendations for fitting a model when one believes that the outcome variable differs by
level, but that the effects of individual level variables on said outcome do not. That is, due to
the nature of the data, I do not expect the effect of DA on performance to differ by supervisor
because DA is measured at the individual level (but see additional analyses). Finally,
following Kreft, de Leeuw, and Aiken’s (1995) recommendations, EL and motives measures
were centered around the grand mean. The interaction of SA and prosocial motives was
created using these centered variables, following Aiken and West’s (1991) suggestion.
The results can be seen in Table 4. The interaction was found to be significant in
predicting employee-customer rapport (γ = -0.09, p < 0.01). Providing further support for
model fit, or deviance, statistics show a better fit for model 2, which contains the interaction,
than model 1 (χ2 = 6.78(1), p < 0.01); a smaller deviance statistic indicates better model fit
(Luke, 2004).
To determine the nature of the interaction, methods outlined by Preacher, Curran, and
Bauer (2006) were used. First, the form of the interaction was plotted for employee-customer
rapport. Hypothesis 3 predicted a null relationship between SA and employee-customer
rapport for high prosocial motives and a negative relationship for low prosocial motives.
However, as Figure 2 shows, when prosocial motives are 1 SD below the mean, SA does not
28

appear to have a negative relationship with performance, but rather the slope trends toward
being positive. However, simple slopes analysis reveals that this relationship is not
significant (Z = 0.48, p = 0.63). More in accordance with hypothesis 3, the slope between SA
and employee-customer rapport when prosocial motives is 1 SD above the mean is also null
(Z = -0.27, p < 0.79).
-------------------------------
Insert figure 2 about here
--------------------------------
Additional Analyses. I explored other possible interactions to establish that the
significant interaction of SA and prosocial motives was not spurious. First, I explored the
interaction of SA and financial motives to determine if SA interacts with motives in general,
or just prosocial motives. The interaction was found to be nonsignificant (γ = -0.05, p =
0.31). Next, I explored the interaction of DA and prosocial motives to determine if prosocial
motives interacts with both EL strategies, instead of just SA. I found the interaction to also be
nonsignificant (γ = -0.03, p = 0.45). Finally, the interaction of altruism and SA was explored
to rule out the notion that SA may just interact with a general tendency to help others. Again,
the interaction was nonsignificant (γ = -0.06, p = 0.58). Overall, the nonsignificance of the
other interactions helps provide support for my focus on the interaction of SA and prosocial
motives in predicting employee-customer rapport.
In summary, hypothesis 1 was partially supported; prosocial motives was positively
related to DA as predicted, but was also negatively related to SA which did not support the
hypothesis. Hypothesis 2 was unsupported as DA was unrelated to employee performance.
29

Finally, prosocial motives moderated the relationship between SA and performance. It was
predicted that when prosocial motives were low, the relationship between SA and
performance would be negative, but high prosocial motives would buffer the effect and make
the relationship null. Instead, it was found that when prosocial motives were low, SA trended
towards having a positive relationship with performance; high prosocial motives yielded the
expected null relationship between SA and performance. Therefore, because the interaction
was of a different form than expected, hypothesis 3 could not be supported.
30

31

32

33

34

Figure 1. Diagram of hypothesis 2. Deep acting mediates the relationship between prosocial motives
and rapport.
35

Figure 2. Prosocial motives as a moderator of the relationship between surface acting and rapport.
36
2.0
2.5
3.0
3.5
4.0
Low SA High SA
Rap
port
Low prosocial motivesHigh prosocial motives

Chapter 4
DISCUSSION
The present study represents a first step in bringing together the research fields of
emotional labor and prosocial motivation. The data provided quantitative evidence
supporting past qualitative research (Bolton & Boyd, 2003; Lewis, 2005) demonstrating that
EL may be engaged in for reasons other than financial motives (Hochschild, 1983).
Supporting predictions made using a SDT (Gagne & Deci, 2005) approach to understanding
motives, prosocial motives were positively related to DA beyond financial motives.
However, in contrast to SDT, the fairly autonomous prosocial motivation was not related to
the performance measure of employee-customer rapport. Relational job design (Grant, 2007)
research usually does not find a direct relationship either (Grant, 2008; Grant, et al., 2009;
Grant & Sumanth, 2009), and instead finds effects of prosocial motives on performance only
when in conjunction with other variables. Accordingly, I predicted an indirect relationship
through DA, but also failed to find support for this relationship. Finally, evidence for an
interaction between SA and prosocial motives in predicting performance was found,
demonstrating the importance of understanding both how and why when predicting service
performance.
Predicting Emotional Labor Strategy
In support of the first hypothesis, prosocial motives for work were positively related
to DA. This is one of the few quantitative studies to examine motives for working and EL.
By definition, EL is emotion regulation for a wage. While I was not testing this specific
assumption, I did find that financial motives were positively predictive of DA (r = 0.21, p < .
37

01), but not SA (r = -0.04, p > .10). This in itself is somewhat interesting, given that only one
strategy of EL was related to financial motives, when in general, EL is supposed to be
engaged in for a wage. While this finding is unexpected, it may be due in part to the fact that
the grocery store employees do not work for tips. Perhaps in a food and beverage services
setting where financial gain is more salient would financial motives be more predictive of
SA.
Controlling for the expected effect of financial motives on EL, I expected that
prosocial motives would be an additional factor in employees’ choice of EL strategy. This
prediction was in part inspired by recent qualitative efforts to explore reasons for engaging in
EL (Bolton & Boyd, 2003; Lewis, 2005). It is also in accordance with SDT which outlines
that more autonomously regulated motives, such as prosocial motivation, have more positive
outcomes, such as performance, than externally regulated ones. Within the EL literature, DA
is generally looked at as the better of the two strategies for enacting display rules; it is
associated with less burnout and higher performance (Hülsheger & Schewe, 2011). SDT
research has shown that more autonomous motives correspond to better well-being and
performance than externally regulated motives. Thus, this study supports SDT in showing
that prosocial motives positively predict the more desirable form of EL, DA, and do so
beyond the effect of financial motives.
EL research by Rafaeli and Sutton (1987) discuss SA as a ‘bad faith’ method of
enacting display rules; one that allows the employee to comply outwardly, but not inwardly.
This would make it seem as though employees using SA may not be concerned with helping
others at all, or in terms of SDT, would not have autonomous motives for working. However,
38

Ashforth and Humphrey (1993) predict that SA may stem from either a weak or a strong
concern for customers. Thus, a negative relationship was not predicted between prosocial
motives and SA because I expected that while individuals low in prosocial motives may be
likely to use SA, occasionally those high in prosocial motives may have to use the strategy as
it would be better than showing authentic negative emotions (Beal et al., 2006). Therefore,
any relationship would be null as both high and low prosocially motivated individuals may
use SA as an emotion regulation strategy.
My findings confirm that those low in prosocial motives do in fact engage in SA,
but does not necessarily mean that individuals high in prosocial motives rarely SA. A
scatterplot of the data reveals that while those low in prosocial motives do tend to use a high
amount of SA, those high in prosocial motives use an average, not low, amount. Combined
with the lack of relationship between financial motives and the negative relationship between
prosocial motives and SA, this study might suggest that employees who use SA are not very
motivated. Perhaps those who use it have been depleted of their motivational resources, or
perhaps, it is a strategy that those already in a depletion state from other causes must resort
to. More negatively, perhaps these employees are not motivated and engaged in the first
place; they may choose not to use SA as a means to avoid being reprimanded by their
supervisor.
Another explanation is that those low in prosocial motives engaged in relatively high
amounts of SA because they were being monitored. In fact, supervisors reported observing
their employees for an average or 17.5 hours (SD = 9.82) a week. This corresponds to about
half of the hours a full time employee is at work. This supports prior research that indicates
39

EL may be done when external pressures are high (Rafaeli & Sutton, 1990) or when
employees are monitored (Holman et al., 2002).
Service Performance: Employee-customer Rapport
This study explored the performance variable of employee-customer rapport. Rapport
was included as an outcome in this study to extend prosocial motives and SDT research. To
my knowledge, SDT researchers have not conducted research within the customer service
realm where interacting with people is a key component of the job. While the relational job
design theory literature often does use customer service samples, the performance measured
tends to be objective (number of calls made to donors) and does not focus on the quality of
interactions with customers as this study does. SDT research predicts that more autonomous
motives, such as prosocial motives (as argued by this paper), have stronger positive links
with performance outcomes (Gagne & Deci, 2005, Ryan & Connell, 1989). Relational job
design research also predicts this, but commonly does not find a direct link between prosocial
motives and performance measures (Grant, 2008; Grant, et al., 2009; Grant & Sumanth,
2009). Thus, it was hypothesized that prosocial motives would be indirectly related to rapport
since they are both concerned with helping others and that DA would be a means for
prosocially motivated individuals to build rapport with others; that is, DA would mediate the
indirect relationship.
Even though prosocial motives are positively associated with DA, neither were
related to supervisor-rated rapport with customers. This finding is somewhat less surprising
for prosocial motives, since it is often found to predict performance only when moderators
are considered (Grant, 2008; Grant, et al., 2009; Grant & Sumanth, 2009). What is more
40

surprising is that DA was not related to employee-customer rapport. Across several
individual studies, DA has been positively linked to service performance (Beal et al., 2006;
Bono & Vey, 2007; Grandey, 2003; Groth et al., 2009; Totterdell & Holman, 2003) and this
relationship is also found in a meta-analysis of EL research (Hülsheger & Schewe, 2011). In
fact, in that same meta-analysis it was stated that displaying genuine positive emotions
created by DA “elicits favorable reactions from customers, helps establish a strong customer
rapport and favors positive customer evaluations” (p. 367).
It may be that the performance measure used, employee-customer rapport, was not
specific enough to EL; perhaps a measure of affective delivery, as has often been looked at in
EL literature, would have proved to be related to the predictor variables. For example, my
employee-customer rapport items measured empathy and the ability to build relationships
with customers, while affective delivery items measure the degree to which the employee
appears polite, friendly, and warm. While these are all components of rapport (Tickle-Degnen
& Rosenthal, 1990), perhaps they lend themselves to being predicted by EL more easily as
they capture how well the employee is performing, not necessarily how effective that
performance is in creating interpersonal relationships with employees.
Perhaps another reason for the null finding is that employee-customer rapport was
rated by supervisors. As the above quote above points out, DA elicits positive reactions from
customers, not necessarily supervisors. This is not the only study to find that EL measures are
unrelated to supervisor-rated performance. Gosserand and Diefendorff (2005) also found a
null relationship when they explore supervisor-rated affective delivery as an outcome.
However, they found that positive affect is positively related to DA and to performance.
41

Additionally, Beal and colleagues (2006) have found that both DA and SA are related to
supervisor-rated affective delivery when employees report high negative affectivity. Together,
these studies suggest that affect maybe a key piece of information when understanding the
relationship between EL strategy and performance. Unfortunately, I did not have a measure
of affect to examine interactions between employee affect and strategy when predicting
employee-customer rapport. I encourage future research to examine the relationship between
these three variables.
An additional explanation for the lack of a relationship between DA and employee-
customer rapport is that supervisors may not recognize this more authentic EL strategy when
rating performance. Beal and colleagues (2006) suggest that this is because supervisors are
more interested in employees displaying a positive expression than they are in the
authenticity of the display. However, research has shown that grocery store supervisors do
care about their employees being genuinely friendly with customers (Tolich, 1993); perhaps
they are not always able to detect what is genuine or not. To my knowledge, there has not
been research on supervisor detection of EL strategy. However, Groth and colleagues (2009)
have found that customers can detect authenticity and that the correct detection of DA
positively predicts perceived quality of service. This is another promising line of research
that has the potential to help the field understand when EL strategy can be used to predict
performance.
While DA, SA and prosocial motives were not found to directly predict employee-
customer rapport, the interaction of prosocial motives and SA was a significant predictor of
rapport. This interaction was predicted because past research has shown that the relationship
42

between SA and performance measures depends on individual differences in ability (Chi et
al., 2011) or need (Beal et al., 2006), and that the relationship between prosocial motives and
performance can also depend on other factors (Grant, 2008; Grant et al., 2009; Grant &
Sumanth, 2009). Since SA tends to be an inauthentic (Brotheridge & Lee, 2002) and
depleting (Brotheridge & Grandey, 2002; Brotheridge & Lee, 2002; Martinez-Inigo, et al.,
2007; Seery & Corrigall, 2009) method of EL, it was predicted that SA would have a
negative relationship with rapport, but that prosocial motives may serve as a resource to
overcome depletion effects (Baumeister et al., 2007) and buffer the negative relationship.
However, it was found that high prosocial motives offered no performance increase
for those who used SA. Instead, the effect trended (but the slope was nonsignificant) in the
direction of SA being compensatory for low prosocial motives. Those who had low prosocial
motives for working and did not engage in SA were rated lowest on rapport with customers.
Those with high prosocial motives faired well in performance ratings, regardless of SA,
while low prosocial motives weren’t necessarily bad for performance, if the employee
engaged in SA. This suggests that employees need to be either prosocially motivated or
engage in SA to avoid low performance ratings. In this manner, SA may act as a sort of
impression management, or efforts to create an image held by a target audience (Bozeman &
Kacmar, 1997), to compensate for a lack of desire to help others. Impression management
has been linked to higher performance ratings, compared to those who do not use such tactics
at work (Wayne & Kacmar, 1991). Therefore, while the relationship was different than
expected, it does not go against the notion that both how one works, EL, and why, motives,
must be understood to predict performance. This is especially true if an employee is low in
43

one or the other. An employee who is low in SA may not necessarily be a low performer if s/
he is prosocially motivated. Similarly, an employee low in prosocial motives may not be a
low performer if s/he is engaging in SA.
That the effect is driven by the low end of SA helps facilitate understanding of what
exactly low faking of emotional expressions means. For those low in prosocial motivation,
infrequent SA may mean a lack of effort, revealing true ambivalent or negative emotions. As
SA is meant to mask true emotions (Ashforth & Humphrey, 1993), then low SA may mean
that these true emotions leak out, if one lacks the motivation to hide them. On the other hand,
for those who are highly motivated, low SA may simply mean that one does not have to fake
emotions. In this case, employees may not experience emotional dissonance, or incongruence
between felt and required emotions. The more emotional dissonance one experience, the
more EL s/he reports using (Morris & Feldman, 1997). Perhaps an individual high in
prosocial motives does not feel ambivalent or negatively because they have a desire to help
others (Batson, 1987) and thus do not need to engage in SA.
Limitations and Strengths
Efforts were taken to minimize weaknesses in the study, but not all limitations could
be avoided. Not all employees were required to complete the survey. It follows then that the
employees who completed the survey may differ in some way than those who did not. For
example, the employees who chose to comply may be more agreeable than those who did not
which would reduce the variability in the measures. The sample consisted of only grocery
store employees. While customer service is part of their job, the type of service and
interactions they have with employees is likely different than service employees in the
44

healthcare or restaurant fields. For example, the intimacy and duration of the interactions
may be somewhat less than is seen in other areas of customer service (Price, Arnould,
Tierney, 1995). Thus, EL may be somewhat less important for employee performance. In
addition, the employees in this sample do not work for tips, which has been an outcome
linked to EL in the past (Chi et al., 2011; Tidd & Lockard, 1978) and may affect whether EL
is related to performance. As such, generalizability should be extended to other areas of
customer service with caution especially in regards to the interaction of SA and prosocial
motives. As the nature of this relationship was different than expected, it should be replicated
in other research before being generalized to all service employees.
While there are several limitations in this study, it also has several merits. The first is
the use of supervisor rated performance data. As mentioned earlier, prior research supports
that customers can detect EL strategy (Groth et al., 2009), but no research has explored
whether supervisors make this distinction when rating performance. In general, there is
limited research within the field of EL that makes use of supervisor ratings of performance,
with a few exceptions (Beal et al., 2006; Gosserand & Diefendorff, 2005). Otherwise, the
ratings from customers, coworkers, the self, and even confederates in lab studies has been
relied upon (Bono & Vey, 2007; Goldberg & Grandey, 2007; Grandey, 2003; Groth et al.,
2009; Totterdell & Holman, 2003).
There are several reasons why using supervisors as raters is a strength of this study.
First, the supervisors were trained to rate performance before the undertaking of data
collection. Further, performance measures were collected for research purposes which can
minimize the inflation seen with performance for evaluation measurement (Longnecker et al.,
45

19987). The use of an outside rater helps ensure that the predictors of performance in this
study in are truly related to performance and not just an artifact of common method variance
(Podsakoff et al., 2003). In addition, supervisors spent on average 17.5 hours a week (SD =
9.82) with the employees they rated, giving supervisors opportunity to observe performance.
Further, the sample was collected in the field, using adult employees, the majority of whom
had over a year’s experience in their current position. This addresses the concern that may
exist as to the generalizability of lab research with student samples to adult work populations
(Pedhazur & Schmelkin, 1991).
Future Directions
First and foremost, research findings should be replicated with other samples and
raters. One recommendation would be using customers as raters of performance as it has
been established that customer detection of EL strategies has implications for the customer’s
ratings of performance and return intentions (Groth et al., 2009). Longer term outcomes, such
as customer loyalty, should also be researched. This study found that prosocial motivation did
not predict employee rapport with customers; might it relate positively to customer intentions
to return to the store? For example, prior research has found positive displays to be linked to
longer term customer outcomes, such as willingness to return to the store or recommend the
store, but not to immediate reactions, such as purchase intentions (Tsai, 2001). In addition,
other employee outcomes should be considered; does having prosocial motives for working
help customer service to be less stressful for employees? Might it make them more satisfied
with their work, especially as contact with customers increases?
46

Furthermore, the mechanism for which prosocial motives moderate the effect of SA
on performance should be explored. The literature suggests that SA is inauthentic and more
depleting and therefore should have a negative relationship with performance (Hülshelger et
al., 2010). However, this study did not find a negative relationship and the form of the
interaction even suggests that for employees low in prosocial motives, SA can be a positive
predictor of employee-customer rapport. Future research should use other variables to
examine when SA can compensate for employee attributes such as low prosocial motives
(found here, or negative affect; Beal et al., 2006).
I did not measure authenticity or burnout, but speculated that the reason prosocial
motives may buffer the effect of SA on performance was that they would restore resources,
or minimize resource loss. This did not seem to be the case as high prosocial motives added
no performance benefit to those who tended to use SA. However, might these motives have a
more buffering effect on burnout instead? The depletion literature would suggest so
(Muraven & Slessareva, 2003).
Practical Implications
In addition to expanding the academic literature, this study broadens the tools
available to the practice of psychology. First, as it was found that prosocial motives were
predictive of EL strategy, managers may wish to use prosocial motives measures a part of
their personnel selection system. Recall that prosocial motives predicted the more desirable
strategy of DA. However, because those who were low in prosocial motives were able to still
maintain good levels of supervisor-rated rapport when using the EL strategy of SA,
employees who are low in prosocial motives may just need training for using this strategy to
47

still be competent customer service personnel. I recommend training for SA with hesitance
however as this strategy is often linked to health consequences such as stress and burnout
(Brotheridge & Grandey, 2002; Brotheridge & Lee, 2002; Martinez-Inigo, et al., 2007; Seery
& Corrigall, 2009).
This research also sheds light on motivation strategies for service managers. As I
found that service employees are motivated by reasons other than financial ones, managers
may try to emphasize the positive impact their employees can have on their customers.
Making salient the positive impact that employees have on customers and clients has been
shown to be an effective way to not only motivate employees, but help them feel more
satisfied with their work (Grant, 2011). I feel more confident recommending this strategy
since research has shown managers can increase employees prosocial motives (Grant,
Campbell, Chen, Cottone, Lapedis & Lee, 2007) and I see this as being less detrimental to
employee health (Grant & Campbell, 2007; Grant and Sonnentag, 2010) than training for SA.
Conclusion
This expanded emotional labor research by demonstrating that emotional labor can be
engaged in for reasons other than a wage. Prosocial motives positively predicted the strategy
of deep acting and were negatively related to surface acting. Self determination theory and
relational job design theories were used to predict that prosocial motives, an moderately
autonomously regulated motive, would positively predict rapport, through the emotional
labor strategy of deep acting. This finding was unsupported as deep acting did not positively
predict rapport. In rapport with customers, it was found, however, that the predicted
interaction of prosocial motives with surface acting was significant. Though the form of this
48

interaction was different than expected, it demonstrates the predicted importance of
understanding both how and why when predicting service performance. Evidence supports
that surface acting can be beneficial when performed by employees low in prosocial motives,
who may lack the ‘natural’ emotions with customers.
49

REFERENCES
Aiken, L. S. & S. G. West (1991), Multiple Regression: Testing and Interpreting
Interactions. Newbury Park, CA: Sage Publications.
Ashforth, B. E., & Humphrey, R. H. (1993). Emotional labor in service roles: the influence of
identity. Academy of Management Review, 18, 88-115.
Barrick, M. R., & Mount, M. K. (1991). The big five personality dimensions and job
performance: A meta-analysis. Personnel Psychology, 44, 1-26.
Batson, C. D. (1987). Prosocial motivation: Is it ever truly altruistic. In L. Berkowitz (Ed.),
Advances in experimental social psychology (Vol. 20, pp. 65-122). New York: Academic
Press.
Baumeister, R. F., Vohs, K. D., & Tice, D. M. (2007). The strength model of self-control.
Psychological Science, 16, 351-355.
Beal, D. J., Trougakos, J. P., Weiss, H. M., & Green, S. G. (2006). Episodic processes in
emotional labor: Perceptions of affective delivery and regulation strategies. Journal of
Applied Psychology, 91, 1053–1065.
Bolton, S., & Boyd, C. (2003). Trolley dolly or skilled emotion manager? Moving on from
Hochschild's Managed Heart. Work, Employment and Society, 17(2), 289-308.
Bono, J. E., & Vey, M. A. (2005). Toward understanding emotional management at work: A
quantitative review of emotional labor research. In C. E. J. Hartel, W. J. Zerb & N. M.
Ashkanasy (Eds.), Emotions in organizational behavior. NJ: Lawrence Erlbaum.
Bono, J. E., & Vey, M. A. (2007). Personality and emotional performance: Extraversion,
neuroticism, and self-monitoring. Journal of Occupational Health Psychology, 12, 177–
50

192.
Bozeman, D. P. & Kacmar, K. M. (1997). A cybernetic model of impression management
processes in organizations. Organizational Behavior and Human Decision Process, 69,
9-30.
Breaugh, J. A. (1985). The measurement of work autonomy. Human Relations 38, 551-570.
Brotheridge, C. M. & Grandey, A. A. (2002). Emotional labor and burnout: Comparing two
perspectives of “people work”. Journal of Vocational Behavior, 60, 17-39.
Brotheridge, C. M. & Lee, R. T. (2002). Testing a conservation or resources model of the
dynamics of emotional labor. Journal of Occupational Health Psychology 7(1),
67-67.
Chi, N. W., Grandey, A. A., Diamond, J. A., & Krimmel, K. R. (in press). Want a Tip?
Service performance as a function of emotional regulation and extraversion. Journal of
Applied Psychology.
Conway, J. M., & Lance, C. E. (2010). What reviewers should expect from authors regarding
common method bias in organizational research. Journal of Business and Psychology,
25, 325-334.
Costa, P. T., McCrae, R. R., & Dye, D. A. (1991). Facet scales for agreeableness and
conscientiousness: A revision of the NEO personality inventory. Personality and
Individual Differences, 12, 887-898.
Diefendorff, J. M., & Richards, E. M. (2003). Antecedents and consequences of emotional
display rule perceptions. Journal of Applied Psychology, 88, 284-294.
Diefendorff, J. M., Croyle, M. H., & Gosserand, R. H. (2005). The dimensionality and
51

antecedents of emotional labor strategies. Journal of Vocational Behavior, 66, 339–357.
Gagne, M. & Deci. E. L. (2005). Self-determination theory and work motivation. Journal of
Organizational Behavior, 26, 331-362.
Goldberg, L., & Grandey, A. (2007). Display rules versus display autonomy: Emotion
regulation, emotional exhaustion, and task performance in a call center simulation.
Journal of Occupational Health Psychology, 12, 301–318.
Goldstein, H. (1995). Multilevel statistical models.
Gosserand, R. H., & Diefendorff, J. M. (2005). Emotional display rules and emotional labor:
The moderating role of commitment. Journal of Applied Psychology, 90, 1256–1264.
Grandey, A. A. (2000). Emotion regulation in workplace: a new way to conceptualize
emotional labor. Journal of Occupational Health Psychology, 5, 95–110.
Grandey, A. A. (2003). When “the show must go on”: Surface acting and deep acting as
determinants of emotional exhaustion and peer-rated service delivery. Academy of
Management Journal, 46, 86–96.
Grandey, A. A., Fisk, G. M., Mattila, A. S., Jansen, K. J., & Sideman, L. A. (2005). Is
“service with a smile” enough? Authenticity of positive displays during service
encounters. Organizational Behavior and Human Decision Processes, 96, 38–55.
Grandey, A. A., Fisk, G. M., & Steiner, D. D. (2005). Must “service with a smile” be
stressful? The moderating role of personal control for American and French
employees. Journal of Applied Psychology, 90(5), 893-904.
Grant, A. M. (2007). Relational job design and the motivation to make a prosocial difference.
Academy of Management Review, 32, 393-417.
52

Grant, A. M. (2008). Does intrinsic motivation fuel the prosocial fire? Motivational synergy
in predicting persistence, performance, and productivity. Journal of Applied
Psychology, 93, 48-58.
Grant, A. M. (2011). How customers can rally your troops. Harvard Business Review, June,
2011, 96-103.
Grant, A. M., Campbell, E. M., Chen, G., Cottone, K., Lapedis, D., & Lee, K. (2007). Impact
and the art of motivation maintenance: The effects of contact with beneficiaries on
persistence behavior. Organizational Behavior and Human Decision Processes, 103,
53-67.
Grant, A. M., & Meyer, D. M. (2009). Good soldiers and good actors: Prosocial and
impression management motives as interactive predictors of affiliative citizenship
behaviors. Journal of Applied Psychology, 94, 900-912.
Grant, A. M., Parker, S., & Collins, C. (2009). Getting credit for proactive behavior:
Supervisor reactions depend on what you value and how you feel. Personnel
Psychology, 62, 31-55.
Grant, A. M., & Sonnentag, S. (2010). Doing good buffers against feeling bad: Prosocial
impact compensates for negative task and self-evaluations. Organizational Behavior
and Human Decision Processes, 111, 13-22.
Grant, A. M., & Sumanth, J. J. (2009). Mission possible? The performance of prosocially
motivated employees depends on manager trustworthiness. Journal of Applied
Psychology, 94, 927-944.
53

Gremler, D. D., & Gwinner, K. P. (2000). Customer-employee rapport in service
relationships. Journal of Service Research, 3, 82-104.
Groth, M., Hennig-Thurau, T., & Walsh, G. (2009). Customer reactions to emotional labor:
The roles of employee acting strategies and customer detection accuracy. Academy of
Management Journal, 52, 958–974.
Gutek, B. A., Bhappu, A. D., Liao-Troth, M. A., Cherry, B. (1999). Distinguishing between
service relationships and encounters. Journal of Applied Psychology, 84, 218-233.
Hennig-Thurau, T., Groth, M., Paul, M., & Gremler, D. D. (2006). Are all smiles created
equal? How emotional contagion and emotional labor affect service relationships.
Journal of Marketing, 70, 58–73.
Hochschild, A. R. (1983). The managed heart: The commercialization of human feeling.
Berkeley: University of California Press.
Hogan, R., Hogan, J., & Roberts, B. W., (1996). Personality measurement and employment
decisions: Questions and answers. American Psychologist, 51I, 469-477.
Holman, D., Chissick, C., Tottderdell, P. (2002). The effects of performance monitoring on
emotional labor and well-being in call centers. Motivation and Emotion, 26, 57-81.
Hülshelger, U. R., Lang, J. W. B., & Maier. (2010). Emotional labor, strain, and performance:
Testing reciprocal relationships in a longitudinal panel study. Journal of Occupational
Healthy Psychology, 15, 505-521.
Hülshelger, U. R., & Schewe, A. F. (2011). On the costs and benefits of emotional labor: A
meta-analysis of three decades of research. Journal of Occupational Health Psychology,
16, 361-389.
54

James, L. R. (1982). Aggregation bias in estimates of perceptual agreement. Journal of
Applied Psychology, 67, 219–229.
Judge, T. A., Woolf, E. F., & Hurst, C. (2009). Is emotional labor more difficult for some than
for others? A multilevel, experience-sampling study. Personnel Psychology, 62, 57-88.
Kreft, I. G.G., & de Leeuw, J. (1998). Introducing multilevel modeling. Thousand Oaks,
California; Sage Publications.
Kreft, I. G. G., de Leeuw, J., & Aiken, L. S. (1995). The effect of different forms of centering
on hierarchical linear models. Multivariate Behavioral Research 30, 1-21.
LaFrance, M. & Broadbent, M. (1976). Group rapport: posture sharing as a noverbal
indicator. Group & Organizational Studies, 1, 328-333. L
Levy, P. E., & Williams, J. R. (2004). The social context of performance appraisal: A review
and framework for the future. Journal of Management 30, 881-905.
Lewis, P. (2005). Suppression or expression: an exploration of emotion management in a
special care baby unit. Work, employment and society, 19(3), 565-581.
Longnecker, C. O., Sims, H.P., & Gioia, D. A (1987). Behind the mask: The politics of
employee appraisal. Academy of Management Executive, 1, 183-193.
Low, G. S., Cravens, D. W., Grant, K., & Moncrief, W. C. (2001). Antecedents and
consequences of salesperson burnout. European Journal of Marketing, 35, 587-611.
Lui, Y., Prati, L. M., Perreew, P. L., & Ferris, G. R. (2008). The relationship between
emotional resources and emotional labor: An exploratory study. Journal of Applied
Social Psychology, 38(10), 2410-2439.
Luke, D. A. (2004). Multilevel modeling. Thousand Oaks, CA: Sage Publications.
55

Martinez-Inigo, D., Totterdell, P., Alcover, C. M., & Holman, D. (2007). Emotional labour
and emotional exhaustion: Interpersonal and intrapersonal mechanisms
Mathieu, J. E., & Taylor, S. R. (2006). Clarifying conditions and decision points for
mediational type inferences in organizational behavior. Journal of Organizational
Behavior, 27, 1031.
Mattila, A. S. & Enz, C. A. (2002). The role of emotions in service encounters. Journal of
Service Research, 4, 268-277.
Morris, J. A., & Feldman, D. C. (1997). Managing emotions in the workplace. Journal of
Managerial Issues, 9, 257-274.
Muraven, M., Shmueli, D., & Burkley, E. (2006). Conserving self-control strength. Journal
of Personality and Social Psychology, 91, 524-537.
Muraven, M., & Slessareva, E. (2003). Mechanisms of self-control failure: Motivation and
limited resources. Personality and Social Psychology Bulletin, 29(7), 894–906.
O*NET Online. (2010). Summary report for: 51-3011.00 - Bakers. In O*Net online.
Retrieved from http://www.onetonline.org/link/summary/51-3011.00
O*NET Online. (2010). Summary report for: 41-2011.00 - Cashiers. In O*Net online.
Retrieved from http://www.onetonline.org/link/summary/41-2011.00
O*NET Online. (2010). Summary report for: 43-5081.01 - Stock Clerks, Sales Floor. In
O*Net online. Retrieved from http://www.onetonline.org/link/summary/43-5081.01
Parasuraman, A., Berry, L. L., & Zeithaml, V. A. (1991). Refinement and reassessment of teh
SERVQUAL scale. Journal of Retailing, 67, 420-450.
56
Pedhazur, E. J., & Schmelkin L. P. (1991). Measurement, design and analysis: An integrated
approach. Hillsdale, NJ: Lawrense Erlbaum Associations Inc., Publishers.
Podsakoff, P. M., MacKenzie, S. B., Lee, J-Y., Podsakoff, N. P. (2003). Common method
biases in behavioral research: A critical review of the literature and recommended
remedies. Journal of Applied Psychology, 88, 879-903.
Preacher, K. J., Curran, P. J., & Bauer, D. J. (2006). Computational tools for probing
interaction effects in multiple linear regression, multilevel modeling, and latent curve
analysis. Journal of Educational and Behavioral Statistics, 31, 437-448.
Price, L. L., Arnould, E. J., & Tierney, P. (1995). Going to extremes: Managing service
encounters and assessing provider performance. Journal of Marketing, 59, 83-97.
Pugh, S. D. (2001). Service with a smile: emotional contagion in the service counter.
Academy of Management Journal, 44, 1018–1027.
Quiñones, M. A., Ford, J. K., & Teachout, M. S. (1995). The relationship between work
experience and job performance: A conceptual and meta-analytic review. Personnel
Psychology, 48, 887-910.
Rafaeli, A. (1989). When cashiers meet customers: An analysis of the role of supermarket
cashiers. Academy of Management Journal, 32, 245-273.
Rafaeli, A., & Sutton, R. I. (1987). Expression of emotion as part of the work role. Academy
of Management Review, 12, 23–37.
Rafaeli, A., & Sutton, R. I. (1990). Busy stores and demanding customers: How do they
affect the display of positive emotion? Academy of Management Journal, 33, 623-637.
Richards, J. M., & Gross, J. J. (1999). Composure at any cost? The cognitive consequences
57

of emotional suppression. Personality and Social Psychology Bulletin, 25, 1033-1044.
Roth, P. L., Huffcutt, A. I., Bobko, P. (2003). Ethnic group differences in measures of job
performance: A new meta-analysis. Journal of Applied Psychology, 88, 694-706.
Rusbult, C. E., Van Lange, P. A. M. (2003). Interdependence, interaction, and relationships.
Annual Review of Psychology, 54, 351-375.
Ryan, R. M., & Connell, J. P. (1989). Perceived locus of causality and internalization:
Examining reasons for acting in two domains. Journal of Personality and Social
Psychology, 57, 749-761.
Ryan, R. M. & Deci, E. L. (2000). Self-determination theory and the facilitation of intrinsic
motivation, social development, and well-being. American Psychologist, 55, 68-78.
Sheldon, K. M., & Elliot, A. J. (1998). Not all personal goals are personal: Comparing
autonomous and controlled reasons for goals as predictors of effort and attainment.
Personality and Social Psychology Bulletin, 24, 546-557.
Sheldon, K. M., Ryan, R. M., Deci, E. L., Kasser, T. (2004). The independent effects of goal
contents and motives on well-being: It’s both what you pursue and why you pursue it.
Personality and Social Psychology Bulletin, 30, 475-486.
Seery, B. L. & Corrigall, E. A. (2009). Emotional labor: Links to work attitudes and
emotional exhaustion. Journal of Managerial Psychology, 24(8), 797-813.
Tice, D. M., Baumeister, R. F., Shmueli, D., & Muraven, M. (2007). Restoring the self:
Positive affect helps improve self-regulation following ego depletion. Journal of
Experimental Social Psychology, 43, 379-384.
58

Tickle-Degnen, L. & Rosenthal, R. (1990). The nature of rapport and its nonverbal correlates.
Psychological Inquiry, 1, 285-293.
Tidd, K. L.k, & Lockard, J. S. (1978). Monetary significance of the affective smile: A case
for reciprocal altruism. Bulletin of the Pyschonomic Society, 11, 344-346.
Tolich, M. B. (1993). Alienating and liberating emotions at work: Supermarket clerks’
performance of customer service. Journal of Contemporary Ethnography, 22,
361-381.
Totterdell, P., & Holman, D. (2003). Emotion regulation in customer service roles: Testing a
model of emotional labor. Journal of Occupational Health Psychology, 8, 55–73.
Tsai, W. C. (2001). Determinants and consequences of employee displayed positive
emotions. Journal of Management, 27, 497-512.
Wayne, S. J., & Kacmar, K. M. (1991). The effects of impression management on the
performance appraisal process. Organizational Behavior and Human Decision
Processes, 48, 70-88.
Zyphur, M. J., Warren, C. R., Landis, R. S., & Thoresen, C. J. (2007). Self-regulation and
performance in high-fidelity simulations: An extension of ego-depletion research.
Human Performance, 20, 103-118.
59

Appendix
Items used for measuring emotional labor and motives
Deep acting - general (Brotheridge & Lee, 2002;Grandey, 2003; Grandey et al., 2004)How often do you do the following with customers during a typical work day?
Try to actually experience the emotions that I must show.Make an effort to actually feel the emotions that I need to display toward others.Work hard to feel the emotions that I need to show to others.
Surface Acting - faking (Grandey, 2003)How often do you do the following with customers during a typical work day?
Fake a good mood with customers.Just pretend to have the feelings I display with customers.Hide my true feelings when interacting with customers.Resist expressing my true feelings when interacting with customers.
Prosocial Motives (Grant, 2008)Please rate the extent to which the following answer the question “Why are you motivated to work?”
Because I care about benefiting others through my work.Because I want to help others through my work.Because I want to have a positive impact on others.Because it is important to me to do good for others through my work.
Financial Motives (Grant, 2008)Please rate the extent to which the following answer the question “Why are you motivated to work?”
Because I need to earn money.Because I need to pay my bills.Because I need to support myself and my family.Because I need the income.
60