Embed Size (px)
Citation preview
THE ROLE OF MANGANESE IN THE
ELECTROWINNING OF COPPER AND ZINC
THIS THESIS IS PRESENTED FOR THE DEGREE OF DOCTOR OF
PHILOSOPHY OF MURDOCH UNIVERSITY, WESTERN AUSTRALIA
BY
VENNY TJANDRAWAN
B.Sc. (Hons)
2010
I declare that this thesis is my own account of my research and contains as its main
content work that has not previously been submitted for a degree or examination at any
tertiary education institution.
Venny Tjandrawan
October 2010
i
ABSTRACT
Manganese ions are often encountered as impurities in the electrolyte used in the
electrowinning of copper and zinc. The effects of manganese ions in the electrolyte on the
anodic behaviour of lead alloy anodes used in the electrowinning of copper and zinc have
not previously been definitively established. Potentiostatic and galvanostatic oxidation of
rotating disc electrodes of Pb-Ag and Pb-Ca-Sn anodes has been used to investigate the
anodic behaviour of these anodes and the oxidation reactions of manganese ions in
sulphuric acid solutions. The electrochemical measurements were complemented by
chemical analyses of the oxidised manganese species formed during the oxidation process,
which allow for the determination of the partial charge involved in oxidation of lead and
manganese as well as for oxygen evolution.
The oxidation of manganese on these anodes was found to be dependent on the formation
of lead dioxide at potentials above about 1.7 V and is also accompanied by oxidation of the
lead and evolution of oxygen at potentials above about 2.0 V. It will be demonstrated that
the amount of manganese oxidized increases with increasing oxidation potential,
concentration of manganese ions, time of oxidation and the silver content of the alloy.
The presence of manganese in the electrolyte decreases the rate of formation of lead
dioxide and reduces the fraction of the charge associated with oxygen evolution. It will
also be shown that both cobalt and manganese ions have an effect on reducing the rate of
ii
corrosion of the anodes and thereby the incorporation of lead on the cathodes. Higher
concentrations of manganese ions and lower oxidation potentials favour the production of
manganese(III) species which can form a MnOOH intermediate layer, while permanganate
is produced under the opposite conditions. Manganese dioxide produced by chemical
precipitation reactions involving manganic and permanganate ions, was also formed in the
bulk electrolyte and on the walls of the cell.
Mechanisms for the oxidation of manganese ions on these lead alloy anodes are presented
together with recommendations for optimization of the additions of manganese to zinc
circuits and minimization of permanganate formation in copper tankhouse electrolytes.

iii
ACKNOWLEDGEMENTS
First and foremost I would like to express my gratitude to my supervisor Professor Michael
James Nicol for his guidance and forbearance throughout my doctoral study. It is my
privilege to have been associated with him. He has been supportive from the very early
stage of this research. In addition, he was always accessible and willing to help his
students with their research. As a result, research life became such a rewarding learning
experience for me.
I gratefully acknowledge the financial support provided by Murdoch University and A.J.
Parker Centre that made my Ph.D. work possible. Special thanks also to RSR Technologies
for providing us with the Pb-Ag anodes.
I also wish to acknowledge the useful assistance provided by the staffs and colleagues of
the Extractive Metallurgy Department at Murdoch University. Many thanks go in
particular to Dr. Justin McGinnity for his tremendous support in various ways, thoughtful
advice, warm encouragement and his precious time in proof-reading parts of this thesis. I
am indebted to him more than he knows. I also benefitted from the work of Mr. Murray
Lindau for his help in fabricating the rotating disc electrodes. Many thanks also to Dr.
Manickam Minakshi for his help, advice and sincere friendship. The administrative work of
Mrs. Lian Chan is also greatly appreciated.

iv
I am especially grateful for the fun camaraderie and expertise of the friends in Extractive
Metallurgy Department, whose presence made my time at university memorable. Many
thanks in particular to: Dmitry Pugaev, Dr. Lilian Velasquez, Dr. Hajime Miki and
Alexander Senaputra.
My deepest thanks are devoted to my loving and caring husband Matthew Supranata, my
beloved family and my friends at Perth Indonesian Church who are always by my side,
encourage me, accept my mistakes, and make me feel proud whenever I have tried my best.
Finally, I would like to thank everybody who was important to the successful realization of
this thesis and would like to express my apology to those whom I could not mention
personally.

v
DEDICATION
This thesis is lovingly dedicated to:
The glory of my Lord Jesus Christ
My forever hope, strength, love and source of inspiration.
For from him and through him and to him are all things. To him be the glory forever! Amen. Romans 11:36

vi
PUBLICATION
Tjandrawan, V. and Nicol, M.J. 2010. The Oxidation of Manganese Ions on Lead Alloys During the Electrowinning of Copper. In Proceedings of the Copper 2010 Conference 4: 1699-1712.

vii
TABLE OF CONTENTS
Abstract .................................................................................................................................. i
Acknowledgements ............................................................................................................. iii
Dedication ............................................................................................................................. v
Publication ........................................................................................................................... vi
Table of Contents ............................................................................................................... vii
List of Figures ....................................................................................................................... x
List of Tables ..................................................................................................................... xiv
Chapter 1. INTRODUCTION ............................................................................................ 1
Chapter 2. LITERATURE REVIEW ................................................................................ 5
2.1 Electrowinning of Copper ............................................................................................ 5
2.1.1 Lead Anode Materials Used in the Electrowinning of Copper ........................... 10
2.2 Electrowinning of Zinc ............................................................................................... 12
2.2.1 Lead Anode Materials Used in the Electrowinning of Zinc ................................ 15
2.3 Electrochemical Behaviour of Lead Alloys in Sulphate Solutions ............................ 17
2.3.1 Potential-pH Diagram for the Lead-Water-Sulphate System .............................. 17
2.3.2 Cyclic Voltammetry of Lead in Sulphate Solutions ............................................. 19
2.3.3 Mechanism of the Electrochemical Oxidation of Lead........................................ 21
2.3.4 Mechanism of Oxygen Evolution on Lead ........................................................... 24
2.3.5 Electrochemical Behaviour of Lead-Silver Alloys ............................................... 27
viii
2.3.6 Electrochemical Behaviour of Lead-Calcium-Tin Alloys .................................... 28
2.4 Electrochemical Behaviour of Manganese Ions in Sulphate Solutions ...................... 30
2.4.1 Electrochemical Oxidation of Manganese(II) Ions on Inert Electrodes ............. 32
2.4.2 Electrochemical Oxidation of Mangaese(II) Ions on Lead Anodes..................... 36
2.5 Electrochemical Oxidation of Cobalt(II) Ions on Lead .............................................. 40
2.6 Scope of the Present Research .................................................................................... 43
Chapter 3. EXPERIMENTAL .......................................................................................... 44
3.1 Electrochemical Measurements .................................................................................. 44
3.1.1 Equipment, Electrodes and Electrochemical Cell ............................................... 45
3.1.2 Anode Materials................................................................................................... 47
3.1.3 Electrolyte Composition ...................................................................................... 48
3.1.4 Electrochemical Test Methods ............................................................................. 49
3.1.4.1 Potentiostatic Electrolysis ............................................................................ 49
3.1.4.2 Galvanostatic Electrolysis ............................................................................ 51
3.1.4.3 Linear Sweep Voltammetry ......................................................................... 51
3.1.4.4 Cyclic Voltammetry ..................................................................................... 52
3.1.4.5 Rotating Disc Electrode ............................................................................... 52
3.2 Analytical Measurements ........................................................................................... 53
3.2.1 Visible Spectroscopy ............................................................................................ 53
3.2.2 Potentiometric Titrations ..................................................................................... 54
3.2.2.1 Reagents ....................................................................................................... 54
3.2.2.2 Apparatus ..................................................................................................... 54
3.2.2.3 Procedure...................................................................................................... 55
Chapter 4. RESULTS AND DISCUSSION ..................................................................... 56
4.1 Potentiostatic Oxidation of Lead-Silver Anodes in Sulphuric Acid .......................... 56
ix
4.1.1 Effect of Varying Sulphuric Acid Concentration ................................................. 56
4.1.2 Effect of Varying Oxidation Time ........................................................................ 63
4.2 Potentiostatic Oxidation of Lead-Silver Anodes in Sulphuric Acid Solutions Containing Manganese ............................................................................................... 67
4.2.1 Effect of Manganese at Various Potentials ......................................................... 67
4.2.1.1 Observations of the Oxidation of Manganese .............................................. 73
4.2.2 Effect of Varying Concentration of Manganese(II) Ions ..................................... 75
4.2.3 Effect of Time of Oxidation .................................................................................. 85
4.2.4 Effect of Varying Silver Content in the Alloys ..................................................... 95
4.3 Potentiostatic Oxidation of Lead-Calcium-Tin Anodes in Sulphuric Acid .............. 100
4.4 Potentiostatic Oxidation of Lead-Calcium-Tin Anodes in Sulphuric Acid Solutions Containing Manganese ............................................................................................. 103
4.5 Galvanostatic Oxidation of Pure Lead and Lead Alloy Anodes in Acidic Manganese Solutions .................................................................................................................. 111
4.5.1 Galvanostatic Oxidation of Pure Lead Anode ................................................... 111
4.5.2 Galvanostatic Oxidation of Lead-Silver Anode ................................................. 112
4.5.3 Galvanostatic Oxidation of Lead-Calcium-Tin Anode ...................................... 116
4.6 Effect of Manganese Ions on the Corrosion Rate of Lead-Silver and Lead-Calcium-Tin Anodes ............................................................................................................... 121
4.7 Electrochemical Oxidation of Iron(II) Ions on Lead Alloy Anodes ........................ 124
Chapter 4. CONCLUSIONS ........................................................................................... 127
References ......................................................................................................................... 130
x
LIST OF FIGURES
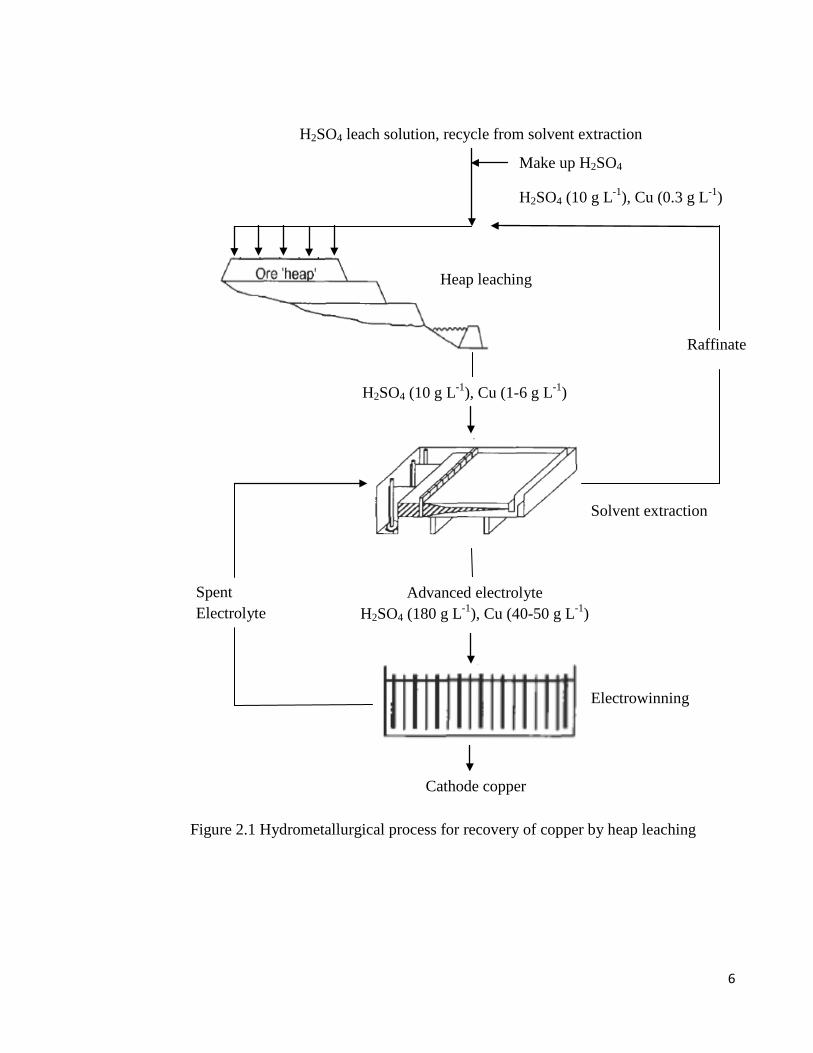
Figure 2.1 Hydrometallurgical process for recovery of copper by heap leaching ................. 6
Figure 2.2 Typical roast-leach-electrowinning processes for zinc....................................... 13
Figure 2.3 Potential-pH diagram for Pb-H2O-SO4 system................................................... 19
Figure 2.4 Typical cyclic voltammograms for a lead electrode in aqueous H2SO4 solution21
Figure 2.5 Potential-pH diagram for Mn-H2O-H2SO4 system ............................................. 30
Figure 3.1 Schematic diagram of the electrochemical cell .................................................. 45
Figure 3.2 Schematic diagram of the complete electrochemical setup. (a) Labview system, (b) potentiostat/ galvanostat, (c) rotating rig controller, (d) rotating rig, (e) electrochemical cell, (f) water bath ................................................................................................................ 46
Figure 4.1 Current-time transients during oxidation of Pb-0.42%Ag anodes at various sulphuric acid concentrations ............................................................................................... 57
Figure 4.2 Reduction sweep after oxidation of Pb-0.42%Ag anodes at various sulphuric acid concentrations ............................................................................................................... 59
Figure 4.3 Current-time transients during oxidation of Pb-0.42%Ag anodes at 1.8 V in 100 g L-1 H2SO4 for 300 and 1650 seconds and the subsequent potential sweep in a negative direction................................................................................................................................ 62
Figure 4.4 Current-time transients during oxidation of Pb-0.42%Ag anodes at 1.8 V in 150 g L-1 H2SO4 for various times .............................................................................................. 63
Figure 4.5 Current-time transients during oxidation of Pb-0.42%Ag anodes at 2.0 V in 150 g L-1 H2SO4 for various times .............................................................................................. 64
Figure 4.6 Reduction sweep after oxidation of Pb-0.42%Ag anodes at 1.80 V in 150 g L-1 H2SO4 for various times ...................................................................................................... 66
Figure 4.7 Reduction sweep after oxidation of Pb-0.42%Ag anodes at 2.00 V in 150 g L-1 H2SO4 for various times ...................................................................................................... 66
xi
Figure 4.8 Current-time transient during oxidation of Pb-0.42%Ag anodes at various potentials in a solution containing 150 g L-1 H2SO4 ............................................................ 68
Figure 4.9 Current-time transient during oxidation of Pb-0.42%Ag anodes at various potentials in a solution containing 150 g L-1 H2SO4 and 5 g L-1 Mn .................................. 69
Figure 4.10 Reduction sweep after 2 hours oxidation of Pb-0.42%Ag anodes at 1.5-2.0 V in 150 g L-1 H2SO4 .............................................................................................................. 71
Figure 4.11 Reduction sweep after 2 hours oxidation of Pb-0.42%Ag anodes at 1.5-2.0 V in 150 g L-1 H2SO4 and 5 g L-1 Mn ...................................................................................... 72
Figure 4.12 Effect of manganese concentration on potentiostatic oxidation of Pb-0.42%Ag anodes at 1.8 V and the subsequent potential sweep in a negative direction ...................... 76
Figure 4.13 Effect of manganese concentration on potentiostatic oxidation of Pb-0.42%Ag anodes at 1.85 V and the subsequent potential sweep in a negative direction .................... 78
Figure 4.14 Effect of manganese concentration on potentiostatic oxidation of Pb-0.42%Ag anodes at 1.9 V and the subsequent potential sweep in a negative direction ...................... 79
Figure 4.15 Effect of manganese concentration on potentiostatic oxidation of Pb-0.42%Ag anodes at 1.95 V and the subsequent potential sweep in a negative direction .................... 81
Figure 4.16 Effect of manganese concentration on potentiostatic oxidation of Pb-0.42%Ag anodes at 2.0 V and the subsequent potential sweep in a negative direction ...................... 82
Figure 4.17 Effect of manganese concentration on the charge fraction for lead oxidation at different potentials .............................................................................................................. 83
Figure 4.18 Effect of manganese concentration on the charge fraction for manganese oxidation at different potentials .......................................................................................... 84
Figure 4.19 Effect of manganese concentration on the charge fraction for oxygen evolution at different potentials ........................................................................................................... 85
Figure 4.20 Current-time transients during oxidation of Pb-0.42%Ag anodes at 2.0 V for 24 hours in a solution containing various manganese concentrations ................................. 86
Figure 4.21 Voltammograms in 150 g L-1 H2SO4 and 0.1 g L-1 Mn after oxidation of Pb-0.42%Ag anodes at 2.0 V for various times ........................................................................ 87
Figure 4.22 Voltammograms in 150 g L-1 H2SO4 and 1 g L-1 Mn after oxidation of Pb-0.42%Ag anodes at 2.0 V for various times ........................................................................ 87
Figure 4.23 Voltammograms in 150 g L-1 H2SO4 and 5 g L-1 Mn after oxidation of Pb-
xii
0.42%Ag anodes at 2.0 V for various times ........................................................................ 88
Figure 4.24 Voltammograms in 150 g L-1 H2SO4 and 10 g L-1 Mn after oxidation of Pb-0.42%Ag anodes at 2.0 V for various times ........................................................................ 88
Figure 4.25 Effect of manganese concentration on the charge fractions for (A) oxidation of lead, (B) oxidation of manganese and (C) evolution of oxygen at 2.0 V for Pb-0.42%Ag anode .................................................................................................................................... 90
Figure 4.26 Current-time transients during oxidation of Pb-0.42%Ag anodes at various potentials for 48 hours in a solution containing 150 g L-1 H2SO4 and 5 g L-1 Mn(II) and the subsequent potential sweep in a negative direction ............................................................. 92
Figure 4.27 Effect of manganese concentration on the charge fractions for (A) oxidation of lead, (B) oxidation of manganese and (C) evolution of oxygen at 1.95 V for Pb-0.42%Ag anode .................................................................................................................................... 93
Figure 4.28 Effect of manganese concentration on the charge fractions for (A) oxidation of lead, (B) oxidation of manganese and (C) evolution of oxygen at 2.05 V for Pb-0.42%Ag anode .................................................................................................................................... 94
Figure 4.29 Voltammetric scans of freshly polished lead-silver anodes with various silver contents in 150 g L-1 H2SO4 solution ................................................................................... 96
Figure 4.30 Voltammetric scans of freshly polished lead-silver anodes with various silver contents in 150 g L-1 H2SO4 and 5 g L-1 Mn(II) solution ..................................................... 97
Figure 4.31 Effect of silver content of the Pb-Ag anode on potentiostatic oxidation at 2.0 V and the subsequent potential sweep in a negative direction in 150 g L-1 H2SO4 and 5 g L-1 Mn(II) solution ..................................................................................................................... 98
Figure 4.32 Effect of silver content of the Pb-Ag anode on the charge fractions for oxidation of both lead and manganese and evolution of oxygen at 2.0 V ........................ 100
Figure 4.33 Current-time transients during oxidation of Pb-Ca-Sn anodes at various potentials in a solution containing 150 g L-1 H2SO4 ......................................................... 101
Figure 4.34 Reduction sweeps after oxidation of Pb-Ca-Sn anodes at each potential in 150 g L-1 H2SO4 for 24 hours .................................................................................................... 102
Figure 4.35 Current-time transients during oxidation of Pb-Ca-Sn anodes for 24 hours at various potentials in a solution containing 150 g L-1 H2SO4 and 0.1 g L-1 Mn(II) ............ 104
Figure 4.36 Current-time transients during oxidation of Pb-Ca-Sn anodes for 24 hours at various potentials in a solution containing 150 g L-1 H2SO4 and 1.0 g L-1 Mn(II) ............ 105
xiii
Figure 4.37 Reduction sweeps after oxidation of Pb-Ca-Sn anodes at each potential in 150 g L-1 H2SO4 and 0.1 g L-1 Mn(II) for 2 hours..................................................................... 106
Figure 4.38 Reduction sweeps after oxidation of Pb-Ca-Sn anodes at each potential in 150 g L-1 H2SO4 and 0.1 g L-1 Mn(II) for 24 hours................................................................... 107
Figure 4.39 Reduction sweeps after oxidation of Pb-Ca-Sn anodes at each potentials in 150 g L-1 H2SO4 and 1.0 g L-1 Mn(II) for 24 hours................................................................... 109
Figure 4.40 Effect of manganese on the charge fractions for (A) oxidation of lead, (B) oxidation of manganese and (C) evolution of oxygen at 2.0 V for Pb-Ca-Sn anode ........ 110
Figure 4.41 Effect of manganese ions on the potential for oxygen evolution on a lead anode at 500 A m-2 ........................................................................................................................ 112
Figure 4.42 Effect of manganese ions on the potential for oxygen evolution on a lead-silver anode at 500 A m-2 ............................................................................................................. 113
Figure 4.43 Voltammetric scan after 24 hours of oxidation of pure lead and lead-silver anodes in the presence of various manganese concentrations ........................................... 114
Figure 4.44 Effect of addition of phosphoric acid on the potential for oxygen evolution on a lead-silver anode at 500 A m-2 ........................................................................................ 115
Figure 4.45 Voltammetric scan after 24 hours of oxidation of a lead-silver anode at 500 A m-2 in the presence of manganese ions and phosphoric acid ............................................. 116
Figure 4.46 Effect of manganese ions on the potential for oxygen evolution on a Pb-Ca-Sn anode at 500 A m-2 ............................................................................................................. 117
Figure 4.47 Effect of manganese ions on the potential for oxygen evolution on a Pb-Ca-Sn anode at 300 A m-2 ............................................................................................................. 117
Figure 4.48 Effect of manganese on the potential for oxygen evolution on a Pb-Ca-Sn anode at 300 A m-2 in the presence of 0.15 g L-1 cobalt ions ............................................. 119
Figure 4.49 Reduction sweep after 24 hours oxidation of Pb-Ca-Sn anode at 300 A m-2 in 150 g L-1 H2SO4 with various manganese and cobalt concentrations ................................ 120
Figure 4.50 Enlarged views of the voltammograms in Figure 4.49 from 1.3 to 1.7 V and -0.8 to -0.2 V ....................................................................................................................... 120
Figure 4.51 Voltammetric scans of freshly polished lead-silver and lead-calcium-tin anodes in solution containing 150 g L-1 H2SO4 and 10 g L-1 iron(II) ............................................ 125

xiv
LIST OF TABLES
Table 2.1 Typical operating parameters for electrowinning of copper .................................. 8
Table 2.2 Typical operating parameters for electrowinning of zinc .................................... 14
Table 3.1 Anodes used in rotating disc electrode experiment ............................................. 48
Table 3.2 Chemicals used for the electrolyte solutions........................................................ 48
Table 3.3 Parameters in the potentiostatic electrolysis measurements ................................ 50
Table 3.4 Parameters in the galvanostatic electrolysis measurements ................................. 51
Table 4.1 Effect of acid concentration on the charge fraction for Pb oxidation and O2 evolution ............................................................................................................................... 58
Table 4.2 Effect of time on the charge fractions during oxidation of a Pb-0.42%Ag anode in 150 g L-1 H2SO4 at 1.8 V and 2.0 V ................................................................................. 65
Table 4.3 Correlation of the ‘anodic current peaks’ to the reduction of “PbO” .................. 65
Table 4.4 Effect of manganese on the charge involved in the oxidation of lead during oxidation of a Pb-0.42%Ag anode at various potentials ...................................................... 73
Table 4.5 Charge associated with manganese oxidation at different potentials .................. 73
Table 4.6 Effect of potential of oxidation on the charges during oxidation in a solution containing 150 g L-1 H2SO4 and 5 g L-1 Mn(II) for 48 hours ............................................... 91
Table 4.7 Effect of silver alloy content on the charge fraction for oxidation of Pb and Mn and evolution of O2 .............................................................................................................. 99
Table 4.8 Charge fractions during oxidation of the Pb-0.75%Ag and Pb-Ca-Sn anodes in 150 g L-1 H2SO4 for 24 hours at different potentials ......................................................... 103
Table 4.9 Experimental conditions for the long term corrosion tests ................................ 121
Table 4.10 Anode corrosion rates after 86 days operation................................................. 122

xv
1
Chapter 1
INTRODUCTION
Over the past several decades, electrowinning has become the preferred method for the
final recovery of metals such as copper, zinc, nickel, manganese and cobalt. Nearly 20% of
the world production of copper and more than 85% of the world’s zinc are produced by
means of an electrowinning process preceded by leaching and solution purification steps.
The electrowinning stage is typically the most energy intensive part of this process and
involves the highest component of the operating costs. The cost of electrical energy for
electrowinning can constitute up to 80% of the total energy cost of recovering metals from
concentrates (M.J. Nicol, personal communication, March 30, 2010). Furthermore,
electrowinning is also the most crucial stage in the process in relation to the quality of the
final product. Given the current economic circumstances and uncertainties about the future
costs and availability of energy, it is important that further studies of the electrowinning
process to be conducted with the goal of reducing energy consumption and maximizing
capital intensity without compromising the product quality.
In electrowinning, the most significant contribution to the overall energy consumption is
directly connected to the processes at the anodes, where the current oxidizes water and
produces oxygen gas. This process requires significant overvoltage and the contribution of
the anodic potential to the overall cell voltage is between 50 and 70% in zinc
electrowinning and is also a significant fraction for copper. The electrical energy
2
consumed in the world-wide electrowinning of copper and zinc is currently in excess of
6000 GWh/annum (M.J. Nicol, personal communication, March 30, 2010). Even a small
saving of 10% would not only save the cost of energy but also significantly reduce the
carbon footprint of the industry.
In addition, the main consequence of the oxygen evolution reaction on the anode is
corrosion of the lead-based anodes which are universally used in such operations. Initially,
a non-conducting layer of lead sulfate is formed on the anode surface, followed by the
formation of lead(II) hydrated oxides and finally a conducting lead dioxide layer that aids
in oxygen evolution. As corrosion of the substrate continues, an internal stress develops
and cracking of the protective inner layer may occur. The evolved oxygen causes flaking
of the corrosion product from the anode. Dissolved lead ions and suspended lead dioxide
and sulfate particles contaminate the electrodeposited copper and zinc. The increasingly
tight specifications for lead in both copper and zinc cathodes have highlighted the
importance of minimizing and controlling the corrosion of the anodes. The use of a
diaphragm in the electrowinning of nickel and cobalt assists in minimizing this problem
with these metals.
Despite the high operating potentials and susceptibility to corrosion, lead-based alloys still
dominate the base metal electrowinning operations. As pure lead is mechanically weak,
lead must be alloyed in order to improve its mechanical and corrosion properties. Common
lead alloys include lead-calcium-tin (Pb-Ca-Sn anodes) which are used in the
electrowinning of copper and nickel, and lead-silver (Pb-Ag anodes) used in the production
of zinc. Significant research and development is required in order to improve the
performance of these alloys in terms of reduced overpotentials and corrosion rates, both of
3
which are susceptible to the presence of certain other metal ions in the electrolytes. Thus,
manganese is added to zinc electrolytes and cobalt to copper electrolytes. In particular,
manganese may be present in the copper and zinc electrolytes as an impurity and
manganese ions are often added to zinc electrolytes in order to reduce the operating
potential and minimize corrosion of the anodes. However, there is also evidence that the
presence of low concentrations of manganese ions may increase the corrosion of anodes in
copper tankhouses. The mechanisms involved in these apparent conflicting effects are not
well understood. Thus an understanding of the role of manganese in the anode reactions on
lead alloy anodes could assist in the optimization of the electrowinning processes for both
copper and zinc with possible application to the electrowinning of nickel.
In addition to the major reaction of oxygen evolution, manganese ions may also be
oxidized at the lead alloy anodes, thus generating either soluble species such as Mn3+ and
MnO4- ions or insoluble oxides such as MnO2 and possibly MnOOH. The formation of
layers of these oxides on the lead anode surface may assist in minimizing disintegration of
the anode and also modify the kinetics of the oxygen evolution reaction. However,
excessive amounts of MnO2 scale have a tendency to break away from the anode causing
increased corrosion of the underlying lead anode. Moreover, the anodes must be cleaned
periodically to remove the deposit which may otherwise cause short-circuiting between the
anode and the cathode and increasing the energy consumption. The concentration of
manganese(II) ions in industrial zinc electrolytes is generally controlled between 1 and 10
g L-1.
In processes which involve solvent extraction as in the copper heap leach process and in
one zinc operation, the concentration of manganese in the electrolyte is typically

4
maintained at low levels between 1 and 250 mg L-1. The problem of manganese in the
electrolyte in such circuits is mainly associated with a decrease in the kinetics of solvent
extraction and capacity of the solvent due to oxidation of the reagents by the higher
oxidation states of manganese generated at the anode.
The kinetics involved in the oxidation of manganese ions on lead alloy anodes have not
been experimentally well characterized and therefore the mechanisms are not understood.
The research in this project is aimed at improving the understanding of the role of
manganese on the performance of Pb-Ag and Pb-Ca-Sn anodes used in the electrowinning
of zinc and copper respectively. This also includes an investigation into the fundamental
electrochemistry of the oxidation of manganese on these two selected lead alloys, and their
behaviour with respect to the oxygen evolution reaction. This will hopefully assist in
optimizing the additions of manganese to zinc circuits while reducing the impact of
manganese ion incursions in the electrowinning of copper.
5
Chapter 2
LITERATURE REVIEW
2.1 Electrowinning of Copper
About 20% of the world’s primary copper is produced by hydrometallurgical processing,
which generally involves heap leaching, solvent extraction and electrowinning as indicated
in Figure 2.1. The copper minerals most commonly treated this way are so-called oxides
such as carbonates, hydroxy-silicates, oxides and sulphates; and secondary copper sulphide
minerals, such as chalcocite and covellite (Davenport et al. 2002).
The leaching process is accomplished with dilute sulphuric acid (1 to 10 g L-1) to dissolve
copper and other chemically amenable ore constituents such as iron and manganese. Oxide
copper minerals are leached quickly without oxidation, but leaching of secondary sulphide
minerals normally requires an oxidant such as bacterially generated ferric ions. The
dissolved copper (1 to 6 g L-1) from the leach solution is then extracted into an organic
extractant, usually a mixture of an aldoxime and ketoxime dissolved in petroleum distillate,
in a process called solvent extraction. Subsequently, the loaded copper is stripped from the
organic extractant into a strong sulphuric acid solution (150 to 180 g L-1) producing a
relatively pure and concentrated copper electrolyte suitable for electrowinning.
6
Figure 2.1 Hydrometallurgical process for recovery of copper by heap leaching
Solvent extraction
Advanced electrolyte H2SO4 (180 g L-1), Cu (40-50 g L-1)
Electrowinning
Cathode copper
Heap leaching
H2SO4 (10 g L-1), Cu (1-6 g L-1)
H2SO4 leach solution, recycle from solvent extraction
Make up H2SO4
H2SO4 (10 g L-1), Cu (0.3 g L-1)
Spent Electrolyte
Raffinate
7
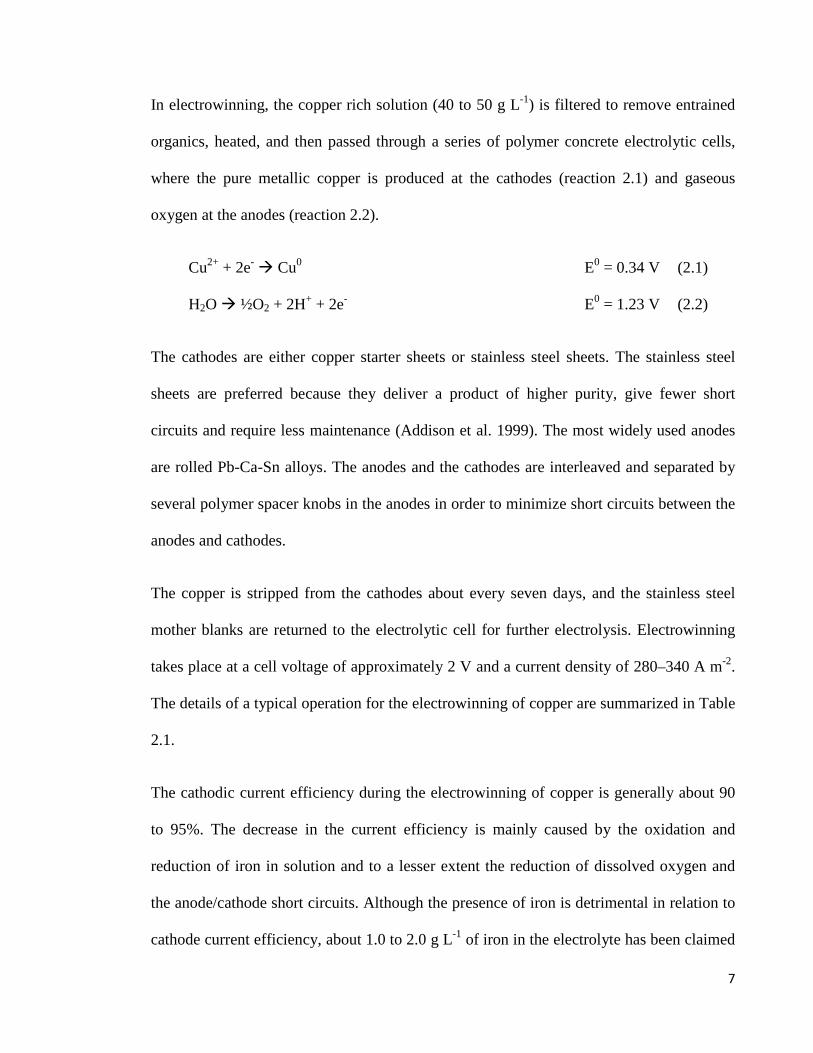
In electrowinning, the copper rich solution (40 to 50 g L-1) is filtered to remove entrained
organics, heated, and then passed through a series of polymer concrete electrolytic cells,
where the pure metallic copper is produced at the cathodes (reaction 2.1) and gaseous
oxygen at the anodes (reaction 2.2).
Cu2+ + 2e- Cu0 E0 = 0.34 V (2.1)
H2O ½O2 + 2H+ + 2e- E0 = 1.23 V (2.2)
The cathodes are either copper starter sheets or stainless steel sheets. The stainless steel
sheets are preferred because they deliver a product of higher purity, give fewer short
circuits and require less maintenance (Addison et al. 1999). The most widely used anodes
are rolled Pb-Ca-Sn alloys. The anodes and the cathodes are interleaved and separated by
several polymer spacer knobs in the anodes in order to minimize short circuits between the
anodes and cathodes.
The copper is stripped from the cathodes about every seven days, and the stainless steel
mother blanks are returned to the electrolytic cell for further electrolysis. Electrowinning
takes place at a cell voltage of approximately 2 V and a current density of 280–340 A m-2.
The details of a typical operation for the electrowinning of copper are summarized in Table
2.1.
The cathodic current efficiency during the electrowinning of copper is generally about 90
to 95%. The decrease in the current efficiency is mainly caused by the oxidation and
reduction of iron in solution and to a lesser extent the reduction of dissolved oxygen and
the anode/cathode short circuits. Although the presence of iron is detrimental in relation to
cathode current efficiency, about 1.0 to 2.0 g L-1 of iron in the electrolyte has been claimed

8
to have beneficial effects in lowering the solution potential and smoothing the cathode
surface.
Table 2.1 Typical operating parameters for electrowinning of copper
Annual copper production, tonnes 151000
Cathodes Stainless steel sheets
Copper cathode impurities, mg L-1 Pb (<3), S (<8), Fe (<0.8), Mn (<0.5), Co (<0.8), Ni (<0.8), Zn (<1), Sn (<0.2)
Anodes Rolled Pb-0.08%Ca-1.5%Sn-0.02%Al plates
Anodes life, years 5
Anodes/cathodes per cell 61/60
Total anodes 29280
Current Density, A m-2 290
Anode-cathode voltage, V 1.9-2.0
Cathode current Efficiency, % 92
Energy Consumption, MWh t-1 cathode 1.8-1.9
Cu, g L-1 40-50
H2SO4, g L-1 180
Temperature, °C 40-50
Fe2+, g L-1 0.2
Fe3+, g L-1 1.2
Mn2+, mg L-1 < 100
Co2+, mg L-1 150
Cl-, mg L-1 18
Guar gum, g t-1 200

9
Aside from iron, the most undesirable metallic impurity in the continuous process of
solvent extraction and electrowinning of copper is manganese. Manganese(II) itself has
minimal effects on the process of solvent extraction. In the electrowinning stage, the Mn2+
ions may be oxidised to Mn3+, MnO4-, MnOOH and MnO2 both on the anode and in the
electrolyte. Problems can arise when these high valence manganese ions are returned to the
solvent extraction circuit in which a decrease in the kinetics and loading capacity of the
organic extractant as a result of oxidation can often be observed (Miller, Readett &
Hutchinson 1997). Therefore, the prevention or minimisation of the oxidation of
manganese ions at the anode during the electrowinning stage is critical.
Cobalt sulphate is normally added to provide about 150 mg L-1 Co2+ in the electrolyte to
reduce both the corrosion rate and oxygen overpotential of the Pb-Ca-Sn anodes. The
addition of cobalt ions also reduces the rate of electrolytic production of manganese
dioxide (Ravindran, Heerman & Van Simaeys 1975) which in turn can minimize the
contamination of the cathodes with lead and extend the life of the anodes.
Chloride ions are either naturally present in the electrolyte or added as hydrochloric acid to
promote dense, fine grain, low impurity copper deposits on the cathode, but the
concentration should be maintained below about 30 mg L-1 (Davenport et al. 2002). At
higher concentrations, chlorine gas will be evolved at the anodes and pitting of the
stainless steel cathodes is observed. Small quantities of an organic additive such as guar
gum are also added as smoothing agents to form a dense copper deposit without nodular
growth.
10
2.1.1 Lead Anode Materials Used in the Electrowinning of Copper
The classical anode used in copper electrowinning is lead alloyed with 6-10% antimony
(Pb-Sb anode) (Ettel 1972; Gendron, Ettel & Abe 1975). Antimony in lead alloys offers
advantages of improved mechanical properties, uniform grain structures, and ease in
conventional casting (Hrussanova, Mirkova & Dobrev 2002). However, the inadequate
electrochemical and corrosion properties are a disadvantage of Pb-Sb anodes. Reduction
in the antimony content of the alloys decreases the mechanical properties markedly. On the
other hand, increasing the concentration of antimony increases the corrosion rate
(Prengaman 1997). The overvoltage for oxygen evolution is similar to that of pure lead
anodes (Chen, Guo & Klaus 1997).
New alloys of lead with calcium and/or strontium were developed to replace the
conventional Pb-Sb anodes (Hood et al. 1975; Prengaman 1984). The addition of calcium
or strontium to the lead improves the hardness. However, the quantities in the alloys must
be carefully controlled to produce a fine-grained structure with minimal alloy segregation
(Hrussanova, Mirkova & Dobrev 2002).
The Pb-Ca-Sn anodes are the most widely used anodes in the electrowinning of copper.
Tin is normally added to improve both the conductivity of the anodic film and the
mechanical properties. Addition of calcium with tin produces an anode with a high
mechanical strength to prevent distortion, warping and short circuits during electrolysis
(Prengaman & Siegmund 2007). Tin also reacts with calcium to form fine uniform Sn3Ca
particles within the grain structure, preventing corrosion from penetrating into the anode
and improving the stability of the anode (Prengaman & Siegmund, 1999). The optimum
11
calcium content is between 0.05 and 0.08%, while the concentration of tin in the alloy
should be between 1.0 to 2.2% (Prengaman & Siegmund 2007).
A recent variation of the Pb-Ca-Sn alloys by Prengaman and Siegmund (2007) involves the
addition of cobalt (0.005-0.040%), aluminium (0.001-0.008%) and silver (0.002 to
0.080%). The alloying of cobalt to the anode reduces the need for adding cobalt to the
electrowinning circuit. Aluminium is added as an anti-drossing agent to prevent the
oxidation of calcium. The addition of silver to the alloys reduces anode corrosion,
maintains the mechanical properties and reduces creep and structural changes in the alloy
at elevated temperatures (Prengaman & Siegmund 2007). Silver also enhances the oxygen
evolution rates and decreases the overvoltage of the oxygen evolution reaction (Zhong et
al. 1999).
The techniques used in the manufacture of anodes for electrowinning have changed over
the years in order to provide a more corrosion resistant and hence longer lasting anode.
Rolled anodes are preferable to cast anodes due to their superior performance since the
rolling process has been shown to produce a more uniform cross section and grain structure
and also less porosity and lower corrosion rates (Prengaman 1984). The production of cast
anodes results in an oriented, dendritic grain structure and the formation of numerous holes
or voids in the anode surface that can initiate internal corrosion in localized areas.
Therefore, the anode sheets are generally rolled to the desired thickness from a cast billet
to break up the original cast grain structure to produce a smoother surface with less
corrosion and easier removal of the PbO2-MnO2 scale (Prengaman & Siegmund, 1999).
The rolling process is normally performed at elevated temperatures to produce a fine
uniform grain structure both at the surface and throughout the rolled sheet. It has been
12
shown that the corrosion behavior improved with increasing rolling temperature (Stelter,
Bombach & Saltykov 2006).
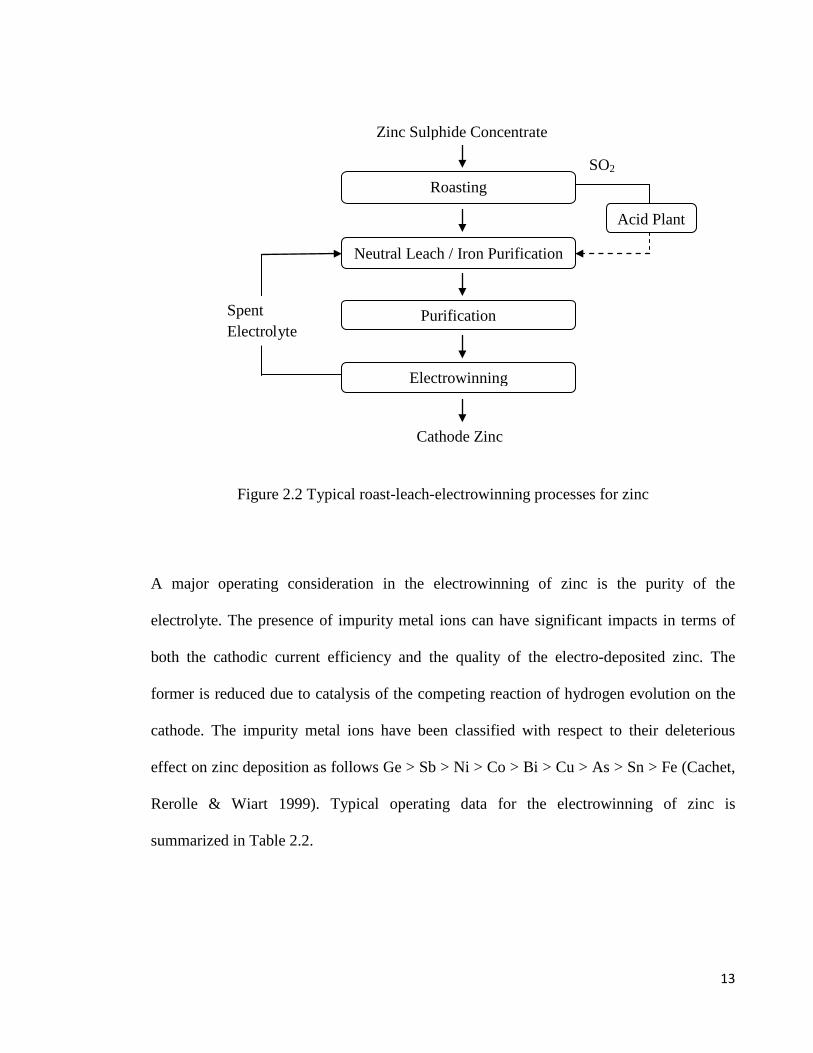
2.2 Electrowinning of Zinc
The production of zinc from zinc sulphide concentrates is predominantly conducted
through the roast-leach-electrowinning process (Figure 2.2), which was first used in 1916
by Anaconda and Cominco. A concentrate of the zinc sulphide ore, in which sphalerite
(ZnS) is the predominant component, is first roasted in a fluidized bed furnace (900-1000
°C) forming zinc oxide. The zinc oxide is then fed into the leaching tanks together with
sulfuric acid solution in the spent electrolyte from electrowinning. During leaching, careful
manipulation of temperature and pH encourages the precipitation of ferric hydroxide which
acts as a metal ion collector and partially removes arsenic, antimony and germanium (Bond
1999).
A subsequent purification step is carried out by zinc dust precipitation in two or three
stages, in which the leached solution is mixed with a fine dust of metallic zinc which
caused the reductive precipitation of the metal ions electropositive to zinc, while the zinc
metal is oxidized. The purified zinc solution is then circulated through the electrowinning
plant, where zinc deposits on aluminium cathodes, oxygen is produced at the lead silver
anodes and acid is regenerated for recycle to leaching. The overall reaction is given by
reaction 2.3.
ZnSO4 + H2O Zn + ½O2 + H2SO4 (2.3)
13
Figure 2.2 Typical roast-leach-electrowinning processes for zinc
A major operating consideration in the electrowinning of zinc is the purity of the
electrolyte. The presence of impurity metal ions can have significant impacts in terms of
both the cathodic current efficiency and the quality of the electro-deposited zinc. The
former is reduced due to catalysis of the competing reaction of hydrogen evolution on the
cathode. The impurity metal ions have been classified with respect to their deleterious
effect on zinc deposition as follows Ge > Sb > Ni > Co > Bi > Cu > As > Sn > Fe (Cachet,
Rerolle & Wiart 1999). Typical operating data for the electrowinning of zinc is
summarized in Table 2.2.
Roasting
Neutral Leach / Iron Purification
Acid Plant
SO2
Purification
Electrowinning
Cathode Zinc
Spent Electrolyte
Zinc Sulphide Concentrate
14
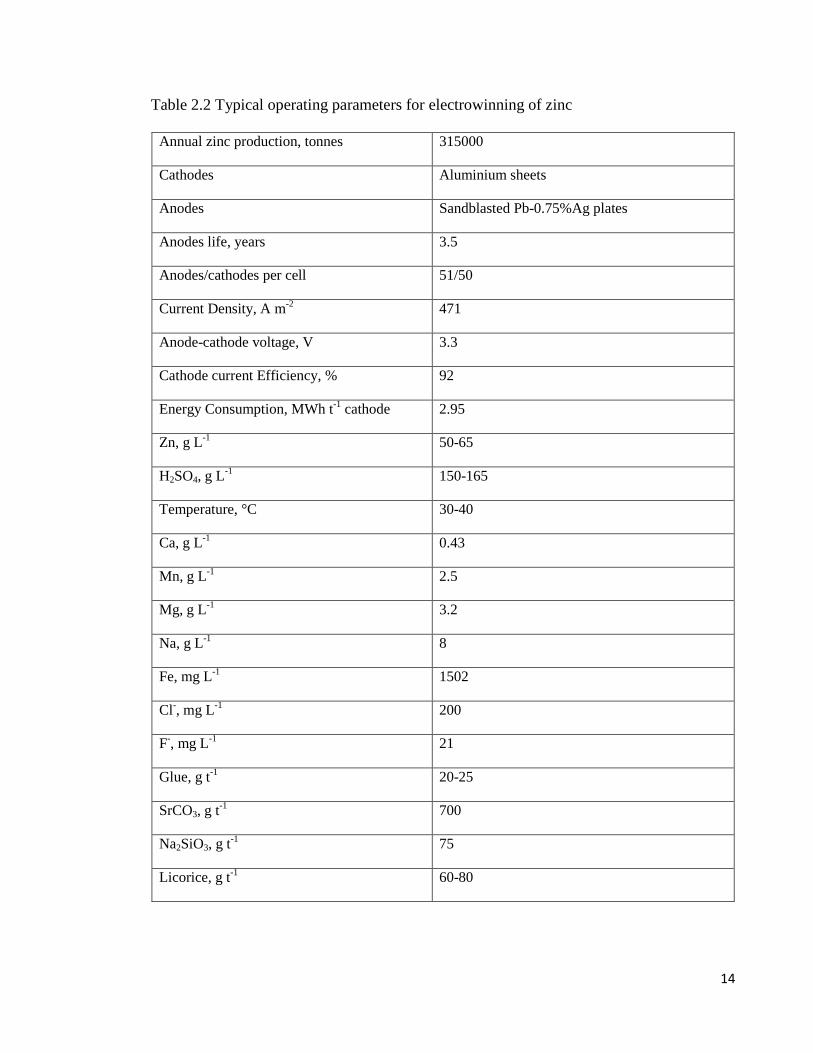
Table 2.2 Typical operating parameters for electrowinning of zinc
Annual zinc production, tonnes 315000
Cathodes Aluminium sheets
Anodes Sandblasted Pb-0.75%Ag plates
Anodes life, years 3.5
Anodes/cathodes per cell 51/50
Current Density, A m-2 471
Anode-cathode voltage, V 3.3
Cathode current Efficiency, % 92
Energy Consumption, MWh t-1 cathode 2.95
Zn, g L-1 50-65
H2SO4, g L-1 150-165
Temperature, °C 30-40
Ca, g L-1 0.43
Mn, g L-1 2.5
Mg, g L-1 3.2
Na, g L-1 8
Fe, mg L-1 1502
Cl-, mg L-1 200
F-, mg L-1 21
Glue, g t-1 20-25
SrCO3, g t-1 700
Na2SiO3, g t-1 75
Licorice, g t-1 60-80

15
Additional manganese ion is often introduced to the zinc sulphate electrolyte if not present
in the ore to maintain a concentration of between 2 and 10 g/L. The presence of manganese
assists in reducing the corrosion of anodes and minimizing the contamination of the zinc
cathodes by co-deposited lead.
2.2.1 Lead Anode Materials Used in the Electrowinning of Zinc
The electrolytic production of zinc is normally operated at a higher (than copper) current
density of about 500 A m-2. The Pb-Ca-Sn anodes are not suitable for use at this high
current as it will lead to high energy consumption (Stelter, Bombach & Saltykov 2006).
Tin cannot be used as an alloying element because it will dissolve into the electrolyte and
reduce the cathode current efficiency in addition to contaminating the cathode zinc
(Prengaman & Morgan 2001). Instead, lead alloys containing 0.45 to 1% silver (Pb-Ag
anode) have been used for many years. Silver is alloyed with the lead anode to reduce the
rate of corrosion and improve the conductivity of the anode. In addition, the addition of
silver also lowers the oxygen evolution overpotential by approximately 120 mV compared
to pure lead (Stelter, Bombach & Saltykov 2006). A small amount of silver oxide may be
formed on the surface of the anode in addition to the lead oxides. However, the poor
mechanical properties are the disadvantage of Pb-Ag anodes in that they are relatively
weak and bend quite easily when struck by cathode sheets as they are removed or inserted
to the cells. Therefore, calcium to the extent of 0.05 to 0.08% is sometimes added to the
alloys to improve the mechanical properties (Prengaman & Morgan 2001).

16
Due to the high cost of silver metal, other alloying elements have been investigated in an
effort to reduce or replace the silver. Thus, cobalt has been found to be a potential additive
in lead alloys as it can improve the stability of a lead anode. However, Pb-Co anodes have
not to-date been used in any industrial application because of the difficulties in producing
suitable Pb-Co alloys (Rashkov et al. 1999). The addition of cobalt ions to the electrolyte
in zinc electrowinning is not advantageous, since it will adversely affect the current
efficiency (Yu & O’Keefe 2002, Petrova et al. 1999).
The formation of a dense adherent protective layer of PbO2/MnO2 on the surface of the
anode is normally a very slow process. It can take from three to six months for the surface
anode to be fully established (Ramachandran et al. 1980). A number of different surface
pretreatment methods for Pb-Ag and Pb-Ag-Ca alloy anodes have been developed to
accelerate its formation, such as chemical oxidation in a KMnO4-H2SO4 electrolyte at 70οC
(Gonzalez 2001), KF electrochemical pretreatment (Newnham 1992), sandblasting
(Rodrigues, Garbers & Meyer 2001) and shot-peening (Jin et al. 2003). All of the methods
aim to roughen the anode surface to enhance the generation of a hard adherent corrosion
layer in a relatively short time.
The permanganate chemical method, however, is sensitive to the rate of cooling after the
pretreatment process, which, if too rapid, can cause cracking and curling of the anodic
layer. The electrochemical preconditioning process in fluoride containing solutions
provides an extra resistance to corrosion due to the formation of the lead difluoride layer
between the lead substrate and the lead dioxide coating. Abrasive blasting and peening are
carried out with relative coarse silica sand, glass beads or steel at high pressures above 500
kPa. The adherent oxide layer forms soon after installation and remains intact for at least
17
two months allowing a stable PbO2-MnO2 layer to form underneath. Sandblasting is
currently the most common preconditioning method since peening with steel shot or glass
beads can result in a significant deformation of the surface of lead anode and actual
warping of the entire anode if not carried out carefully (Tuffrey 2004).
2.3 Electrochemical Behaviour of Lead Alloys in Sulphate Solutions
Due to the extensive use of lead in battery applications and as the preferred anode in base
metal electrowinning processes from sulphate solutions, significant efforts have been made
by many researchers to understand the electrochemistry of lead and its corrosion
mechanism. The electrochemical studies involved various techniques such as potential-pH
equilibrium diagrams, potentiostatic or galvanostatic oxidation, linear sweep or cyclic
voltammetry, electrochemical impedance spectroscopy and X-ray diffraction analysis.
2.3.1 Potential-pH Diagram for the Lead-Water-Sulphate System
Metallic lead can be dissolved by acid oxidizing solutions with the formation of divalent
plumbous ions Pb2+. More powerful oxidation can result in conversion of divalent
plumbous ions into brown quadrivalent lead dioxide PbO2. In the absence of passivating
substances such as carbonates, an oxidizing action can cause lead to corrode, except at high
electrode potentials where PbO2 is stable (Pourbaix 1974).

18
Figure 2.3 shows the potential-pH diagram of lead in sulphuric acid solutions (Guo 1992).
This diagram includes the basic lead sulphates PbO.PbSO4, 3PbO.PbSO4.H2O and the
tetragonal oxide, PbO (PbOt). When a lead electrode is immersed in sulphuric acid solution
and polarized anodically to potentials in the area of stability of PbO2, two main reactions
occur on the electrode, which are the evolution of oxygen (shown as the dotted line) and
the oxidation of PbSO4 to PbO2. The oxidation of water to oxygen is theoretically possible
at 1.23 V, but oxygen production is only observed at potentials several tenths of a volt
more positive than the equilibrium potential for the PbO2/ PbSO4 couple (Lander 1956).
Therefore the oxidation of lead sulphate to lead dioxide and the evolution of oxygen gas
require significant overpotentials. It has been suggested that the oxygen evolution reaction
occurs at the anodic layer – solution interface and that its rate is affected by the quantity of
PbO2 on the electrode surface (Zhong et al. 1999).
It has also been observed that two forms of lead dioxide are formed with the rhombic (α-
form) being stable at lower potentials than the tetragonal (β-form). Thus, Astakhov,
Vaisberg and Kabanov (1964) have established that α-PbO2 forms more dense deposits,
composed of large and closely packed crystals. The β-PbO2 deposits are less compact being
composed of poorly bonded, fine, needle shaped crystals. On the basis of X-ray diffraction
analyses, Sharpe (1975) reported that β-PbO2 resides primarily in the outer portion of the
film and α-PbO2 exists in the inner portion of the film closer to the metal together with
PbOt. Ivanov et al. (2000) stated that α-PbO2 is formed through an intermediate complex
with hydroxyl ions, while β-PbO2 is formed through an intermediate complex containing
sulfate ions. Thus, on this basis, α-PbO2 can be obtained only in alkaline or neutral media
and β-PbO2 only by oxidizing PbSO4 in acidic media. α-PbO2 is believed to be formed in a

19
localized high pH environment that is protected from the bulk acid by a PbSO4 layer highly
permeable to H2SO4 (Sharpe 1975).
Figure 2.3 Potential-pH diagram for Pb-H2O-SO4 system
2.3.2 Cyclic Voltammetry of Lead in Sulphate Solutions
Numerous studies have been made to characterize the reactions taking place on lead using
potentiodynamic methods such as cyclic voltammetry (G. Cifuentes, L. Cifuentes &
Crisostomo 1998; Mahato 1979; Sharpe 1975; Yamamoto et al. 1992). Figure 2.4 shows a
typical cyclic voltammogram for a lead electrode in sulphuric acid solution with the
following features:
3PbO.PbSO4.H2O
0 2 4 6 8 10 12 14 pH
2.0
1.6
1.2
0.8
0.4
0.0
-0.4
-0.8
E / V (vs SHE)
Pb
PbSO4
β-PbO2
α-PbO2
PbO
Pb3O4
PbO.PbSO4
20
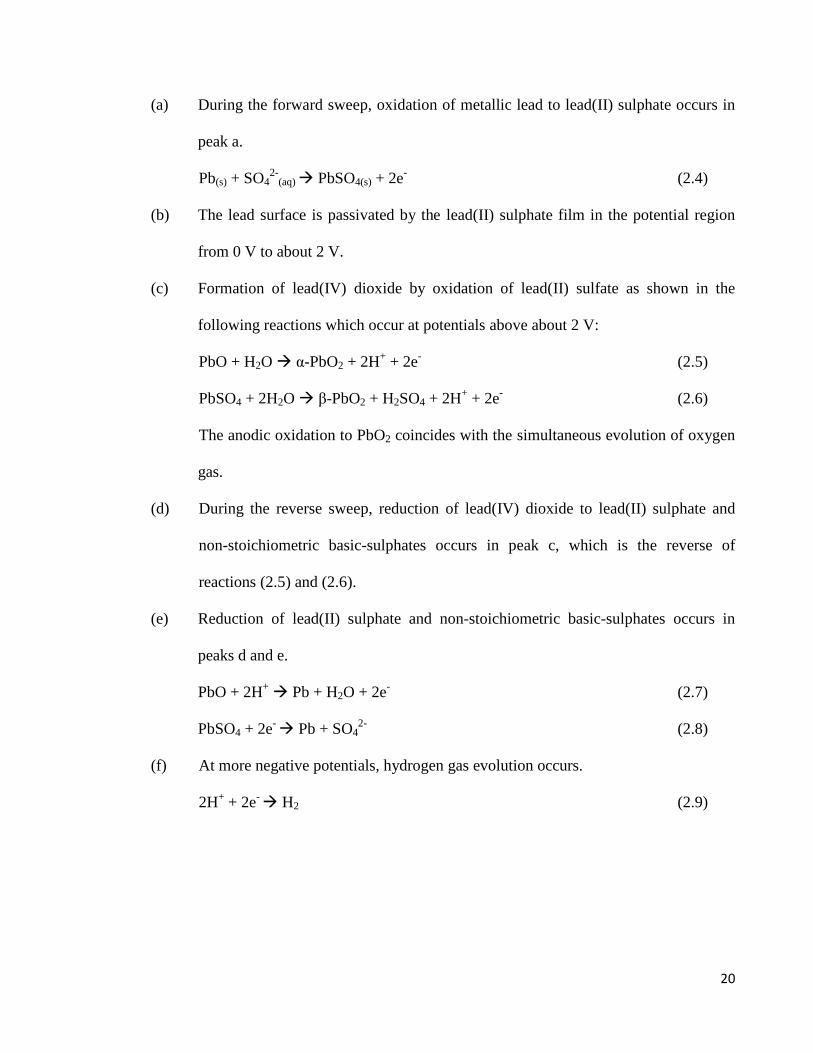
(a) During the forward sweep, oxidation of metallic lead to lead(II) sulphate occurs in
peak a.
Pb(s) + SO42-
(aq) PbSO4(s) + 2e- (2.4)
(b) The lead surface is passivated by the lead(II) sulphate film in the potential region
from 0 V to about 2 V.
(c) Formation of lead(IV) dioxide by oxidation of lead(II) sulfate as shown in the
following reactions which occur at potentials above about 2 V:
PbO + H2O α-PbO2 + 2H+ + 2e- (2.5)
PbSO4 + 2H2O β-PbO2 + H2SO4 + 2H+ + 2e- (2.6)
The anodic oxidation to PbO2 coincides with the simultaneous evolution of oxygen
gas.
(d) During the reverse sweep, reduction of lead(IV) dioxide to lead(II) sulphate and
non-stoichiometric basic-sulphates occurs in peak c, which is the reverse of
reactions (2.5) and (2.6).
(e) Reduction of lead(II) sulphate and non-stoichiometric basic-sulphates occurs in
peaks d and e.
PbO + 2H+ Pb + H2O + 2e- (2.7)
PbSO4 + 2e- Pb + SO42- (2.8)
(f) At more negative potentials, hydrogen gas evolution occurs.
2H+ + 2e- H2 (2.9)

21
Figure 2.4 Typical cyclic voltammograms for a lead electrode in aqueous H2SO4 solution
2.3.3 Mechanism of the Electrochemical Oxidation of Lead
As a result of analysis of the anodic layer on lead and the thermodynamic considerations
(Figures 2.3 and 2.4), three main potential regions have been identified as follows:
• From -0.325 to 0.245 V (versus SHE) the fresh anode surface is initially covered
with a non-conducting layer of PbSO4 crystals.
• From 0.245 to 1.65 V, the formation of tetragonal PbO (PbOt) occurs together with
thickening of a basic PbSO4 film. PbOt has a very low electronic conductivity.
H2
Peak a. Pb PbSO4 Peak b. PbSO4 β-PbO2
PbO α-PbO2
O2
Peak c. α-PbO2, β-PbO2 PbSO4
Peak d. PbO, PbSO4 Pb
Peak e. PbSO4 Pb
-1.5 -1.0 -0.5 0.0 0.5 1.0 1.5 2.0 2.5 E / V (vs SHE)
100
50
0
-50
I / mA

22
• Above 1.65 V, the anodic layer contains α- and β-PbO2, PbOt and hydrated (gel)
zones donated as PbO(OH)2.
When lead is placed in sulphuric acid, a layer of PbSO4 forms spontaneously, the
mechanism of which was first advanced by Pavlov (1978). He suggested that the formation
of the PbSO4 layer is controlled by solid state diffusion of Pb2+ and SO42- ions through the
intergranular pores of the layer. During the growth, the layer acts simultaneously as a
permselective membrane for Pb2+ ions and as a blocking membrane for the access of SO42-
ions to the interfacial region. As a consequence, the anodic current passing through the
electrode makes protons in the anodic film move towards the electrolyte and OH- ions
migrate towards the lead surface. The migration of these ions leads to an increase in pH
and production of basic lead sulphates and PbOt between the PbSO4 sublayer and the metal
(Guo 1992).
With increasing anodic polarization, PbSO4 is then transformed to a conductive layer of
PbO2. Codaro and Vilche (1997) suggested that the formation of PbO2 proceeds through
reactions 2.5 and 2.6 above. The α-PbO2 is formed from the oxidation of PbO.xPbO2 or
basic lead sulphate according to a two-dimensional nucleation and growth mechanism. The
β-PbO2 is formed from the oxidation of PbSO4 in the outer layer. This final solid phase
change is followed by oxygen evolution and the corrosion increases rapidly with increasing
potential (Dawson 1979).
Pavlov and Dinev (1980) further suggested that the surface layers formed by oxidation of
lead electrodes in sulfuric acid solutions also contain non-stoichiometric lead oxides PbOn
(1<n<2). At the Pb/PbO interface, Pb is oxidised to PbOv2+ (reaction 2.10) where PbOv
2+ is
23
a PbO molecule containing an O2 vacancy (Ov2+). Under the action of the electric field, the
O2 vacancy migrates into the oxide layer and reaches the oxide/solution interface where it
reacts with water (reaction 2.11). The H+ ions migrate through the PbSO4 membrane into
the bulk of the solution.
(Pb/PbO interface) Pb PbOv2+ + 2 e- (2.10)
(PbO/PbSO4/electrolyte interface) PbOv2+ + H2O PbO + 2 H+ (2.11)
PbO is then oxidised at the PbO/electrolyte interface via solid phase reactions to
nonstoichiometric PbOn without a change of its crystal structure (reaction 2.12)
k PbO + (m/2) H2O = k PbOn + m H+ + m e- (2.12)
in which, n = (k + (m/2))/k, (1<n<2).
The value of n is potential dependent and progressively increases closer to the
oxide/solution interface. With increasing n, the electronic conductivity also rises. After
passage of a critical charge, n reaches critical value ≈1.4 at which point nucleation of the
new phase, α-PbO2, commences in the pores of the PbSO4 membrane. When this phase
reaches the acid solution interface, the oxidation of PbSO4 crystals to β-PbO2 begins in the
outer portion of the film upon oxidation above 1.685 V and α-PbO2 exists along with PbOt
in the inner portion of the film closer to the metal (Mahato 1979).

24
2.3.4 Mechanism of Oxygen Evolution on Lead
The production of a conducting PbO2 layer from the insulating PbSO4 film permits the
evolution of oxygen on the lead alloy/oxide layer surface. Several mechanisms of the
electrochemical processes that proceed during the oxygen evolution reaction (OER) on or
in the PbO2 layer in acidic solution have been proposed.
The first mechanism ignores the direct involvement of the PbO2 layer in the kinetics of the
OER (Bockris 1956; Codaro & Vilche 1997). The PbO2 surface is considered as an inert
electrode on which the mechanism of the OER is likely to be similar to that occurring on
noble metals such as Pt and Ir. The rate limiting reaction has been suggested to be the
primary discharge of H2O molecules (reaction 2.13).
H2O = OHads + H+ + e- (2.13)
OHads = Oads + H+ + e- (2.14)
2Oads = O2 (2.15)
Codaro and Vilche (1997) also suggested that β-PbO2 is a better catalyst for the OER than
α-PbO2. The β-PbO2 layer is considered as being constituted by small cylindrical crystals
surrounded by PbSO4 crystals, so that the OER starts on the β-PbO2/PbSO4 surface, and at
high positive potentials and/or long oxidation times it continues on the β-PbO2 layer.
A second mechanism involves the PbO2 layer in the kinetics of the OER. In a first step,
water is decomposed forming an intermediate unstable oxide. This oxide is then
transformed into a stable species accompanied by oxygen evolution as shown in the
following reactions.
25
H2O + MOx MOx+1 + 2H+ + 2e- (2.16)
2MO(x+1) 2MOx + O2 (2.17)
Kabanov and his co-workers (1964) hypothesized that anodic corrosion of lead in sulphuric
acid solution occurs by means of the diffusion of oxygen to the lead through the layer of
lead dioxide and lead oxide. They carried out an anodic polarization of one face of a pure
lead membrane and measured the potential on the opposite, unpolarized face. They
observed that the potential on the polarized side increased and exceeded the equilibrium
potential for the PbO2/PbSO4/H2SO4 system. On the other hand, the potential on the
opposite side of the membrane also increased as a result of the penetration of atomic
oxygen through the membrane.
Pavlov and Monahov (1996) later proposed a rather complex mechanism involving the
formation of a hydrated lead dioxide layer. They established two potential regions in which
oxygen evolution is observed on the PbO2 electrode,
• Passive Potential Region (PPR). In the potential region from 1.645 to 1.945 V, the
anodic current density is small and the anodic layer formed contains more β-PbO2 than α-
PbO2.
• Active Potential Region (APR). Upon further oxidation from 1.945 to 2.245 V,
extensive oxygen evolution is observed and α-PbO2 is the predominant phase in the anodic
layer.
They suggested that the PbO2/electrolyte interface is hydrated, forming a gel-like
PbO(OH)2 phase. The crystalline and the gel components are in equilibrium and it was

26
suggested that the OER proceeds in the layer located in the gel near its interface with the
crystal layer.
PbO2 + H2O = PbO(OH)2 (2.18)
crystal layer hydrated (gel) layer
The anodic layer comprises of Pb/PbOn reaction layer/PbO2 crystal layer/PbO(OH)2 gel
layer/electrolyte. Near the metal surface, n is low but increases to reach that of
stoichiometric PbO2 at a certain distance from the metal. The rate of the OER depends on
the electronic conductivity of the anodic layer, which is determined by the stoichiometry of
the PbO2 which in turn depends on the potential of the electrode and on the alloying
additives in the alloy.
Pavlov and Monahov (1996) further suggested that the OER reaction occurs in two
consecutive electrochemical reactions. The first which proceeds at potentials above 1.645
V, leads to the formation of OH radicals while the second takes place at potentials above
1.945 V. Both reactions are localised in active centers in the hydrated PbO(OH)2 layer
(denoted Pb*O(OH)2). At potentials below 1.945 V, the products of the first reaction block
these active centers resulting in low current densities. At potentials above 1.945 V, the
second reaction proceeds, as a result of which O2 is evolved due to the oxidation of the OH
radicals and the consequent unblocking of the active centers. After formation of the anodic
film, 99.2% of the charge is utilised for the OER, 0.67% for production of PbO2 and 0.13%
for other reactions (Ivanov et al. 2000). Thus, the oxide layer continues to slowly grow
with increasing time of anodization.
27
Generally, the corrosion rates increased with increasing temperature and current density.
Increased temperature leads to depolarization of the OER reaction, as well as to formation
of greater amounts of both the compact and less dense PbO2 layers (Hrussanova et al.
2004). The spalling of this anodic layer due to internal stresses occurs more frequently at
higher temperatures.
The increase in corrosion rate with increasing current density can be attributed in part to
the increased rate of oxygen evolution which inhibits the formation of a dense anode layer.
2.3.5 Electrochemical Behaviour of Lead-Calcium-Tin Alloys
Prengaman and Siegmund (1999) studied the influence of calcium and tin in the wrought
Pb-Ca-Sn alloys and found that tin reacts with calcium to form fine uniform Sn3Ca
particles within the grain structure which imparts strength to the anode. In addition, tin
prevents the formation of PbOt at the lead anode/PbO2 corrosion product interface by the
formation of SnO2-doped PbO2 according to the following suggested reactions
2PbO + Sn SnO.PbO + Pb (2.19)
SnO.PbO + O2 SnO2.PbO2 (2.20)
in which tin reduces PbO to form PbO and SnO. This SnO is soluble in PbO and upon
further oxidation forms SnO2-doped PbO2, which is much more conductive and much less
reactive than pure PbO2.
28
2.3.6 Electrochemical Behaviour of Lead-Silver Alloys
The addition of silver to the lead has been shown to reduce the rate of anode corrosion and
the amount of lead codeposited and occluded in the cathode during zinc electrowinning. It
is believed that the presence of silver enables an alternate pathway for the evolution of
oxygen, which results in a decreased overpotential for oxygen evolution (Cole & O’Keefe
1981).
Cachet, Rerrole and Wiart (1996) studied the kinetics of the OER on Pb-Ag anodes in
acidic solutions containing some manganese ions by utilising electrochemical impedance
spectroscopy (EIS). They found that the presence of silver and Mn2+ ions decreased the
extent of anodic polarisation. The effect of Ag is more pronounced with increasing Ag
content up to 0.5%. However, the rate of growth of the PbSO4 layers is independent of the
silver content. The oxide layer has the structure of β-PbO2 in the potential region 1.915 to
1.995 V. In manganese containing electrolytes, this feature persisted above 1.995 V. They
proposed that the secondary reactions occurring on the Pb-Ag electrode are as follows in
the absence and presence of manganese ions
In H2SO4 solution Ag Ag+surf + e- AgSO4
-ad (2.21)
In H2SO4/MnSO4 Ag Ag+surf + e- AgMnO4
-ad (2.22)
The presence of AgSO4-ad or AgMnO4
-ad is thought to inhibit oxygen evolution, but
oxidation of these species to form AgO (reaction 2.23) results in a more active catalytic
surface for the OER than on PbO2 (Ivanov et al. 2000; McGinnity 2008). The amount of
AgO increases with increasing Ag content in the alloy.
29
AgSO4- + H2O AgOad + H2SO4 + e- (2.23)
In the presence of manganese, silver also exhibits a strong catalytic effect on the OER.
However this catalytic effect requires that it be in an intimate contact with the anode
(McGinnity 2008).
Studies carried out with silver added as Ag+ ions, rather than via dissolution of silver from
the anode, also showed a decrease in the overpotential of the OER but did not affect the
corrosion rate of pure lead (Pavlov & Rogachev 1986). It is thought that the effect of the
Ag+ ions is limited only to the oxide-solution interface. When silver is alloyed in the metal,
silver is oxidized together with lead and the oxidized silver is incorporated in the oxide as a
solid solution thereby influencing the mobility of O atoms in the oxide and the phase
composition of the anodic layer.
Pavlov and Rogachev (1986) suggested that silver enhances the formation of β-PbO2 at the
oxide-solution interface and also in the zone close to the metal. During the oxidation of tet-
PbOn silver creates suitable conditions for formation of the crystal lattice for β-PbO2.
Monahov, Pavlov and Petrov (2000) further revealed that silver decreases the activation
energy for the OER and probably increases the number of active centres in the gel zone of
the PbO2 layer. This effect appears to increase with increasing silver content in the alloy.
However, there is no clear evidence in the literature that the extent of the gel zones on the
PbO2 particles affects the oxygen evolution overvoltage.

30
2.4 Electrochemical Behaviour of Manganese Ions in Sulphate Solutions
Manganese metal can easily be dissolved by acid or neutral oxidizing solutions with the
formation of the pale pink manganous Mn2+ ion. As shown in the equilibrium potential-pH
diagram of the Mn-H2SO4-H2O system (Figure 2.5) (Kelsall et al. 2000), oxidation of
manganous ions can, depending on the pH and Eh, produce a number of higher oxidation
states with the formation of solid oxides Mn3O4, MnOOH and MnO2. Under more strongly
oxidizing conditions, species such as Mn3+ ions in very acidic solution, MnO42- ions in
very basic solution or MnO4- ions over a wide range of pH can be produced.
Figure 2.5 Potential-pH diagram for Mn-H2O-H2SO4 system
MnOOH
HMnO2
2.0
-2 0 2 4 6 8 10 12 14
pH
1.5
1.0
0.5
0
-0.5
-1.0
-1.5
-2.0
E/ V (vs SHE)
Mn
MnSO4 Mn(OH)2
MnO4-
MnHSO42+
MnO2
MnO42-
Mn3O4
31
The oxidation of Mn(II) to Mn(III) (reaction 2.24) is generally complicated by the limited
stability of the Mn3+ ion except in strongly acidic solutions. Disproportionation results in
the formation of manganese dioxide as shown in reaction 2.25.
Mn2+ = Mn3+ + e- E0 = 1.509 V (2.24)
2Mn3+ + 2H2O = Mn2+
+ MnO2 + 4H+ (2.25)
Solutions of Mn(III) can be prepared by adding permanganate solution to a solution
containing a large excess of Mn(II) in strong sulphuric acid solutions according to reaction
2.26.
MnO4- + 4Mn2+ + 8H+
= 5Mn3+ + 4H2O (2.26)
When the concentration of Mn3+ ion is relatively high, the addition of more permanganate
results in the oxidation of Mn3+ to Mn4+ (reaction 2.27).
MnO4- + 3Mn3+ + 8H+ = 4Mn4+ + 4H2O (2.27)
Mn4+ is not stable in the solution and will react with water to form Mn(OH)4 which
dehydrates easily to yield solid MnO2 (Kao & Weibel 1992).
Mn4+ + 4H2O Mn(OH)4 + 4H+ (2.28)
Mn(OH)4 MnO2 + 2H2O (2.29)
The stability of the Mn(III) produced is dependent upon the acidity, the ratio of the
concentrations of Mn(II) to Mn(III) and the ability of SO42- ion to complex with Mn3+ ion
(Morrow & Perlman, 1973). Selim and Lingane (1959) demonstrated that stable solutions
of Mn(III) were formed in 4.6 - 7.2 M H2SO4 in the presence of ten-fold excess of Mn(II),

32
while Kalra and Gosh (1966) suggested that a much higher Mn(II)/ Mn(III) ratio of about
25 or greater in 4.5 M H2SO4 solution is required to stabilize Mn(III) in solution.
The permanganate ion is itself intrinsically unstable in that it will decompose slowly to
MnO2 evolving O2 according to the following reaction (Pourbaix 1974).
4MnO4- + 4H+ 4MnO2 + 3O2 + 2H2O (2.30)
In summary, manganese can be present as either ions of Mn(II), Mn(III), Mn(VII) and
possibly also Mn(IV) in strongly acidic solutions.
It is apparent that a number of manganese species can be oxidized to form deposits on the
surface of an electrode, with MnO2 as the predominant product. However, the detailed
mechanisms of the anodic oxidation of Mn(II) ions and the deposition of MnO2 are still
unresolved particularly on lead alloy anodes. However, there is some information on the
mechanism of the deposition of electrolytic manganese dioxide (EMD) on other anode
surfaces.
2.4.1 Electrochemical oxidation of Manganese(II) Ions on Inert Electrodes
The formation of EMD (generally regarded as γ-MnO2) by anodic oxidation of manganese
sulphate solutions is an industrial process and has been studied using inert anode substrates
such as platinum, titanium, gold, and carbon or graphite fibre materials in dilute sulfuric
acid (20 to 70 g L-1) at current densities of 20 to 120 A m-2 and high temperatures (80 to 98
°C) (Duarte, Pilla & Mayer 2003; Kao & Weibel 1992). Several mechanisms have been
33
proposed for the oxidation of Mn2+ and the deposition of MnO2 on inert electrodes in
sulphuric acid solution using different techniques. The overall reaction is given by reaction
2.31.
Mn2+(aq) + 2H2O(l) MnO2(s) + 4H+
(aq) + 2e- E0 = 1.228 V (2.31)
Most researchers agree that this reaction does not occur in a single step since the oxidation
state of manganese increases from +2 to +4. The initial step of Mn2+ oxidation can be either
a one-electron oxidation to Mn3+ or a two-electron oxidation to Mn4+. Kao and Weibel
(1992) carried out rotating ring-disc experiments on platinum/platinum electrodes and
found that the initial oxidation product was soluble in the solution and slowly formed a
MnO2 deposit. Therefore they suggested that Mn3+ ions could be the initial oxidation
product (reaction 2.24) because Mn4+ ions are not stable in the solution as shown in
reactions 2.28 and 2.29.
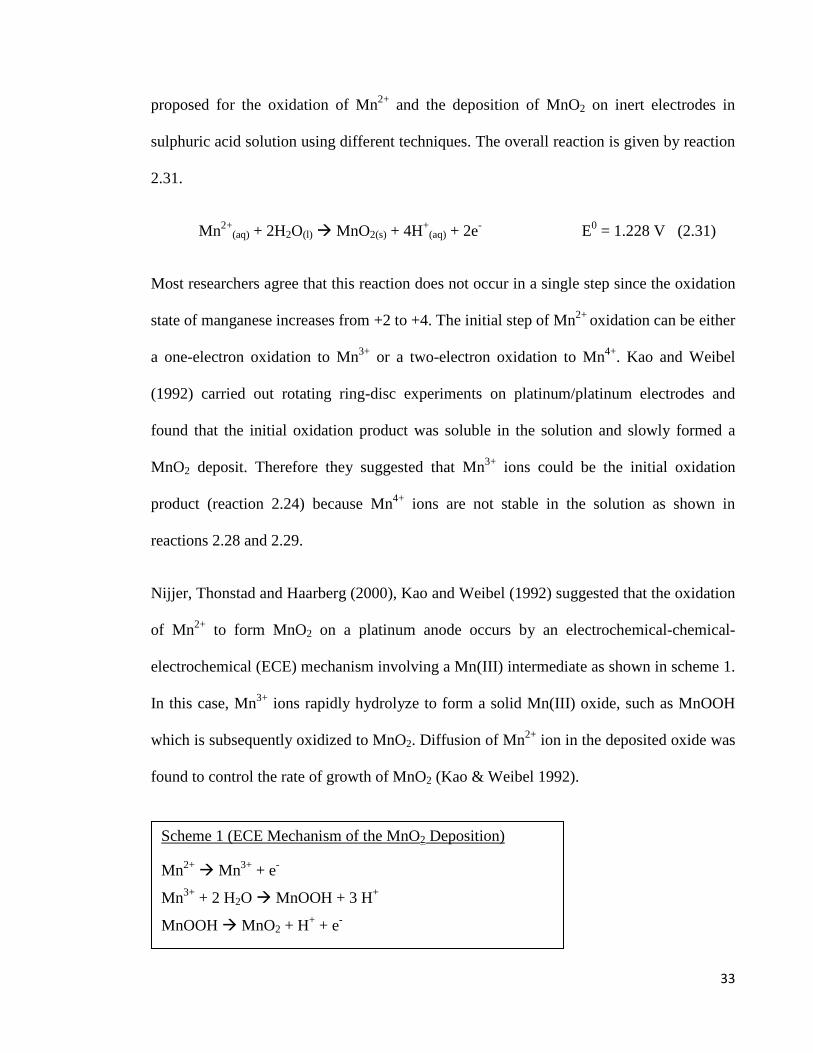
Nijjer, Thonstad and Haarberg (2000), Kao and Weibel (1992) suggested that the oxidation
of Mn2+ to form MnO2 on a platinum anode occurs by an electrochemical-chemical-
electrochemical (ECE) mechanism involving a Mn(III) intermediate as shown in scheme 1.
In this case, Mn3+ ions rapidly hydrolyze to form a solid Mn(III) oxide, such as MnOOH
which is subsequently oxidized to MnO2. Diffusion of Mn2+ ion in the deposited oxide was
found to control the rate of growth of MnO2 (Kao & Weibel 1992).
Scheme 1 (ECE Mechanism of the MnO2 Deposition)
Mn2+ Mn3+ + e-
Mn3+ + 2 H2O MnOOH + 3 H+
MnOOH MnO2 + H+ + e-
34
At low Mn2+ concentrations parts of the electrode surface may still be active for oxidation
of Mn2+ to Mn3+ because of the reduced coverage of the insulating intermediate MnOOH.
At high Mn2+ concentrations the rate of formation of MnOOH is high and the high surface
coverage will deactivate the electrode against further oxidation of Mn2+. High
temperatures, low acidity and increased mass transport enhance the rate of oxidation of
Mn2+ to MnO2 (Nijjer, Thonstad & Haarberg 2000).
According to Selim and Lingane (1959), the Mn3+ ions are unstable at low acid
concentrations and will disproportionate to Mn2+ and Mn4+ ions. The formal
disproportionation constant varies from 10-3 in 4 M H2SO4 to 10-4 in 7 M H2SO4 at 25 ºC.
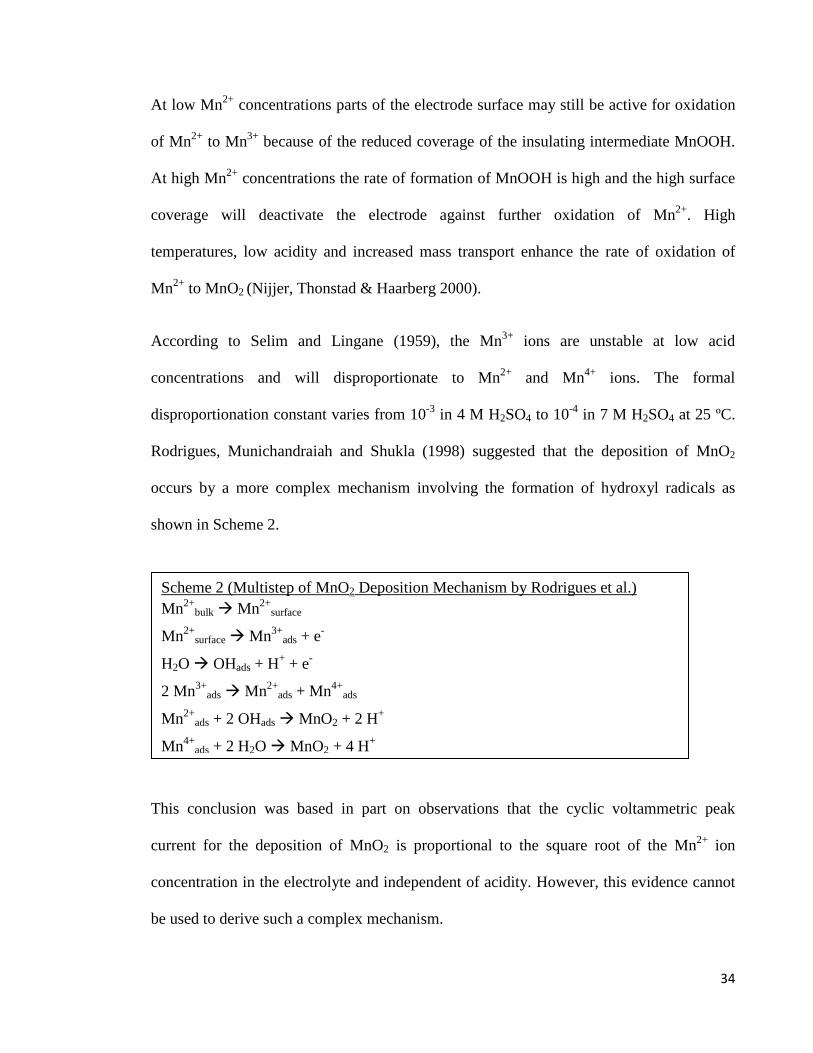
Rodrigues, Munichandraiah and Shukla (1998) suggested that the deposition of MnO2
occurs by a more complex mechanism involving the formation of hydroxyl radicals as
shown in Scheme 2.
This conclusion was based in part on observations that the cyclic voltammetric peak
current for the deposition of MnO2 is proportional to the square root of the Mn2+ ion
concentration in the electrolyte and independent of acidity. However, this evidence cannot
be used to derive such a complex mechanism.
Scheme 2 (Multistep of MnO2 Deposition Mechanism by Rodrigues et al.) Mn2+
bulk Mn2+surface
Mn2+surface Mn3+
ads + e-
H2O OHads + H+ + e-
2 Mn3+ads Mn2+
ads + Mn4+ads
Mn2+ads + 2 OHads MnO2 + 2 H+
Mn4+ads + 2 H2O MnO2 + 4 H+
35
Clarke, Browning and Donne (2006) investigated the effect of the concentrations of Mn(II)
and sulphuric acid on the deposition of MnO2 on platinum and observed that the increase
in peak current for oxidation of Mn2+ was not proportional to the increase in Mn(II)
concentration. This result has been interpreted in terms of a decrease in the substrate
catalytic activity as a result of manganese dioxide deposition. When the deposited
manganese dioxide delaminated from the substrate, the current increased as a result of
exposure to the more catalytic platinum surface. From the effect of acidity, they suggested
that MnOOH is the initial precipitated species in dilute acid (< 1.0 M) as shown in scheme
1. In more concentrated acid electrolytes, the adsorbed Mn3+ ion is more stable towards
hydrolysis, and so is able to undergo subsequent oxidation or disproportionation to form
MnO2 as shown in scheme 2. This was justified in terms of the expected lifetime of the
Mn(III) intermediate at various acid concentrations as obtained from rotating disc electrode
(RDE) and rotating ring disc electrode (RRDE) voltammetry. Furthermore, they also
suggested that the rate of oxidation is activation and not mass transport controlled.
However, the extent to which mass transport contributed to the rate of oxidation was found
to increase as both temperature and acid concentration increased, reflecting the catalytic
nature of the electrode surface and the extent to which the Mn(III) intermediate is soluble.
An alternative mechanism has been suggested in terms of which, Mn2+ ions may also be
oxidised directly to MnO4- at high oxidation potentials which then react with the Mn2+ ions
in the electrolyte to form Mn4+ (Pajunen, Aaroma & Forsen 2003). The Mn4+ ions
hydrolyse and form dispersed MnO2 in the bulk of the solution.

36
Scheme 3 (Mechanism of the MnO2 Deposition at Higher Potentials)
Mn2+ + 4 H2O MnO4- + 8 H+ + 5e-
2 MnO4- + 3 Mn2+ + 16 H+ 5 Mn4+ + 8 H2O
Mn4+ + 2 H2O = MnO2 + 4 H+
2.4.2 Electrochemical Oxidation of Manganese(II) Ions on Lead Anodes
Manganese ions are electrochemically active at lead or lead alloy anodes and may
precipitate manganese oxide after PbO2 is formed on the anode and before extensive
evolution of oxygen occurs. It has been shown that the electrochemical deposition of
manganese on the anode may act favorably to minimize disintegration of the anode scale
by decreasing the amount of lead oxidized to PbO2 anodes (Yu & O’Keefe 2002).
The mechanism of MnO2 deposition on lead anodes appears to be different from that on
‘inert’ electrodes. Thus PbO2 electrodes seem to have significant catalytic properties for
the oxidation of Mn2+ to MnO4-, but not for the oxidation of Mn2+ to Mn3+ (Zhang & Park
1994). Cheng et al. (2000) also suggested that there was no evidence for the presence of
Mn4+ in the electrolyte during oxidation of Mn2+ on a PbO2 anode.
Kelsall et al. (2000) suggested that anodic oxidation of Mn2+ ions on Pb/PbO2 anode
operating at potentials above 1.8 V with a current density of 500 A/m2 involves reaction
2.32 coupled to the homogeneous electron transfer reaction 2.26.
Mn2+ + 4H2O = MnO4- + 8H+ + 5e- (2.32)
37
As mentioned above, manganese(III) ions are unstable except in very concentrated acid
solutions and disproportionate by the reaction (2.25) to form MnO2.
The MnO2 deposited on the anode and formed by disproportionation in solution were both
reported to be γ-MnO2 which is a solid solution of MnO2 and a lower oxidation state
manganese oxide containing hydroxyl ions and water. The general formula has been
proposed as MnOn.(2-n)H2O, which is MnO2 for n = 2, and MnOOH for n =1.5.
Comninellis and Petitpierre (1991) reported that Ag(I) is a very effective catalyst for the
oxidation of Mn2+ to MnO4- in sulphuric acid solution by way of Ag(II) as an intermediate
at anodic potentials below 1.945 V,
5Ag(I) = 5Ag(II) + 5e- (2.33)
Mn2+ + 4H2O + 5Ag(II) MnO4- + 5Ag(I) + 8H+ (2.34)
Above 1.945 V, AgO is deposited at the anode and the current efficiency for formation of
permanganate decreases due to the simultaneous evolution of oxygen.
5Ag(I) + 5H2O = 5AgO + 10H+ + 5e- (2.35)
Mn2+ + 5H2O + 5AgO MnO4- + 5Ag(I) + 10H+ (2.36)
Yu and O’Keefe (2002) also suggested that the formation of MnO2 occurs via
disproportionation of Mn3+ (reaction 2.25) or the hydrolysed form
2MnOH2+ = Mn2+ + MnO2 + 2H+ (2.37)
They suggested that the MnO2 formed could catalyse the disproportionation of Mn3+. They
found that MnO2 not only deposited on the PbO2 surface but extensive deposition of MnO2
38
also occurred on the insulating material surrounding the anode. They confirmed that Mn3+
could be produced from Mn2+ oxidation (reaction 2.24), the reaction between Mn2+ and
MnO4- (reaction 2.26) and/or the oxidation of Mn2+ by PbO2 (reaction 2.38).
2Mn2+ + PbO2 + HSO4- + 3H+ 2Mn3+ + PbSO4 + 2H2O (2.38)
They found that a high Mn2+ concentration and low electrode potential favour the
formation of Mn3+ and MnO2 while the formation of MnO4- is enhanced at higher
potentials. The precipitation of MnO2 was observed on the walls and bottom of the cell,
indicating that reaction (2.26) might occur in the bulk electrolyte followed by reaction
(2.25) which when combined could give the overall reaction
3Mn2+ + 2MnO4- + 2H2O 5MnO2 + 4H+ (2.39)
The MnO2 formed on PbCaSn anode has been characterised by Ipinza et al. (2003) as a
double layer consisting of a thick external layer of non-adhering and easily removable
scale and a thin internal layer which adheres relatively well to the surface of the electrode.
They suggested that MnO2 slimes were composed of
• Hexagonal ε-MnO2 as a non-adhering layer produced by oxidation on the PbO2
surface as an amorphous structure which slowly crystallises in contact with the electrolyte;
and
• Tetragonal β-MnO2 which is produced by a chemical precipitation reaction at the
electrode-electrolyte interface which may be catalysed by PbO2 active sites. The
precipitation starts as a result of formation of MnO4- as suggested by Yu and O’Keefe
(2002).
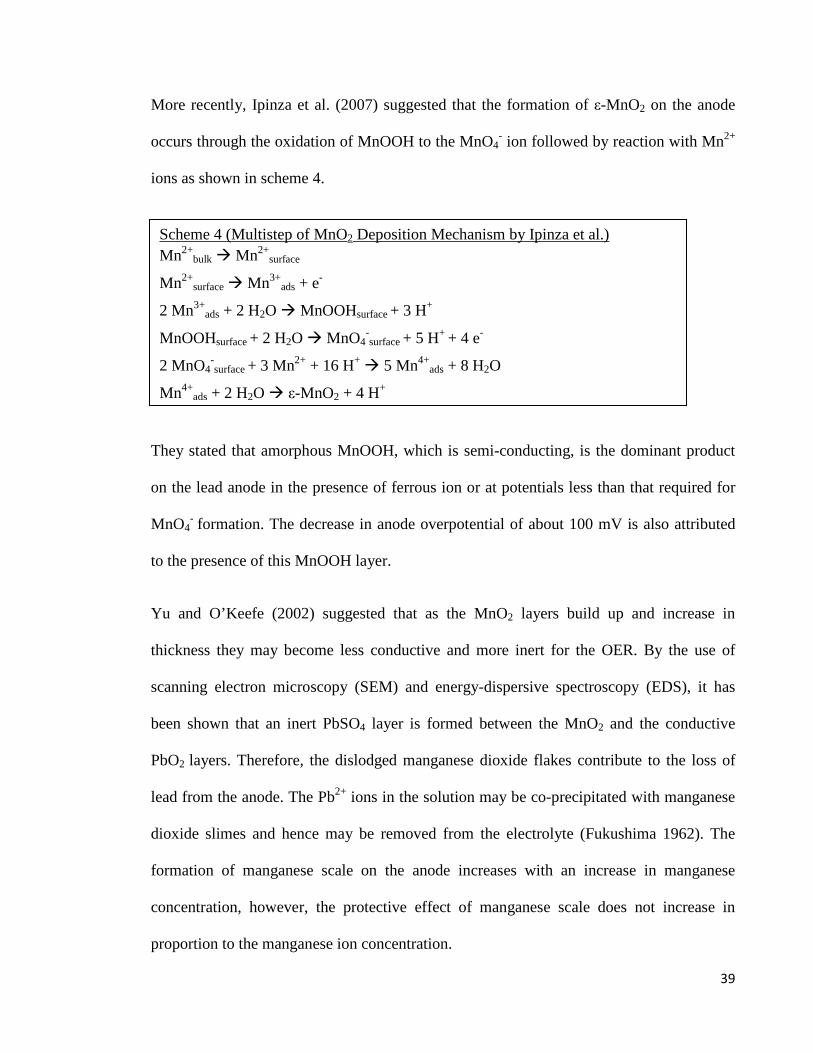
39
More recently, Ipinza et al. (2007) suggested that the formation of ε-MnO2 on the anode
occurs through the oxidation of MnOOH to the MnO4- ion followed by reaction with Mn2+
ions as shown in scheme 4.
They stated that amorphous MnOOH, which is semi-conducting, is the dominant product
on the lead anode in the presence of ferrous ion or at potentials less than that required for
MnO4- formation. The decrease in anode overpotential of about 100 mV is also attributed
to the presence of this MnOOH layer.
Yu and O’Keefe (2002) suggested that as the MnO2 layers build up and increase in
thickness they may become less conductive and more inert for the OER. By the use of
scanning electron microscopy (SEM) and energy-dispersive spectroscopy (EDS), it has
been shown that an inert PbSO4 layer is formed between the MnO2 and the conductive
PbO2 layers. Therefore, the dislodged manganese dioxide flakes contribute to the loss of
lead from the anode. The Pb2+ ions in the solution may be co-precipitated with manganese
dioxide slimes and hence may be removed from the electrolyte (Fukushima 1962). The
formation of manganese scale on the anode increases with an increase in manganese
concentration, however, the protective effect of manganese scale does not increase in
proportion to the manganese ion concentration.
Scheme 4 (Multistep of MnO2 Deposition Mechanism by Ipinza et al.) Mn2+
bulk Mn2+surface
Mn2+surface Mn3+
ads + e-
2 Mn3+ads + 2 H2O MnOOHsurface + 3 H+
MnOOHsurface + 2 H2O MnO4-surface + 5 H+ + 4 e-
2 MnO4-surface + 3 Mn2+ + 16 H+ 5 Mn4+
ads + 8 H2O
Mn4+ads + 2 H2O ε-MnO2 + 4 H+

40
The rate of formation of manganese dioxide is more significant on Pb-Ag anodes than on
Pb-Ca-Sn anodes, with a thicker layer forming on the former material. The presence of
cobalt (II) ions in the electrolyte also enhances the rate of formation of MnO2 on Pb-Ca-Sn
anodes, although the oxide that forms is denser and less powdery. It has been suggested
that there are possible catalytic effects of the Ag(I/II) and Co(II/III) couples on the
oxidation of manganese ions (Yu & O’Keefe 2002; Cachet, Rerolle & Wiart 1999).
2.5 Electrochemical Oxidation of Cobalt(II) Ions on Lead
The strong beneficial effects of cobalt in lowering both the oxygen overvoltage and the
corrosion rate of lead alloy anodes have been well established. However, the exact
mechanism by which cobalt acts on the oxidation process has not been resolved. It is
apparent that the anodic film formed on lead alloy anodes in the presence of cobalt ions is
more adherent, thin and compact. Therefore, there is a reduced tendency for the oxide
scales to become dislodged. This provides another significant benefit in reducing the extent
of lead contamination of the cathodes.
Krivolapova and Kabanov (1953) proposed that cobalt decreases the oxidation of lead by
the adsorption of Co3+ ions or CoO2 in the pores of the lead oxide, possibly forming a
dense blocking film. This assumption was based in part on observations that the color of
the Pb-Sb anodes was pale red in the presence of cobalt ions.
Yu and O’Keefe (2002) reported that the effect of cobalt is only observed at potentials
above 1.8 V where the oxygen evolution was enhanced significantly. The effect is more
pronounced with increasing cobalt concentration (Gendron, Ettel & Abe 1975). Koch

41
(1959) also stated that the beneficial effect of cobalt in reducing the corrosion of lead is
effective at potentials above 1.83 V where Co2+ ions are oxidized to Co3+ ions (reaction
2.40).
In agreement with Koch (1959), Ramachandran et al. (1996) reported that when oxygen
was evolved in the presence of cobalt, very much less PbO2 was formed on the lead anode.
They suggested that oxygen evolution occurs more readily in the presence of cobalt ions
and therefore once a conducting PbO2 layer is formed a greater fraction of the current may
be used for the oxygen evolution in preference to the oxidation of PbSO4. Koch (1959)
postulated that cobalt ions supply an alternative pathway for the OER by means of the
following reactions.
Co2+(aq) Co3+
(aq) + e- E0 = 1.83 V (2.40)
Co3+(aq) + OH- CoOH2+
(aq) (2.41)
2CoOH2+(aq) 2Co2+
(aq) + H2O + O (2.42)
O + O O2 (2.43)
The oxidation of Co2+ ions is likely to be catalyzed by the PbO2 surface and the resulting
Co3+ ions are adsorbed on the surface and undergo reduction by oxidation of water.
In a similar mechanism, it was suggested by Antonov and Stepanenko (1972) that the
catalytic effect of cobalt on the OER is due to the following continuous process that takes
place on the anode:
4 Co3+(ads) + 2 H2O = 4 Co2+
(ads) + 4 H+ + O2 (2.44)
Co2+(ads) = Co3+
(ads) + e- (2.45)
42
They assumed that the Co2+ or Co3+ ions in the solution are adsorbed on the active areas of
the lead anodic surface. The unstable oxidized cobalt inside the protective layer then
oxidizes water, which reaction is catalytically accelerated in the presence of PbO2. It is
suggested that this circular catalytic process is responsible for the lower potential at the
anode. This hypothesis was later supported by Gendron, Ettel and Abe (1975) who also
observed a reduction in the anode potential by about 100 mV during the polarization of a
Pb-Sb anode at 300 A m-2 in the presence of 3 g L-1 cobalt. The absence of any significant
amount of cobalt on the surface of the aged anodes confirms the instability of the oxidized
cobalt compounds.
More recently, an alternative mechanism was suggested by Nguyen and Atrens (2009) who
did not support the cobalt film mechanism. They postulated that cobalt ions hinder the
oxidation of lead by the formation of a more protective corrosion product. By the use of X-
ray diffraction (XRD) and X-ray photon electron spectroscopy (XPS) techniques, they
revealed that the surface anodic film in the presence of cobalt ions was thin and compact
and there are no crystalline compounds of cobalt. They suggested that cobalt increases the
imperviousness of the α-PbO2 layer in hindering both the oxidation of metallic lead to α-
PbO2 and the oxidation of PbSO4 to β-PbO2. Danilov, Velichenko and Nishcheryakova
(1992) explained that cobalt ions increase the amount of labile oxygen containing species
and decrease the number of adsorbed hydroxyl species that are strongly bound to the anode
surface. As a result, the formation of lead oxides is inhibited.

43
2.6 Scope of the Present Research
The aim of this project is to develop a fundamental understanding of the role of manganese
ions in the corrosion and electrocatalytic behaviour of selected lead alloys in the
electrowinning of zinc and copper. In order to achieve this objective, an investigation has
been conducted into the oxidation of both lead as an anode material and manganese as ions
on lead alloy anodes, in particular Pb-Ag and Pb-Ca-Sn anodes, in sulphuric acid solutions
containing manganese ions.
The electrochemical study was to be performed using rotating disc electrodes involving
potentiostatic and galvanostatic oxidation followed by negative potential sweeps at various
manganese concentrations, oxidation potentials, times of oxidation and silver alloy
concentrations. The electrochemical measurements were complemented by chemical
analyses of the oxidised manganese species formed during the oxidation process, which
allow for the determination of the partial charge involved in oxidation of lead and
manganese as well as for oxygen evolution.
The results of this study will assist in deriving a mechanism for the oxidation of
manganese ions on these lead alloy anodes and in the understanding of the role of
manganese in the electrowinning processes for both copper and zinc.

44
Chapter 3
EXPERIMENTAL
Several electrochemical and analytical techniques have been selected to investigate the role
of manganese ions in the electrolytic behaviour of Pb-Ag and Pb-Ca-Sn anodes. These
techniques include: (1) potentiostatic or (2) galvanostatic electrolysis followed by (3)
linear potential sweep voltammetry, (4) UV-visible spectroscopy and (5) potentiometric
titration for analysis of the manganese species. This chapter describes these techniques and
their procedures.
3.1 Electrochemical Measurements
The study of the kinetics of electrochemical reactions involves measurements of the rate or
currents as a function of the potential. A three electrode system is generally utilised for the
electrochemical measurements, involving a working electrode, a reference electrode and a
counter electrode. The counter electrode is used to make an electrical connection to the
electrolyte so that a current can be applied to the working electrode. The reference
electrode has a stable and well-known electrode potential which is used as a reference
which enables the working electrode potential to be established.
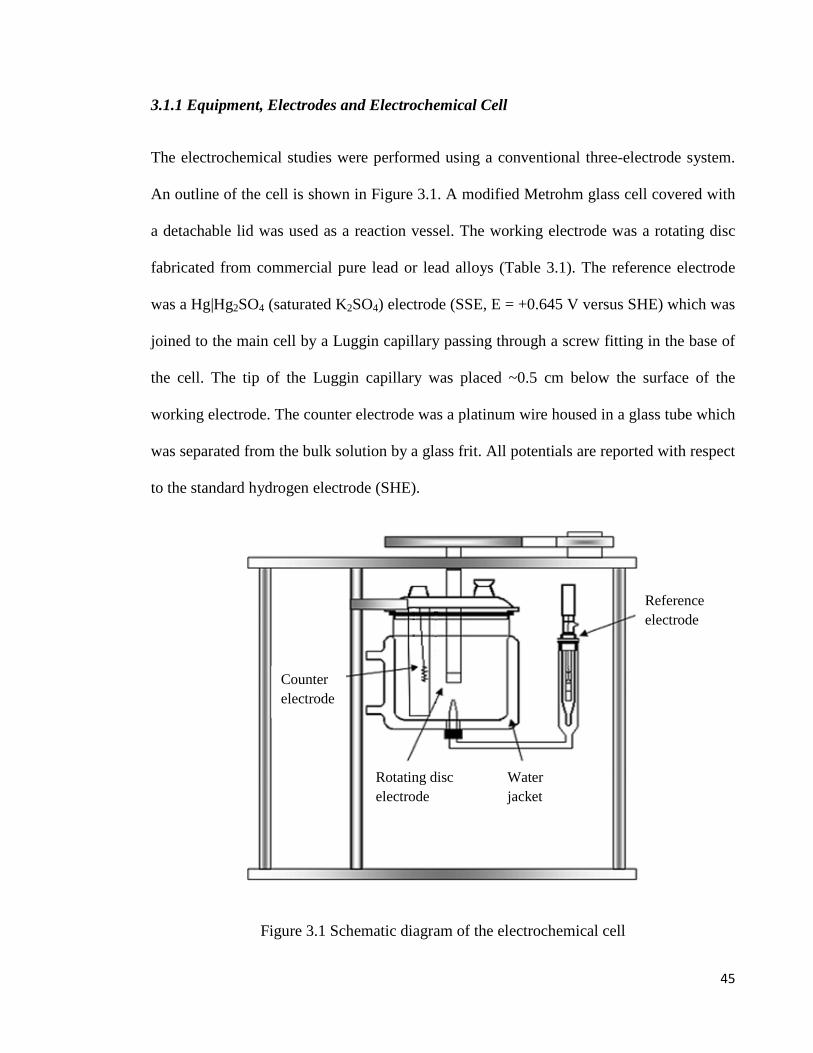
45
3.1.1 Equipment, Electrodes and Electrochemical Cell
The electrochemical studies were performed using a conventional three-electrode system.
An outline of the cell is shown in Figure 3.1. A modified Metrohm glass cell covered with
a detachable lid was used as a reaction vessel. The working electrode was a rotating disc
fabricated from commercial pure lead or lead alloys (Table 3.1). The reference electrode
was a Hg|Hg2SO4 (saturated K2SO4) electrode (SSE, E = +0.645 V versus SHE) which was
joined to the main cell by a Luggin capillary passing through a screw fitting in the base of
the cell. The tip of the Luggin capillary was placed ~0.5 cm below the surface of the
working electrode. The counter electrode was a platinum wire housed in a glass tube which
was separated from the bulk solution by a glass frit. All potentials are reported with respect
to the standard hydrogen electrode (SHE).
Figure 3.1 Schematic diagram of the electrochemical cell
Reference electrode
Rotating disc electrode
Counter electrode
Water jacket
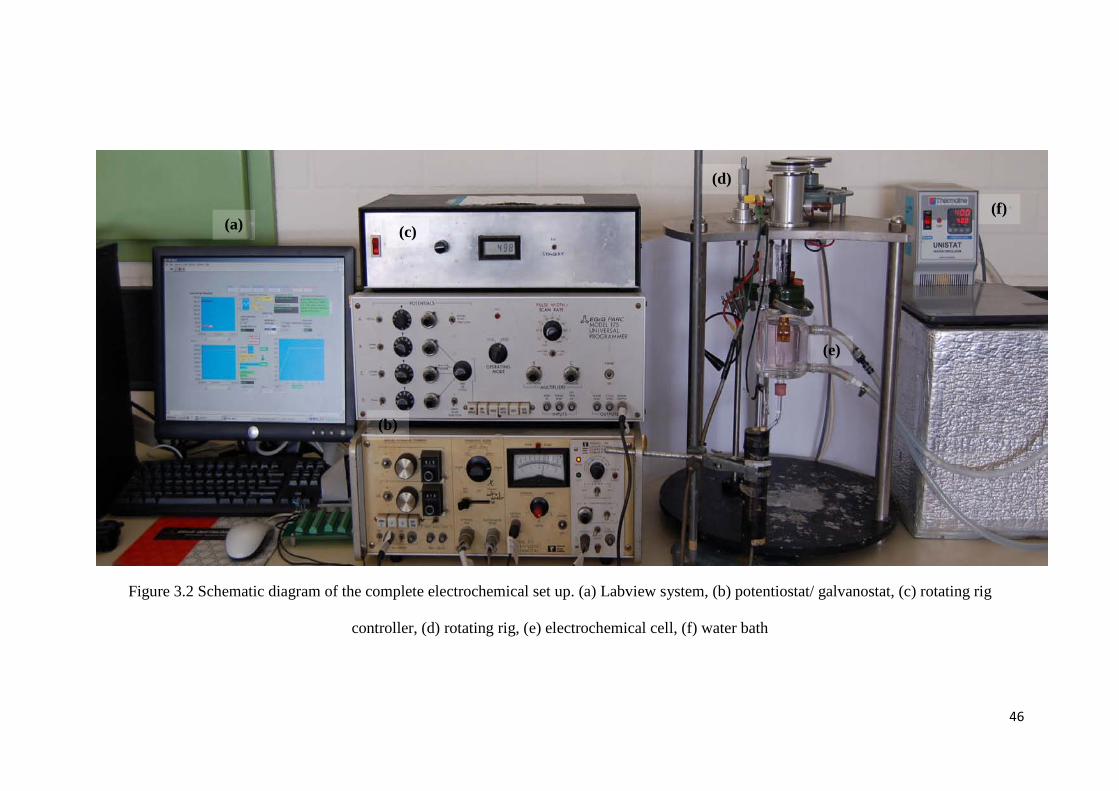
46
Figure 3.2 Schematic diagram of the complete electrochemical set up. (a) Labview system, (b) potentiostat/ galvanostat, (c) rotating rig
controller, (d) rotating rig, (e) electrochemical cell, (f) water bath
(a)
(b)
(c)
(d)
(e)
(f)
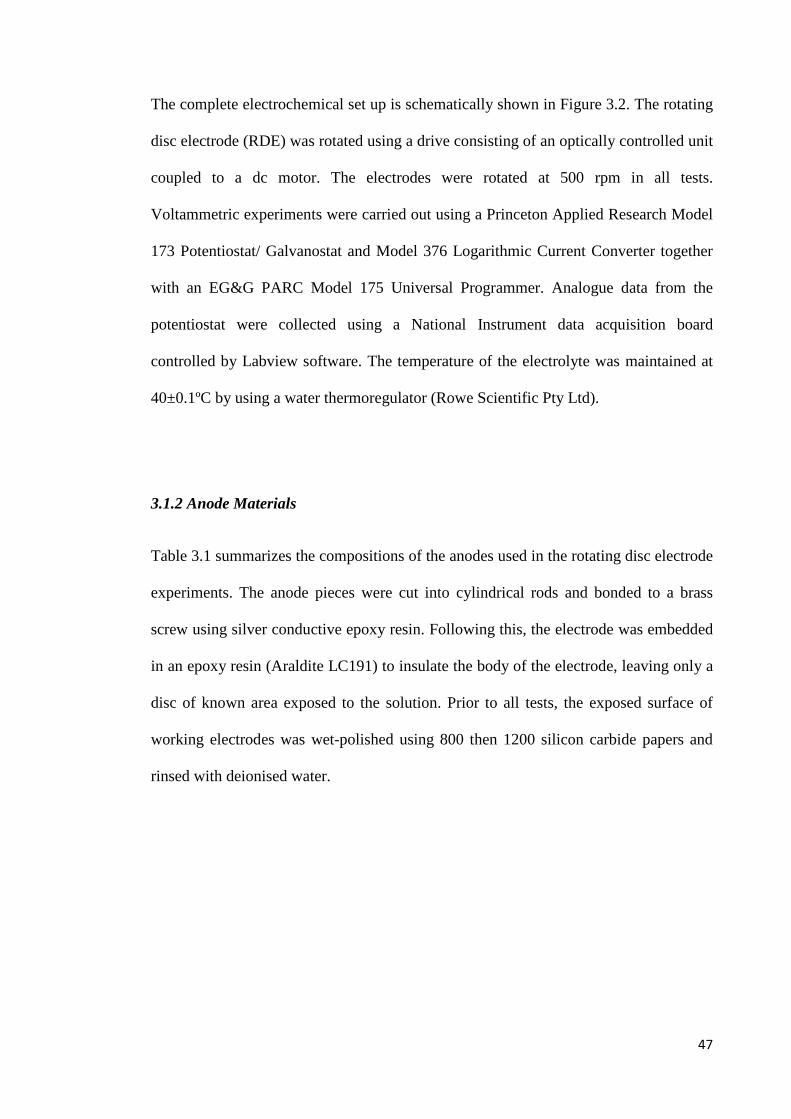
47
The complete electrochemical set up is schematically shown in Figure 3.2. The rotating
disc electrode (RDE) was rotated using a drive consisting of an optically controlled unit
coupled to a dc motor. The electrodes were rotated at 500 rpm in all tests.
Voltammetric experiments were carried out using a Princeton Applied Research Model
173 Potentiostat/ Galvanostat and Model 376 Logarithmic Current Converter together
with an EG&G PARC Model 175 Universal Programmer. Analogue data from the
potentiostat were collected using a National Instrument data acquisition board
controlled by Labview software. The temperature of the electrolyte was maintained at
40±0.1ºC by using a water thermoregulator (Rowe Scientific Pty Ltd).
3.1.2 Anode Materials
Table 3.1 summarizes the compositions of the anodes used in the rotating disc electrode
experiments. The anode pieces were cut into cylindrical rods and bonded to a brass
screw using silver conductive epoxy resin. Following this, the electrode was embedded
in an epoxy resin (Araldite LC191) to insulate the body of the electrode, leaving only a
disc of known area exposed to the solution. Prior to all tests, the exposed surface of
working electrodes was wet-polished using 800 then 1200 silicon carbide papers and
rinsed with deionised water.

48
Table 3.1 Anodes used in rotating disc electrode experiment
Anode Composition Process Diameter (mm) Sources
Pure Pb 99.99% Pb Rolled 4.2 Consolidated Alloys
Pb-Ag Pb-0.25%Ag Rolled 5.0 RSR Corporation Pb-Ag Pb-0.42%Ag Rolled 5.0 Hudson Bay
Pb-Ag Pb-0.75%Ag Cast 5.0 Consolidated Alloys
Pb-Ag Pb-1.0%Ag Rolled 5.0 RSR Corporation Pb-Ag Pb-2.0%Ag Rolled 5.0 RSR Corporation
Pb-Ca-Sn Pb-0.08%Ca-1.3%Sn-0.01%Al Rolled 5.0 Consolidated Alloys
3.1.3 Electrolyte Composition
All electrolyte solutions were prepared from chemicals of analytical grade and high
quality water from a Millipore Milli-Q distilled water as shown in Table 3.2. The
experiments were carried out in sulphuric acid solutions containing only manganese
ions, unless otherwise specified.
Table 3.2 Chemicals used for the electrolyte solutions
Reagent Supplier Grade Chemical Composition Sulphuric acid Merck AR (98%) H2SO4
Manganese Sulphate Chem-Supply AR MnSO4.H2O Cobalt Sulphate Univar AR CoSO4.7H2O
Phosphoric acid (ortho) Rowe Scientific AR (85%) H3PO4 Ferrous Sulphate Chem-Supply AR FeSO4.7H2O
Four different concentrations of sulphuric acid (50, 100, 150 and 200 g L-1) were used
in the preliminary testwork to examine the effect of acidity on the anodic behaviour of
the Pb-0.42%Ag anode. A sulphuric acid solution of concentration 150 g L-1 was then
used as the base electrolyte for subsequent experiments.

49
The role of manganese ions was investigated by adding 0.1, 1, 5 or 10 g L-1 Mn2+ ions
to the base electrolyte. The tests were initially conducted in 100 mL of electrolyte and
then in 200 mL of electrolyte as required for the longer experiments.
Cobalt ion (150 mg L-1) was also added for the galvanostatic electrolysis of the Pb-Ca-
Sn anode to study its effects on the oxidation of both lead and manganese. The tests
were conducted in the base electrolyte containing either 0.1 or 1 g L-1 Mn2+ ions.
Phosphoric acid can be used to complex the manganic Mn3+ ion and hence reduce its
disproportionation to MnO2 (Velayutham, Noel & Chidambaram 1993). Various
concentrations of phosphoric acid (1.78, 17.83 and 35.66 g L-1) were added to the base
electrolyte containing 1 g L-1 Mn2+ ion for the galvanostatic electrolysis of the Pb-
0.75%Ag anode.
Cyclic voltammetry in solution containing ferrous ion (10 g L-1) was performed to
study the electrochemical oxidation of iron(II) ions in comparison with manganese(II)
ions on both Pb-0.42%Ag and Pb-Ca-Sn anodes.
3.1.4 Electrochemical Test Methods
3.1.4.1 Potentiostatic Electrolysis
This electrochemical measuring technique is applied to determine the kinetics and
mechanism of electrode reactions based on the control of the electrode potential. Hence
a constant potential was applied and the variation of current was observed as a function
of time.
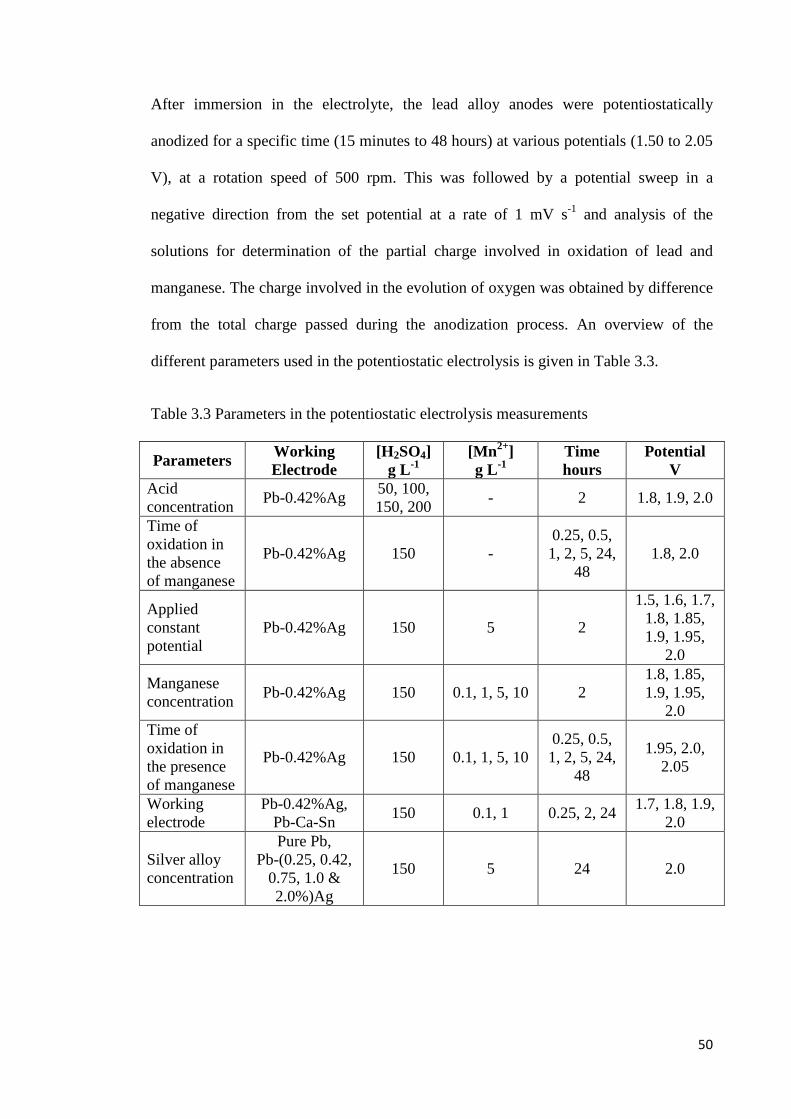
50
After immersion in the electrolyte, the lead alloy anodes were potentiostatically
anodized for a specific time (15 minutes to 48 hours) at various potentials (1.50 to 2.05
V), at a rotation speed of 500 rpm. This was followed by a potential sweep in a
negative direction from the set potential at a rate of 1 mV s-1 and analysis of the
solutions for determination of the partial charge involved in oxidation of lead and
manganese. The charge involved in the evolution of oxygen was obtained by difference
from the total charge passed during the anodization process. An overview of the
different parameters used in the potentiostatic electrolysis is given in Table 3.3.
Table 3.3 Parameters in the potentiostatic electrolysis measurements
Parameters Working Electrode
[H2SO4] g L-1
[Mn2+] g L-1
Time hours
Potential V
Acid concentration Pb-0.42%Ag 50, 100,
150, 200 - 2 1.8, 1.9, 2.0
Time of oxidation in the absence of manganese
Pb-0.42%Ag 150 - 0.25, 0.5, 1, 2, 5, 24,
48 1.8, 2.0
Applied constant potential
Pb-0.42%Ag 150 5 2
1.5, 1.6, 1.7, 1.8, 1.85, 1.9, 1.95,
2.0
Manganese concentration Pb-0.42%Ag 150 0.1, 1, 5, 10 2
1.8, 1.85, 1.9, 1.95,
2.0 Time of oxidation in the presence of manganese
Pb-0.42%Ag 150 0.1, 1, 5, 10 0.25, 0.5, 1, 2, 5, 24,
48
1.95, 2.0, 2.05
Working electrode
Pb-0.42%Ag, Pb-Ca-Sn 150 0.1, 1 0.25, 2, 24 1.7, 1.8, 1.9,
2.0
Silver alloy concentration
Pure Pb, Pb-(0.25, 0.42,
0.75, 1.0 & 2.0%)Ag
150 5 24 2.0

51
3.1.4.2 Galvanostatic Electrolysis
The rate of the electrochemical reaction by the galvanostatic method was measured by
applying a constant current to an electrode and the variation of the resultant potential
was observed as a function of time.
The lead alloy anodes were oxidized at either 300 (typical of copper electrowinning) or
500 (typical of zinc electrowinning) A m-2 in the electrolyte for 24 hours at a rotation
speed of 500 rpm, followed by a potential sweep in a negative direction at a rate of 1
mV s-1. This technique was employed to determine the effect of alloying elements as
well as that of manganese and manganese-cobalt ions on oxygen overvoltage during
polarization of the Pb-Ag and Pb-Ca-Sn anodes. The sulphuric acid concentration was
150 g L-1 and the temperature was held constant at 40ºC for all experiments. Table 3.4
gives an overview of the different parameters used in the galvanostatic experiments.
Table 3.4 Parameters in the galvanostatic electrolysis measurements
Working Electrode
Current Density A m-2
[Mn2+] g L-1
[Co2+] g L-1
[H3PO4] g L-1
Pure Pb 500 0, 1, 5 - - Pb-0.75%Ag 500 0, 0.1, 1, 5 - - Pb-0.75%Ag 500 1 - 1.78, 17.83, 35.66
Pb-Ca-Sn 500 0, 1 - - Pb-Ca-Sn 300 0, 0.1, 1, 5 - - Pb-Ca-Sn 300 - 0.15 - Pb-Ca-Sn 300 0.1, 1 0.15 -
3.1.4.3 Linear Sweep Voltammetry
Linear sweep voltammetry is a potentiodynamic method in which the current at the
working electrode is measured while the potential applied to the working electrode is
52
varied linearly in time. The scan rate of the potential sweep has units of volts per unit
time. The anodic or cathodic processes of species are typically shown as peaks in the
current signal at the potential at which the species is oxidized or reduced.
All voltammograms in this work were initiated from the rest potential established after
potentiostatic or galvanostatic polarization of the lead alloy anodes as mentioned above.
The potential was swept in the negative direction at 1 mV s-1 and stopped at -0.9 V.
3.1.4.4 Cyclic Voltammetry
Cyclic voltammetry is an extension of linear sweep voltammetry in which the voltage is
swept between two switching potentials in alternate anodic and cathodic directions. The
potential can be cycled for several cycles before the experiment is ended at the final
potential. This technique has been widely used for studying the phase composition of
oxide layers as well as the kinetic parameters of the reactions at lead alloy anodes in
sulphate solution. In these experiments, the cyclic polarization curves are obtained
initially from the open circuit potential to the potential region of oxygen evolution and
then reversed in the negative direction to the potential region of hydrogen evolution.
3.1.4.5 Rotating Disc Electrode
The rotating disc electrode is a valuable tool in electrochemistry for the study of
electrochemical reactions under conditions of controlled mass transport. It is generally
used as a working electrode which consists of a cylindrical metal rod (or other electrode
material) embedded in a larger cylindrical non-conductive resin or polymer that can be
rotated at a controlled variable speed. As the electrode rotates, it creates convective
53
flow perpendicular to the electrode which transforms into radial flow out from the
surface of the electrode. Providing the rotation speed is kept within the limits of
laminar flow then the rate of mass transport can be calculated from the Levich
equation, which can be written in terms of a limiting current density as follows
iL = (0.620) n F A D2/3 w1/2 v-1/6 C
in which iL is the limiting current density; n is the number of electrons transferred in the
electrochemical reaction; F is the Faraday constant; A is the electrode area; D is the
diffusion coefficient of the electroactive species; w is the angular rotation rate of the
electrode; v is the kinematic viscosity; and C is the concentration of the electroactive
species. According to the Levich equation, the current observed at a rotating disc
electrode increases linearly with the square root of the rotation rate and the
concentration of the electroactive species.
3.2 Analytical Measurements
3.2.1 Visible Spectroscopy
Visible spectroscopy was used to identify the high-oxidation state manganese species in
solution, namely manganic (Mn3+) and permanganate (MnO4-) ions. The visible
absorption spectrum of Mn3+ ions has a broad absorbance maximum at 482 nm, while
MnO4- ion gives maxima at 488, 506, 524, 544 and 565 nm (Cheng et al. 2000). At the
end of each test, samples of the electrolyte were filtered (membrane pore size 0.45 µm)
and transferred to a Unicam 1.0 cm Optical Path Length Quartz Glass cell for
immediate spectral analysis. An Agilent 8453 UV-Visible Spectrophotometer was used
to scan from 900 to 350 nm at a rate of 600 nm/min.
54
The results of the absorbance measurements showed that in all cases only Mn3+ ions
and no MnO4- ion was present.
3.2.2 Potentiometric Titrations
At the end of each experiment involving potentiostatic oxidation and subsequent linear
cathodic sweep voltammetry, the concentrations of the manganic ion as well as any
precipitated MnO2 solid were determined by first reacting the solution and solids with
excess ferrous ammonium sulphate and then back titrating with standard potassium
dichromate solution.
3.2.2.1 Reagents
All solutions were prepared from chemicals of analytical grade and deionised water.
Solutions of ferrous ammonium sulphate ((NH4)2(SO4)2.6H2O) of concentrations 0.01
and 0.05 M were prepared by dissolving the required amount in 0.1 M sulphuric acid. A
solution of potassium dichromate (K2Cr2O7) of 0.01 M was used as the titrant.
3.2.2.2 Apparatus
A Radiometer-Copenhagen ETS822 end-point autotitration which comprises of ABU80
autoburette, TTT80 titrator, TTA80 titration assembly, PHM82 standard pH meter
equipped with a combined platinum ring electrode in 3 M KCl (Metrohm 6.0451.100)
was used.
55
3.2.2.2 Procedure
The concentration of the ferrous ammonium sulphate solutions were determined by
titrating 25 mL aliquots with 0.01 M potassium dichromate (reaction 3.1) to an end-
point potential of 599 mV.
Cr2O72- + 6Fe2+ + 14H+ 2Cr3+ + 6Fe3+ + 7H2O (3.1)
0.01M ferrous solutions were used for analysis of the Mn3+ ions and MnO2 solids after
electrolysis periods of less than 24 hours, while the higher ferrous concentration (0.05
M) was required for analysis of the greater amounts of manganese oxidized after longer
periods.
The concentration of the manganic ion was determined by reacting 25 mL of the
filtered electrolyte with 25 mL of excess ferrous ammonium sulphate. The amount of
MnO2 was determined by dissolving the MnO2 solids that were precipitated on the wall
of the cell, in the bulk of the solution and on the rotating disc electrode in 25 mL of the
stirred ferrous solution. The unreacted ferrous ion was then back titrated with
potassium dichromate. The amounts of Mn3+ and MnO2 were calculated from the
amount of ferrous ions consumed according to the following equations.
Mn3+ + Fe2+ = Mn2+ + Fe3+ (3.2)
MnO2 + 2Fe2+ = Mn2+ + 2Fe3+ (3.3)
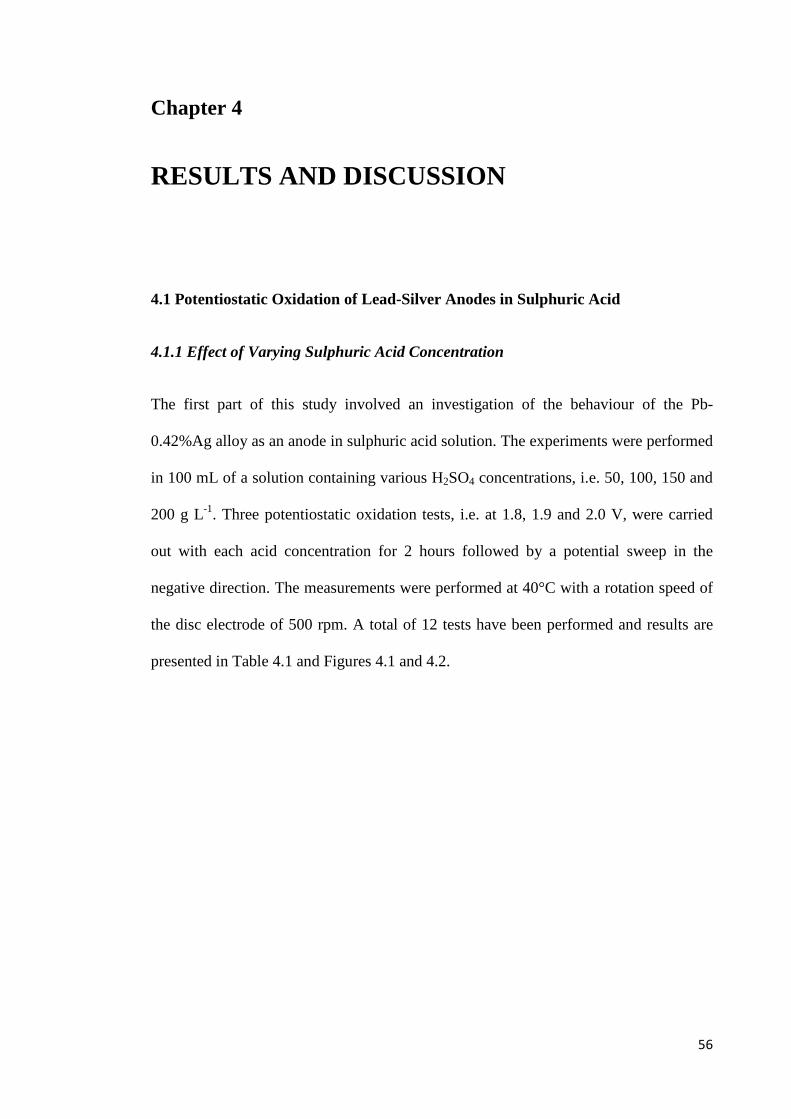
56
Chapter 4
RESULTS AND DISCUSSION
4.1 Potentiostatic Oxidation of Lead-Silver Anodes in Sulphuric Acid
4.1.1 Effect of Varying Sulphuric Acid Concentration
The first part of this study involved an investigation of the behaviour of the Pb-
0.42%Ag alloy as an anode in sulphuric acid solution. The experiments were performed
in 100 mL of a solution containing various H2SO4 concentrations, i.e. 50, 100, 150 and
200 g L-1. Three potentiostatic oxidation tests, i.e. at 1.8, 1.9 and 2.0 V, were carried
out with each acid concentration for 2 hours followed by a potential sweep in the
negative direction. The measurements were performed at 40°C with a rotation speed of
the disc electrode of 500 rpm. A total of 12 tests have been performed and results are
presented in Table 4.1 and Figures 4.1 and 4.2.

57
Time (seconds)
Figure 4.1 Current-time transients during oxidation of Pb-0.42%Ag anodes at various
sulphuric acid concentrations
(A) Oxidation at 1.8 V
(B) Oxidation at 1.9 V
(C) Oxidation at 2.0 V

58
The cumulative charge (QT) passed during oxidation for 2 hours under each condition
was obtained from the current-time curves in Figure 4.1. It is apparent from the current
densities measured and the total charge passed that the rate of oxidation increased
substantially as the potential was increased to 2.0 V. Oxygen evolution was more
readily visually observed at 2.0 V. The charge passed during oxidation at all potentials
decreased with increasing acidity as shown in Table 4.1. The current-time curves
exhibit current maxima in the initial stages of oxidation at 1.8 and 1.9 V which also
varied with the acidity.
Table 4.1 Effect of acid concentration on the charge fraction for Pb oxidation and O2
evolution
[H2SO4]
/ g.L-1
Total Charge, QT
/ Coulomb
Charge Fraction for Pb
Oxidation, QPb/QT
Charge Fraction for O2
Evolution, QO2/QT
Oxidation at 1.8 V 50 1.083 0.911 0.089
100 0.598 0.905 0.095
150 0.303 0.858 0.142
200 0.464 0.791 0.209
Oxidation at 1.9 V 50 2.738 0.147 0.853
100 2.096 0.206 0.794
150 1.859 0.145 0.855
200 1.577 0.199 0.801
Oxidation at 2.0 V 50 94.800 0.006 0.994
100 66.698 0.007 0.993
150 62.479 0.007 0.994
200 48.277 0.010 0.990
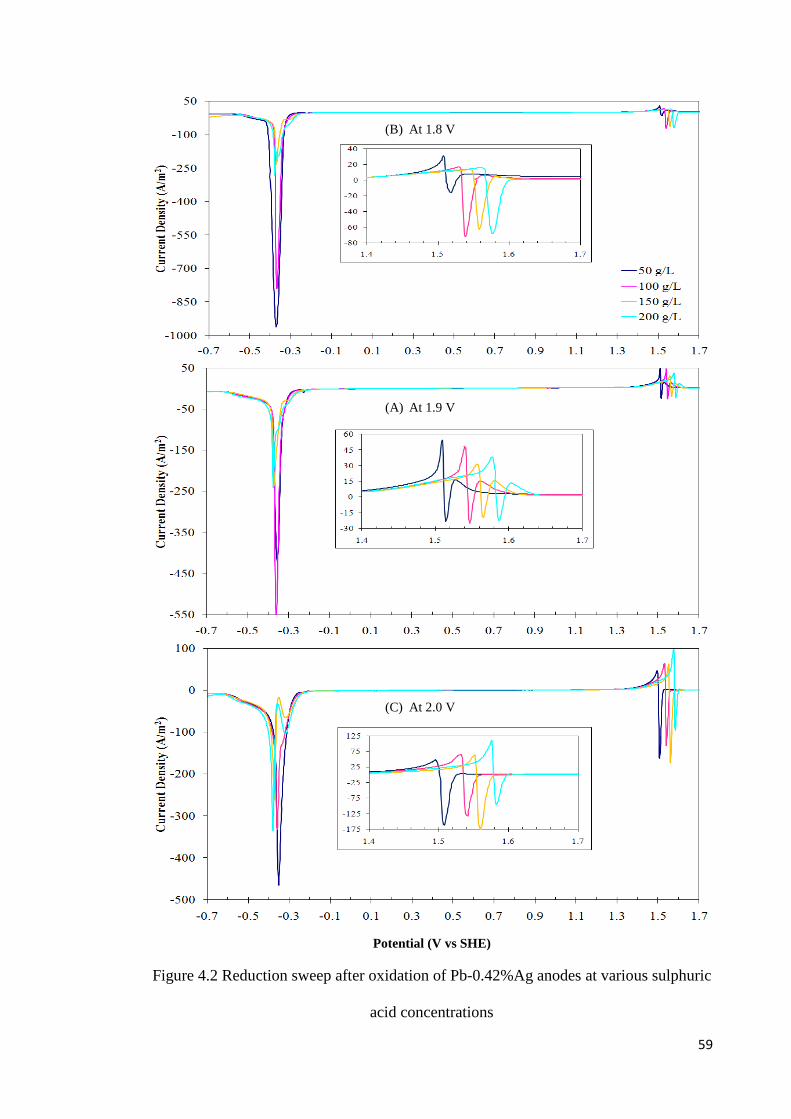
59
Potential (V vs SHE)
Figure 4.2 Reduction sweep after oxidation of Pb-0.42%Ag anodes at various sulphuric
acid concentrations
(A) At 1.9 V
(C) At 2.0 V
(B) At 1.8 V

60
Figure 4.2 shows the cathodic sweeps at 1 mV s-1 after each of the oxidation periods
with the inset showing the voltammograms between 1.4 and 1.7 V. As the potential was
swept in a negative direction, two cathodic peaks are observed which are due to the
reduction of PbO2 to PbSO4 at 1.6 to 1.5 V followed by that of PbO and PbSO4 to Pb at
-0.2 to -0.6 V with a passive region between 1.4 to -0.2 V. The charges associated with
the oxidation of lead (QPb) were obtained from the integration of the area under each of
these peaks and the results are also shown in Table 4.1. The appearance of anodic
current peaks during the reduction of PbO2 to PbSO4 (1.5 to 1.6 V) has been attributed
to the oxidation of lead exposed in the process of reduction of PbO2 to PbSO4. The
magnitude of these peaks can be correlated to the small cathodic peak appearing at -
0.25 to -0.35 V which has previously been assigned to the reduction of PbO (Sharpe
1975).
It has been suggested by Sharpe (1975) that PbSO4 formed on the surface of the
discharging PbO2 might possess perm-selectivity, so that OH- ions become localized in
the interior of the corrosion film and are responsible for the reaction.
Pb + 2OH- = PbO + H2O + 2e- (4.1)
The charge for oxygen evolution (QO2) during oxidation was calculated from the
difference between the total charge (QT) and the charge for the oxidation of lead (QPb).
As can be seen from Table 4.1, after 2 hours at 1.8 V, about 90 % of the total charge is
utilised for oxidation of lead. The experiment at 1.8 V was repeated with 100 g L-1
H2SO4 for 300 and 1650 seconds until the current reached the first and the second
maxima respectively and then the potential was swept cathodically as shown in Figure
4.3. At this potential, decreasing acid concentration resulted in an increase of the extent
of PbSO4 formation and slower kinetics of the oxidation of PbSO4 to PbO2. However,

61
at higher potentials, where oxygen evolution is the main reaction, increasing acid
concentration does not affect the fraction of the charge involved in the oxidation of
lead. Another notable feature is that the cathodic peaks for the reduction of PbO2 to
PbSO4 shift to a more positive potential with increasing acidity (Figure 4.2). Also the
cathodic peak for reduction of PbO to Pb only appears at the higher acidities of 150 and
200 g L-1 sulphuric acid. This is contrary to what could be expected on the basis of the
reverse of reaction (4.1). An alternative explanation is that PbSO4 formed by the
oxidation of exposed lead at 1.5 V is more readily reduced to metal. Thus, direct
oxidation may occur at 1.5 V to form an amorphous PbSO4 phase as opposed to the
accepted dissolution-precipitation model for PbSO4 formation at lower potentials.
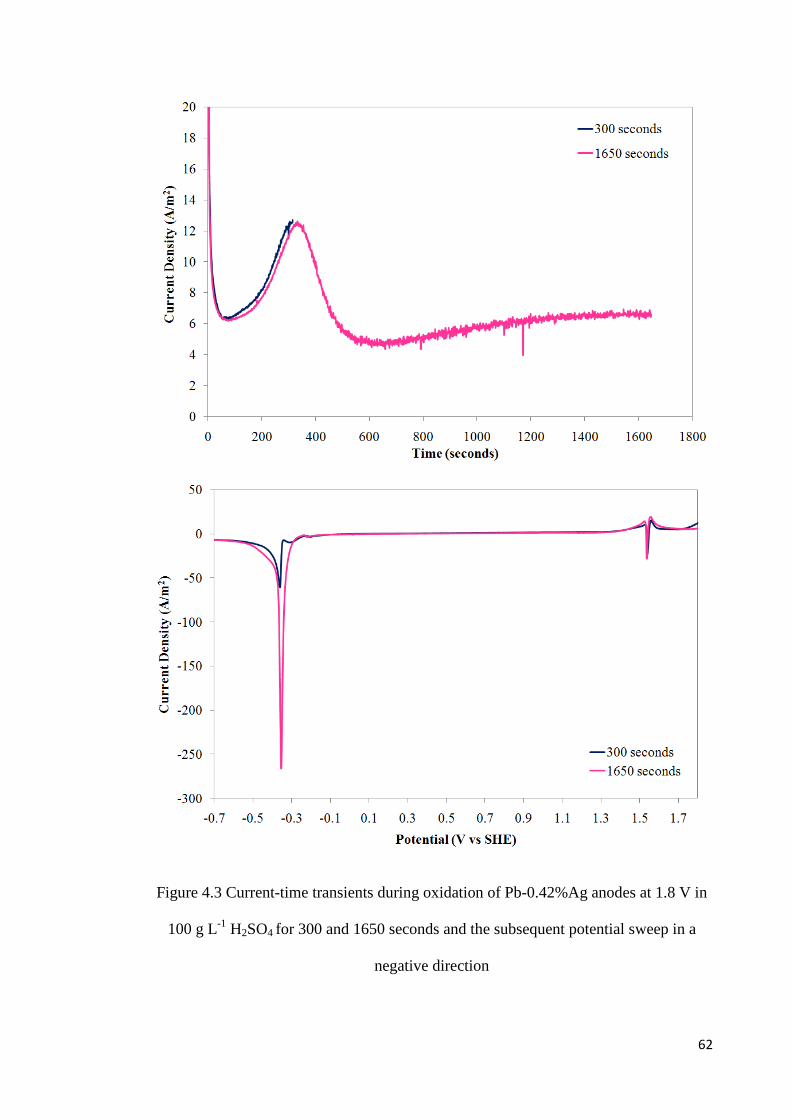
62
Figure 4.3 Current-time transients during oxidation of Pb-0.42%Ag anodes at 1.8 V in
100 g L-1 H2SO4 for 300 and 1650 seconds and the subsequent potential sweep in a
negative direction
63
4.1.2 Effect of Varying Oxidation Time
In a series of tests, the anodic behaviour of a Pb-0.42%Ag anode in acid solution was
studied by varying the oxidation time from 15 minutes up to 48 hours at a constant
potential of 1.8 V (Figure 4.4) or 2.0 V (Figure 4.5), followed by negative potential
sweeps as described above. The acid concentration in the 100 mL solution was 150g L-1
H2SO4 which is typical of that used in plant zinc electrolytes. The measurements were
performed at a rotation speed of 500 rpm at 40°C.
Figure 4.4 Current-time transients during oxidation of Pb-0.42%Ag anodes at 1.8 V in
150 g L-1 H2SO4 for various times

64
Figure 4.5 Current-time transients during oxidation of Pb-0.42%Ag anodes at 2.0 V in
150 g L-1 H2SO4 for various times
Figures 4.6 and 4.7 show the reduction scans of the anode surfaces after oxidation at
1.8 and 2.0 V respectively. Only the relevant sections of the potential region have been
shown. The charges involved in the oxidation of lead and oxygen evolution are
summarized in Table 4.2. The charges associated with the formation of PbO2 were
obtained from the integration of the area under the reduction peaks of PbO2 to PbSO4 at
1.6 to 1.5 V. The charges associated with the formation of PbSO4 were calculated from
the difference between the total charge for the reduction peaks of PbSO4 to Pb at -0.2 to
-1.0 V and the charges for formation of PbSO4 from PbO2 reduction. It is apparent that
there was a significant amount of lead sulphate on the anodized surface after long times
compared to short times. The rate of oxidation of lead decreases with time at both
potentials and the rate is almost an order of magnitude greater at 2.0 V than 1.8 V. The
rate of oxidation of lead decreases as the thickness of the oxide layer increases. On the
other hand, the rate of oxygen evolution increases with time at both potentials
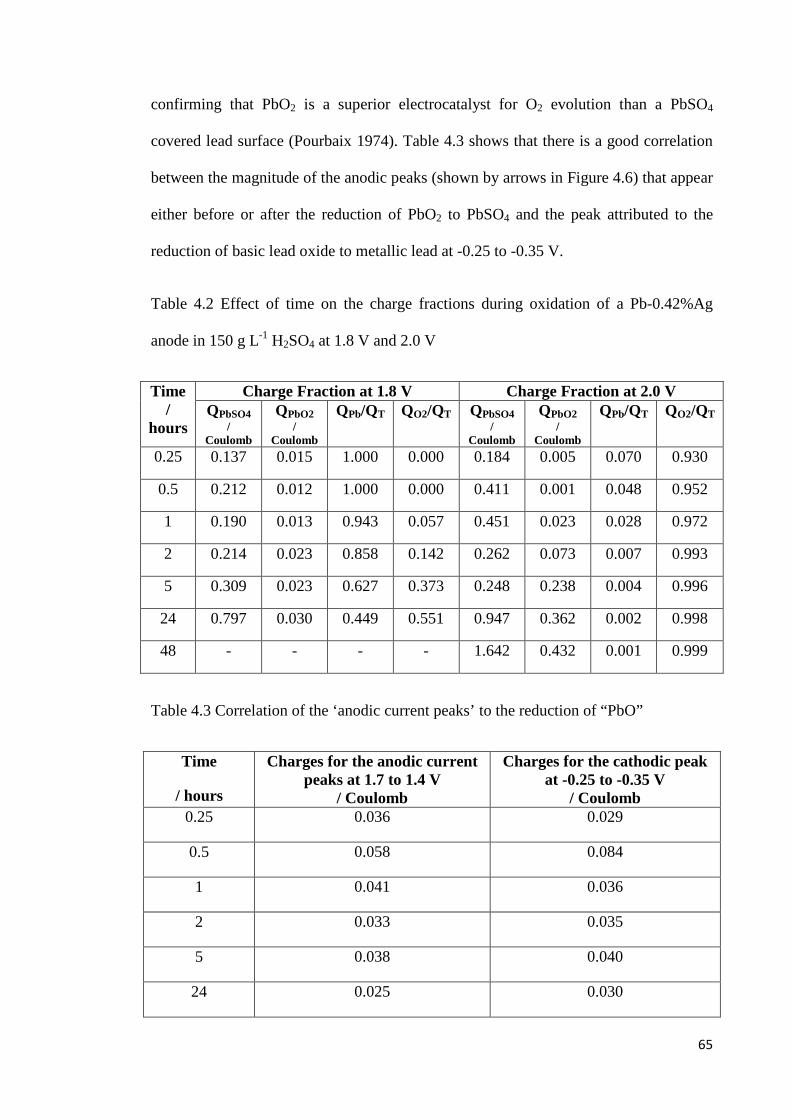
65
confirming that PbO2 is a superior electrocatalyst for O2 evolution than a PbSO4
covered lead surface (Pourbaix 1974). Table 4.3 shows that there is a good correlation
between the magnitude of the anodic peaks (shown by arrows in Figure 4.6) that appear
either before or after the reduction of PbO2 to PbSO4 and the peak attributed to the
reduction of basic lead oxide to metallic lead at -0.25 to -0.35 V.
Table 4.2 Effect of time on the charge fractions during oxidation of a Pb-0.42%Ag
anode in 150 g L-1 H2SO4 at 1.8 V and 2.0 V
Time /
hours
Charge Fraction at 1.8 V Charge Fraction at 2.0 V QPbSO4
/ Coulomb
QPbO2 /
Coulomb
QPb/QT QO2/QT QPbSO4 /
Coulomb
QPbO2 /
Coulomb
QPb/QT QO2/QT
0.25 0.137 0.015 1.000 0.000 0.184 0.005 0.070 0.930
0.5 0.212 0.012 1.000 0.000 0.411 0.001 0.048 0.952
1 0.190 0.013 0.943 0.057 0.451 0.023 0.028 0.972
2 0.214 0.023 0.858 0.142 0.262 0.073 0.007 0.993
5 0.309 0.023 0.627 0.373 0.248 0.238 0.004 0.996
24 0.797 0.030 0.449 0.551 0.947 0.362 0.002 0.998
48 - - - - 1.642 0.432 0.001 0.999
Table 4.3 Correlation of the ‘anodic current peaks’ to the reduction of “PbO”
Time
/ hours
Charges for the anodic current peaks at 1.7 to 1.4 V
/ Coulomb
Charges for the cathodic peak at -0.25 to -0.35 V
/ Coulomb 0.25 0.036 0.029
0.5 0.058 0.084
1 0.041 0.036
2 0.033 0.035
5 0.038 0.040
24 0.025 0.030

66
Potential (V vs SHE)
Figure 4.6 Reduction sweep after oxidation of Pb-0.42%Ag anodes at 1.80 V in 150 g
L-1 H2SO4 for various times
Potential (V vs SHE)
Figure 4.7 Reduction sweep after oxidation of Pb-0.42%Ag anodes at 2.00 V in 150 g
L-1 H2SO4 for various times
PbSO4 Pb PbO2 PbSO4
PbSO4 Pb PbO2 PbSO4
PbO, PbSO4 Pb
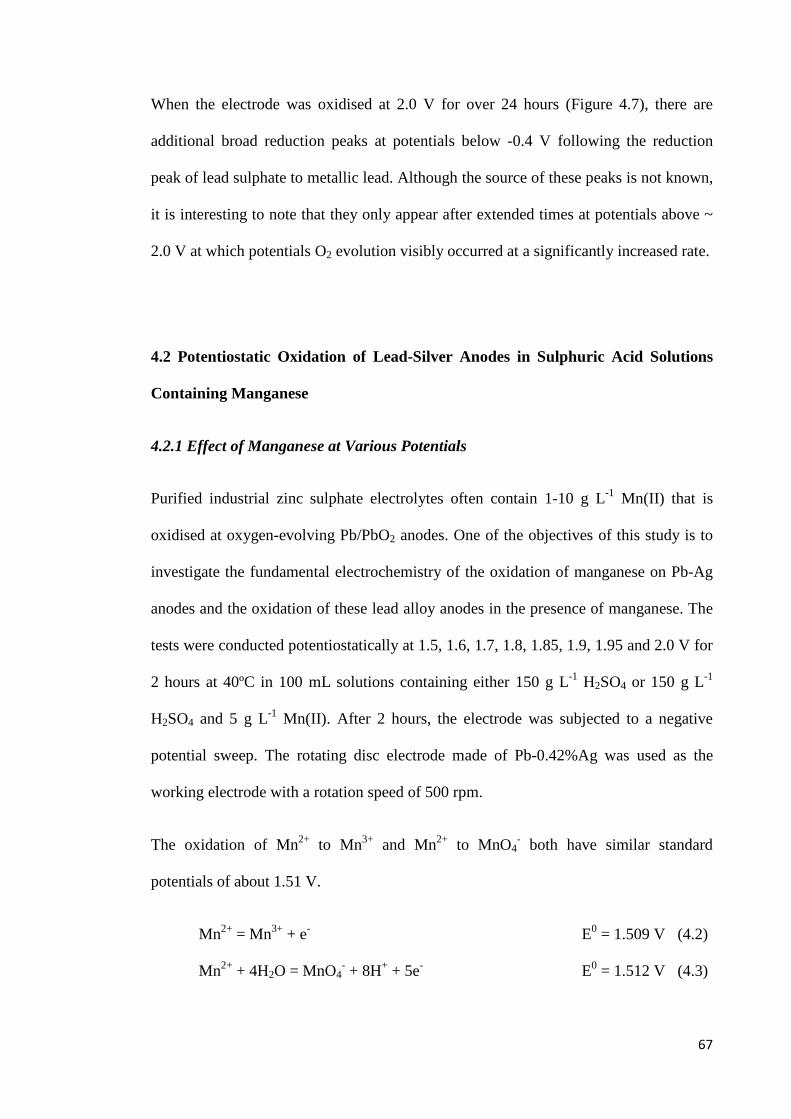
67
When the electrode was oxidised at 2.0 V for over 24 hours (Figure 4.7), there are
additional broad reduction peaks at potentials below -0.4 V following the reduction
peak of lead sulphate to metallic lead. Although the source of these peaks is not known,
it is interesting to note that they only appear after extended times at potentials above ~
2.0 V at which potentials O2 evolution visibly occurred at a significantly increased rate.
4.2 Potentiostatic Oxidation of Lead-Silver Anodes in Sulphuric Acid Solutions
Containing Manganese
4.2.1 Effect of Manganese at Various Potentials
Purified industrial zinc sulphate electrolytes often contain 1-10 g L-1 Mn(II) that is
oxidised at oxygen-evolving Pb/PbO2 anodes. One of the objectives of this study is to
investigate the fundamental electrochemistry of the oxidation of manganese on Pb-Ag
anodes and the oxidation of these lead alloy anodes in the presence of manganese. The
tests were conducted potentiostatically at 1.5, 1.6, 1.7, 1.8, 1.85, 1.9, 1.95 and 2.0 V for
2 hours at 40ºC in 100 mL solutions containing either 150 g L-1 H2SO4 or 150 g L-1
H2SO4 and 5 g L-1 Mn(II). After 2 hours, the electrode was subjected to a negative
potential sweep. The rotating disc electrode made of Pb-0.42%Ag was used as the
working electrode with a rotation speed of 500 rpm.
The oxidation of Mn2+ to Mn3+ and Mn2+ to MnO4- both have similar standard
potentials of about 1.51 V.
Mn2+ = Mn3+ + e- E0 = 1.509 V (4.2)
Mn2+ + 4H2O = MnO4- + 8H+ + 5e- E0 = 1.512 V (4.3)
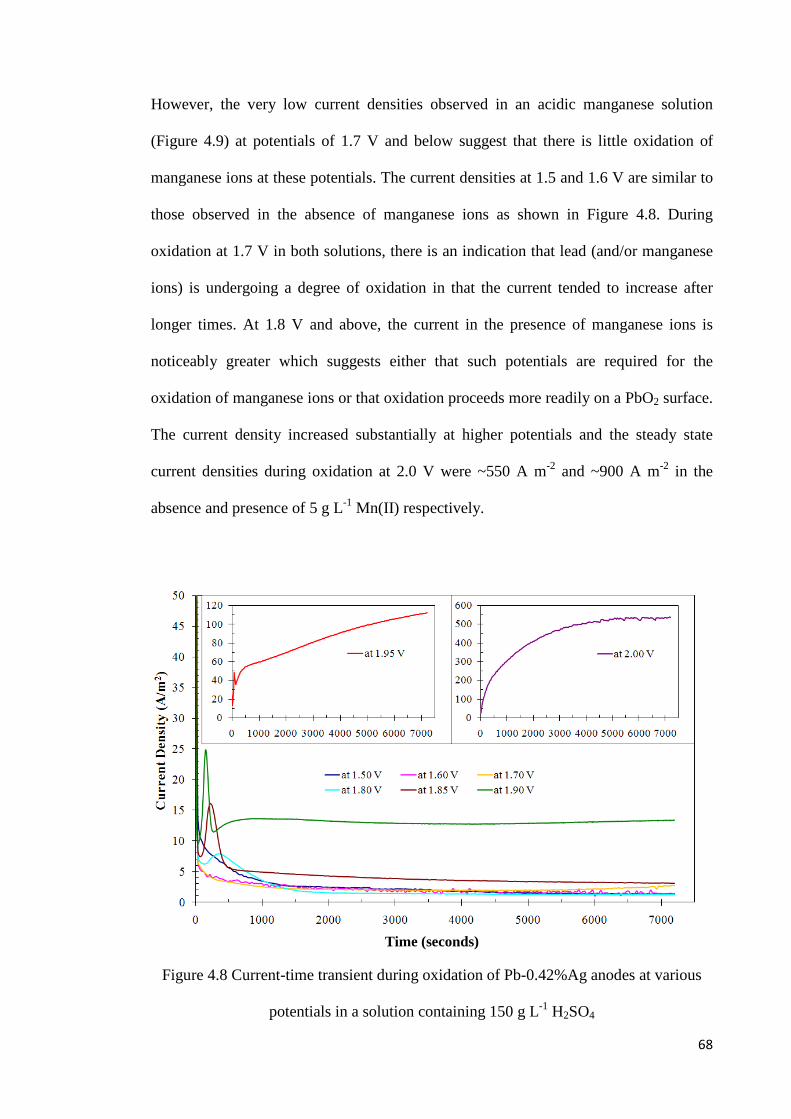
68
However, the very low current densities observed in an acidic manganese solution
(Figure 4.9) at potentials of 1.7 V and below suggest that there is little oxidation of
manganese ions at these potentials. The current densities at 1.5 and 1.6 V are similar to
those observed in the absence of manganese ions as shown in Figure 4.8. During
oxidation at 1.7 V in both solutions, there is an indication that lead (and/or manganese
ions) is undergoing a degree of oxidation in that the current tended to increase after
longer times. At 1.8 V and above, the current in the presence of manganese ions is
noticeably greater which suggests either that such potentials are required for the
oxidation of manganese ions or that oxidation proceeds more readily on a PbO2 surface.
The current density increased substantially at higher potentials and the steady state
current densities during oxidation at 2.0 V were ~550 A m-2 and ~900 A m-2 in the
absence and presence of 5 g L-1 Mn(II) respectively.
Time (seconds)
Figure 4.8 Current-time transient during oxidation of Pb-0.42%Ag anodes at various
potentials in a solution containing 150 g L-1 H2SO4
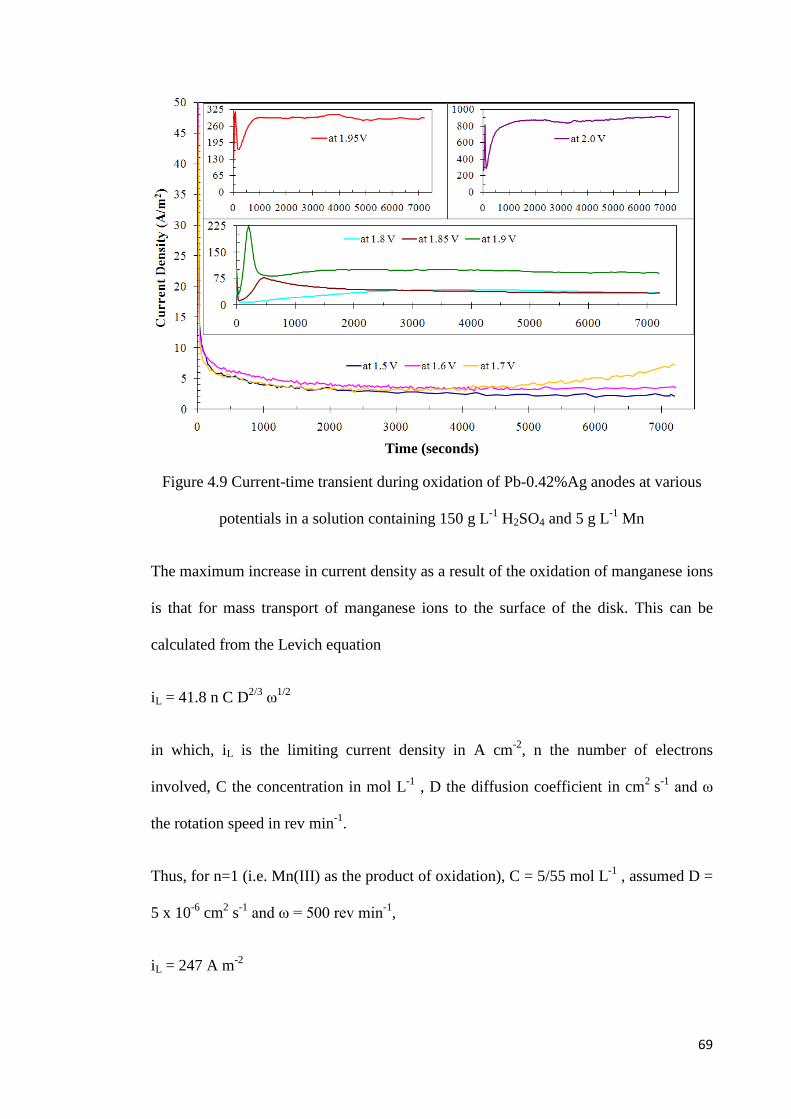
69
Time (seconds)
Figure 4.9 Current-time transient during oxidation of Pb-0.42%Ag anodes at various
potentials in a solution containing 150 g L-1 H2SO4 and 5 g L-1 Mn
The maximum increase in current density as a result of the oxidation of manganese ions
is that for mass transport of manganese ions to the surface of the disk. This can be
calculated from the Levich equation
iL = 41.8 n C D2/3 ω1/2
in which, iL is the limiting current density in A cm-2, n the number of electrons
involved, C the concentration in mol L-1 , D the diffusion coefficient in cm2 s-1 and ω
the rotation speed in rev min-1.
Thus, for n=1 (i.e. Mn(III) as the product of oxidation), C = 5/55 mol L-1 , assumed D =
5 x 10⁻⁶ cm2 s-1 and ω = 500 rev min-1,
iL = 247 A m-2
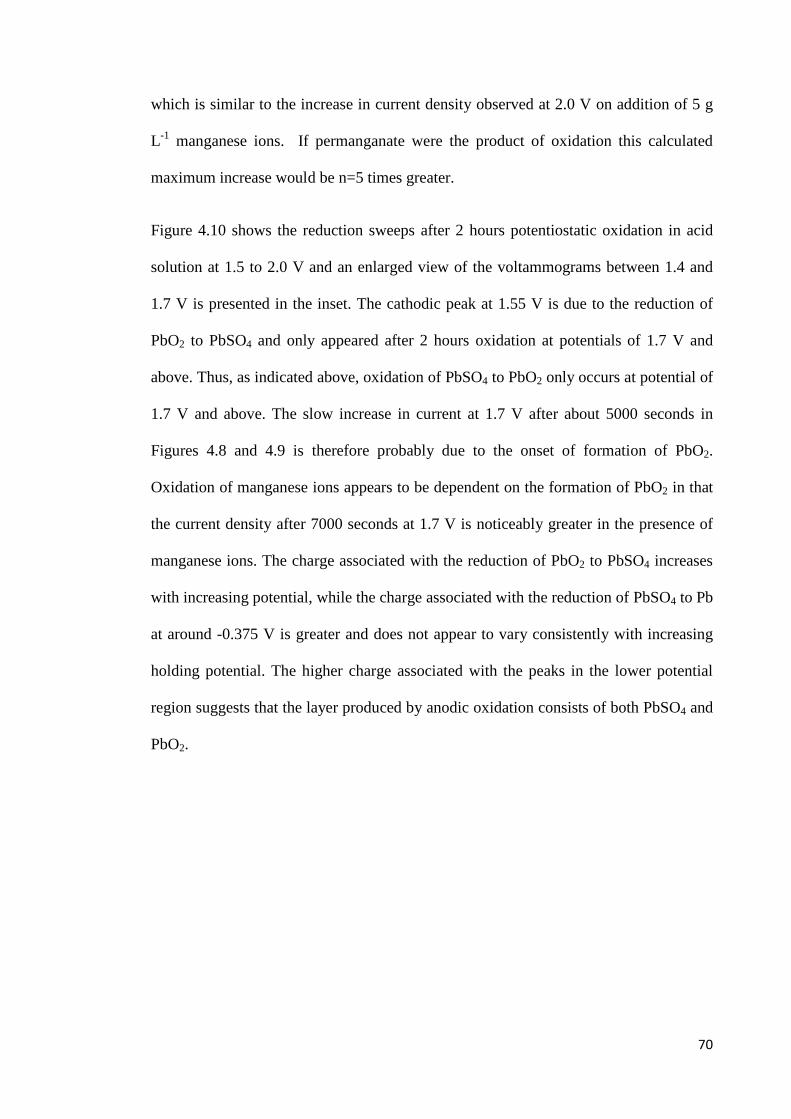
70
which is similar to the increase in current density observed at 2.0 V on addition of 5 g
L-1 manganese ions. If permanganate were the product of oxidation this calculated
maximum increase would be n=5 times greater.
Figure 4.10 shows the reduction sweeps after 2 hours potentiostatic oxidation in acid
solution at 1.5 to 2.0 V and an enlarged view of the voltammograms between 1.4 and
1.7 V is presented in the inset. The cathodic peak at 1.55 V is due to the reduction of
PbO2 to PbSO4 and only appeared after 2 hours oxidation at potentials of 1.7 V and
above. Thus, as indicated above, oxidation of PbSO4 to PbO2 only occurs at potential of
1.7 V and above. The slow increase in current at 1.7 V after about 5000 seconds in
Figures 4.8 and 4.9 is therefore probably due to the onset of formation of PbO2.
Oxidation of manganese ions appears to be dependent on the formation of PbO2 in that
the current density after 7000 seconds at 1.7 V is noticeably greater in the presence of
manganese ions. The charge associated with the reduction of PbO2 to PbSO4 increases
with increasing potential, while the charge associated with the reduction of PbSO4 to Pb
at around -0.375 V is greater and does not appear to vary consistently with increasing
holding potential. The higher charge associated with the peaks in the lower potential
region suggests that the layer produced by anodic oxidation consists of both PbSO4 and
PbO2.
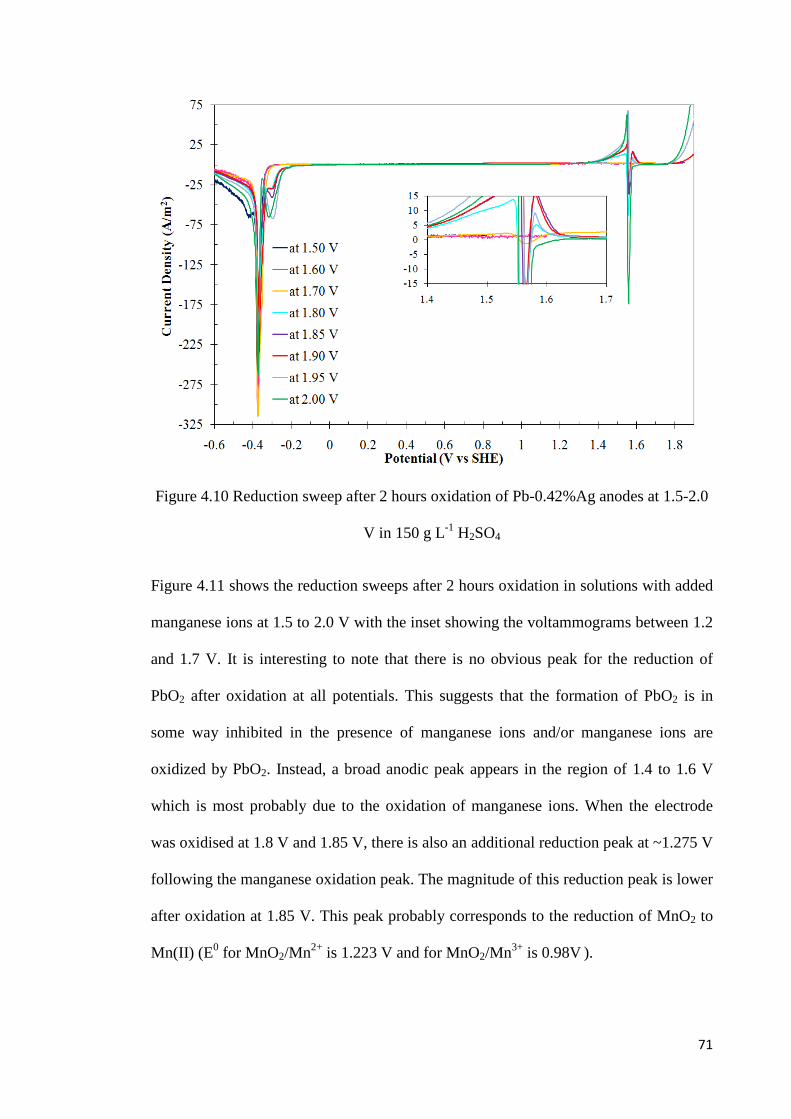
71
Figure 4.10 Reduction sweep after 2 hours oxidation of Pb-0.42%Ag anodes at 1.5-2.0
V in 150 g L-1 H2SO4
Figure 4.11 shows the reduction sweeps after 2 hours oxidation in solutions with added
manganese ions at 1.5 to 2.0 V with the inset showing the voltammograms between 1.2
and 1.7 V. It is interesting to note that there is no obvious peak for the reduction of
PbO2 after oxidation at all potentials. This suggests that the formation of PbO2 is in
some way inhibited in the presence of manganese ions and/or manganese ions are
oxidized by PbO2. Instead, a broad anodic peak appears in the region of 1.4 to 1.6 V
which is most probably due to the oxidation of manganese ions. When the electrode
was oxidised at 1.8 V and 1.85 V, there is also an additional reduction peak at ~1.275 V
following the manganese oxidation peak. The magnitude of this reduction peak is lower
after oxidation at 1.85 V. This peak probably corresponds to the reduction of MnO2 to
Mn(II) (E0 for MnO2/Mn2+ is 1.223 V and for MnO2/Mn3+ is 0.98V ).
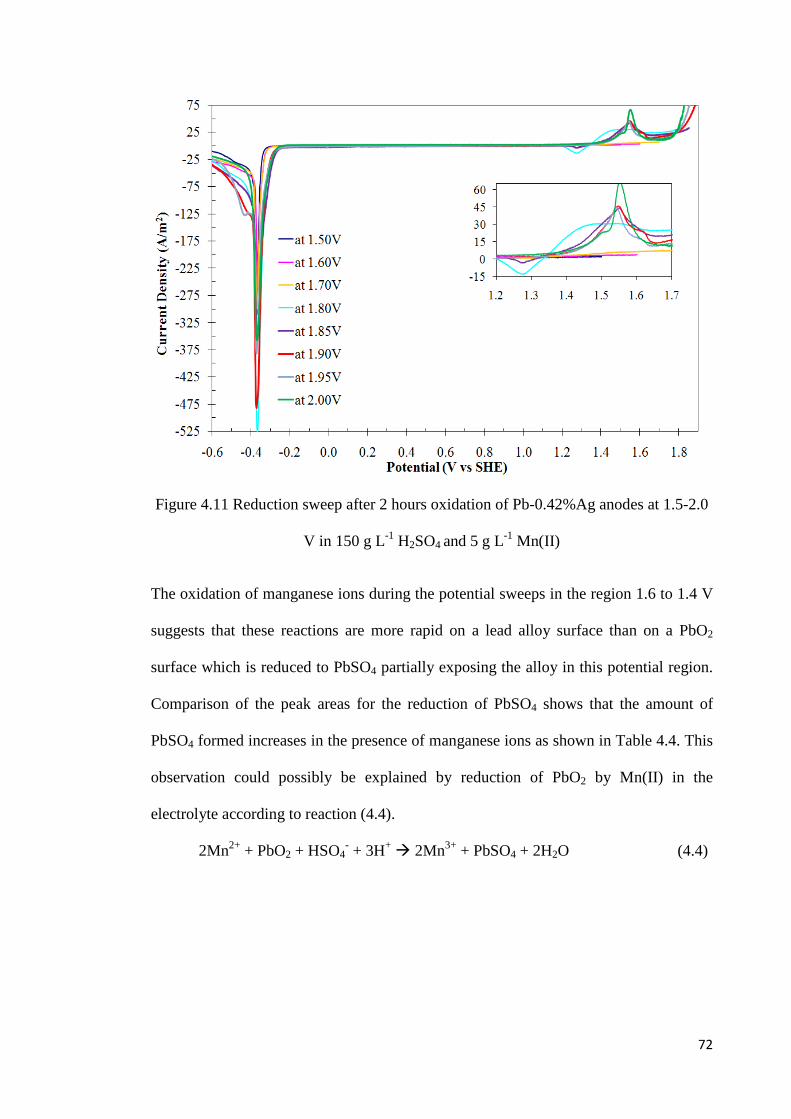
72
Figure 4.11 Reduction sweep after 2 hours oxidation of Pb-0.42%Ag anodes at 1.5-2.0
V in 150 g L-1 H2SO4 and 5 g L-1 Mn(II)
The oxidation of manganese ions during the potential sweeps in the region 1.6 to 1.4 V
suggests that these reactions are more rapid on a lead alloy surface than on a PbO2
surface which is reduced to PbSO4 partially exposing the alloy in this potential region.
Comparison of the peak areas for the reduction of PbSO4 shows that the amount of
PbSO4 formed increases in the presence of manganese ions as shown in Table 4.4. This
observation could possibly be explained by reduction of PbO2 by Mn(II) in the
electrolyte according to reaction (4.4).
2Mn2+ + PbO2 + HSO4- + 3H+ 2Mn3+ + PbSO4 + 2H2O (4.4)
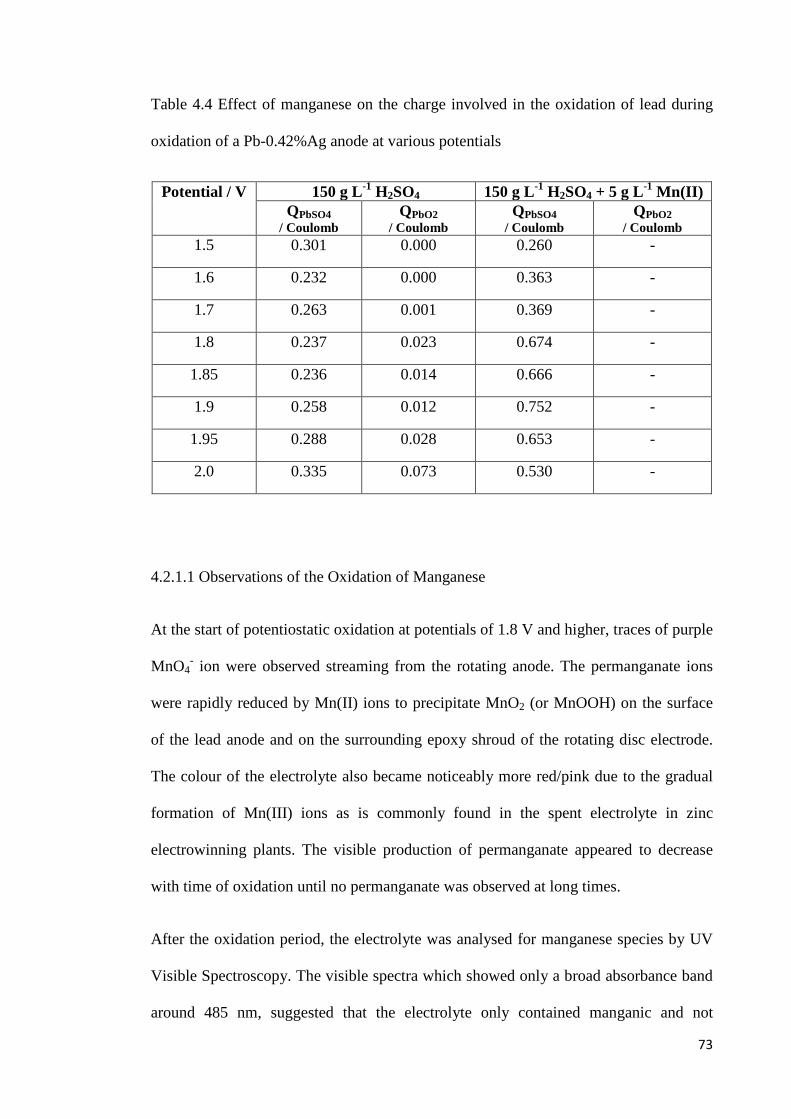
73
Table 4.4 Effect of manganese on the charge involved in the oxidation of lead during
oxidation of a Pb-0.42%Ag anode at various potentials
Potential / V 150 g L-1 H2SO4 150 g L-1 H2SO4 + 5 g L-1 Mn(II) QPbSO4
/ Coulomb QPbO2
/ Coulomb QPbSO4
/ Coulomb QPbO2
/ Coulomb 1.5 0.301 0.000 0.260 -
1.6 0.232 0.000 0.363 -
1.7 0.263 0.001 0.369 -
1.8 0.237 0.023 0.674 -
1.85 0.236 0.014 0.666 -
1.9 0.258 0.012 0.752 -
1.95 0.288 0.028 0.653 -
2.0 0.335 0.073 0.530 -
4.2.1.1 Observations of the Oxidation of Manganese
At the start of potentiostatic oxidation at potentials of 1.8 V and higher, traces of purple
MnO4- ion were observed streaming from the rotating anode. The permanganate ions
were rapidly reduced by Mn(II) ions to precipitate MnO2 (or MnOOH) on the surface
of the lead anode and on the surrounding epoxy shroud of the rotating disc electrode.
The colour of the electrolyte also became noticeably more red/pink due to the gradual
formation of Mn(III) ions as is commonly found in the spent electrolyte in zinc
electrowinning plants. The visible production of permanganate appeared to decrease
with time of oxidation until no permanganate was observed at long times.
After the oxidation period, the electrolyte was analysed for manganese species by UV
Visible Spectroscopy. The visible spectra which showed only a broad absorbance band
around 485 nm, suggested that the electrolyte only contained manganic and not
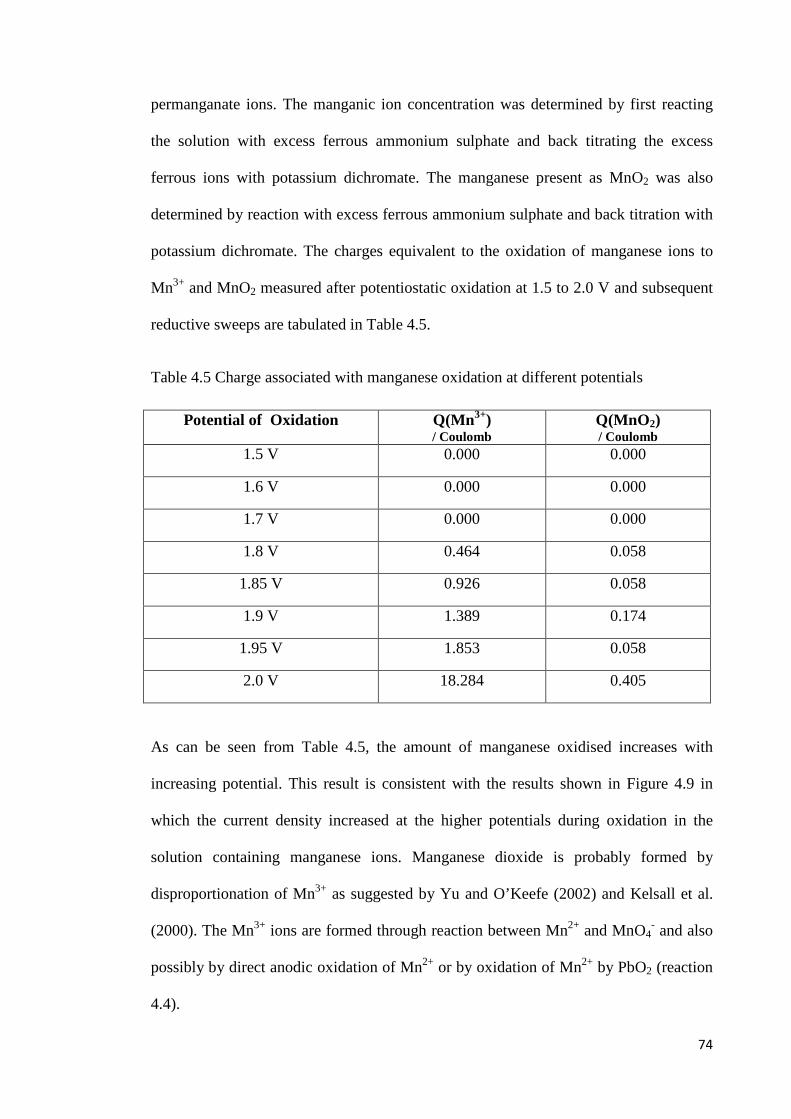
74
permanganate ions. The manganic ion concentration was determined by first reacting
the solution with excess ferrous ammonium sulphate and back titrating the excess
ferrous ions with potassium dichromate. The manganese present as MnO2 was also
determined by reaction with excess ferrous ammonium sulphate and back titration with
potassium dichromate. The charges equivalent to the oxidation of manganese ions to
Mn3+ and MnO2 measured after potentiostatic oxidation at 1.5 to 2.0 V and subsequent
reductive sweeps are tabulated in Table 4.5.
Table 4.5 Charge associated with manganese oxidation at different potentials
Potential of Oxidation Q(Mn3+) / Coulomb
Q(MnO2) / Coulomb
1.5 V 0.000 0.000
1.6 V 0.000 0.000
1.7 V 0.000 0.000
1.8 V 0.464 0.058
1.85 V 0.926 0.058
1.9 V 1.389 0.174
1.95 V 1.853 0.058
2.0 V 18.284 0.405
As can be seen from Table 4.5, the amount of manganese oxidised increases with
increasing potential. This result is consistent with the results shown in Figure 4.9 in
which the current density increased at the higher potentials during oxidation in the
solution containing manganese ions. Manganese dioxide is probably formed by
disproportionation of Mn3+ as suggested by Yu and O’Keefe (2002) and Kelsall et al.
(2000). The Mn3+ ions are formed through reaction between Mn2+ and MnO4- and also
possibly by direct anodic oxidation of Mn2+ or by oxidation of Mn2+ by PbO2 (reaction
4.4).
75
4.2.2 Effect of Varying Concentration of Manganese(II) Ions
A series of experiments were carried out in 100 mL solutions of 150 g L-1 H2SO4
containing 0.1, 1, 5 or 10 g L-1 Mn(II) at 40ºC. In each case, potentiostatic oxidation
was carried out at 1.8, 1.85, 1.9, 1.95 and 2.0 V for 2 hours followed by a reduction
sweep as before. The tests were performed using the Pb-0.42%Ag alloy at a rotation
speed of 500 rpm.
At 1.8 V (Figure 4.12), the cumulative charge passed during potentiostatic oxidation
increased with increasing manganese ion concentration and the current time transients
exhibit a broad maximum indicating that continuous oxidation occurs at higher
manganese concentrations. At this potential the rate of oxidation of manganese ions is
not mass transport controlled as the increase in current density in the presence of
manganese ions is considerably less than that estimated above for the limiting current
density at all concentrations. During the reduction sweep, the peak for reduction of
PbO2 is only observed at the lowest manganese concentration. At higher
concentrations, a broad anodic plateau is observed at potentials above about 1.4 V with
a slight peak at about 1.5 V. The anodic currents increase with increasing concentration
of manganese ions in this potential region and it is possible that the peak at 1.5 V is due
to enhanced oxidation of manganese ions on the surface after reduction of PbO2. The
charge associated with the reduction of “MnO2” is only a small fraction of the anodic
charge due to oxidation of manganese ions which confirms that soluble manganese ions
(Mn3+ and/or MnO4-) are the main products of oxidation at these potentials. The
cathodic peak at 1.2 to 1.3 V due to reduction of MnO2 is observed for all manganese
concentrations except the lowest. The charge associated with reduction of PbSO4 also
increases with increasing manganese ion concentration.

76
Figure 4.12 Effect of manganese concentration on potentiostatic oxidation of Pb-
0.42%Ag anodes at 1.8 V and the subsequent potential sweep in a negative direction
77
At 1.85 V (Figure 4.13), the current-time transient exhibited a different shape in that, at
longer times, the current decayed to roughly the same pseudo-steady-state values
observed at 1.8 V. Although the peak currents increased with increasing manganese ion
concentration, the current at longer times did not appear to be related to the
concentration. Again, during the reduction sweep, the peak for reduction of PbO2 is
only observed at the lowest manganese ion concentration. At higher concentrations, a
more prominent anodic peak due to oxidation of manganese ions is again observed in
the region of 1.4 to 1.6 V. The cathodic peak at 1.2 to 1.3 V due to reduction of MnO2
is again observed for all manganese concentrations except for the lowest but these
peaks are significantly smaller than those observed after oxidation at 1.8 V. The charge
associated with reduction of PbSO4 also increases with increasing manganese ion
concentration but is lower than observed after oxidation at 1.8 V. This could be
expected in that oxidation of PbSO4 is likely to be more rapid at the higher holding
potential.
Similar trends were observed after oxidation at 1.9 V (Figure 4.14). However, the
cathodic peak at 1.25 V was no longer present and this was also apparent in all
subsequent experiments at higher potentials. The reason for this is not clear at this stage
but could be due to the formation of a different manganese oxide at lower potentials
which is more easily reduced.
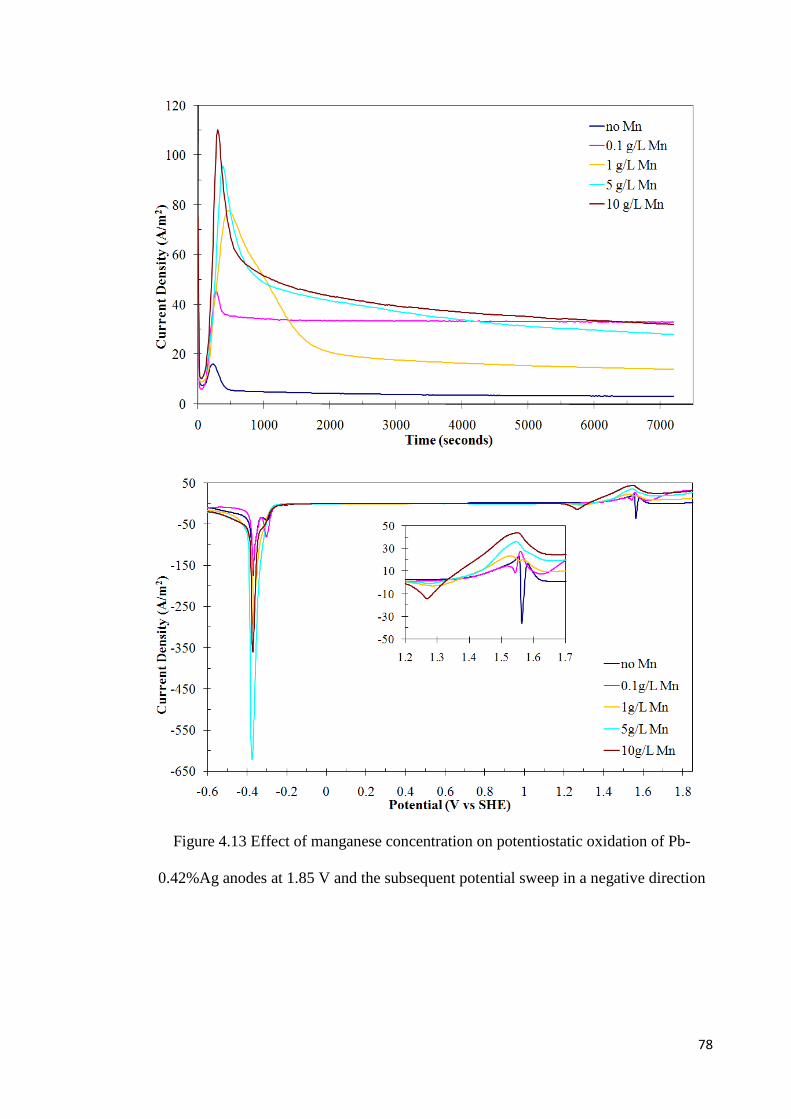
78
Figure 4.13 Effect of manganese concentration on potentiostatic oxidation of Pb-
0.42%Ag anodes at 1.85 V and the subsequent potential sweep in a negative direction
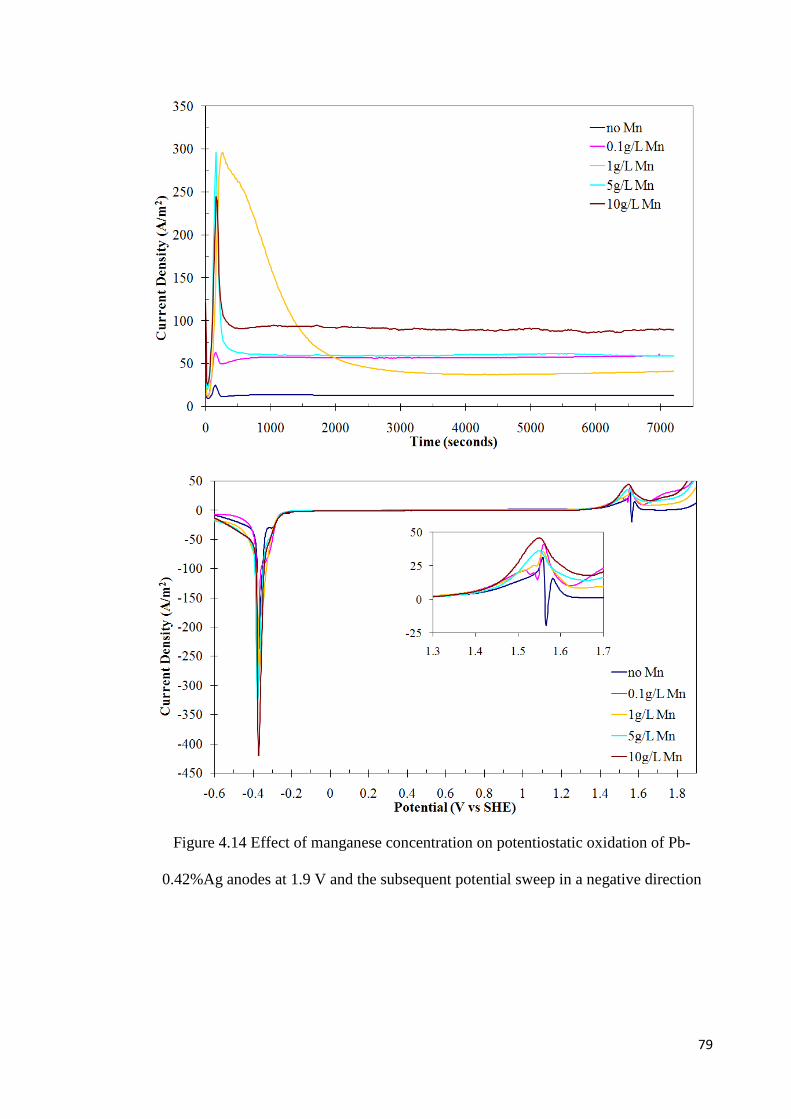
79
Figure 4.14 Effect of manganese concentration on potentiostatic oxidation of Pb-
0.42%Ag anodes at 1.9 V and the subsequent potential sweep in a negative direction
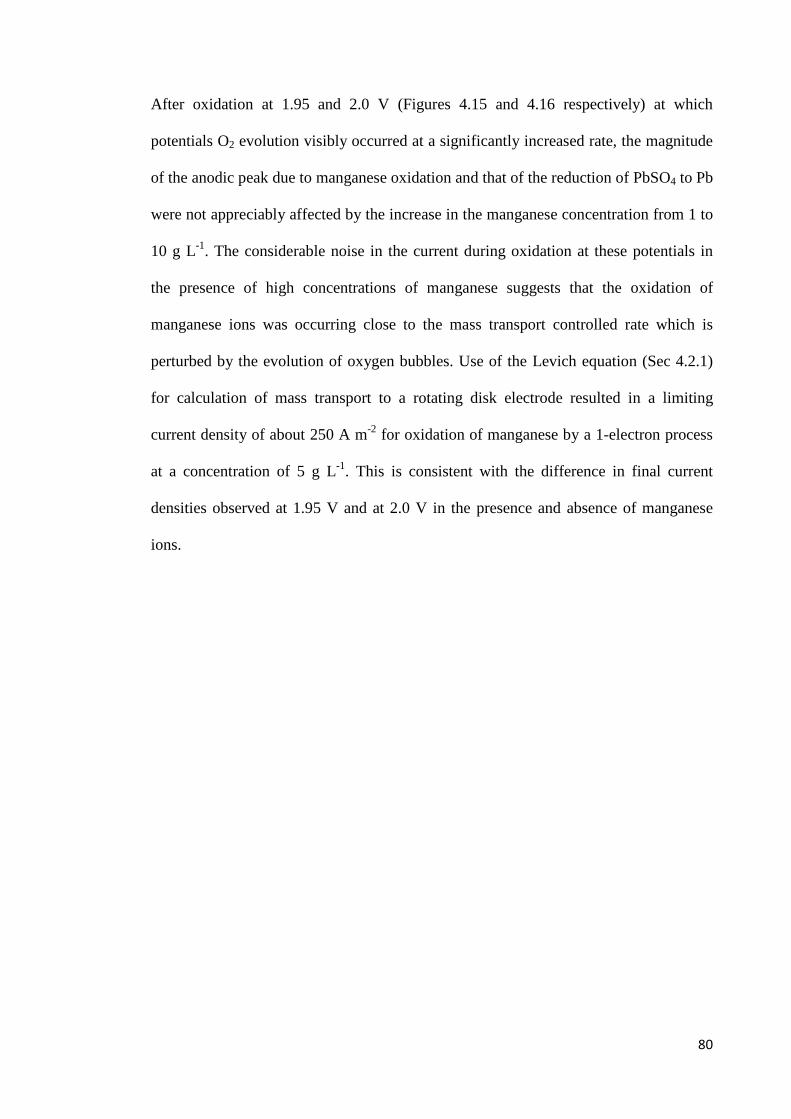
80
After oxidation at 1.95 and 2.0 V (Figures 4.15 and 4.16 respectively) at which
potentials O2 evolution visibly occurred at a significantly increased rate, the magnitude
of the anodic peak due to manganese oxidation and that of the reduction of PbSO4 to Pb
were not appreciably affected by the increase in the manganese concentration from 1 to
10 g L-1. The considerable noise in the current during oxidation at these potentials in
the presence of high concentrations of manganese suggests that the oxidation of
manganese ions was occurring close to the mass transport controlled rate which is
perturbed by the evolution of oxygen bubbles. Use of the Levich equation (Sec 4.2.1)
for calculation of mass transport to a rotating disk electrode resulted in a limiting
current density of about 250 A m-2 for oxidation of manganese by a 1-electron process
at a concentration of 5 g L-1. This is consistent with the difference in final current
densities observed at 1.95 V and at 2.0 V in the presence and absence of manganese
ions.
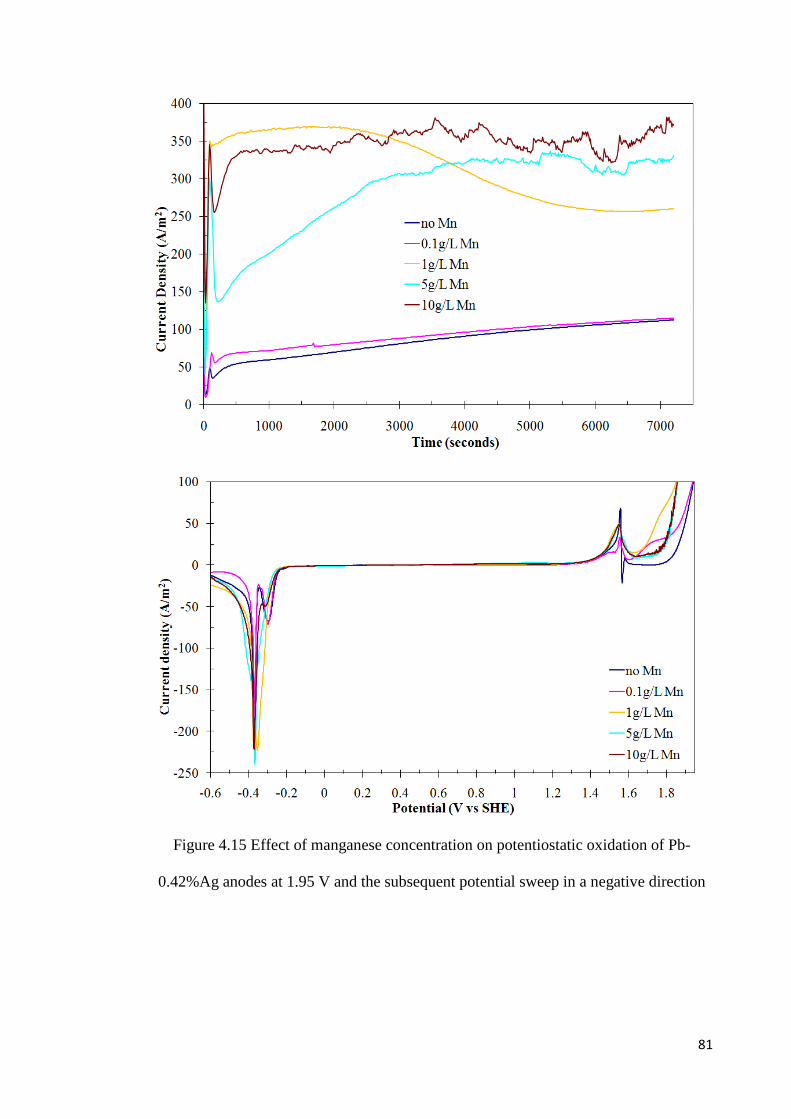
81
Figure 4.15 Effect of manganese concentration on potentiostatic oxidation of Pb-
0.42%Ag anodes at 1.95 V and the subsequent potential sweep in a negative direction
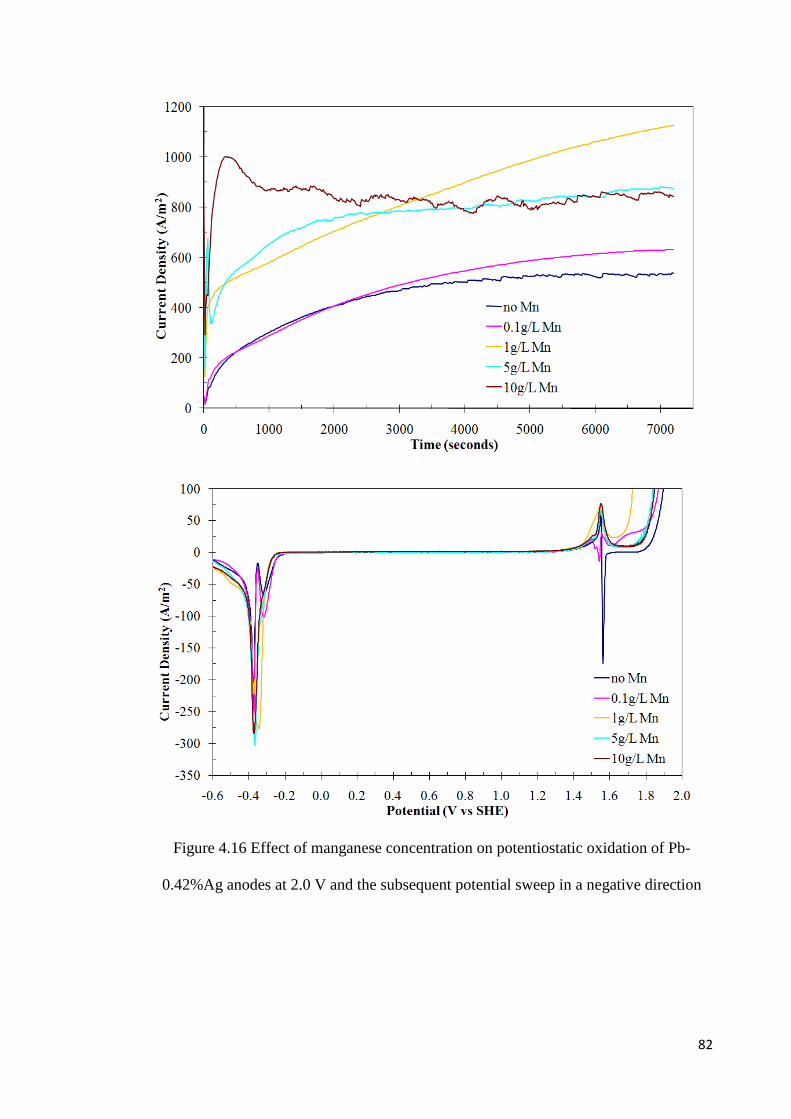
82
Figure 4.16 Effect of manganese concentration on potentiostatic oxidation of Pb-
0.42%Ag anodes at 2.0 V and the subsequent potential sweep in a negative direction

83
In the presence of manganese, the total charge (QT) passed will be equal to the sum of
the charge for the oxidation of lead (QPb), the oxidation of manganese (QMn) and that
for the evolution of oxygen (QO2). Figures 4.17 to 4.19 show the effect of varying
manganese ion concentration on the fractions of the total charge attributable to these
processes during oxidation at each potential. It can be seen that below 1.9 V the
presence of manganese greatly suppresses the oxidation of lead and most of the charge
is utilised for oxidation of manganese. The data for 0.1 g L-1 manganese is probably not
reliable given the very small amounts of oxidised manganese products at this potential.
At potentials above 1.9 V where oxygen evolution occurs more readily, the effect of
manganese on the extent of oxidation of lead is minimal. However, the rate of oxygen
evolution is suppressed in the presence of manganese ions although the effect does not
appear to be directly proportional to the manganese concentration.
Figure 4.17 Effect of manganese concentration on the charge fraction for lead oxidation
at different potentials
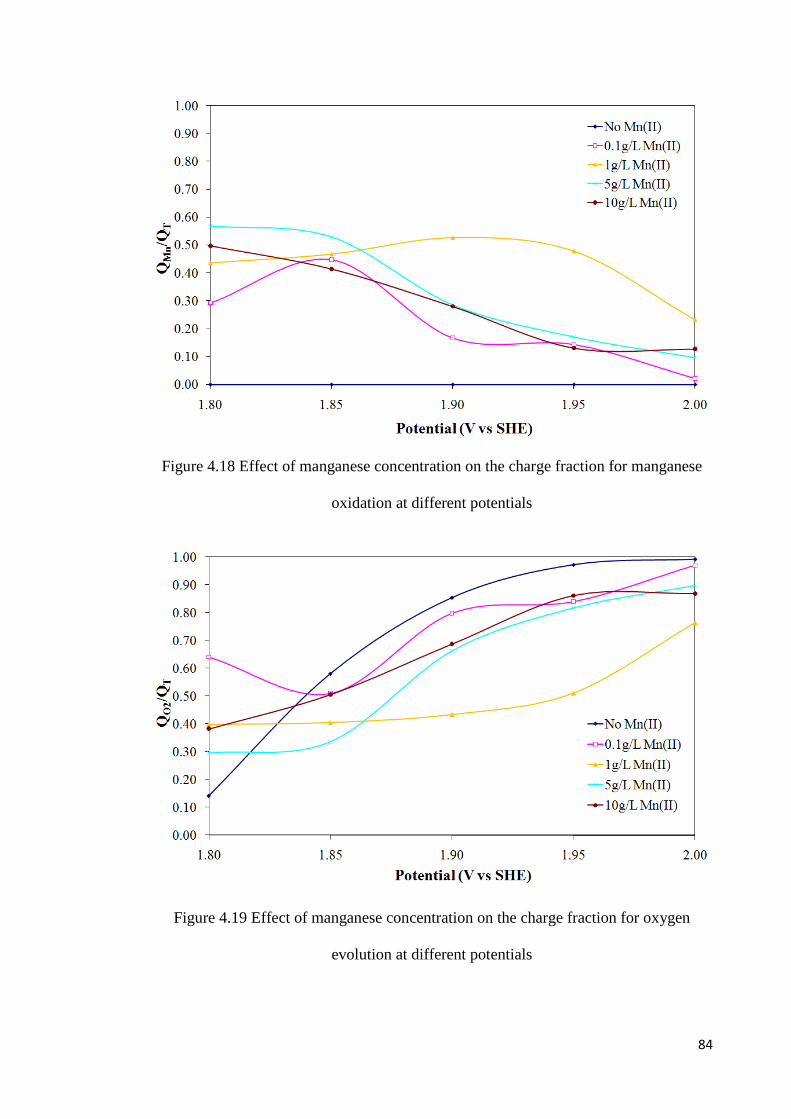
84
Figure 4.18 Effect of manganese concentration on the charge fraction for manganese
oxidation at different potentials
Figure 4.19 Effect of manganese concentration on the charge fraction for oxygen
evolution at different potentials

85
It is apparent that these results are only indicative of the early stages of oxidation of the
alloys and do not reflect the steady-state behavior in the various solutions. The results
in the following section at longer times are a more realistic indication of the longer
term behavior.
4.2.3 Effect of Time of Oxidation
In a series of tests in 200 mL of 150 g L-1 H2SO4 with various Mn(II) ion
concentrations (0.1, 1, 5 and 10 g L-1), the oxidation time was varied from 15 minutes
up to 48 hours at a constant potential of 2.0 V which most closely approximates the
operating potential of an anode in practice. Each test was followed by a negative-going
potential sweep and analyses of the solids and solutions for the oxidised forms of
manganese. The temperature was held constant at 40ºC and the Pb-0.42%Ag alloy
electrode was rotated at 500 rpm. Figure 4.20 shows the current-time transient during
oxidation of the lead anode at 2.0 V for 24 hours in each solution.
The linear sweep voltammograms obtained for the various manganese concentrations
are shown in Figures 4.21 to 4.24 after various oxidation periods at 2.0 V. It can be
seen that the peak for the reduction of PbO2 to PbSO4 at ~1.55 V was absent for periods
up to 5 hours but reappeared after 24 and 48 hours in a solution of 5 and 10 g L-1
Mn(II) (Figures 4.23 and 4.24). At lower concentrations (0.1 and 1 g L-1) of manganese
ions, this peak was present after 5 hours oxidation (Figures 4.21 and 4.22). The charge
associated with this peak was also reduced with increasing manganese ion
concentration.
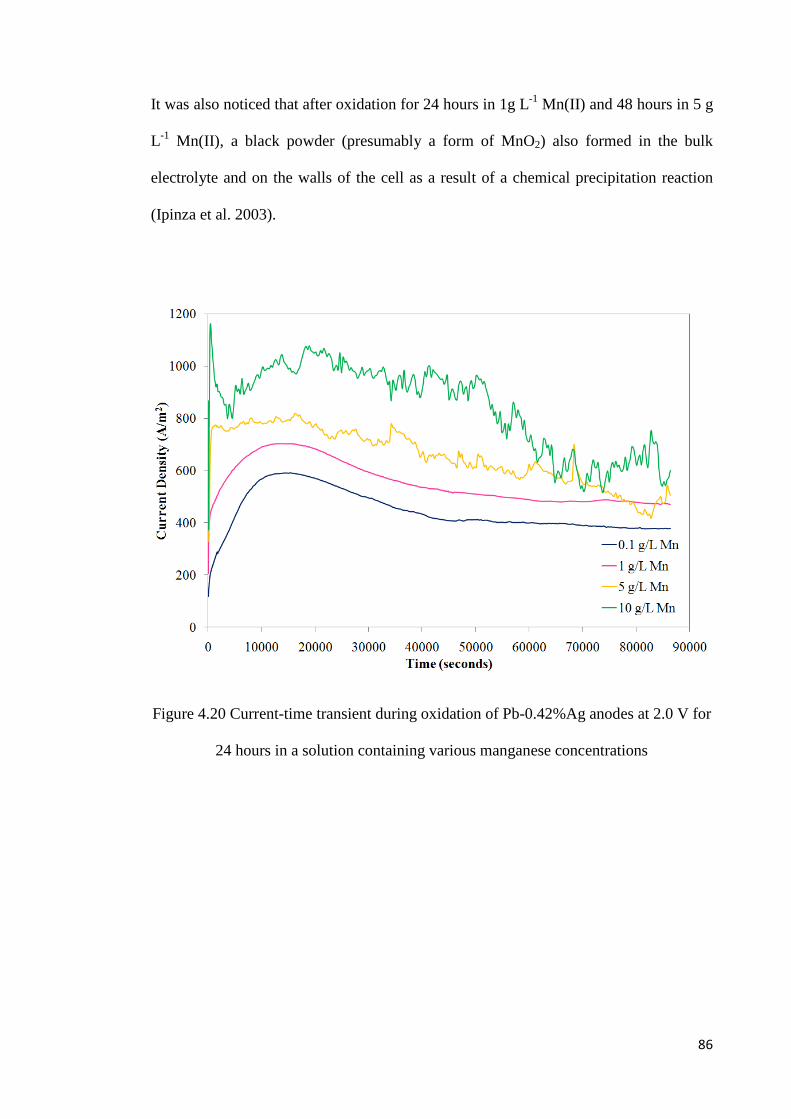
86
It was also noticed that after oxidation for 24 hours in 1g L-1 Mn(II) and 48 hours in 5 g
L-1 Mn(II), a black powder (presumably a form of MnO2) also formed in the bulk
electrolyte and on the walls of the cell as a result of a chemical precipitation reaction
(Ipinza et al. 2003).
Figure 4.20 Current-time transient during oxidation of Pb-0.42%Ag anodes at 2.0 V for
24 hours in a solution containing various manganese concentrations
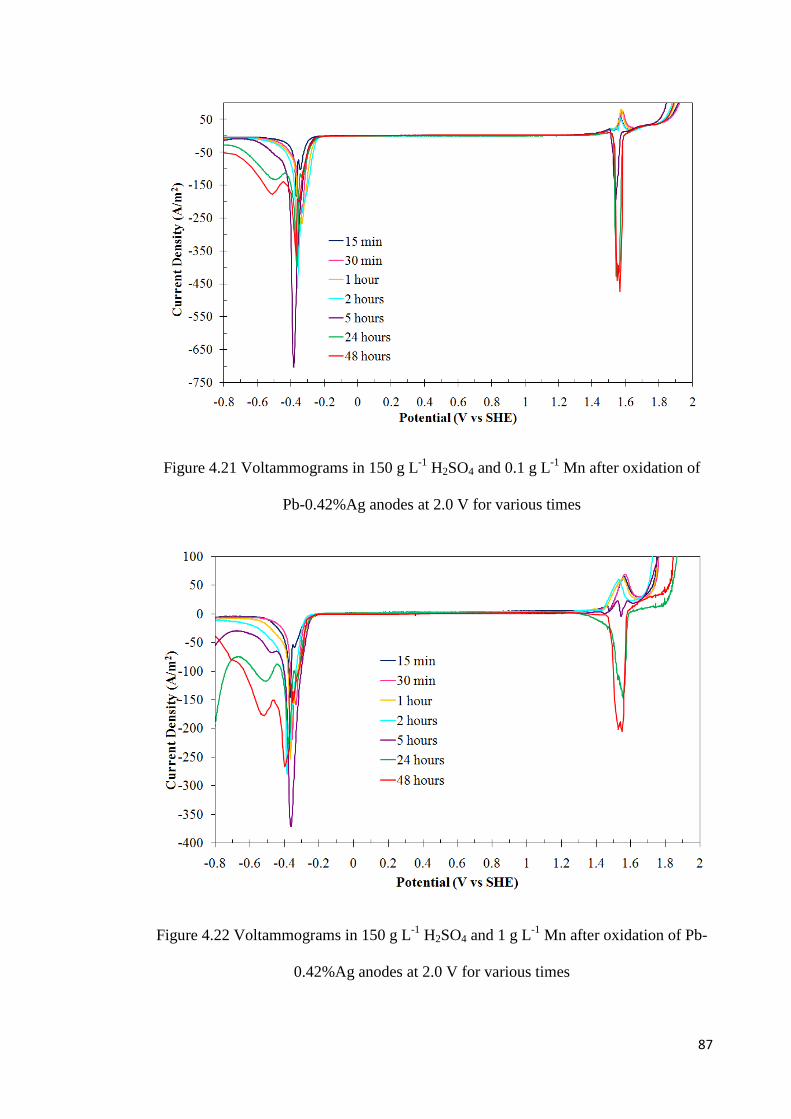
87
Figure 4.21 Voltammograms in 150 g L-1 H2SO4 and 0.1 g L-1 Mn after oxidation of
Pb-0.42%Ag anodes at 2.0 V for various times
Figure 4.22 Voltammograms in 150 g L-1 H2SO4 and 1 g L-1 Mn after oxidation of Pb-
0.42%Ag anodes at 2.0 V for various times
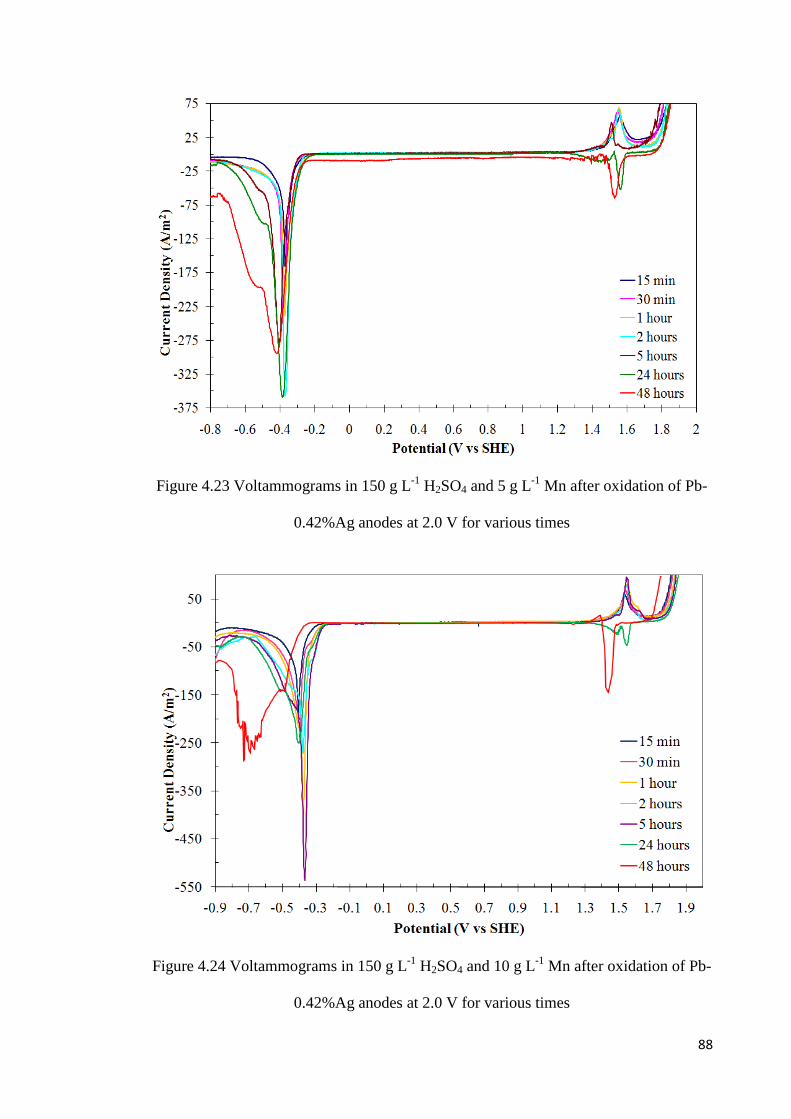
88
Figure 4.23 Voltammograms in 150 g L-1 H2SO4 and 5 g L-1 Mn after oxidation of Pb-
0.42%Ag anodes at 2.0 V for various times
Figure 4.24 Voltammograms in 150 g L-1 H2SO4 and 10 g L-1 Mn after oxidation of Pb-
0.42%Ag anodes at 2.0 V for various times
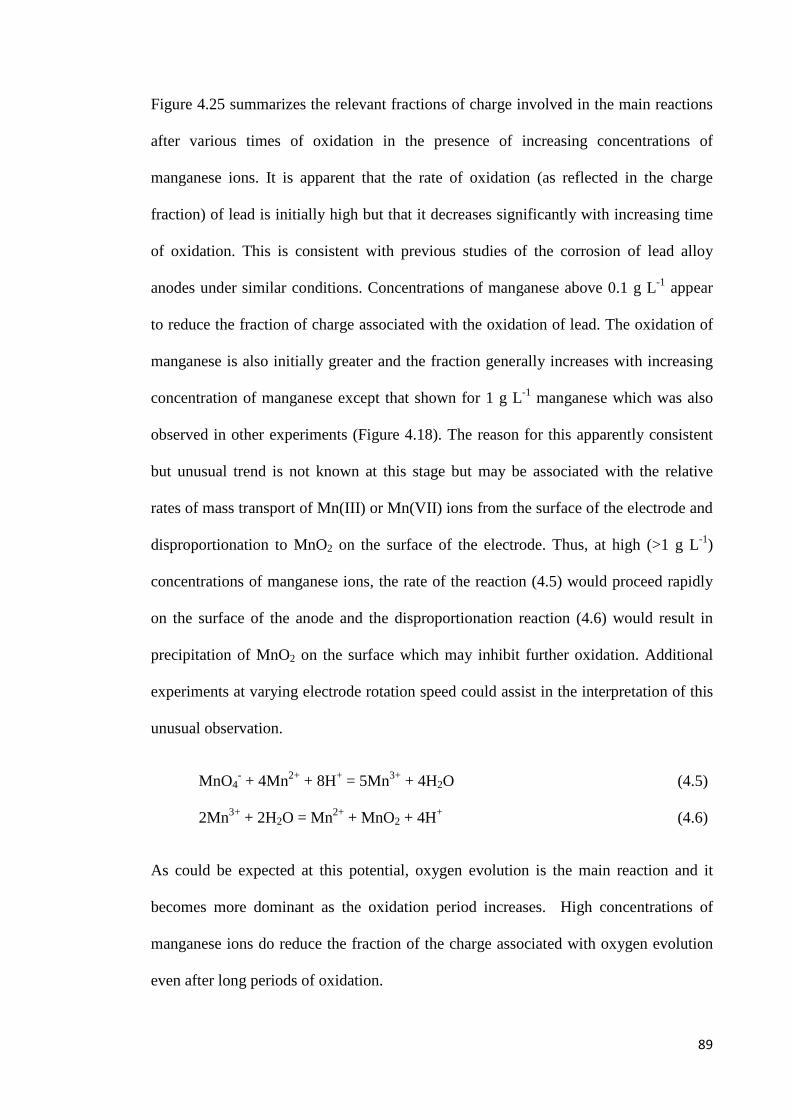
89
Figure 4.25 summarizes the relevant fractions of charge involved in the main reactions
after various times of oxidation in the presence of increasing concentrations of
manganese ions. It is apparent that the rate of oxidation (as reflected in the charge
fraction) of lead is initially high but that it decreases significantly with increasing time
of oxidation. This is consistent with previous studies of the corrosion of lead alloy
anodes under similar conditions. Concentrations of manganese above 0.1 g L-1 appear
to reduce the fraction of charge associated with the oxidation of lead. The oxidation of
manganese is also initially greater and the fraction generally increases with increasing
concentration of manganese except that shown for 1 g L-1 manganese which was also
observed in other experiments (Figure 4.18). The reason for this apparently consistent
but unusual trend is not known at this stage but may be associated with the relative
rates of mass transport of Mn(III) or Mn(VII) ions from the surface of the electrode and
disproportionation to MnO2 on the surface of the electrode. Thus, at high (>1 g L-1)
concentrations of manganese ions, the rate of the reaction (4.5) would proceed rapidly
on the surface of the anode and the disproportionation reaction (4.6) would result in
precipitation of MnO2 on the surface which may inhibit further oxidation. Additional
experiments at varying electrode rotation speed could assist in the interpretation of this
unusual observation.
MnO4- + 4Mn2+ + 8H+ = 5Mn3+ + 4H2O (4.5)
2Mn3+ + 2H2O = Mn2+ + MnO2 + 4H+ (4.6)
As could be expected at this potential, oxygen evolution is the main reaction and it
becomes more dominant as the oxidation period increases. High concentrations of
manganese ions do reduce the fraction of the charge associated with oxygen evolution
even after long periods of oxidation.
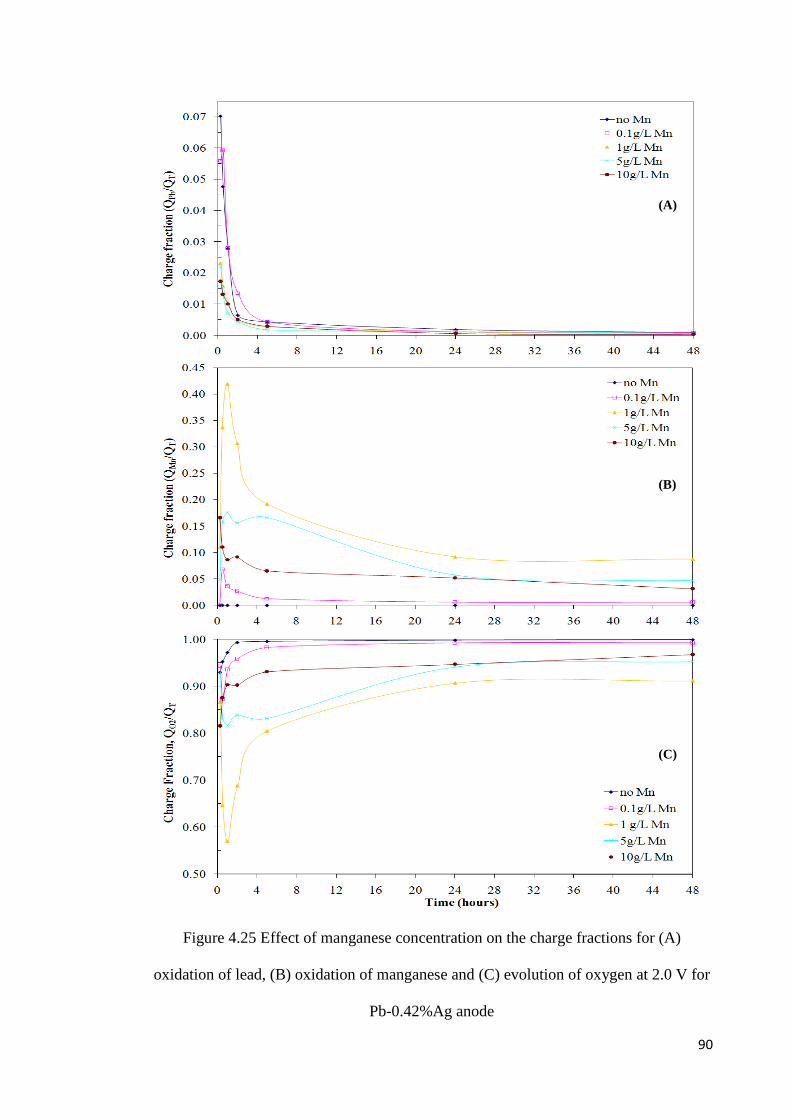
90
Figure 4.25 Effect of manganese concentration on the charge fractions for (A)
oxidation of lead, (B) oxidation of manganese and (C) evolution of oxygen at 2.0 V for
Pb-0.42%Ag anode
(A)
(B)
(C)
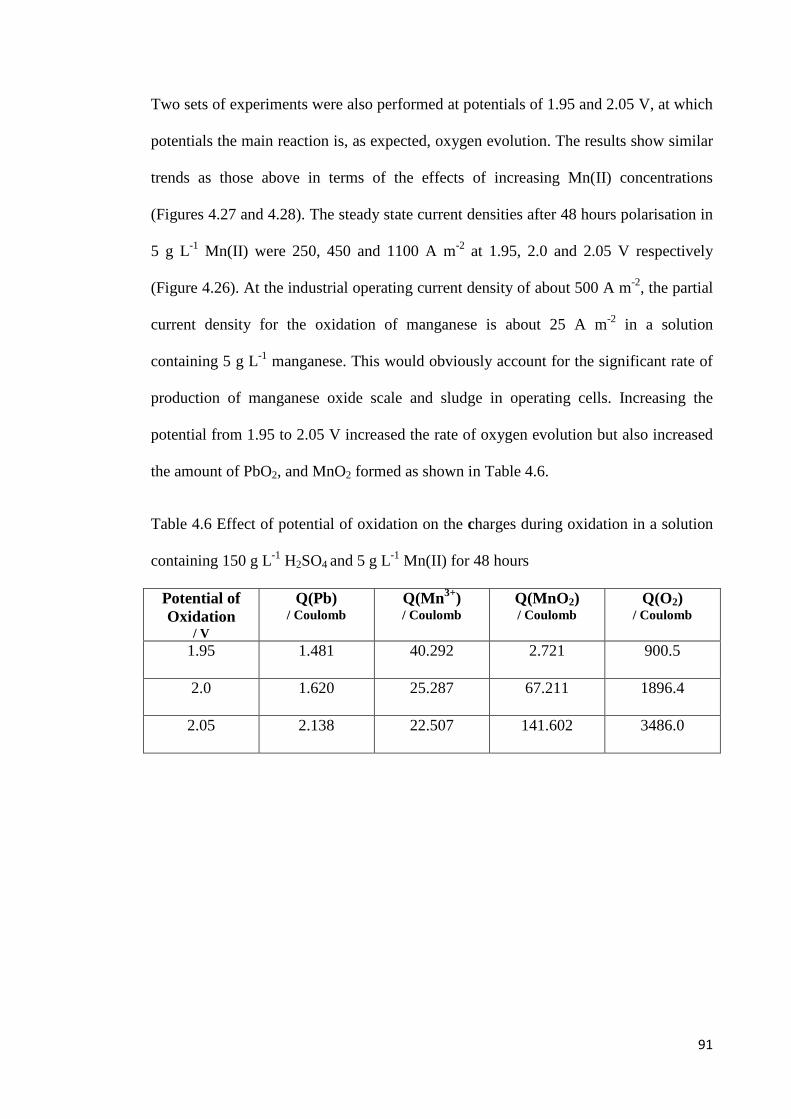
91
Two sets of experiments were also performed at potentials of 1.95 and 2.05 V, at which
potentials the main reaction is, as expected, oxygen evolution. The results show similar
trends as those above in terms of the effects of increasing Mn(II) concentrations
(Figures 4.27 and 4.28). The steady state current densities after 48 hours polarisation in
5 g L-1 Mn(II) were 250, 450 and 1100 A m-2 at 1.95, 2.0 and 2.05 V respectively
(Figure 4.26). At the industrial operating current density of about 500 A m-2, the partial
current density for the oxidation of manganese is about 25 A m-2 in a solution
containing 5 g L-1 manganese. This would obviously account for the significant rate of
production of manganese oxide scale and sludge in operating cells. Increasing the
potential from 1.95 to 2.05 V increased the rate of oxygen evolution but also increased
the amount of PbO2, and MnO2 formed as shown in Table 4.6.
Table 4.6 Effect of potential of oxidation on the charges during oxidation in a solution
containing 150 g L-1 H2SO4 and 5 g L-1 Mn(II) for 48 hours
Potential of Oxidation
/ V
Q(Pb) / Coulomb
Q(Mn3+) / Coulomb
Q(MnO2) / Coulomb
Q(O2) / Coulomb
1.95 1.481 40.292 2.721 900.5
2.0 1.620 25.287 67.211 1896.4
2.05 2.138 22.507 141.602 3486.0
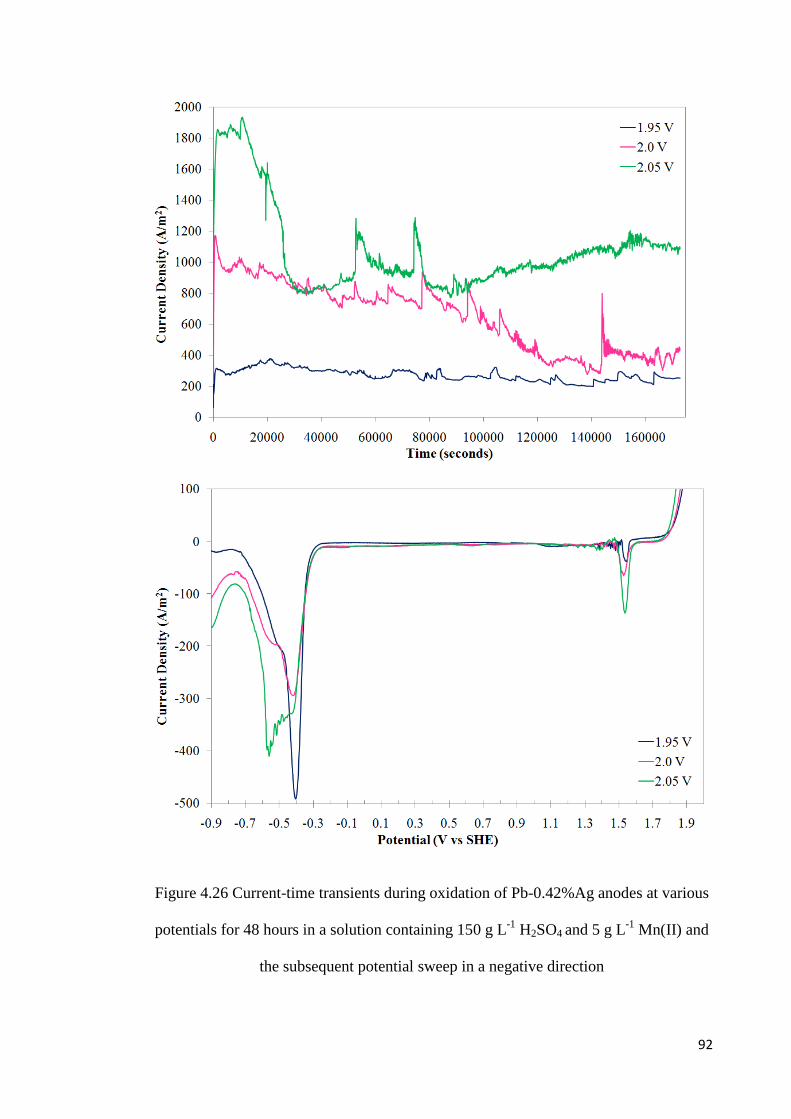
92
Figure 4.26 Current-time transients during oxidation of Pb-0.42%Ag anodes at various
potentials for 48 hours in a solution containing 150 g L-1 H2SO4 and 5 g L-1 Mn(II) and
the subsequent potential sweep in a negative direction
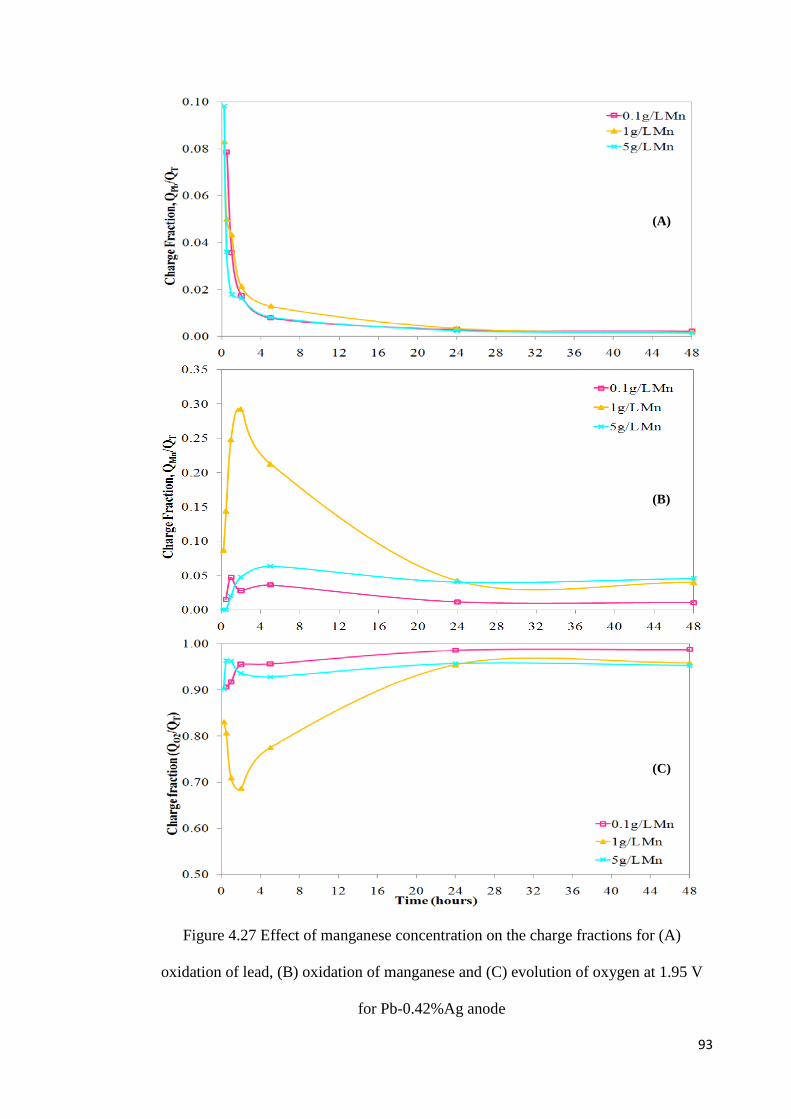
93
Figure 4.27 Effect of manganese concentration on the charge fractions for (A)
oxidation of lead, (B) oxidation of manganese and (C) evolution of oxygen at 1.95 V
for Pb-0.42%Ag anode
(A)
(B)
(C)

94
Figure 4.28 Effect of manganese concentration on the charge fractions for (A)
oxidation of lead, (B) oxidation of manganese and (C) evolution of oxygen at 2.05 V
for Pb-0.42%Ag anode
(A)
(B)
(C)
95
4.2.4 Effect of Varying Silver Content in the Alloy
Lead-silver anodes with a silver content ranging from about 0.5 to 1% are used in the
zinc electrowinning process. It has been previously pointed out that silver has a
significant effect in reducing the corrosion rate of the lead anode and in lowering the
overpotential for oxygen evolution reaction. The superior performance of the lead-
silver anode over pure lead anode is believed to be due to the presence of silver oxide,
most probably Ag2O2, in the PbO2 layer of the metal substrate (McGinnity 2008).
Oxygen evolution occurs preferentially at lower overpotentials on this silver oxide
surface. It was considered useful to assess the effect of varying the silver content of the
anodes on the rates of oxidation of both lead and manganese as well as oxygen
evolution. Samples of commercial materials with silver contents of 0.25, 0.42, 0.75, 1
and 2% were provided by RSR Technologies. The experiments were performed in 200
mL solution containing either 150 g L-1 H2SO4 or 150 g L-1 H2SO4 and 5 g L-1 Mn(II) at
40°C with an electrode rotation speed of 500 rpm.
Cyclic voltammograms of the pure lead anode and the five different lead-silver alloys
were obtained to identify the reactions occurring on the surface of the electrode in the
absence and presence of 5 g L-1 Mn(II) at 1 mV s-1 scan rate. In all cases the scan was
started from the open circuit potential at about -0.35 V to positive potentials, and
reversed when the current density reached ~500 A m-2. The scan was finished at -0.8 V
at which potential the evolution of hydrogen commenced. This potential range was
selected to cover all reactions of interest in the electrochemistry of lead.
Figure 4.29 summarizes the voltammetric scans of the anode surfaces in the absence of
manganese. As the potential was swept in a positive direction, the first anodic peak is
due to the oxidation of Pb to PbSO4 at about -0.31 V. The anodic peak for the
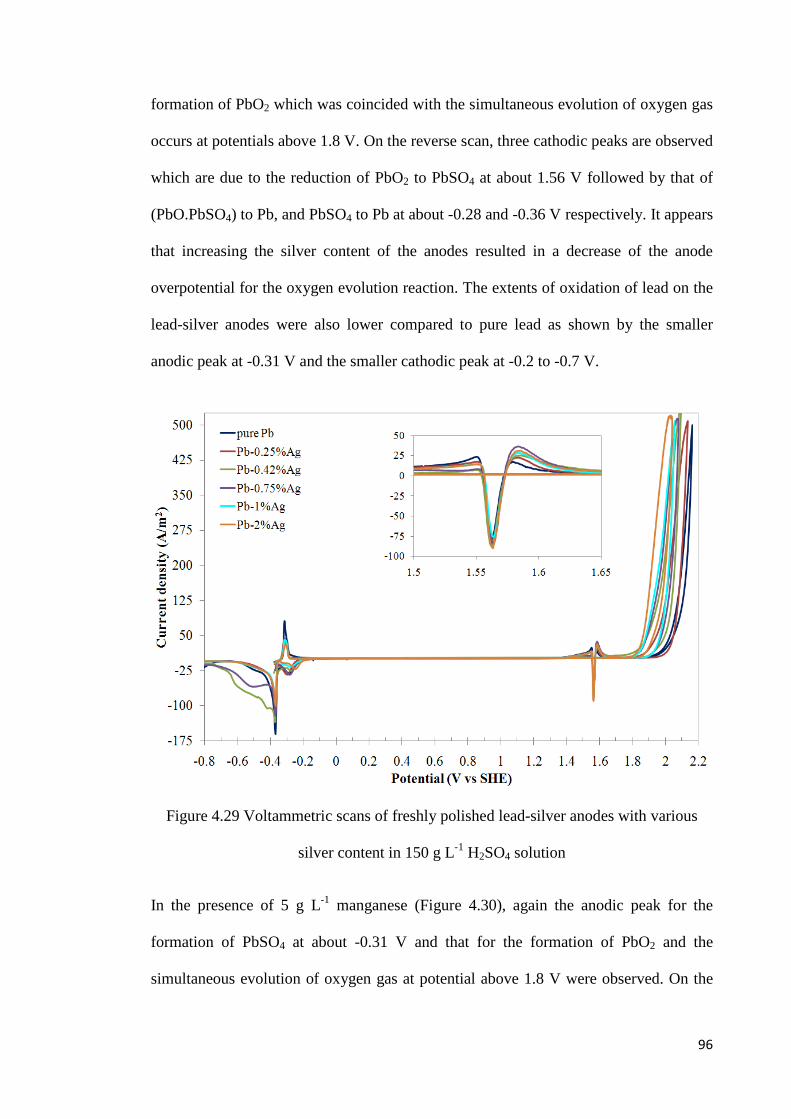
96
formation of PbO2 which was coincided with the simultaneous evolution of oxygen gas
occurs at potentials above 1.8 V. On the reverse scan, three cathodic peaks are observed
which are due to the reduction of PbO2 to PbSO4 at about 1.56 V followed by that of
(PbO.PbSO4) to Pb, and PbSO4 to Pb at about -0.28 and -0.36 V respectively. It appears
that increasing the silver content of the anodes resulted in a decrease of the anode
overpotential for the oxygen evolution reaction. The extents of oxidation of lead on the
lead-silver anodes were also lower compared to pure lead as shown by the smaller
anodic peak at -0.31 V and the smaller cathodic peak at -0.2 to -0.7 V.
Figure 4.29 Voltammetric scans of freshly polished lead-silver anodes with various
silver content in 150 g L-1 H2SO4 solution
In the presence of 5 g L-1 manganese (Figure 4.30), again the anodic peak for the
formation of PbSO4 at about -0.31 V and that for the formation of PbO2 and the
simultaneous evolution of oxygen gas at potential above 1.8 V were observed. On the
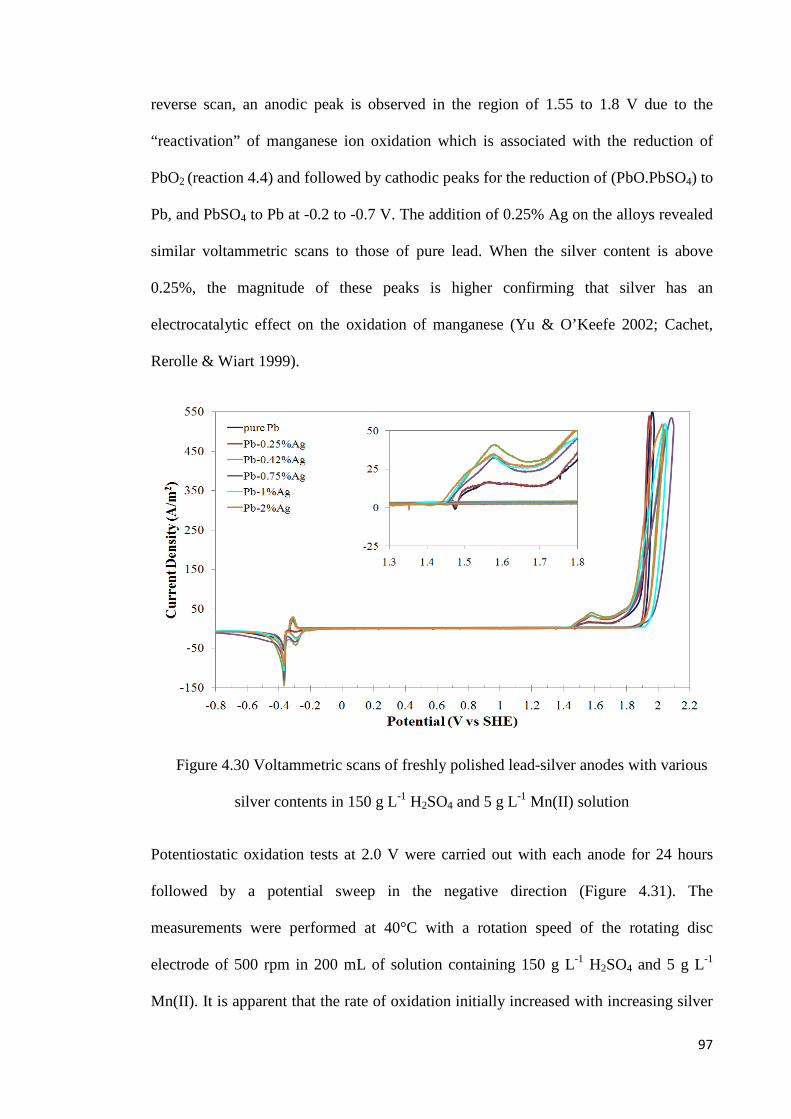
97
reverse scan, an anodic peak is observed in the region of 1.55 to 1.8 V due to the
“reactivation” of manganese ion oxidation which is associated with the reduction of
PbO2 (reaction 4.4) and followed by cathodic peaks for the reduction of (PbO.PbSO4) to
Pb, and PbSO4 to Pb at -0.2 to -0.7 V. The addition of 0.25% Ag on the alloys revealed
similar voltammetric scans to those of pure lead. When the silver content is above
0.25%, the magnitude of these peaks is higher confirming that silver has an
electrocatalytic effect on the oxidation of manganese (Yu & O’Keefe 2002; Cachet,
Rerolle & Wiart 1999).
Figure 4.30 Voltammetric scans of freshly polished lead-silver anodes with various
silver contents in 150 g L-1 H2SO4 and 5 g L-1 Mn(II) solution
Potentiostatic oxidation tests at 2.0 V were carried out with each anode for 24 hours
followed by a potential sweep in the negative direction (Figure 4.31). The
measurements were performed at 40°C with a rotation speed of the rotating disc
electrode of 500 rpm in 200 mL of solution containing 150 g L-1 H2SO4 and 5 g L-1
Mn(II). It is apparent that the rate of oxidation initially increased with increasing silver
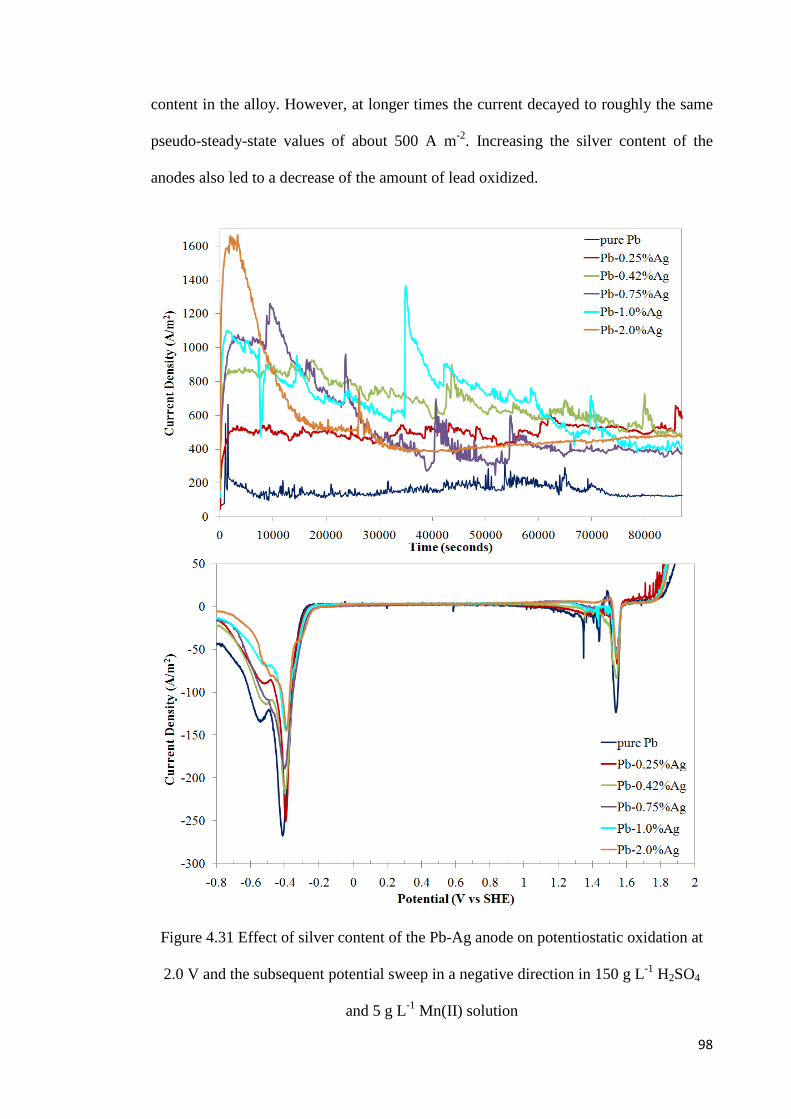
98
content in the alloy. However, at longer times the current decayed to roughly the same
pseudo-steady-state values of about 500 A m-2. Increasing the silver content of the
anodes also led to a decrease of the amount of lead oxidized.
Figure 4.31 Effect of silver content of the Pb-Ag anode on potentiostatic oxidation at
2.0 V and the subsequent potential sweep in a negative direction in 150 g L-1 H2SO4
and 5 g L-1 Mn(II) solution

99
Table 4.7 and Figure 4.32 summarize the relevant fractions of charge involved in the
main reactions after 24 hours oxidation of the various alloys. It is noticeable that
increasing the silver alloy concentrations increased the cumulative charge passed
(increased current density at the same potential) and also increased the extent of
oxidation of manganese and the formation of MnO2 both on the anode and in the
electrolyte. The rate of oxygen evolution was also reduced with increasing silver
content. The behavior appears to be similar for silver contents of about 0.75% and
greater.
Table 4.7 Effect of silver alloy content on the charge fraction for oxidation of Pb and
Mn and evolution of O2
Ag
%
Charge Fraction for Pb Oxidation, QPb/QT
Charge Fraction for Mn Oxidation, QMn/QT
Charge Fraction for O2 Evolution, QO2/QT
0 0.005 0.039 0.956
0.25 0.001 0.013 0.986
0.42 0.001 0.026 0.973
0.75 0.001 0.106 0.893
1.00 0.001 0.076 0.923
2.00 0.001 0.092 0.908
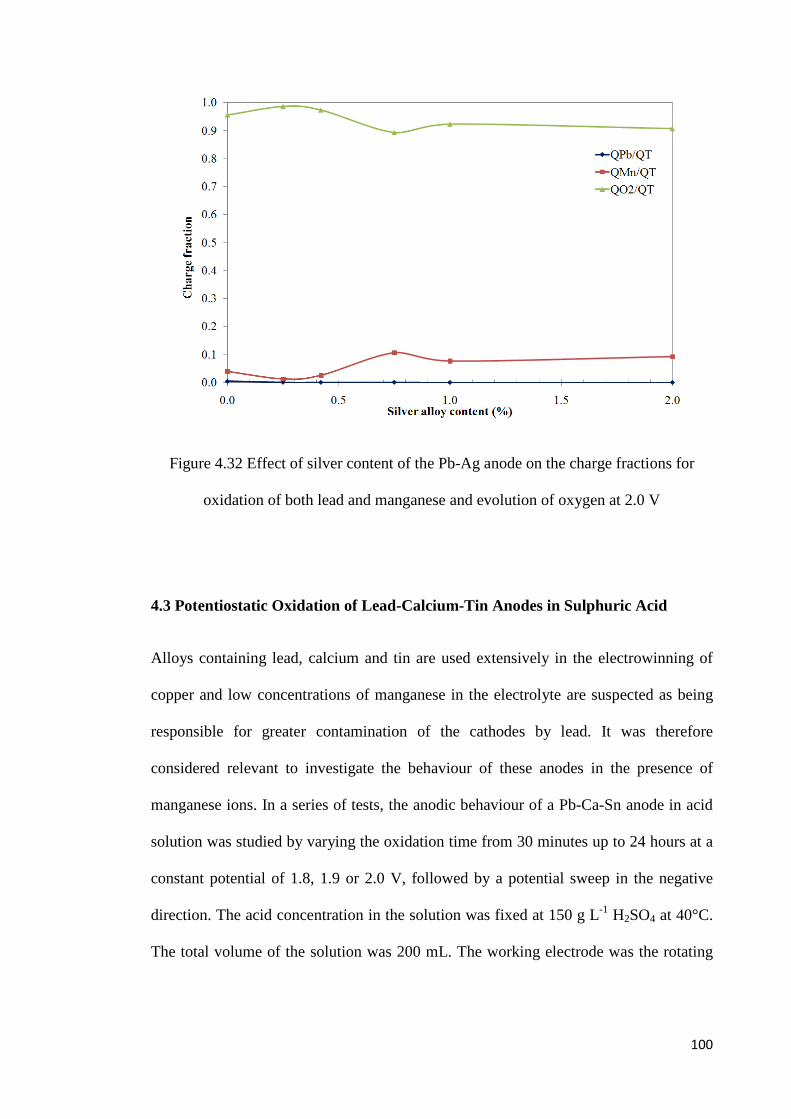
100
Figure 4.32 Effect of silver content of the Pb-Ag anode on the charge fractions for
oxidation of both lead and manganese and evolution of oxygen at 2.0 V
4.3 Potentiostatic Oxidation of Lead-Calcium-Tin Anodes in Sulphuric Acid
Alloys containing lead, calcium and tin are used extensively in the electrowinning of
copper and low concentrations of manganese in the electrolyte are suspected as being
responsible for greater contamination of the cathodes by lead. It was therefore
considered relevant to investigate the behaviour of these anodes in the presence of
manganese ions. In a series of tests, the anodic behaviour of a Pb-Ca-Sn anode in acid
solution was studied by varying the oxidation time from 30 minutes up to 24 hours at a
constant potential of 1.8, 1.9 or 2.0 V, followed by a potential sweep in the negative
direction. The acid concentration in the solution was fixed at 150 g L-1 H2SO4 at 40°C.
The total volume of the solution was 200 mL. The working electrode was the rotating
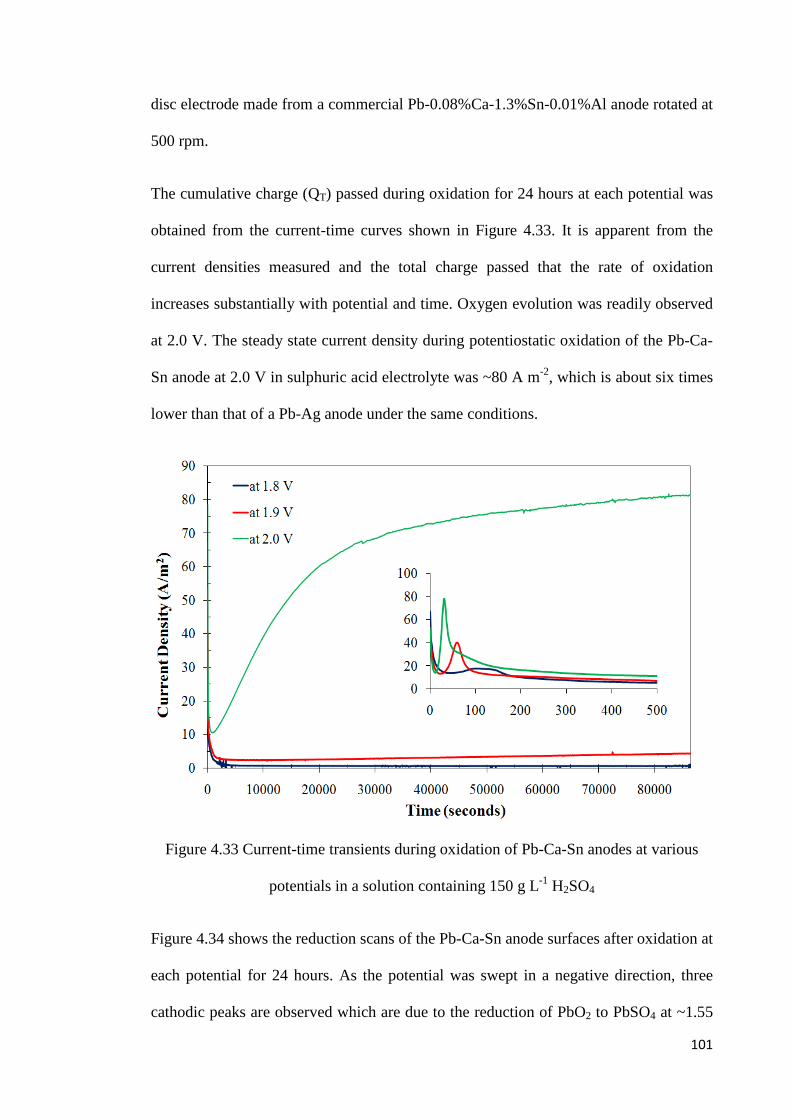
101
disc electrode made from a commercial Pb-0.08%Ca-1.3%Sn-0.01%Al anode rotated at
500 rpm.
The cumulative charge (QT) passed during oxidation for 24 hours at each potential was
obtained from the current-time curves shown in Figure 4.33. It is apparent from the
current densities measured and the total charge passed that the rate of oxidation
increases substantially with potential and time. Oxygen evolution was readily observed
at 2.0 V. The steady state current density during potentiostatic oxidation of the Pb-Ca-
Sn anode at 2.0 V in sulphuric acid electrolyte was ~80 A m-2, which is about six times
lower than that of a Pb-Ag anode under the same conditions.
Figure 4.33 Current-time transients during oxidation of Pb-Ca-Sn anodes at various
potentials in a solution containing 150 g L-1 H2SO4
Figure 4.34 shows the reduction scans of the Pb-Ca-Sn anode surfaces after oxidation at
each potential for 24 hours. As the potential was swept in a negative direction, three
cathodic peaks are observed which are due to the reduction of PbO2 to PbSO4 at ~1.55
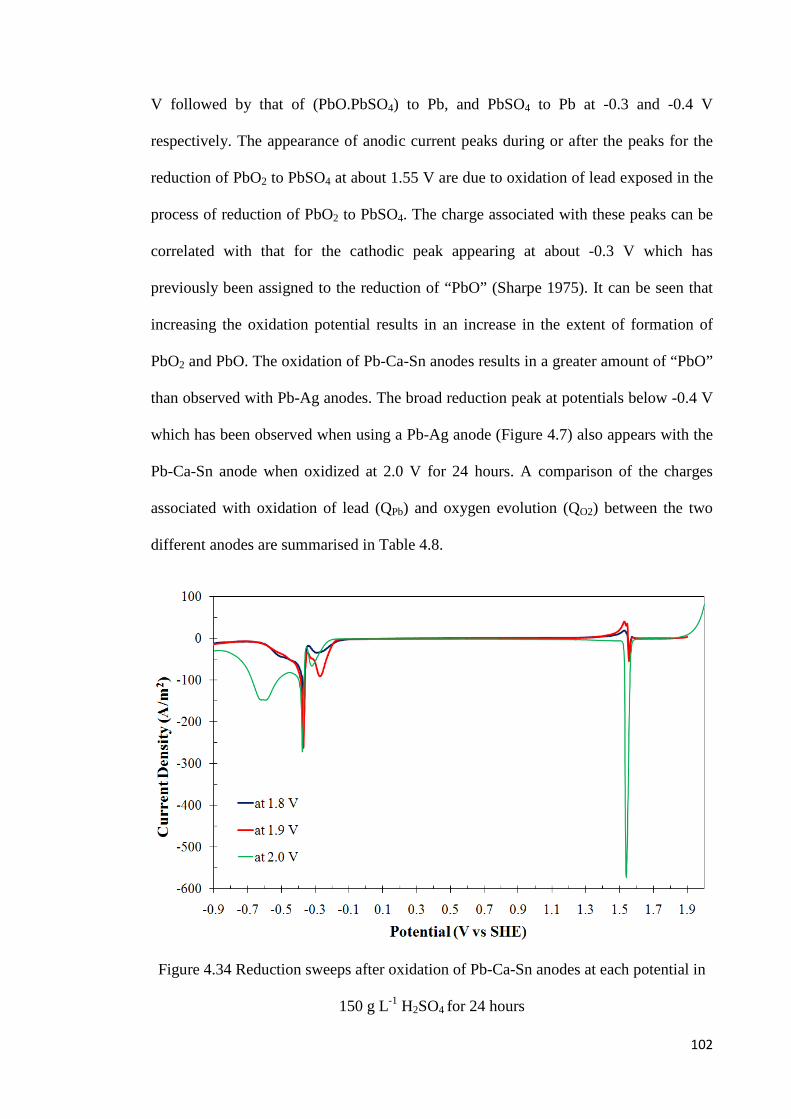
102
V followed by that of (PbO.PbSO4) to Pb, and PbSO4 to Pb at -0.3 and -0.4 V
respectively. The appearance of anodic current peaks during or after the peaks for the
reduction of PbO2 to PbSO4 at about 1.55 V are due to oxidation of lead exposed in the
process of reduction of PbO2 to PbSO4. The charge associated with these peaks can be
correlated with that for the cathodic peak appearing at about -0.3 V which has
previously been assigned to the reduction of “PbO” (Sharpe 1975). It can be seen that
increasing the oxidation potential results in an increase in the extent of formation of
PbO2 and PbO. The oxidation of Pb-Ca-Sn anodes results in a greater amount of “PbO”
than observed with Pb-Ag anodes. The broad reduction peak at potentials below -0.4 V
which has been observed when using a Pb-Ag anode (Figure 4.7) also appears with the
Pb-Ca-Sn anode when oxidized at 2.0 V for 24 hours. A comparison of the charges
associated with oxidation of lead (QPb) and oxygen evolution (QO2) between the two
different anodes are summarised in Table 4.8.
Figure 4.34 Reduction sweeps after oxidation of Pb-Ca-Sn anodes at each potential in
150 g L-1 H2SO4 for 24 hours

103
Table 4.8 Charge fractions during oxidation of the Pb-0.75%Ag and Pb-Ca-Sn anodes
in 150 g L-1 H2SO4 for 24 hours at different potentials
Potential
/ V
Total Charge, QT
/ Coulomb
Charge Fraction for Pb Oxidation,
QPb/QT
Charge Fraction for O2 Evolution,
QO2/QT
Pb-Ag Pb-Ca-Sn Pb-Ag Pb-Ca-Sn Pb-Ag Pb-Ca-Sn
1.8 2.611 1.195 0.250 0.287 0.750 0.713
1.9 65.869 5.413 0.012 0.087 0.988 0.913
2.0 867.129 112.168 0.002 0.011 0.998 0.989
As can be seen from Table 4.8, the charges attributable to the evolution of oxygen
during oxidation of Pb-Ca-Sn anodes at all potentials for 24 hours were slightly lower
than those of Pb-Ag anodes and this coupled with the considerably higher current
densities observed on the Pb-Ag anodes confirms that silver exhibits a catalytic effect
on the oxygen evolution reaction (Cachet, Rerolle & Wiart 1996; Ivanov et al. 2000).
4.4 Potentiostatic Oxidation of Lead-Calcium-Tin Anodes in Sulphuric Acid
Solutions Containing Manganese
These tests were conducted potentiostatically at 1.7, 1.8, 1.9 and 2.0 V for 30 minutes
up to 24 hours at 40ºC in 200 mL of a solution containing 150 g L-1 H2SO4 with either
0.1 or 1.0 g L-1 Mn(II). Each test was followed by a negative-going potential sweep and
analyses of the oxidised forms of manganese present as solids or in solution after the
cathodic sweep.
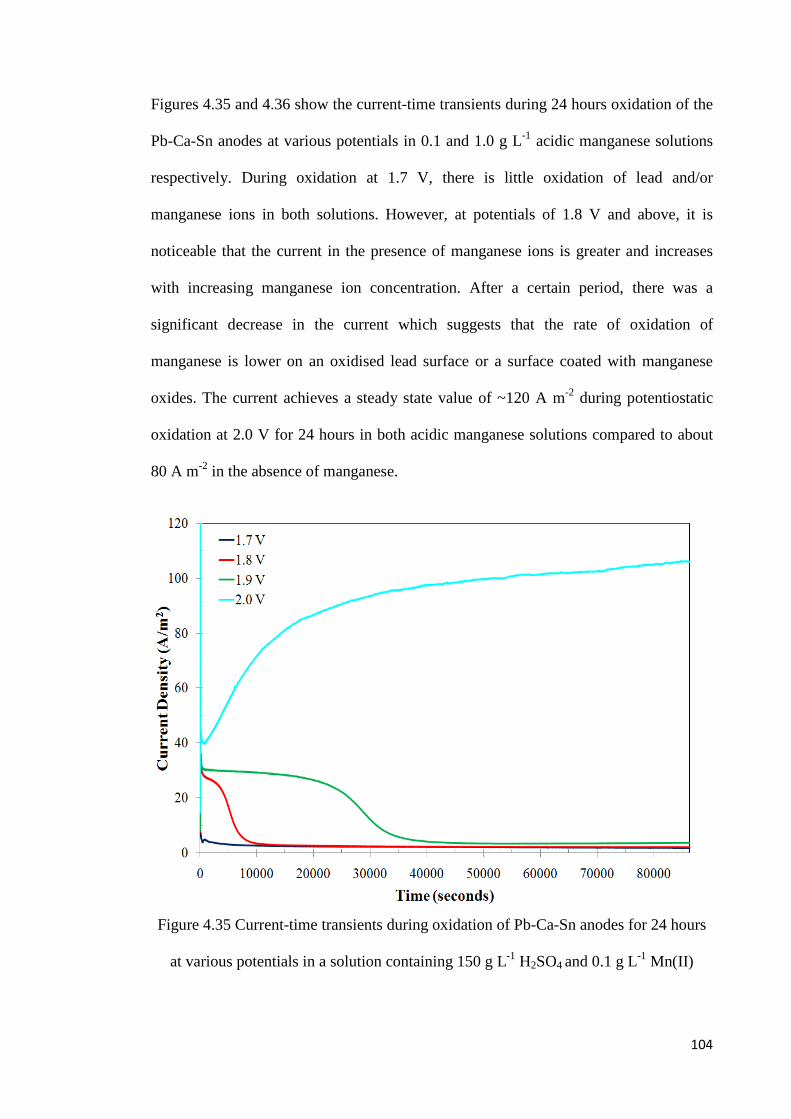
104
Figures 4.35 and 4.36 show the current-time transients during 24 hours oxidation of the
Pb-Ca-Sn anodes at various potentials in 0.1 and 1.0 g L-1 acidic manganese solutions
respectively. During oxidation at 1.7 V, there is little oxidation of lead and/or
manganese ions in both solutions. However, at potentials of 1.8 V and above, it is
noticeable that the current in the presence of manganese ions is greater and increases
with increasing manganese ion concentration. After a certain period, there was a
significant decrease in the current which suggests that the rate of oxidation of
manganese is lower on an oxidised lead surface or a surface coated with manganese
oxides. The current achieves a steady state value of ~120 A m-2 during potentiostatic
oxidation at 2.0 V for 24 hours in both acidic manganese solutions compared to about
80 A m-2 in the absence of manganese.
Figure 4.35 Current-time transients during oxidation of Pb-Ca-Sn anodes for 24 hours
at various potentials in a solution containing 150 g L-1 H2SO4 and 0.1 g L-1 Mn(II)
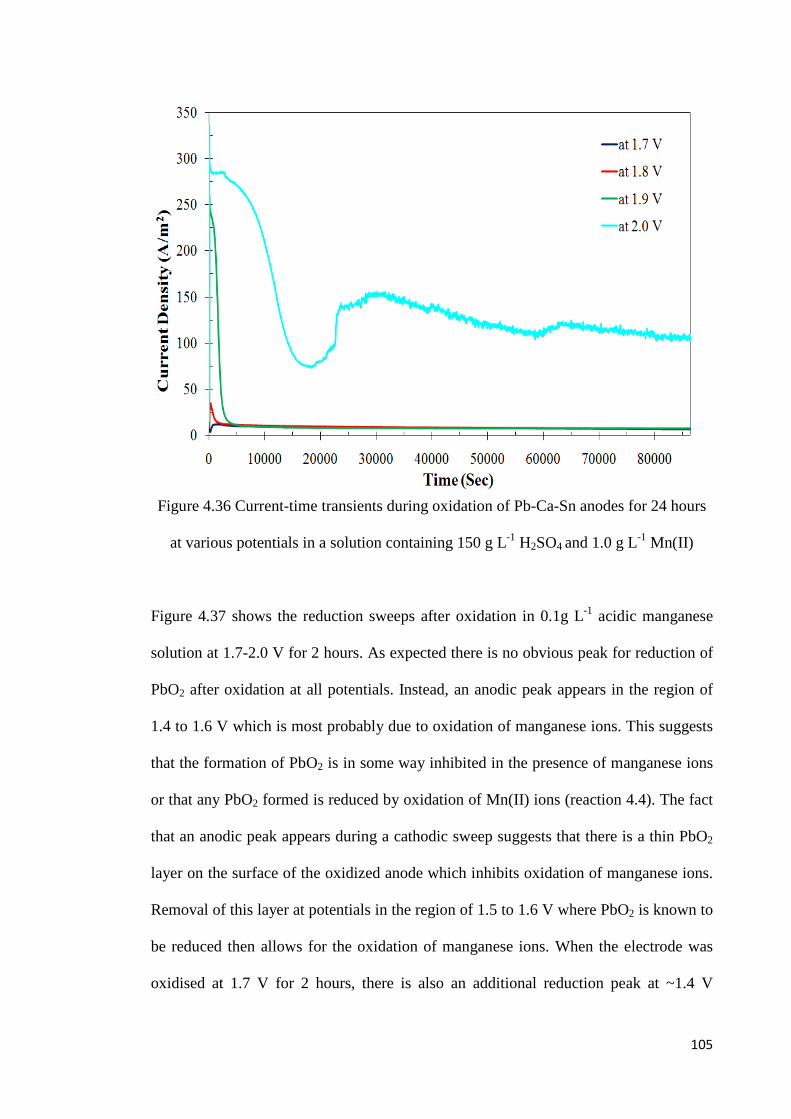
105
Figure 4.36 Current-time transients during oxidation of Pb-Ca-Sn anodes for 24 hours
at various potentials in a solution containing 150 g L-1 H2SO4 and 1.0 g L-1 Mn(II)
Figure 4.37 shows the reduction sweeps after oxidation in 0.1g L-1 acidic manganese
solution at 1.7-2.0 V for 2 hours. As expected there is no obvious peak for reduction of
PbO2 after oxidation at all potentials. Instead, an anodic peak appears in the region of
1.4 to 1.6 V which is most probably due to oxidation of manganese ions. This suggests
that the formation of PbO2 is in some way inhibited in the presence of manganese ions
or that any PbO2 formed is reduced by oxidation of Mn(II) ions (reaction 4.4). The fact
that an anodic peak appears during a cathodic sweep suggests that there is a thin PbO2
layer on the surface of the oxidized anode which inhibits oxidation of manganese ions.
Removal of this layer at potentials in the region of 1.5 to 1.6 V where PbO2 is known to
be reduced then allows for the oxidation of manganese ions. When the electrode was
oxidised at 1.7 V for 2 hours, there is also an additional reduction peak at ~1.4 V

106
following the manganese oxidation peak. This cathodic peak also appears when the
electrode was oxidised at 1.7, 1.8 and 1.9 V for 24 hours (Figure 4.38), but these peaks
shift to a lower potential of ~1.275 V. These peaks are probably due to the reduction of
MnO2 to Mn(III) and/or Mn(II) (E0 for MnO2/Mn2+ is 1.223 V). It can also be seen
from Figure 4.38 that the peak for the reduction of PbO2 to PbSO4 at ~1.55 V
reappeared after 24 hours oxidation at 2.0 V.
Figure 4.37 Reduction sweeps after oxidation of Pb-Ca-Sn anodes at each potentials in
150 g L-1 H2SO4 and 0.1 g L-1 Mn(II) for 2 hours
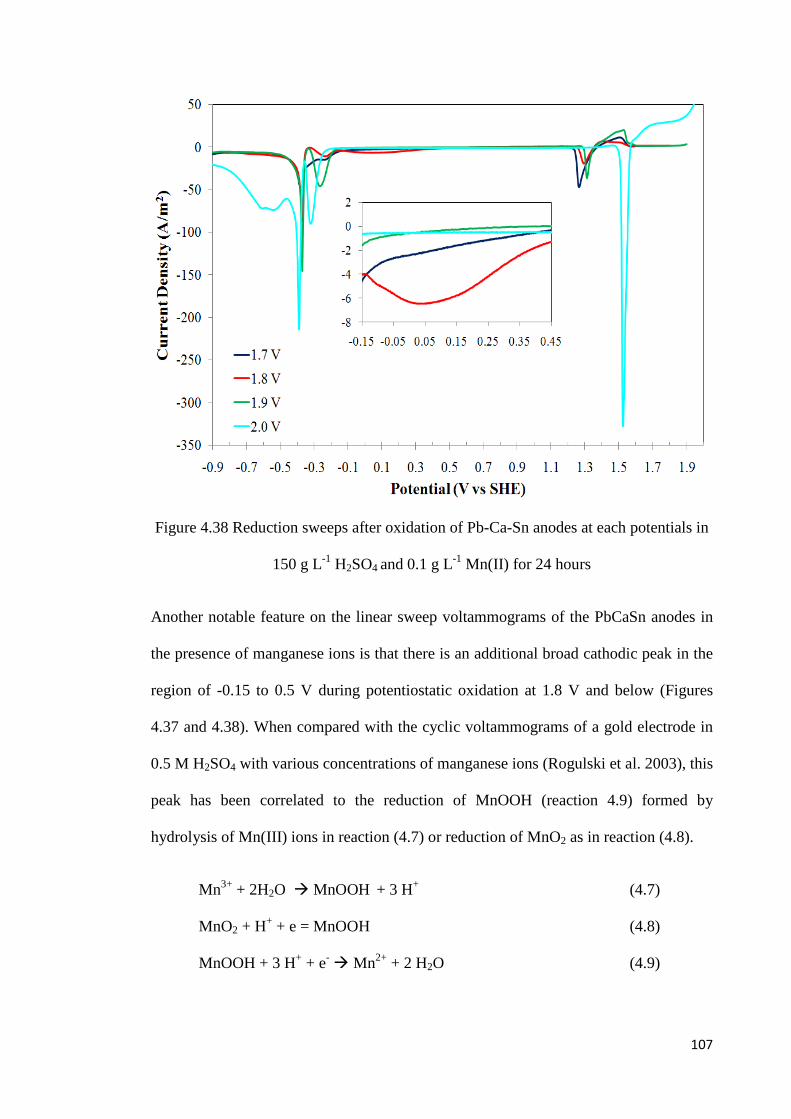
107
Figure 4.38 Reduction sweeps after oxidation of Pb-Ca-Sn anodes at each potentials in
150 g L-1 H2SO4 and 0.1 g L-1 Mn(II) for 24 hours
Another notable feature on the linear sweep voltammograms of the PbCaSn anodes in
the presence of manganese ions is that there is an additional broad cathodic peak in the
region of -0.15 to 0.5 V during potentiostatic oxidation at 1.8 V and below (Figures
4.37 and 4.38). When compared with the cyclic voltammograms of a gold electrode in
0.5 M H2SO4 with various concentrations of manganese ions (Rogulski et al. 2003), this
peak has been correlated to the reduction of MnOOH (reaction 4.9) formed by
hydrolysis of Mn(III) ions in reaction (4.7) or reduction of MnO2 as in reaction (4.8).
Mn3+ + 2H2O MnOOH + 3 H+ (4.7)
MnO2 + H+ + e = MnOOH (4.8)
MnOOH + 3 H+ + e- Mn2+ + 2 H2O (4.9)
108
Ipinza et al. (2007) suggested that amorphous MnOOH is formed in the oxide layer on
a PbCaSn anode as the intermediate species in the oxidation to ε-MnO2. However,
further surface analyses are required to confirm the formation of MnOOH on a PbCaSn
anode.
Figure 4.39 shows the reduction sweeps after oxidation in 1.0 g L-1 acidic manganese
solution at 1.7-2.0 V for 24 hours. Both of the reduction peaks of MnO2 to
Mn2+/MnOOH at ~1.2 V and MnOOH to Mn2+ ions at the region of 0 V increased with
increasing manganese ion concentration and decreasing oxidation potential. There does
not appear to be a correlation between the charges associated with the peaks at the 1.2
V and 0 V with that for the former being higher than that for the latter. This suggests
that reduction to both soluble Mn2+ ions and insoluble MnOOH occurs at 1.2 V. In any
event, the oxidation of Mn2+ ions during the cathodic sweep is a very small fraction of
the oxidation products formed during anodization for 24 hours. Reduction of these
oxidation products does not occur during the cathodic sweep. Increasing the
concentration of manganese ions also resulted in a decrease of the extent of PbO2 and
PbSO4 formation.
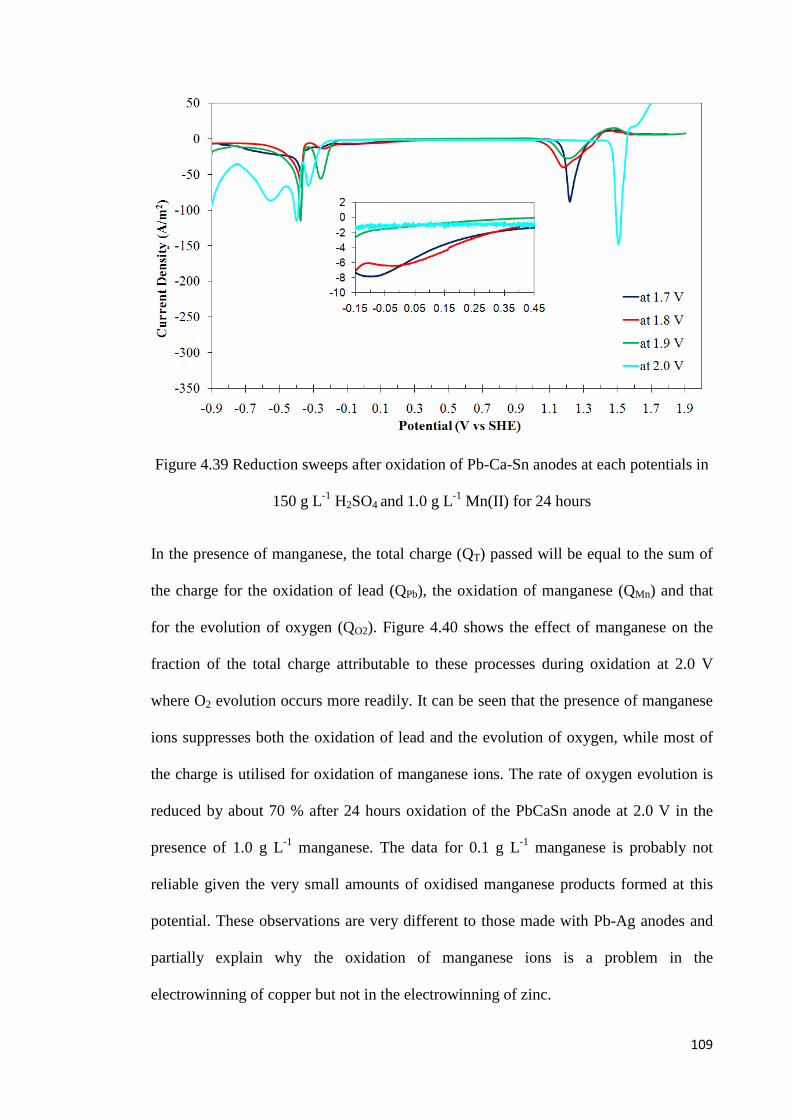
109
Figure 4.39 Reduction sweeps after oxidation of Pb-Ca-Sn anodes at each potentials in
150 g L-1 H2SO4 and 1.0 g L-1 Mn(II) for 24 hours
In the presence of manganese, the total charge (QT) passed will be equal to the sum of
the charge for the oxidation of lead (QPb), the oxidation of manganese (QMn) and that
for the evolution of oxygen (QO2). Figure 4.40 shows the effect of manganese on the
fraction of the total charge attributable to these processes during oxidation at 2.0 V
where O2 evolution occurs more readily. It can be seen that the presence of manganese
ions suppresses both the oxidation of lead and the evolution of oxygen, while most of
the charge is utilised for oxidation of manganese ions. The rate of oxygen evolution is
reduced by about 70 % after 24 hours oxidation of the PbCaSn anode at 2.0 V in the
presence of 1.0 g L-1 manganese. The data for 0.1 g L-1 manganese is probably not
reliable given the very small amounts of oxidised manganese products formed at this
potential. These observations are very different to those made with Pb-Ag anodes and
partially explain why the oxidation of manganese ions is a problem in the
electrowinning of copper but not in the electrowinning of zinc.
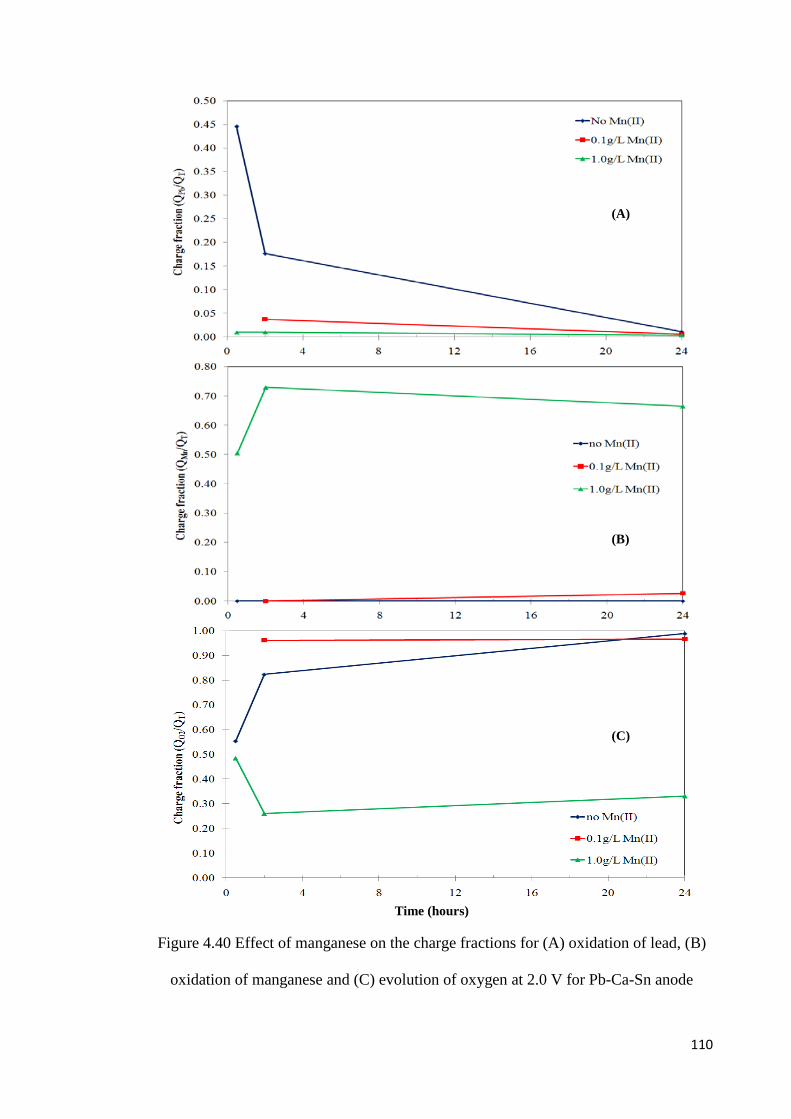
110
Time (hours)
Figure 4.40 Effect of manganese on the charge fractions for (A) oxidation of lead, (B)
oxidation of manganese and (C) evolution of oxygen at 2.0 V for Pb-Ca-Sn anode
(A)
(B)
(C)
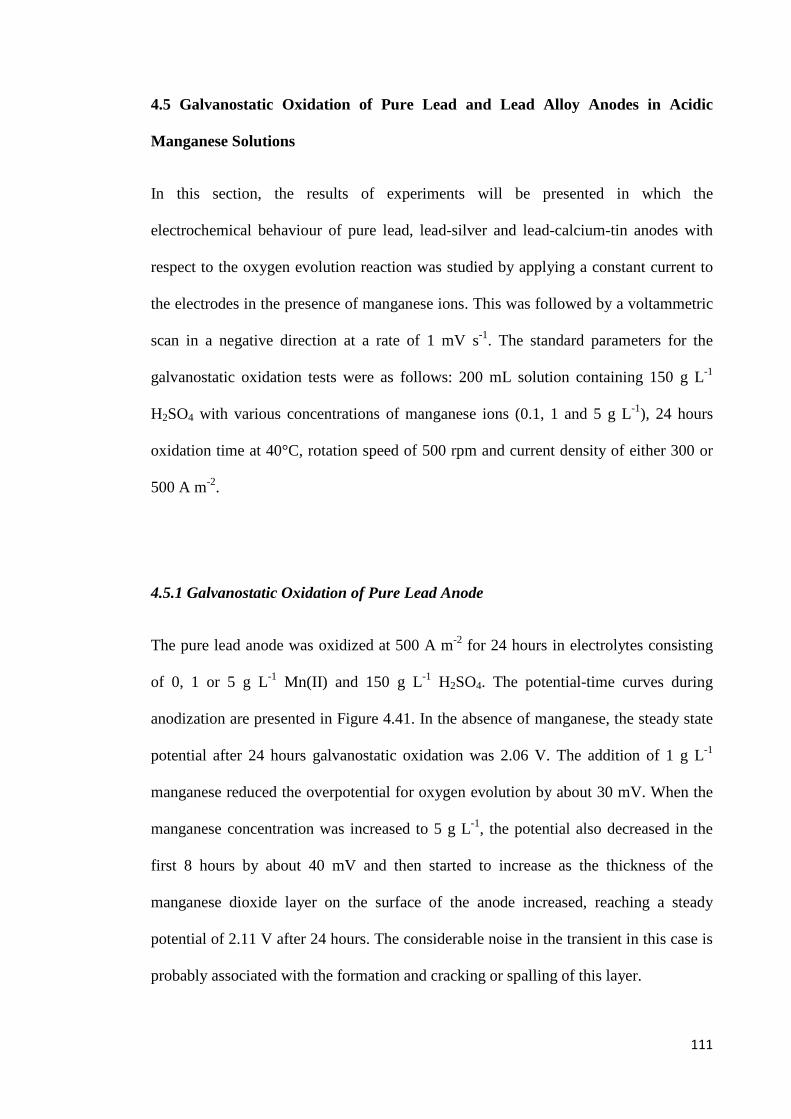
111
4.5 Galvanostatic Oxidation of Pure Lead and Lead Alloy Anodes in Acidic
Manganese Solutions
In this section, the results of experiments will be presented in which the
electrochemical behaviour of pure lead, lead-silver and lead-calcium-tin anodes with
respect to the oxygen evolution reaction was studied by applying a constant current to
the electrodes in the presence of manganese ions. This was followed by a voltammetric
scan in a negative direction at a rate of 1 mV s-1. The standard parameters for the
galvanostatic oxidation tests were as follows: 200 mL solution containing 150 g L-1
H2SO4 with various concentrations of manganese ions (0.1, 1 and 5 g L-1), 24 hours
oxidation time at 40°C, rotation speed of 500 rpm and current density of either 300 or
500 A m-2.
4.5.1 Galvanostatic Oxidation of Pure Lead Anode
The pure lead anode was oxidized at 500 A m-2 for 24 hours in electrolytes consisting
of 0, 1 or 5 g L-1 Mn(II) and 150 g L-1 H2SO4. The potential-time curves during
anodization are presented in Figure 4.41. In the absence of manganese, the steady state
potential after 24 hours galvanostatic oxidation was 2.06 V. The addition of 1 g L-1
manganese reduced the overpotential for oxygen evolution by about 30 mV. When the
manganese concentration was increased to 5 g L-1, the potential also decreased in the
first 8 hours by about 40 mV and then started to increase as the thickness of the
manganese dioxide layer on the surface of the anode increased, reaching a steady
potential of 2.11 V after 24 hours. The considerable noise in the transient in this case is
probably associated with the formation and cracking or spalling of this layer.
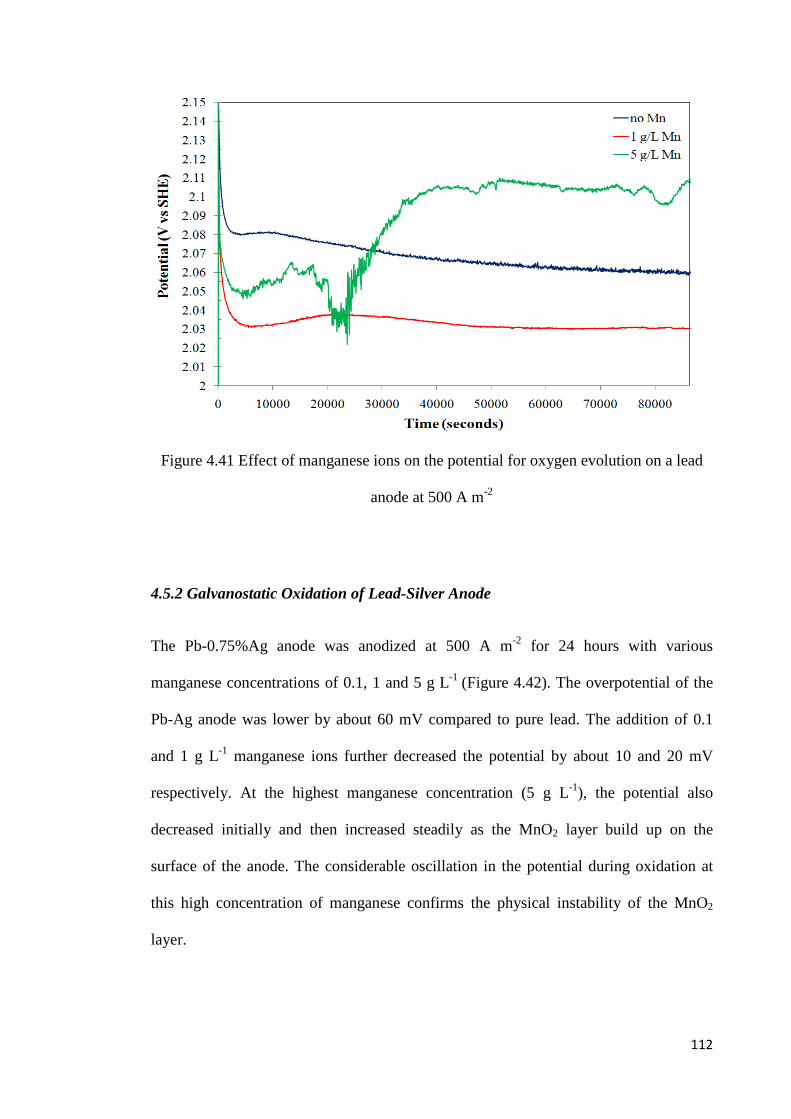
112
Figure 4.41 Effect of manganese ions on the potential for oxygen evolution on a lead
anode at 500 A m-2
4.5.2 Galvanostatic Oxidation of Lead-Silver Anode
The Pb-0.75%Ag anode was anodized at 500 A m-2 for 24 hours with various
manganese concentrations of 0.1, 1 and 5 g L-1 (Figure 4.42). The overpotential of the
Pb-Ag anode was lower by about 60 mV compared to pure lead. The addition of 0.1
and 1 g L-1 manganese ions further decreased the potential by about 10 and 20 mV
respectively. At the highest manganese concentration (5 g L-1), the potential also
decreased initially and then increased steadily as the MnO2 layer build up on the
surface of the anode. The considerable oscillation in the potential during oxidation at
this high concentration of manganese confirms the physical instability of the MnO2
layer.
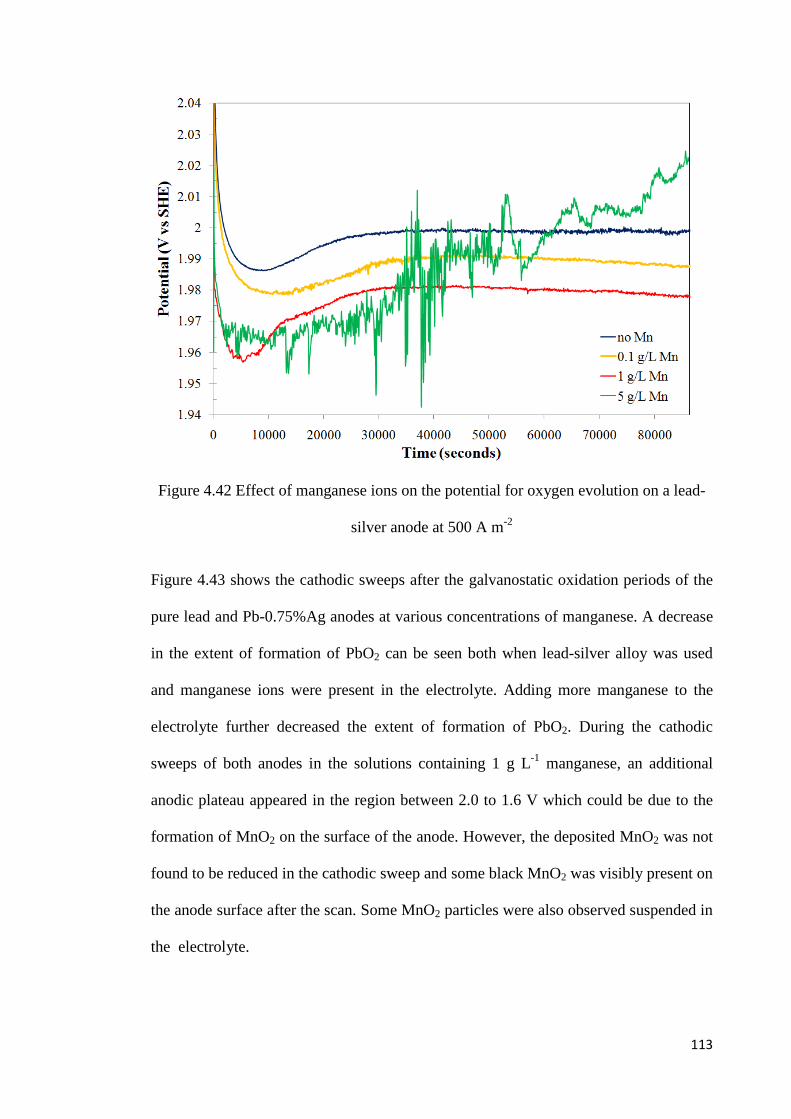
113
Figure 4.42 Effect of manganese ions on the potential for oxygen evolution on a lead-
silver anode at 500 A m-2
Figure 4.43 shows the cathodic sweeps after the galvanostatic oxidation periods of the
pure lead and Pb-0.75%Ag anodes at various concentrations of manganese. A decrease
in the extent of formation of PbO2 can be seen both when lead-silver alloy was used
and manganese ions were present in the electrolyte. Adding more manganese to the
electrolyte further decreased the extent of formation of PbO2. During the cathodic
sweeps of both anodes in the solutions containing 1 g L-1 manganese, an additional
anodic plateau appeared in the region between 2.0 to 1.6 V which could be due to the
formation of MnO2 on the surface of the anode. However, the deposited MnO2 was not
found to be reduced in the cathodic sweep and some black MnO2 was visibly present on
the anode surface after the scan. Some MnO2 particles were also observed suspended in
the electrolyte.
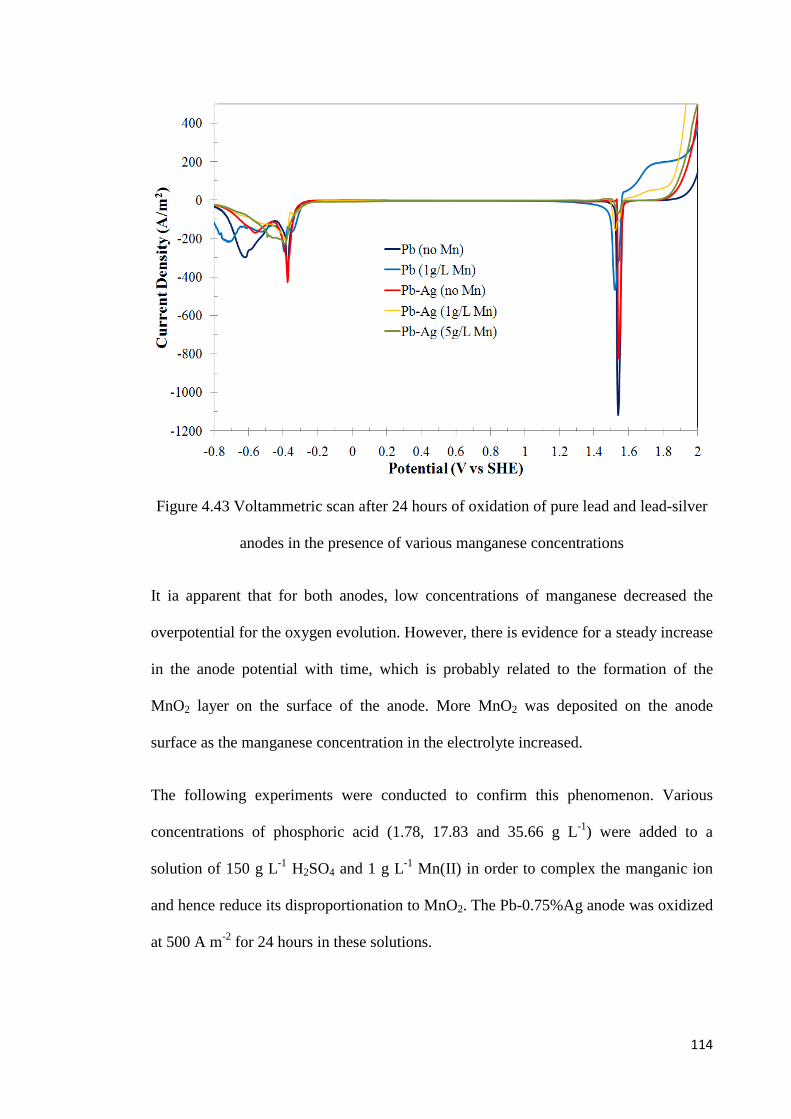
114
Figure 4.43 Voltammetric scan after 24 hours of oxidation of pure lead and lead-silver
anodes in the presence of various manganese concentrations
It ia apparent that for both anodes, low concentrations of manganese decreased the
overpotential for the oxygen evolution. However, there is evidence for a steady increase
in the anode potential with time, which is probably related to the formation of the
MnO2 layer on the surface of the anode. More MnO2 was deposited on the anode
surface as the manganese concentration in the electrolyte increased.
The following experiments were conducted to confirm this phenomenon. Various
concentrations of phosphoric acid (1.78, 17.83 and 35.66 g L-1) were added to a
solution of 150 g L-1 H2SO4 and 1 g L-1 Mn(II) in order to complex the manganic ion
and hence reduce its disproportionation to MnO2. The Pb-0.75%Ag anode was oxidized
at 500 A m-2 for 24 hours in these solutions.
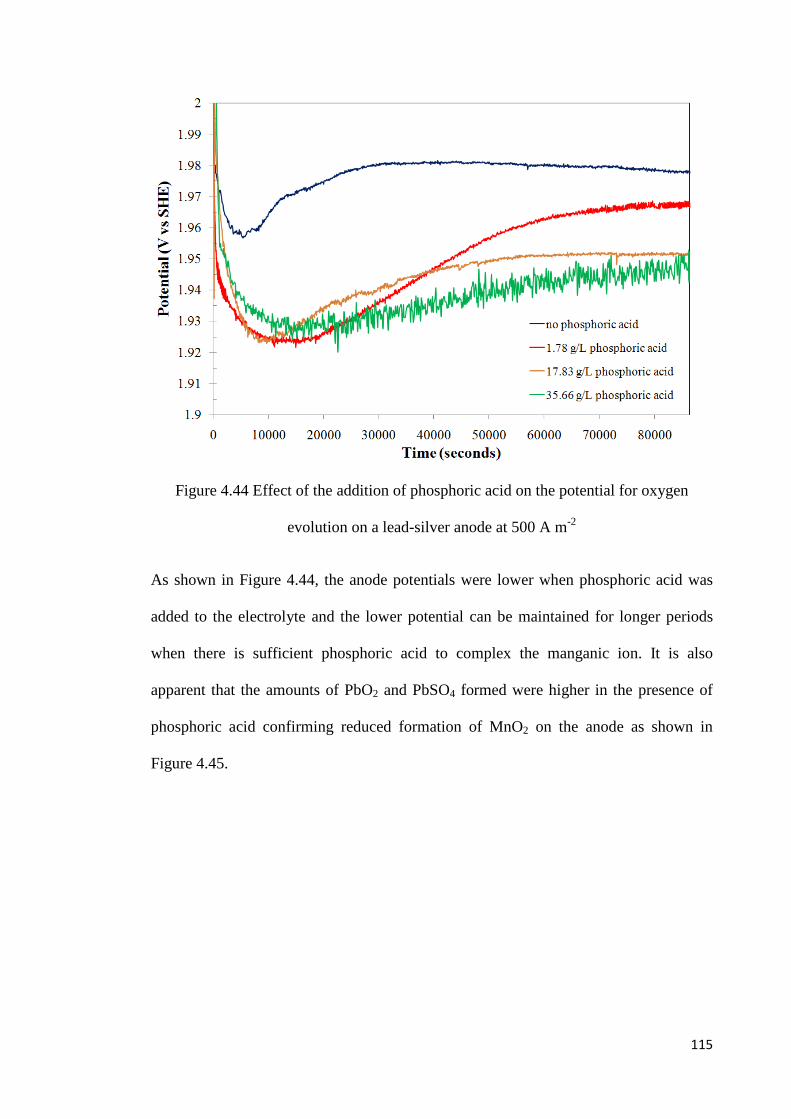
115
Figure 4.44 Effect of the addition of phosphoric acid on the potential for oxygen
evolution on a lead-silver anode at 500 A m-2
As shown in Figure 4.44, the anode potentials were lower when phosphoric acid was
added to the electrolyte and the lower potential can be maintained for longer periods
when there is sufficient phosphoric acid to complex the manganic ion. It is also
apparent that the amounts of PbO2 and PbSO4 formed were higher in the presence of
phosphoric acid confirming reduced formation of MnO2 on the anode as shown in
Figure 4.45.
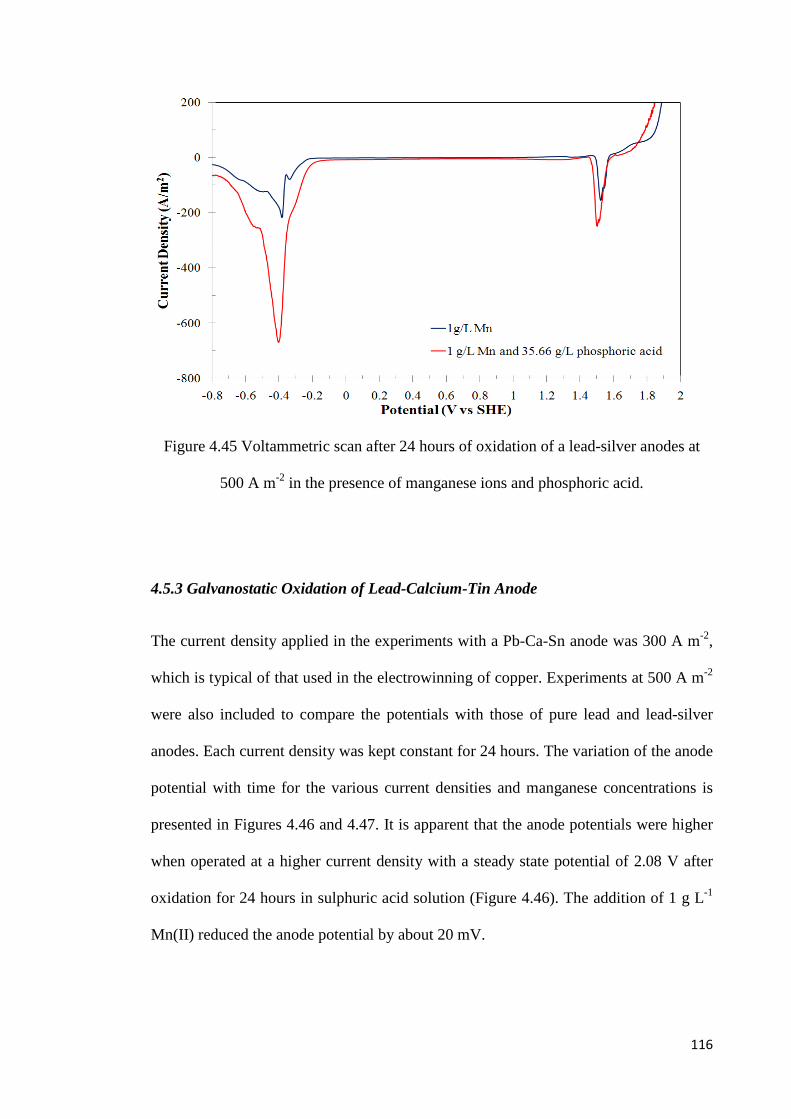
116
Figure 4.45 Voltammetric scan after 24 hours of oxidation of a lead-silver anodes at
500 A m-2 in the presence of manganese ions and phosphoric acid.
4.5.3 Galvanostatic Oxidation of Lead-Calcium-Tin Anode
The current density applied in the experiments with a Pb-Ca-Sn anode was 300 A m-2,
which is typical of that used in the electrowinning of copper. Experiments at 500 A m-2
were also included to compare the potentials with those of pure lead and lead-silver
anodes. Each current density was kept constant for 24 hours. The variation of the anode
potential with time for the various current densities and manganese concentrations is
presented in Figures 4.46 and 4.47. It is apparent that the anode potentials were higher
when operated at a higher current density with a steady state potential of 2.08 V after
oxidation for 24 hours in sulphuric acid solution (Figure 4.46). The addition of 1 g L-1
Mn(II) reduced the anode potential by about 20 mV.
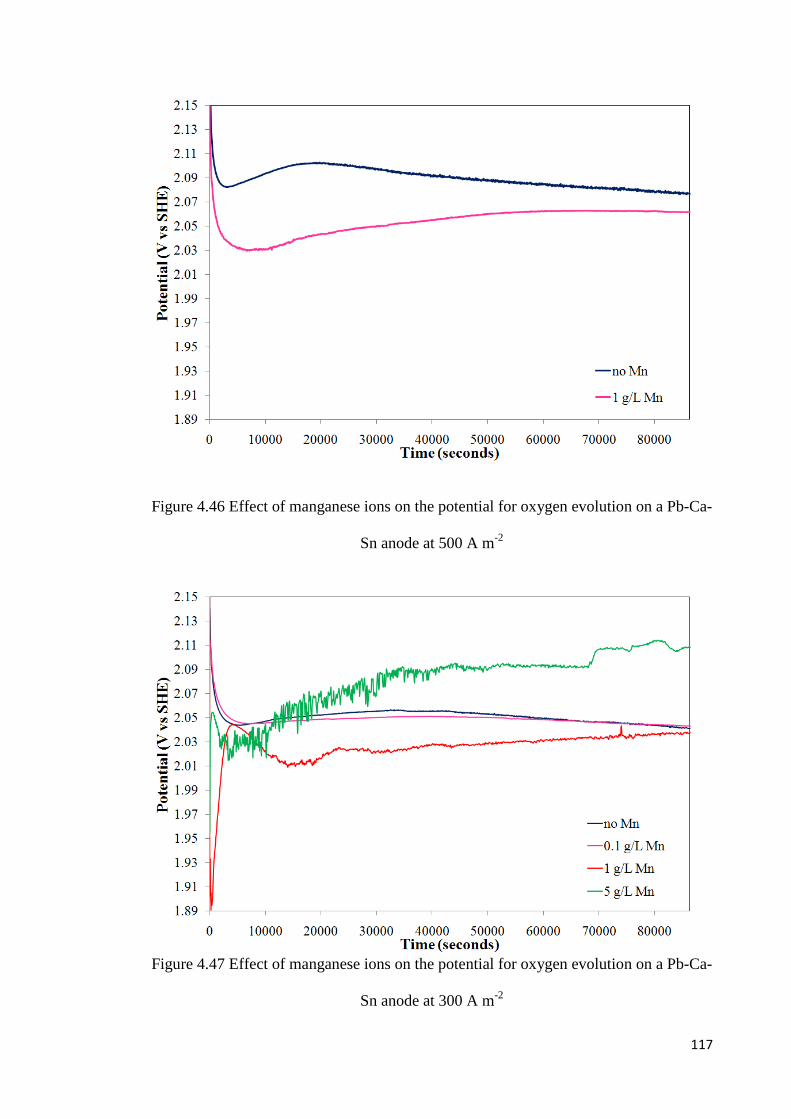
117
Figure 4.46 Effect of manganese ions on the potential for oxygen evolution on a Pb-Ca-
Sn anode at 500 A m-2
Figure 4.47 Effect of manganese ions on the potential for oxygen evolution on a Pb-Ca-
Sn anode at 300 A m-2
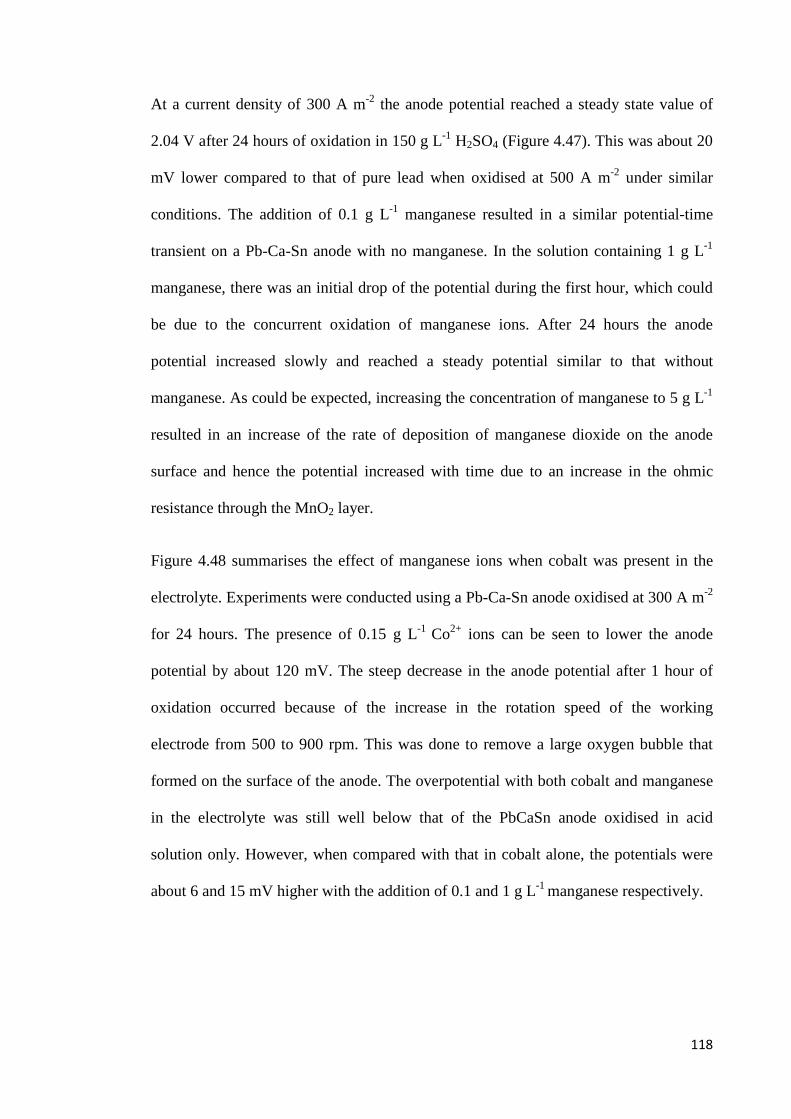
118
At a current density of 300 A m-2 the anode potential reached a steady state value of
2.04 V after 24 hours of oxidation in 150 g L-1 H2SO4 (Figure 4.47). This was about 20
mV lower compared to that of pure lead when oxidised at 500 A m-2 under similar
conditions. The addition of 0.1 g L-1 manganese resulted in a similar potential-time
transient on a Pb-Ca-Sn anode with no manganese. In the solution containing 1 g L-1
manganese, there was an initial drop of the potential during the first hour, which could
be due to the concurrent oxidation of manganese ions. After 24 hours the anode
potential increased slowly and reached a steady potential similar to that without
manganese. As could be expected, increasing the concentration of manganese to 5 g L-1
resulted in an increase of the rate of deposition of manganese dioxide on the anode
surface and hence the potential increased with time due to an increase in the ohmic
resistance through the MnO2 layer.
Figure 4.48 summarises the effect of manganese ions when cobalt was present in the
electrolyte. Experiments were conducted using a Pb-Ca-Sn anode oxidised at 300 A m-2
for 24 hours. The presence of 0.15 g L-1 Co2+ ions can be seen to lower the anode
potential by about 120 mV. The steep decrease in the anode potential after 1 hour of
oxidation occurred because of the increase in the rotation speed of the working
electrode from 500 to 900 rpm. This was done to remove a large oxygen bubble that
formed on the surface of the anode. The overpotential with both cobalt and manganese
in the electrolyte was still well below that of the PbCaSn anode oxidised in acid
solution only. However, when compared with that in cobalt alone, the potentials were
about 6 and 15 mV higher with the addition of 0.1 and 1 g L-1 manganese respectively.
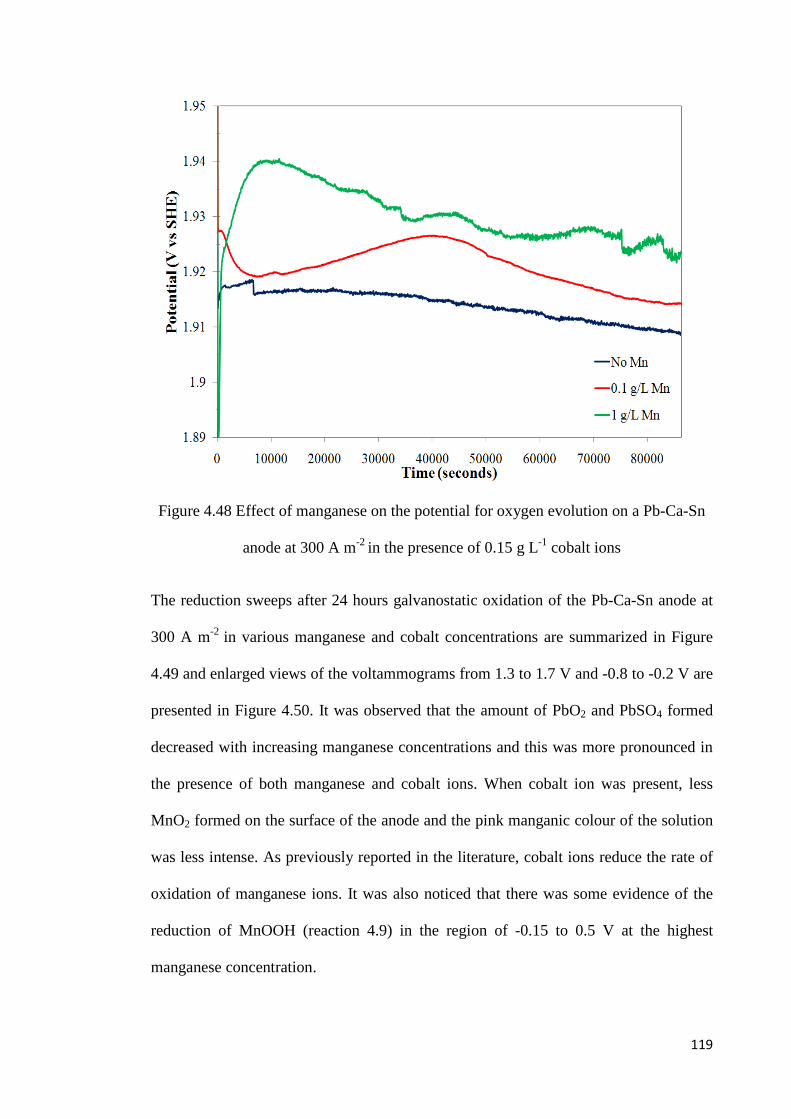
119
Figure 4.48 Effect of manganese on the potential for oxygen evolution on a Pb-Ca-Sn
anode at 300 A m-2 in the presence of 0.15 g L-1 cobalt ions
The reduction sweeps after 24 hours galvanostatic oxidation of the Pb-Ca-Sn anode at
300 A m-2 in various manganese and cobalt concentrations are summarized in Figure
4.49 and enlarged views of the voltammograms from 1.3 to 1.7 V and -0.8 to -0.2 V are
presented in Figure 4.50. It was observed that the amount of PbO2 and PbSO4 formed
decreased with increasing manganese concentrations and this was more pronounced in
the presence of both manganese and cobalt ions. When cobalt ion was present, less
MnO2 formed on the surface of the anode and the pink manganic colour of the solution
was less intense. As previously reported in the literature, cobalt ions reduce the rate of
oxidation of manganese ions. It was also noticed that there was some evidence of the
reduction of MnOOH (reaction 4.9) in the region of -0.15 to 0.5 V at the highest
manganese concentration.
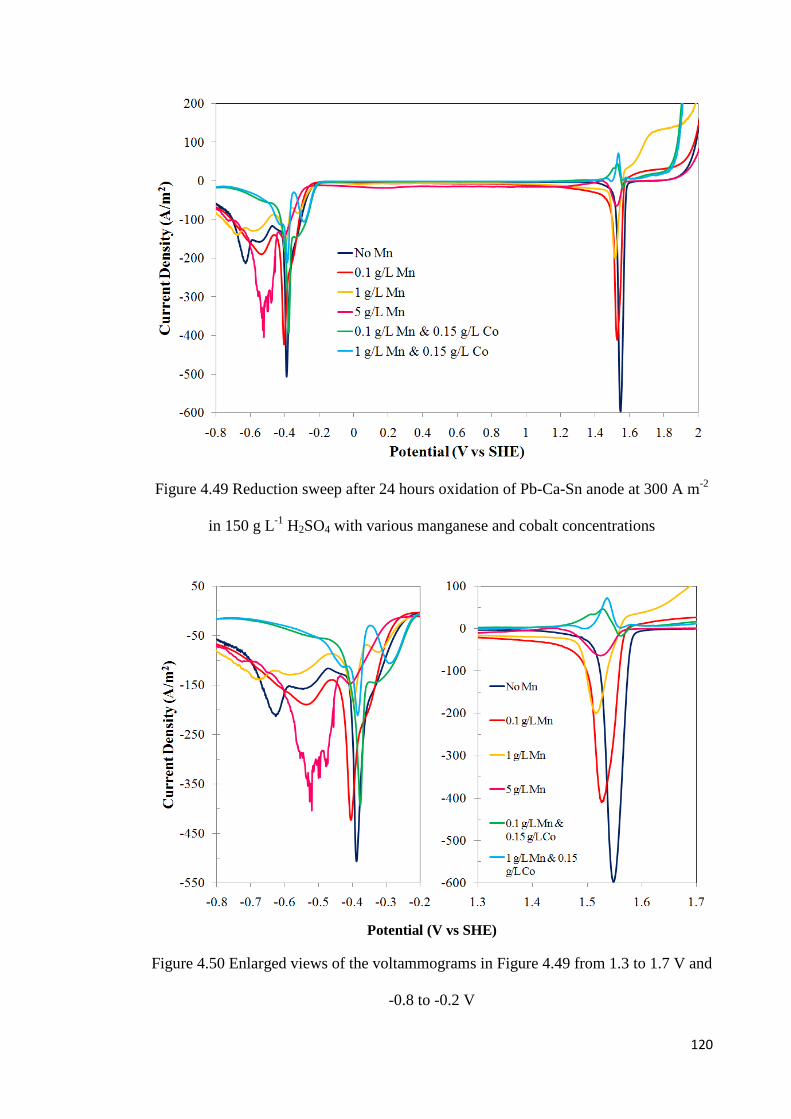
120
Figure 4.49 Reduction sweep after 24 hours oxidation of Pb-Ca-Sn anode at 300 A m-2
in 150 g L-1 H2SO4 with various manganese and cobalt concentrations
Potential (V vs SHE)
Figure 4.50 Enlarged views of the voltammograms in Figure 4.49 from 1.3 to 1.7 V and
-0.8 to -0.2 V

121
4.6 Effect of Manganese Ions on the Corrosion Rate of Lead-Silver and Lead-
Calcium-Tin Anodes
In this section, the experimental results of corrosion tests carried out over three months
as part of the AMIRA Project P705A at Murdoch University (McGinnity 2007) were
included as part of this thesis to provide more representative long-term corrosion rates
of both Pb-Ag and Pb-Ca-Sn anodes in the absence and presence of manganese ions.
The various combinations of alloy composition, electrolyte composition and current
density are detailed in Table 4.9. The corrosion rates of the anodes were determined
from anode weight loss measurements after operation for 86 days as shown in Table
4.10.
Table 4.9 Experimental conditions the long term corrosion tests
Anodes Surface
Pretreatment
Electrolyte Current
Density
/ A m-2
Temp
/ °C
Rolled Pb-0.5%Ag-
0.0023%Ca
Sand blasted 170 g L-1 H2SO4 500 40
Rolled Pb-0.5%Ag-
0.0023%Ca
Sand blasted 170 g L-1 H2SO4
+ 5 g L-1 Mn
500 40
Rolled Pb-0.08%Ca-
1.3%Sn-0.01%Al
600 SiC grit polished 170 g L-1 H2SO4
+ 50 mg L-1 Co
300 40
Rolled Pb-0.08%Ca-
1.3%Sn-0.01%Al
600 SiC grit polished 170 g L-1 H2SO4
+ 50 mg L-1 Co
+ 50 mg L-1 Mn
300 40

122
Table 4.10 Anode corrosion rates after 86 days operation
Anodes [Mn]
/g L-1
[Co]
/g L-1
Potential
/V vs
SHE
Corrosion
rate
/ g kA-1 h-1
Mud
generation rate
/ g kA-1 h-1
Mass of Pb
formed on
cathodes / g
Pb-Ag 0 0 2.002 4.25 1.8 19
Pb-Ag 5 0 1.989 1.13 14.3 0.5
Pb-Ca-Sn 0 0.05 1.882 1.19 0.48 0.1
Pb-Ca-Sn 0.05 0.05 1.880 1.01 3.6 0.18
From the data it is evident that the anode potential for the Pb-Ag anode is lower by
about 13 mV in the presence of 5 g L-1 manganese ions over three months operation.
For the Pb-Ca-Sn anode with the addition of cobalt ions, the potentials are as expected
lower than that of the Pb-Ag anode by about 120 mV and are not affected by the
addition of 0.05 g L-1 manganese ions. The average corrosion rates for both types of
anodes over 86 days operation were lower in the presence of manganese ions i.e. from
4.25 to 1.13 g kA-1 h-1 for the Pb-Ag anode and from 1.19 to 1.01 g kA-1 h-1 for the Pb-
Ca-Sn anode. The rates of mud generation in the presence of manganese increased by
up to a factor of 7.9 and 7.5 for Pb-Ag and Pb-Ca-Sn anodes respectively, with much
larger amounts of anode mud and cell mud produced with a Pb-Ag anode in 170 g L-1
H2SO4 containing 5 g L-1 Mn. In contrast, the mass of lead product deposited upon the
cathodes (made of lead) decreased from 19 g to 0.5 g in the presence of 5 g L-1 Mn for
the Pb-Ag anode and even lower to 0.18 g in the presence of 0.05 g L-1 Co and 0.05 g
L-1 Mn for the Pb-Ca-Sn anode. These results illustrate the effect that both manganese
and cobalt ions have on reducing the corrosion of the anodes and thereby the
incorporation of lead on the cathodes.
123
These observations indicate that, consistent with the results shown in this study, the
presence of manganese in the electrolyte decreases the rate of oxidation of lead and
thereby the average corrosion rates of both Pb-Ag and Pb-Ca-Sn anodes. Increasing the
concentrations of manganese decreases the extent of oxidation of lead as shown in
Section 4.5.2 and 4.5.3 but also increases the amount of manganese oxidized (shown in
Figures 4.25 and 4.40). The much larger amounts of mud produced with the higher
manganese concentrations are primarily due to the spalling of the anode scale
(predominantly manganese oxides) and the formation of fine MnO2 precipitates in the
electrolyte.
The formation of MnO2 layer on the surface of the Pb-Ag anode seems to originate
from the oxidation of Mn(II) to MnO4- ions (reaction 4.3), followed by the reduction of
permanganate ions by Mn(II) ions to form intermediate Mn(III) species (reaction 4.5),
which subsequently disproportionate to MnO2 by reaction 4.6. High concentrations of
manganese ions favor reactions 4.5 and 4.6, thus gradually increasing the
concentrations of manganic ion in the electrolyte and the amount of MnO2 precipitated
both on the anode surface and in the electrolyte.
For the Pb-Ca-Sn anodes which have lower oxygen overpotentials, it is possible that a
change in reaction mechanism of Mn3+ generation via a permanganate intermediate to
direct Mn3+ formation on the anode has occurred, which can form a MnOOH
intermediate layer (reaction 4.7) as shown in Section 4.4. The presence of cobalt ions in
the electrolyte leads to a lower potential which results in decreased precipitation of
MnO2 both on the anode surface and in the electrolyte.

124
4.7 Electrochemical Oxidation of Iron(II) Ions on Lead Alloy Anodes
A preliminary study was made of the characteristics of the anodic oxidation of iron(II)
ions on both Pb-Ag and Pb-Ca-Sn anodes for several reasons. Firstly, it was considered
useful to study the electrochemical oxidation of iron(II) ions in comparison with that of
manganese(II) ions and secondly, iron is always present in the electrolyte during the
electrowinning of copper and iron(II) is oxidized at the anodes. Finally, it is of interest
to establish the extent to which anodic reactions are possible on these anode materials
in the potential region between formation of lead sulfate and its oxidation to lead
dioxide.
Cyclic voltammograms of the Pb-0.42%Ag and Pb-Ca-Sn anodes at 1 mV s-1 scan rate
in a solution containing 150 g L-1 H2SO4 and 10 g L-1 Fe(II) were obtained. The
measurements were performed at 40°C with a rotation speed of the disc electrodes of
500 rpm. The scan was started from the open circuit potential at about -0.35 V to
positive potentials of about 2.1 V, and reversed. The scan was stopped at -0.8 V for the
Pb-Ca-Sn anode and at 0.58 V for the Pb-Ag anode. The voltammograms are shown in
Figure 4.51.
As the potential was swept in a positive direction, the oxidation of Pb to PbSO4 occurs
at about -0.31 V and the surface of the lead anodes is coated with a passive lead
sulphate layer. Oxidation of iron(II) could be expected at potentials above about 0.8 V
given that the standard reduction potential for the reaction
Fe2+ = Fe3+ + e- (4.10)
is 0.77 V. However, no significant anodic currents are obtained until the potential
increases to about 1.5 V in the case of the Pb-Ca-Sn anode due to the formation of both
α- and β-PbO2 followed by the simultaneous evolution of oxygen gas at potentials
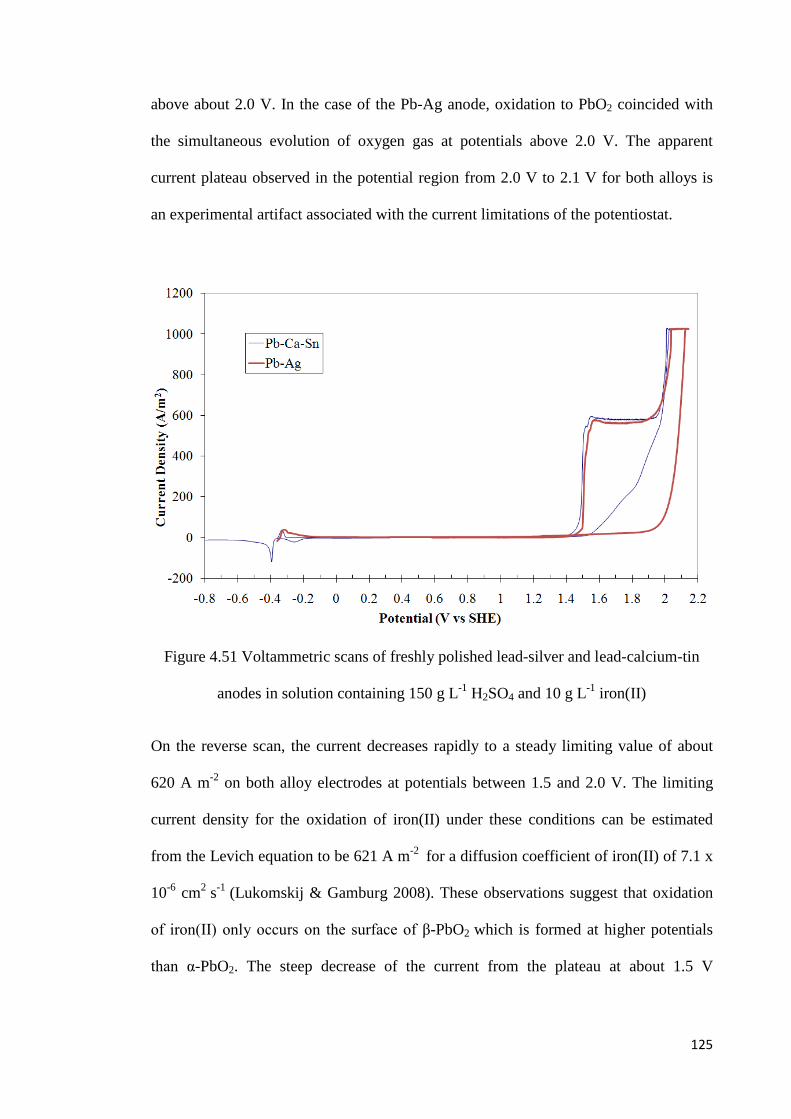
125
above about 2.0 V. In the case of the Pb-Ag anode, oxidation to PbO2 coincided with
the simultaneous evolution of oxygen gas at potentials above 2.0 V. The apparent
current plateau observed in the potential region from 2.0 V to 2.1 V for both alloys is
an experimental artifact associated with the current limitations of the potentiostat.
Figure 4.51 Voltammetric scans of freshly polished lead-silver and lead-calcium-tin
anodes in solution containing 150 g L-1 H2SO4 and 10 g L-1 iron(II)
On the reverse scan, the current decreases rapidly to a steady limiting value of about
620 A m-2 on both alloy electrodes at potentials between 1.5 and 2.0 V. The limiting
current density for the oxidation of iron(II) under these conditions can be estimated
from the Levich equation to be 621 A m-2 for a diffusion coefficient of iron(II) of 7.1 x
10-6 cm2 s-1 (Lukomskij & Gamburg 2008). These observations suggest that oxidation
of iron(II) only occurs on the surface of β-PbO2 which is formed at higher potentials
than α-PbO2. The steep decrease of the current from the plateau at about 1.5 V

126
coincides with the potential at which PbO2 is reduced to PbSO4. The absence of a
cathodic peak could be due to the reduction of PbO2 by iron(II) by a reaction such as
PbO2 + 2Fe2+ + HSO4- + 3H+ = PbSO4 + 2Fe3+ + 2H2O (4.11)
the rate of which must be mass transport controlled on both anodes. This explains why
there are no observed peaks for the reduction of PbO2 but only the cathodic peaks for
the reduction of (PbO.PbSO4) to Pb, and PbSO4 to Pb at about -0.28 and -0.39 V
respectively.
These results suggest that a more detailed study of reactions such as these allow one to
probe the nature of the sulfate/oxide layer on the alloy surfaces. There are some
interesting similarities with respect to the results obtained in solutions containing
manganese ions (Sections 4.2.1 and 4.4). The oxidation of manganese(II) ions on the
Pb-Ag and Pb-Ca-Sn anodes also appears to depend on the formation of PbO2 at
potentials of above 1.7 V. The favourable influence of manganese ions on reducing the
rate of formation of lead dioxide might be as well explained by reaction 4.4 in which
the lead dioxide formed may be reduced to lead sulphate by oxidation of Mn2+ ions to
Mn3+ ions, which disproportionate to MnO2.
127
Chapter 5
CONCLUSIONS
The role of manganese ions in the corrosion and electrocatalytic behaviour for the
oxygen evolution reaction of commercial Pb-Ag and Pb-Ca-Sn anodes under conditions
typical of the electrowinning of zinc and copper has been studied using rotating disc
electrodes involving potentiostatic and galvanostatic oxidation followed by negative
potential sweeps and chemical analyses of the oxidized manganese species formed
during the oxidation process.
Potentiostatic oxidation experiments in the range of 1.5 to 2.0 V followed by negative
potential sweeps of surfaces of the Pb-Ag and Pb-Ca-Sn anodes in acidic manganese
solution have revealed that the oxidation of manganese proceeds after the formation of
PbO2 at potentials above about 1.7 V and is also accompanied by evolution of oxygen
at potentials above about 2.0 V. The amount of manganese oxidized increases with
increasing potential, manganese ion concentration and time.
At 1.8 V, the rate of oxidation of manganese ions is not mass transport controlled. The
main products of oxidation at this potential are soluble manganese ions (Mn3+ and/or
MnO4-). At 1.95 and 2.0 V, at which potentials O2 evolution visibly occurred at a
significantly increased rate, the oxidation of manganese ions was occurring close to the
mass transport controlled rate. The presence of manganese in the electrolyte decreased
the rate of formation of lead dioxide and also reduced the charge fraction for oxygen
evolution. The high current densities observed during oxidation in the presence of

128
manganese might account for the significant rate of production of manganese oxide
scale and sludge in operating cells, particularly during the electrowinning of zinc.
Increased silver content of the Pb-Ag alloys resulted in a decrease of the anode
overpotential for the oxygen evolution reaction and a decrease in the extent of
oxidation of lead. An increase in the silver concentration in the alloy, up to a saturation
limit of about 0.75%, also increased the extent of the oxidation of manganese and the
formation of MnO2 both on the anode and in the electrolyte and reduced the rate of
oxygen evolution.
The charge attributable to the evolution of oxygen during oxidation of Pb-Ca-Sn anodes
at all potentials for 24 hours was slightly lower than those of Pb-Ag anodes and this
coupled with the considerably higher current densities observed on the Pb-Ag anodes
confirms that silver exhibits a catalytic effect on the oxygen evolution reaction. When
Pb-Ca-Sn anodes were oxidized at 2.0 V for 24 hours in the presence of 1 g L-1
manganese ions, 70% of the charge is utilized for oxidation of manganese ions. This
value was reduced to about 10% when the Pb-Ag anodes were oxidized under the same
conditions. In the presence of cobalt ions, the rate of oxidation of manganese ions
decreased. Both cobalt and manganese have an effect on reducing the corrosion of the
anodes and thereby the incorporation of lead on the cathodes.
The results observed in this study show that initial permanganate formation occurred
with both Pb-Ag and Pb-Ca-Sn anodes but permanganate ions are not stable in the bulk
electrolyte. Permanganate decomposition can result in the formation of either MnO2 or
Mn3+ ions depending on the concentration of manganese(II) ion, the oxidation potential
and hydrodynamic conditions at the anode surface. The kinetics of the reduction of
permanganate by manganese(II) ions is second-order with respect to manganese(II) and

129
therefore is a very sensitive function of the manganese(II) ion concentration. Thus, one
will only observe permanganate in the electrolyte at low concentrations of manganese
ions under which conditions it is metastable.
For the Pb-Ca-Sn anodes which have lower overpotentials for oxygen evolution, it is
possible that a change in reaction mechanism occurs from manganese(III) formation via
a permanganate intermediate to direct oxidation of manganese(II) ions on the anode.
Subsequent slower precipitation of MnOOH and/or MnO2 by disproportionation results
in the formation of solids in the bulk electrolyte and on the walls of the cell. It is also
possible that oxidation of manganese ions by anodically produced PbO2 also occurs but
confirmation will require additional experiments.
Preliminary results of the oxidation of iron(II) on the lead alloy anodes has shown some
promising results as a probe of the nature of the sulfate/oxide layer on the surface of the
alloys and further work should be conducted along these lines.

130
REFERENCES
Addison, J.R., Savage, B.J., Robertson, J.M., Kramer, E.P. and Stauffer, J.C. 1999. Implementing technology: Conversion of Phelps Dodge Morenci, Inc. Central EW tankhouse from copper starter sheets to stainless steel technology. In Proceedings of the Copper 99-Cobre 99 International Conference 3: 609-618.
Antonov, S.P. and Stepanenko, V.G. 1972. Anodic behavior of lead in the presence of cobalt ions. Ukrainskii Khimicheskii Zhurnal 38 (9): 935-937.
Astakhov, I.I., Vaisberg, E.S. and Kabanov, B.N. 1964. Anodic corrosion of Pb in H2SO4. Doklady Akademii Nauk SSSR 154 (6): 1414-1416.
Bockris, J. O’M. 1956. Kinetics of activation controlled consecutive electrochemical reactions: anodic evolution of oxygen. Journal of Chemical Physics 24 (4): 817-827.
Bond, A.M. 1999. 200 years of practical electroanalytical chemistry: past, present and future directions illustrated by reference to the on-line, on-stream and off-line determination of trace metals in zinc plant electrolyte by voltammetric and potentiometric techniques. Analytica Chimica Acta 400: 333-379.
Cachet, C., Rerolle, C. and Wiart, R. 1996. Kinetics of Pb and Pb-Ag anodes for zinc electrowinning – II. Oxygen evolution at high polarization. Electrochimica Acta 41 (1): 83-90.
Cachet, C., Rerolle, C. and Wiart, R. 1999. Influence of Co2+ and Mn2+ ions on the kinetics of lead anodes for zinc electrowinning. Journal of Applied Electrochemistry 29 (7): 813-820.
Chen, W., Guo, B. and Klaus, H. 1997. Study on kinetics of oxygen evolution on lead alloy anodes. Journal of Central South University of Technology 4(1): 69-72.
Cheng, C.Y., Hughes, C.A., Barnard, K.R. and Larcombe, K. 2000. Manganese in copper solvent extraction and electrowinning. Hydrometallurgy 58: 135-150.
Cifuentes, G., Cifuentes, L. and Crisostomo, G. 1998. A lead-acid battery analogue to in situ anode degradation in copper electrometallurgy. Corrosion Science 40 (2/3): 225-234.
Clarke, C.J., Browning, G.J. and Donne, S.W. 2006. An RDE and RRDE study into the electrodeposition of manganese dioxide. Electrochimica Acta 51: 5773-5784.

131
Codaro, E.N. and Vilche, J.R. 1997. A kinetic study of the electroformation of PbO2 on Pb electrodes in sulphuric acid solutions. Electrochimica Acta 42 (4): 549-555.
Cole Jr., E.R. and O’Keefe, T.J. 1981. Insoluble anodes for electrowinning zinc and other metals. Report of Investigations- Bureau of Mines 8531.
Comninellis, Ch. And Petitpierre, J.Ph. 1991. Electrochemical oxidation of Mn(II) to MnO4
- in the presence of Ag(I) catalyst. Electrochimica Acta 36 (8): 1363-1365.
Danilov, F.I., Velichenko, A.B. and Nishcheryakova, L.N. 1992. Effect of ions of the iron group on the corrosion-electrochemical behavior of lead anodes. Elektrokhimiya 28 (1): 27-31.
Dawson, J.L. 1979. Corrosion of lead and alloys in sulphuric acid: Introduction and basic principles. In The Electrochemistry of Lead, ed. A.T. Kuhn, 309-353. New York: Academic Press.
Duarte, M.M.E., Pilla, A.S. and Mayer, C.E. 2003. Electrooxidation of Mn(II) to MnO2 on graphite fibre electrodes. Journal of Applied Electrochemistry 33: 387-392.
Davenport, W.G., King, M., Schlesinger, M. and Biswas, A.K. 2002. Extractive Metallurgy of Copper. 4th ed. Kidlington, Oxford, UK: Pergamon.
Ettel, V.A. 1972. Electrowinning nonferrous metals such as copper, nickel or cobalt. International Nickel Co. of Canada, Ltd. European Patent # 2144291.
Fukushima, S. 1962. Studies on electrolytic refining of zinc. X Removal of lead from the zinc electrolyte solution. The 136th Report of the Research Institute of Mineral Dressing and Metallurgy 14 (3): 165-174.
Gendron, A. S., Ettel, V. A., Abe, S. 1975. Effect of cobalt added to electrolyte on corrosion rate of lead-antimony anodes in copper electrowinning. Canadian Metallurgical Quarterly 14 (1): 59-61.
Gonzalez, J. A. 2001. Zinc electrowinning: Anode conditioning and current distribution studies. Electrometallurgy In Proceedings of Annual Hydrometallurgy Meeting, 31st, Toronto, ON, Canada, August, 26-29, 2001. 147-162.
Guo, Y. 1992. A new potential-pH diagram for an anodic film on Pb in H2SO4. Journal of the Electrochemical Society 139 (8): 2114-2120.
Hood, A.G. III, Adamson, D.L., Andersen, T.N., Richards, K.J. 1975. Calcium-containing lead alloy anodes for electrowinning. Kennecott Copper Corp., USA. US Patent # 3859185.
132
Hrussanova, A., Mirkova, L., Dobrev, Ts. 2002. Electrochemical properties of Pb-Sb,
Pb-Ca-Sn and Pb-Co3O4 anodes in copper electrowinning. Journal of Applied
Electrochemistry 32 (5): 505-512.
Hrussanova, A., Mirkova, L., Dobrev, Ts. And Vasilev, S. 2004. Influence of temperature and current density on oxygen overpotential and corrosion rate of Pb-Co3O4, Pb-Ca-Sn, and Pb-Sb anodes for copper electrowinning: Part I. Hydrometallurgy 72: 205-213.
Ipinza, J., Ibanez, J.P., Vergara, F. and Pagliero, A. 2003. Study of anodic slime from Chilean copper electrowinning plants. Hydrometallurgy 2: 1267-1277.
Ipinza, J., Ibanez, J.P., Pagliero, A. and Vergara, Y.F. 2007. Formation mechanism of manganese compounds in acidic electrolytes of copper. Revista de Metalurgia 43 (1): 11-19.
Ivanov, I., Stevanov, Y., Noncheva, Z., Petrova, M., Dobrev, Ts., Mirkova, L., Vermeersch, R. and Demaerel, J.-P. 2000. Insoluble anodes used in hydrometallurgy Part II. Anodic behaviour of lead and lead-alloy anodes. Hydrometallurgy 57: 125-139.
Jin, S., Ghali, E., Houlachi, G. and St-Amant, G. 2003. Effect of sandblasting and shot-peening on the corrosion behavior of Pg-Ag alloy anodes in acid zinc sulfate electrolyte at 38°C. Environmental Degradation of Materials and Corrosion Control in Metals, Proceedings of the International Symposium on Environmental Degradation of Materials and Corrosion Control in Metals, August 24-27: 459-470.
Kabanov, B.N., Weisberg, E.S., Romanova, I.L. and Krivolapova, E.V. 1964. Anodic diffusion of oxygen through lead dioxide. Electrochimica Acta 9 (9): 1197-1202.
Kalra, H.L. and Gosh, S. 1966. Kinetics of the reaction between oxalate and iodine in the presence of manganese (III). Zeitschrift fuer Physikalische Chemie (Leipzig) 231 (1-2): 21-25.
Kao, W.-H. and Weibel, V.J. 1992. Electrochemical oxidation of manganese(II) at a platinum electrode. Journal of Applied Electrochemistry 22: 21-27.
Kelsall, G.H., Guerra, E., Li, G. and Bestetti, M. 2000. Effects of manganese(II) and chloride ions in zinc electrowinning reactors. In Proceedings of Electrochemical Society 2000 (14): 350-361.
Koch, D.F.A. 1959. The effect of cobalt on the kinetics of oxygen evolution at a lead dioxide anode in sulfuric acid. Australian Journal of Chemistry 12: 127-137.
133
Krivolapova, E.V. and Kabanov, B.N. 1953. An investigation of the corrosion of lead in oxidizing media. II. The influence of the addition of cobalt salt, temperature, and other factors on the term of service of the positive electrode of the lead storage battery. Trudy Soveshchaniya Electrokimii Akademii Nauk SSSR, Otdelemie Khimicheskikh Nauk: 539-548.
Lander, J.J. 1956. Further studies on the anodic corrosion of lead in H2SO4 solutions. Journal of the Electrochemical Society 103 (1): 1-8.
Lukomskij, Yu.Ya. and Gamburg, Yu. D. 2008. Physical-Chemical Foundations of Electrochemistry. Dolgoprudnij: Intellect.
Mahato, B.K. 1979. The cyclic corrosion of the lead-acid battery positive. Journal of the Electrochemical Society: Electrochemical Science and Technology 126 (3): 365-374.
McGinnity, J. 2007. The effect of periodic low current density on the performance of lead alloy anodes. AMIRA Project P705A Module 1. Advancing Electrode Processes and Cathode Quality, Perth.
McGinnity, J. 2008. An investigation into the site of oxygen evolution on PbAg anodes. AMIRA Project P705A Module 1. Advancing Electrode Processes and Cathode Quality. Perth
Miller, G.M., Readett, D.J. and Hutchinson, P. 1997. Experience in operating the Girilambone copper SX-EW plant in changing chemical environments. Minerals Engineering 10 (5): 467-481.
Monahov, B., Pavlov, D. and Petrov, D. 2000. Influence of Ag as alloy additive on the oxygen evolution reaction on Pb/PbO2 electrode. Journal of Power Sources 85: 59-62.
Morrow, J.I. and Perlman, S. 1973. A kinetic study of the permanganate-manganous ion reaction to form manganic ion in sulfuric acid media. Inorganic Chemistry 12 (10): 2453-2455.
Newnham, R.H. 1992. Corrosion rates of lead based anodes for zinc electrowinning at high current densities. Journal of Applied Electrochemistry 22: 116-124.
Nguyen, T. and Atrens, A. 2009. Composition and morphology of the film formed on a lead alloy under conditions typical of the electro-winning of copper. Hydrometallurgy 96: 14-26.
Nijjer, S., Thonstad, J. and Haarberg, G.M. 2000. Oxidation of manganese(II) and reduction of manganese dioxide in sulphuric acid. Electrochimica Acta 46: 395-399.

134
Pajunen, L., Aromaa, J. and Forsen, O. 2003. The effect of dissolved manganese on anode activity in electrowinning. Hydrometallurgy 2: 1255-1265.
Pavlov, D. 1978. Processes in solid state at anodic oxidation of a lead electrode in H2SO4 solution and their dependence on the oxide structure and properties. Electrochimica Acta 23 (9): 845-854.
Pavlov, D. and Dinev, Z. 1980. Mechanism of the electrochemical oxidation of lead to lead dioxide electrode in H2SO4 solution. Journal of the Electrochemical Society: Electrochemical Science and Technology 127 (4): 855-863.
Pavlov, D. and Monahov, B. 1996. Mechanism of the elementary electrochemical processed taking place during oxygen evolution on the lead dioxide electrode. Journal of the Electrochemical Society 143 (11): 3616-3629.
Pavlov, D. and Rogachev, T. 1986. Mechanism of the action of Ag and As on the anodic corrosion of lead and oxygen evolution at the Pb/PbO(2-x)/H2O/O2/H2SO4 electrode system. Electrochimica Acta 31 (2): 241-249.
Petrova, M., Stefanov, Y., Noncheva, Z., Dobrev, Ts. And Rashkov, St. 1999. Electrochemical behaviour of lead alloys as anodes in zinc electrowinning. British Corrosion Journal 34 (3): 198-200.
Pourbaix, M. 1974. Atlas of Electrochemical Equilibria in Aqueous Solutions. 2nd ed. Houston, Texas, USA: NACE International Cebelcor, Brussels.
Prengaman, R.D. 1984. The metallurgy of lead alloys for electrowinning anodes. Anodes Electrowinning Proceeding Sessions AIME Annual Meeting, Los Angeles, CA, February 1984: 59-67.
Prengaman, R.D. 1997. The metallurgy and performance of cast and rolled lead alloys for battery grids. Journal of Power Sources 67: 267-278.
Prengaman, R.D. and Morgan, C.E. 2001. Electrowinning anodes which rapidly produce a protective oxide coating. USA. US Patent # 6224723B1.
Prengaman, R.D. and Siegmund, A. 1999. Improved copper electrowinning operations using wrought Pb-Ca-Sn anodes. In Proceedings of the Copper 99-Cobre 99 International Conference 3: 561-573.
Prengaman, R.D. and Siegmund, A. 2007. A Pb-Sn-Ca alloy and anode for use in the electrowinning of metals. USA. US Patent # 20070193879.
Ramachandran, P., Naganathan, K., Balakrishnan, K. and Srinivasan, R. 1980. Effect of pre-treatment on the anodic behaviour of lead alloys for use in electrowinning operations. I. Journal of Applied Electrochemistry 10 (5): 623-626.

135
Ramachandran, P.R., Nandakumar, V. And Venkateswaran, K.V. 1996. Electrolyte additives for improved behaviour of anodes in electrowinning of metals. Transactions of the Indian Institute of Metals 49 (6): 789-794.
Rashkov, St., Dobrev, Ts., Noncheva, Z., Stefanov, Y., Rashkova, B. and Petrova, M. 1999. Lead-cobalt anodes for electrowinning of zinc from sulphate electrolytes. Hydrometallurgy 52: 223-230.
Ravindran, K., Heerman, L. And Van Simaeys, L. 1975. The anodic behaviour of lead in acid sulphate solutions. Influence of manganese ions and electrochemical oxidation of manganese ions at lead anodes. Bulletin Des Societes Chimiques Belges 84 (1-2): 83-90.
Rodrigues, S., Munichandraiah, N. and Shukla, A.K. 1998. A cyclic voltammetric study of the kinetics and mechanism of electrodeposition of manganese dioxide. Journal of Applied Electrochemistry 28: 1235-1241.
Rodrigues, J., Garbers, D. and Meyer, E.H.O. 2001. Recent developments in the Zincor cell house. Canadian Metallurgy Quarterly 40 (4): 441-449.
Rogulski, Z., Siwek, H. Paleska, I. and Czerwinski, A. 2003. Electrochemical behavior of manganese dioxide on a gold electrode. Journal of Electroanalytical Chemistry 543: 175-185.
Selim, R.G. and Lingane, J.J. 1959. Coulometric titration with higher oxidation states of manganese. Electrolytic generation and stability of +3 manganese in sulfuric acid media. Analytical Chimica Acta 21: 536-544.
Sharpe, T.F. 1975. Low-rate cathodic linear sweep voltammetry (LSV) studies on anodized lead. Journal of the Electrochemical Society 122 (7): 845-851.
Stelter, M., Bombach, H. and Saltykov, P. 2006. Corrosion behavior of lead-alloy anodes in metal winning. Sohn International Symposium Advanced Processing of Metals and Materials 6: 451-461.
Tuffrey, N. 2004. Preliminary studies of the effects of pre-treatment methods on the electrochemical behaviour of rolled PbAg anodes. AMIRA Project P705 Module 1. Anode Processes. Perth.
Velayutham, D., Noel, M. and Chidambaram, S. 1993. Influence of acid strength and other addition agents on the electrochemical production of manganic sulphate from manganous sulphate. Bulletin of Electrochemistry 9 (2&3): 99-102.
Yamamoto, Y., Fumino, K., Ueda, T. and Nambu, M. 1992. A potentiodynamic study of the lead electrode in sulphuric acid solution. Electrochimica Acta 37 (2): 199-203.
136
Yu, P. and O’Keefe, T.J. 2002. Evaluation of lead anode reactions in acid sulfate electrolytes II. Manganese reactions. Journal of the Electrochemical Society 149 (5): 558-569.
Zhang, H. and Park, S.M. 1994. Electrochemical oxidation of manganese(II) in HClO4 solutions. Journal of the Electrochemical Society 141 (9): 2422-2429.
Zhong, S., Wang, J., Liu, H.K. and Dou, S.X. 1999. Influence of silver on electrochemical and corrosion behaviours of Pb-Ca-Sn-Al grid alloys Part I: Potentiodynamic and potentiostatic studies. Journal of Applied Electrochemistry 29: 1-6.