Embed Size (px)
Citation preview
The Role of Image Understanding in Contour Detection
C. Lawrence ZitnickMicrosoft Research, Redmond
Devi ParikhToyota Technological Institute, Chicago (TTIC)
Abstract
Many cues have been proposed for contour detection orimage segmentation. These include low-level image gradi-ents to high-level information such as the identity of the ob-jects in the scene or 3D depth understanding. While state-of-the-art approaches have been incorporating more cues,the relative importance of the cues is unclear. In this pa-per, we examine the relative importance of low-, mid- andhigh-level cues to gain a better understanding of their rolein detecting object contours in an image. To accomplishthis task, we conduct numerous human studies and com-pare their performance to several popular segmentationand contour detection machine approaches. Our findingssuggest that the current state-of-the-art contour detectionalgorithms perform as well as humans using low-level cues.We also find evidence that the recognition of objects, butnot occlusion information, leads to improved human perfor-mance. Moreover, when objects are recognized by humans,their contour detection performance increases over currentmachine algorithms. Finally, mid-level cues appear to of-fer a larger performance boost than high-level cues such asrecognition.
1. Introduction
Segmentation and the related task of contour detectionare being leveraged for an increasingly wide variety of com-puter vision tasks. For instance, segmentation has been usedfor object recognition [2, 25, 10, 29, 33], optical flow esti-mation [35], stereo [31], and image compositing [27]. Inthis paper, we focus on the task of object level contour de-tection and segmentation.
A fundamental question is the degree to which high-levelinformation is necessary when performing object segmenta-tion [33, 10, 16]. For instance, is object segmentation pos-sible even if the objects in the scene cannot be recognized?How important is the 3D understanding [12, 15] of a scenein segmenting its objects? It is commonly assumed that ob-ject boundaries correspond to changes in color or texture[3, 17, 6] (Figure 1(a)). However, boundaries referred to
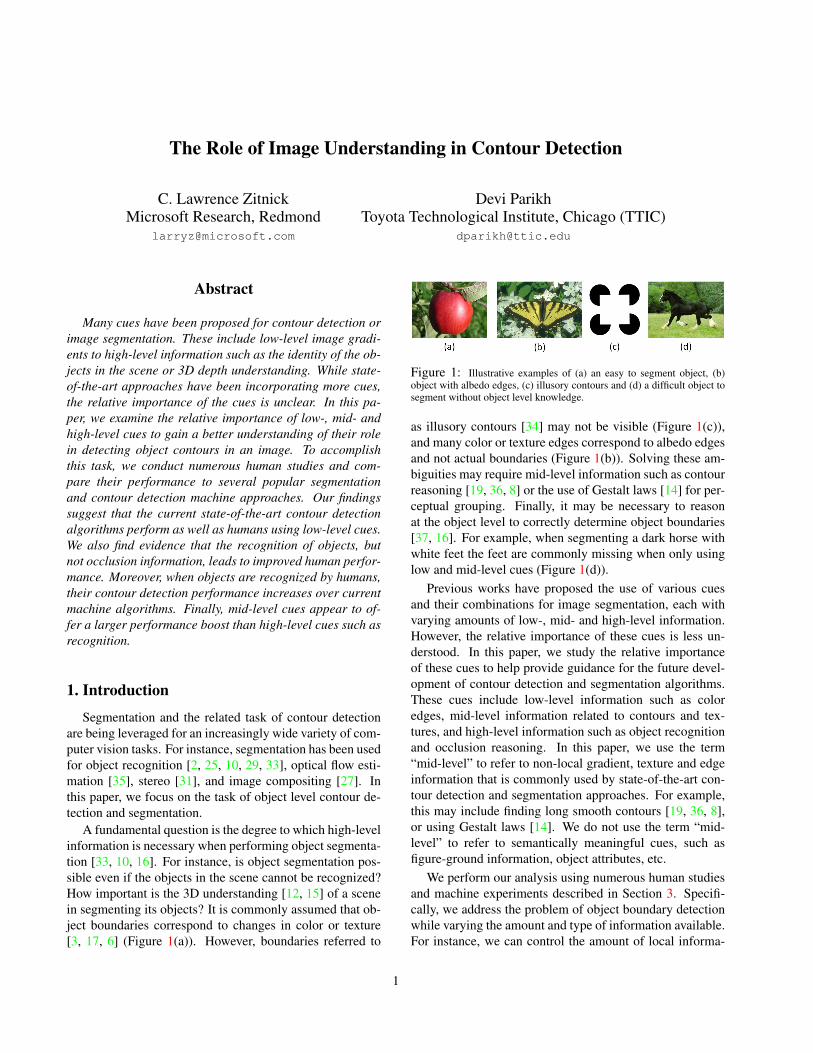
Figure 1: Illustrative examples of (a) an easy to segment object, (b)object with albedo edges, (c) illusory contours and (d) a difficult object tosegment without object level knowledge.
as illusory contours [34] may not be visible (Figure 1(c)),and many color or texture edges correspond to albedo edgesand not actual boundaries (Figure 1(b)). Solving these am-biguities may require mid-level information such as contourreasoning [19, 36, 8] or the use of Gestalt laws [14] for per-ceptual grouping. Finally, it may be necessary to reasonat the object level to correctly determine object boundaries[37, 16]. For example, when segmenting a dark horse withwhite feet the feet are commonly missing when only usinglow and mid-level cues (Figure 1(d)).
Previous works have proposed the use of various cuesand their combinations for image segmentation, each withvarying amounts of low-, mid- and high-level information.However, the relative importance of these cues is less un-derstood. In this paper, we study the relative importanceof these cues to help provide guidance for the future devel-opment of contour detection and segmentation algorithms.These cues include low-level information such as coloredges, mid-level information related to contours and tex-tures, and high-level information such as object recognitionand occlusion reasoning. In this paper, we use the term“mid-level” to refer to non-local gradient, texture and edgeinformation that is commonly used by state-of-the-art con-tour detection and segmentation approaches. For example,this may include finding long smooth contours [19, 36, 8],or using Gestalt laws [14]. We do not use the term “mid-level” to refer to semantically meaningful cues, such asfigure-ground information, object attributes, etc.
We perform our analysis using numerous human studiesand machine experiments described in Section 3. Specifi-cally, we address the problem of object boundary detectionwhile varying the amount and type of information available.For instance, we can control the amount of local informa-
1

tion by varying the size of the visible patch surrounding thepotential object boundary [11]. We may also manipulate thetype of information shown by only displaying intensities orby rotating the color channels. For each of these tasks, thedifficulty of recognizing the objects and their occlusion re-lationships varies providing insights into their relative roles.While it is difficult to directly infer causality relationships,as shown in Section 4, correlations between contour detec-tion, low-level information, object recognition and occlu-sion reasoning can be found.
Our studies support three hypotheses. First, further re-search on low-level cues may not yield improved segmen-tation results. Our studies show that humans do not out-perform state-of-the-art segmentation and contour detectionmethods using only small image patches. This supports theearlier findings of Fowlkes [11]. Second, the recognitionof objects leads to a notable improvement in contour de-tection accuracy, while occlusion information is less essen-tial. Assuming there are no confounding factors, our ex-periments show that the improvements in contour detectionaccuracy due to larger patch sizes is caused in part by im-proved recognition of the objects in the patches. Finally,while recognition of objects leads to a significant improve-ment in contour detection, a larger performance boost isgained from the increase in mid-level information as the an-alyzed image patches gain in size.
2. Previous workIn this section, we describe previous works using human
subjects to study segmentation and contour detection, aswell as, various works that have used segmentation-basedapproaches to object recognition and discovery.
The problem of image segmentation and contour detec-tion are closely related. Rivest and Cavanagh [26] studiedvarious sources of information used by humans for contourlocalization. Their findings supported the hypothesis thatinformation related to luminance, color, motion and textureare integrated at a common site in the brain. Closely relatedto our work, Grady et al. [13] find that if given a boundingbox, high level semantic information is not needed for hu-mans to find a consistent segmentation, and conclude theproblem is well-posed. Fowlkes [11] studied the perfor-mance of humans at depth boundary detection with vary-ing window sizes. He found machines were roughly equiv-alent to humans when shown grey-scale patches. A largedatabase of human labeled boundaries was collected andanalyzed by Martin et al. [17]. Each contour segments aregion into foreground and background objects, known asfigure-ground labeling. Fowlkes et al. [12] study the prob-lem of figure-ground labeling given both local and globalinformation, and find that image luminance does provideadditional information over just the knowledge of the depthboundary shape. Peterson [24] hypothesizes that object
(a) Color (b) ColorU (c) ColorUR (d) ColorURI
(e) ColorURI* (f) Gray (g) GrayU
Figure 2: Example patch visualizations from our seven scenarios for ourhuman studies (best viewed in color).
recognition may proceed figure-ground organization in hu-mans. McDermott [18] studied how contour junctions maybe detected. The role of motion parallax in segmentationwas studied by [38]. Related to segmentation, numerousstudies have addressed the problem of selective attention inhumans [7]. Recently, the use of human studies has beenapplied to several computer vision problems to help in un-derstanding the challenges that remain. These include rec-ognizing objects in tiny images [32, 23], the tradeoffs be-tween features, learning algorithm and the amount of train-ing data [21], the roles of local and global information inimages [20] and person detectors [22]. In this paper, weconduct human studies to understand the relative impor-tance of low-, mid- and high-level information for contourdetection.
Since there are numerous works using segmentation andcontours for object recognition, we only reference a fewrepresentative examples here. Belongie et al. [2] proposedusing contours for recognition, while Rabinovich et al. [25]used segments as the basis for contextual reasoning betweenobjects in an image. Segmentation approaches to object dis-covery were proposed by Sivic et al. [30] and Lee and Grau-man [16]. Shotton et al. [29], Ferrari et al. [10], and Tu etal. [33] all proposed algorithms to jointly segment and rec-ognize objects in an image. In this paper we systematicallyquantify the dependence between segmentation and high-level tasks such as recognition.
3. Experimental setupIn this paper, our goal is to examine the role of low-
level, mid-level and high-level information in object seg-mentation. Instead of measuring segmentation performancedirectly, we measure the accuracy of contour detection, i.e.,the accuracy of the segment boundaries, as done by previousstudies on machine segmentation performance [17, 1]. Thedetection of contours has the additional advantage in that it

is possible to perform the task using only local information.This allows us to vary the amount of local (low-level) vs.global (high-level) information available during our humanstudies. However, a set of contours does not necessarily cre-ate an image segmentation, since they may not form closedloops. A few missing contours can also join two segmentscreating a poor segmentation of an image. Despite thesedrawbacks, measures of contour detection accuracy havebeen shown to correlate well with segmentation accuracy,and approaches have been proposed to create segmentationsfrom possibly incomplete contours [8, 1].
In the next section we discuss the various machine algo-rithms used in our experiments, followed by a descriptionof the experimental setup for our human studies.
3.1. Machine experiments
We experiment with six different machine approachesto generating contours, ranging from naive to state-of-the-art methods. Two of these are based on low-level gra-dient information, while the other four are unsupervisedsegmentation-based approaches. For the segmentation-based approaches, we use the authors’ publicly availableimplementation. Gradient: The first approach is a naivemethod based on local gradient information. Contours aredetected simply by thresholding the magnitude of the gra-dients at a pixel. Canny: The second approach detects con-tours in the image by running the classical canny edge de-tector [3]. We used the in-built MATLAB implementation.Ncut: This is the segmentation-based approach of [28] thatbuilds a graph on neighboring pixels. The weights of theedges between pixels are determined using the interveningcontours cue that depends on the magnitude of the colorgradients between pixels. The graph is partitioned usingnormalized cuts, resulting in a segmentation of the image.Mean Shift: This segmentation-based approach uses themean-shift clustering algorithm for image segmentation [5].Each pixel is represented by its five dimensional positionin color and location. The modes in this five dimensionalspace that are found using the mean-shift clustering algo-rithm correspond to a clustering of the image. FH: Thissegmentation-based approach by Felzenszwalb and Hut-tenlocher [9] is an efficient graph-based approach that de-fines edge-weights based on not just the gradient acrossthe edge, but relative to gradients observed in a neighbor-hood. This allows the method to capture perceptually im-portant non-local aspects of the image. It can preserve de-tail in low-variability image regions while ignoring detail inhigh-variability regions. UCM: This segmentation-basedapproach uses a hierarchical representation of the imagecalled Ultrametric Contour Maps [1]. It integrates localcontour cues along the regions boundaries and surround-ing region attributes. Recent results show this approach toachieve state-of-the-art performance [1].
(a) low (b) medium (c) high
(d) low (e) medium (f) high
Figure 3: Examples of low, medium and high gradient patches (largestsize) from our Contour patch dataset with (top) no object contour and (bot-tom) with object contour.
3.2. Human experiments
Our human studies measure the accuracy of our sub-jects on contour detection, recognition, occlusion (i.e. depthboundary) detection and figure-ground labeling tasks on im-age patches. We perform these tasks under numerous sce-narios with varying amounts and types of information avail-able. Each of these scenarios was designed to help separatethe influence of different types of low-, mid- and high-levelinformation. For instance the patch size can control theamount of mid and high-level information available. Theknowledge of high-level information such as the recogni-tion of objects can be reduced by flipping the patch upsidedown or by manipulating the color information, with a min-imal affect on mid-level non-semantic information.
For each scenario, we showed subjects a patch with smallred and yellow squares equidistant from the center, as seenin Figure 2. We asked them several questions related tothe red and yellow squares pertaining to contour detection,depth boundary detection, figure-ground assignment andrecognition. Specifically, the questions were:
• Do the red and yellow squares lie on the same ob-ject, or different objects? The possible answers were:“Same object” or “Different object”.
• Is the object under the red square in front of or behindthe object under the yellow square? The possible an-swers were: “Red in front of Yellow”, “Yellow in frontof Red” and “Neither”.
• Which object does the red square belong to? Subjectswere to provide a one word free form answer.
• Which object does the yellow square belong to?Again, subjects were to provide a one word free formanswer.
.

We conducted these human studies on Amazon’s Me-chanical Turk. Each subject answered the questions abovefor 6 patches at the same time. Reasoning about multiplepatches for a task before moving on to the next task limitsthe influence of one task on the other. Getting responses forall tasks pertaining to a patch from the same subject reducesinter-subject variabilities. In our experiments, each patchwas assigned to 10 unique subjects. Since the experimentalsetup and viewing environment cannot be fully controlledusing Amazon’s Mechanical Turk, these studies are meantto merely serve as a lower bound on human performance.
We presented the patches using seven different scenarios,each with a different visualization to vary the low-level in-formation available (color vs. gray-scale) and the ease withwhich high-level information can be inferred (manipulatingspatial layout and color information). (1) Color: A reg-ular RGB patch was shown. (2) ColorU: The color patchwas flipped upside down before presenting it. (3) ColorUR:The RGB channels of the patch were rotated to be BRG, andthe patch was flipped upside down before presenting it. (4)ColorURI: The RGB channels were rotated and inverted.So the three color channels became 255-B, 255-R and 255-G. The patch was flipped upside down before presenting it.(5) ColorURI*: The color channels were rotated, and onlyone of the channels was inverted. So the three color chan-nels became B, 255-R and G. The patch was flipped upsidedown before presenting it. (6) Gray: An upright patch waspresented in gray scale and (7) GrayU: A gray scale patchwas presented after flipping it upside down. Examples ofthese visualizations can be seen in Figure 2.
4. ResultsWe now describe our contour patch dataset, and the re-
sults of the machine experiments and human studies.
4.1. Contour patch dataset
We build our contour patch dataset from a subset of 185images in the SUN dataset [4]. The dense and detailed ob-ject segmentations in the SUN dataset are appropriate forour study of object boundary detection. We did not usethe popular Berkeley Segmentation Dataset [17] since manyof the labeled contour boundaries correspond to changes inalbedo and not object boundaries. We extract patches froma total of 240 locations across these images. Half of theselocations fall on an object boundary as per the SUN groundtruth annotations, and the other half do not have an objectboundary within a 15x15 pixel neighborhood. To obtaina varied distribution of patch and contour types, as shownin Figure 3, a third of the locations have low-gradients i.e.they have at most a gradient magnitude of 10 in the sur-rounding 7x7 patch. Another third of the locations havemedium-gradients i.e. they have a gradient magnitude be-tween 10 and 30, and none of the pixels in the 7x7 neigh-
borhood have a gradient magnitude higher than 30. The lastthird of the locations have high-gradients with a gradientmagnitude of at least 30 in a 7x7 neighborhood. Since theobject boundaries are occasionally not well localized in theSUN dataset, the presence or absence of a contour was ver-ified using Amazon’s Mechanical Turk. Of the original 240patches, 196 were verified and used for our experiments.We extract patches at seven different sizes centered at eachof the 196 locations: 7x7, 9x9, 15x15, 25x25, 33x33, 63x63and 127x127. This results in a total of 1372 patches in ourdataset. Each patch is presented using seven different visu-alizations to 10 subjects, resulting in about 96k responses toeach of our four questions. The dataset is available on theauthors’ website.
4.2. Machine algorithms
We detected contours in the 185 images using the six ma-chine approaches described above. If a contour boundarywas detected within a 5x5 window of the central pixel, thepatch was considered to have a contour boundary, and other-wise not. This is to account for any small location errors inthe SUN dataset, and to mirror the human studies as closelyas possible, which had the red and yellow squares separatedby 5 pixels. The parameters for the various segmentationalgorithms were selected by optimizing their contour detec-tion performance on an independent set of patches extractedfrom a disjoint set of images from the SUN dataset. Thethreshold for the gradient-based contour detector was set to20. We used the default parameters for canny (automaticallydetermined threshold and sigma = 1). We generated 10 seg-ments for every image using normalized cuts. For the meanshift segmentation algorithm, the parameters were Spatial-Bandwidth = 7, RangeBandwidth = 6.5 and MinimumRe-gionArea = 200. The parameters for FH were set to sigma= 1, K = 500, min = 200. The parameter for UCM was setto k = 0.1.
The results of the machine tests on our dataset for con-tour detection can be seen in Figure 6. The local edge basedmethods, gradient and Canny perform relatively poorlywith 58.3% and 63.9% respectively. The segmentationapproaches, mean shift (74.2%), FH (74.2%), and UCM(74.7%) all perform roughly the same with normalized cuts(67.0%) doing worse. Clearly, the mid-level informationused by the segmentation approaches provides additionalaccuracy. We provide a comparison between machine andhuman accuracy in the following section.
4.3. Human Studies
Before we describe our results for the human studies,we describe how human accuracies for the different tasksare computed. The SUN dataset does not supply groundtruth for depth boundary detection or figure-ground label-ing. For these tasks, we use the majority vote response of

Figure 4: Accuracies of (a) contour detection, (b) recognition, (c) depth boundary detection and (d) figure-ground labeling across window sizes for allscenarios.
Figure 5: Scatter plots of contour detection accuracies vs. (a) recognition accuracies (corr = 0.944), (b) boundary detection accuracies (corr = 0.914) and(c) figure-ground labelings (corr = 0.378) for all scenarios and window sizes.
Figure 6: Graph showing the accuracies of various machine approaches(red) compared to human accuracies on the Color scenario (dark blue), theColor scenario when an object in the patch was not recognized (light blue),Gray scenario (gray), and ColorURI scenario (green).
our subjects at the largest patch size (127x127) using theColor visualization as ground truth. For the depth bound-ary detection task, we ignore the polarity of the response(red in front of yellow or yellow in front of red), and sim-ply check if the subject correctly detected the presence of adepth boundary or not, i.e., did he choose “neither” or not.To measure recognition accuracy, we generated a groundtruth dataset of object labels by gathering 30 responses inaddition to our original 10 responses to name objects under
the red and yellow squares using (127x127) patches with theColor visualization. The freeform answers provided werecompared to the answers provided by the original subjects.If corresponding words were found, ignoring capitalizationand punctation, the objects were said to be recognized. Ifat least one object was recognized correctly in the patch, itwas labeled as recognized.
We now analyze the results of our human studies. We be-gin by providing an overview of the results and analyze theaccuracies given low-level and mid-level cues. Next, we ad-dress the dependencies between contour detection and im-age understanding, i.e., recognition, depth boundaries (oc-clusion) and figure-ground labels. Finally, we compare hu-mans accuracies to machines.
An overview of our human studies results can be seen inFigures 4 and 5. Figure 4 plots the contour detection accu-racy, recognition accuracy, depth boundary detection accu-racy, and figure-ground labeling accuracy vs. the patch sizefor all scenarios. In each case, the accuracies increase withthe patch size visible to the subjects. Figure 5 shows threescatter plots of contour detection accuracy vs. recognitionaccuracy, depth boundary detection accuracy, and figure-ground labeling accuracy. Each data point corresponds toa scenario and window size. A strong correlation is visible

Figure 7: Plot of contour detection accuracies across patch sizes for thehuman study Color scenario with high, medium and low gradient patches.
between the accuracy of contour detection and both recog-nition accuracy and depth boundary detection accuracy.
In Figure 7, we show the contour detection accuracy forthe patches with low, medium an high gradients for theColor scenario. Accuracy typically varies by 5% betweenpatches with low and high contrast. Other scenarios showsimilar differences.
Low-level We can study the performance of contour de-tection using low-level cues by analyzing the accuracies us-ing small windows in Figure 4(a). The results can be clearlysplit into two groups. The scenarios in which the relativecolor information is kept, Color, ColorU, ColorUR and Col-orURI, all have higher accuracies than the scenarios with-out color, Gray and GrayU, and ColorURI*, which does notmaintain relative color information. It is interesting to notethat low-level contour detection appears to be invariant tocolor rotation, and the patch being flipped upside down.
Mid-level We refer to non-local and non-semantic con-tour and texture information as “mid-level information.” Wedo not use the term “mid-level” to refer to figure-ground orobject attribute information. In Figure 4, the contour de-tection accuracies increase with window size, but it is un-clear whether this increase is due to more mid-level cuesbeing visible or to better image understanding using high-level knowledge. To separate the effect of high-level knowl-edge from mid-level cues, we plot in Figure 8 the contourdetection accuracies conditioned upon whether at least oneobject was recognized correctly (R=1) or not (R=0). Wealso conditioned on whether the presence of a depth bound-ary was correctly labeled (D=1) or not (D=0). The resultsare averaged across all scenarios. In each of the four possi-ble cases, the accuracies increase substantially with windowsize by about 15%. For example, even if an object was notrecognized (R=0) and the depth boundary was not correctlylabeled (D=0), contour detection accuracies still increasedwith window size from 64% to 78%. If the increase in accu-racy with window size in Figure 4 were solely do to recog-
Figure 8: Contour accuracies conditioned on correctly recognizing anobject and correctly detecting the presence of a depth boundary acrosswindow sizes averaged over all scenarios. (blue, R=1) an object is cor-rectly recognized, (red, R=0) not recognized, (solid, D=1) depth boundarycorrectly labeled, (dotted, D=0) depth boundary incorrectly labeled.
nizing objects or detecting depth boundaries we would ex-pect the curves in Figure 8 to be flat. This provides strongevidence that mid-level cues are important for object seg-mentation, assuming there are no other significant sourcesof high-level information beyond recognition and depth un-derstanding that led to the observed increase.
Depth boundaries In Figure 5(b), the knowledge of adepth boundary within the patch appears strongly corre-lated (corr = 0.914) to contour detection accuracy. How-ever, in Figure 8 when the contour detection accuracy isconditioned on labeling the presence of a depth boundarycorrectly (solid vs. dotted lines) there is only a negligi-ble difference. Specifically, the contour detection accuracyis approximately the same regardless of whether the sub-ject correctly labels the presence of a depth boundary (solidgreen line) or not (dotted green line). Hence, the correla-tion observed in Figure 5(b) may be primarily due to bothdepth boundaries and contours being easier to detect withlarger patch sizes. In Figure 5, the change in depth bound-ary detection accuracy (65% to 72%) across patches sizesand scenarios is also quite small with respect to the changesin contour detection accuracy (65% to 85%.) These obser-vations make it unlikely that the understanding of depth hada significant impact on the accuracy of the detected contoursin our studies.
Figure-ground Unlike depth boundary detection, figure-ground knowledge does not appear to be strongly correlated(corr = 0.378) to contour detection accuracy as shown inFigure 5(c). The use of patches flipped upside down insome scenarios and right side up in others, resulted in twodistinct groupings in Figure 5(c). In upside down patches,the shading information available might lead to the wrongfigure-ground interpretation, since humans typically assumea scene is lit from above. However, this misinterpretationdoes not appear to adversely affect contour detection per-
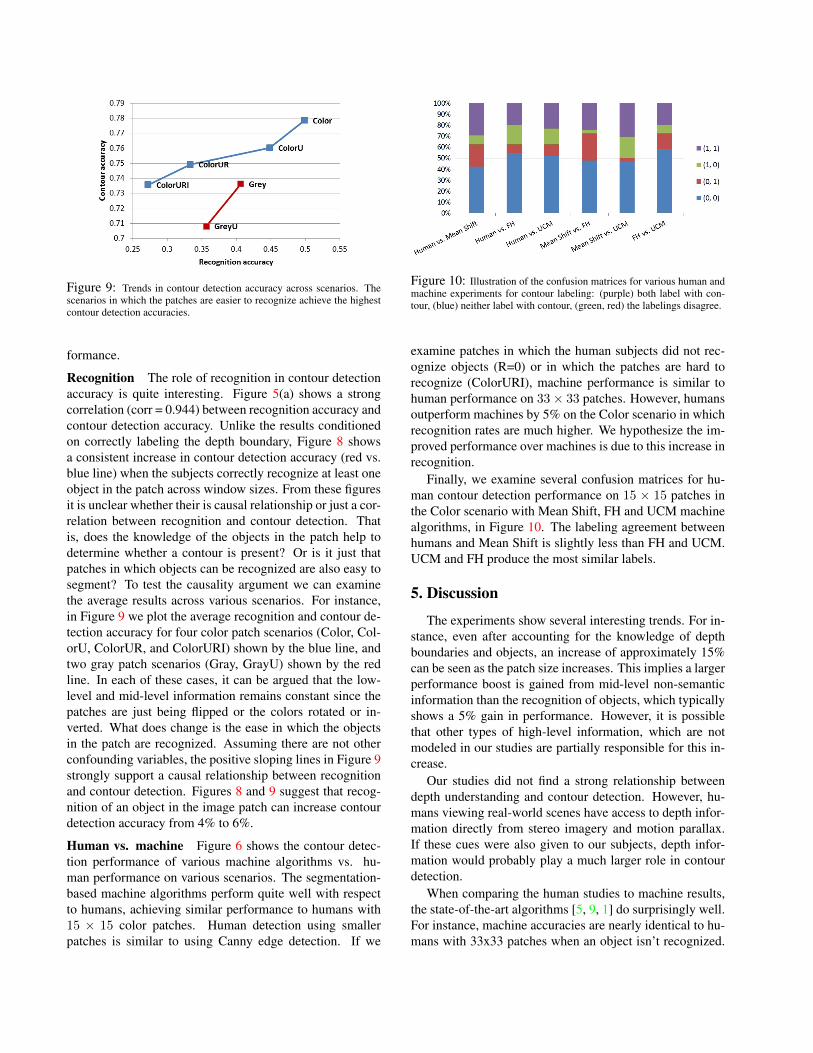
Figure 9: Trends in contour detection accuracy across scenarios. Thescenarios in which the patches are easier to recognize achieve the highestcontour detection accuracies.
formance.
Recognition The role of recognition in contour detectionaccuracy is quite interesting. Figure 5(a) shows a strongcorrelation (corr = 0.944) between recognition accuracy andcontour detection accuracy. Unlike the results conditionedon correctly labeling the depth boundary, Figure 8 showsa consistent increase in contour detection accuracy (red vs.blue line) when the subjects correctly recognize at least oneobject in the patch across window sizes. From these figuresit is unclear whether their is causal relationship or just a cor-relation between recognition and contour detection. Thatis, does the knowledge of the objects in the patch help todetermine whether a contour is present? Or is it just thatpatches in which objects can be recognized are also easy tosegment? To test the causality argument we can examinethe average results across various scenarios. For instance,in Figure 9 we plot the average recognition and contour de-tection accuracy for four color patch scenarios (Color, Col-orU, ColorUR, and ColorURI) shown by the blue line, andtwo gray patch scenarios (Gray, GrayU) shown by the redline. In each of these cases, it can be argued that the low-level and mid-level information remains constant since thepatches are just being flipped or the colors rotated or in-verted. What does change is the ease in which the objectsin the patch are recognized. Assuming there are not otherconfounding variables, the positive sloping lines in Figure 9strongly support a causal relationship between recognitionand contour detection. Figures 8 and 9 suggest that recog-nition of an object in the image patch can increase contourdetection accuracy from 4% to 6%.
Human vs. machine Figure 6 shows the contour detec-tion performance of various machine algorithms vs. hu-man performance on various scenarios. The segmentation-based machine algorithms perform quite well with respectto humans, achieving similar performance to humans with15 × 15 color patches. Human detection using smallerpatches is similar to using Canny edge detection. If we
Figure 10: Illustration of the confusion matrices for various human andmachine experiments for contour labeling: (purple) both label with con-tour, (blue) neither label with contour, (green, red) the labelings disagree.
examine patches in which the human subjects did not rec-ognize objects (R=0) or in which the patches are hard torecognize (ColorURI), machine performance is similar tohuman performance on 33× 33 patches. However, humansoutperform machines by 5% on the Color scenario in whichrecognition rates are much higher. We hypothesize the im-proved performance over machines is due to this increase inrecognition.
Finally, we examine several confusion matrices for hu-man contour detection performance on 15 × 15 patches inthe Color scenario with Mean Shift, FH and UCM machinealgorithms, in Figure 10. The labeling agreement betweenhumans and Mean Shift is slightly less than FH and UCM.UCM and FH produce the most similar labels.
5. Discussion
The experiments show several interesting trends. For in-stance, even after accounting for the knowledge of depthboundaries and objects, an increase of approximately 15%can be seen as the patch size increases. This implies a largerperformance boost is gained from mid-level non-semanticinformation than the recognition of objects, which typicallyshows a 5% gain in performance. However, it is possiblethat other types of high-level information, which are notmodeled in our studies are partially responsible for this in-crease.
Our studies did not find a strong relationship betweendepth understanding and contour detection. However, hu-mans viewing real-world scenes have access to depth infor-mation directly from stereo imagery and motion parallax.If these cues were also given to our subjects, depth infor-mation would probably play a much larger role in contourdetection.
When comparing the human studies to machine results,the state-of-the-art algorithms [5, 9, 1] do surprisingly well.For instance, machine accuracies are nearly identical to hu-mans with 33x33 patches when an object isn’t recognized.

Since humans have access to significant low- and mid-levelinformation in a 33x33 patch, it is worth asking to whatdegree segmentation performance can improve using onlylow and mid-level information. Perhaps the recognition ofobjects is necessary to significantly improve segmentationperformance. Should segmentation and recognition be per-formed jointly [10, 33, 29]?
In conclusion, this paper presents numerous human andmachine studies on image segmentation. We find evidencethat machines perform as well as humans using low-levelinformation. Mid-level information appears to provide alarger boost in contour detection accuracy than the recog-nition of objects. Finally, we hypothesize the recognitionof objects, but not depth boundary detection is necessary toachieve human level performance.
Acknowledgements: This work was supported in part byNSF IIS-1115719.
References[1] P. Arbelaez, M. Maire, C. Fowlkes, and J. Malik. Con-
tour detection and hierarchical image segmentation. PAMI,33(5):898 –916, 2011. 2, 3, 7
[2] S. Belongie, J. Malik, and J. Puzicha. Shape matching andobject recognition using shape contexts. PAMI, 24(4), 2002.1, 2
[3] J. Canny. A computational approach to edge detection.PAMI, 8(6), 1986. 1, 3
[4] M. J. Choi, J. Lim, A. Torralba, and A. Willsky. Exploitinghierarchical context on a large database of object categories.In CVPR, 2010. 4
[5] D. Comaniciu and P. Meer. Mean shift: A robust approachtoward feature space analysis. PAMI, 24(5), 2002. 3, 7
[6] P. Dollar, Z. Tu, and S. Belongie. Supervised learning ofedges and object boundaries. In CVPR, June 2006. 1
[7] J. Driver and R. S. Frackowiak. Neurobiological measures ofhuman selective attention. Neuropsychologia, 39(12):1257 –1262, 2001. 2
[8] J. Elder and S. Zucker. Computing contour closure. InECCV. 1996. 1, 3
[9] P. F. Felzenszwalb and D. P. Huttenlocher. Efficient graph-based image segmentation. IJCV, 59(2), 2004. 3, 7
[10] V. Ferrari, T. Tuytelaars, and L. Van Gool. Simultaneousobject recognition and segmentation by image exploration.In ECCV. 2004. 1, 2, 8
[11] C. C. Fowlkes. Measuring the ecological validity of groupingand figure-ground cues. Thesis, 2005. 2
[12] C. C. Fowlkes, D. R. Martin, and J. Malik. Local figure-ground cues are valid for natural images. Journal of Vision,7(8), 2007. 1, 2
[13] L. Grady, M.-P. Jolly, and A. Seitz. Segmentation from abox. In ICCV, 2011. 2
[14] G. W. Hartmann. Principles of gestalt psychology. Journalof Applied Psychology, 20:623–628, 1936. 1
[15] D. Hoiem, A. Efros, and M. Hebert. Putting objects in per-spective. In CVPR, 2006. 1
[16] Y. J. Lee and K. Grauman. Collect-cut: Segmentation withtop-down cues discovered in multi-object images. In CVPR,2010. 1, 2
[17] D. R. Martin, C. C. Fowlkes, and J. Malik. Learning to detectnatural image boundaries using local brightness, color, andtexture cues. PAMI, 26:530–549, 2004. 1, 2, 4
[18] J. McDermott. Psychophysics with junctions in real images.Perception, 33:1101–1127, 2004. 2
[19] P. Parent and S. Zucker. Trace inference, curvature consis-tency, and curve detection. PAMI, 11(8):823 –839, 1989. 1
[20] D. Parikh. Recognizing jumbled images: the role of local andglobal information in image classification. In ICCV, 2011. 2
[21] D. Parikh and C. Zitnick. The role of features, algorithmsand data in visual recognition. In CVPR, 2010. 2
[22] D. Parikh and C. Zitnick. Finding the weakest link in persondetectors. In CVPR, 2011. 2
[23] D. Parikh, C. Zitnick, and T. Chen. From appearance tocontext-based recognition: Dense labeling in small images.In CVPR, 2008. 2
[24] M. Peterson. Object recognition processes can and do oper-ate before figure-ground organization. Current Directions inPsychological Science, 3, 1994. 2
[25] A. Rabinovich, A. Vedaldi, C. Galleguillos, E. Wiewiora,and S. Belongie. Objects in context. ICCV, 2007. 1, 2
[26] J. Rivest and P. Cabanagh. Localizing contours defined bymore than one attribute. Vision Research, 36(1):53 – 66,1996. 2
[27] C. Rother, V. Kolmogorov, and A. Blake. ”grabcut”: inter-active foreground extraction using iterated graph cuts. InSIGGRAPH, 2004. 1
[28] J. Shi and J. Malik. Normalized cuts and image segmenta-tion. PAMI, 22(8), 2000. 3
[29] J. Shotton, J. Winn, C. Rother, and A. Criminisi. Texton-boost: Joint appearance, shape and context modeling formulti-class object recognition and segmentation. In ECCV.2006. 1, 2, 8
[30] J. Sivic, B. Russell, A. Efros, A. Zisserman, and W. Freeman.Discovering objects and their location in images. In ICCV,2005. 2
[31] H. Tao, H. Sawhney, and R. Kumar. A global matchingframework for stereo computation. In ICCV, 2001. 1
[32] A. Torralba, R. Fergus, and W. Freeman. 80 million tinyimages: A large data set for nonparametric object and scenerecognition. PAMI, 30(11), 2008. 2
[33] Z. Tu, X. Chen, A. L. Yuille, and S.-C. Zhu. Image parsing:Unifying segmentation, detection, and recognition. IJCV,63:113–140, 2005. 1, 2, 8
[34] R. von der Heydt, E. Peterhans, and G. Baumgartner. Illusorycontours and cortical neuron responses. Science, 224(4654),1984. 1
[35] J. Wang and E. Adelson. Representing moving images withlayers. TIP, 3(5), 1994. 1
[36] L. R. Williams and D. W. Jacobs. Stochastic completionfields: a neural model of illusory contour shape and salience.Neural Comput., 9:837–858, 1997. 1
[37] J. Winn and N. Jojic. Locus: learning object classes withunsupervised segmentation. In ICCV, 2005. 1
[38] A. Yoonessi and C. L. Baker. Contribution of motion paral-lax to segmentation and depth perception. Journal of Vision,11(9), 2011. 2


![Implementation of Edge Detection Technique for ...implemented using Edge detection technique. Edge based methods are focussed on detecting the contour of the image [17]. Canny Edge](https://img.pdfslide.us/doc/110x75/5f12a334bc86d46691255693/implementation-of-edge-detection-technique-for-implemented-using-edge-detection.jpg)