Embed Size (px)
Citation preview

The role of higher molecular weight
dissolved organic nitrogen in the plant-
soil nitrogen cycle
Kirsten Lønne Enggrob
Phd Thesis, Science and Technology, 2019
Department of Agroecology
Faculty of Science and Technology
Aarhus University, Foulum
Blichers Allé 20
P.O. Box 50
8830 Tjele
Denmark

Main supervisor
Senior Researcher Jim Rasmussen
Department of Agroecology
Aarhus University, Denmark
Co-supervisor
Associate Professor Lars Elsgaard
Department of Agroecology
Aarhus University, Denmark
Assessment Committee
Professor Mathias Neumann Andersen (Chairman)
Department of Agroecology
Aarhus University, Denmark
Associated Professor Anke M. Herrmann
Department of Soil & Environment
Swedish University of Agricultural Sciences, Sweden
Senior Lecturer Paul W. Hill
School of Natural Sciences
Bangor University, United Kingdom

i
Preface
This thesis entitled “The role of higher molecular weight dissolved organic nitrogen in the plant-soil
nitrogen cycle” is submitted in fulfilment of the requirement for the Doctor of Philosophy (PhD) degree
at Faculty of Science and Technology, Aarhus University, Denmark. This PhD project was supervised
by Senior researcher Jim Rasmussen and Associate Professor Lars Elsgaard.
This thesis is a result of work conducted from January 2015 to January 2019 at Department of
Agroecology, Aarhus University. This project was financially supported by The Independent Research
Fund Denmark – Technology and Production (Project no. 1335-00760B).
This thesis is based on the work presented in one published paper and two prepared for submission:
Paper 1:
Enggrob, K.L., Larsen, T., Larsen, M., Elsgaard, L., Rasmussen, J., 2019. The influence of hydrolysis and
derivatization on the determination of amino acid contentand isotopic ratios in dual‐labeled (13C,15N)
white clover. Rapid Commun Mass Spectrom 33, 21-30. DOI: 10.1002/rcm.8300.
Paper 2:
Enggrob, K.L., Larsen, T., Rasmussen, J. Molecular size doesn't matter for turning over large organic N
in soil. (Prepared for submission to Nature)
Paper 3:
Enggrob, K.L., Jakobsen, C.M., Pedersen, I.F., Rasmussen, J. Newly depolymerized large organic N
contributes directly to maize amino acid uptake. (Prepared for submission to New Phytologist)

ii
Acknowledgements
I would like to acknowledge my supervisor Jim Rasmussen, whom granted me the opportunity to
conduct this PhD project, without his contribution and support this work would not have been
possible. I would also like to acknowledge my co-supervisors Lars Elsgaard, whom through
discussions and guidance steered me in the right direction.
I would like to acknowledge Senior Scientist Mogens Larsen for giving me the opportunity to work
with the GC-C-IRMS, and a special thanks to the lab technicians Anne Krustrup and Birgit Hørdum Løth
for help and support with the laboratory work during my stay at Department of Animal Science. Also a
special thanks to lab technician Cecilie Kokholm and scientific assistant Janni Hansen for their help in
the laboratory, and the technicians at the Soil Fertility section in general.
Thanks to my office mates Betina Nørgaard Pedersen and Julie Therese Christensen for both moral and
work related support and a special thanks to all the other PhD students in Soil Fertility for the work
related discussions and social related debates. Also, I would like to thank all my coworkers in Soil
Fertility for provided a great work environment.
Last but not least, a special thanks to by beloved Husband Knud Erik and sons, Benjamin and
Alexander, and family and friends for their love, encouragement and continuous support.
Kirsten Lønne Enggrob
February 2019
Aarhus University, Foulum, Denmark

iii
Summary in English
Nitrogen (N) is an essential nutrient for plant growth required in large amounts. Efficient use of N in
agricultural systems is essential in the strive for sustainability in crop production and to counter the
environmental and climate change challenges related to food production. A key issue in predicting
plant available N is the turnover of complex higher molecular weight (Mw) organic N, like proteins and
peptides, to lower Mw organic N, available for direct plant and microbial uptake. However, there is a
lack of knowledge of the mechanisms controlling the fate of DON pools in soil.
In this project I investigated the role of higher Mw DON compounds in the plant-soil nitrogen cycle
with a specific focus on amino acids bound in peptides and proteins. The work was divided into three
objective namely: (i) to set up a compound specific isotope analysis (CSIA) to characterize and
quantify amino acids in 15N and 13C-labeled high Mw DON derived from white clover, (ii) to investigate
the turnover of higher Mw DON in soil with different management histories, and (iii) to investigate the
turnover of higher Mw DON in a soil with plant growth to determine the influences of the competition
between plants and soil microorganisms on the turnover of higher Mw DON and the uptake of N by
plants.
Firstly, I examined the efficiency of a standard acidic hydrolysis (6 M HCl, 20 h at 110°C) and a fast
acidic hydrolysis (6 M HCl, 70 min at 150°C) on the recovery of amino acids from a protein standard
Bovine Serum Albumin (BSA). I tested two derivaterization methods, N-acetyl methyl esterification
(NACME) and N-acetyl isopropyl esterification (NAIP), for the gas chromatography combustion
isotopic ratio mass spectrometry (GC-C-IRMS) analysis of amino acid standards. The best methods
were tested on dual-labeled (13C and 15N) clover shoot and root juice, divided in four Mw sized
fractions. The NAIP derivatization successfully resulted in higher recovery compared to the NACME
derivatization method. The NAIP derivaterization gave very low limit of detection (LOD) < 2 pmol and
limit of quantification (LOQ) ranging from 0.55-4.89 pmol across amino acids. Comparing
concentrations of individual amino acids in hydrolyzed versus un-hydrolyzed samples of the low Mw
sized fraction (< 1 kDa) showed a significant decline in concentration for seven amino acids after
hydrolysis. Despite the decline in amino acid concentration, I found a linear connection between the
obtained atomic fraction (13C and 15N) for individual amino acids of hydrolyzed versus un-hydrolyzed
samples for the <1 kDa fraction. The methodology distinguished differences in atomic fractions across
amino acid, in individual amino acid in Mw size fractions, and between shoot and root samples of
experimentally labeled white clover. Uniquely, the method separate glutamate and glutamine, which is
usually hard to achieve. Thus, the first part of my study presented an optimized methodology for GC-C-
IRMS analysis of amino acids in enriched organic N samples for 13C and 15N amino acid stable isotopic
probing (SIP).

iv
Secondly, I investigated the fate of peptide-sized and protein-sized organic N fractions in soils from
two long-term field experiments (LTE) markedly differing in condition for microorganisms. Contrary
to the present paradigm, the results showed that for all soils the exo-enzymatic depolymerization was
not per se the rate-limiting step in the turnover of these compounds nor was protection via strong
sorption to the soil mineral phase. Instead, strong evidence pointed to that gram-positive bacteria are
the key actors in the decomposition of protein-sized nitrogen compounds and that large organic
nitrogen compounds contribute directly to bacterial tissue build-up. Thus, when large organic nitrogen
compounds are dissolved, turnover occurs rapidly, irrespective of molecular size, and the bacterial
incorporation of these rapid cycling compounds potentially make an important contribution to soil
organic matter formation.
Thirdly, LTE soils with and without maize were added >100 kDa organic N, to investigate the
contribution of large Mw dissolved organic N to microbial and plant carbon (C) and N nutrition.
Mineralization of >100 kDa organic N increased with soil pH in soil without maize, but no effect of soil
pH was seen for soil with maize. The >100 kDa organic N disappeared rapidly in soils with and without
maize, but surprisingly more >100 kDa organic N derived amino acids remained in soil with than
without maize – most likely in the microbial biomass. Total 15N uptake in maize increased with higher
soil pH and the organic N uptake estimated to account for 20-30% of the total 15N uptake across the
soil pH gradient. Organic N uptake was confirmed by presence of 13C-labeled amino acids in the maize
roots. The study shows that when bio-available N is derived from large molecular sized organic N then
the importance of plant organic N uptake increases, and that rhizosphere microorganisms increase
anabolic utilization of organic N compared to bulk soil microorganisms.
v
Dansk sammendrag
Kvælstof (N) er et vigtigt plantenæringsstof, der kræves i store mængder. Effektiv anvendelse af N i
landbruget er afgørende for at øge bæredygtigheden i planteproduktionen og derved mindske de
miljømæssige og klimamæssige problemer, der er forbundet med fødevareproduktion. For at
forudsige tilgængeligheden af N skal vi forstå omdannelsen af komplekse organiske N forbindelser,
som proteiner og peptider af høj molekylvægt, til mindre organiske N forbindelser af lavere
molekylevægt. Idet mindre organiske N forbindelser er direkte tilgængelige for plante- og mikrobiel
optagelse. Vi mangler dog viden om de mekanismer, der styrer DON-puljernes skæbne i jorden.
I dette projekt undersøger jeg stort DONs rolle i plante-jord N kredsløbet, med fokus på aminosyrer
bundet i peptider og proteiner. Arbejdet var inddelt i tre delmål: (i) optimering af en stof specifik
isotop analyse (CSIA) til karakterisering og kvantificeringen af aminosyrer i 15N og 13C-mærket
højmolekylært DON fra hvidkløver, (ii) undersøgelse af omdannelsen af højmolekylært DON i jord fra
langvarige forsøg med forskellig historik og, (iii) undersøgelse af omdannelsen af højmolekylært DON i
jord med tilstedeværelsen af planter for at bestemme indflydelsen konkurrencen mellem plante og
mikroorganismer på omsætningen af højmolekylært DON, samt plantens optag af N.
Først undersøgte jeg effektiviteten af en standard hydrolyse og en hurtig hydrolyse på genfindelsen af
aminosyrer fra et standard protein Bovine Serum Albumin (BSA). Jeg testede to derivatiserings
metoder, N-acetyl methyl esterificering (NACME) and N-acetyl isopropyl esterificering (NAIP), til
analyse af aminosyrestandarder på gaskromatografisk isotop-ratio massespektrometrisk (GC-C-IRMS)
analyse. De bedste fremgangsmåder blev derefter yderligere testet på dobbelt mærket (13C og 15N)
hvidkløverblad- og rodsaft, opdelt i fire molekylevægt fraktioner. NAIP derivatiseringen resulterede i
meget lave detektions- (LOD) < 2pmol og kvantificeringsgrænser (LOQ) liggende mellem 0.55 – 4.89
pmol på tværs af aminosyrer. Sammenligningen af koncentrationen af individuelle aminosyrer fra
henholdsvis hydrolyserede versus ikke hydrolyserede prøver af lavmolekylært organisk N (<1 kDa)
viste et signifikant fald i koncentrationen fra syv aminosyrer i de hydrolyserede prøver. På trods af
nedgangen i koncentrationen af aminosyrer fandt jeg en lineær sammenhæng mellem de målte
atomfraktioner (13C og 15N) for individuelle aminosyrer fra hydrolyserede versus ikke hydrolyserede
prøver fra <1 kDa fraktionen. Fremgangsmåden kunne adskille forskellene i atomfraktionerne på
tværs af aminosyrerne, for individuelle aminosyrer på tværs af molekylærvægt fraktionerne og
mellem rod- og bladsaftsprøver fra eksperimentelt mærket hvidkløver. Ret enestående kunne
fremgangsmåden adskille glutamat og glutamin, hvilke normal er svært at opnå. Således opnåede jeg i
den første del af mit studie at lave en optimeret metode til GC-C-IRMS analyse af aminosyrer fra
organiske N prøver beriget med stabile isotoper .

vi
For det andet, undersøgte jeg omdannelsen af organiske N forbindelser af peptid- og proteinstørrelse i
jord fra to langvarige markforsøg (LTE) med markante forskelle i dyrkningshistorik og dermed de
mikrobielle miljøer. I modsætning til det nuværende paradigme, viste resultaterne for alle jorderne, at
hverken exo-enzymatiske depolymerisering eller beskyttelse højmolekylært organisk N via stærk
sorption til jordens mineralfase var begrænsende for omsætningen. I stedet for fandt jeg, at gram-
positive bakterier er nøgleaktørerne i nedbrydning af kvælstofforbindelser i proteinstørrelse, og at
store organiske nitrogenforbindelser bidrager direkte til bakteriel vævsopbygning. Forsøget viste, at
når først organiske N forbindelser er opløst, sker omsætningen hurtigt uanset molekylstørrelse, og at
bakteriel indbygning af disse stoffer potentielt udgør et vigtigt bidrag til dannelse af organisk stof i
jorden.
For det tredje, undersøgte jeg bidraget fra stort organisk N (>100 kDa) til plante og mikroorganismers
optag af kulstof (C) og N. Mineralisering af >100 kDa organisk N steg med jord pH i jord uden majs,
mens der ingen virkning var af jordens pH ved tilstedeværelse af majs. Aminosyrer fra det stor
organiske N forsvandt hurtigt både i jord med og uden majs, men overraskende genfandt jeg en større
andel af organisk N afledte aminosyrer i jord med majs end i jord uden majs - sandsynligvis fordi
aminosyrerne var indbygget i den mikrobielle biomasse. Det totale 15N optag i majs steg med jordens
pH, og N optaget i organisk form blev anslået til at udgøre 20-30% af det samlede 15N optagelse på
tværs af den undersøgte pH gradient. Det direkte optag af organiske N forbindelser blev bekræftet ved
tilstedeværelse af 13C-mærkede aminosyrer i majsrødderne.
Studiet viste, at vigtigheden af plantens optag af organisk N var større for højmolekylært organisk N
end det er blevet fundet undersøgelser af lavmolekylært organisk N, og at mikroorganismer i
rhizosfæren øger den anabolske udnyttelse af det højmolekylære organiske N sammenlignet med
mikroorganismer i jord uden planter.

vii
Abbreviations AA Amino acid
BSA Bovine Serum Albumin
C Carbon
CSIA Compound specific isotopic analysis
DIN Dissolved inorganic nitrogen
DON Dissolved organic nitrogen
GC-C-IRMS Gas chromatography combustion isotopic ratio mass spectrometry
HpH High pH soil
ISTD Internal standard
LOD Limit of detection
LOQ Limit of quantification
LpH Low pH soil
LSC Liquid Scintillation Counting
MpH Medium pH soil
Mw Molecular weight
N Nitrogen
NACME N-acetyl methyl esterification
NAIP N-acetyl isopropyl esterification
NH4+ Ammonium
NO3- Nitrate
PLFA Phospholipid fatty acid
SIP Stable isotopic probing
SMB Soil microbial biomass
Amino acids abbreviations Ala Alanine
Val Valine
Gly Glycine
Leu Leucine
Ile iso Leucine
Nle nor Leucine
Pro Proline
Thr Threonine
Asn Aspargine
Asp Aspartic acid
Ser Serine
Glu Glutamate
Gln Glutamine
Phe Phenylalanine
Tyr Tyrosine
Lys Lysine
Asx Aspargine + Aspartate
Glx Glutamate + Glutamine
Pro/Thr Proline + Threonin

viii
Contents
Preface ............................................................................................................................................................... i
Acknowledgements ........................................................................................................................................ ii
Summary in English ...................................................................................................................................... iii
Dansk sammendrag ........................................................................................................................................ v
Abbreviations ................................................................................................................................................ vii
1. General introduction ............................................................................................................................ 1
1.1. Studying the plant-soil nitrogen cycling ....................................................................................... 1
1.2. Aim and hypothesis ........................................................................................................................... 3
2. Method theory ........................................................................................................................................ 5
2.1. Stable isotopic probing ..................................................................................................................... 5
2.2. Bulk isotopic analysis ....................................................................................................................... 6
2.2.1. 14CO2 analysis by Liquid Scintillation Counter ......................................................................... 6
2.2.2. 13C and 15N analysis by Flash Elemental Analyzer Isotopic ratio mass spectrometer ...... 7
2.3. Compound specific isotopic analysis ............................................................................................. 8
2.3.1. Amino acid analysis ....................................................................................................................... 8
2.3.2. Phospholipid fatty acid (PLFA) analysis ................................................................................... 9
3. Experimental work .............................................................................................................................. 10
3.1. Developing the CSIA for amino acid (paper 1) ........................................................................... 10
3.1.1. Tuning the GC-C-IRMS analysis ................................................................................................. 11
3.1.2. Key findings .................................................................................................................................. 13
3.2. Turnover of higher Mw organic nitrogen (paper 2) ................................................................. 15
3.2.1. Incubation experiment ............................................................................................................... 16
3.2.2. Three extra sized fractions ........................................................................................................ 19
3.2.3. The amino acid CSIA of the soil samples ................................................................................. 22
3.2.4. Evaluating the amino acid CSIA results ................................................................................... 22
3.2.5. Confirming the results using different LTE soils ................................................................... 23
3.2.6. The PLFA CSIA of the soil samples ............................................................................................ 25
3.3. Plant N uptake from higher Mw DON (paper 3) ........................................................................ 27
3.3.1. Key findings .................................................................................................................................. 31
4. General discussion .............................................................................................................................. 34
4.1. The analytical method for amino acid CSIA ................................................................................ 34
4.2. Mineralization and sorption of organic N in soil with or without plants ............................. 35
4.3. Organic nitrogen in soil with and without plants ..................................................................... 36

ix
4.4. Plant N uptake .................................................................................................................................. 37
5. Conclusion ............................................................................................................................................. 38
6. References ............................................................................................................................................. 40
7. Appendices ............................................................................................................................................ 44

1
1. General introduction
1.1. Studying the plant-soil nitrogen cycling
The traditional understanding of the nitrogen (N) cycling in the plant-soil system is that the soil
microbiota has to fully decompose organic bound N to inorganic N in order to make N available for
plant uptake. This view is dating back to Liebig (1842), and was supported by the recognition that
microbial mediated decomposition of organic N resulted in ammonium (NH4+) as an end product
(Waksman, 1932). Hence mineralization of organic N became a central element in the perception of
the N cycle in the plant-soil system. This, and further observations described in a reviewing paper by
Schimel and Bennett (2004), highlighted two core assumptions in relation to studying plant-soil N
cycling: 1) plants only use IN and 2) plants are poor competitors for available soil N relative to
microbes. In the 1980’s and 1990’s studies began to find evidence that plants can use not only
inorganic N, but (among others) also amino acids as N sources at least in N limited ecosystems
(Nasholm et al., 1998; Jones and Kielland, 2002). In the competition for soil nitrogen between plants
and soil microorganisms, soil microorganisms have a number of advantages, such as high substrate
affinities, high surface to volume ratio, and fast growth rates Hodge et al. (2000). Yet, it is most often
found that plants are able to compete successfully for uptake of N. It has been speculated that this may
be because of the cooperation between mycorrhizal fungi and the roots. However, in their seminal
paper Hodge et al. (2000) states in their concluding remarks that: “For most plant species, both the
direct uptake of simple organic compounds and arbuscular mycorrhizal assistance appear to be
unimportant in N capture.” Instead, they suggest that the reason why plants eventually capture most N
is because of their longer life span than soil microorganisms. However, for the last few decades several
studies have documented the ability of plants, including major crops (Nasholm et al., 2001), to directly
utilize lower molecular weight (Mw) dissolved organic nitrogen (DON) in the form of amino acids and
small peptides (Owen and Jones, 2001; Jones and Murphy, 2007; Ge et al., 2009). This calls for further
studies investigating the importance of organic N uptake in plants, figure 1.
Soil organic N exists predominantly as proteinaceous material, about 40%, (Jan et al., 2009). Proteins
are linear polymers build of monomer units of amino acids, which are linked end to end in peptide
bonds, thereby forming polypeptide chains. Most natural proteins consist of between 50 and 2000
amino acids, typically corresponding to Mw’s between 4 and 544 kDa (Berg et al., 2006). Warren
(2014) illustrated the distribution of DON among size classes and the distribution of DON monomers
among main classes with protein amino acids being a key component of dissolved monomers. It was
pointed out that we have a good understanding of the lower Mw sized class (< 1 kDa), but a poor
understanding (less than five studies) of higher Mw sized classes (> 100 kDa). We know that higher

2
Figure 1. Conceptual figure showing the routes of N flow from higher molecular weight (Mw) dissolved organic
N (DON) into bio-available N. Initially, the large organic N needs to be depolymerized to lower Mw DON, which
either can be directly taken up by plants or be mineralized to inorganic N forms. The lower box shows that we
presently lack knowledge of the proportion of total N uptake occurring in organic form.
Mw organic N constitute a major part of DON (Jones et al., 2012; Warren, 2014), where bound amino
acids are an important component (Jamtgard et al., 2010). Higher Mw DON needs to undergo
depolymerization (Schimel and Bennett, 2004), the process of converting polymers, such as protein
and peptides, into monomers, such as amino acids, in order to make the DON plant available. The
proteolytic activity for large organic N depolymerization is known to be affected by among other soil
pH, active microbial communities, and presence of plants (Godlewski and Adamczyk, 2007;
Sinsabaugh et al., 2008; Vranova et al., 2013). DON may also undergo mineralization, the process of
converting organic N, both polymers and monomers, into CO2 and inorganic N (NH4+ and NO3
-). The
turnover of free amino acids in soil solution ranges from 1 to 12 hours (Jones et al., 2005), whereas the
mineralization of a protein solution, containing compounds with Mw of 65, 75 and 120 kDa, was
approximately 20 fold slower than the mineralization rate of amino acids (Jan et al., 2009). Thus the
present understanding is that depolymerization of higher Mw organic N (Mw > 1 kDa) to lower Mw
organic N (< 1 kDa) is the bottleneck in soil N cycling (Schimel and Bennett, 2004). In the soil, the
depolymerization is mediated by the release of extracellular enzymes from the soil microbial biomass
(SMB) (Burns et al., 2013), and plants (Godlewski and Adamczyk, 2007). The cleavage of the higher
Mw organic N release lower Mw organic N such as amino acids, and short peptides, which to a large
extent are bioavailable and can be used directly by plants and microorganisms (Figure 2).
The interaction between plants, soil and SMB, is a complex system of release and uptake of nutrients.
Each of the nutrient pools can be measured as a concentration, as illustrated by Warren (2014), but
the concentrations itself cannot give us the full story of what is going on in the soil, during
HigherMw DON
LowerMw DON
Plant organic N uptake
Depolymerization
CO2 [g]
Inorganic NNH4
+, NO3-Mineralization
Bio-available N
Plant inorganic N uptake
Organic N
uptake
Inorganic N
uptake
??

3
Figure 2: Conceptual figure showing the overall plant-soil N cycle with the present study focusing on the organic
side to the left where the retention of higher Mw DON (>1 kDa) and depolymerization of this DON to lower Mw
DON (<1 kDa) is investigated.
depolymerization and mineralization of organic matter. The rate at which higher Mw organic N is
turned over in the soil plant system is needed in order to determine the bottleneck (if any) in the
transformation of higher Mw organic N into bioavailable lower Mw DON. When investigating the
turnover of organic N in soil, it is beneficial to use amino acids as the target compounds group due to
the soils high content of proteinaceous material. The best way to follow the turnover of protein is
through stable isotopic probing (SIP) (Dumont and Murrell, 2005). When using SIP a stable isotope is
introduced, in excess amounts, to the system. Typical isotopes used are 13C, 14C and 15N. The movement
of the isotopes can then be followed through the processes by either bulk isotopic analysis or
compound specific isotopic analysis (CSIA). There is a need for developing a suitable amino acid CSIA
protocol, to tackle the challenges associated with hydrolysis and purification of plant and soil samples.
Importantly is also the derivatization, which can influence which amino acids can be analyzed.
1.2. Aim and hypothesis
The overall aim of my PhD project was to investigate the fate of higher Mw DON when it enters a soil
with and without plants. The first objective was to set up a compound specific isotope analysis (CSIA)
to characterize and quantify amino acids in double labeled (15N and 13C) high Mw DON derived from
Soil (micro)
organisms
Soilorganic N
HigherMw DON
LowerMw DON
NO3-
NH4+
Pla
nt N
N2 [g]
N2O [g]
N2O [g]
Pla
nt N
Mobilizing
Immobilizing
Plant flows
Exo-enzymatic
Gasseous emissions
CO2 [g]

4
white clover. The second objective was to investigate the turnover of higher Mw DON in soil with
different management histories. The third objective was to investigate the turnover of higher Mw DON
in a soil with plant growth to determine the influences of the competition between plants and SMB on
the turnover of higher Mw DON and the uptake of N by plants.
The corresponding hypothesis are
1. In cultivated soil the pool of Higher Mw DON represents the bottleneck in the production of plant
available N from soil organic N (Figure 3) (Schimel and Bennett, 2004).
2. Differences in soil pH will affect which microbial communities dominate the decomposition of
DON; at low pH fungi is expected to dominate and at increasing pH the dominating microbial
communities will shift towards bacteria (Rousk and Baath, 2011).
3. The competition between plants and the microbial communities for plant available DON will
increase the turnover of high Mw DON compared to a soil without plants (Godlewski and
Adamczyk, 2007).
4. At low soil pH, organic N turnover is expected to be slower and hence there will be a greater
chance of direct organic N plant uptake as indicated by 13C presence in roots, whereas at higher pH
mineralization will be greater and so will dissolved inorganic 15N (DI15N).
Figure 3: Schematic representation of the amino acid-based constitutes of higher Mw DON, showing the relation
to Mw sizes of free amino acids and amino acids bound in peptides and proteins.

5
2. Method theory
In the following sections, an introduction to the method theory used during the experimental work of
this PhD project is presented. Each section will contain a description on the given analysis technique
and critical reflections on their limitations.
2.1. Stable isotopic probing
We wanted to grasp a picture of the plant derived DON turnover in the plant soil system.
Stable isotopic probing (SIP) techniques were applied in studies of white clover derived dissolved
organic nitrogen (DON) produced from screw pressing triple labeled (13C, 14C, 15N) white clover into
juice. The production of the triple labeled white clover juice is fully described in paper 1 (Enggrob et
al., 2019).
We firstly needed to enrich white clover plants with 13C, 14C and 15N and there are several techniques
that can be used to induce labeling into plants (Wichern et al., 2008), some of which are illustrated in
Figure 4. Atmospheric labeling can be used when it is possible to contain the air around the plants to
be enriched, such as in laboratory or pot experiments, and when the enriched compounds can be made
airborne and available for plant uptake, such as 13CO2 and 14CO2. Soil labeling is another option, in
which the enriched compound is either mixed with the soil before planting or seeding, or the enriched
compound is dissolved and added during irrigation. Soil labeling can be used both in field and in pot
experiments. Any enriched compounds, expected to be available for plant uptake, can be used in soil-
labeling experiments.
Figure 4: Introduction of labeling into white clover occurred for C-tracers via CO2-labeling, and for the N-tracer
via soil N labeling.

6
For the labeling of white clover, we wanted the enrichment to enter the plant as naturally as possible
to ensure a natural distribution throughout the plant. The best way to do that is by continuous labeling
throughout the growth period. I therefore used repeatable atmospheric labeling for the enrichment in
13C and 14C, as 13CO2 and 14CO2 and soil labeling by irrigation with each irrigation to create the
enrichment in 15N with a 3 at% 15N-(NH4)2SO4 solution; details of the labelling procedure are described
in paper 1 (Enggrob et al., 2019). Briefly, from day one, the water used for irrigation contained 3 at%
15N-PK fertilizer. From week 8 and onward, the 13/14CO2 was introduced to the white clover as descried
by (Rasmussen et al., 2008). Within each pot of clover, a beaker containing 5 ml of a saturated solution
of 13C and 14C labeled sodium bicarbonate dissolved in 1M NaOH was placed. The pot was then covered
by a transparent plastic bag and the 13CO2 and 14CO2 was made air born by the addition of 5 ml 2M HCl
to the beaker. After 2 h, the labeling was stopped by removing the plastic bag and discarding the
beaker.
2.2. Bulk isotopic analysis
Bulk isotopic analysis are good to give an overview of the total amount of the isotope in question, in
the particular sample. It is a fast and efficient way to follow the fluxes and pools of enriched
compounds. The analysis itself is not time consuming and it is therefore possible to make time series.
But it also have its limitation, for instance, when analyzing 15N it is not possible to get any information
on the distribution in inorganic an organic compounds without pre-treatment. Neither is it possible to
get any information on whether the compounds of interest are in their original form or to what extent
the compounds are turned over.
When studying a complex system such as the plant soil N system, in which a certain amount of DON is
added to the soil, and the movement of DON through the system over time is what we want to
highlight, then it is not enough just to take a soil sample at the end of the experiment. A time series is
needed, as is a division of the system into sample type such as gas, soil solution and soil samples. Then
it is possible to trace some of the routes the DON goes through in the soil system.
In this study, we used two types of bulk isotopic analysis (1) Liquid Scintillation Counting (LSC) for the
analysis of 14CO2, and (2) Flash Elemental analysis Isotope Ratio Mass Spectrometry for the analysis of
13C and 15N in both soil solution and soil.
2.2.1. 14CO2 analysis by Liquid Scintillation Counter
The mineralization of organic compounds is analyzed as the production of 14CO2 after the addition of a
given 14C-organic compound to soil (Jones, 1999; Owen and Jones, 2001; Jones and Kielland, 2002;
Kemmitt et al., 2008). The microbial mineralization of any organic compound results in the production
of CO2. The production of CO2 can therefore be seen as an indicator of the activity in that given soil. The

7
CO2 production can follow two principal time courses, i.e., with or without a lag phase in the beginning
before the mineralization takes off. A lag phase indicates that, before the microorganisms can utilize
the organic compounds, there needs to be a proliferation (growth) of an initially small population or
the necessary enzymes have to be induced in an existing larger population. No lag phase indicates that
the SMB is immediately able to utilize the organic compound.
In my study, the mineralization of dissolved organic compounds to 14CO2 follows a first order kinetic
decay model (Boddy et al., 2007):
Equation 1: 𝑆 = 𝑆𝑈 + [𝑎 × 𝑒𝑥𝑝(−𝑘 × 𝑡)]
Where S is the 14C label remaining in the soil, SU is the amount of unrecovered 14CO2, k is the
exponential coefficient, the production, a is the respiration constants for the given system and t is time.
This function makes it possible to calculate a half-life time (𝑡½) for the given pool of dissolved organic
compounds:
Equation 2: 𝑡½ =𝑙𝑛(2)
𝑘
It has, however, been suggested by (Boddy et al., 2007; Boddy et al., 2008) that the mineralization
should be described by a double first order kinetic decay model, arguing that the first part describing
the turnover of the added compound to be investigated, and that the second part refers to the turnover
of storage or anabolic procuct from microbial carbon uptake the SMB itself:
Equation 3: 𝑆 = 𝑆𝑈 + [𝑎1 × 𝑒𝑥𝑝(−𝑘1𝑡)] + [𝑎2 × 𝑒𝑥𝑝(−𝑘2𝑡)]
Where a1 is the respiration constant and a2 is the immobilization constant in the SMB (Farrell et al.,
2011).
To analyze the produced 14CO2, it first have to be collected in a liquid form, this is done by introducing
a base trap, containing NaOH, to the system. Once the 14CO2 is trapped, a scintillation cocktail is added
to the system. The Liquid Scintillation Counter (LSC) works by the 14C in the sample sending out
radioactive β particles, which are picked up by the Scintillation cocktail and transformed into a flash of
light, which then are picked up by a counter.
2.2.2. 13C and 15N analysis by Flash Elemental Analyzer
Isotopic ratio mass spectrometer
An Elemental Analyzer can analyze a variety of solid or liquid sample types, and it gives the elements
or isotopic composition of the given sample. Depending on the detector used, it can give either a
qualitative or a quantitative view of the elements or isotopic ratio in the sample. As a detector, we used
both a thermal conductivity detector (TCD) and an isotopic ratio mass spectrometer (IRMS), enabling
us to get both the total amount of N and C, and the delta values δ13C and δ15N. From these data we were
able to calculating the amount of 13C and 15N in the sample.

8
2.3. Compound specific isotopic analysis
The ability of tracking a single compound or compound group through the cycling of organic N in the
plant soil N cycle is a valuable technique when studying the uptake and turnover of specific
compounds. CSIA provides information of both the concentration and the enrichment of the compound
of interest. This makes it possible to follow the changes both in concentration and in enrichment,
whether the compound is turned over or taken up. When doing CSIA, firstly the compound group of
interest must be isolated, doing a purification, secondly the group of compounds must be separated
into individual compounds by chromatography, either liquid chromatography (LC) or gas
chromatography (GC), and thirdly the compound and the isotopes are detected by either a time of
flight mass spectrometer (TOF-MS) or an isotopic ratio mass spectrometer (IRMS). In this project we
analyzed two compound groups, amino acids and phospholipid fatty acid (PLFA) using gas
chromatography combustion isotopic ratio mass spectrometry (GC-C-IRMS).
The GC analysis implies that the compound of interest must be gaseous. For the analysis of amino
acids, this is ensured by derivating the amino acids (see section 3.1) before the analysis and by
adjusting the temperature of the inlet to the GC column. The separation on the GC column is very
important in the GC-C-IRMS analysis because the combustion oven oxidize everything into CO2 and N2.
The separation can be controlled by selecting the right column and adjusting a temperature gradient
over the time of the separation of the compounds of interest. Hereafter the ratio of the 13C/12C and the
ratio of 14N/15N are detected by the IRMS. To be able to detect the N2 resulting from the combustion of
the compound in question, the CO2 must first be removed by leading the gas through a liquid nitrogen
freeze trap, thereby freezing the CO2 solid, and allowing the N2 to be detected. Due to the complete
oxidation of the compounds in the combustion oven, standards for each compound of interest are
necessary for the identification and concentration calculation. Also, to monitor the efficiency of the
sample treatment and the analysis, an internal standard, not representing one of the compounds of
interest, must also be added.
2.3.1. Amino acid analysis
As previously stated, is 40% of soil organic nitrogen bound in protein (Jan et al., 2009), and all proteins
are build from a repertoire of 20 different amino acids. Proteins are too complex to analyze directly,
but rather they are hydrolyzed, thereby breaking the peptide bond, separating them into the building
blocks (i.e., amino acids). Amino acids are relative simple compounds that consist of a central C atom
linked to an amino group, a carboxylic acid group, a hydrogen and a distinctive side chain, which
determine the function of the amino acids (Berg et al., 2006). It therefore stand to reason that to follow
the turnover of higher Mw soil organic N the target compound is amino acid. Therefore, the first

9
objective of my PhD project was to develop a CSIA for the analysis of amino acids bound in plant and
soil samples (see section 3.1 and paper 1 for further details).
2.3.2. Phospholipid fatty acid (PLFA) analysis
An important building block of all cell membranes is phospholipid fatty acid (PLFA). PLFA are the
primary lipids of cellular membranes, consists of hydrophilic head and a hydrophobic tail (Berg et al.,
2006). PLFAs are widely being used as biomarkers for different microbial groups (Frostegard et al.,
1993; Fierer et al., 2003; Stromberger et al., 2012), but one have to be aware that some of the same
biomarkers can be an indicator for different effects (Frostegard et al., 2011). In my PhD project, I was
looking for biomarkers for gram-positive bacteria, gram- negative bacteria and fungi. The soil
microorganisms are crucial for the soil function, however only the active microorganisms are involved
in the ongoing processes (Blagodatskaya and Kuzyakov, 2013). By combining SIP with then PLFA
methods, it ensured the measurement of the activity of the target microbial groups (Knief et al., 2003;
Boschker et al., 2014; Kusliene et al., 2014). The extraction and analysis of the PLFAs of the soil
samples were done as described by Petersen et al. (2002).

10
3. Experimental work
In the following section an experimental overview is given followed by presentation and discussion of key
results.
In order to investigate the fate of higher Mw DON in soils with different management histories, a series
of experiments were carried out. White clover was grown in pots and triple labeled by soil labeling
(15N) and atmospheric labeling (13C, 14C). After harvest, the white clover was juiced by screw pressing,
and the juice was fractionated into Mw sized fractions. Fractions of < 1 kDa, 1-10 kDa, 10-100 kDa, and
> 100 kDa were used for the development of the CSIA method. Fractions of 1-10 kDa, > 10 kDa, 10-30
kDa, 30-100 kDa and >100 kDa were used in soil incubation experiments without plants, whereas only
the >100 kDa sized fraction was used for the experiment with plants.
The experimental work represented three lines of experiments, one for each objectives, eventually
resulting out in three publications.
During the first line of experiments (paper 1), white clover were grown in pots, simultaneously
enriched in 13C, 14C and 15N, as descried in section 2.1. After harvest, both the shoots (including the
stolen) and the roots were screw pressed into shoot and root juice and subsequently fractionated into
four Mw size classes. A CSIA method was developed to analyze the DON for the content and
distribution of amino acids along with the atomic fraction of 13C and 15N. Details of the experimental
work, not described in the paper 1, are detailed in the following sections (3.1).
During the second line of experiments, Mw sized fractions of DON solutions were incubated with soils
of different management histories, in order to investigate the influences of different soil and microbial
properties on the turnover of DON. Different Mw sized fractions of DON solutions were used to
investigate the bottleneck of the organic nitrogen turnover described by Jan et al. (2009), and
illustrated in Figure 3. Doing the experiment, the first results, led us to test not only two Mw sized
fractions, 1-10 kDa and > 10 kDa, but a total of five Mw sized fractions: 1-10 kDa, >10 kDa, 10-30 kDa,
30-100 kDa and >100 kDa.
During the third line of experiments the highest Mw DON fraction (>100 kDa) was incubated with soil
in which maize were growing, i.e., to investigate how the competition between plants and the SMB will
affect the turnover of higher Mw DON and the plant uptake of ON.
3.1. Developing the CSIA for amino acid (paper 1)
Amino acids, as mentioned in section 2.3.1, consists of a central C atom linked to an amino group, a
carboxylic acid group, a hydrogen and a distinctive side chain. The most common method used for the
analysis of amino acids is GC-C-IRMS (Fountoulakis and Lahm, 1998; Corr et al., 2007; Larsen et al.,
2013; Yarnes and Herszage, 2017). Before the amino acids can be analyzed by gas chromatography

11
they have to be made more volatile, so they become airborne and available for gas separation. The
transformation to a more volatile compound is done by the addition of a secondary functional group to
the amino group and the carboxylic acid group of the amino acid. This process is called derivatization.
To ensure a proper separation on the gas chromatograph, a proper column and temperature gradient
must be adjusted. Finally, analyzing proteinaceous material in a natural sample requires hydrolysis to
release the amino acids from the peptide bonds, and purification of the sample to eliminate
contaminators. The choice of hydrolysis method and the purification of the natural samples are fully
described in paper 1 (Enggrob et al., 2019).
3.1.1. Tuning the GC-C-IRMS analysis
The goal was to achieve the best possible separation of multiple amino acids in the shortest possible
time. Several parameters can influence the efficiency of the gas chromatograph performances, most of
which are controlled by the GC software (Isodat 3.0). Two important parameters are always adjusted
to fit the particular analysis: the column and the temperature gradient controlling the temperature of
the column. Based on the literature (Corr et al., 2007), the VF‐23m capillary column (60 m× 0.25 mm
i.d. × 0.25 μm film thickness; AgilentTechnologies, Amstelveen, The Netherlands) was chosen. Corr et
al. (2007) also inspired the initial temperature gradient which starts at a temperature of 40°C; then
the temperature was first raised to 120°C over 4 min, secondly to 190°C over 23 min, and finally to
250°C over 12 min and held for 20 min.
Amino acid standards, both single standards and mixed standards containing 21 amino acids, were
used to test the temperature gradient.
Two derivatization methods, based on (Corr et al., 2007; Larsen et al., 2013), were evaluated for the
analysis of amino acids. These were N-acetyl methyl esterification (NACME) and N-acetyl isopropyl
esterification (NAIP) as depicted in Figure 5. The derivatization procedures are described in paper 1
Figure 5. Step by step structural information of the two amino acid derivatization methods, i.e. (A) the N-acetyl
methyl esterification, and (B) N-acetyl isopropyl esterification.

12
(Enggrob et al., 2019) but in brief, the two derivatization methods differ only in the use of methanol in
the NACME method and the use of isopropanol in the NAIP method.
Two series of standards, one for each derivatization method, were subject to GC-C-IRSM analysis to
help optimizing the temperature gradient to improve separation of the amino acids. The final
temperature gradient was as follows: initial temperature were set to 90°C and held for 1 min, secondly
the temperature were raised to 120°C over 2 min, thirdly the temperature were raised to 250°C over
43 min and held at 250°C for 45 min.
With the NACME derivatization method we were able to obtain repeatable signals for 10 out of 21
amino acids (Table 1) namely nor valine (ISTD), nor leucine (ISTD), threonine, aspartic acid, Serine,
glutamate, phenylalanine, hydroxyproline, tyrosine, and lysine; with lysine eluated as the last after
5404 s. Despite repeated attempts, we were not able to obtain repeatable stable derivatives from the
NACME derivatization of alanine, valine, glycine, leucine, iso leucine, proline, aspargine, glutamine,
methionine, cysteine or tryptophan in single or mixed standards.
Table 1: Retention times of amino acids obtained with the NACME or NAIP derivatization methods, respectively
(ISTD = internal standard).
In contrast, were we able to obtain separation and stable retention time for all 21 amino acids in single
standards with the NAIP method (Table 1). Again, lysine eluted as the last with a retention time of
5181 s. However, in mixed standards, methionine and cysteine disappeared, whereas proline +
NACME Amino
acid
Retention time individual standards
[s] NAIP
Amino acid
Retention time individual standards
[s]
Retention time mixed standards [s]
1 Ala 1232,3 1230
2 Val 1360,2 1360
1 AvlISTD 1422 and 1660 3 AvlISTD 1438,5 1444
4 Gly 1443,8 1444
5 Leu 1465,3 1464
6 Ile 1477,6 1478
2 Nle ISTD 1783 7 NleISTD 1556,2 1554
8 Pro 1874 1886
3 Thr 2069 9 Thr 1883 1886
10 Asn 1996,8 2000
4 Asp 2207 11 Asp 2001 2000
5 Ser 2215 12 Ser 2058 2051
6 Glu 2451 13 Glu 2197 2190
14 Gln 2295,9 2297
15 Met 2347,3 -
7 Phe 2512 16 Phe 2434 2436
17 Cys 2443 -2445 -
8 Hyp 2593 18 Hyp 2523,9 2523
19 Trp 2840,3 2979
9 Tyr 3429 20 Tyr 3553,6 3589
10 Lys 5405 21 Lys 5188,6 5181

13
threonine (Pro/Thr) eluted simultaneously with retention times of 1886 s and aspargine + aspartic
acid (Asx) eluted simultaneous with retention times of 2000 s.
3.1.2. Key findings
When performing acid hydrolysis on a sample it always give rise to some uncertainty in whether the
hydrolysis is complete or insufficient. We therefore tested the recovery of Bovine Serum Albumin
(BSA) from two acidic hydrolysis methods (paper 1) and found a recovery of 35.6% (± 1.3%) for
standard hydrolysis and 31.8% (± 1.5%) for fast hydrolysis (data shown as mean ± standard error).
These results were in line with previously reported recoveries of approximately 30% (Fountoulakis
and Lahm, 1998). We also found that there is a high risk of losing material, especially from the lower
Mw fraction, when performing acid hydrolysis. Figure 6 shows the measured concentration of amino
acids after hydrolysis of the < 1 kDa fraction versus the measured concentration of amino acids in the
unhydrolyzed < 1 kDa fraction (i.e., representing the free amino acids). We expected that the
concentration of all amino acids would increase after the hydrolysis, but instead the concentration of
seven of the amino acids was significantly lower after the hydrolysis. Importantly, even though the
hydrolysis affected the amino acid concentrations in the <1 kDa fraction, it did not affect the isotopic
signature (13C and 15N) of the amino acids (Figure 7). Hence, tracing the fate of labeled amino acids is
not compromised, which if further supported by the similar isotopic signature pattern of amino acids
bound in the higher Mw sized fractions (Figure 8).
Figure 6: The content of free amino acids (AA) versus bound amino acids (AA) in the Mw size fraction <1 kDa for
white clover shoot juice using the standard hydrolysis method (n = 3).
Free AA in <1kDa fraction(ng AA/g fresh material)
0 20 40 60 80 100 120 140
Bo
un
d A
A i
n <
1k
Da f
racti
on
(ng
AA
/g f
resh
mate
rial)
0
20
40
60
80
100
120
140Ala
Val
Gly
Leu
Ile
Pro/Thr
Asx
Ser
Glu
Gln
-
Phe
Tyr
Lys
1:1 line

14
Figure 7: The atomic fraction in free amino acids (AA) versus bound amino acids (AA) in the Mw size fraction <1
kDa for (A) 13C in shoot, and (B) 15N in shoot juice of experimentally labeled white clover (n = 3).
Figure 8: Example of the 13C atomic fraction of amino acids in white clover shoot juice for different Mw size
fractions: free amino acids (blue circle), amino acids bound in 1-10 kDa (yellow triangle up), amino acids bound
in 10-100 kDa (green square), and amino acids bound in >100 kDa (orange diamond). For free amino acids both
glutamate and glutaminen were measured (glutamate omitted in this figure), whereas in the hydrolyzed Mw size
fractions >1 kDa glutamate and glutaminen is reported as Glx (n=3). Asterisks indicate significant differences in
the obtained atomic fraction. Double asterisks indicate no normal distribution.
A
13C in free AA in <1kDa fraction
(13
C atomic fraction)
0.00 0.06 0.08 0.10 0.12
13C
in
bo
un
d A
A i
n <
1kD
a f
racti
on
(13C
ato
mic
fra
cti
on
)
0.00
0.06
0.08
0.10
0.12 B
15N in free AA in <1kDa fraction
(15
N atomic fraction)
0.000 0.012 0.014 0.016 0.018
15N
in
bo
un
d A
A i
n <
1kD
a f
racti
on
(15N
ato
mic
fra
cti
on
)
0.000
0.012
0.014
0.016
0.018
Ala
Val
Gly
Leu
Ile
Pro/Thr
Asx
Ser
Glu
Gln
Glx
Phe
Tyr
Lys
1:1 line
0.00
0.02
0.04
0.06
0.08
0.10
Ala*
Val*
Gly*
Leu
Ile**
Pro/Thr*
Asx*
Ser
Gln/Glx*
Phe*
Lys*
Tyr
Shoot free Shoot 1 -10 kDa Shoot 10-100 kDa Shoot >100 kDa
15
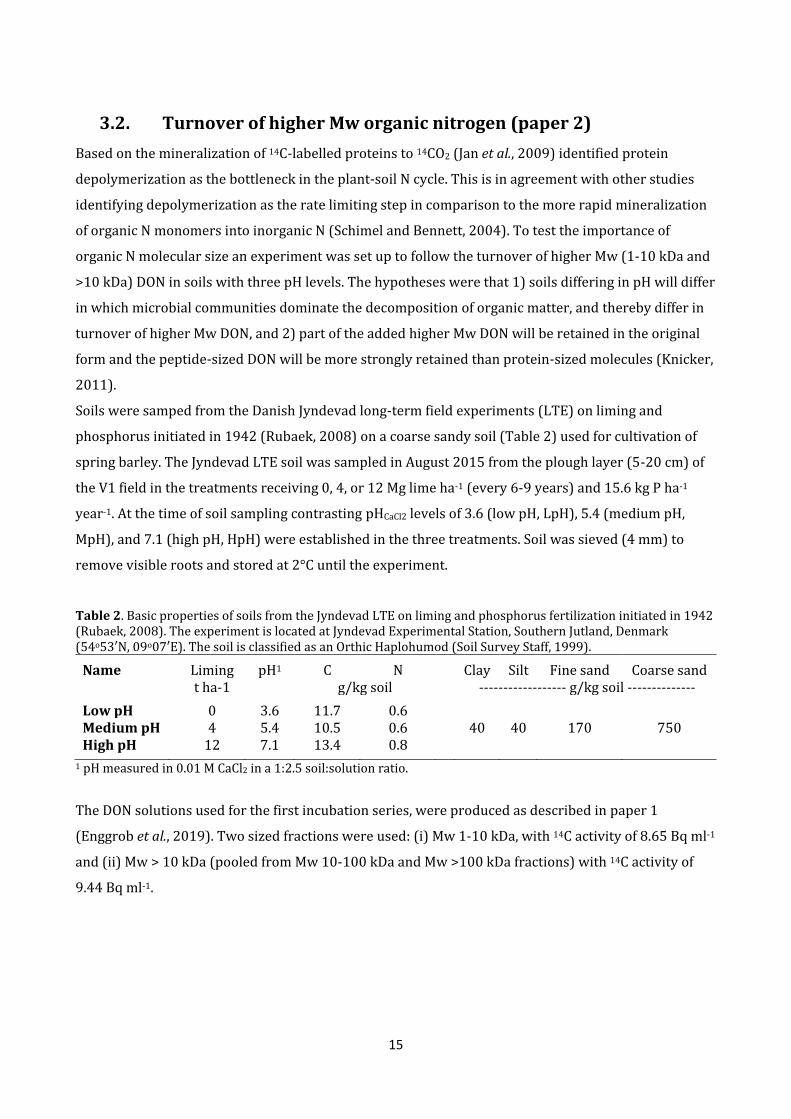
3.2. Turnover of higher Mw organic nitrogen (paper 2)
Based on the mineralization of 14C-labelled proteins to 14CO2 (Jan et al., 2009) identified protein
depolymerization as the bottleneck in the plant-soil N cycle. This is in agreement with other studies
identifying depolymerization as the rate limiting step in comparison to the more rapid mineralization
of organic N monomers into inorganic N (Schimel and Bennett, 2004). To test the importance of
organic N molecular size an experiment was set up to follow the turnover of higher Mw (1-10 kDa and
>10 kDa) DON in soils with three pH levels. The hypotheses were that 1) soils differing in pH will differ
in which microbial communities dominate the decomposition of organic matter, and thereby differ in
turnover of higher Mw DON, and 2) part of the added higher Mw DON will be retained in the original
form and the peptide-sized DON will be more strongly retained than protein-sized molecules (Knicker,
2011).
Soils were samped from the Danish Jyndevad long-term field experiments (LTE) on liming and
phosphorus initiated in 1942 (Rubaek, 2008) on a coarse sandy soil (Table 2) used for cultivation of
spring barley. The Jyndevad LTE soil was sampled in August 2015 from the plough layer (5-20 cm) of
the V1 field in the treatments receiving 0, 4, or 12 Mg lime ha-1 (every 6-9 years) and 15.6 kg P ha-1
year-1. At the time of soil sampling contrasting pHCaCl2 levels of 3.6 (low pH, LpH), 5.4 (medium pH,
MpH), and 7.1 (high pH, HpH) were established in the three treatments. Soil was sieved (4 mm) to
remove visible roots and stored at 2°C until the experiment.
Table 2. Basic properties of soils from the Jyndevad LTE on liming and phosphorus fertilization initiated in 1942 (Rubaek, 2008). The experiment is located at Jyndevad Experimental Station, Southern Jutland, Denmark (54o53′N, 09o07′E). The soil is classified as an Orthic Haplohumod (Soil Survey Staff, 1999).
Name Liming pH1 C N Clay Silt Fine sand Coarse sand t ha-1 g/kg soil ------------------ g/kg soil --------------
Low pH 0 3.6 11.7 0.6 Medium pH 4 5.4 10.5 0.6 40 40 170 750 High pH 12 7.1 13.4 0.8
1 pH measured in 0.01 M CaCl2 in a 1:2.5 soil:solution ratio.
The DON solutions used for the first incubation series, were produced as described in paper 1
(Enggrob et al., 2019). Two sized fractions were used: (i) Mw 1-10 kDa, with 14C activity of 8.65 Bq ml-1
and (ii) Mw > 10 kDa (pooled from Mw 10-100 kDa and Mw >100 kDa fractions) with 14C activity of
9.44 Bq ml-1.

16
3.2.1. Incubation experiment
The micro lysimeters were constructed from the insert to a 50 mL centrifugal filter tube (Macrosep®
Advance, Pall Corporation, Ann Arbor, MI, USA) as described in paper 2 (Figure 9). The micro-
lysimeters were added 12 g of field moist soil, which was gently packed by tapping on the insert unit.
The incubation chambers were constructed from 1 L glass jars, where the micro-lysimeter was placed
together with a base trap containing 1 ml NaOH (1 M), for trapping any produced CO2, and a beaker
containing 2 ml water to avoid soil drying.
Figure 9:. Micro-lysimeter setup with the soil packed in an insert unit fitting 50 ml centrifugal tubes, which
allows rapid sampling of soil solution via centrifugation. Micro-lysimeters were constructed using the insert unit
from the 50 ml Macrosep® centrifugal tubes (Pall Coorporation, Ann Arbor, MI, USA) after removal of the
vertical filter-piece. Constructing micro-lysimeters in the insert-unit allowed rapid sampling of soil solution via
centrifugation and the use of a soil quantity great enough to conduct multiple analyses of both soil and soil
solution after treatments with triple-labeled DON. The micro-lysimeters were packed from below of a glass
microfiber filter (Whatman GF/A filter, 25 mm, GE Healthcare Life Sciences), a piece of silk organza cloth, and
another glass microfiber filter. On top, 7 g of purified sea sand (0.1 - 0.315 mm, analytical grade, Merck KGaA,
Darmstadt, Germany) was packed by adding 5 ml of water followed by centrifugation for 5 minutes at 5000g.
The micro-lysimeters were added 12 g of field moist soil, which was gently packed by tapping on the insert unit.
The incubation started with the addition of 2.0 ml DON solution to the micro-lysimeter. As a control
treatment, 2.0 ml water was added instead of the DON solution.
The micro-lysimeters were incubated at room temperature (22°C). Four series of micro-lysimeter
incubations were prepared aiming at final destructive sampling after 1 hour, 1 day, 7 days and 14
days, respectively. The base trap to collect 14CO2 was sampled after 1 hour and 1 day for the 1 hour and
1 day treatments, respectively, and at days 1, 4 and 7 for the 7 days treatment and day 1, 4, 7, and 14
after start of incubation for the 14 days treatment. The resulting mineralization curves for the 14 days
incubation are shown in Figure 10.
Upon termination after 1 hour, 1, 7, and 14 days, the micro-lysimeters were first added 8 ml of water
and centrifuged for 5 minutes at 5000 g, followed by addition of 10 ml of water with repeated
Insert unit setup:
- 25 mm soil layer (12 g fresh weight)- 10 mm sea sand layer (7 g dry weight)- GF/A filter- Disk of silk organza cloth- GF/A filter

17
centrifugation, where after the two solutions were pooled to give one sample of 20 ml of soil solution
washed with water. Then, 10 ml of 1 M KCl was added with subsequent centrifugation, and the
addition of 10 ml KCl and centrifugation was repeated to give a 20 ml pooled sample of soil solution
washed with KCl. The soils were hereafter removed from the micro-lycimeter and frozen before
further analysis. The water and KCl soil solutions were immediately filtrated using 0.45 µm Macrosep
centrifugal tubes (Pall Corporation, New York, USA) with centrifugation for 5 minutes at 5.000 g,
where after two times 250 µl was taken from each sample; one was directly added 4 ml scintillation
cocktail (OptiPhase HiSafe3, PerkinElmer, Waltham, MA, USA), the other was added 250 µl 1 M
HCl and left for 1 hour to allow any dissolved CO2 to escape before addition of 4 ml scintillation
cocktail. The LSC analysis of the KCl soil solution showed no 14C activity and are therefore not shown,
and have not undergoing any other analysis. The water soil solution, from here referred to as the soil
solution, were freeze-dried, dissolved in 500 µl milliQ water (Synergy® System, Millipore,
Molsheim, France) and transferred into individual tin capsuls and analyzed by Flash EA. The results
are shown in Figure 11.
Figure 10: Mineralization of higher Mw labeled organic N to 14CO2 in Jyndevad soils at three pH CaCl2 levels: low
at pH 3.6, medium at pH 5.4, and high at pH 7.1. (A) the 1-10 kDa organic N fraction, and (B) the >10 kDa fraction.
There were no statistical differences among soil pH levels in accumulated 14CO2 after 14 days as shown by ‘ns’
next to the curves (n = 4).
A
0
10
20
30
40
50
ns
B
Time (days)
0 2 4 6 8 10 12 14
Min
era
liza
tio
n t
o C
O2
(ac
cu
mu
late
d 1
4C
O2 o
f a
dd
ed
14C
, %
)
0
10
20
30
40
50
Low pH (3.6)
Medium pH (5.4)
High pH (7.1)
ns

18
The mineralization curves showed a total mineralization of 42-45% and 33-36% for the Mw 1-10 kDa
and the Mw >10 kDa, respectively, but no differences between the soil pH levels. The differences in the
mineralization between the two DON fractions were smaller than we had expected based on the
mineralization curves of protein solutions showed by Jan et al. (2009).
Figure 11: The temporal changes in soil solution 13C and 15N content (in % of added) for (A) the 1-10 kDa, and
(B) the >10 kDa organic N fraction (n = 4).
The Flash EA data from the soil solution revealed an interesting pattern for the relation between 13C
and 15N over time (Figure 11). The percent of added 13C and 15N remaining in soil solution, i.e. still
dissolved, after 1 hour and 1 day, respectively, showed a parallel loss of both 13C and 15N from the soil
solution over time. This correlate with the measured mineralization for both DON fractions. At day 7
and 14, an increase in 15N was observed whereas 13C was only present at low levels in the soil solution.
The interpretation of the data led to the design of a conceptual figure (Figure 12). In this figure, the
A
0 10 20 30 40 50
0
10
20
30
40
50
B
N from organic N in soil solution (% 15
N of added)
0 10 20 30 40 50
C f
rom
org
an
ic N
in
so
il s
olu
tio
n (
%1
3C
of
ad
de
d)
0
10
20
30
40
50 LpH 1 hour
LpH 1 day
LpH 7 days
LpH 14 days
MpH 1 hour
MpH 1 day
MpH 7 days
MpH 14 days
HpH 1 hour
HpH 1 day
HpH 7 days
HpH 14 days

19
parallel loss of 13C and 15N in percent of added from 1 hour to 1 day illustrate the dissipation of the
added dissolved compounds whereas the increase of 15N in percent of added indicate mineralization of
the added compound to inorganic N. These observations were supported by the data from the flash EA
analysis of the soil (data not shown).
Figure 12: Conceptual figure of development in soil solution 13C and 15N content, where first after 1 hour the %
of added remaining in soil solution is the compounds not-sorbed (i.e. still dissolved), second the parallel loss of 13C and 15N show dissipation of the added compounds (still dissolved or in equilibrium with the soil solution),
thirdly the loss of 13C with 15N still present (or even increasing) indicates mineralization of the added compound
to inorganic N.
3.2.2. Three extra sized fractions
Based on the relatively high 14CO2 respiration from the >10 kDa fraction, we wondered if the
bottleneck in organic N mineralization would lie somewhere within this Mw sized fraction. Therefore
the >10 kDa Mw sized fraction was further fractionated into three pools, Mw 10-30 kDa, Mw 30-100
kDa and Mw >100 kDa, and the incubation experiment was repeated for the three different soil pH
levels for two times: 1 hour and 14 d. The incubation and sampling of the Mw sized fractionated DON
(10-30 kDa, 30-100 kDa and >100 kDa) were performed as explained above.
From the 1 hour time series the soil and soil solution were analyzed by Flash EA to investigate the
immediate sorption of the DON solutions to the soil. From the 14 days time series, the base trap to
collect 14CO2 was changed after day 1, 4, 7 and 14, and a mineralization curve for each DON solution
were calculated (Figure 13). From the 14 days incubation experiment, both the soil and soil solution

20
were analyzed by Flash EA as described above. The total 13C and 15N from the Flash EA analysis of the
soil, calculated as percent of added 13C or 15N are listed in Table 3.
Figure 13: Mineralization of higher Mw labeled organic N to 14CO2 after 14 days in Jyndevad soils at three pH
CaCl2 levels: low at pH 3.6, medium at pH 5.4, and high at pH 7.1 of (A) the Mw 10-30 kDa, (B) the Mw 30-100
kDa, and (C) the Mw >100 kDa organic N fractions. Statistical differences are marked by different letter next to
the curves (n = 4).
The relation between the accumulated amount of respired 14CO2, calculated as percent of added, and
the amount of 13C and 15N, also calculated as percent of added, of the Flash EA of the soil solution from
the 1 hour time series, were used to illustrate the negative correlation between the immediate
sorption and the mineralization of each Mw sized fractions. Both the mineralization curve and the
immediate sorption are described in paper 2 and the immediate sorption is displayed in Figure 14.
A
0
10
20
30
40
50
B
Min
era
lizati
on
to
CO
2 (
accu
mu
late
d 1
4C
O2 o
f ad
ded
14C
, %
)
0
10
20
30
40
50
Low pH (3.6)
Medium pH (5.4)
High pH (7.1)
C
Time (days)
0 2 4 6 8 10 12 14
0
10
20
30
40
50
b
a
a
ns
bab
a

21
Table 3. Recovery (% of added) of 13C and 15N in Jyndevad soils after 14 days of incubation. Data is given as
mean ± standard error (n = 4). Statistical differences among organic N fraction within each soil is show with
different letter; no significant differences were found across soils within each organic N fraction.
Fraction 1-10 kDa 10-30 kDa 30-100 kDa >100 kDa
-------------------- 13C recovery (% of added) --------------------
Low pH 25.3 ± 0.8 A 28.6 ± 1.0 B 31.0 ± 1.7 B 44.1 ± 3.1 B Medium pH 33.3 ± 1.0 A 31.7 ± 0.7 A 26.9 ± 1.3 A 44.8 ± 1.6 A High pH 36.9 ± 1.1 A 34.5 ± 1.3 A 33.4 ± 1.1 A 43.6 ± 1.4 B
-------------------- 15N recovery (% of added) ---------------------
Low pH 19.9 ± 0.7 A 18.1 ± 0.6 A 23.5 ± 1.0 B 23.8 ± 2.1 B Medium pH 28.5 ± 0.3 A 23.7 ± 0.5 B 23.0 ± 0.8 C 28.3 ± 1.2 D
High pH 34.2 ± 0.9 A 28.4 ± 1.5 B 32.5 ± 1.8 C 29.6 ± 0.8 A
Figure 14. Correlation between organic N sorption after 1 hour and accumulated 14CO2 after 14 days for (A)
sorption of 13C in the added organic N fractions and (B) sorption of 15N in the added organic N fractions (n = 4).
As described in paper 2, the release of 14CO2 follow a first order kinetic decay model, and statistical
analyses showed that there for some Mw sized fractions was an effect of soil pH. But what especially
comes to mind when looking at the mineralization curve is the clear reduction in accumulated
mineralization from Mw sized fraction 10-30 kDa to the Mw sized 30-100 kDa, indicating that the
bottleneck lies within these two fractions depending on soil pH level. From the data displayed in Table
3 it was concluded that a significant amount of both 13C and 15N remains in the soil after washing with
water, but it is unknown whether the DON are retained in its original form due to sorption to the soil
surface or has been transformed during uptake in the SMB.
A
Sorption of organic N
(13
C retained after 1 hour, %)
0 20 40 60 80 100
Min
era
lizati
on
of
org
an
ic N
to
CO
2
(accu
mu
late
d 1
4C
O2 a
fter
14 d
ays,
%)
0
10
20
30
40
50B
Sorption of organic N
(15
N retained after 1 hour, %)
0 20 40 60 80 100
Low pH
Medium pH
High pH
1-10 kDa
10-30 kDa
30-100 kDa
>100 kDa

22
To investigate to what extent the DON was retained in the soil as the original compounds, the soils
incubated with both the Mw sized 1-10 kDa well below the bottleneck and the Mw sized >100 kDa well
above the bottleneck were selected for further analysis by amino acid CSIA.
3.2.3. The amino acid CSIA of the soil samples
The amino acid CSIA of the two DON solutions was conducted as described in Enggrob et al. (2019).
The procedure for soil samples with complex matrix was developed and optimized during the PhD
project. In the original protocol (Paper 1), after the addition of internal standard, the solution was
immediately transferred to a polypropylene column filled with 1 g Dowex 50WX8 cation exchange
resin. In the optimized protocol, the samples were first freeze dried before being dissolved in 1 ml 0.01
M HCl, and then the sample was transferred to a polypropylene column filled with 2 g Dowex 50WX8
cation exchange resin. This single change to the purification protocol proved to be sufficient to ensure
the analysis of the wanted amino acids.
The second challenge was to find an adequate sample mass to raise analytical results above limit of
detection (LOD), calculated in paper 1. By using too much sample, there is a risk of overload the resin
in the polypropylene column and thereby loosing material. If the concentration in the samples is too
high there is a risk to end up outside the range of the standard curve and the internal standard, and
thereby not be able to calculate the concentration of the amino acid in the samples correctly. Another
risk is to overload the sensitive analytical equipment and thereby contaminating the system, which
again makes it impossible to calculate a valid concentration. However, the sample mass must not be
too small either, due to the fact that the LOD of the N analysis is much lower than that of the C analysis.
The C:N ratio in the derivatizied amino acids were between 6:1 and 14:1. The compromise was to have
an amount of soil containing enough N to raise well above LOD, but not higher than the GC column and
the combustion oven could handle with no to minimum wear and tear. The critical point was risking to
overload and contaminate the IRMS detector, which I avoided by making an analytical dilution before
the detector. This secured that I could use the same derivatized soil sample for both the 13C and the 15N
amino acid analysis. The result obtained from the amino acid CSIA are shown in Figure 15.
3.2.4. Evaluating the amino acid CSIA results
First of all we compared the concentration of amino acids across soils with and without the addition of
organic N. We wanted to make sure that we were monitoring a natural turnover of organic N and not a
system overloading with organic N. We found that there were no significant differences in the
concentration of individual amino acids in soil with or without the addition of organic N.

23
Looking in to the distribution of 13C and 15N within the amino acids after the incubation of 14 d, (Figure
15), we found that across all pH levels and organic N fractions, the lowest recoveries of individual
amino acids (leucine, lysine, phenylalanine) were close to zero, meaning that the added organic N
Figure 15 Bound amino acids remaining in individual amino acids from the peptide-sized (1-10 kDa, a-c) and
protein-sized (>100 kDa, d-f) organic N in the (a,d) low, (b, e) medium, and (c, f) high pH Jyndevad soils.
Significant differences are marked by an asterisk; a double asterisk indicates no 15N data; ‘nn’ indicate no normal
distribution. Amino acids are organized from left on right with increasing steps in their biosynthesis. The amino
acids: asparagine and aspartate (Asx), glutamine and glutamate (Glx), and Proline and Threonine (Pro/Thr) elute
together in the GC-C-IRMS analysis of acid hydrolyzed samples (n = 4).
compounds were not retained in their original form, but had been decomposed. The recovery levels
across individual amino acids were between 0 and 20% for the 15N tracer and between 1 and 30% for
the 13C tracer. The 13C and 15N decoupling, especially in the 1-10 kDa in all soil, further lend support to
microbial decomposition of the added organic N compounds. Thus, in spite of the pronounced sorption
to the soil of the added organic N compounds (Figure 15 d-f), the organic N was not protected against
microbial decomposition.
3.2.5. Confirming the results using different LTE soils
To ensure that our findings could be generalized to other soil types, soil from Askov LTE on animal and
mineral fertilizer were included in the experiment, and the incubations for 1 hours and 14 days were
repeated for the >100 kDa fraction.
The Askov LTE on animal manure and mineral fertilizers was initiated in 1894 (Christensen et al.,
2006) on sandy loam soil used for arable crop rotations (Table 4). Soil was sampled from the plough
layer (5-20 cm) of the treatments designated unfertilized, 1½ NPK, and 1½ AM treatments of the B3
a
Bo
un
d a
min
o a
cid
s r
em
ain
ing
(%
of
ad
de
d)
0
10
20
30
40
13C
15N
b c
d
Ala
As
x
Glx
Se
r
Gly
Pro
/Th
r
Va
l
Le
u
Lys
Ph
e
0
10
20
30
40e
Ala
As
x
Glx
Se
r
Gly
Pro
/Th
r
Va
l
Le
u
Lys
Ph
e
f
Ala
As
x
Glx
Se
r
Gly
Pro
/Th
r
Va
l
Le
u
Lys
Ph
e
*
**
***
* **
*
*
**
* *
*
*
** *
**
*
* * *nn
* **
** **
*
nn
Low pH soil Medium pH soil High pH soil
1-1
0 k
Da
>1
00
kD
a

24
field. Annually, the 1½ NPK and 1½ AM treatments has received on average 150 kg total-N, 30 kg P
and 120 kg K ha-1 in mineral fertilizer and animal manure (slurry since 1974), respectively. All soils
were sieved (4 mm) to remove visible roots and stored at 2°C until the incubation experiment in
October 2015. The sampling and analysis were conducted as described for the Jyndevad LTE, and the
corresponding results are shown in Figure 16.
Table 4. Basic properties of soils from the Askov LTE on animal manure and mineral fertilizers initiated in 1894. The experiment is located at Askov Experimental Station, Southern Jutland, Denmark (55o28′N, 09o07′E). The soil is classified as an Ultic Hapludalf (Soil Survey Staff, 1999).
Name pH1 C N Clay Silt Fine sand Coarse sand g/kg soil ------------------ g/kg soil --------------
Unfertilized 6.6 11.1 0.9 NPK fertilizer 6.2 12.9 1.0 100 120 430 350 Animal Manure 6.4 13.4 1.2
1 pH measured in 0.01 M CaCl2 in a 1:2.5 soil:solution ratio.
Figure 16: Fate of the >100 kDa organic N fraction in Askov soil with three fertilizer treatments: UNF is
unfertilized since 1894, NPK is mineral fertilizers since 1894, and AM is animal manure since 1894. (a)
Mineralization to 14CO2, (b, c) correlation between sorption of organic N after 1 hour and accumulated 14CO2 after
14 days with data from the Askov soils inserted in the findings from the Jyndevad soils, and (d-f) the remaining 15N and 13C in bound amino acids after 14 days of incubation for the (d) unfertilized, (e) mineral fertilized, and (f)
animal manure fertilized soils. Significant differences (panels d, e, f) are marked by an asterisk, ns indicate no
Significant differences (a) and nn indicate no normal distribution (n = 4).
Min
era
liza
tio
n o
f o
rga
nic
N t
o C
O2
(14C
O2 o
f a
dd
ed
14C
, %
)
a
Time (days)
0 2 4 6 8 10 12 14
0
10
20
30
40
50
Unfertilized (UNF)
Mineral fertilizer (NPK)
Animal Manure (AM)
ns
b
Sorption of organic N
(13C retained after 1 hour, %)
0 20 40 60 80 100
UNF
NPK
AM
c
Sorption of organic N
(15N retained after 1 hour, %)
0 20 40 60 80 100
UNF
NPK
AM
d
Ala
Asx
Glx
Ser
Gly
Pro
/Th
r
Val
Leu
Lys
Ph
e
Bo
un
d a
min
o a
cid
s r
em
ain
ing
(%
of
ad
de
d)
0
10
20
30
40
50
13C 15N
e
Ala
Asx
Glx
Ser
Gly
Pro
/Th
r
Val
Leu
Lys
Ph
e
f
Ala
Asx
Glx
Ser
Gly
Pro
/Th
r
Val
Leu
Lys
Ph
e
*
nn
*
*
*
* *
* **
*
* * **
*
*
nn

25
First of all the mineralization of >100 kDa organic N to 14CO2 in Askov soil are in the same range as for
the mineralization of >100 kDa organic N to 14CO2 in Jyndevad soil, but there was no difference across
fertilizer treatments (Figure 16a). Secondly, the sorption of both 13C and 15N matches the negative
correlation found for the incubation of the Jyndevad soil across Mw sized organic N, (Figure 16b and
c). Thirdly, bound amino acids remaining in the soil after 14 days incubation shows the same pattern
in distribution of amino acids as from the 14 days incubation of Jyndevad soil. The decoupling of 13C
and 15N, together with the decrease proportions remaining of amino acids as they increase in
complexity supports the incorporation of organic N by microbial cells (Figure 16 d-f).
3.2.6. The PLFA CSIA of the soil samples
To find out which SMB groups benefits from the incorporation of organic N, incubated soils, both from
Jyndevad LTE and Askov LTE, were analyzed for their content, distribution and 13C enrichment of
PLFA.
The PLFA CSIA analysis itself were conducted by the Stable isotope service lab., Department of Biology,
Lund University, Sweden. The preparation, extraction and derivatization of the PLFA from the soil
samples were performed as described by Petersen and Klug (1994); Petersen et al. (2002) , where 2.5
g freeze-dried soil was used to isolate phospholipids by a Bligh-Dyer single phase extraction followed
by a solid–phase extraction on silicic acid columns and an alkaline transesterification. The SMB
benefitted from the addition of organic N, especially in low pH soil and for all Askov soils. Surprisingly,
we found no substantial increase in the fungal biomarkers in the low pH soil after the addition of
organic N, instead we saw an increase in gram-negative and gram-positive bacteria in low and high pH
soil, and across all Askov soils (Figure 17). This in particular in the Jyndevad LTE low pH soil and all
Askov LTE soils. Gram-positive bacteria and fungi are typically said to contribute to the degradation of
complex compounds due to their ability to facilitate exo-enzymes, whereas gram-negative bacterial
generally decompose lower Mw compounds (Madigan et al., 2018). Looking into the specific activity of
the PLFA Figure 18 for each organic N, all microbial groups were enriched with 13C after 14 days of
incubation. Bacteria dominated the specific activity across all soils from the addition of both the 1-10
kDa and >100 kDa fractions. The addition of > 100 kDa to both Jyndevad LTE and Askov LTE showed
similar patterns with gram-positive bacteria having the highest and fungi the lowest activity. Even
though low pH have been shown to reduce bacterial activity (Rousk and Baath, 2011; Cline and Zak,
2015), this was not the case for the addition of > 100 kDa to the Jyndevad LTE, where both total PLFA
(Figure 17) and the specific activity (Figure 18) showed bacterial dominance across the pH gradient.
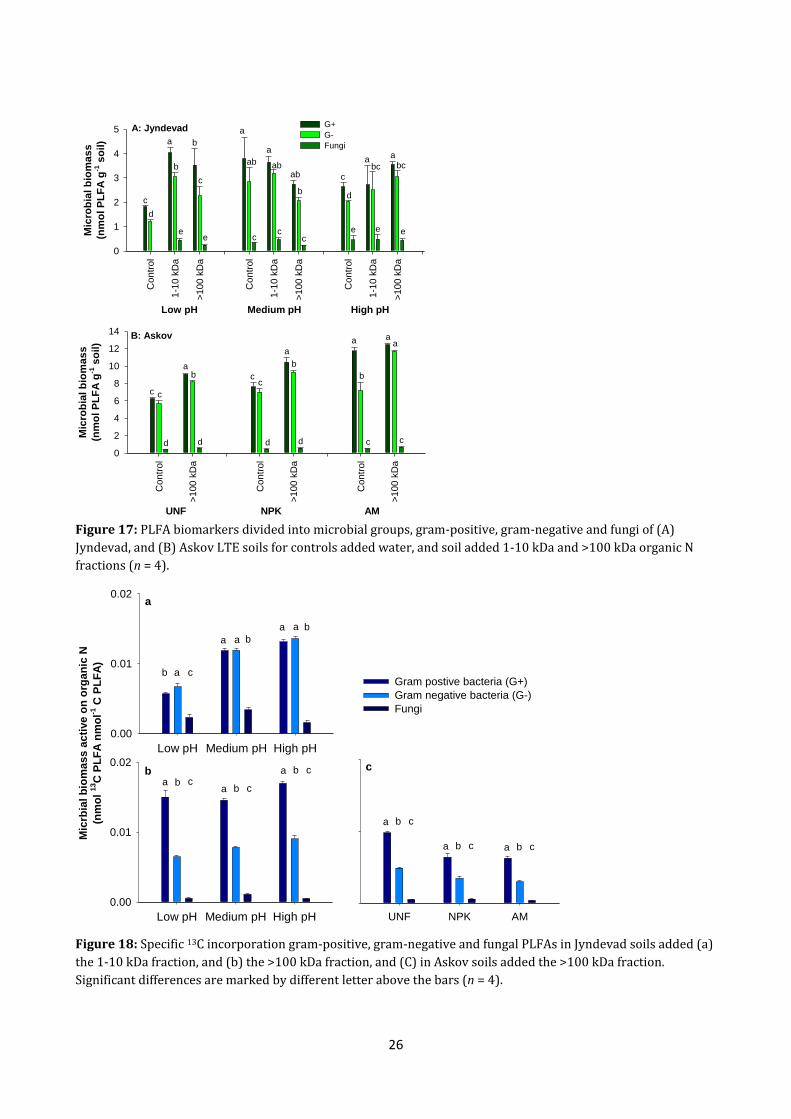
26
Figure 17: PLFA biomarkers divided into microbial groups, gram-positive, gram-negative and fungi of (A)
Jyndevad, and (B) Askov LTE soils for controls added water, and soil added 1-10 kDa and >100 kDa organic N
fractions (n = 4).
Figure 18: Specific 13C incorporation gram-positive, gram-negative and fungal PLFAs in Jyndevad soils added (a)
the 1-10 kDa fraction, and (b) the >100 kDa fraction, and (C) in Askov soils added the >100 kDa fraction.
Significant differences are marked by different letter above the bars (n = 4).
B: Askov
UNF NPK AM
Co
ntr
ol
>1
00
kD
a
Co
ntr
ol
>1
00
kD
a
Co
ntr
ol
>1
00
kD
a
Mic
rob
ial b
iom
as
s
(nm
ol P
LF
A g
-1 s
oil)
0
2
4
6
8
10
12
14
A: Jyndevad
Low pH Medium pH High pH
Co
ntr
ol
1-1
0 k
Da
>1
00
kD
a
Co
ntr
ol
1-1
0 k
Da
>1
00
kD
a
Co
ntr
ol
1-1
0 k
Da
>1
00
kD
a
Mic
rob
ial b
iom
as
s
(nm
ol P
LF
A g
-1 s
oil)
0
1
2
3
4
5G+
G-
Fungi
c c
d
ab
d
cc
d
a
b
d
a
b
c
aa
c
c
d
e
abc
e
abc
e
a
ab
c
a
ab
c
ab
b
c
c
d
a
b
e
b
c
e
a
Low pH Medium pH High pH
0.00
0.01
0.02
Gram postive bacteria (G+)
Gram negative bacteria (G-)
Fungi
b
Low pH Medium pH High pH
0.00
0.01
0.02
b a c
a a b
a a b
a b ca b c
a b c
Mic
rbia
l b
iom
ass
ac
tive o
n o
rgan
ic N
(nm
ol
13C
PL
FA
nm
ol-1
C P
LF
A)
c
UNF NPK AM
a b c
a b c a b c

27
3.3. Plant N uptake from higher Mw DON (paper 3)
After investigating the turnover of DON by the SMB alone, we added a plant to the system in a second
series of experiments. We continued using soil from the Jyndevad LTE, table 2, and the Mw sized
fraction > 100 kDa.
We chose maize in four varieties as our test plant: LG 31.218, Alfastar, Atrium and Emblem. The aim of
the study was to investigate the turnover of protein-sized organic N (>100 kDa) and the uptake of this
organic N source in maize grown in soil with three pH levels. The study was based on the hypothesis
that: (i) the turnover of >100 kDa organic N would be greater in the presence of plants due to a more
active microbial community in rhizosphere soil than bulk soil (Blagodatskaya et al., 2014) and plant
exudation of proteolytic exo-enzymes (Godlewski and Adamczyk, 2007), and (ii) higher plant growth
and greater mineralization with increasing soil pH would result in a greater total plant N uptake from
>100 kDa organic N at high soil pH, but a greater proportion of organic N uptake at low pH.
When studying organic N uptake short chase periods in the studies are needed (Nasholm et al., 2009;
Hill and Jones, 2019), but for this study we still needs sufficient time for depolymerization to occur,
assuming that maize is unable to assimilate protein-sized organic N directly. The incubation time of 48
hours was based on the mineralization pattern of the >100 kDa organic N from paper 2.The plant
uptake of organic N was studied through a micro-lysimeter experiment in a similar manner as
described in section 3.2. using CIRO Centrifuge Filters (XPE-45 Maxi-Spin Filters 0.45 PES, Frisinette
ApS, Knebel, Denmark). Each micro-lysimeter was filled with approximately 15 g of field moist soil and
packed by gently tapping on the side of the unit. In addition to the maize receiving the triple-labeled
organic N we had three control treatments: 1) maize with water added (i.e. no organic N), 2) unplanted
soil receiving the triple-labeled organic N (i.e. no plant), 3) unplanted soil with water added (i.e. no
organic N and no plant). All treatments and controls were sampled by end-point sampling of both soil
and plant tissue 48 hours after the addition of triple-labeled organic N (or water for the respective
controls).
Unplanted controls were setup as described in section 3.2.1. These incubations ran for 48h, and the
base trap were changed after 1, 2, 4, 24 and 48 hours, and immediately analyzed by LSC for 14C activity,
the resulting mineralization curves are shown in Figure 19A and B. After end of incubation, the soils
were frozen before further analysis.
Maize seeds were germinated in the dark for 2 days at room temperature before transferring into
micro-lysimeters. After 20 days of growth in the laboratory with a day length of 14h at 24-28°C and
irrigation as needed, the maize plants reached the BBCH growth stage 12-13 and assessed to be ready
for the incubation experiment. Maize grew significantly better in soil at medium and high pH than at

28
Figure 19. Mineralization of protein-sized organic N (>100 kDa) to 14CO2 in Jyndevad soils. (A) Temporal
development of mineralization and (B) accumulated mineralization after 48 hours in soils without maize, and (C)
accumulated mineralization after 48 hours in soils with four maize varieties. The three pH levels are low at
pHCaCl2 3.6, medium at pHCaCl2 5.4, and high at pHCaCl2 7.1. Statistical differences among soil pH levels in
accumulated 14CO2 after 48 hours are indicated by different letters above the bars (n = 4).
the low pH level. Maize plants at the soil low pH level had significantly lower shoot, root and total dry
matter yields than maize in the medium and high soil pH levels (paper 3).
The micro-lysimeters were placed in 1L glass jars, with a beaker containing 4 ml of water and a
scintillation vial containing 1 ml of 0.5 M NaOH. In addition, a hole was drilled in the lid to pull through
the stem of the maize. The incubation were initiated after the addition of 2.00 ml triple-labelled (15N,
14C and 13C) Mw sized > 100 kDa to the micro-lysimeters, or 2.00 ml water for the control treatments;
all done in four replicates. After end incubation the base trap was analyzed for 14C activity, the
resulting mineralization is shown in Figure 19C. The maize was harvested by cutting the stem at soil
level, and then the soil and roots were gently separated and roots washed free of soil. Shoot, root and
soil samples were frozen before further analysis.
The mineralization in unplanted soil followed a first order kinetics with detection of 14CO2 already
after 1 hour across all pH levels (Figure 19A and B). The accumulated mineralization was significantly
higher (P = 0.0259) in the high pH soil than the low pH soil (Figure 19B); with 9.2 ± 0.7 % of added 14C
as 14CO2 at high pH compared to 6.2 ± 0.6 % of added at low pH. The medium pH soil had intermediate
B
Without maize
C
LG Emblem Alfastar Atrium
Min
era
liza
tio
n t
o C
O2 (
ac
cu
mu
late
d 1
4C
O2 o
f a
dd
ed
14C
, %
)
0
2
4
6
8
10
12
14
16
A
Time of incubation (hours)
0 10 20 30 40 50
0
2
4
6
8
10
12Low pH (3.6)
Medium pH (5.4)
High pH (7.1)
b
aba
- a - - a -
- a -
- a -

29
14CO2 evolution with 7.0 ± 0.3 % of added 14C as 14CO2 after 48 hours (Figure 19B). Interestingly, these
differences in mineralization across soil pH levels disappeared in the presence of maize (Figure 19C).
In paper 3, we chose to focus only on one of the four maize variety, but here I will present bulk data for
all four varieties. When plants were present, the mineralization to 14CO2 tended to increase in the low
pH soil and so did the variation among replicate samples across all pH levels and maize varieties. Thus,
there were no significant differences between mineralization across soil pH levels within each maize
variety; neither did we find significant differences in mineralization across maize varieties within each
soil pH levels (Figure 19C).
The bulk analysis of total C and N, and 13C and 15N stable isotope composition was determined by
transferring 5-7 mg shoot or root material to tin capsules before analysis on a PDZ Europa ANCA-GSL
elemental analyzer interfaced to a PDZ Europe 20-20 isotope ratio mass spectrometer (Sercon Ltd.
Cheshire, UK) at the UC Davis Stable Isotope Facility. The corresponding results are shown in Figure
20. The uptake of 15N was significantly (P < 0.0001) greater than the uptake of 13C in all four maize
varieties across all soil pH levels (Figure 20). The total uptake of 15N ranged from 5.8 to 12.4 % of 15N
added with the >100 kDa fraction (Figure 20F) with the 15N equally distributed among the roots and
the shoots (Figure 20B, 20D). The 15N uptake for the LG and Emblem varieties was significantly higher
in the medium and high pH soils than in the low pH soil in line with the mineralization pattern found
for the unplanted soil. However, we found no correlation between 15N uptake and the actual 14CO2
evolution in the planted soils (data not shown). The uptake of 13C was significantly (P < 0.0001) higher
in roots than in shoots 0.9 to 2.6 % of 13C added with the >100 kDa fraction present in the roots and
0.2 to 0.5% of 13C added present in shoots after 48 hours. Although the uptake of 13C in roots tended to
be lower in the low pH soils was there no significant differences across the soil pH levels for the four
maize varieties (Figure 20C). On a whole plant basis, the uptake of 13C was on average 21% (ranging
from 13 to 31%) of the uptake of 15N with no significant differences in the 13C uptake-to-15N uptake-
ratio across soil pH levels or maize varieties. Uptake of organic N is mainly determined using (13C, 15N)
dual-labeled compound with the uptake estimated based on the ratio of bulk 13C and 15N isotope taken
up (Nasholm et al., 1998). This indicate that the uptake of organic N from the depolymerization of
higher Mw DON over the time of 48 hour by maize seedling were on average 21%. The LG maize
variety tended to have greater bulk 13C uptake across the soil pH levels and was therefore chosen for
further CSIA. The amino acid SIP analysis was performed as described above. From the incubation of
LG with and without the addition of Mw sized >100 kDa the concentration of amino acid in soils and in
root tissues after 48 hour incubation are calculated and shown in supporting information for paper 2.
Overall, there were no significant differences in the

30
Figure 20. Uptake (A, C, E) of 13C and (B, D, F) of 15N from protein-sized organic N (>100 kDa) after 48 hours in
maize (A, B) shoots, (C, D) roots, and (E, F) the whole plant. Significant differences in uptake among soils with
different pH are marked by different letters above the bars; ‘nn’ indicates no normal distribution (n = 4).
concentration of individual amino acids, except for Asx in soil at high pH and serine, Pro/Thr and
tyrosine in root at low pH. Indicating that we did not overload the system with organic N added.
Investigating how the added 13C was distributed in the amino acids, calculated as percent of added 13C,
of the soil from both planted and unplanted soil revealed an interesting pattern, Figure 21. In the
presence of maize (variety LG) the general pattern was that significantly higher proportions of
individual amino acids remained in the soil compared to the unplanted control. The exception was
tyrosine, lysine and phenylalanine. For lysine and phenylalanine a similar proportions remained at all
pH levels and at medium and high pH level, respectively. For tyrosine the proportion remained in the
soil where greater in the unplanted control. Before the CSIA the soil were hydrolyzed and we therefore
cannot deduce whether the individual amino acids remaining after 48 hours were bound in the >100
kDa organic N added or had been incorporated in microbial tissue. Assuming an equal degradation of
A Shoot
Reco
very
of
trace
r in
pla
nt
tis
su
e (
%o
f a
dd
ed
)
0
2
4
6
8 Low pH
Medium pH
High pH
C Root
0
2
4
6
8
E Whole plant
LG
Em
ble
m
Alf
asta
r
Atr
ium
0
5
10
15
B
D
F
LG
Em
ble
m
Alf
asta
r
Atr
ium
a b ba b b
a b a
a b b
a b a
a b b a b b
a b b
- a -
- a -
- a -a b a
- a - - a - - a - - a -
- a - - a -- a -
- a -
- a - nn a b abnn
--- bulk 13
C --- --- bulk 15
N ---

31
proteins in the added >100 kDa organic N, we use the individual amino acids with lowest proportions
remaining as an estimate of the proportion of proteins in the >100 kDa organic N remaining intact as
added. This proportion of original organic nitrogen highlighted in Figure 21 by a red line.
Figure 21. Bound amino acids from added >100 kDa organic N remaining after 48 hours without and with maize
in Jyndevad soils at (a) low, (b) medium, and (c) high pH. Significant differences between soils without and with
maize in 13C remaining for individual amino acids are marked by an asterisk above the bars (n = 4). Amino acids
are organized from left on right with increasing steps in their biosynthesis. The amino acids: asparagine and
aspartate (Asx), glutamine and glutamate (Glx), and Proline and Threonine (Pro/Thr) elute together in the GC-C-
IRMS analysis of acid hydrolyzed samples. The red dashed line indicate the lowest proportion of an individual
amino acid remaining in soil without maize.
3.3.1. Key findings
Surprisingly, we found higher proportions of individual amino acids remaining in the soil with maize
than in unplanted soil; this in particular pronounced for the amino acids with fewer than those with
more biosynthetic steps (amino acids to the left in Figure 21). The finding of more amino acids
a: Low pH
0
20
40
60
80
100Without maize
With maize
b: Medium pH
Bo
un
d a
min
o a
cid
re
ma
inin
g i
n s
oil
(%
of
13C
ad
de
d i
n i
nd
ivid
ua
l a
min
o a
cid
s)
0
20
40
60
80
100
c: High pH
Ala
As
x
Glx
Se
r
Gly
Pro
/Th
r
Va
l
Ile
Le
u
Lys
Tyr
Ph
e
0
20
40
60
80
100
*
*
*
* *
*
*
**
*
*
*
*
*
**
*
**
*
*
*
*
*
*
*
**
*
*

32
remaining with maize than in unplanted soil is surprising since turnover is generally consider to be
greater in rhizosphere than bulk soil due to greater microbial activity (Blagodatskaya et al., 2014) and
plant exudation of proteolytic enzymes (Godlewski and Adamczyk, 2007).
The total 15N uptake reached 12.4 % of added and the total 13N uptake reached up to 2.6% of added
after 48 hours across the maize varieties (Figure 20). The presence of individual 13C-labeled amino
acids varied significantly in maize roots of the LG variety at all three soil pH levels (Figure 22).
Figure 22. Presence of 13C-labeled bound amino acids from added >100 kDa organic N in maize roots after 48
hours in Jyndevad soils at (A) low, (B) medium, and (C) high pH. Significant differences between presence among
individual amino acids within each soil pH level are marked by different letters above the bars (n=4). Amino
acids are organized from left on right with increasing steps in their biosynthesis.
The presence ranged from 0 to 1.7% of the 13C added with the >100 kDa organic N across soils; with no
significant effects of soil pH level on the presence of individual 13C-labeled amino acids. The presence
of individual amino acids had a similar pattern at all soil pH levels where glutamine/glutamate,
proline/threonine and leucine had the greatest presence and lysine had the lowest presence
throughout. Importantly, the pattern of amino acid presence in maize roots did not resemble the
A: Low pH
0.0
0.5
1.0
1.5
2.0
B: Medium pH
Pre
se
nc
e o
f la
be
led
bo
un
d a
min
o a
cid
in
ma
ize
ro
ots
(% o
f 1
3C
ad
de
d i
n i
nd
iviu
al
am
ino
ac
ids
)
0.0
0.5
1.0
1.5
2.0
C: High pH
Ala
As
x
Glx
Se
r
Gly
Pro
/Th
r
Va
l
Ile
Le
u
Lys
Tyr
Ph
e
0.0
0.5
1.0
1.5
2.0
b bc
cd
a
aa
b
cd cd
bc
d
de de
ef
b
a
bc
cd
dfef
d
fgg
bcbc
ce
a a
b
cb
defeg
cd
fgg

33
pattern of neither amino acids remaining in the soil nor amino acids lost from the soil. The average
presence of 13C-labeled amino acids was 0.5-0.6 % of added, which correspond to one third of the bulk
13C presence in maize roots; the latter reaching 2.2 % of added in the LG variety.

34
4. General discussion
The aim of this PhD project was to study the role of higher Mw dissolved organic N in the plant-soil N
cycle. Based on three objectives, an extensive experimental and analytical work was performed, which
resulted in three papers that are presented individually in section 3. The following discussion will be
based on the main points of this PhD projects, drawing in results across the three papers.
4.1. The analytical method for amino acid CSIA
Previous studies have typically focused on tracing the turnover of individual amino acids in soil, e.g.,
looking at dissipation kinetic of asparagine (Czaban et al., 2016) or compound specific analysis of di-
and tri-peptides (Jamtgard et al., 2018). But for the study of more complex organic N compounds, such
as large peptides and proteins, better approaches are needed to advance the state of the art. Having a
good analytical method implies that the results can be trusted and repeated, which was the case with
the NAIP derivaterization method (Paper 1) and the optimized soil hydrolysis procedure (Paper 2 and
3). The presently developed methodology for amino acid CSIA of large Mw organic N concerns not only
the GC-C-IRMS analysis itself, but also a detailed and easy-to-follow sample preparation protocol, to
ensure consistency in sample preparation as well as sample analysis.
We used Mw sized fractionation to divide triple labeled DON into size fractions and thereby reduce the
complexity of the organic N compounds. Each fraction was hydrolyzed and analyzed for the amino acid
distribution and enrichment. Results confirmed that hydrolysis is a harsh treatment (Fountoulakis and
Lahm, 1998), and that there is a risk of losing free amino acids, but simultaneously it was shown that
the isotopic signature was not affected by the hydrolysis. Purification procedures were optimized to fit
the soil samples, enabling the GC-C-IRMS analysis of the effect of added organic N on the soil and plant-
soil systems.
I believe that paper 2 and 3 demonstrate the strength of analyzing multiple amino acids. Thus, when
able to create an amino acid profile or fingerprint of the original organic N compound, the fate of the
organic N can be traced through the soil N cycling (paper 2) and soil-plant N cycling (paper 3). This for
example led to the discovery of greater recycling of simple amino acids compared to those with more
complex biosynthesis (Paper 2). Paper 1 showed that there could be an issue with hydrolyzing
samples containing free amino acids. We avoided interference from this issue in the work leading up to
paper 2 by using Mw sized fractions > 1 kDa and by washing the soil with water at the end of
incubation thus removing free amino acids. In the work leading to paper 3, the issue was eliminated by
using the Mw sized fraction >100 kDa, and as shown in studies of the turnover of free amino acids
(Wilkinson et al., 2014; Hill and Jones, 2019), the half-life of these compounds is short. Therefore, the

35
concentration of free amino acids is most likely low and so is the potential bias from loss of free amino
acids upon soil hydrolysis.
CSIA profiling is time-consuming and here we chose the end point sampling for the amino acid CSIA in
different soil management instead of a detailed time series. In the future, more detailed time series of
both soil and plant amino acid CSIA would help the understanding of the uptake dynamic between the
plant and the SMB.
4.2. Mineralization and sorption of organic N in soil with or without
plants
The mineralization of added Mw sized >100 kDa organic N during 48 hour incubation revealed that
there was no lag phase (Figure 19), indicating that a functioning soil microbial population was present
to catabolize higher Mw organic N without preceding growth and most likely also without de novo
enzyme synthesis. The lower mineralization to 14CO2 after 14 days observed for the >100 kDa fraction
than for the 1-10 kDa fraction (Figure 10 and Figure 13) indicated that >100 kDa organic N to a
greater extent was involved in microbial anabolism (Liang et al., 2017). This was also confirmed by the
incorporation of 13C in PLFA. In addition, the low recovery of labeled amino acids after 14 days
incubation (Figure 15 and 16) can hardly be explained by chemical sorption of the originally added
amino acids in peptides and proteins as such processes would result in similar or consistent recoveries
across all amino acids. Thus, C and N from amino acids were incorporated in microbial tissue early in
the degradation; paper 3 shows a large proportion already after 48 hours. This lend support to 14CO2
evolution being at two phases also from protein-sized ON, with the first phase representing the initial
microbial respiration of the added compounds and the second phase representing the subsequent
respiration of organic compounds initially incorporated in the microbial tissue (Boddy et al., 2007;
Boddy et al., 2008; Farrell et al., 2011).
In the plant-soil system studied in paper 3, there was a positive effect from the presence of plants on
14CO2 production from the low pH soil (Figure 19 c). In paper 3 we outlined that this could be due to a
more active SMB, greater overall turnover of added organic N, and root respiration of the added
organic N. The CSIA of amino acids in soil showed a higher microbial amino acid incorporation with
plants than without plants. This strongly indicate a higher microbial C use efficiency of amino acid
derived C, and thus a lower microbial contribution to 14CO2 respiration from the added organic N.
Therefore, root 14CO2 respiration was most likely responsible for the higher mineralization (Nasholm
et al., 2009; Fischer et al., 2010; Warren, 2012; Hildebrandt et al., 2015).
It could be worth repeating the 48 hour incubation with plants to get a more detailed timeline, both for
the respiration of 14CO2 and the incorporation of amino acids in the SMB.

36
4.3. Organic nitrogen in soil with and without plants
In paper 2, the study provides strong evidence for the hypothesis that C and N from labile compounds
persist in soil (Cotrufo et al., 2015), but rather than persisting due to protection of the original
compounds (Schmidt et al., 2011), the C and N persist due to the incorporation via anabolic processes
into microbial tissue. We concluded based on 14 days incubation studies that degradation of large
organic N is rapid and that SMB incorporates especially the simpler amino acids. This picture was
confirmed from the CSIA of amino acids in soil with and without plants after 48 hours as reported in
paper 3. An example is shown for two bound amino acids (alanine and lysine) remaining in soil after
48 hours and 14 days having a high (alanine) and a low (lysine) percent of added remaining in the soil
(Figure 23). Alanine is a simple amino acid with few biosynthetic steps (Kirchman et al., 1986), and
was one of the amino acids with highest amount remaining. Lysine is a complex amino acid with
several biosynthetic steps (Kirchman et al., 1986), and was one of the amino acids with lowest amount
remaining. A curve fitting of these data would have a striking resembling to that of the mineralization
curves, although of course the dissipation curves show decreases in amino acid remaining and
mineralization curves show increases in CO2 respiration. The tendency of the more complex amino
acids to decrease more rapidly than the simpler amino acids was surprising and diverges from the
expected direct anabolic microbial use of amino acids with complex biosynthesis saving the
Figure 23: The rapid degradation of the added >100 kDa organic N is illustrated by the presence of bound 13C-
labeled alanine and lysine from the 48 hours incubation (paper 3) and the 14 days incubation (paper 2) in
Jyndevad soil at low pH. The differences in the level of 13C remaining of alanine and lysine illustrate the higher
use of complex amino acids (lysine) for energy and the higher incorporation of simple amino acids (alanine) as
microbial building blocks.
Incubation time (days)
0 2 4 6 8 10 12 14
Bo
un
d a
min
o a
cid
s r
em
ain
ing
(%
of
ad
de
d 1
3C
)
0
20
40
60
80
100
Lysine in low pH soil without plant
Alanine in low pH soil without plant

37
microorganisms most energy (Kirchman et al., 1986). The majority of the labeled amino acids
recovered from soil after 48 hours were most likely in microbial tissue in the unplanted soil; with a
good proportion of C-skeletons entering biosynthesis of other compounds as less than 10% of C was
respired as 14CO2 in unplanted soil. Interestingly, simpler amino acids, such as alanine,
asparagine/aspartate, glutamine/glutamate, and glycine, are typically among the most abundant
constituents of the peptidoglycan layers of bacterial cell walls (Simelyte et al., 2003; Vollmer et al.,
2008; Schneewind and Missiakas, 2012). Hence, these findings support substantial incorporation of
organic N by microbial cells.
4.4. Plant N uptake
The variation in the maize root presence of individual amino acids from the added >100 kDa organic N
showed that organic N uptake contributed to maize N uptake (paper 3). We estimated that 20-30%
was taken up in organic form based on the bulk 13C and 15N uptake. Since, plants most likely
contributed to the 14CO2 respiration (see section 4.1.), then the 20-30% N uptake in organic form is
probably underestimated due to post-uptake metabolism (Nasholm et al., 2009; Warren, 2012).
Supporting this, is the soil solution data from experiment 2, where the temporal development in 13C
and 15N presence show a parallel loss of 13C and 15N from 1 hour to 1 days with no indication of 15N-
inorgaic N in this period (Figure 10b). This point to that for at least the first 24 h, the disappearance of
13C and 15N are correlated, meaning that the N available was in organic form and that the release of
DIN do not occur until after 24 hours. Hence supporting, a higher N uptake in organic form than the
20-30% estimate, which contradicting the recent finding by Hill and Jones (2019) showing N uptake
being dominated by inorganic N forms when adding alanine to a plant-soil system.
With the present data we cannot determine at what rate the >100 kDa was depolymerized and hence
made bio-available, and therefore the uptake rate of organic N by plants cannot be determined either.
But, the post-uptake fate of individual amino acids may be indicated by the specific enrichment of
amino acids in the maize roots (paper 3), where a greater specific enrichment indicate a greater
recycling of amino acid C-skeletons. We speculate that the post-uptake fate of amino acids is a balance
between abundance of the amino acid in the plant tissue and the energy gain when using the amino
acid in catabolism (Hildebrandt et al., 2015). Again, future studies with more detailed time scales
would be interesting to determine the plant uptake rate of organic N compounds and their fate in root
after uptake.

38
5. Conclusion
In this PhD project I examined the turnover of higher Mw dissolved organic N in soils from two LTE,
Jyndevad and Askov. The studies were based on among other the setup, testing and optimization of a
CSIA method for labeled amino acid from complex organic N compounds. The LTE soils, with and
without growing plants, were incubated in micro-lysimeters in 1 L glass jars at varies times, from 1
hour to 14 days. The experiments were setup to test four hypothesis:
(i) In cultivated soil the pool of Higher Mw DON represents the bottleneck in the production of plant
available N from soil organic N. This hypothesis was rejected in paper 2, where there was a rapid
turnover of large molecular size organic N compounds. It was concluded that large organic N primarily
contributes to SOM formation via build-up of microbial tissue, where incorporation of C and N in the
short-chained peptides of bacterial cell walls potentially results in longer-term storage of plant-
derived C. The study, thus, provides strong evidence for the hypothesis that C and N from labile
compounds persist in soil via anabolic incorporation into microbial tissue.
(ii) Differences in soil pH will affect which microbial communities dominate the decomposition of DON; at
low pH fungi is expected to dominate and at increasing pH the dominating microbial communities will
shift towards bacteria. However, I found that bacteria dominated the decomposition of both 1-10 kDa
and >100 kDa across all LTE soils. Turnover of the largest organic N (>100 kDa) was dominated by
gram-positive bacteria, and we suggested that this could be coupled to direct uptake of organic N
larger than the presently acknowledged assimilation limit of 0.6 kDa.
(iii) The competition between plants and the microbial communities for plant available DON will increase
the turnover of high Mw DON compared to a soil without plants. The findings in paper 3 showed
interestingly that the concentration of individual amino acids was higher in soils with maize growing
than in soils with no maize growing. The amino acids found to have the highest concentration was
consistent with the amino acids most abundant constituents of the peptidoglycan layers of bacterial
cell walls, alanine, Asx, Glx and glycine. The interpretation of this was that with a plant growing in the
soil, there is a second source of C for the SMB and therefore more amino acids were taken up by the
SMB to be used as building blocks in creating new cell growth, instead of undergoing deamination and
being used for energy.
(iv) At low soil pH, organic N turnover is expected to be slower and hence there will be a greater chance
of direct organic N plant uptake as indicated by 13C presence in roots, whereas at higher pH
mineralization will be greater and so will dissolved inorganic 15N (DI15N). The plant uptake of 15N from
the > 100 kDa organic N after 48 hours was increasing with soil pH reaching 12% of the added 15N. The
maize uptake of organic N, confirmed by the presence of 13C-labeled amino acid in the maize roots, was

39
estimated based on the ratio between the net-uptake of 13C-to-15N to be 20-30% of the total 15N uptake
with no significantly different across soil pH.
Overall, I conclude based on my finding during this PhD project that depolymerization does not pose a
bottleneck to the turnover of dissolved organic N into bioavailable N. The decomposition of higher Mw
organic N was dominated by the exo-enzymatic activity of gram-positive bacteria, which would
potentially allow plants to assimilate degradation metabolites, such as amino acids or short peptides.
The latter was confirmed by the uptake of organic N in young maize plants. Hence, the study showed
that large organic N can make a significant contribution to plant and microbial N nutrition.

40
6. References
Berg, J.M., Tymoczko, J.L., Stryer, L., 2006. Biochemistry. Sara Tenney, W. H. Freeman and Company, New York.
Blagodatskaya, E., Blagodatsky, S., Anderson, T.H., Kuzyakov, Y., 2014. Microbial Growth and Carbon Use Efficiency in the Rhizosphere and Root-Free Soil. Plos One 9, 9.
Blagodatskaya, E., Kuzyakov, Y., 2013. Active microorganisms in soil: Critical review of estimation criteria and approaches. Soil Biology & Biochemistry 67, 192-211.
Boddy, E., Hill, P.W., Farrar, J., Jones, D.L., 2007. Fast turnover of low molecular weight components of the dissolved organic carbon pool of temperate grassland field soils. Soil Biology & Biochemistry 39, 827-835.
Boddy, E., Roberts, P., Hill, P.W., Farrar, J., Jones, D.L., 2008. Turnover of low molecular weight dissolved organic C (DOC) and microbial C exhibit different temperature sensitivities in Arctic tundra soils. Soil Biology & Biochemistry 40, 1557-1566.
Boschker, H.T.S., Vasquez-Cardenas, D., Bolhuis, H., Moerdijk-Poortvliet, T.W.C., Moodley, L., 2014. Chemoautotrophic Carbon Fixation Rates and Active Bacterial Communities in Intertidal Marine Sediments. Plos One 9, 12.
Burns, R.G., DeForest, J.L., Marxsen, J., Sinsabaugh, R.L., Stromberger, M.E., Wallenstein, M.D., Weintraub, M.N., Zoppini, A., 2013. Soil enzymes in a changing environment: Current knowledge and future directions. Soil Biology & Biochemistry 58, 216-234.
Christensen, B.T., Petersen, J., Trentemoller, U.M., 2006. The Askov Long-Term Experiments on Animal Manure and Mineral Fertilizers: The Lermarken site 1894-2004., DIAS report Plant productions.
Cline, L.C., Zak, D.R., 2015. Soil microbial communities are shaped by plant-driven changes in resource availability during secondary succession. Ecology 96, 3374-3385.
Corr, L.T., Berstan, R., Evershed, R.P., 2007. Optimisation of derivatisation procedures for the determination of delta C-13 values of amino acids by gas chromatography/combustion/isotope ratio mass spectrometry. Rapid Communications in Mass Spectrometry 21, 3759-3771.
Cotrufo, M.F., Soong, J.L., Horton, A.J., Campbell, E.E., Haddix, M.L., Wall, D.H., Parton, A.J., 2015. Formation of soil organic matter via biochemical and physical pathways of litter mass loss. Nature Geoscience 8, 776-+.
Czaban, W., Rasmussen, J., Nicolaisen, M., Fomsgaard, I.S., 2016. Dissipation kinetics of asparagine in soil measured by compound-specific analysis with metabolite tracking. Biology and Fertility of Soils 52, 911-916.
Dumont, M.G., Murrell, J.C., 2005. Stable isotope probing — linking microbial identity to function. Nature Reviews Microbiology 3, 499.
Enggrob, K.L., Larsen, T., Larsen, M., Elsgaard, L., Rasmussen, J., 2019. The influence of hydrolysis and derivatization on the determination of amino acid contentand isotopic ratios in dual‐labeled (13C,15N) white clover. Rapid Commun Mass Spectrom 33, 21-30.
Farrell, M., Hill, P.W., Wanniarachchi, S.D., Farrar, J., Bardgett, R.D., Jones, D.L., 2011. Rapid peptide metabolism: A major component of soil nitrogen cycling? Global Biogeochemical Cycles 25, 11.
Fierer, N., Schimel, J.P., Holden, P.A., 2003. Variations in microbial community composition through two soil depth profiles. Soil Biology & Biochemistry 35, 167-176.

41
Fischer, H., Eckhardt, K.U., Meyer, A., Neumann, G., Leinweber, P., Fischer, K., Kuzyakov, Y., 2010. Rhizodeposition of maize: Short-term carbon budget and composition. J. Plant Nutr. Soil Sci. 173, 67-79.
Fountoulakis, M., Lahm, H.W., 1998. Hydrolysis and amino acid composition analysis of proteins. Journal of Chromatography a 826, 109-134.
Frostegard, A., Baath, E., Tunlid, A., 1993. SHIFTS IN THE STRUCTURE OF SOIL MICROBIAL COMMUNITIES IN LIMED FORESTS AS REVEALED BY PHOSPHOLIPID FATTY-ACID ANALYSIS. Soil Biology & Biochemistry 25, 723-730.
Frostegard, A., Tunlid, A., Baath, E., 2011. Use and misuse of PLFA measurements in soils. Soil Biology & Biochemistry 43, 1621-1625.
Ge, T.D., Song, S.W., Roberts, P., Jones, D.L., Huang, D.F., Iwasaki, K., 2009. Amino acids as a nitrogen source for tomato seedlings: The use of dual-labeled (C-13, N-15) glycine to test for direct uptake by tomato seedlings. Environ. Exp. Bot. 66, 357-361.
Godlewski, M., Adamczyk, B., 2007. The ability of plants to secrete proteases by roots. Plant Physiology and Biochemistry 45, 657-664.
Hildebrandt, T.M., Nesi, A.N., Araujo, W.L., Braun, H.P., 2015. Amino Acid Catabolism in Plants. Molecular Plant 8, 1563-1579.
Hill, P.W., Jones, D.L., 2019. Plant–microbe competition: does injection of isotopes of C and N into the rhizosphere effectively characterise plant use of soil N? New Phytologist 221, 796-806.
Hodge, A., Robinson, D., Fitter, A., 2000. Are microorganisms more effective than plants at competing for nitrogen? Trends in plant science 5, 304-308.
Jamtgard, S., Nasholm, T., Huss-Danell, K., 2010. Nitrogen compounds in soil solutions of agricultural land. Soil Biology & Biochemistry 42, 2325-2330.
Jamtgard, S., Robinson, N., Moritz, T., Colgrave, M.L., Schmidt, S., 2018. Optimising methods for the recovery and quantification of di- and tripeptides in soil. Soil Research 56, 404-412.
Jan, M.T., Roberts, P., Tonheim, S.K., Jones, D.L., 2009. Protein breakdown represents a major bottleneck in nitrogen cycling in grassland soils. Soil Biology & Biochemistry 41, 2272-2282.
Jones, D.L., 1999. Amino acid biodegradation and its potential effects on organic nitrogen capture by plants. Soil Biology & Biochemistry 31, 613-622.
Jones, D.L., Healey, J.R., Willett, V.B., Farrar, J.F., Hodge, A., 2005. Dissolved organic nitrogen uptake by plants - an important N uptake pathway? Soil Biology & Biochemistry 37, 413-423.
Jones, D.L., Kielland, K., 2002. Soil amino acid turnover dominates the nitrogen flux in permafrost-dominated taiga forest soils. Soil Biology & Biochemistry 34, 209-219.
Jones, D.L., Murphy, D.V., 2007. Microbial response time to sugar and amino acid additions to soil. Soil Biology & Biochemistry 39, 2178-2182.
Jones, D.L., Willett, V.B., Stockdale, E.A., Macdonald, A.J., Murphy, D.V., 2012. Molecular Weight of Dissolved Organic Carbon, Nitrogen, and Phenolics in Grassland Soils. Soil Science Society of America Journal 76, 142-150.

42
Kemmitt, S.J., Lanyon, C.V., Waite, I.S., Wen, Q., Addiscott, T.M., Bird, N.R.A., O'Donnell, A.G., Brookes, P.C., 2008. Mineralization of native soil organic matter is not regulated by the size, activity or composition of the soil microbial biomass - a new perspective. Soil Biology & Biochemistry 40, 61-73.
Kirchman, D.L., Newell, S.Y., Hodson, R.E., 1986. INCORPORATION VERSUS BIOSYNTHESIS OF LEUCINE - IMPLICATIONS FOR MEASURING RATES OF PROTEIN-SYNTHESIS AND BIOMASS PRODUCTION BY BACTERIA IN MARINE SYSTEMS. Marine Ecology Progress Series 32, 47-59.
Knicker, H., 2011. Soil organic N - An under-rated player for C sequestration in soils? Soil Biology & Biochemistry 43, 1118-1129.
Knief, C., Altendorf, K., Lipski, A., 2003. Linking autotrophic activity in environmental samples with specific bacterial taxa by detection of C-13-labelled fatty acids. Environ. Microbiol. 5, 1155-1167.
Kusliene, G., Rasmussen, J., Kuzyakov, Y., Eriksen, J., 2014. Medium-term response of microbial community to rhizodeposits of White clover and ryegrass and tracing of active processes induced by C-13 and N-15 labelled exudates. Soil Biology & Biochemistry 76, 22-33.
Larsen, T., Ventura, M., Andersen, N., O'Brien, D.M., Piatkowski, U., McCarthy, M.D., 2013. Tracing Carbon Sources through Aquatic and Terrestrial Food Webs Using Amino Acid Stable Isotope Fingerprinting. Plos One 8, e73441-e73441.
Liang, C., Schimel, J.P., Jastrow, J.D., 2017. The importance of anabolism in microbial control over soil carbon storage. Nature Microbiology 2.
Liebig, J., 1842. Chemistry in its application to Agriculture and Physiology. John Owen, Cambridge.
Madigan, M.T., Bender, K.S., Buckley, D.H., Sattley, W.M., Stahl, D.A., 2018. Brock Biology of Microorganisms. Pearson Education Limited, London, UK.
Nasholm, T., Ekblad, A., Nordin, A., Giesler, R., Hogberg, M., Hogberg, P., 1998. Boreal forest plants take up organic nitrogen. Nature 392, 914-916.
Nasholm, T., Huss-Danell, K., Hogberg, P., 2001. Uptake of glycine by field grown wheat. New Phytologist 150, 59-63.
Nasholm, T., Kielland, K., Ganeteg, U., 2009. Uptake of organic nitrogen by plants. New Phytologist 182, 31-48.
Owen, A.G., Jones, D.L., 2001. Competition for amino acids between wheat roots and rhizosphere microorganisms and the role of amino acids in plant N acquisition. Soil Biology & Biochemistry 33, 651-657.
Petersen, S.O., Frohne, P.S., Kennedy, A.C., 2002. Dynamics of a soil microbial community under spring wheat. Soil Science Society of America Journal 66, 826-833.
Petersen, S.O., Klug, M.J., 1994. EFFECTS OF SIEVING, STORAGE, AND INCUBATION-TEMPERATURE ON THE PHOSPHOLIPID FATTY-ACID PROFILE OF A SOIL MICROBIAL COMMUNITY. Appl. Environ. Microbiol. 60, 2421-2430.
Rasmussen, J., Gjettermann, B., Eriksen, J., Jensen, E.S., Hogh-Jensen, H., 2008. Fate of (15)N and (14)C from labelled plant material: Recovery in perennial ryegrass-clover mixtures and in pore water of the sward. Soil Biology & Biochemistry 40, 3031-3039.
Rousk, J., Baath, E., 2011. Growth of saprotrophic fungi and bacteria in soil. FEMS microbiology ecology 78, 17-30.

43
Rubaek, G.H., 2008. Long-term effects of liming and phosphorus fertilisation on soil properties. In: Christensen, B.T., Petersen, J., Schact, M. (Eds.), Long-term field experiments - a unique research platform: Proceedings of NJF Seminar 407. Aarhus University, Denmark, Askov Experimental Station and Sandbjerg Estate, Denmark.
Schimel, J.P., Bennett, J., 2004. Nitrogen mineralization: Challenges of a changing paradigm. Ecology 85, 591-602.
Schmidt, M.W.I., Torn, M.S., Abiven, S., Dittmar, T., Guggenberger, G., Janssens, I.A., Kleber, M., Kogel-Knabner, I., Lehmann, J., Manning, D.A.C., Nannipieri, P., Rasse, D.P., Weiner, S., Trumbore, S.E., 2011. Persistence of soil organic matter as an ecosystem property. Nature 478, 49-56.
Schneewind, O., Missiakas, D.M., 2012. Protein secretion and surface display in Gram-positive bacteria. Philosophical Transactions of the Royal Society B-Biological Sciences 367, 1123-1139.
Simelyte, E., Rimpilainen, M., Zhang, X., Toivanen, P., 2003. Role of peptidoglycan subtypes in the pathogenesis of bacterial cell wall arthritis. Annals of the Rheumatic Diseases 62, 976-982.
Sinsabaugh, R.L., Lauber, C.L., Weintraub, M.N., Ahmed, B., Allison, S.D., Crenshaw, C., Contosta, A.R., Cusack, D., Frey, S., Gallo, M.E., Gartner, T.B., Hobbie, S.E., Holland, K., Keeler, B.L., Powers, J.S., Stursova, M., Takacs-Vesbach, C., Waldrop, M.P., Wallenstein, M.D., Zak, D.R., Zeglin, L.H., 2008. Stoichiometry of soil enzyme activity at global scale. Ecology Letters 11, 1252-1264.
Soil Survey Staff, 1999. Soil Taxonomy: A Basic System of Soil Classification for Making and Interpreting Soil Surveys. Natural Resources Conservation Service, United States Department of Agriculture, Washington D.C., USA.
Stromberger, M.E., Keith, A.M., Schmidt, O., 2012. Distinct microbial and faunal communities and translocated carbon in Lumbricus terrestris drilospheres. Soil Biology & Biochemistry 46, 155-162.
Vollmer, W., Blanot, D., de Pedro, M.A., 2008. Peptidoglycan structure and architecture. Fems Microbiology Reviews 32, 149-167.
Vranova, V., Rejsek, K., Formanek, P., 2013. Proteolytic activity in soil: A review. Applied Soil Ecology 70, 23-32.
Waksman, S.A., 1932. Principles of Soil Microbiology. The Williams & Wilkins Company, Baltimore.
Warren, C.R., 2012. Post-uptake metabolism affects quantification of amino acid uptake. New Phytologist 193, 522-531.
Warren, C.R., 2014. Organic N molecules in the soil solution: what is known, what is unknown and the path forwards. Plant and Soil 375, 1-19.
Wichern, F., Eberhardt, E., Mayer, J., Joergensen, R.G., Muller, T., 2008. Nitrogen rhizodeposition in agricultural crops: Methods, estimates and future prospects. Soil Biology & Biochemistry 40, 30-48.
Wilkinson, A., Hill, P.W., Farrar, J.F., Jones, D.L., Bardgett, R.D., 2014. Rapid microbial uptake and mineralization of amino acids and peptides along a grassland productivity gradient. Soil Biology & Biochemistry 72, 75-83.
Yarnes, C.T., Herszage, J., 2017. The relative influence of derivatization and normalization procedures on the compound-specific stable isotope analysis of nitrogen in amino acids. Rapid Communications in Mass Spectrometry 31, 693-704.

44
7. Appendices

45
Paper 1
The influence of hydrolysis and derivatization on the determination of amino acid content and isotopic
ratios in dual-labeled (13C, 15N) white clover
Kirsten Lønne Enggrob, Thomas Larsen, Mogens Larsen, Lars Elsgaard, Jim Rasmussen
Puplished in Rapid Comunication in Mass Spectrometry. DOI: 10.1002/rcm.8300

Received: 9 July 2018 Revised: 26 September 2018 Accepted: 27 September 2018
DOI: 10.1002/rcm.8300
R E S E A R CH AR T I C L E
The influence of hydrolysis and derivatization on thedetermination of amino acid content and isotopic ratios indual‐labeled (13C, 15N) white clover
Kirsten Lønne Enggrob1 | Thomas Larsen2,3 | Mogens Larsen4 | Lars Elsgaard1 |
Jim Rasmussen1
1Department of Agroecology, Aarhus
University, Foulum, Denmark
2Max Planck Institute for the Science of
Human History, Kahlaische Str. 10, 07745
Jena, Germany
3Leibniz‐Laboratory for Radiometric Dating
and Stable Isotope Research, Christian‐Albrechts Universität zu Kiel, Kiel, Germany
4Department of Animal Science, Aarhus
University, Foulum, Denmark
Correspondence
J. Rasmussen, Department of Agroecology,
Aarhus University, Foulum, Denmark.
Email: [email protected]
Funding information
Teknologi og Produktion, Det Frie
Forskningsråd, Grant/Award Number: 1335‐00760B; The Independent Research Fund
Denmark – Technology and Production
Rapid Commun Mass Spectrom. 2019;33:21–30.
Rationale: The cycling of peptide‐ and protein‐bound amino acids (AAs) is
important for studying the rate‐limiting steps in soil nitrogen (N) turnover. A strong
tool is stable C and N isotopes used in combination with compound‐specific isotope
analysis (CSIA), where a prerequisite for analysis is appropriate methods for peptide
and protein hydrolysis and appropriate methods for derivatization of AAs for analysis
by gas chromatography (GC).
Methods: We examined the efficiency of a standard acidic hydrolysis (6M HCl, 20 h
at 110°C) and a fast acidic hydrolysis (6M HCl, 70min at 150°C) on the recovery of
AAs from a protein standard (bovine serum albumin). The best methods were used
on dual‐labeled (13C and 15N) clover shoot and root juice, divided into four molecular
weight (Mw) size fractions. We used NAIP (N‐acetyl isopropyl esterification)
derivatization for GC/combustion‐isotope ratio mass spectrometry (C‐IRMS) analysis
of AA standards.
Results: The NAIP derivatization gave very low limits of detection (LODs) (< 2 pmol)
and limits of quantification (LOQs) ranging from 0.55 to 4.89 pmol. Comparing the
concentrations of individual AAs in hydrolyzed versus unhydrolyzed clover juice
samples of the low Mw size fraction (<1 kDa) showed a significant decline in
concentration (p <0.03) for seven AAs after hydrolysis. Despite the decline in AA
concentration, we found a linear connection between the obtained atomic fraction
(13C/total carbon and 15N/total nitrogen) for individual AAs of hydrolyzed versus
unhydrolyzed samples.
Conclusions: The methodology distinguished differences in atomic fractions across
AAs, in individual AAs in Mw size fractions, and between shoot and root samples of
experimentally labeled white clover. Specifically, the method separated L‐glutamate
(Glu) and glutamine (Gln). Thus, for a broader use in plant and soil ecology, we present
an optimized methodology for GC/C‐IRMS analysis of AAs from organic nitrogen
samples enriched with 13C and 15N – AA stable isotope probing (SIP).
1 | INTRODUCTION
Nitrogen (N) is a required nutrient for all lifeforms and a building block
for the backbone of amino acids (AAs). In studies of plant–soil
wileyonlinelibrary
interactions, AAs have gained considerable interest as plant nutrients,1
as components of root exudates,2 and as key compounds for under-
standing key fluxes through soil organic N pools.3,4 A strong tool to
study these issues is stable isotope labeling, where isotopically
© 2018 John Wiley & Sons, Ltd..com/journal/rcm 21

22 ENGGROB ET AL.
enriched AAs are used to trace the fate of single or a few AAs. Such
studies have, for example, documented direct acquisition of asparagine
by white clover,5,6 direct uptake of glycine in a number of crop species,7
and direct uptake of a mixture of glycine, valine, tyrosine and lysine by
plantain.8 However, it is generally acknowledged that AAs and small
peptides (<1 kDa) have a rapid turnover in soil3,9 and this step therefore
does not constitute the rate‐limiting step of the turnover of organic N
in plant–soil N cycling. However, progress in characterizing the cycling
and role of more complex organic N molecules, such as AAs bound in
larger peptides and proteins (>1 kDa), has been hampered by two
methodological issues. One is the need for testing the optimal
hydrolysis of peptides and proteins, and the other is separating as many
isotopically labeled AAs as possible.
To analyze proteinogenic AAs in plant and soil samples, it is
necessary to perform several analytical steps. The first step is breaking
the peptide bonds between individual AAs, which is commonly done
by acidic hydrolysis.10,11 The second step is purifying the hydrolysates
and isolating the AA fraction using a cation‐exchange column. For gas
chromatographic separation, the third and final step is making the AAs
more volatile by derivatizing them.
Several protocols have been used for acid hydrolysis, which
basically differ in the type and strength of acids, reaction temperature
and incubation time.12,13 Samples can be incubated in heating blocks,
ovens or microwave ovens. Joergensen et al14 reported similar results
when comparing microwave oven incubation for between 10 and
30min and oven incubation for 20 h. The benefit of the microwave
oven is the reduction in incubation time. The hydrolysis of protein
bonds of the hydrophobic AAs, valine, isoleucine and leucine, may
require an extended hydrolysis time up to 72 h.15 However, hydrolysis
is a harsh treatment that may also destroy AAs. A typical result is
deamination of asparagine and glutamine into aspartate and glutamate,
respectively, and the destruction of tryptophan and cysteine.15 In
addition, residual oxygen left in the hydrolysis reaction vessel may
induce thermal breakdown, resulting in reduced recovery of the
hydroxyl‐ and C‐heavy AAs, such as serine, threonine, tyrosine and
methionine.12 Thus, it is challenging to balance the release of strongly
bound AAs against the loss of labile AAs. We here selected two
methods for investigation, differing in temperature and hydrolysis
length, reported in recent literature.13,16
Theanalysisof labeledAAs isperformedbycompound‐specificstable
isotope analysis (CSIA), using either gas chromatography/combustion‐
FIGURE 1 Step‐by‐step structural information of the two amino acid derisopropyl esterification (B)
isotope ratio mass spectrometry (GC/C‐IRMS) or liquid chromatography
(LC) coupled to either IRMS or to time‐of‐flight mass spectrometry
(TOF‐MS). GC/C‐IRMS analysis requires the derivatization of AAs to
make them volatile, but the derivatization step introduces extra carbon
atoms to the AAs and thereby induces a potential error in measurement
of δ13C values,which have to be adjusted by correction factors calculated
for each individual AA.17,18WehereusedGC/C‐IRMS, since it is themost
widely usedmethod to rapidly separate multiple AAs.
In selecting the most appropriate derivatization method for
GC/C‐IRMS, several issues must be taken into account.19,20 These
include the number of C atoms introduced, the stability of the
derivative, the ease of handling and use of hazardous reagents, the
effect of the derivative on the durability of the combustion oven,
and the type of study in terms of natural isotope abundance or
experimental labeling. Corr et al19 compared seven derivatization
methods, two of which they detailed in a subsequent study,21
namely N‐acetyl methyl esterification (NACME) and N‐acetyl
isopropyl esterification (NAIP), as depicted in Figure 1. Corr et al21
recommended the NACME method as it only introduces the small
number of additional C atoms and had the smallest errors associated
with δ13C value determinations. Yet, a disadvantage of NACME
compared with NAIP derivatization22 is that it is harder to obtain a
good GC baseline separation.13,23 The NAIP method has the
disadvantage that it introduces five C atoms (Figure 1) and is thus
associated with a potentially greater error on the measured δ13C
values; this may be of particular concern in natural abundance
studies. However, when working with experimental labeling the main
concern is not related to (relatively small) errors on the measured
δ13C values, but rather to kinetic isotope effects,18 arising from the
faster reaction of lighter than heavier atoms. Thus, for experimental
isotope labeling studies, the most important criterion is choosing a
method with superior baseline separation. For this reason, we used
the NAIP derivatization method.
The aim of this study was to refine and test the GC/C‐IRMS
analysis of labeled AAs, both free and bound in peptides and proteins,
separating as many AAs as possible to be used in experimental labeling
studies. We compared the recovery of AAs from a standard protein
using two common acid hydrolysis protocols: standard hydrolysis in
6N HCl for 20 h at 110°C12 and fast hydrolysis in 6N HCl for
70min at 150°C.13 Finally, we then used the best methods for acid
hydrolysis on dual‐labeled (13C and 15N) clover shoot and root juice,
ivatization methods, i.e. N‐acetyl methyl esterification (A) and N‐acetyl

ENGGROB ET AL. 23
divided into four molecular weight (Mw) size fractions, to test the
power of the methods in separating the AA and then measuring the
isotopic enrichment of free and bound AAs in the clover.
2 | EXPERIMENTAL
2.1 | Amino acid preparation, derivatization andanalysis
2.1.1 | Standards and reagent
Twenty‐one individual unlabeled amino acid standards were purchased,
namely L‐alanine (Ala), L‐valine (Val), glycine (Gly), L‐leucine (Leu),
L‐isoleucine (Ile), L‐proline (Pro), L‐threonine (Thr), aspargine (Asn),
L‐aspartate (Asp), L‐serine (Ser), L‐glutamate (Glu), glutamine (Gln),
methionine (Met), L‐phenylalanine (Phe), L‐cysteine (Cys), hydroxy‐L‐
proline (Hyp), tryptophan (Trp), L‐tyrosine (Tyr), L‐lysine (Lys) and
norvaline (Avl) from Sigma‐Aldrich (St Louis, MO, USA) and D‐(−)‐
norleucine (Nle) from Alfa Aesar (Thermo Fisher Scientific, Heysham,
UK). D‐(−)‐Norleucine and norvaline were used as internal standards
(ISTDs). All solvents used were of HPLC grade and purchased from
VWR International (Herlev, Denmark).
2.1.2 | Acid hydrolysis
In order to release AAs from protein and peptide bonds, the samples
were exposed to a standard acidic hydrolysis16 and a fast acidic
hydrolysis.13 The two methods were tested (with three replicates
of the entire procedure) on 10 μL of a bovine serum albumin (BSA)
protein standard (200mgmL−1) in 16 × 100 soda‐lime disposable cul-
ture tubes (Duran Group, Mainz, Germany). BSA was chosen as a
protein standard to test the influences of the hydrolysis because it
is a relatively small, water‐soluble, standardized protein, and there-
fore directly comparable with the easily degradable DON (dissolved
organic nitrogen) compounds found in the juice fraction of the white
clover. For both methods, 1 mL 6M HCl was added to the sample
under an N2 atmosphere to eliminate oxygen and the culture tubes
were sealed to prevent oxygen penetration. In the standard
hydrolysis procedure, the samples were heated to 110°C for 20 h
using aluminum blocks, while, in the fast hydrolysis, samples were
heated to 150°C for 70min using aluminum blocks. After hydrolysis,
the AAs were purified and derivatized before GC/C‐IRMS analysis as
described below.
2.1.3 | Sample purification
Prior to derivatization, the hydrolyzed samples were purified, using a
modified version of the method of Amelung and Zhang.10 Solids and
lipophilic compounds were removed from the hydrolysate by adding
2mL n‐hexane/dichloromethane (DCM) (6:5, v/v), vortexing for 30 s
and centrifugation at 1000 g for 2min. The aqueous phase was then
transferred through a Pasteur pipette lined with glass wool into a
new glass tube, followed by 2 × 0.5mL 0.1M HCl to rinse the
pipette. An ISTD was then added to the aqueous sample, which
was diluted to 8mL with MilliQ water (Synergy® system, Millipore,
Molsheim, France) and transferred to a polypropylene column (10mL)
containing 1 g Dowex 50W‐X8 cation‐exchange resin (analytical
grade, 100–200 mesh, hydrogen form; Bio‐Rad Laboratory Inc.,
Hercules, CA, USA) and rinsed with 3 × 3mL 0.1M oxalic acid,
3 × 3mL 0.01M HCl and 3 × 3mL MilliQ water. Finally, the AAs
were eluted with 3 × 1mL 2.5M ammonium hydroxide solution
(Merck, Darmstadt, Germany). To avoid heating of the samples prior
to derivatization, the ammonium hydroxide solution was evaporated
by freeze centrifugation.
2.1.4 | Derivatization
The NAIP derivatization method was modified from Corr et al and
Larsen et al21,22 and tested on individual AA standards to assess and
optimize the stabilization of the derivatives. First, solutions of standard
AAs were dried as described above by freeze centrifugation. Next, the
dried AAs were added to 0.70mL acidified isopropanol, prepared by
transferring 1:4 cooled acetyl chloride to cooled isopropanol. The
reaction vessels were then flushed with N2, closed and placed in a
heating block at 75°C for 60min, followed by cooling to room
temperature (20°C) in aluminum blocks. After cooling of the sample, the
excess solvent was evaporated under a gentle N2 flow at 60°C. Any
residual acetate left over from the propylation was removed by the
addition and evaporation of 0.5mL DCM to ensure proper acetylation.
The derivatized AAs were acetylated by adding 0.75mL of an acetylation
mixture containing acetic anhydride, triethylamine and acetone (1:2:5,
v/v/v, 10min, 60°C). Excess solvent was evaporated under a gentle N2
flow for 8min at 60°C. Salts and precipitates were removed by adding
ethyl acetate and a saturated NaCl solution (1:1, v/v) and centrifuging
for 2min at 1500 g. After centrifugation, the organic phase was
transferred to a new test tube and gently evaporated under N2 flow at
room temperature. Residual water was removed by the addition and
evaporation of 0.5mL DCM. Finally, the derivatized AAs were dissolved
in ethyl acetate and transferred to GC glass vials.
2.1.5 | GC/C‐IRMS analysis
GC analyses were performed on a Trace GC Ultra gas chromatograph
interfaced to a TriPlus autosampler (both from Thermo Scientific,
Hvidovre, Denmark). The derivatives were separated with a VF‐23m
capillary column (60m × 0.25mm i.d. × 0.25 μm film thickness; Agilent
Technologies, Amstelveen, The Netherlands). The inlet was operated
with a temperature of 250°C in splitless mode, with a helium column
flow rate of 1.4mLmin−1. The temperature gradient was as follows:
initial oven temperature set to 90°C for 1min, raised to 120°C at
15°C·min−1, then raised to 250°C at 3°C·min−1 and held at 250°C for
5–45min, depending on the AA retention time. The gas chromatograph
was coupled via a combustion reactor (GC IsoLink, Thermo Scientific),
oxidation at 1000°C, to a Delta V Plus isotope ratio mass spectrometer
(Thermo Scientific). All mass spectrometer related parameters were
controlled by Isodat version 3.0 software (Thermo Scientific). All δ13C
values are reported relative to the Vienna PeeDee Belemnite (VPDB)
international isotope standard. All δ15N values are reported relative to
atmospheric N2. A standard curve based on analyses of Asn with

24 ENGGROB ET AL.
increasing percentages of dual‐labeled Asn (13C4,15N2) showed a
strong linearity of all δ13C and δ15N values, with increasing amounts
of dual‐labeled Asn (13C4,15N2), with a coefficient of determination of
R2 = 0.984 and R2 = 0.982, respectively. The AAs were identified by
the retention time of standards and the concentration calculated
relative to individual standard curves.
2.1.6 | Correction factor and kinetic isotope effect(KIE)
The obtained δ13C values were converted into atomic fractions (AFs)
using the following equation:17
AF ¼VPDB 10−3δ13Cþ 1
� �
1þ VPDB 10−3δ13Cþ 1� � (1)
To adjust for the carbon added during the derivatization a
correction factor, AFL, was calculated for each AA according to:17
AFL ¼ yþ xð ÞAFD − xAFUy
(2)
where y is the number of added C atoms, x is the number of C atoms
in the AA, AFD is the δ13C atomic fraction of the derivatizied AA, and
AFU is the δ13C atomic fraction of the underivatizied AA.
The AF of the enriched AA can now be calculated as:
AFAA ¼ xþ yð ÞAFAAD − yAFLx
(3)
During derivatization, isotopic fractionation occurs when bonds
involving heavier isotopes are broken, thereby creating a kinetic
isotopic effect (KIE).18 The KIE can be calculated according to the
following equation:
KIE ¼ − 1þ AFL xþ yð Þ1000z
� �(4)
where z is the number of functional groups available for acetylation.
2.2 | Determination of limit of detection (LOD) andlimit of quantification (LOQ)
Typically, the LOD and LOQ are calculated by multiplying the signal‐
to‐noise ratio by 3 for the LOD, and by 10 for the LOQ. This method,
unfortunately, does not take account of the stability of the signal or
background noise of the analysis. We applied the more stringent
three‐step method suggested by Harris24 and first established a
calibration curve for the AAs of interest, spanning from 0.75 to
7.5mM, carried out in triplicate. Secondly, eight standard mixtures,
containing all the AAs of interest, were analyzed at an equal low
concentration of 0.75mM to reflect the stability of the analyses.
Thirdly, eight blind samples were analyzed to reflect the stability of
the background noise. The lowest detectable signal (ydl), LOD and
LOQ were determined using the following equations:24
ydl ¼ yblank þ 3·s (5)
LOD ¼ 3·sm
(6)
LOQ ¼ 10·sm
(7)
where yblank is the average of the signal obtained from blind
samples, s is the standard deviation from the analysis of standards
in mixtures, and m is the slope of the standard curve determined
for individual AAs.
2.3 | Test of analytical procedure on AAs in whiteclover
2.3.1 | Cultivating and labeling of white clover
White clover was sown in pots containing sand and irrigated once a
week for the first 8weeks, twice a week for the next 5weeks and
three times a week for the last 6weeks. The water used for irrigation
contained 3 at% 15N‐PK fertilizer. From week 8 and onwards, the
clover was labeled with 13CO2 prior to irrigation as previously
described.25 Briefly, 5mL of a saturated solution of sodium
bicarbonate (13C 99at%) dissolved in 1M NaOH was placed in a beaker
in each pot of clover. The pot was then covered with a transparent
plastic bag and 5mL 2M HCl was added to the 13C‐bicarbonate
solution, hence releasing 13CO2. After 2 h the labeling was stopped by
removing the plastic bags.
2.3.2 | Harvest and preparation of juice samples
White clover was harvested after 19weeks of growth and divided into
shoot and root biomass by cutting the shoots at the sand surface (i.e.
everything containing chlorophyll was considered a part of the
shoots). The shoots were rinsed with water and dabbed dry with a
towel. The roots were carefully separated from the sand and rinsed
in the same manner.
Juice from shoots and roots was extracted by screw pressing.26
The resulting juice was centrifuged at 10.000 g for 30min followed
by filtration through a 0.45 μm syringe CA filter (VWR International,
Søborg, Denmark).
Prior to determination of AAs, the juice was subjected to
molecular weight (Mw) size fractionation to reduce interference from
larger molecules. Molecular weight size fractionation was performed
by a modified ultrafiltration method27 using 20‐mL centrifugal filter
tubes (Macrosep® Advance, Pall Corporation, Ann Arbor, MI, USA)
equipped with permeable membranes of pore sizes 1, 10, and
100 kDa. First, each centrifugal tube was washed with 0.1 N HCl
and rinsed with MilliQ water three times before use. Then, the juice
was added to the 100 kDa filter tubes and centrifuged at 5000 g for
up to 180min. After centrifugation of the juice sample, the filter was
washed twice by adding 5.0mL MilliQ water to the filter and
centrifuged at 5000 g for up to 60min. The filtrate that had passed
through the 100 kDa filter was collected and the process was
repeated for the 10 kDa and 1 kDa filters. The residues that had
not passed through the filters were washed out by shaking the filter

ENGGROB ET AL. 25
three times in 5.0mL MilliQ water. The fractionation procedure
eventually resulted in four size fractions of juice from both root
and shoot biomass, i.e. >100 kDa, 10–100 kDa, 1–10 kDa
and <1 kDa. All fractionated samples were stored frozen until
derivatization and analysis as described above.
2.4 | Data analysis and statistics
The influence of the hydrolysis and the Mw size distribution on the
atomic fraction was tested with a linear mixed‐effects model using
the statistical analysis program R (version 3.3.1; R Core Team,
2016).28 For statistical analysis, the datasets were divided into sub-
sets; each subset was tested for normal distribution by the Shapiro–
Wilk normality test and for homogeneity of variances by the Bartlett
test. Models describing each subset were tested by either an analysis
of variance (ANOVA) test or a pairwise test.
TABLE 1 Obtained retention times (s) of AAs after NAIP derivati-zation (ISTD= internal standard)
NAIP AAIndividualstandards (s)
Mixedstandards (s)
1 Ala 1232.3 1230
2 Val 1360.2 1360
3 AvlISTD 1438.5 1444
3 | RESULTS
3.1 | Efficiency of the hydrolysis
BSA standard solutions, subjected to the two acid hydrolysis methods
and GC/C‐IRMS analysis, revealed between 21 and 23 peaks, where
12 could be assigned to a specific AA or group of AAs, including one
peak from the ISTD. The total area ± SE of both identified and
unidentified AAs was significantly higher (P <0.001) with the standard
acid hydrolysis (1083 ± 104 Vs) than with the fast acid hydrolysis (636
Vs ± 55 Vs). The areas of identified AAs were 685 ± 46 Vs and
502 ± 39 Vs for the standard and fast hydrolysis, respectively. We
then calculated that the total recoveries, based on the identified
AAs, were 35.6% (±1.3%) and 31.8% (±1.5%) of the total mass of the
BSA standard for the standard and fast hydrolysis, respectively. The
recovery was significantly higher (P <0.04) with the standard acid
hydrolysis for 7 of the 11 identified AAs, whereas the fast acid
hydrolysis was comparable with the standard acid hydrolysis for the
remaining 4 identified AAs (Figure 2).
FIGURE 2 Recovery of 11 identified amino acids or groups of aminoacids from bovine serum albumin (BSA) standard solutions afterstandard acid hydrolysis (“black bars”) and fast acid hydrolysis (“greybars”). Data are mean ± standard error (n = 3); Asterisks indicatesignificant differences in the recovery among the hydrolysis methods
3.2 | Efficiency of the NAIP derivatization methodfor separating AAs
Individual AA standard solutions were derivatized to optimize the
gradient of the GC column for maximum separation of the AA.
We were able to obtain separation and stable retention time for
all 21 AAs in single standards with the NAIP method (Table 1).
Ala eluted first with a retention time of 1232 s and Lys eluted last
with a retention time of 5181 s (Figure S1, supporting information).
However, in mixed standards, Met and Cys disappeared, whereas
Pro + Thr (Pro/Thr) eluted simultaneously with retention times of
1886 s and Asn + Asp (Asx) eluted simultaneously with retention
times of 2000 s. In addition, the ISTD Avl eluted simultaneously
with Gly; we, therefore, decided to use Nle as the ISTD for the
sample analysis.
3.3 | LODs and LOQs for the C‐IRMS analysis
Using the three‐step methodology suggested by Harris,24 we deter-
mined the LODs and LOQs for 15 AAs or co‐eluting AAs using
NAIP derivatization for C‐IRMS analysis (Table 2). The LODs
ranged from 0.17 pmol for Leu to 1.47 pmol for Lys. The LOQs
ranged from 0.55 pmol for Ser to 4.89 pmol for Lys. The LOD
was below 1 pmol for seven AAs and below 2 pmol for another
four AAs.
4 Gly 1443.8 1444
5 Leu 1465.3 1464
6 Ile 1477.6 1478
7 NleISTD 1556.2 1554
8 Pro 1874 1886
9 Thr 1883 1886
10 Asn 1996.8 2000
11 Asp 2001 2000
12 Ser 2058 2051
13 Glu 2197 2190
14 Gln 2295.9 2297
15 Met 2347.3 ‐
16 Phe 2434 2436
17 Cys 2443–2445 ‐
18 Hyp 2523.9 2523
19 Trp 2840.3 2979
20 Tyr 3553.6 3589
21 Lys 5188.6 5181

TABLE 2 The standard equation, the LOD and LOQ, lowest detectable signal (ydl) and13C AF stability for 15 AAs or co‐eluting AAs after
NAIP derivatization of non‐enriched standard mixtures for C‐IRMS analysis. (ISTD= internal standard). AF stability of 13C is listed as the lowestconcentration with stable AF (p >0.05)
AAMolar mass(g/mol) Slope Intercept R2
ydl(signal intensity)
LOD C(pmol)
LOQ C(pmol)
AF stability(pmol)
Ala 89.09 7.714 3.284 0.9527 2.117 0.23 0.77 0.74
Val 117.15 2.949 1.039 0.9599 1.213 0.19 0.63 1.23
Gly 75.07 5.512 3.122 0.9489 2.100 0.25 0.85 0.74
Leu 131.17 9.443 3.733 0.9697 2.544 0.17 0.58 2.55
Ile 131.17 3.957 ‐0.473 0.9239 1.828 0.29 0.96 2.48
Nle ISTD 131.17 9.653 3.898 0.9691 3.947 0.34 1.12 0.75
Pro/Thr 115.13 6.224 9.858 0.9459 6.900 0.92 3.07 1.51
Asx 132.12 5.558 5.792 0.9691 3.138 0.28 0.92 2.52
Ser 105.09 7.081 −1.144 0.8589 3.013 0.16 0.55 0.74
Glu 147.13 4.464 1.485 0.9439 5.734 0.76 2.53 2.5
Gln 146.14 14.801 7.417 0.9731 8.358 0.35 1.18 0.75
Phe 165.19 7.813 6.359 0.9574 6.631 0.36 1.19 2.51
Hyp 131.13 4.662 7.828 0.8245 5.641 0.64 2.12 0.74
Tyr 181.19 5.231 7.937 0.9194 4.324 0.60 1.98 1.24
Lys 182.65 9.195 0.167 0.9081 18.88 1.47 4.89 2.5
26 ENGGROB ET AL.
3.4 | AAs in white clover samples
3.4.1 | Low Mw size fraction
The low Mw size fraction (<1 kDa) was analyzed both for free AAs and
for bound AAs after hydrolysis in order to release the AAs in small
peptides. We found that the unhydrolyzed samples contained 11 single
eluting AAs (Ala, Val, Gly, Leu, Ile, Ser, Glu, Gln, Phe, Tyr and Lys),
and two pairs of co‐eluting AAs: Pro/Thr, and Asx. The hydrolyzed
sample contained the same eluting AAs, except for Glu and Tyr, that
were completely lost. Furthermore, the amount of seven AAs (Asx,
Gln, Ser, Pro/Thr, Ala and Val) was significantly lower (P <0.03) after
acid hydrolysis, whereas four AAs (Phe, Leu, Ile and Gly) were
unaffected (P >0.09) by the hydrolysis (Figure 3).
FIGURE 3 The content of free amino acids (AAs) versus bound AAs in thusing the standard hydrolysis method to retrieve bound AAs
3.4.2 | High Mw size fraction
The three larger Mw size fractions (>1 kDa) were all subject to
hydrolysis prior to derivatization, in order to release all the
peptide‐ and protein‐bound AAs (Table S1, supporting information).
For the 1–10 kDa size fraction we detected, in both shoot and
root juice, six single eluting AAs (Ala, Val, Gly, Leu, Ile and Ser)
and one pair of co‐eluting AAs: Pro/Thr; with an additional co‐
eluting pair, Asx, found in the shoot juice. For the 10–100 kDa size
fraction, both shoot and root juice gave four single eluting AAs
(Val, Leu, Ile and Phe). For the >100 kDa size fraction, both shoot
and root juice gave 10 single eluting AAs (Ala, Val, Gly, Leu, Ile,
Ser, Gln, Phe, Tyr and Lys), and two pairs of co‐eluting AAs:
Pro/Thr, and Asx.
e <1 kDa Mw size fraction for (A) root juice and (B) shoot juice (n = 3)

ENGGROB ET AL. 27
3.5 | Enrichment of AAs in clover samples
The correction factor and KIE were calculated based on obtained
δ13C data from analysis of underivatizied AA standards on a Flash
elemental analyzer (Thermo Scientific) and GC/C‐IRMS analysis of
derivatized AA standards; the KIE values were 0.13 ± 0.06‰
(Table 3). The correction factor reflects the contribution of 13C from
the added C atoms during derivatization. The correction factor must
therefore be significantly lower than the 13C atomic fraction of the
samples for the results to be reliable. In the present study, the 13C
atomic fraction for AAs was five to ten times higher than the
correction factor, substantiating that, for 13C‐enriched samples, the
number of C atoms added with the NAIP derivatization is not an
issue of concern.
In the low Mw size fraction (<1 kDa) we found a linear relation-
ship, with a slope close to 1, between the 13C and 15N atomic fractions
for individual AAs as both free and bound for both shoot and root
juice (Figures 4A–4D).
The statistical comparison of the 13C atomic fractions in shoot and
root from unhydrolyzed versus hydrolyzed samples showed that there
was no significant difference between the atomic fraction obtained
from free and bound AAs in the <1 kDa fraction for both shoot
(p = 0.73) and root (p = 0.84). For the 15N atomic fraction in shoot
and root juice from hydrolyzed versus unhydrolyzed samples there
was no significant difference for Ile (p = 0.82) and Phe (p = 0.19) in
shoot juice and for Val (p = 0.15), Gly (p = 0.08), Leu (p = 0.27), Ser
(p = 0.41), Phe (p = 0.31) and Lys (p = 0.16) in root juice. For the three
larger Mw size fractions (>1 kDa) there were significant differences
between the atomic fraction obtained across Mw size fractions for
both 15N and 13C, except for Leu and Ser for 13C in shoot juice, and
TABLE 3 Correction factors and KIEs for individual AAs for theIRMS determination of 13C
AA Correction factor KIE [‰]
Ala 0.0106229 0.08
Val 0.0105033 0.11
Gly 0.0106524 0.07
Leu 0.0104997 0.12
Ile 0.0104222 0.11
Nle 0.0105710 0.12
Pro 0.0104943 0.10
Thr 0.0106344 0.13
Asn 0.0106472 0.23
Asp 0.0106316 0.13
Ser 0.0105209 0.12
Glu 0.0109726 0.14
Gln 0.0105238 0.00
Phe 0.0103794 0.15
Hyp 0.0105120 0.14
Tyr 0.0102663 0.14
Lys 0.0105582 0.30
Average 0.0105537 0.13
SE 0.0001444 0.03
Gln, Tyr and Lys for 13C in root juice (Figure 5 and Table S2,
supporting information). The 13C atomic fraction of AAs in shoot juice
generally had a higher 13C enrichment than root juice compared across
Mw size fractions (Figure 6).
4 | DISCUSSION
4.1 | Influence of hydrolysis and derivatization onrecovery of AAs
The recoveries of BSA from the two acidic hydrolysis methods, i.e.
35.6% (±1.3%) for standard hydrolysis and 31.8% (±1.5%) for
fast hydrolysis, are in line with previously reported recoveries of
approximately 30%.12 Based on the total recovery and the recovery of
individual AAs in BSA standard solutions, the standard acid hydrolysis
was chosen for the further work.
The NAIP derivatization method could separate and identify 13
proteinogenic AAs, one synthetic AA (Nle) used as the ISTD, and
two pairs of co‐eluting AAs. Compared with other methods,19,22 we
were uniquely able to separate Gln and Glu in a mixed standard and
we were also able to obtain signals from Hyp and Trp and to separate
Pro and Thr. Both Corr et al19 and Larsen et al16 showed co‐elution of
these two AAs with the NACME derivatization method using VF‐
23ms GC and TG‐200MS GC columns, respectively. Wang et al29
recently separated NACME‐derivatized Pro and Thr using a VF‐
35ms GC column, but further studies are required to test whether this
GC column is suited for AAs enriched in heavy isotopes.
We obtained markedly lower LODs and LOQs than previously
reported for the GC/C‐IRMS analysis of AAs. Walsh et al20 reported
a LOQ of 10–50 pmol and Sessions30 stated that the instrument
sensitivity for GC/C‐IRMS typically lies between 0.1 and 10 nmol.
Our LOQs ranged from 0.55 to 4.89 pmol with the lowest concentrations
with stable AFs ranging from 0.74 to 2.55 pmol of the non‐enriched
standards. The low LODs and LOQ for C‐IRMS were achieved in part
because at least five C atoms were added during NAIP derivatization
(Figure 1). As demonstrated in this study, the dilution of the13C‐labeled atoms is a relatively low source of error compared with
analyzing peaks next to or below the LOD and LOQ. The improvement
in LODs and LOQs for C analysis by using NAIP does not apply to the
N analysis since there is no addition of N atoms during the
derivatization. The low LODs and LOQs of the NAIP derivatization
are particularly important when analyzing labeled natural samples with
low AA concentrations.
4.2 | Content and enrichment of AAs in Mw sizefractionated clover shoot and root juice
As stated in the literature,12,15 a decline in the concentration of Asn,
Gln, Ser, Thr and Tyr is expected due to hydrolysis, along with an
increase in Val, Ile and Leu. Yet, we were surprised to find that the
AA concentration from the <1 kDa Mw size fraction was generally
lower after hydrolysis than the concentrations of free AAs (i.e. in the
unhydrolyzed samples). This indicated that the hydrolysis affects the
composition of AAs much more than previously recognized.11 This

FIGURE 4 The atomic fraction in free amino acids (AAs) versus bound AAs in the <1 kDa Mw size fraction for (A) 13C in shoot juice, (B) 15N inshoot juice, (C) 13C in root juice, and (D) 15N in root juice of experimentally labeled white clover (n = 3)
FIGURE 5 Example of the 13C atomicfraction of amino acids (AAs) in white clovershoot juice for different Mw size fractions:free AAs (black circles), AAs bound in 1–10 kDa fraction (dark grey triangles), AAsbound in 10–100 kDa fraction (light greysquares), and AAs bound in >100 kDa fraction(white diamonds). For free AAs both Glu andGln were measured (Glu omitted in thisfigure), whereas in the hydrolyzed Mw sizefractions >1 kDa, Glu/Gln is reported as Glx.Table S2 (supporting information) gives 13Cand 15N atomic fractions for AAs in all Mwsize fractions from white clover shoot androot juice (n = 3). Asterisks indicate significantdifferences in the obtained AFs. Doubleasterisks indicate no normal distribution
28 ENGGROB ET AL.
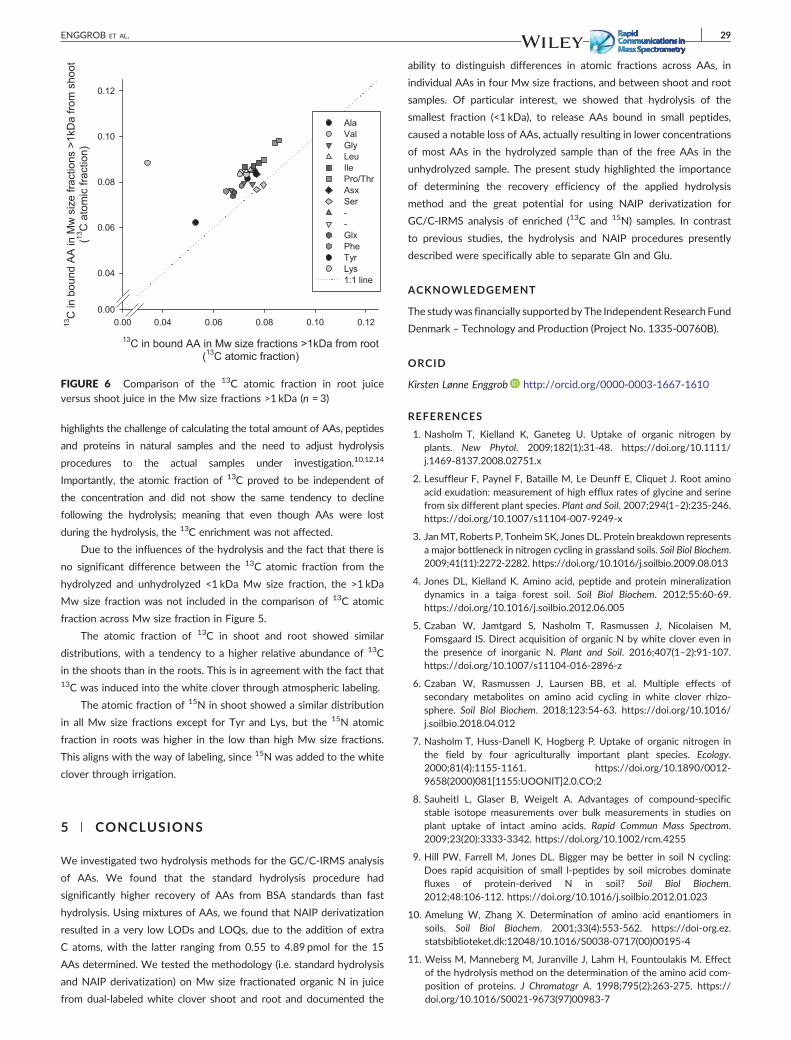
FIGURE 6 Comparison of the 13C atomic fraction in root juiceversus shoot juice in the Mw size fractions >1 kDa (n = 3)
ENGGROB ET AL. 29
highlights the challenge of calculating the total amount of AAs, peptides
and proteins in natural samples and the need to adjust hydrolysis
procedures to the actual samples under investigation.10,12,14
Importantly, the atomic fraction of 13C proved to be independent of
the concentration and did not show the same tendency to decline
following the hydrolysis; meaning that even though AAs were lost
during the hydrolysis, the 13C enrichment was not affected.
Due to the influences of the hydrolysis and the fact that there is
no significant difference between the 13C atomic fraction from the
hydrolyzed and unhydrolyzed <1 kDa Mw size fraction, the >1 kDa
Mw size fraction was not included in the comparison of 13C atomic
fraction across Mw size fraction in Figure 5.
The atomic fraction of 13C in shoot and root showed similar
distributions, with a tendency to a higher relative abundance of 13C
in the shoots than in the roots. This is in agreement with the fact that13C was induced into the white clover through atmospheric labeling.
The atomic fraction of 15N in shoot showed a similar distribution
in all Mw size fractions except for Tyr and Lys, but the 15N atomic
fraction in roots was higher in the low than high Mw size fractions.
This aligns with the way of labeling, since 15N was added to the white
clover through irrigation.
5 | CONCLUSIONS
We investigated two hydrolysis methods for the GC/C‐IRMS analysis
of AAs. We found that the standard hydrolysis procedure had
significantly higher recovery of AAs from BSA standards than fast
hydrolysis. Using mixtures of AAs, we found that NAIP derivatization
resulted in a very low LODs and LOQs, due to the addition of extra
C atoms, with the latter ranging from 0.55 to 4.89 pmol for the 15
AAs determined. We tested the methodology (i.e. standard hydrolysis
and NAIP derivatization) on Mw size fractionated organic N in juice
from dual‐labeled white clover shoot and root and documented the
ability to distinguish differences in atomic fractions across AAs, in
individual AAs in four Mw size fractions, and between shoot and root
samples. Of particular interest, we showed that hydrolysis of the
smallest fraction (<1 kDa), to release AAs bound in small peptides,
caused a notable loss of AAs, actually resulting in lower concentrations
of most AAs in the hydrolyzed sample than of the free AAs in the
unhydrolyzed sample. The present study highlighted the importance
of determining the recovery efficiency of the applied hydrolysis
method and the great potential for using NAIP derivatization for
GC/C‐IRMS analysis of enriched (13C and 15N) samples. In contrast
to previous studies, the hydrolysis and NAIP procedures presently
described were specifically able to separate Gln and Glu.
ACKNOWLEDGEMENT
The studywas financially supported by The Independent Research Fund
Denmark – Technology and Production (Project No. 1335‐00760B).
ORCID
Kirsten Lønne Enggrob http://orcid.org/0000-0003-1667-1610
REFERENCES
1. Nasholm T, Kielland K, Ganeteg U. Uptake of organic nitrogen byplants. New Phytol. 2009;182(1):31‐48. https://doi.org/10.1111/j.1469‐8137.2008.02751.x
2. Lesuffleur F, Paynel F, Bataille M, Le Deunff E, Cliquet J. Root aminoacid exudation: measurement of high efflux rates of glycine and serinefrom six different plant species. Plant and Soil. 2007;294(1–2):235‐246.https://doi.org/10.1007/s11104‐007‐9249‐x
3. JanMT, Roberts P, Tonheim SK, Jones DL. Protein breakdown representsa major bottleneck in nitrogen cycling in grassland soils. Soil Biol Biochem.2009;41(11):2272‐2282. https://doi.org/10.1016/j.soilbio.2009.08.013
4. Jones DL, Kielland K. Amino acid, peptide and protein mineralizationdynamics in a taiga forest soil. Soil Biol Biochem. 2012;55:60‐69.https://doi.org/10.1016/j.soilbio.2012.06.005
5. Czaban W, Jamtgard S, Nasholm T, Rasmussen J, Nicolaisen M,Fomsgaard IS. Direct acquisition of organic N by white clover even inthe presence of inorganic N. Plant and Soil. 2016;407(1–2):91‐107.https://doi.org/10.1007/s11104‐016‐2896‐z
6. Czaban W, Rasmussen J, Laursen BB, et al. Multiple effects ofsecondary metabolites on amino acid cycling in white clover rhizo-sphere. Soil Biol Biochem. 2018;123:54‐63. https://doi.org/10.1016/j.soilbio.2018.04.012
7. Nasholm T, Huss‐Danell K, Hogberg P. Uptake of organic nitrogen inthe field by four agriculturally important plant species. Ecology.2000;81(4):1155‐1161. https://doi.org/10.1890/0012‐9658(2000)081[1155:UOONIT]2.0.CO;2
8. Sauheitl L, Glaser B, Weigelt A. Advantages of compound‐specificstable isotope measurements over bulk measurements in studies onplant uptake of intact amino acids. Rapid Commun Mass Spectrom.2009;23(20):3333‐3342. https://doi.org/10.1002/rcm.4255
9. Hill PW, Farrell M, Jones DL. Bigger may be better in soil N cycling:Does rapid acquisition of small l‐peptides by soil microbes dominatefluxes of protein‐derived N in soil? Soil Biol Biochem.2012;48:106‐112. https://doi.org/10.1016/j.soilbio.2012.01.023
10. Amelung W, Zhang X. Determination of amino acid enantiomers insoils. Soil Biol Biochem. 2001;33(4):553‐562. https://doi‐org.ez.statsbiblioteket.dk:12048/10.1016/S0038‐0717(00)00195‐4
11. Weiss M, Manneberg M, Juranville J, Lahm H, Fountoulakis M. Effectof the hydrolysis method on the determination of the amino acid com-position of proteins. J Chromatogr A. 1998;795(2):263‐275. https://doi.org/10.1016/S0021‐9673(97)00983‐7

30 ENGGROB ET AL.
12. Fountoulakis M, Lahm H. Hydrolysis and amino acid composition anal-ysis of proteins. J Chromatogr A. 1998;826(2):109‐134. https://doi.org/10.1016/S0021‐9673(98)00721‐3
13. Yarnes CT, Herszage J. The relative influence of derivatization and nor-malization procedures on the compound‐specific stable isotopeanalysis of nitrogen in amino acids. Rapid Commun Mass Spectrom.2017;31(8):693‐704. https://doi.org/10.1002/rcm.7832
14. Joergensen L, Thestrup H. Determination of Amino‐Acids in Biomassand Protein Samples by Microwave Hydrolysis and Ion‐ExchangeChromatography. J Chromatogr A. 1995;706(1–2):421‐428. https://doi.org/10.1016/0021‐9673(94)01107‐P
15. Roberts P, Jones DL. Critical evaluation of methods for determiningtotal protein in soil solution. Soil Biol Biochem. 2008;40(6):1485‐1495.https://doi.org/10.1016/j.soilbio.2008.01.001
16. Larsen T, Bach LT, Salvatteci R, et al. Assessing the potential ofamino acid C−13 patterns as a carbon source tracer in marine sedi-ments: effects of algal growth conditions and sedimentary diagenesis.Biogeosciences. 2015;12(16):4979‐4992. https://doi.org/10.5194/bg‐12‐4979‐2015
17. Tetens V, Kristensen N, Calder A. Measurement of C‐13 Enrichmentof Plasma Lactate by Gas Chromatography/isotope Ratio Mass‐Spectrometry. Anal Chem. 1995;67(5):858‐862. https://doi.org/10.1021/ac00101a011
18. Docherty G, Jones V, Evershed R. Practical and theoretical consider-ations in the gas chromatography/combustion/isotope ratio massspectrometry delta C‐13 analysis of small polyfunctional compounds.Rapid Commun Mass Spectrom. 2001;15(9):730‐738. https://doi.org/10.1002/rcm.270
19. Corr LT, Berstan R, Evershed RP. Optimisation of derivatisation proce-dures for the determination of delta C‐13 values of amino acids by gaschromatography/combustion/isotope ratio mass spectrometry. RapidCommun Mass Spectrom. 2007;21(23):L3759‐L3771. https://doi.org/10.1002/rcm.3252
20. Walsh RG, He S, Yarnes CT. Compound‐specific delta C‐13 and deltaN‐15 analysis of amino acids: a rapid, chloroformate‐basedmethod for ecological studies. Rapid Commun Mass Spectrom.2014;28(1):96‐108. https://doi.org/10.1002/rcm.6761
21. Corr LT, Berstan R, Evershed RP. Development of N‐acetyl methylester derivatives for the determination of delta(13) C values of aminoacids using gas chromatography‐combustion‐isotope ratio mass spec-trometry. Anal Chem. 2007;79(23):9082‐9090. https://doi.org/10.1021/ac071223b
22. LarsenT, Ventura M, Andersen N, O'Brien DM, Piatkowski U, McCarthyMD. Tracing Carbon Sources through Aquatic and Terrestrial FoodWebs Using Amino Acid Stable Isotope Fingerprinting. PLoS One.2013;8(9):e73441. https://doi.org/10.1371/journal.pone.0073441
23. Sabadel AJM, Woodward EMS, Van Hale R, Frew RD. Compound‐spe-cific isotope analysis of amino acids: A tool to unravel complexsymbiotic trophic relationships. Food Webs. 2016;6:9‐18. https://doi.org/10.1016/j.fooweb.2015.12.003
24. Harris DC (Ed). Quality Assurance and Calibration Methods. In: Quanti-tative Chemical Analysis. 7th ed. New York: W. H. Freeman andCompany; 2007:78‐95.
25. Rasmussen J, Gjettermann B, Eriksen J, Jensen ES, Hogh‐Jensen H.Fate of (15) N and (14) C from labelled plant material: Recovery inperennial ryegrass‐clover mixtures and in pore water of the sward. SoilBiol Biochem. 2008;40(12):3031‐3039. https://doi.org/10.1016/j.soilbio.2008.08.025
26. Colas D, Doumeng C, Pontalier PY, Rigal L. Green crop fractionation bytwin‐screw extrusion: Influence of the screw profile on alfalfa(Medicago sativa) dehydration and protein extraction. Chem Eng Pro-cess. 2013;72:1‐9. https://doi.org/10.1016/j.cep.2013.05.017
27. PourretO,Dia A, DavrancheM, GruauG,HeninO, AngeeM.Organo‐colloi-dal control on major‐ and trace‐element partitioning in shallowgroundwaters: Confronting ultrafiltration and modelling. Appl Geochem.2007;22(8):1568‐1582. https://doi.org/10.1016/j.apgeochem.2007.03.022
28. R Core Team. R: A language and environment for statistical computing.Vienna, Austria: R Foundation for Statistical Computing; 2016 Avail-able at https://www.R‐project.org/.
29. Wang YV, Wan AHL, Lock E, Andersen N, Winter‐Schuh C, Larsen T.Know your fish: A novel compound‐specific isotope approach for trac-ing wild and farmed salmon. Food Chem. 2018;256:380‐389. https://doi.org/10.1016/j.foodchem.2018.02.095
30. Sessions AL. Isotope‐ratio detection for gas chromatography. J Sep Sci.2006;29(12):1946‐1961. https://doi.org/10.1002/jssc.200600002
SUPPORTING INFORMATION
Additional supporting information may be found online in the
Supporting Information section at the end of the article.
How to cite this article: Enggrob KL, Larsen T, Larsen M,
Elsgaard L, Rasmussen J. The influence of hydrolysis and
derivatization on the determination of amino acid content
and isotopic ratios in dual‐labeled (13C, 15N) white clover.
Rapid Commun Mass Spectrom. 2019;33:21–30. https://doi.
org/10.1002/rcm.8300

56
Paper 2
Molecular size doesn't matter for turning over large organic N in soil
Kirsten Lønne Enggrob, Thomas Larsen, Jim Rasmussen
Prepared for sumbission to Nature

1
Original paper Date of preparation: 30-01-2019 1
Pages: 18 Figures: 5 Extended Data Figures: 4 Extended Data Tables: 5 2
3
Molecular size doesn’t matter for turning over large organic N in soil 4
5
Kirsten Lønne Enggrob,1 Thomas Larsen,2 and Jim Rasmussen1* 6
7
1Department of Agroecology, Faculty of Science and Technology, Aarhus University, Denmark. 8
2Department of Archaeology, Max Planck Institute for the Science of Human History, Jena, 9
Germany. 10
*Corresponding author: Post Box 50, 8830 Tjele, Denmark, [email protected] 11
12
13
Summary 14
Global nitrogen use efficiency urgently needs to increase to reduce environmental emissions. This 15
necessitates better predictions of the cycling of organic nitrogen from plants into stable soil organic 16
carbon and nitrogen pools. We investigated the fate of peptide-size and protein-size fractions in 17
soils from two long-term field experiments markedly differing in condition for microorganisms. 18
Contrary to the present paradigm, we found for both soils that exo-enzymatic depolymerization was 19
not per se the rate-limiting step in the turnover of these compounds neither was protection via 20
strong sorption to the soil mineral phase. Instead, we found strong evidence that gram-positive 21
bacteria are the key actors in the decomposition of protein-sized nitrogen compounds and that large 22
organic nitrogen compounds contribute directly to bacterial tissue build-up. We conclude that when 23
large organic nitrogen compounds are dissolved, turnover occurs rapidly, irrespective of molecular 24

2
size, and that the bacterial incorporation of these rapid cycling compounds makes an important 25
contribution to soil organic matter formation. 26
27
Main text 28
Turnover and stabilization of soil carbon (C) and nitrogen (N) are critical processes for enhancing N 29
use efficiency in cultivated soils and mitigating increasing atmospheric loads of greenhouse gases 30
through soil C sequestration1. Carbon plays a pivotal role for N-cycling in soils because one-third of 31
stored C is bound in compounds containing N2. Thus, to enhance soil C storage it is vital to improve 32
our understanding the fate of organic N compounds. The present view on soil organic matter (SOM) 33
formation3,4 implies that microbial turnover is key to C and N stabilization5,6, which requires insight 34
in the short-term cycling of labile organic compounds. During litter decomposition, small plant-35
derived compounds, like amino acids and sugars, turn over within hours or days7,8, which may 36
contribute to the build-up of microbial biomass9 and eventual SOM stabilization in the microbial 37
necromass10,11. However, the turnover rates of the larger (>1 kDa) soluble compounds derived from 38
plants and their role in the formation of SOM is only scarcely examined. 39
40
Soil organic matter is composed of progressively decomposing organic compounds in a continuum 41
of size classes4. In the soil continuum model, Lehmann and Kleber4 makes a generally accepted 42
distinction between small biopolymers (<0.6 kDa) that can be directly assimilated by 43
microorganisms and larger compounds (>0.6 kDa) requiring extracellular depolymerization prior to 44
microbial assimilation. The majority of organic N compounds enter the soil in the form of proteins 45
inevitably larger than 0.6 kDa12 and the depolymerization of proteins to peptides and amino acids 46
are considered the bottleneck in the turnover of organic N13. The slower turnover of proteins14,15 47
than of small peptides and amino acids is considered to be a result of strong retention of proteins in 48

3
the soil mineral phase15,16 or the need for production of complex energetically demanding exo-49
enzymes, which represents a risky investment for the microorganisms in the soil ecosystem17. It has 50
also been suggested that peptides are strongly bound to the soil mineral phase2, but it is not clear 51
whether these peptides are bound in the original form or in microbial necromass11. Therefore, to 52
determine the mechanisms controlling large molecular weight (Mw) organic N cycling in soil, we 53
studied the short-term fate of non-structural organic N compounds in four molecular size classes 54
above the 0.6 kDa threshold for assimilation in soil. We triple-labeled (14C, 13C, 15N) white clover 55
during the growth phase and retrieved non-structural organic N compounds from shoots via screw 56
pressing and molecular size fractionation of the resulting plant juice18. The decomposition of these 57
organic N fractions was determined in topsoil from long-term field experiments (LTE) with 58
contrasting pH and fertilizer management; specifically the Jyndevad LTE on liming and phosphorus 59
fertilization initiated in 194219 and the Askov LTE on animal manure and mineral fertilizer initiated 60
in 189420. We determined organic N sorption and mineralization, investigated to which extent the 61
organic N compounds were retained in their original forms or had been metabolized using amino 62
acid (AA) stable isotope probing (SIP)18, and we identified active microbial groups metabolizing 63
the labeled organic N using phospholipid acid stable isotope probing (PLFA-SIP)21. 64
65
Larger organic N size reduces mineralization 66
The release of CO2 from organic N mineralization followed first-order kinetics without a lag-phase 67
across all Mw size fractions (1-10, 10-30, 30-100, >100 kDa) and soil pH levels (low: pHCaCl2 3.6; 68
medium: pHCaCl2 5.4; high: pHCaCl2 7.1) (Fig. 1a-d). This shows that the microbial community was 69
immediately capable of decomposing the added organic N compounds across all pH levels, 70
although proteolysis is believed to be under strong pH control22. However, the accumulated CO2 71
released decreased with increasing molecular size. In the 1-10 kDa fraction, 40-45% of added 14C 72

4
was respired as 14CO2 after 14 days at all soil pH levels (Fig. 1a). Likewise the 10-30 kDa fraction 73
in the high pH soil resembled the mineralization patterns often found for small organic N 74
compounds (< 1kDa)8,23. Respiration from the low pH soil decreased with increasing molecular size 75
compared to the medium and high pH soils (Fig. 1b-d). Based on the C/N ratios (Extended Dsata 76
Table 1), the 1-10, 10-30 and 30-100 kDa fractions most likely contained C-compounds other than 77
organic N, which may have contributed to 14CO2 production. Nevertheless, the level of respiration 78
halved from the 1-10 kDa to both the 30-100 kDa and >100kDa fractions. Classically this would be 79
interpreted as a bottleneck in the decomposition of organic N above the Mw of 30 kDa14,15 with a 80
more pronounced bottleneck under less favorable conditions (i.e. in the 10-30 kDa range at low pH) 81
and less pronounced under more favorable conditions (i.e. in the 30-100 kDa range at high pH). 82
83
Three main mechanisms can explain the reduced respiration with increasing organic N molecular 84
sizes: (i) increased protection with higher molecular size making organic N inaccessible for 85
microorganisms15,16, (ii) an increase in ex vivo modification of the original compounds6 or (iii) a 86
higher microbial C use efficiency with increasing molecular sizes (i.e. a shift from catabolism to 87
anabolism)6. We first examined relationships between respiration and organic N sorption 88
determined as removal of labeled (13C, 15N) organic N compounds from soil solution after one hour. 89
We found a negative correlation between respiration and sorption of organic N (Fig. 1e-f) indicating 90
that microbial decomposition is controlled the accessibility of organic N24,25. In addition, we found 91
a significantly larger recovery after 14 days of added 13C in soil for the >100 kDa fraction compared 92
to the 1-10 kDa fraction (Extended Data Table 2). In order to elucidate to what extent the added 93
organic N compounds were retained in their original form, we determined the isotopic signatures of 94
soil-bound amino acids for the 1-10 kDa fraction where a bottleneck was not observed and the >100 95
kDa fraction where the bottleneck was most pronounced and present in all studied soils. 96

5
97
Organic N not retained in original form 98
Across all pH levels and organic N fractions, the lowest recoveries of individual amino acids 99
(generally leucine, lysine, phenylalanine) were close to zero (Fig. 2). In general, when organic N in 100
form of proteins or peptides is decomposed it occur via proteases breaking peptide bonds either on 101
terminal amino acids releasing single amino acids or on internal peptide bonds releasing peptide 102
fragments of various length. Assuming equal degradation of the added organic N compounds the 103
low recoveries means that the organic N compounds were decomposed rather than retained in their 104
original form. The recovery levels across individual amino acids were 0-20% for the 15N tracer and 105
1-30% for the 13C tracer with significant decoupling of the remaining 13C and 15N in individual 106
amino acids (Fig. 2). The 13C and 15N decoupling further supports the microbial decomposition of 107
the added organic N compounds, as deaminating amino-groups is often the initial step in during 108
microbial metabolism26. It is unlikely that our low recovery of the dual-labeled amino acids is 109
associated with the hydrolysis procedure27 as the isotopic ratios of amino acids are unaffected by 110
amino acid decomposition during hydrolysis18. Further, it is highly unlikely that chemical sorption 111
of the originally added amino acids in peptides and proteins explains the low recovery as such 112
processes would result in similar or consistent recoveries across all amino acids. Thus, our amino 113
acid 13C and 15N is representative of the isotopic signature prior to extraction and, despite the 114
pronounced sorption to the soil of the added organic N compounds (Fig. 1e-f), the organic N was 115
not protected against microbial decomposition. Hence, any sorption of large organic N must be an 116
equilibrium between the soil matrix and soil solution allowing decomposition and the lower 117
mineralization to 14CO2 observed for the >100 kDa fraction than for the 1-10 kDa fraction. This 118
together with the similar levels of amino acids remaining implies that the >100 kDa organic N is 119
involved in microbial anabolism to a greater extent than the 1-10 kDa organic N6. 120

6
121
To confirm that the almost complete degradation of >100 kDa organic N was not due soil specific 122
conditions, we validated our findings for the protein-sized fraction (>100 kDa) using soils from the 123
Askov LTE. Soil from Askov is more clayey than the Jyndevad soils20 (Extended Data Table 3 & 124
4), and the long-term experimental treatments have resulted in different microbial communities28,29 125
and fertility levels30. The degradation patterns of the >100 kDa fraction across the fertility levels in 126
the Askov soils resembled those observed at the different soil pH levels in Jyndevad soils. The 127
mineralization to 14CO2 reached 15-20% after 14 days (Fig. 3a) and had a negative relationship to 128
sorbed organic N (Fig. 3b-c). The added organic N was degraded with less than 25% of the 13C and 129
15N in bound amino acids remaining after two weeks at all three fertility levels (Fig. 3d-f), thereby 130
corroborating the equilibrium between sorbed and dissolved organic N as aforementioned. This is 131
remarkable especially for the soil unfertilized since 1894 and known to be unsaturated with organic 132
matter31 and thus exhibiting strong potential for sorption32. 133
134
The patterns of amino acid decomposition were surprising. Amino acids with more complex 135
biosynthetic pathways (e.g. leucine, lysine, phenylalanine) were decomposed at a greater rate than 136
the simpler amino acids (alanine, asparagine/aspartate, glutamine/glutamate) (Fig. 2d-i and 3d-f), 137
which diverges from the expected direct anabolic microbial use of amino acids to reduce energy for 138
de novo synthesis33. The results can neither be explained by different additions of these specific 139
amino acids in the 1-10 and >100 kDa fractions (Extended Data Fig. 1) nor by changes in soil 140
amino acid composition upon organic N addition (Extended Data Fig. 2). It is also notable that more 141
amino acids remained in the 1-10 kDa than >100 kDa fractions at Jyndevad medium and high pH 142
soils underlining that greater molecular size does not protect against degradation. Moreover, 13C 143
and 15N decoupling were highest for the 1-10 kDa fraction with more 13C than 15N remaining at all 144

7
Jyndevad pH levels. The most likely explanation for this decoupling is a higher rate of deaminating 145
amino-groups during microbial metabolism26 than catabolizing amino acid carbon skeletons. The C 146
and N decoupling were highest for amino acids associated with aminotransferases, thus supporting 147
that bacterial cells incorporated intact amino acid from the soil medium. In other words, simpler 148
amino acids such as alanine and asparagine were incorporated intact into microbial tissue to a 149
greater extent than more complex amino acids such as lysine and phenylalanine. Interestingly, 150
simpler amino acids, alanine, asparagine/aspartate, glutamine/glutamate, and glycine, are typically 151
among the most abundant constituents of the peptidoglycan layers of bacterial cell walls34-36. Hence, 152
our findings support substantial incorporation of organic N by microbial cells. 153
154
Bacteria are doing the work 155
To elucidate microbial groups active in organic N turnover, we determined the incorporation of 13C 156
in PLFA. All microbial groups were 13C enriched after 14 days of the incubation, but bacteria 157
dominated the specific incorporation of 13C from both the 1-10 kDa and >100 kDa fractions across 158
all soils (Fig. 4c-e). Both bacteria and fungi have the capacity to facilitate exo-enzymatic 159
depolymerization with gram-positive bacteria and fungi typically contributing to the degradation of 160
complex compounds and gram-negative generally decomposing lower Mw compounds37. The 161
specific incorporation of 13C in microbial PLFA from the protein-sized organic N compounds 162
showed a surprisingly similar pattern across all Jyndevad pH levels (Fig. 4d) and Askov fertilizer 163
treatments (Fig. 4e). In all soils, gram-positive bacteria had a significantly higher specific 13C 164
incorporation from the >100 kDa fraction than gram-negative bacteria, and subsequently higher 13C 165
incorporation than fungi. Low soil pH is generally considered to reduce bacterial activity, thus 166
enhancing the relative importance of fungal activity38. Although fungi and gram-negative bacteria 167
activity (Fig. 4) and biomass (Extended Data Fig. 3) responded to organic N addition, the higher 168

8
activity of gram-positive bacteria on protein-sized organic N compounds show that this microbial 169
group must both have the proteolytic ability and uptake mechanisms to outcompete other microbial 170
groups for protein-derived organic N. The production of extracellular enzymes is expected to be 171
greater in gram-positive than in gram-negative bacteria where enzymes to a larger extent 172
accumulate in the periplasmic space rather than being exuded39. Furthermore, gram-positive 173
bacterial species can directly assimilate organic N well above the 0.6 kDa threshold 40,41. This 174
suggests that the gram-positive bacterial group outcompeted the gram-negative and fungal groups in 175
a two-step process involving depolymerization of protein-sized N and subsequent direct 176
assimilation of the released peptide helixes (Fig. 5a). Gram-negative bacteria needing organic N 177
smaller than the 0.6 kDa threshold for assimilation would then scavenge on any further 178
depolymerization of peptide N. A similar mechanism could apply to the 1-10 kDa fraction (Fig. 5b), 179
where the specific 13C incorporation showed an activity equivalent with gram-positive and gram-180
negative bacteria and a greater fungal activity than found with the >100 kDa fraction (Fig. 4c). As 181
mentioned previously, the 1-10 kDa fraction most likely contained labeled C-compounds other than 182
organic N, which could also have contributed to the 13C incorporation in microbial biomarkers; this 183
may explain the 13C incorporation in the fungal biomarker for this organic N fraction. In conclusion, 184
the results suggest that direct assimilation above the 0.6 kDa threshold may be more prevalent for 185
gram-positive bacteria than previously thought, and importantly the PLFA-SIP results identify a 186
microbial group active on the added organic N having the toolbox to rapidly turnover protein-sized 187
N. 188
189
Discussion 190
The rate-limiting step in soil organic N turnover is generally thought to be the depolymerization of 191
higher Mw organic N into lower Mw compounds that can be directly assimilated by 192

9
microorganisms and plants4,6,13. The rate of depolymerization is affected by sorption of the 193
substrate4,16 or exo-enzymes to the soil mineral phase42. The latter causing hindrance of exo-enzyme 194
activity due to the spatial separation from the substrate3 or by blockage of the enzyme reactive 195
sites15. In line with this, we found that increasing molecular size of added organic N reduced the 196
mineralization; a reduction in mineralization strongly correlated to sorption of the higher organic N 197
sizes. However, in all treatments, we saw a rapid degradation of the added organic N compounds 198
irrespective of molecular size (Fig. 2 and 3d-f). Such rapid dissipation of protein-sized organic N 199
could be expected in fertile agricultural soils13, but we were surprised to find that even in the low 200
productivity soil (low pH or unfertilized since 1894) with lower microbial biomass (Fig. 4a-b), the 201
remaining added organic N was at a similarly low level as in the more fertile soils. This shows that 202
the ability of the existing microbial biomass for depolymerization of large size organic N was 203
sufficient in these soils and that the high sorption of >100 kDa organic N in all soils did not prevent 204
an almost complete turnover of the added compounds. Thus, we demonstrate that depolymerization 205
of proteins is not per se the rate-limiting step in large size organic N turnover, neither is sorption of 206
protein-sized organic N to the soil mineral phase. In the latter, we show that sorbed organic N is in 207
equilibrium with the soil solution where dissolved organic N compounds are rapidly turned over; 208
i.e. sorption is not protecting the compounds. Instead, part of the plant-derived protein must – at 209
least short-term – be physically protected in cell structures, which needs to be degraded before 210
proteins can be turned over. Hence, in contrast to the presently viewed importance of proteolytic 211
enzymes43,44, other enzyme classes may play the key role in the eventual turnover of bound organic 212
N. In the long term, parts of the structurally bound organic N may be physically protected in 213
particulate organic matter predominately of plant origin32. 214
215

10
To study stabilization of plant-derived C, Liang et al.6 suggests to differentiate between in vivo 216
turnover and ex vivo modification, i.e. biotic, abiontic, and abiotic processes taking place inside or 217
outside a microbial cell. The rapid and almost complete dissipation of all large size organic N 218
fractions found in the present study and the incorporation of organic N derived 13C into bacterial 219
PLFAs point to in vivo turnover as the dominant route of decomposition. The turnover of >100 kDa 220
organic N was dominated by gram-positive bacteria, which have the exo-enzymatic tools to 221
depolymerize these large compounds. Thus, the potential for ex vivo modification should potentially 222
be higher for the >100 kDa organic N as would retention of modified compounds to the soil mineral 223
phase. However, our data do not support this. Therefore, large organic N primarily contributes to 224
SOM formation via build-up of microbial tissue, where incorporation of C and N in the short-225
chained peptides of bacterial cell walls potentially results in longer-term storage of plant-derived C. 226
Our study provides strong evidence for the hypothesis that C and N from labile compounds persist 227
in soil5, but rather than persisting due to protection of the original compounds3, the C and N persist 228
due to the incorporation via anabolic processes into microbial tissue. Furthermore, the rapid 229
turnover of large molecular size organic N compounds in our study suggests that it will be 230
beneficial to make a distinction between organic N contained inside the cell (non-structural5) and 231
within cell structures when predicting the release of plant-available N from plant residues. 232
Additionally, non-structural N inside microbial cells should be considered as a temporary pool that 233
is highly prone to rapid decomposition. Finally, by identifying gram-positive bacteria as the 234
dominating organic N decomposers, our study suggests that exo-enzymatic decomposition would 235
potentially allow plants to assimilate degradation metabolites, such as amino acids or short peptides, 236
in the same manner that gram-negative bacteria in the present study assimilated degradation 237
metabolites from the protein-sized organic N. 238
239

11
Materials and methods 240
Soils came from the Jyndevad and Askov long-term field experiments (LTE) in Denmark. The 241
Jyndevad LTE on liming and phosphorus was initiated in 194219 on a coarse sandy soil (Extended 242
Data Table 3) cultivated with spring barley for at least 30 years. Soil was sampled in August 2015 243
from the plough layer (5-20 cm) of the V1 field in the treatments receiving 0, 4 and 12 Mg lime ha-1 244
every 6-9 years and yearly doses of 15.6 kg P ha-1 year-1. At the time of soil sampling contrasting 245
pHCaCl2 levels of 3.6 (low pH), 5.4 (medium pH), and 7.1 (high pH) were established in the three 246
treatments. The Askov LTE on animal manure and mineral fertilizers was initiated in 189420 on a 247
sandy loam soil in an arable crop rotation (Extended Data Table 4). Soil was sampled in October 248
2015 from the plough layer (5-20 cm) of the treatments designated unfertilized, 1½ mineral 249
fertilizer (NPK), and 1½ animal manure (AM) treatments of the B3 field. Annually, the 1½ NPK 250
and 1½ AM treatments have received on average 150 kg total-N, 30 kg P and 120 kg K ha-1 in 251
mineral fertilizer and animal manure (slurry since 1974), respectively. All soils were sieved (4 mm) 252
to remove visible roots and stored at 2 ºC until the incubation experiment in September 2015 for 253
Jyndevad soils and October 20145 for Askov soils. 254
255
Organic N fractions were produced from greenhouse grown triple-labeled (14C, 13C, 15N)45 white 256
clover shoots using a screw press and subsequent Mw size fraction of the juice18 into the fractions: 257
1-10, 10-30, 30-100, and >100 kDa. The organic N fractions were characterized for total C and N, 258
bulk isotopic and amino acid specific composition as described in Enggrob et al.18 (Extended Data 259
Table 1, Extended Data Fig. 1). The organic N fractions were incubated in packed micro-lysimeters 260
holding 12 g field moist soil. The micro-lysimeters were constructed from inserts in 50 mL 261
centrifuge tubes (Extended Data Fig. 4) to allow rapid recovery of soil solution by centrifugation 262
upon termination of incubation. Incubation time was one-hour and 14 days at room temperature (22 263

12
°C) and all soil amendments were made in four replicates. The one hour incubation allowed the 264
determination organic N sorption. The 14 days incubation was chosen for the mineralization 265
response because at that time the 14CO2 production from the fastest mineralizing organic N fraction 266
started to level off; based on the assumption that if sorption controls mineralization this would be 267
the time when labeled organic N had been depleted from soil solution. The organic N fractions were 268
added in low amounts in 2 mL water (100-190 µg C g-1 soil and 9-40 µg N g-1 soil), and sufficiently 269
low to have a minor or no influence on the concentration of extractable amino acids in soil 270
(Extended Data Fig. 2). The micro-lysimeters were incubated in the dark in 1 L glass jars at room 271
temperature (22ºC) with a beaker holding 1 mL of 0.5 M NaOH to trap 14CO2. CO2 traps were 272
replaced after 1, 4, 7, and 14 days. Liquid scintillation cocktail (OptiPhase HiSafe3, PerkinElmer, 273
Waltham, MA, USA) was added to the trap solution and 14C-activity counted on a Tri-Carb® 274
2910TR Liquid Scintillation Analyser (PerkinElmer, Waltham, MA, USA). All four organic N 275
fractions were incubated in the Jyndevad soils, whereas the >100 kDa fraction was incubated in the 276
Askov soils for comparison of results across two soil types. Control treatments with addition of 2 277
mL water instead of organic N were run for all soils and sampling times. 278
279
Upon terminating the incubation, the micro-lysimeters were first added 8 mL of water and 280
centrifuged for 5 minutes at 5000 g followed by addition of 10 mL of water and repeated 281
centrifugation. The two solutions were pooled to give one sample of 20 mL containing the soluble 282
N fractions. After this, the soil in the micro-lysimeters was washed in a similar manner with two 283
times 10 mL 1 M KCl and the KCl solutions were pooled. Both water and KCl solutions were 284
immediately filtered through 0.45 µm Macrosep centrifuge filters (Pall Corporation, New York, 285
USA) and the filtrates were sampled for 14C-analysis (see above). The remaining liquid samples 286
were stored frozen until further analysis of total C and N content and 13C and 15N isotope 287

13
composition. After the final KCl wash the soil was immediately recovered from the micro-288
lysimeters and stored frozen until further analysis. 289
290
Soil solution samples were freeze-dried, re-dissolved in 1 mL MilliQ water (Synergy® System, 291
Millipore, Molsheim, France), transferred to tin capsules and freeze-dried before analysis of total C 292
and N content and 13C and 15N stable isotope composition. Analyses were performed on a Flash 293
Elemental Analyser (Thermo Scientific, Hvidovre, Denmark) coupled via a TCD to an isotope ratio 294
mass spectrometer (Delta V Plus IRMS, Thermo Scientific, Hvidovre, Denmark). Mass 295
spectrometer related parameters were controlled by the Isodat software version 3.0 (Thermo 296
Scientific, Hvidovre, Denmark). All δ13C values are reported relative to the Vienna PeeDee 297
Belemnite (VPDB) international isotope standard. All δ15N values are reported relative to the δ15N 298
values of atmospheric N2. 299
300
Soil samples were freeze-dried and homogenized by ball milling to allow representative sub-301
sampling. Analysis of total C and N and 13C and 15N composition was carried out as described 302
above after weighing 25-30 mg soil samples into tin capsules. Jyndevad soils with added 1-10 and > 303
100 kDa organic N fractions and Askov soils with added >100 kDa fraction (all incubated for 14 304
days) underwent compound-specific isotope analysis aimed at determining organic N bound in 305
amino acids (AA-SIP) and biomarkers for active microbial biomass (PLFA-SIP). For AA-SIP, 800 306
mg freeze-dried soil was weighed into 16x100 soda-lime disposable test tubes (Duran Group, 307
Mainz, Germany) added 2 mL 6 M HCl and hydrolyzed for 20 hours at 110°C. To remove solids 308
and lipophilic compounds 4 mL n-hexane/dichloromethane (6:5, v/v) was added and vortexed for 309
30 s, upon centrifugation (1600 rpm at 2 min). After mixing and centrifugation, the aquatic phase 310
was transferred through a Pasteur pipette lined with glass wool, to remove visible floating particles 311

14
from the aquatic phase, followed by washing the Pasteur pipette lined with glass wool by 2 x 0.5 312
mL 0.1 M HCl into new test tubes. The remaining sample preparation (purification and 313
derivatization of amino acids) along with the GC/C-IRMS analysis was done as described in 314
Enggrob et al.18, except for an extra freeze-drying step added during purification after the addition 315
of the internal standard (300µl 2.5 M norLeucine) and before the filtration of the samples on resin 316
columns. The amino acids: asparagine and aspartate (Asx), glutamine and glutamate (Glx), and 317
Proline and Threonine (Pro/Thr) elute together in the GC-C-IRMS analysis of acid hydrolyzed 318
samples. For PLFA-SIP, 2.5 g freeze-dried soil was used to isolate phospholipids by a Bligh-Dyer 319
single phase extraction followed by a solid–phase extraction on silicic acid columns and an alkaline 320
transesterification46,47. The PLFA’s were analyzed for isotopic composition by a GC-C-IRMS at the 321
Stable isotope service lab., Department of Biology, Lund University, Sweden. Individual PLFA’s 322
were assigned to specific microbial groups48-50 (Extended Data Table 5); both specified and 323
unspecified PLFAs were used for estimating active microbial biomass. 324
325
Statistical analyses 326
The influence of the soil pH levels and comparisons across 13C and 15N content, amino acid 327
contents and groupings of soil microorganisms were tested with a linear mixed-effects model using 328
the statistical analysis program R version 3.3.1 (R Core Team, 2016, URL https://www.R-329
project.org/). For statistical analysis, the datasets were tested for normal distribution by the Shapiro-330
Wilk test of normality. Linear models describing each subset were tested by pairwise comparisons. 331
Correlations between sorption and mineralization were conducted using the Spearman’s rank 332
correlation coefficient or Spearman’s rho. 333
334
References 335

15
1 Paustian, K. et al. Climate‐smart soils. Nature 532, 49‐57 (2016). 336 2 Knicker, H. Soil organic N ‐ An under‐rated player for C sequestration in soils? Soil Biol. Biochem. 43, 337
1118‐1129 (2011). 338 3 Schmidt, M. W. I. et al. Persistence of soil organic matter as an ecosystem property. Nature 478, 49‐339
56 (2011). 340 4 Lehmann, J. & Kleber, M. The contentious nature of soil organic matter. Nature 528, 60‐68, 341
doi:10.1038/nature16069 (2015). 342 5 Cotrufo, M. F. et al. Formation of soil organic matter via biochemical and physical pathways of litter 343
mass loss. Nat. Geosci. 8, 776‐779 (2015). 344 6 Liang, C., Schimel, J. P. & Jastrow, J. D. The importance of anabolism in microbial control over soil 345
carbon storage. Nat. Microbiol. 2, Article no. 17105 (2017). 346 7 Czaban, W., Rasmussen, J., Nicolaisen, M. & Fomsgaard, I. S. Dissipation kinetics of asparagine in 347
soil measured by compound‐specific analysis with metabolite tracking. Biol. Fertil. Soils 52, 911‐916 348 (2016). 349
8 Farrell, M. et al. Rapid peptide metabolism: A major component of soil nitrogen cycling? Global 350 Biogeochem. Cy. 25 (2011). 351
9 Apostel, C., Dippold, M. A., Bore, E. & Kuzyakov, Y. Sorption of Alanine changes microbial 352 metabolism in addition to availability. Geoderma 292, 128‐134 (2017). 353
10 Khan, K. S., Mack, R., Castillo, X., Kaiser, M. & Joergensen, R. G. Microbial biomass, fungal and 354 bacterial residues, and their relationships to the soil organic matter C/N/P/S ratios. Geoderma 271, 355 115‐123 (2016). 356
11 Miltner, A., Bombach, P., Schmidt‐Brücken, B. & Kästner, M. SOM genesis: microbial biomass as a 357 significant source. Biogeochem., 1‐15 (2012). 358
12 Nannipieri, P. & Eldor, P. The chemical and functional characterization of soil N and its biotic 359 components. Soil Biol. Biochem. 41, 2357‐2369 (2009). 360
13 Schimel, J. P. & Bennett, J. Nitrogen mineralization: Challenges of a changing paradigm. Ecology 85, 361 591‐602 (2004). 362
14 Jan, M. T., Roberts, P., Tonheim, S. K. & Jones, D. L. Protein breakdown represents a major 363 bottleneck in nitrogen cycling in grassland soils. Soil Biol. Biochem. 41, 2272‐2282 (2009). 364
15 Jones, D. L. & Kielland, K. Amino acid, peptide and protein mineralization dynamics in a taiga forest 365 soil. Soil Biol. Biochem. 55, 60‐69 (2012). 366
16 Mariano, E., Jones, D. L., Hill, P. W. & Trivelin, P. C. O. Mineralisation and sorption of dissolved 367 organic nitrogen compounds in litter and soil from sugarcane fields. Soil Biol. Biochem. 103, 522‐368 532 (2016). 369
17 Bosatta, E. & Ågren, G. I. Soil organic matter quality interpreted thermodynamically. Soil Biol. 370 Biochem. 31, 1889‐1891 (1999). 371
18 Enggrob, K. L., Larsen, T., Larsen, M., Elsgaard, L. & Rasmussen, J. The influence of hydrolysis and 372 derivatization on the determination of amino acid content and isotopic ratios in dual labeled (13C, 373 15N) white clover. Rapid Commun. Mass Spectrom. 33, 21‐30 (2019). 374
19 Rubaek, G. H. Effects of liming an P fertilisation. in Long continued Agriculatural Soil experiments: A 375 Nordic research platform – a catalogue, eds Petersen, J. et al., DJF Plant Science 16, 12‐14, Aarhus 376 University, Denmark (2008). 377
20 Christensen, B. T., Petersen, J. & Trentemoller, U. M. The Askov long‐term experiments on animal 378 manure and mineral fertilizers: The Lermarken site 1894‐2004. Report No. 121, (2006). 379
21 Dumont, M. G. & Murrell, J. C. Stable isotope probing ‐ linking microbial identity to function. Nat. 380 Rev. Microbiol. 3, 499‐504 (2005). 381
22 Nasholm, T., Kielland, K. & Ganeteg, U. Uptake of organic nitrogen by plants. New Phytol. 182, 31‐382 48 (2009). 383

16
23 Hill, P. W., Farrell, M. & Jones, D. L. Bigger may be better in soil N cycling: Does rapid acquisition of 384 small l‐peptides by soil microbes dominate fluxes of protein‐derived N in soil? Soil Biol. Biochem. 385 48, 106‐112 (2012). 386
24 Jones, D. L. & Hodge, A. Biodegradation kinetics and sorption reactions of three differently charged 387 amino acids in soil and their effects on plant organic nitrogen availability. Soil Biol. Biochem. 31, 388 1331‐1342 (1999). 389
25 Gonod, L. V., Jones, D. L. & Chenu, C. Sorption regulates the fate of the amino acids lysine and 390 leucine in soil aggregates. Eur. J. Soil Sci. 57, 320‐329 (2006). 391
26 Dippold, M. A. & Kuzyakov, Y. Biogeochemical transformations of amino acids in soil assessed by 392 position‐specific labelling. Plant Soil 373, 385‐401 (2013). 393
27 Kogel‐Knabner, I. & Rumpel, C. Advances in molecular approaches for understanding soil organic 394 matter composition, origin, and turnover: A historical overview. Advances in Agronomy, 149, 1‐48 395 (2018). 396
28 Tamez‐Hidalgo, P., Christensen, B. T., Lever, M. A., Elsgaard, L. & Lomstein, B. A. Endospores, 397 prokaryotes, and microbial indicators in arable soils from three long‐term experiments. Biol. Fertil. 398 Soils 52, 101‐112 (2016). 399
29 Hemkemeyer, M., Christensen, B. T., Martens, R. & Tebbe, C. C. Soil particle size fractions harbour 400 distinct microbial communities and differ in potential for microbial mineralisation of organic 401 pollutants. Soil Biol. Biochem. 90, 255‐265 (2015). 402
30 Suarez‐Tapia, A., Thomsen, I. K., Rasmussen, J. & Christensen, B. T. Residual N effect of long‐term 403 applications of cattle slurry using winter wheat as test crop. Field Crop. Res. 221, 257‐264 (2018). 404
31 Jensen, J. L., Schjonning, P., Christensen, B. T. & Munkholm, L. J. Suboptimal fertilisation 405 compromises soil physical properties of a hard‐setting sandy loam. Soil Res. 55, 332‐340 (2017). 406
32 Castellano, M. J., Mueller, K. E., Olk, D. C., Sawyer, J. E. & Six, J. Integrating plant litter quality, soil 407 organic matter stabilization, and the carbon saturation concept. Global Change Biol. 21, 3200‐3209 408 (2015). 409
33 Kirchman, D. L., Newell, S. Y. & Hodson, R. E. Incorporation versus biosynthesis of leucine – 410 implications for measuring rates of protein‐synthesis and biomass production by bacteria in marine 411 systems. Mar. Ecol. Prog. Ser. 32, 47‐59 (1986). 412
34 Simelyte, E., Rimpilainen, M., Zhang, X. & Toivanen, P. Role of peptidoglycan subtypes in the 413 pathogenesis of bacterial cell wall arthritis. Ann. Rheum. Dis. 62, 976‐982 (2003). 414
35 Schneewind, O. & Missiakas, D. M. Protein secretion and surface display in Gram‐positive bacteria. 415 Philos. Trans. R. Soc. Lond. B Biol. Sci. 367, 1123‐1139 (2012). 416
36 Vollmer, W., Blanot, D. & de Pedro, M. A. Peptidoglycan structure and architecture. FEMS 417 Microbiol. Rev. 32, 149‐167 (2008). 418
37 Madigan, M. T., Bender, K. S., Buckley, D. H., Sattley, W. M. & Stahl, D. A. Brock Biology of 419 Microorganisms. 15th edition, Pearson Education Limited, London, UK (2018). 420
38 Rousk, J. et al. Soil bacterial and fungal communities across a pH gradient in an arable soil. ISME J. 421 4, 1340‐1351 (2010). 422
39 Burns, R. G. Enzyme activity in soil: some theoretical and practical considerations. in Soil Enzymes, 423 ed R.G. Burns, Academic Press Inc., London, UK (1978). 424
40 Detmers, F. J. M., Kunji, E. R. S., Lanfermeijer, F. C., Poolman, B. & Konings, W. N. Kinetics and 425 specificity of peptide uptake by the oligopeptide transport system of Lactococcus lactis. Biochem. 426 37, 16671‐16679 (1998). 427
41 Scherrer, R., Beaman, T. C. & Gerhardt, P. Macromolecular sieving by dormant spore of bacillus‐428 cereus. J. Bacteriol. 108, 868‐& (1971). 429
42 Nannipieri, P., Trasar‐Cepeda, C. & Dick, R. P. Soil enzyme activity: a brief history and biochemistry 430 as a basis for appropriate interpretations and meta‐analysis. Biol. Fertil. Soils 54, 11‐19 (2018). 431

17
43 Simpson, J., Warren, C. & Adams, P. Potential protease activity and organic nitrogen concentration 432 are rapid tests and accurate indicators of N‐availability in Tasmanian Eucalyptus nitens plantations. 433 Soil Biol. Biochem. 115, 152‐160 (2017). 434
44 Lipson, D. & Nasholm, T. The unexpected versatility of plants: organic nitrogen use and availability 435 in terrestrial ecosystems. Oecologia 128, 305‐316 (2001). 436
45 Rasmussen, J., Gjettermann, B., Eriksen, J., Jensen, E. S. & Hogh‐Jensen, H. Fate of 15N and 14C from 437 labelled plant material: Recovery in perennial ryegrass‐clover mixtures and in pore water of the 438 sward. Soil Biol. Biochem. 40, 3031‐3039 (2008). 439
46 Petersen, S. O. & Klug, M. J. Effects of sieving, storage, and incubation‐temperature on the 440 phospholipid fatty‐acid profile of a soil microbial community. Appl. Environ. Microbiol. 60, 2421‐441 2430 (1994). 442
47 Petersen, S. O., Frohne, P. S. & Kennedy, A. C. Dynamics of a soil microbial community under spring 443 wheat. Soil Sci. Soc. Am. J. 66, 826‐833 (2002). 444
48 Fierer, N., Schimel, J. P. & Holden, P. A. Variations in microbial community composition through two 445 soil depth profiles. Soil Biol. Biochem. 35, 167‐176 (2003). 446
49 Stromberger, M. E., Keith, A. M. & Schmidt, O. Distinct microbial and faunal communities and 447 translocated carbon in Lumbricus terrestris drilospheres. Soil Biol. Biochem. 46, 155‐162 (2012). 448
50 Frostegard, A., Baath, E. & Tunlid, A. Shifts in the structure of soil microbial communities in limed 449 forests as revealed by phospholipid fatty‐acid analysis. Soil Biol. Biochem. 25, 723‐730 (1993). 450
451
Extended data 452
Extended method description and data are available online. 453
454
Acknowledgement 455
We thank L. Elsgaard, G.H. Rubæk, L. Peixoto, Z. Liang and J.E. Olesen for discussions. The study 456
was financially supported by The Independent Research Fund Denmark – Technology and 457
Production (Project no. 1335-00760B). 458
459
Author contributions 460
K.L.E. and J.R. designed and executed the experiment and analysis; K.L.E. performed statistical 461
analysis; K.L.E., T.L. and J.R. made AA-SIP interpretations; K.L.E. and J.R. drafted the 462
manuscript; all authors revised the manuscript and approved the final version. 463
464
465

18
Author Information 466
Reprints and permissions information is available at www.nature.com/reprints. The authors declare 467
no competing interests. Correspondence and requests for materials should be addressed to J.R. 468
([email protected]). 469
470

Figure 1.
Fig. 1. Mineralization and sorption of large organic N. Mineralization of labeled organic N to 14CO2 in Jyndevad soils at three pHCaCl2 levels: low at pH 3.6, medium at pH 5.4, and high at pH 7.1. Panels show (a) the 1-10 kDa organic N fraction, (b) the 10-30 kDa fraction, (c) the 30-100 kDa fraction, and (d) the >100 kDa fraction. Statistical differences among soil pH levels in accumulated 14CO2 after 14 days are indicated by different letters next to the curves. Correlation between organic N sorption after 1 hour and accumulated 14CO2 after 14 days with (e) sorption of 13C in added organic N fractions (Rs = -0.90, P<0.001; for 15N Rs = -0.84, P <0.001) and (f) sorption of 15N in added organic N fractions (Rs = -0.84, P <0.001).
a
0
10
20
30
40
50b
c
Time (days)0 2 4 6 8 10 12 14
Min
eral
iza
tio
n o
f o
rgan
ic N
to
CO
2
(cu
mu
lati
ve 1
4 CO
2 p
rod
uct
ion
ad
ded
14C
, %
)
0
10
20
30
40
50
Low pH (3.6)Medium pH (5.4)High pH (7.1)
d
0 2 4 6 8 10 12 14
ns b
a
a
ns
baba
e
Sorption of organic N(13C retained after 1 hour, %)
0 20 40 60 80 1000
10
20
30
40
50f
Sorption of organic N(15N retained after 1 hour, %)
0 20 40 60 80 100
Low pHMedium pHHigh pH1-10 kDa10-30 kDa30-100 kDa>100 kDa

Figure 2.
Fig. 2. Organic N derived amino acids remaining in soil. Amino acids remaining in % of added bound amino acids from the peptide-sized (1-10 kDa, a-c) and protein-sized (>100 kDa, d-f) organic N in the low (a,d), medium (b,e) and high pH Jyndevad soils (c,f). Significant differences are marked by an asterisk; a double asterisk indicates no 15N data; ‘nn’ indicates non-normal distribution. Amino acids are organized from left on right with increasing number of steps in their biosynthesis.
a
Bo
un
d a
min
o a
cid
s re
mai
nin
g (
% o
f ad
ded
)
0
10
20
30
4013C 15N
b c
d
Ala
Asx Glx
Se
r
Gly
Pro
/Th
r
Val
Leu Lys
Ph
e
0
10
20
30
40e
Ala
As
x
Glx
Ser
Gly
Pro
/Th
r
Va
l
Leu Lys
Ph
e
f
Ala
As
x
Glx
Ser
Gly
Pro
/Th
r
Val
Leu Lys
Ph
e
*
**
* *** **
*
*
**
* **
*
** *
**
*
* * *nn
* **
** **
*
nn
Low pH soil Medium pH soil High pH soil
1-1
0 k
Da
>100 kD
a

Figure 3.
Fig. 3. Mineralization, sorption and amino acids remaining in soils with different fertility. Fate of the >100 kDa organic N fraction in Askov soil with three fertilizer treatments: UNF is unfertilized since 1894, NPK is mineral fertilizers since 1894, and AM is animal manure since 1894. Mineralization to 14CO2 (a), correlation between sorption of organic N after 1 hour and accumulated 14CO2 after 14 days with results from the Askov soils inserted in the Jyndevad results (grey) (b, c), and remaining 15N and 13C in bound amino acids after 14 days of incubation for the UNF (d), NPK (e), and AM (f) soils. Significant differences are marked by an asterisk; ‘nn’ indicates non-normal distribution.
Min
era
liza
tio
n o
f o
rga
nic
N t
o C
O2
(14 C
O2
of
add
ed
14 C
, %
)
a
Time (days)
0 2 4 6 8 10 12 140
10
20
30
40
50
Unfertilized (UNF)Mineral fertilizer (NPK)Animal Manure (AM)
ns
b
Sorption of organic N(13C retained after 1 hour, %)
0 20 40 60 80 100
UNFNPKAM
c
Sorption of organic N(15N retained after 1 hour, %)
0 20 40 60 80 100
UNFNPKAM
d
Ala
As
x
Glx
Se
r
Gly
Pro
/Th
r
Va
l
Leu Lys
Ph
e
Bo
un
d a
min
o a
cid
s re
mai
nin
g
(% o
f ad
ded
)
0
10
20
30
40
5013C 15N
e
Ala
As
x
Glx
Se
r
Gly
Pro
/Th
r
Va
l
Leu Lys
Ph
e
f
Ala
As
x
Glx
Se
r
Gly
Pro
/Th
r
Va
l
Leu Lys
Ph
e
*
nn
**
*
* *
* **
*
* * * *
*
*
nn

Figure 4.
Fig. 4. Microbial biomass and specific activity of 13C from added organic N fractions in the Jyndevad and Askov soils. Total PLFA after 14 days of incubation in control added water, the 1-10 kDa fraction, and the >100 kDa fraction for the low, medium and high pH Jyndevad soils (a), Total PLFA after 14 days of incubation in control added water and the >100 kDa fraction for the unfertilized, mineral fertilized, and animal manure fertilized Askov soil (b), Specific 13C incorporation in gram-positive, gram-negative and fungal PLFAs in Jyndevad soils added the 1-10 kDa fraction (c), Specific 13C incorporation in gram-positive, gram-negative and fungal PLFAs in Jyndevad soils added the >100 kDa fraction (d), and Specific 13C incorporation in gram-positive, gram-negative and fungal PLFAs in Askov soils added the >100 kDa fraction (e). Significantly differences are marked by different letter above the bars.
a
Low pH Medium pH High pH
Mic
rob
ial b
iom
as
s(n
mo
l PL
FA
g-1
so
il)
0
5
10
15
20
25 Control1-10 kDa>100 kDa
c
Low pH Medium pH High pH0.00
0.01
0.02
Gram postive bacteria (G+) Gram negative bacteria (G-) Fungi
d
Low pH Medium pH High pH0.00
0.01
0.02
c a b - ns - - ns -
b a c
a a ba a b
a b ca b c
a b c
Mic
rbia
l b
iom
ass
acti
ve o
n o
rgan
ic N
(nm
ol
13 C
PL
FA
nm
ol-1
C P
LF
A)
b
UNF NPK AM0
10
20
30
40
50
b
e
UNF NPK AM
a b c
a b c a b c
ab a
b a

Figure 5.
Fig. 5. The suggested microbial effects on large organic N turnover in soil. (a) The suggested route of protein-size (>100 kDa) organic N turnover via gram-positive (G+) exo-enzymatic depolymerization to peptides directly assimilated by gram-positive bacteria, but also benefitting gram-negative (G-) bacteria. (b) The suggested routes for peptide-sized (1-10 kDa) organic N turnover directly through gram-positive (G+) bacteria and via exo-enzymatic depolymerization for both gram-positive (G+) and gram-negative (G-) bacteria.
LowerMw DON
1-100 kDaDON
G+Bacteria
G-Bacteria
a
NH4+
>100 kDaDON
Soil microbial
community
LowerMw DON
1-10 kDaDON
Soil microbial
community
G+Bacteria
G-Bacteria
b
NH4+
Mobilizing
Immobilizing
Exo-enzymatic

Extended data for Enggrob et al.
Extended Data Fig. 1. Concentration, 13C and 15N atom fractions of individual amino acids bound in the 1-10 kDa and >100 kDa fractions added to the soils. Mean ± standard error (n = 4).
Am
ino
aci
d c
on
cen
trat
ion
(mg
ml-
1)
0.0
0.1
0.2
0.3
0.4
0.5
0.61-10 kDa>100 kDa
Am
ino
aci
d 13
C a
tom
fra
ctio
n
0.00
0.05
0.10
0.15
Ala
Asx Glx
Se
r
Gly
Pro
/Th
r
Val
Leu Lys
Ph
e
Am
ino
aci
d 15
N a
tom
fra
ctio
n
0.00
0.01
0.02

Extended Data Fig. 2. Concentrations of amino acids in control and organic N treated soils. Mean ± standard error (n = 4).
A: Low pH
Co
nce
ntr
atio
n o
f am
ino
aci
ds
in s
oil
(m
g/g
)
0.0
0.1
0.2
0.3
0.4Control1-10 kDa>100 kDa
B: Medium pH
0.0
0.1
0.2
0.3
0.4
C: High pH
Ala
Asx Glx
Se
r
Gly
Pro
/Th
r
Val
Leu Lys
Ph
e
0.0
0.1
0.2
0.3
0.4
D: UnfertilizedControl>100 kDa
E: NPK
F: Animal manure
Ala
Asx Glx
Se
r
Gly
Pro
/Th
r
Val
Leu Lys
Ph
e
Jyndevad Askov

Extended Data Fig. 3. Microbial community structure of Jyndevad (A) and Askov (B) soils in control added water, and soil added 1-10 and >100 kDa organic N fractions. Letters above the bars show significant differences among microbial groups within each soil (n = 4).
B: Askov
UNF NPK AM
Co
ntro
l
>10
0 kD
a
Co
ntro
l
>10
0 kD
a
Co
ntro
l
>10
0 kD
a
Mic
rob
ial b
iom
as
s(n
mo
l PL
FA
g-1
so
il)
0
2
4
6
8
10
12
14
A: Jyndevad
Low pH Medium pH High pH
Con
trol
1-1
0 k
Da
>1
00 k
Da
Con
trol
1-1
0 k
Da
>1
00 k
Da
Con
trol
1-1
0 k
Da
>1
00 k
Da
Mic
rob
ial b
iom
as
s(n
mo
l PL
FA
g-1
so
il)
0
1
2
3
4
5G+ G- Fungi
c c
d
ab
d
cc
d
a
b
d
a
b
c
aa
c
c
d
e
abc
e
abc
e
a
ab
c
a
ab
c
ab
b
c
c
d
a
b
e
b
c
e

Extended Data Table 1. Composition of the four organic N Mw size fraction used in the experiment; 13C and 15N enrichment expressed as atom fraction (AF) of the isotope. Data is given as mean ± standard error (n = 4).
Fraction C quantity N quantity C/N ratio 14C-activity AF 13C AF 15N [mg ml-1] [mg ml-1] [Bq ml-1]
1-10 kDa 0.87 ±0.02 0.11 ±0.002 8.1 ±0.2 8.65 ±0.12 0.081 ±8.4E-5 0.015 ±1.3E-5 10-30 kDa 0.97 ±0.02 0.16 ±0.003 6.1 ±0.1 10.2 ±0.09 0.081 ±7.8E-5 0.015 ±0.1E-5 30-100 kDa 0.48 ±0.13 0.04 ±0.009 10.7 ±3.7 1.8 ±0.07 0.047 ±6.0E-4 0.013 ±8.5E-4 >100 kDa 0.90 ±0.01 0.20 ±0.001 4.6 ±0.1 9.78 ±0.15 0.082 ±3.7E-5 0.014 ±0.7E-5
Extended Data Table 2. Recovery (% of added) of 13C and 15N in Jyndevad soils after 14 days of incubation. Data is given as mean ± standard error (n = 4). Statistical differences among organic N fraction within each soil is show with different letter; no significant differences were found across soils within each organic N fraction.
Fraction 1-10 kDa 10-30 kDa 30-100 kDa >100 kDa
-------------------- 13C recovery (% of added) --------------------
Low pH 25.3 ± 0.8 A 28.6 ± 1.0 B 31.0 ± 1.7 B 44.1 ± 3.1 B Medium pH 33.3 ± 1.0 A 31.7 ± 0.7 A 26.9 ± 1.3 A 44.8 ± 1.6 A High pH 36.9 ± 1.1 A 34.5 ± 1.3 A 33.4 ± 1.1 A 43.6 ± 1.4 B
-------------------- 15N recovery (% of added) ---------------------
Low pH 19.9 ± 0.7 A 18.1 ± 0.6 A 23.5 ± 1.0 B 23.8 ± 2.1 B Medium pH 28.5 ± 0.3 A 23.7 ± 0.5 B 23.0 ± 0.8 C 28.3 ± 1.2 D
High pH 34.2 ± 0.9 A 28.4 ± 1.5 B 32.5 ± 1.8 C 29.6 ± 0.8 A
Extended Data Table 3. Basic properties of soils from the Jyndevad LTE on liming and phosphorus fertilization initiated in 1942. The experiment is located at Jyndevad Experimental Station, Southern Jutland, Denmark (54o53′N, 09o07′E). The soil is classified as an Orthic Haplohumod a.
Name Liming pH b C N Clay Silt Fine sand Coarse sand t ha-1 g/kg soil ------------------ g/kg soil --------------
Low pH 0 3.6 11.7 0.6 Medium pH 4 5.4 10.5 0.6 40 40 170 750 High pH 12 7.1 13.4 0.8
a Soil Survey Staff. Soil Taxonomy: A Basic System of Soil Classification for Making and Interpreting Soil Surveys. 2nd edition, Natural Resources Conservation Service, United States Department of Agriculture (1999). b pH measured in 0.01 M CaCl2 in a 1:2.5 soil:solution ratio.

Extended Data Table 4. Basic properties of soils from the Askov LTE on animal manure and mineral fertilizers initiated in 1894. The experiment is located at Askov Experimental Station, Southern Jutland, Denmark (55o28′N, 09o07′E). The soil is classified as an Ultic Hapludalf a.
Name pH b C N Clay Silt Fine sand Coarse sand g/kg soil ------------------ g/kg soil --------------
Unfertilized 6.6 11.1 0.9 NPK fertilizer 6.2 12.9 1.0 100 120 430 350 Animal Manure 6.4 13.4 1.2
a Soil Survey Staff. Soil Taxonomy: A Basic System of Soil Classification for Making and Interpreting Soil Surveys. 2nd edition, Natural Resources Conservation Service, United States Department of Agriculture (1999). b pH measured in 0.01 M CaCl2 in a 1:2.5 soil:solution ratio.
Extended Data Fig. 4. Micro-lysimeter setup with the soil packed in an insert unit fitting 50 ml centrifugal tubes, which allows rapid sampling of soil solution via centrifugation. Micro-lysimeters were constructed using the insert unit from the 50 ml Macrosep® centrifugal tubes (Pall Coorporation, Ann Arbor, MI, USA) after removal of the vertical filter-piece. Constructing micro-lysimeters in the insert-unit allowed rapid sampling of soil solution via centrifugation and the use of a soil quantity great enough to conduct multiple analyses of both soil and soil solution after treatments with triple-labeled DON. The micro-lysimeters were packed from below of a glass microfiber filter (Whatman GF/A filter, 25 mm, GE Healthcare Life Sciences), a piece of silk organza cloth, and another glass microfiber filter. On top, 7 g of purified sea sand (0.1 - 0.315 mm, analytical grade, Merck KGaA, Darmstadt, Germany) was packed by adding 5 ml of water followed by centrifugation for 5 minutes at 5000g. The micro-lysimeters were added 12 g of field moist soil, which was gently packed by tapping on the insert unit.
Insert unit setup:
‐ 25 mm soil layer (12 g fresh weight)‐ 10 mm sea sand layer (7 g dry weight)‐ GF/A filter‐ Disk of silk organza cloth‐ GF/A filter

Extended Data Table 5. Overview of individual PLFA’s used as specific for gram-positive bacteria, gram-negative bacteria, and fungi, and individual PLFA’s not specified for microbial groups.
Group Name References
Gram positive bacteria a15:0, i15:0, i16:0, i17:0 48
Gram negative bacteria 16:1w7c, 18:1w9c 49
Fungi 18:2w6,9 50
Unspecified
14:0, 15:0, 16:0, 17:0, 18:0, 19:0, 18:1w9t

86
Paper 3
Newly depolymerized large organic N contributes directly to maize amino acid uptake
Kirsten Lønne Enggrob, Charlotte Marie Jakobsen, Ingeborg Frøsig Pedersen, Jim Rasmussen
Prepared for submission to New Phytologist

1
Title: Newly depolymerized large organic N contributes directly to amino acid uptake in young 1
maize plants 2
3
Kirsten Lønne Enggrob,1 Charlotte Marie Jakobsen,1 Ingeborg Frøsig Pedersen,1 and Jim 4
Rasmussen1* 5
6
1Department of Agroecology, Faculty of Science and Technology, Aarhus University, Denmark. 7
*Corresponding author: Post Box 50, 8830 Tjele, Denmark, [email protected] 8
9
Total word count for the main body of the text: 5777 10
Word count for Introduction: 1086 11
Word count for Material and Methods: 2048 12
Word count for Results: 847 13
Word count for Discussion: 1796 14
Word count for Acknowledgement: 31 15
Number of Figures: 5 16
Number of Tables: 3 17
Number of Supporting Material: 1 18
19
20
Summary 21
The contribution of large molecular size organic nitrogen (N) to microbial and plant carbon 22
(C) and N nutrition is unclear. 23
Soils with and without maize at three pH levels were added (14C, 13C, 15N) triple-labeled 24
>100 kDa organic N. Soil and maize sampled 48 hours after addition of organic N were 25
analyzed by bulk and compound specific isotope analysis to study plant and microbial 13C 26
and 15N uptake. 27
Mineralization of >100 kDa organic N increased with soil pH in soil without maize, but no 28
effect of soil pH was seen for soil with maize. The >100 kDa organic N disappeared rapidly 29
in soils with and without maize, but surprisingly more >100 kDa organic N derived amino 30

2
acids remained in soil with than without maize – most likely in the microbial biomass. Total 31
15N uptake in maize increased with higher soil pH and the organic N uptake estimated to 32
account for 20-30% of the total 15N uptake across the soil pH gradient. Organic N uptake 33
was confirmed by presence of 13C-labeled amino acids in the maize roots. 34
The study shows that when bio-available N is derived from large molecular size organic N 35
then the importance of plant organic N uptake increases, and that rhizosphere 36
microorganisms increase anabolic utilization of organic N compared to bulk soil 37
microorganisms. 38
39
Keywords: amino acid, large molecular size organic N, maize, organic N uptake, soil pH, stable 40
isotope probing. 41
42
1. Introduction 43
Insufficient nitrogen (N) supply limits crop production and N fertilizer are supplied to meet this 44
demand, although surplus N inputs in the agricultural sector has adverse environmental effects. We 45
thus need to enhance the use efficiency of N cycling in agricultural systems (Lassaletta et al., 2014). 46
Nitrogen entering or cycling in soil bound in organic form poses a great challenge as it is hard to 47
achieve synchrony of plant-available N and plant N demands. Most N bound in organic form enters 48
soil as amino acids bound in proteinaceous material (Jan et al., 2009), and organic N in soil organic 49
matter is dominated by amino acids bound in peptides or proteins (polypeptides) (Knicker, 2011). In 50
order to become plant available this organic N needs to be depolymerized to smaller organic N 51
forms like small peptides and amino acids or further mineralized to inorganic N forms (Fig. 1) 52
(Schimel & Bennett, 2004; Jones et al., 2005a). This turnover of organic N sources is both plant and 53
microbial driven. We know that small peptides and amino acids in soil solution turnover rapidly 54
(within minutes to hours) (Jones et al., 2005a; Czaban et al., 2016b; Hill & Jones, 2019), whereas 55
larger organic N like proteins are decomposed a slower rates (Jan et al., 2009), although when 56
dissolved in soil solution at a rate of days rather than weeks (Enggrob et al. subm.). The proteolytic 57
activity for large organic N depolymerization is known to be affected by among other soil pH 58
(Godlewski & Adamczyk, 2007; Sinsabaugh et al., 2008; Vranova et al., 2013), and the presence of 59
plants (Godlewski & Adamczyk, 2007) where rhizosphere soil have a more active microbial 60
community than bulk soil (Clarholm, 1985; Blagodatskaya et al., 2014). Thus, we expect a higher 61
turnover of organic N in the rhizosphere than in bulk soil. Furthermore, soil pH generally affect the 62

3
active microbial communities with low soil pH favoring fungi and higher soil pH favoring bacteria 63
(Rousk & Baath, 2011), although we recently showed that gram-positive bacteria mainly benefit 64
from dissolved organic N turnover irrespective of soil pH (Enggrob et al. subm.). However, we lack 65
knowledge of the short-term contribution of N bound in large organic N forms to plant N nutrition. 66
67
In fertile soil crop N uptake is viewed as dominated by the inorganic N forms (Schimel & Bennett, 68
2004; Hill & Jones, 2019), although most plants have the capacity for organic N uptake (Chapin et 69
al., 1993; Kielland et al., 2006; Näsholm et al., 2009; Paungfoo-Lonhienne et al., 2012). Our main 70
knowledge of plant organic N uptake comes from studies with addition of individual amino acids 71
e.g. glycine (Näsholm et al., 1998), alanine (Hill & Jones, 2019), asparagine (Czaban et al., 2016a; 72
Czaban et al., 2018), glutamate (Jones et al., 2013), mixtures of amino acids (Forsum et al., 2008; 73
Jämtgard et al., 2008; Sauheitl et al., 2009b) or short peptides (Paungfoo-Lonhienne et al., 2009; 74
Hill et al., 2011a; Soper et al., 2011). These studies confirms direct plant uptake of organic N, but 75
also point to that the microbial competition for these small organic N compounds may reduce the 76
importance of organic N uptake for crop N nutrition (Jones et al., 2013; Hill & Jones, 2019). 77
However, studies with the addition of a single pulse of one or a few amino acids may not reflect 78
conditions in soil (Hill & Jones, 2019), where amino acids and peptides released via 79
depolymerization of proteins most likely would be present at lower and more constant 80
concentrations. Furthermore, release of N from protein-sized organic N would give a broader 81
profile of small organic N compounds (i.e. more individual amino acids and small peptides) than 82
previously studied. Thus, there is a lack of studies on the release of N from protein-sized organic N 83
and the subsequent contribution to plants N nutrition. 84
85
Uptake of organic N is mainly determined using (13C, 15N) dual-labeled compounds with the uptake 86
estimated based on the ratio of bulk 13C and 15N isotope uptake (Näsholm et al., 1998), and the 87
intact uptake of the added compound confirmed by compound specific isotope analysis (Näsholm et 88
al., 2001; Sauheitl et al., 2009a; Czaban et al., 2016a). Although these methods have mainly been 89
used for individual amino acids they ought to be applicable in studies of larger dual-labeled organic 90
N, even though it may pose several challenges: Firstly, since the large organic N most likely needs 91
to undergo depolymerization before being plant available (Fig. 1), the short chase periods normally 92
recommended for the study of intact amino acid uptake (Näsholm et al., 2009; Hill & Jones, 2019) 93
cannot be used. Sufficient time must be allowed for the depolymerization to small peptides or 94

4
individual amino acids. Secondly, upon depolymerization we know presently little of the strength of 95
microbial competition towards released peptides, although based on studies of small peptides and 96
individual amino acids we expect microorganisms to better than plants at taking up small organic N 97
(Jones et al., 2013; Hill & Jones, 2019). Recently, we showed that in unplanted soil increasing the 98
molecular size of organic N changed the microbial catabolism-anabolism balance towards greater 99
anabolism (Enggrob et al. subm.), but we have a lack of knowledge of this microbial balance in the 100
presence of plants. Thirdly, given that the protein-sized organic N most likely needs 101
depolymerization prior to plant uptake, then the estimation of intact organic N uptake cannot be 102
directly based on the quantity of labeled compound added as normally done with bulk or 103
compound-specific methods. Instead, it must be related to the release of bio-available organic N, 104
which is difficult to estimate non-destructively. Finally, the ‘normal’ potential biases like C-tracer 105
uptake via bicarbonate (Rasmussen & Kuzyakov, 2009; Rasmussen et al., 2010) or keto acids (Hill 106
& Jones, 2019) also needs to be taken into account. 107
108
The aim of the present study was to investigate the turnover of protein-sized organic N (>100 kDa) 109
and determine the contribution of this organic N source to the N nutrition in young maize plants 110
grown in soil with a pH gradient. We hypothesized that (i) the turnover of >100 kDa organic N 111
would be greater in the presence of plants due to higher microbial activity and more plant and 112
microbially derived exo-enzymes in the rhizosphere, and (ii) higher plant growth and greater 113
mineralization with increasing soil pH would result in a greater total 15N uptake from >100 kDa 114
organic N at high soil pH, but a greater proportion of the total 15N uptake being in organic form at 115
low pH due to lower mineralization. 116
117
2. Material and Methods 118
An experiment was carried out with maize in 20 ml ”pots” (hence fort termed micro-lysimeters) 119
where the mineralization and bulk uptake of C- and N-tracer from triple-labeled >100 kDa organic 120
N was investigated in soil with three pH levels established through long-term liming. 121
122
2.1 Soils 123
Soils came from the Jyndevad long-term field experiment (LTE) on liming and phosphorus initiated 124
in 1942 (Rubaek, 2008) located at St. Jyndevad Experimental Station, Southern Jutland, Denmark 125
(54˚53’N, 09˚07’E). The soil is coarse sandy with 40 g kg-1 clay, 40 g kg-1 silt, 170 g kg-1 fine sand, 126

5
and 750 g kg-1 coarse sand in the plough layer and classified as an Ultic Hapludalf (Soil Survey 127
Staff, 1999), which has been used for spring barley cultivation for at least 30 years prior to 128
sampling. Soil for the experiment was sampled in August 2015 from the plough layer (5-20 cm) of 129
the V1 field in the treatments receiving 15.6 kg P ha-1 year-1. Soil was taken from plots receiving 0, 130
4, or 12 Mg lime ha-1, which had contrasting pHCaCl2 levels (Table 1); with pH measured in 0.01 M 131
CaCl2 in a 1:2.5 soil:solution ratio. Soil was sieved (4 mm) to remove visible roots and stored at 2ºC 132
until the experiment. 133
134
2.2. Triple-labeled >100 kDa organic N 135
The protein-sized organic N (>100 kDa) was produced from greenhouse grown triple-labeled (14C, 136
13C, 15N) white clover shoots (Enggrob et al., 2019). Briefly, white clover grown in sterile sand 137
received a standard nutrient solution supplemented with 15N-labeled (15NH4)2SO4 (98 at%) and 138
clover was C-labeled via 14CO2 and 13CO2 as described by Rasmussen et al. (2008). Upon harvest, 139
clover shoots were passed through a screw press, (Colas et al., 2013) to obtain a juice, which 140
following was filtrated through a 0.45µm filter and Mw size fractionized using 20 ml centrifugal 141
filter tubes (Macrosep® Advance, Pall Corporation, Ann Arbor, MI, USA) with a pore size of 100 142
kDa. The residue remaining on the filter after three times rising with 5 ml MilliQ water was used 143
for the experiment; thus, the >100 kDa organic N was in the size >100 kDa and <0.45 µm (hereafter 144
referred as “>100 kDa organic N”). The >100 kDa organic N was characterized for total C and N, 145
bulk isotopic and amino acid specific composition as described in Enggrob et al. (2019) (Table 2, 146
Fig. S1). 147
148
2.3. Micro-lysimeter experiment 149
The micro-lysimeters were constructed in the 20 ml inset of 50 ml centrifugal tubes (Maxi-Spin 150
Filter tubes XPE-45, Ciro, Deerfield Beach, Florida, USA) to allow free drainage from the soil 151
reducing the risk of anaerobic conditions. Each inset was filled with 15 g of field moist soil and 152
gently packed by tapping on the side of the insert unit. In addition to the maize receiving the triple-153
labeled >100 kDa organic N we had the following control treatments: (i) maize with water added 154
(i.e. no organic N), (ii) soil without maize receiving the >100 kDa organic N, and (iii) soil without 155
maize added water. In all treatments and controls end-point sampling of soil and plant tissue was 156
done 48 hours after addition of the >100 kDa organic N (or water for the respective controls). The 157
48 hours was based on the mineralization pattern of the >100 kDa organic N in the same soils in a 158

6
previous study (Enggrob et al. subm.) recognizing the need for short chase periods in organic N 159
uptake studies (Näsholm et al., 2009; Hill & Jones, 2019) and allowing sufficient time for 160
depolymerization to occur assuming that maize is unable to directly take up protein-size organic N. 161
Thus, the duration of the treatments with >100 kDa organic N was a balance between a short chase 162
period known to be important for detection of intact amino acids in plant roots and allowing time 163
for depolymerization of the >100 kDa organic N. 164
165
2.3.1. Control soil without maize – >100 kDa organic N incubation 166
Soil without plants was incubated with the triple-labeled >100 kDa organic N or with water for 48 167
hours in a glass jar setup (Enggrob et al. subm.). Briefly, micro-lysimeters were placed in a 1 L 168
glass jar together with a base trap containing 1 ml 1 M NaOH, and a beaker containing 2 ml water 169
to insure humidity. Prior to incubation the soils were allowed to temperature adjust for a day. The 170
incubation started by addition of 2.0 ml the >100 kDa organic N or in the control 2.0 ml of MilliQ 171
water. The C and N quantity added in the >100 kDa organic N corresponded to 117 µg C g-1 soil 172
and 22 µg N g-1 soil. 173
174
Mineralization to 14CO2 of the >100 kDa organic N was measured by exchanging the base trap after 175
1, 2, 4, 24 and 48h. Immediately after removal of the base trap, 4 ml of liquid scintillation cocktail 176
(OptiPhase HiSafe3, PerkinElmer, Waltham, MA, USA) was added to the base trap and it was 177
counted for 14C-activity on a Tri-Carb® 2910TR Liquid Scintillation Analyzer (PerkinElmer, 178
Waltham, MA, USA). After 48 hours, the incubation was terminated and the soil was immediately 179
frozen. The soil was freeze dried and ground for two minutes to fine powder in 2 ml Eppendorf 180
tubes prior to analysis. 181
182
2.3.2. Maize treatment and control with plant 183
Maize seeds (variety LG31.218, Limagrain A/S, Horsens, Denmark) were germinated in the dark 184
for two days at room temperature before transplanting to the micro-lysimeters. The maize were 185
grown in the laboratory for 20 days (14 hour day length, 24-28 ˚C, irrigated when needed) reaching 186
the BBCH growth stage 12-13 (Meier, 2001) prior to the addition of the >100 kDa organic N. At 187
the time of addition of the >100 kDa organic N maize roots had occupied the whole soil volume 188
effectively making all soil ‘rhizosphere soil’ (Jones et al., 2005b; Rasmussen et al., 2010). 189
190

7
Before the >100 kDa organic N treatment, maize plants were placed in glass jars with a setup as 191
described above, with the exception that the lid of the jar had a hole where maize shoot was gently 192
pulled through. The shoot was then sealed from the root and soil inside the glass jar by placing an 193
inert plastic material (UNIGUM Sanitary putty, Unipak A/S, Galten, Denmark) around the stem 194
making the hole airtight. Again, the incubation started by addition of 2.0 ml the >100 kDa organic 195
N or in the control 2.0 ml of MilliQ water, this time with a syringe through the hole in the lid. The 196
mineralization of the >100 kDa organic N was determined as an end-point sampling after 48 hours 197
of incubation, where the base trap was removed and analyzed for 14C-activity as described above. 198
Upon termination, the shoots were cut at the soils surface and the roots were gently shaken free of 199
the soil and firstly rinsed with demineralized water and secondly rinsed with a 1M KCl solution, to 200
remove any DON solution sorbed to the root surface. The shoot, root and soils were then 201
immediately frozen, freeze dried and ground to fine powder as described above. 202
203
2.4. Analysis 204
2.4.1. Bulk 13C and 15N analysis 205
The total C and N, and 13C and 15N stable isotope composition was determined by transferring 5-7 206
mg shoot or root material to tin capsules before analysis on a PDZ Europa ANCA-GSL elemental 207
analyzer interfaced to a PDZ Europe 20-20 isotope ratio mass spectrometer (Sercon Ltd. Cheshire, 208
UK) at the UC Davis Stable Isotope Facility. 209
210
2.4.2. GC-C-IRMS analysis of bound amino acids 211
For the GC-C-IRMS analysis of bound amino acids approximately 800 mg ground soil and 212
approximately 70 mg ground root sample were weighted into separate 16x100 soda-lime disposable 213
test tubes (Duran Group, Mainz, Germany).The samples were hydrolyzed as followed: 2 ml 6 M 214
HCl was added to each sample and heated to 110 °C for 20 hours. To remove solids and lipophilic 215
compounds 4 ml n-hexane/dichloromethane (6:5, v/v) was added to the soil samples and 2 ml to the 216
root samples. After mixing and centrifugation, the aquatic phase was transferred through a Pasteur 217
pipette lined with glass wool followed by 2 x 0.5 mL 0.1 M HCl into new test tubes and the internal 218
standard was added. After freeze drying and resolving in 1 ml 0.01 M HCl, the sample was 219
transferred to a polypropylene column containing 2 g Dowex 50w x 8 cation exchange resin for 220
separation of compounds containing N and compounds not containing N. After eluting the amino 221

8
acid with 2.5 M ammonium hydroxide solution, the sample was freeze-dried and derivatizied 222
according to Enggrob et al. (2019). 223
224
The GC-IRMS analyses were performed as described by Enggrob et al. (2019), briefly: A VF-23m 225
capillary column (60 m x 0.25 mm inner diameter x 0.25 µm film thickness, Agilent Technologies, 226
Amstelveen, Netherland) fittet in a Trace GC Ultra mounted with a TriPlus autosampler (both from 227
Thermo Scientific, Hvidovre, DK), were used to separate the derivate. The inlet was operating at 228
250°C in splitless mode, with a Helium column flow of 1.4 mL min-1. The gas chromatograph was 229
coupled via a combustion reactor (GC IsoLink, Thermo Scientific, Hvidovre, DK), oxidation at 230
1000°C, to an isotope ratio mass spectrometer (Delta V Plus IRMS, Thermo Scientific, Hvidovre, 231
DK). All MS related parameters were controlled by the Isodat software version 3.0 (Thermo 232
Scientific, Hvidovre, DK). All δ13C values were reported relative to the Vienna PeeDee Belemnite 233
(VPDB) international isotope standard. All δ15N values were reported relative to the δ15N values of 234
atmospheric N2. A standard curve based on analyses of Asparagine (Asn) with an increasing 235
percentages of fully-labeled Asn (13C-4, 15N-2), showed a strong linearity of all δ13C and δ15N 236
values, with increasing amounts of fully-labeled Asn (13C-4, 15N-2), with coefficient of 237
determination of R2=0.984 and R2=0.982 for 13C and 15N, respectively. The AAs were identified by 238
the retention time of standards and the concentration calculated relative to individual standard 239
curves. 240
241
2.5. Calculations and statistical analysis 242
Mineralization of the >100 kDa organic N to 14CO2 was calculated as percent of added, where the 243
measured 14C-activity in the base traps were background corrected based on the respective controls 244
added water, and then divided by the 14C-activity added initially. Controls were soil added water for 245
the treatment without maize, and maize and soil added water for the treatments with plants. Total 246
uptake of 13C and 15N in maize shoot and root was calculated from the excess quantify of tracer 247
using maize receiving water as natural abundance backgrounds, and expressed as percent of added 248
13C and 15N with the >100 kDa organic N. 249
250
The concentration of amino acid in hydrolyzed soils and roots was calculated based on individual 251
standard curves for each amino acid together with internal standard present in each sample. The 252
13C-labeled amino acids remaining in soil 48 hours after addition of the 100 kDa organic N was 253

9
calculated as the concentration of each individual amino acid in soil multiplied by the 13C at% 254
excess of the particular amino acid using the respective controls receiving water as natural 255
abundance backgrounds, and expressed as percent of 13C added in each individual amino acid in the 256
>100 kDa organic N. The 15N uptake occurring in organic form was estimated as the ratio between 257
total 13C and total 15N uptake in the whole plant. The presence of 13C-labeled amino acids in roots 258
after 48 hours was calculated as the concentration of each individual amino acid in root multiplied 259
by the 13C at% excess of the particular amino acid using control maize added water as natural 260
abundance backgrounds, and expresses as percent of 13C added in each individual amino acid in the 261
>100 kDa organic N. The specific enrichment of individual amino acids in root was calculated as 262
the ratio between the total 13C amount and the total C amount in each individual amino acid. 263
264
The influence of the soil pH levels and the presence of maize on mineralization to 14CO2, bulk 13C 265
and 15N in maize shoot and root, total amino acids content and 13C-labeled amino acid content in 266
soil and maize roots were tested with a linear mixed-effects model using the statistical analysis 267
program R version 3.5.1 using R-package lme4 (RCoreTeam, 2018). For statistical analysis, the 268
datasets were divided into subsets, each subset were tested for normal distribution by the Shapiro-269
Wilk normality test (Royston, 1982). For each subset, a two-sample t-test comparing the least-mean 270
squares was conducted using R-package emmeans. Significance was declared at P ≤ 0.05. 271
272
3. Results 273
Maize grew better in soil at medium and high pH than at the low pH level. Maize seedlings at the 274
soil low pH level had significantly lower shoot, root and total dry matter yields than maize in the 275
medium and high soil pH levels (Table 3). In presence of maize, the addition of the >100 kDa 276
organic N did not significantly affect the concentrations of individual amino acids in hydrolyzed 277
soil irrespective of pH level (Fig. S2) nor was the concentration of individual amino acids in the 278
root samples generally affected (Fig. S2). 279
280
3.1. Mineralization of >100 kDa organic N with and without maize 281
The mineralization of the >100 kDa organic N in soil without followed first order kinetics with 282
detection of 14CO2 already after 1 hour across the pH gradient (Fig. 2A). The accumulated 283
mineralization was significantly higher (P = 0.0259) in the high pH soil than the low pH soil (Fig. 284
2B). Mineralization in the high pH soil was 9.2 ± 0.7 % of added 14C as 14CO2 compared to 6.2 ± 285

10
0.6 % of added in the low pH soil, whereas the medium pH soil had intermediate 14CO2 evolution 286
with 7.0 ± 0.3 % of added after 48 hours (Fig. 2B). Interestingly, these differences in mineralization 287
across soil pH levels disappeared in the presence of maize, where there were no significant 288
differences between mineralization across the pH gradient (Fig. 2B). 289
290
3.2. 13C-labeled amino acids remaining in soil with and without maize 291
After 48 hours 6 to 50% of the bound amino acids added in the >100 kDa organic N remained with 292
intact C-skeletons in the soils without maize (Fig. 3). There was a considerable variation in the 293
proportion remaining among individual amino acids across the pH gradient with 13-50%, 16-50% 294
and 6-38% of individual amino acids remaining in the soils with low, medium and high pH levels, 295
respectively. Surprisingly, in the presence of maize the general pattern was that significantly higher 296
proportions of individual amino acids remained in the soil compared to the soil without maize (Fig. 297
3); except lysine where similar proportions remained, and tyrosine at all pH levels and 298
phenylalanine at the low pH level where greater proportions remained in the soil without maize. 299
The lowest proportions of individual amino acid remaining was 19, 19 and 18 % of the added at the 300
low, medium and high soil pH levels, respectively, with the highest proportions remaining reaching 301
as much as 78% of added (alanine in the medium pH soil). In line with the controls without maize, 302
there was also in the presence of maize a considerable variation in the proportion remaining among 303
individual amino acids with 19-74%, 19-78% and 18-66% of the added 13C in individual amino 304
acids remaining in the low, medium and high pH level soils, respectively. 305
306
3.3. Bulk 13C and 15N uptake in maize 307
The uptake of 15N was significantly (P < 0.001) greater than the uptake of 13C across the soil pH 308
gradient (Fig. 4). The total uptake of 15N ranged from 6.5 to 12.0 % of 15N added the >100 kDa 309
fraction (Fig. 4c) with the 15N equally distributed among the roots and the shoots (Fig. 4a,b). The 310
15N uptake was significantly higher in the medium and high pH soils than in the low pH soil in line 311
with the mineralization pattern found for the soils without maize. However, we found no correlation 312
between 15N uptake and the actual 14CO2 evolution in the soils with maize. The uptake of 13C 48 313
hours after addition of the >100 kDa organic N was significantly (P < 0.001) higher in roots (1.4 to 314
2.2 % of 13C added) than in the shoots (0.4 to 0.5% of 13C added). Although the uptake of 13C in 315
roots tended to be lower in the low pH soils there was no significant differences across the soil pH 316
gradient (Fig. 4b). On a whole plant basis, the 13C-to-15N uptake-ratio was 28 ± 5%, 20 ± 1% and 22 317

11
± 4% in the low, medium and high pH soil, respectively with no significant differences in the 13C-318
to-15N uptake-ratio across the soil pH gradient. 319
320
3.4. Presence of 13C-labeled amino acids in maize 321
The presence of individual 13C-labeled amino acids varied significantly in maize roots at all three 322
soil pH levels (Fig. 5). The presence ranged from 0 to 1.7% of the 13C added with the >100 kDa 323
organic N across soils; with no significant effects of soil pH level on the presence of individual 13C-324
labeled amino acids. The presence of individual amino acids had a similar pattern across the soil pH 325
gradient where glutamine/glutamate, proline/threonine and leucine had the greatest presence 326
reaching close to 2% of added, and lysine had the lowest presence throughout. The pattern of amino 327
acid presence in maize roots did not resemble the pattern of neither amino acids remaining in the 328
soil nor amino acids lost from the soil. The average presence of 13C-labeled amino acids in maize 329
roots was 0.5-0.6% of the added. Thus, the 13C in the root amino acids corresponded to one third of 330
the bulk 13C recovered. 331
332
4. Discussion 333
334
4.1. Mineralization with and without maize 335
Mineralization of the >100 kDa organic N in the soils without maize started immediately across the 336
soil pH gradient, confirming that the microbial toolbox for depolymerization of large organic N was 337
ready and available irrespective of soil pH level (Enggrob et al. subm.). Individual amino acids are 338
completely removed from soil solution (Czaban et al., 2016b; Hill & Jones, 2019) and mineralized 339
(Wilkinson et al., 2014; Hill & Jones, 2019) within minutes to hours. Clearly the >100 kDa organic 340
N studied here was not respired at similar rates with the 14CO2 evolution expected to continue 341
beyond the 48 hours chase period used here (Enggrob et al. subm.). The significant effect of pH 342
level on accumulated 14CO2 in soil without maize disappeared in the presence of maize. This change 343
in respiration pattern in especially the low pH soil must be related to higher microbial or plant 344
respiration. Increased microbial respiration could be due to a more active microbial biomass in 345
rhizosphere soil (Blagodatskaya et al., 2014), a greater overall turnover of the >100 kDa organic N 346
added, or a shift from anabolism to catabolism in the microbial community (Liang et al., 2017). 347
Plants may also have contributed to the 14CO2 respiration organic compounds from the >100 kDa 348

12
organic N were taken up and used as energy source in the maize roots (Näsholm et al., 2009; Hill et 349
al., 2011b; Warren, 2012; Hildebrandt et al., 2015). 350
351
4.2. Added >100 kDa organic N remaining in soil with and without maize 352
In the soils without maize, 6 to 50% of individual amino acids added with the >100 kDa organic N 353
remained in the soil 48 hours after the addition. Assuming an equal degradation of proteins in the 354
added >100 kDa organic N, we use the individual amino acids with lowest proportions remaining as 355
an estimate of the proportion of proteins in the >100 kDa organic N remaining intact as added. 356
Thus, the present results strongly support that depolymerization of dissolved protein-sized organic 357
N occurs rapidly (Enggrob et al. subm.). The lowest proportions of individual amino acids 358
remaining in the soil without maize were 13, 16 and 6% of added at the low, medium and high soil 359
pH levels, respectively (Fig. 3). We interpret amino acids remaining at higher proportions than the 360
lowest (i.e. above the dashed line in Fig. 3) as representing 13C-labeled amino acids incorporated in 361
the microbial biomass (Enggrob et al. subm.). This based on the higher proportions of simpler 362
amino acids (fewer biosynthetic steps) remaining than the more complex amino acids (from left to 363
right on Fig. 3). The amino acids with fewer biosynthetic steps (alanine, glutamine/glutamate, 364
asparagine/aspartate, glycine) are among those known to be part of bacterial cell walls (Simelyte et 365
al., 2003; Vollmer et al., 2008; Schneewind & Missiakas, 2012). Thus, the majority of the labeled 366
amino acids recovered from soil were most likely build into microbial tissue in the soil without 367
maize. 368
369
The finding of more amino acids remaining in soil with than without maize (Fig. 3) is surprising, 370
since turnover is generally considered to be greater in rhizosphere than bulk soil (Godlewski & 371
Adamczyk, 2007; Blagodatskaya et al., 2014). The higher proportions of amino acids remaining in 372
the soil with than without maize point to a lower overall degradation of the added >100 kDa organic 373
N. Plant exudation of C-rich compounds usually makes the rhizosphere N limited (Kuzyakov, 2002; 374
Jones et al., 2013), which ought to have increased the microbial need for N mining (Kuzyakov, 375
2010). Soil in the micro-lysimeters was expected to be low in available N as no fertilizers were 376
added and the roots occupied the whole soil. However, N mining would lead to greater loss of C 377
from the added >100 kDa organic N, which was evident for the 14CO2 respiration, but not for the 378
loss of 13C-labeled amino acids from the >100 kDa organic N added. Instead, other nutrients than N 379
may have been limited (Dijkstra et al., 2013), and thus reduced the microbial turnover of added 380
13
>100 kDa organic N. The higher proportion of amino acids with fewer biosynthetic steps remaining 381
also in the soil with maize again indicate microbial incorporation of amino acids derived from the 382
added >100 kDa organic N. This can be explained if maize exudation of C-rich compounds reduces 383
the microbial need for using amino acid C-skeletons for energy. In addition, unrecovered root hairs 384
and root fragments may contain 13C-labeled amino acids, which could contribute to a greater 385
proportion of amino acids in the soil. 386
387
4.3. Bulk uptake and presence of intact amino acids in maize 388
The uptake of 15N in maize after 48 hours reached up to 12 % of the added with the >100 kDa 389
organic N. This is in the same range of the 0-26% of added 15N in alanine and tri-alanine in grass 390
after 2.5 hours (Wilkinson et al., 2015), in the lower range of the 13-28% of added 15N in an amino 391
acid mixture recovered in grass after 48 hours (Sauheitl et al., 2009b), and somewhat lower than the 392
30% of added 15N in alanine recovered in wheat after 24 hours (Hill & Jones, 2019). The lower 393
level of 15N uptake in the present study compared to studies with similar chase periods is probably 394
due the the expected delay in production in bio-available organic N after depolymerization. The 15N 395
uptake was markedly higher than 13C uptake (Fig. 4) showing uptake of inorganic 15N from 396
mineralization of the >100 kDa and/or post-uptake metabolism of organic N (Näsholm et al., 2009; 397
Warren, 2012). The presence of 13C in plant tissue indicates organic N uptake since uptake of 13C 398
via e.g. pyruvate and bicarbonate usually cannot explain all 13C uptake from rapidly cycling amino 399
acids. Moreover, the present setup with a sealed root system the fixation of 13C via photosynthesis 400
must have been minimal as also shown by the lower 13C presence in shoots than roots (Fig. 4). 401
402
We analyzed root material for 13C-labeled amino acids by compound specific isotope analysis to 403
confirm the uptake of amino acids derived from the >100 kDa organic N. Across the soil pH 404
gradient, 13C-labeled amino acids were present in maize roots, which support the uptake of organic 405
N. Interestingly, the average presence of 13C-labeled amino acids in maize roots accounted for one 406
third of the bulk 13C uptake, which is a higher proportion than previously reported (Sauheitl et al., 407
2009a). The 13C-labeled amino acids varied in their presence in roots, which can arise from 408
differences in the actual bio-availability in soil, the actual uptake, and the post-uptake fate in roots 409
of the specific amino acids. We cannot with the present data determine the uptake rates of amino 410
acids from the >100 kDa organic N, neither can we deduce whether the organic N was taken up as 411
free amino acids or bound in peptides (Hill et al., 2011b). However, the post-uptake fate of 412

14
individual amino acids may be indicated by the specific enrichment of amino acids in the maize 413
roots (Fig. S3), where a greater specific enrichment indicate a greater recycling of amino acid C-414
skeletons. We speculate that the post-uptake fate of amino acids is a balance between abundance of 415
the amino acid in the plant tissue and the energy gain when using the amino acid in catabolism 416
(Hildebrandt et al., 2015). For example, comparing leucine and tyrosine both with high energy gain 417
in catabolism (Hildebrandt et al., 2015), we found greater presence of leucine than tyrosine both as 418
% of added (Fig. 5) and as specific enrichment (Fig. S3), which could be related to a greater 419
abundance of leucine in maize root tissue (Fig. S2). The difference could also be related to a greater 420
uptake of leucine than tyrosine though. 421
422
4.4 Estimation of N uptake in organic form 423
We found that 20-30% of N uptake was in organic form across the soil pH gradient assuming that 424
the 15N uptake represents the net-plant-available N. We advocate that the N uptake in organic form 425
should be based on the ratio between the net-uptake of 13C and 15N. We acknowledge that the 13C-426
uptake in the present study could be affected by C-tracer uptake bias, but as shown by the 427
compound specific isotope analysis then at least one third of the C-tracer uptake could be accounted 428
for by 13C in amino acids. Furthermore, the C-tracer uptake in the present study does not take 13C 429
loss from post-uptake metabolism into account. The recent study by (Hill & Jones, 2019) reports 430
both 13C and 15N in ‘% of added’ alanine to wheat and our calculation of their data show a 4% 13C-431
to-15N uptake-ratio after 24 hours. The higher organic N uptake in the present study is most likely 432
related to a slower release of bio-available organic N, than with the pulse of alanine added in the 433
Hill and Jones study. A pulse of organic N may saturate the microbial biomass (Czaban et al., 434
2016b) and allow plants a better chance for competition (Näsholm et al., 2009). Interestingly, the 435
20-30% net-organic N-uptake estimate in the present study is in line with the 13C-to-15N ratio-based 436
estimates reported for e.g. glycine uptake in four grassland species (Näsholm et al., 2000), wheat 437
(Näsholm et al., 2001), and tomato (Ge et al., 2009), and uptake of amino acid mixtures in grass 438
(Sauheitl et al., 2009b). Hence, the present study shows that when N is added to a plant-soil system 439
in large molecular sizes then the potential for intact organic N uptake is at least at the same level or 440
higher than when organic N is added as individual amino acids. 441
442
Conclusion 443
15
We conducted an experiment in soils with and without maize at three pH levels with addition of 444
triple-labeled >100 kDa organic N. Maize was grown for three weeks in micro-lysimeters prior to 445
addition of the >100 kDa organic N creating rhizosphere soil in the whole soil volume in treatments 446
with maize. In soil without maize, mineralization differed significantly between pH levels, whereas 447
there was no difference in 14CO2 among soil pH levels in presence of maize. The >100 kDa organic 448
N was rapidly turned over in soil both with and without maize, but surprisingly more amino acids 449
derived from >100 kDa organic N remained in soil with than without maize most likely in the 450
microbial biomass. Maize grew better at a soil pHCaCl2 of 5.4 and 7.1, and the total 15N uptake from 451
>100 kDa organic N increased with higher soil pH reaching 12 % at a pH level of 7.1 48 hours after 452
addition of the >100 kDa organic N. Based on the 13C-to-15N uptake-ratio we estimated that 20-30% 453
of the N uptake occurred in organic form across the three pH levels. The presence of 13C-labeled 454
amino acids in maize roots confirmed the organic N uptake. 455
456
Acknowledgement 457
The study was financially supported by The Independent Research Fund Denmark – Technology 458
and Production (Project no. 1335-00760B). The authors wish to thank Limagrain A/S for delivering 459
seeds for the experiment. 460
461
Author contributions 462
All authors designed and executed the experiment and analysis, K.L.E. ran the statistical analysis, 463
K.L.E. and J.R. drafted the manuscript, and all authors revised the manuscript and approved the 464
final version. 465
466
References 467
468
Blagodatskaya E, Blagodatsky S, Anderson TH, Kuzyakov Y. 2014. Microbial growth and 469
carbon use efficiency in the rhizosphere and root-free soil. Plos ONE 9, e93282. 470
471
Chapin FS, Moilanen L, Kielland K. 1993. Preferential use of organic nitrogen for growth by a 472
nonmycorrhizal arctic sedge. Nature 361, 150-153. 473
474

16
Clarholm M. 1985. Interactions of bacteria, protozoa and plants leading to mineralization of soil-475
nitrogen. Soil Biology & Biochemistry 17, 181-187. 476
477
Colas D, Doumeng C, Pontalier PY, Rigal L. 2013. Green crop fractionation by twin-screw 478
extrusion: Influence of the screw profile on alfalfa (Medicago sativa) dehydration and protein 479
extraction. Chemical Engineering and Processing 72, 1-9. 480
481
Czaban W, Jämtgard S, Näsholm T, Rasmussen J, Nicolaisen M, Fomsgaard IS. 2016a. Direct 482
acquisition of organic N by white clover even in the presence of inorganic N. Plant and Soil 407, 483
91-107. 484
485
Czaban W, Rasmussen J, Laursen BB, Vidkjær NH, Sapkota R, Nicolaisen M, Fomsgaard IS. 486
2018. Multiple effects of secondary metabolites on amino acid cycling in white clover rhizosphere. 487
Soil Biology & Biochemistry 123, 54-63. 488
489
Czaban W, Rasmussen J, Nicolaisen M, Fomsgaard IS, 2016b. Dissipation kinetics of 490
asparagine in soil measured by compound-specific analysis with metabolite tracking. Biology and 491
Fertility of Soils 52, 911-916. 492
493
Dijkstra FA, Carrillo Y, Pendall E, Morgan JA, 2013. Rhizosphere priming: a nutrient 494
perspective. Frontiers in Microbiology 4, Article no. 216. 495
496
Enggrob KL, Larsen T, Larsen M, Elsgaard L, Rasmussen J. 2019. The influence of hydrolysis 497
and derivatization on the determination of amino acid content and isotopic ratios in dual-labeled 498
(13C, 15N) white clover. Rapid Communications in Mass Spectrometry 33, 21-30. 499
500
Enggrob KL, Larsen T, Rasmussen J. Molecular size doesn’t matter for turning over large 501
organic N in soil. Nature, submitted. 502
503
Forsum O, Svennerstam H, Ganeteg U, Näsholm T. 2008. Capacities and constraints of amino 504
acid utilization in Arabidopsis. New Phytologist 179, 1058-1069. 505
506

17
Ge TD, Song SW, Roberts P, Jones DL, Huang DF, Iwasaki K. 2009. Amino acids as a nitrogen 507
source for tomato seedlings: The use of dual-labeled (13C, 15N) glycine to test for direct uptake by 508
tomato seedlings. Environmental and Experimental Botany 66, 357-361. 509
510
Godlewski M, Adamczyk B. 2007. The ability of plants to secrete proteases by roots. Plant 511
Physiology and Biochemistry 45, 657-664. 512
513
Hildebrandt TM, Nesi AN, Araujo WL, Braun HP. 2015. Amino acid catabolism in plants. 514
Molecular Plant 8, 1563-1579. 515
516
Hill PW, Farrar J, Roberts P, Farrell M, Grant H, Newsham KK, Hopkins DW, Bardgett RD, 517
Jones DL. 2011a. Vascular plant success in a warming Antarctic may be due to efficient nitrogen 518
acquisition. Nature Climate Change 1, 50-53. 519
520
Hill PW, Jones DL. 2019. Plant–microbe competition: does injection of isotopes of C and N into 521
the rhizosphere effectively characterise plant use of soil N? New Phytologist 221, 796-806. 522
523
Hill PW, Quilliam RS, Deluca TH, Farrar J, Farrell M, Roberts P, Newsham KK, Hopkins 524
DW, Bardgett RD, Jones DL. 2011b. Acquisition and assimilation of nitrogen as peptide-bound 525
and D-enantiomers of amino acids by wheat. Plos ONE 6, e19220. 526
527
Jämtgard S, Näsholm T, Huss-Danell K. 2008. Characteristics of amino acid uptake in barley. 528
Plant and Soil 302, 221-231. 529
530
Jan MT, Roberts P, Tonheim SK, Jones DL. 2009. Protein breakdown represents a major 531
bottleneck in nitrogen cycling in grassland soils. Soil Biology & Biochemistry 41, 2272-2282. 532
533
Jones DL, Clode PL, Kilburn MR, Stockdale EA, Murphy DV. 2013. Competition between 534
plant and bacterial cells at the microscale regulates the dynamics of nitrogen acquisition in wheat 535
(Triticum aestivum). New Phytologist 200, 796-807. 536
537

18
Jones DL, Healey JR, Willett VB, Farrar JF, Hodge A. 2005a. Dissolved organic nitrogen 538
uptake by plants - an important N uptake pathway? Soil Biology & Biochemistry 37, 413-423. 539
540
Jones DL, Shannon D, Junvee-Fortune T, Farrar JF. 2005b. Plant capture of free amino acids is 541
maximized under high soil amino acid concentrations. Soil Biology & Biochemistry 37, 179-181. 542
543
Kielland K, McFarland J, Olson K. 2006. Amino acid uptake in deciduous and coniferous taiga 544
ecosystems. Plant and Soil 288, 297-307. 545
546
Knicker H. 2011. Soil organic N - An under-rated player for C sequestration in soils? Soil Biology 547
& Biochemistry 43, 1118-1129. 548
549
Kuzyakov Y. 2002. Review: Factors affecting rhizosphere priming effects. Journal of Plant 550
Nutrition and Soil Science 165, 382-396. 551
552
Kuzyakov Y. 2010. Priming effects: Interactions between living and dead organic matter. Soil 553
Biology & Biochemistry 42, 1363-1371. 554
555
Lassaletta L, Billen G, Grizzetti B, Anglade J, Garnier J. 2014. 50 year trends in nitrogen use 556
efficiency of world cropping systems: the relationship between yield and nitrogen input to cropland. 557
Environmental Research Letters 9, Article no. 105011. 558
559
Liang C, Schimel JP, Jastrow JD. 2017. The importance of anabolism in microbial control over 560
soil carbon storage. Nature Microbiology 2, Article no. 17105. 561
562
Meier U. 2001. Growth stages of mono-and dicotyledonous plants. BBCH Monographs 2nd edition. 563
Federal Biological Research Centre for Agriculture and Forestry, Berlin, Germany. 564
565
Näsholm T, Ekblad A, Nordin A, Giesler R, Högberg M, Högberg P. 1998. Boreal forest plants 566
take up organic nitrogen. Nature 392, 914-916. 567
568
19
Näsholm T, Huss-Danell K, Högberg P. 2000. Uptake of organic nitrogen in the field by four 569
agriculturally important plant species. Ecology 81, 1155-1161. 570
571
Näsholm T, Huss-Danell K, Högberg P. 2001. Uptake of glycine by field grown wheat. New 572
Phytologist 150, 59-63. 573
574
Näsholm T, Kielland K, Ganeteg U, 2009. Uptake of organic nitrogen by plants. New Phytologist 575
182, 31-48. 576
577
Paungfoo-Lonhienne C, Schenk PM, Lonhienne TGA, Brackin R, Meier S, Rentsch D, 578
Schmidt S. 2009. Nitrogen affects cluster root formation and expression of putative peptide 579
transporters. Journal of Experimental Botany 60, 2665-2676. 580
581
Paungfoo-Lonhienne C, Visser J, Lonhienne TGA, Schmidt S. 2012. Past, present and future of 582
organic nutrients. Plant and Soil 359, 1-18. 583
584
Rasmussen J, Gjettermann B, Eriksen J, Jensen ES, Høgh-Jensen H. 2008. Fate of 15N and 14C 585
from labelled plant material: Recovery in perennial ryegrass-clover mixtures and in pore water of 586
the sward. Soil Biology & Biochemistry 40, 3031-3039. 587
588
Rasmussen J, Kuzyakov Y. 2009. Carbon isotopes as proof for plant uptake of organic nitrogen: 589
Relevance of inorganic carbon uptake. Soil Biology & Biochemistry 41, 1586-1587. 590
591
Rasmussen J, Sauheitl L, Eriksen J, Kuzyakov Y. 2010. Plant uptake of dual-labeled organic N 592
biased by inorganic C uptake: Results of a triple labeling study. Soil Biology & Biochemistry 42, 593
524-527. 594
595
RCoreTeam. 2018. R: A language and environment for statistical computing. R Foundation for 596
Statistical Computing. 597
598
Rousk J, Baath E. 2011. Growth of saprotrophic fungi and bacteria in soil. FEMS Microbiology 599
Ecology 78, 17-30. 600

20
601
Royston JP. 1982. An extension of Sharpiro and Wilk-W test for normality of large samples. 602
Journal of the Royal Statistical Society. Series C Applied Statistics 31, 115-124. 603
604
Rubaek GH. 2008. Effects of liming and P fertilisation. In: Long continued agricultural soil 605
experiments: a Nordic platform – a catalogue. Editors Petersen J, Mattsson L, Reiley H, Sala T, 606
Thorvaldsson G, Christensen BT. DJF Plant Science 16, 12-14, Aarhus University, Denmark. 607
608
Sauheitl L, Glaser B, Weigelt A. 2009a. Advantages of compound-specific stable isotope 609
measurements over bulk measurements in studies on plant uptake of intact amino acids. Rapid 610
Communications in Mass Spectrometry 23, 3333-3342. 611
612
Sauheitl L, Glaser B, Weigelt A. 2009b. Uptake of intact amino acids by plants depends on soil 613
amino acid concentrations. Environmental and Experimental Botany 66, 145-152. 614
615
Schimel JP, Bennett J. 2004. Nitrogen mineralization: Challenges of a changing paradigm. 616
Ecology 85, 591-602. 617
618
Schneewind O, Missiakas DM. 2012. Protein secretion and surface display in Gram-positive 619
bacteria. Philosophical Transactions of the Royal Society B-Biological Sciences 367, 1123-1139. 620
621
Simelyte E, Rimpilainen M, Zhang X, Toivanen P. 2003. Role of peptidoglycan subtypes in the 622
pathogenesis of bacterial cell wall arthritis. Annals of the Rheumatic Diseases 62, 976-982. 623
624
Sinsabaugh RL, Lauber CL, Weintraub MN, Ahmed B, Allison SD, Crenshaw C, Contosta 625
AR, Cusack D, Frey S, Gallo ME, Gartner TB, Hobbie SE, Holland K, Keeler BL, Powers JS, 626
Stursova M, Takacs-Vesbach C, Waldrop MP, Wallenstein MD, Zak DR, Zeglin LH. 2008. 627
Stoichiometry of soil enzyme activity at global scale. Ecology Letters 11, 1252-1264. 628
629
Soil Survey Staff. 1999. Soil Taxonomy: A Basic System of Soil Classification for Making and 630
Interpreting Soil Surveys. Natural Resources Conservation Service, United States Department of 631
Agriculture, Washington D.C., USA. 632

21
633
Soper FM, Paungfoo-Lonhienne C, Brackin R, Rentsch D, Schmidt S, Robinson N. 2011. 634
Arabidopsis and Lobelia anceps access small peptides as a nitrogen source for growth. Functional 635
Plant Biology 38, 788-796. 636
637
Vollmer W, Blanot D, de Pedro MA. 2008. Peptidoglycan structure and architecture. FEMS 638
Microbiology Reviews 32, 149-167. 639
640
Vranova V, Rejsek K, Formanek P. 2013. Proteolytic activity in soil: A review. Applied Soil 641
Ecology 70, 23-32. 642
643
Warren CR. 2012. Post-uptake metabolism affects quantification of amino acid uptake. New 644
Phytologist 193, 522-531. 645
646
Wilkinson A, Hill PW, Farrar JF, Jones DL, Bardgett RD. 2014. Rapid microbial uptake and 647
mineralization of amino acids and peptides along a grassland productivity gradient. Soil Biology & 648
Biochemistry 72, 75-83. 649
650
Wilkinson A, Hill PW, Vaieretti MV, Farrar JF, Jones DL, Bardgett RD. 2015. Challenging 651
the paradigm of nitrogen cycling: no evidence of in situ resource partitioning by coexisting plant 652
species in grasslands of contrasting fertility. Ecology and Evolution 5, 275-287. 653

Table 1. Basic properties of the three Jyndevad soils.
Name Liming pH1 C N [t ha-1] [g kg-1 soil]
Low pH 0 3.6 11.7 0.6 Medium pH 4 5.4 10.5 0.6 High pH 12 7.1 13.4 0.8
1 pH measured in 0.01 M CaCl2 in a 1:2.5 soil:solution ratio.
Table 2. Composition of the >100 kDa organic N used in the experiment; 13C and 15N enrichment expressed as atom fraction (AF) of the isotope. Data is given as mean ± standard error (n = 4).
Fraction C quantity N quantity C/N ratio 14C-activity AF 13C AF 15N [mg ml-1] [mg ml-1] [Bq ml-1]
>100 kDa 0.84 ±0.01 0.16 ±0.001 5.0 8.11 ±0.14 0.083 ±7.6E-5 0.014 ±0.1E-5
Table 3. Dry matter yield of maize grown in Jyndevad soils at three pH levels. Mean ± standard error (n = 4). Letters show significant differences among soil pH levels within each column.
Shoot Root Total
[mg DM micro-lysimeter-1]
Low pH 87 ± 9 b 65 ± 4 b 153 ± 13 b
Medium pH 117 ± 6 ab 109 ± 14 a 226 ± 19 a
High pH 127 ± 7 a 90 ± 5 ab 216 ± 12 a

Figure 1.
Figure 1. Conceptual figure showing the routes of 15N and 13C entry into plant from protein-sized dissolved organic N (DON, >100 kDa in the present study). Initially, protein-sized organic N needs to be depolymerized to lower molecular weight (Mw) DON, which can either be directly assimilated by plants or be mineralized to inorganic N forms before plant uptake. Thus, plant 15N-enrichment is the result of either organic N or inorganic N uptake, and plant 13C-enrichment is the result of either organic C uptake or inorganic C assimilation via photosynthesis or dark fixation. The lower box indicates that at present we lack knowledge of the proportion of total N uptake occurring via organic N forms.
15N, 13C, 14CLabeled
DON>100 kDa
LowerMw DON
Plant 15N + 13C
Depolymerization
CO2 [g]HCO3
-
Inorganic NNH4
+, NO3-Mineralization
Bio-available N
Plant 15NPlant 13C
Organic N uptake
Inorganic N uptake
??

Figure 2.
Figure 2. Mineralization of >100 kDa organic N to 14CO2 in Jyndevad soils. (a) Temporal development of mineralization and (b) accumulated mineralization after 48 hours soil without and with maize. The three pH levels are low at pHCaCl2 3.6, medium at pHCaCl2 5.4, and high at pHCaCl2 7.1. Statistical differences among soil pH levels in accumulated 14CO2 after 48 hours are indicated by different letters above the bars (n = 4).
b
Without maize With maize
Min
era
liza
tio
n t
o C
O2 (
ac
cu
mu
late
d 1
4C
O2 o
f a
dd
ed
14C
, %)
0
2
4
6
8
10
12
a
Time of incubation (hours)0 10 20 30 40 50
0
2
4
6
8
10
12 Low pH (3.6)Medium pH (5.4)High pH (7.1)
aabb
- a -

Figure 3.
Figure 3. Bound amino acids from added >100 kDa organic N remaining in Jyndevad soils after 48 hours without and with maize in soil at (a) low pH, (b) medium pH, and (c) high pH. Significant differences between unplanted soil and soil with maize in 13C remaining for individual amino acids are marked by an asterisk above the bars (n=4). Amino acids are organized from left on right with increasing steps in their biosynthesis. The amino acids: asparagine and aspartate (Asx), glutamine and glutamate (Glx), and Proline and Threonine (Pro/Thr) elute together in the GC-C-IRMS analysis of acid hydrolyzed samples. The red dashed line indicate the lowest proportion of an individual amino acid remaining in soil without maize.
a: Low pH
0
20
40
60
80
100Without maizeWith maize
b: Medium pH
Bo
un
d a
min
o a
cid
rem
ain
ing
in s
oil
(%
of
13 C
ad
de
d i
n in
div
idu
al a
min
o a
cid
s)
0
20
40
60
80
100
c: High pH
Ala
As
x
Glx
Ser
Gly
Pro
/Th
r
Va
l
Ile
Leu Lys Tyr
Ph
e
0
20
40
60
80
100
*
*
*
* *
*
*
**
**
*
*
*
* *
*
**
*
*
*
*
*
*
*
**
*
*

Figure 4.
Figure 4. Bulk uptake of 13C and 15N from >100 kDa organic N 48 hours after addition in maize (a) shoots, (b) roots, and (c) the whole plant. Significant differences in uptake among soils with different pH are marked by different letters above the bars (n =4).
a: Shoot
Rec
ove
ry o
f tr
acer
in
pla
nt
tiss
ue
(% o
f ad
ded
wit
h >
100
kDa
org
anic
N)
0
2
4
6
8Low pHMedium pHHigh pH
b: Root
0
2
4
6
8
c: Whole plant
0
5
10
15
b a a
b a a
b a a
- a -
- a -
- a -
15N 13C

Figure 5.
Figure 5. Presence of 13C-labeled bound amino acids from added >100 kDa organic N in maize roots after 48 hours in Jyndevad soils in soil with (a) low pH, (b) medium pH, and (c) high pH. Significant differences between presence among individual amino acids within each soil pH level are marked by different letters above the bars (n=4). Amino acids are organized from left on right with increasing steps in their biosynthesis. The amino acids: asparagine and aspartate (Asx), glutamine and glutamate (Glx), and Proline and Threonine (Pro/Thr) elute together in the GC-C-IRMS analysis of the acid hydrolyzed samples.
a: Low pH
0.0
0.5
1.0
1.5
2.0
b: Medium pH
Pre
sen
ce o
f la
bel
ed b
ou
nd
am
ino
aci
d i
n m
aize
ro
ots
(%
of
13 C
ad
ded
in
ind
iviu
al a
min
o a
cid
s)
0.0
0.5
1.0
1.5
2.0
c: High pH
Ala
As
x
Glx
Ser
Gly
Pro
/Th
r
Va
l
Ile
Leu Lys Tyr
Ph
e
0.0
0.5
1.0
1.5
2.0
b bc
cd
aa
a
b
cd cd
bc
d
de de
ef
b
a
bc
cd
df ef
d
fgg
bcbc
ce
a a
b
cb
defeg
cd
fgg

Supporting Material for Enggrob et al.
Figure S1. Concentration, 13C and 15N atom fractions of individual amino acids bound in the >100 kDa organic N added to the soils. Mean ± standard error (n = 4).
Am
ino
aci
d c
on
cen
trat
ion
(mg
ml-
1)
0.00
0.05
0.10
0.15
0.20
Am
ino
aci
d 13
C a
tom
fra
cti
on
0.00
0.05
0.10
Ala
As
x
Glx
Ser
Gly
Pro
/Th
r
Val Ile
Leu Lys Tyr
Ph
e
Am
ino
aci
d 15
N a
tom
fra
ctio
n
0.00
0.01
0.02

Figure S2. Concentration of bound amino acids after 48 hours in soil with maize (a, c, e) and maize root tissue (b, d, f) from control added water and soil added protein-sized organic N (>100 kDa). Low pH (a, b), Medium pH (c, d), and High pH (e, f) in Jyndevad soils. Bars show mean ± standard error (n = 4). Amino acids are organized from left on right with increasing steps in their biosynthesis. The amino acids: asparagine and aspartate (Asx), glutamine and glutamate (Glx), and Proline and Threonine (Pro/Thr) elute together in the GC-C-IRMS analysis of the acid hydrolyzed samples.
a: Low pH
0.00
0.05
0.10
0.15
0.20
0.25
0.30
Control>100 kDa
c: Medium pH
Bo
un
d a
min
o a
cid
co
nce
ntr
atio
n (
mg
AA
g-1
)
0.00
0.05
0.10
0.15
0.20
0.25
0.30
e: High pH
Ala
Asx Glx
Se
r
Gly
Pro
/Th
r
Va
l
Ile
Leu Lys Tyr
Ph
e
0.00
0.05
0.10
0.15
0.20
0.25
0.30
b: Low pH
0
2
4
6
8
10
12
d: Medium pH
0
2
4
6
8
10
12
f: High pH
Ala
Asx Glx
Se
r
Gly
Pro
/Th
r
Va
l
Ile
Leu Lys Tyr
Ph
e
0
2
4
6
8
10
12
--- Soil --- --- Root ---
nn
nn
nn
nn
*
*
*
*

Figure S3. Specific enrichment of 13C-labeled bound amino acids from added protein-sized organic N (>100 kDa) in maize roots after 48 hours in Jyndevad soils at (a) low pH, (b) medium pH, and (c) high pH. Significant differences between specific enrichment among individual amino acids within each soil pH level are marked by different letters above the bars (n=4). Amino acids are organized from left on right with increasing steps in their biosynthesis. The amino acids: asparagine and aspartate (Asx), glutamine and glutamate (Glx), and Proline and Threonine (Pro/Thr) elute together in the GC-C-IRMS analysis of the acid hydrolyzed samples.
a: Low pH
0.0
0.2
0.4
0.6
0.8
1.0
b: Medium pH
Sp
ecif
ic e
nri
chm
ent
of
bo
un
d a
min
o a
cid
s i
n m
aiz
e r
oo
ts (
µg
13C
mg
-1 t
ota
l C
)
0.0
0.2
0.4
0.6
0.8
1.0
c: High pH
Ala
As
x
Glx
Ser
Gly
Pro
/Th
r
Va
l
Ile
Leu Lys Tyr
Ph
e
0.0
0.2
0.4
0.6
0.8
1.0
cc
d
aba
ab
a
d
d
c
fde
f
ab
cc
ba
d
g
ef
g
c
c
c
aa
aa
a
bc
dc
d