Embed Size (px)
Citation preview
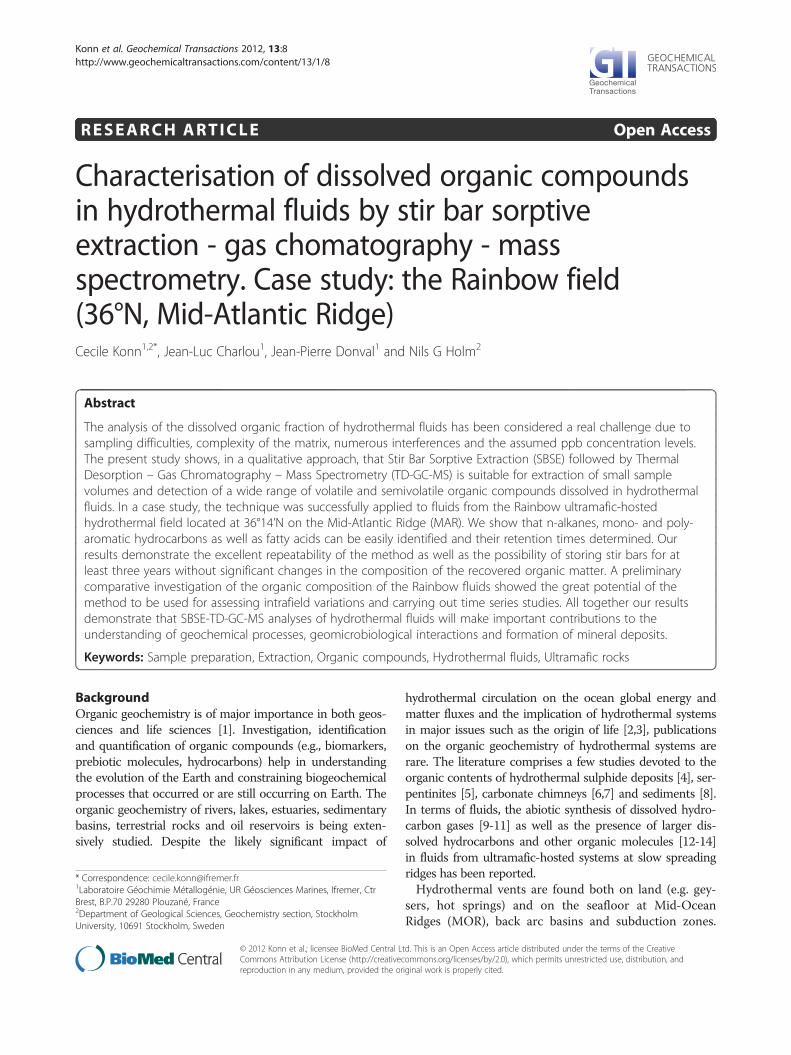
Konn et al. Geochemical Transactions 2012, 13:8http://www.geochemicaltransactions.com/content/13/1/8
RESEARCH ARTICLE Open Access
Characterisation of dissolved organic compoundsin hydrothermal fluids by stir bar sorptiveextraction - gas chomatography - massspectrometry. Case study: the Rainbow field(36°N, Mid-Atlantic Ridge)Cecile Konn1,2*, Jean-Luc Charlou1, Jean-Pierre Donval1 and Nils G Holm2
Abstract
The analysis of the dissolved organic fraction of hydrothermal fluids has been considered a real challenge due tosampling difficulties, complexity of the matrix, numerous interferences and the assumed ppb concentration levels.The present study shows, in a qualitative approach, that Stir Bar Sorptive Extraction (SBSE) followed by ThermalDesorption – Gas Chromatography – Mass Spectrometry (TD-GC-MS) is suitable for extraction of small samplevolumes and detection of a wide range of volatile and semivolatile organic compounds dissolved in hydrothermalfluids. In a case study, the technique was successfully applied to fluids from the Rainbow ultramafic-hostedhydrothermal field located at 36°14’N on the Mid-Atlantic Ridge (MAR). We show that n-alkanes, mono- and poly-aromatic hydrocarbons as well as fatty acids can be easily identified and their retention times determined. Ourresults demonstrate the excellent repeatability of the method as well as the possibility of storing stir bars for atleast three years without significant changes in the composition of the recovered organic matter. A preliminarycomparative investigation of the organic composition of the Rainbow fluids showed the great potential of themethod to be used for assessing intrafield variations and carrying out time series studies. All together our resultsdemonstrate that SBSE-TD-GC-MS analyses of hydrothermal fluids will make important contributions to theunderstanding of geochemical processes, geomicrobiological interactions and formation of mineral deposits.
Keywords: Sample preparation, Extraction, Organic compounds, Hydrothermal fluids, Ultramafic rocks
BackgroundOrganic geochemistry is of major importance in both geos-ciences and life sciences [1]. Investigation, identificationand quantification of organic compounds (e.g., biomarkers,prebiotic molecules, hydrocarbons) help in understandingthe evolution of the Earth and constraining biogeochemicalprocesses that occurred or are still occurring on Earth. Theorganic geochemistry of rivers, lakes, estuaries, sedimentarybasins, terrestrial rocks and oil reservoirs is being exten-sively studied. Despite the likely significant impact of
* Correspondence: [email protected] Géochimie Métallogénie, UR Géosciences Marines, Ifremer, CtrBrest, B.P.70 29280 Plouzané, France2Department of Geological Sciences, Geochemistry section, StockholmUniversity, 10691 Stockholm, Sweden
© 2012 Konn et al.; licensee BioMed Central LCommons Attribution License (http://creativecreproduction in any medium, provided the or
hydrothermal circulation on the ocean global energy andmatter fluxes and the implication of hydrothermal systemsin major issues such as the origin of life [2,3], publicationson the organic geochemistry of hydrothermal systems arerare. The literature comprises a few studies devoted to theorganic contents of hydrothermal sulphide deposits [4], ser-pentinites [5], carbonate chimneys [6,7] and sediments [8].In terms of fluids, the abiotic synthesis of dissolved hydro-carbon gases [9-11] as well as the presence of larger dis-solved hydrocarbons and other organic molecules [12-14]in fluids from ultramafic-hosted systems at slow spreadingridges has been reported.Hydrothermal vents are found both on land (e.g. gey-
sers, hot springs) and on the seafloor at Mid-OceanRidges (MOR), back arc basins and subduction zones.
td. This is an Open Access article distributed under the terms of the Creativeommons.org/licenses/by/2.0), which permits unrestricted use, distribution, andiginal work is properly cited.
Konn et al. Geochemical Transactions 2012, 13:8 Page 2 of 19http://www.geochemicaltransactions.com/content/13/1/8
During hydrothermal circulation, seawater heats up andinteracts with rocks in the hot Earth’s crust and mantle.Hydrothermal systems are the places where this modi-fied seawater is expelled as hydrothermal fluids. Water-rock interactions generate gases (CH4, H2, H2S),whereas, major and minor elements such as Fe, Mn,Ca, Li, K, Na, Cl, Si are exchanged between rocks andwater. These chemical entities may dissolve in the fluidsor precipitate (metal oxide particle). Concentrations inthe aqueous phase vary depending on lithologies (rockassemblages), processes that occur during hydrothermalcirculation and physico-chemical conditions. For ex-ample, major variations in the salinity of the fluids arethought to be due to phase separation [15-18]. Al-though the inorganic geochemistry of hydrothermalfluids is quite well documented and understood, thestudy of their organic geochemistry is near its begin-ning. This is mainly due to sampling and extraction dif-ficulties. Indeed, hydrothermal fluids can be defined asan extremely complex and unusual matrix in which or-ganic compounds are dissolved. The number of samplesis limited and collected volumes are small because sam-pling of hydrothermal fluids is laborious. An extractionmethod capable of recovering a wide range of organiccompounds from small sample volumes of a complexmatrix is required and this is a real challenge.Various sample preparation techniques are available to
extract and concentrate analytes from liquids: solid phaseextraction (SPE) [19], solid phase microextraction (SPME)[20], membrane extraction with a sorbent interface(MESI) [21], liquid-liquid extraction (LLE) [22], supercrit-ical fluid extraction (SFE) [23], pressurized fluid extraction(PFE) [24] and microwave-assisted solvent extraction [25]to cite a few. The most used techniques for extraction ofanalytes in liquids are based on LLE or SPE. Over theyears, they have proven their efficiency in terms of quanti-fication and most standardised analytical methods usethem [19]. However, both techniques involve multipletime-consuming operations. In particular, SPE requires atedious filtration step to remove suspended particlespresent in the matrix. The numerous preparation stepsassociated with SPE extraction multiply sources and risksof contamination. For instance, SPE sorbents and espe-cially polymeric ones constitute major sources of contami-nants due to plastics bleeding [26]. Finally LLE uses largeamounts of solvents. All these drawbacks cause particularinterferences when dealing with small sample volumescontaining relatively low amounts (~ppb) of unknown or-ganic compounds dissolved in a complex matrix. There-fore these methods are not the most suitable for theanalysis of organic compounds in hydrothermal fluids.The analysis of volatile and semivolatile organic com-
pounds in aqueous solutions using Stir Bar Sorptive Ex-traction (SBSE) as the extraction step is gaining
acceptance in a wide variety of applications in the envir-onmental (e.g., water analyses), food and biomedicalfields [27]. The SBSE is a robust, efficient and conveni-ent technology. It requires minimal sample volumes, therecovery rate is higher than 90% for most nonpolar com-pounds and 100% of the organic matter sorbed on a stirbar is analysed. The few contaminants associated withSBSE are methylcyclosiloxanes and readily identifiable.The method allows gas chromatographic analysis of or-ganic compounds in aqueous matrices faster than withconventional techniques, omitting time-costly prepar-ation steps and solvents. In addition, the technique hasshown great potential to extract organic compoundseven from complex matrices (e.g., waste waters, bev-erages, biological fluids) and to achieve exceedingly lowdetection limits, under optimised conditions, by beingtimes more sensitive than direct SPME [28,29]. For ex-ample, Ochiai and Nakamura [30] measured sub-partper trillion (sub-ppt) levels of off-flavor compounds indrinking water. In seawater, polyaromatic hydrocarbons(PAHs) have been detected down to the sub-ppt levels[31] and Pérez-Carrera et al. [32] reported limits of de-tection (LOD) of the order of the ppt for PCBs. Leónet al. [33] obtained LOD in the range of 0.04 to 11 pptfor semivolatile organic compounds (2 < LogKo/w < 7.66,see explanation in the next paragraph) in salted tapwater. Nevertheless, SBSE, like any other analyticalmethod, has some limitations for extraction of certaincompounds and the attainment of such low LOD mayrequire further sample preparation, e.g., pH adjustment,back extraction or derivatisation [34].As mentioned in a review on SBSE theory and applica-
tions [27], SBSE is by nature an equilibrium techniquebased on the partitioning of solutes between a polymerphase (PolyDiMethylSiloxane (PDMS)) and the aqueousmatrix. This polymer is in a liquid-like state at roomtemperature, resulting in the retention of the analytes bydissolution into the bulk of the PDMS (this phenomenonis called sorption) rather than by adsorption on a surfacewhich is the retention process involved in other extrac-tion techniques. The partition equilibrium is correlatedwith the octanol-water partition coefficient (Ko/w) whichcan be defined by equation (1):
KO=W ≈ KPDMS=W ¼ CSBSE=CW
¼ mSBSE=mWð Þ � VW=VSBSEð Þ ð1Þ
where CSBSE and CW are the analyte concentration in theSBSE and the water phase, respectively, mSBSE and mW
are the mass of analyte in the SBSE and the water phase,respectively and VSBSE and VW are the volume of PDMSand water phase, respectively.The retention and the recovery rate of a molecule mainly
depend on Ko/w and on the sample to PDMS volumes ratio
Log(Ko/w)2.620.62 4.623.621.62
ß = 417
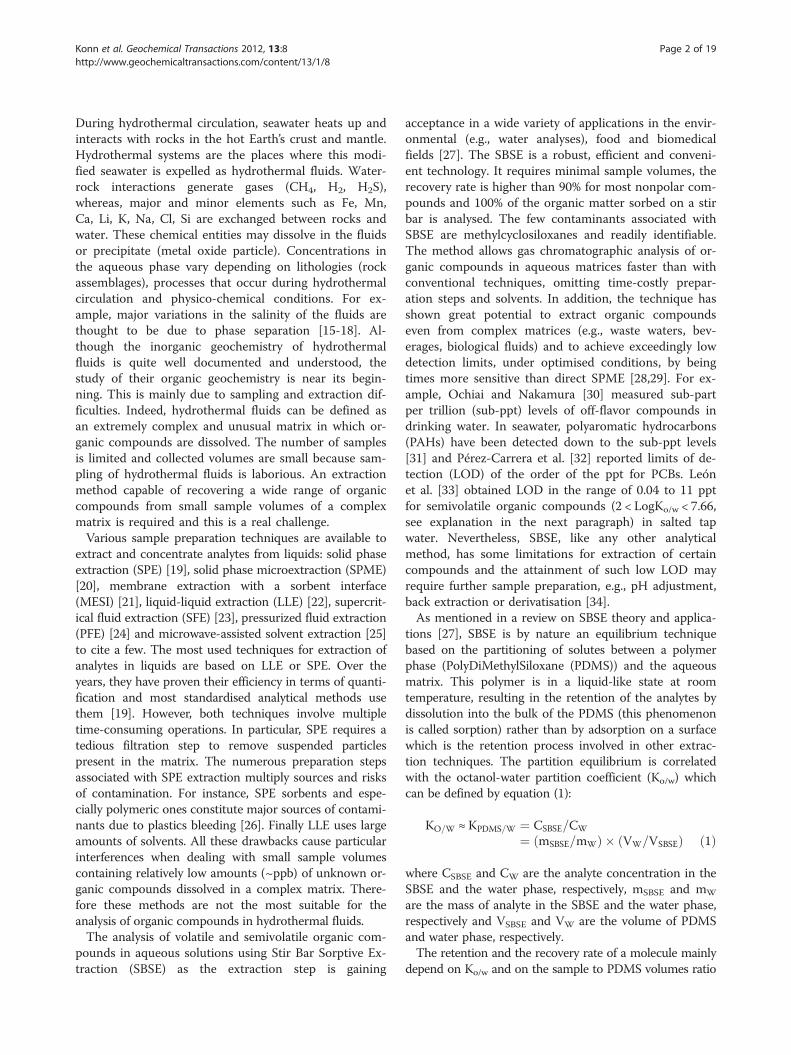
Figure 1 Modified after Baltussen et al. [28]. Recovery as a function of the octanol-water partitioning constant log(Ko/w).
Konn et al. Geochemical Transactions 2012, 13:8 Page 3 of 19http://www.geochemicaltransactions.com/content/13/1/8
(β), even though concentration of analytes, pH, polarity ofthe matrix and extraction time have some effect [27,35]. Toa lesser extent, analytical parameters such as desorptionflow, CIS initial temperature and CIS splitless time may alsoaffect the retention and recovery rate of a compound [36].Using β, equation (1) can be restated as:
KO=W=β ¼ mSBSE=mW ¼ mSBSE= m0 �mSBSEð Þ ð2Þwhere m0 is the total amount of analyte originally present inthe water sample. For a more detailed theoretical study, we
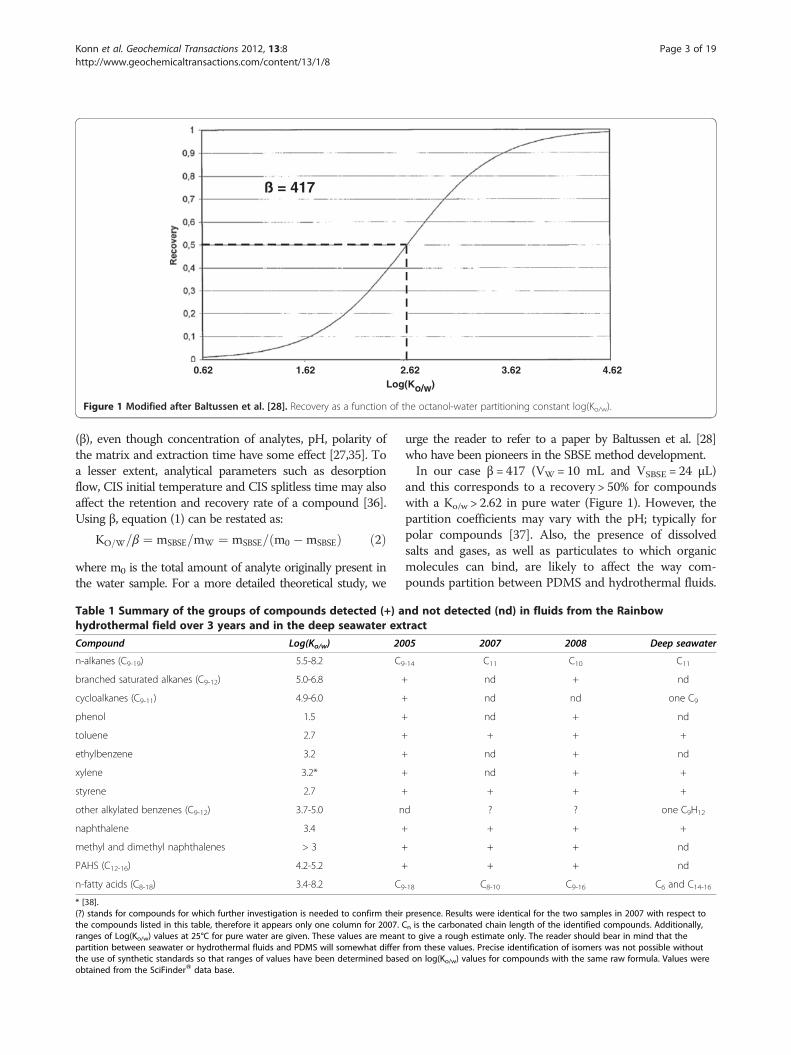
Table 1 Summary of the groups of compounds detected (+) ahydrothermal field over 3 years and in the deep seawater ex
Compound Log(Ko/w) 20
n-alkanes (C9-19) 5.5-8.2 C9
branched saturated alkanes (C9-12) 5.0-6.8 +
cycloalkanes (C9-11) 4.9-6.0 +
phenol 1.5 +
toluene 2.7 +
ethylbenzene 3.2 +
xylene 3.2* +
styrene 2.7 +
other alkylated benzenes (C9-12) 3.7-5.0 n
naphthalene 3.4 +
methyl and dimethyl naphthalenes > 3 +
PAHS (C12-16) 4.2-5.2 +
n-fatty acids (C8-18) 3.4-8.2 C9
* [38].(?) stands for compounds for which further investigation is needed to confirm theirthe compounds listed in this table, therefore it appears only one column for 2007.ranges of Log(Ko/w) values at 25°C for pure water are given. These values are meanpartition between seawater or hydrothermal fluids and PDMS will somewhat differthe use of synthetic standards so that ranges of values have been determined baseobtained from the SciFinderW data base.
urge the reader to refer to a paper by Baltussen et al. [28]who have been pioneers in the SBSE method development.In our case β = 417 (VW = 10 mL and VSBSE = 24 μL)
and this corresponds to a recovery > 50% for compoundswith a Ko/w > 2.62 in pure water (Figure 1). However, thepartition coefficients may vary with the pH; typically forpolar compounds [37]. Also, the presence of dissolvedsalts and gases, as well as particulates to which organicmolecules can bind, are likely to affect the way com-pounds partition between PDMS and hydrothermal fluids.
nd not detected (nd) in fluids from the Rainbowtract
05 2007 2008 Deep seawater
-14 C11 C10 C11
nd + nd
nd nd one C9
nd + nd
+ + +
nd + nd
nd + +
+ + +
d ? ? one C9H12
+ + +
+ + nd
+ + nd
-18 C8-10 C9-16 C6 and C14-16
presence. Results were identical for the two samples in 2007 with respect toCn is the carbonated chain length of the identified compounds. Additionally,t to give a rough estimate only. The reader should bear in mind that thefrom these values. Precise identification of isomers was not possible withoutd on log(Ko/w) values for compounds with the same raw formula. Values were
3520
2300
0235
2300
2250
N36 13.85
N36 13.80
N36 13.75
N36 13.70W33 54.3 W33 54.2 W33 54.1 W33 54.0
Rainbow field
Thermitière
AT10, T11
B
C
T88
T91-98T78
© Ifremer ©If
rem
er
© Ifremer © Ifremer© Ifremer
zone C
zone A & BThermitière
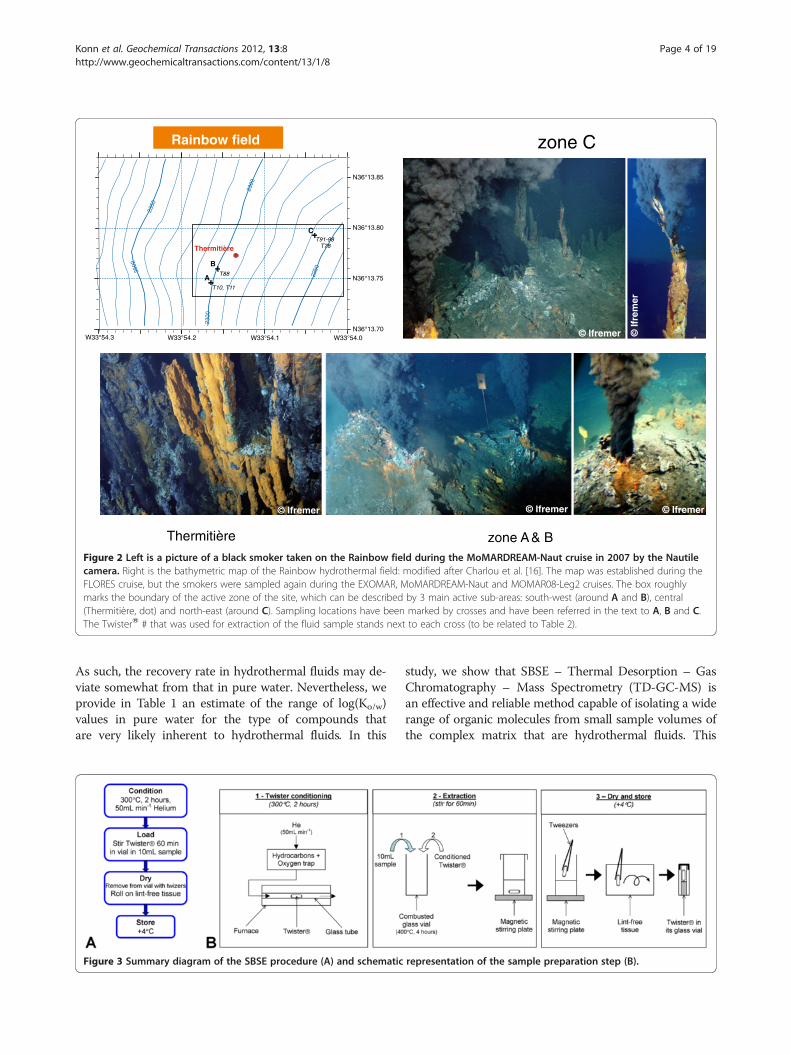
Figure 2 Left is a picture of a black smoker taken on the Rainbow field during the MoMARDREAM-Naut cruise in 2007 by the Nautilecamera. Right is the bathymetric map of the Rainbow hydrothermal field: modified after Charlou et al. [16]. The map was established during theFLORES cruise, but the smokers were sampled again during the EXOMAR, MoMARDREAM-Naut and MOMAR08-Leg2 cruises. The box roughlymarks the boundary of the active zone of the site, which can be described by 3 main active sub-areas: south-west (around A and B), central(Thermitière, dot) and north-east (around C). Sampling locations have been marked by crosses and have been referred in the text to A, B and C.The TwisterW # that was used for extraction of the fluid sample stands next to each cross (to be related to Table 2).
Konn et al. Geochemical Transactions 2012, 13:8 Page 4 of 19http://www.geochemicaltransactions.com/content/13/1/8
As such, the recovery rate in hydrothermal fluids may de-viate somewhat from that in pure water. Nevertheless, weprovide in Table 1 an estimate of the range of log(Ko/w)values in pure water for the type of compounds thatare very likely inherent to hydrothermal fluids. In this
Figure 3 Summary diagram of the SBSE procedure (A) and schematic
study, we show that SBSE – Thermal Desorption – GasChromatography – Mass Spectrometry (TD-GC-MS) isan effective and reliable method capable of isolating a widerange of organic molecules from small sample volumes ofthe complex matrix that are hydrothermal fluids. This
representation of the sample preparation step (B).
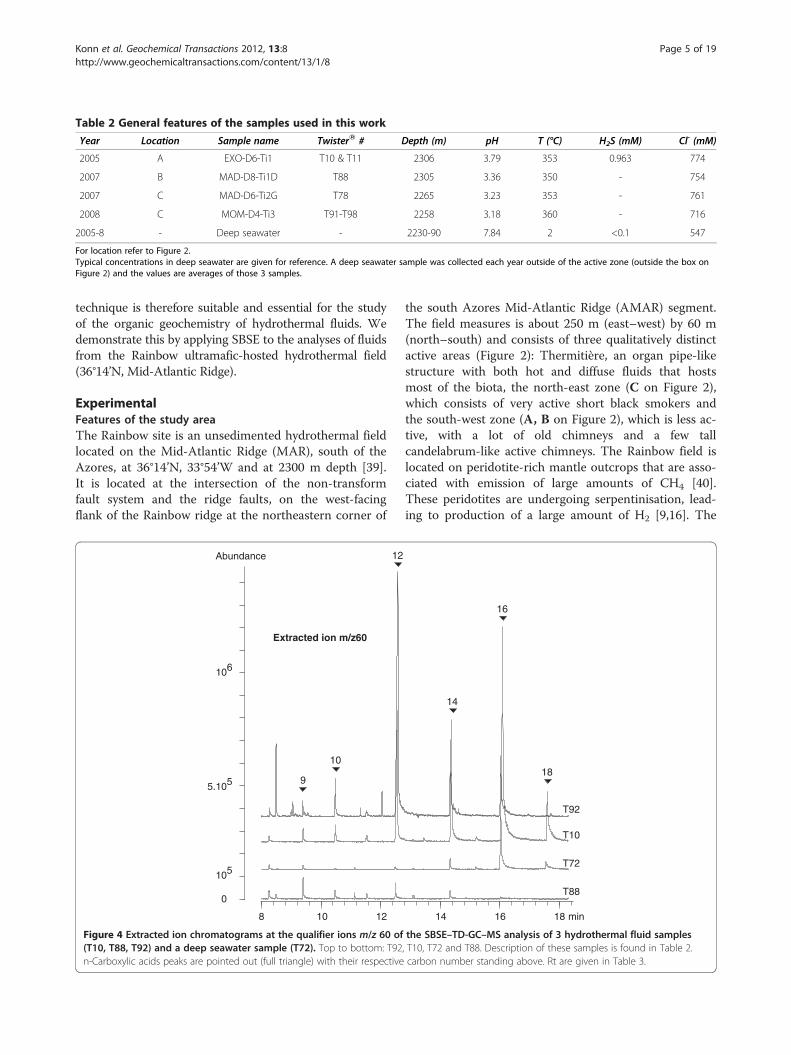
Table 2 General features of the samples used in this work
Year Location Sample name TwisterW # Depth (m) pH T (°C) H2S (mM) Cl- (mM)
2005 A EXO-D6-Ti1 T10 & T11 2306 3.79 353 0.963 774
2007 B MAD-D8-Ti1D T88 2305 3.36 350 - 754
2007 C MAD-D6-Ti2G T78 2265 3.23 353 - 761
2008 C MOM-D4-Ti3 T91-T98 2258 3.18 360 - 716
2005-8 - Deep seawater - 2230-90 7.84 2 <0.1 547
For location refer to Figure 2.Typical concentrations in deep seawater are given for reference. A deep seawater sample was collected each year outside of the active zone (outside the box onFigure 2) and the values are averages of those 3 samples.
Konn et al. Geochemical Transactions 2012, 13:8 Page 5 of 19http://www.geochemicaltransactions.com/content/13/1/8
technique is therefore suitable and essential for the studyof the organic geochemistry of hydrothermal fluids. Wedemonstrate this by applying SBSE to the analyses of fluidsfrom the Rainbow ultramafic-hosted hydrothermal field(36°14’N, Mid-Atlantic Ridge).
ExperimentalFeatures of the study areaThe Rainbow site is an unsedimented hydrothermal fieldlocated on the Mid-Atlantic Ridge (MAR), south of theAzores, at 36°14’N, 33°54’W and at 2300 m depth [39].It is located at the intersection of the non-transformfault system and the ridge faults, on the west-facingflank of the Rainbow ridge at the northeastern corner of
8 10 12
510
55.10
610
0
Abundance
10
12
9
Extracted ion m/z60
Figure 4 Extracted ion chromatograms at the qualifier ions m/z 60 of(T10, T88, T92) and a deep seawater sample (T72). Top to bottom: T92n-Carboxylic acids peaks are pointed out (full triangle) with their respective
the south Azores Mid-Atlantic Ridge (AMAR) segment.The field measures is about 250 m (east–west) by 60 m(north–south) and consists of three qualitatively distinctactive areas (Figure 2): Thermitière, an organ pipe-likestructure with both hot and diffuse fluids that hostsmost of the biota, the north-east zone (C on Figure 2),which consists of very active short black smokers andthe south-west zone (A, B on Figure 2), which is less ac-tive, with a lot of old chimneys and a few tallcandelabrum-like active chimneys. The Rainbow field islocated on peridotite-rich mantle outcrops that are asso-ciated with emission of large amounts of CH4 [40].These peridotites are undergoing serpentinisation, lead-ing to production of a large amount of H2 [9,16]. The
14 16 18 min
T92
T10
T72
T88
14
16
18
the SBSE–TD-GC–MS analysis of 3 hydrothermal fluid samples, T10, T72 and T88. Description of these samples is found in Table 2.carbon number standing above. Rt are given in Table 3.
Abundance
10
Konn et al. Geochemical Transactions 2012, 13:8 Page 6 of 19http://www.geochemicaltransactions.com/content/13/1/8
temperature of the fluids is around 360°C leading tophase separation in the subseafloor [39,41]. High chlori-nity (780 mmol kg-1), low pH (pH = 3–4), high concen-trations of metals (e.g. [Fe] = 24 mmol kg-1), alkalimetals and alkaline earth metals [41], low concentrationof dissolved SiO2, and high levels of dissolved hydrogen(16 mmol kg-1) and methane (2.5 mmol kg-1) [16,40]characterise the inorganic geochemistry of the Rainbowfluids. Finally there have been reports that hydrocarbonsand oxidized organic compounds are dissolved in theRainbow fluids [12,13].
4 5 6 7 8min
510
55.10
0
9
11Extracted ionm/z 57m/z 85
510
Abundance
52.10
53.10
12
1314
15
Sample collection and preparationAll glassware used was pre-combusted at 400°C for4 hours to remove any trace of organic matter. Thecommercial stir bars (TwistersW) used in this studyconsist of a magnetic rod in a tubular glass housingcoated with 24 μL PDMS (length = 10 mm, film thick-ness = 0.5 mm). They were purchased from GerstelGmbH & Co. KG (Mülheim an der Ruhr, Germany).TwistersW were conditioned prior to use by thermaldesorption at 300°C for 2 hours under a purified he-lium (He) flow (50 mL min-1) (Figure 3). For eachbatch of conditioned TwistersW one was kept as a dryblank reference.Hot fluids of the Rainbow ultramafic-hosted hydro-
thermal field and deep seawater were collected in titan-ium syringes using the same procedure. Sampling wasconducted by the ROV Victor 6000 during the EXO-MAR (2005) and MOMAR08-Leg2 (2008) [42] cruises
Table 3 Retention times (Rt stds) of C8:0-C20:0 carboxylicacids obtained by SBSE-TD-GC-MS analyses of a standardmixture (50 μg/L)Compounds Molecular formula Rt stds (min) Rt fluids (min)
octanoic acid C8H16O2 8.30 8.24†
nonanoic acid C9H18O2 9.47 9.43*
decanoic acid C10H20O2 10.61 10.52*
undecanoic acid C11H22O2 11.68 -
dodecanoic acid C12H24O2 12.67 12.58*
tridecanoic acid C13H26O2 13.59 -
tetradecanoic acid C14H28O2 14.44 14.41*
pentadecanoic acid C15H30O2 15.24 15.23†
hexadecanoic acid C16H32O2 16.02 16.12*
heptadecanoic acid C17H34O2 16.78 -
octadecanoic acid C18H36O2 17.65 17.61*
nonadecanoic acid C19H38O2 18.27 -
eicosanoic acid C20H40O2 - -
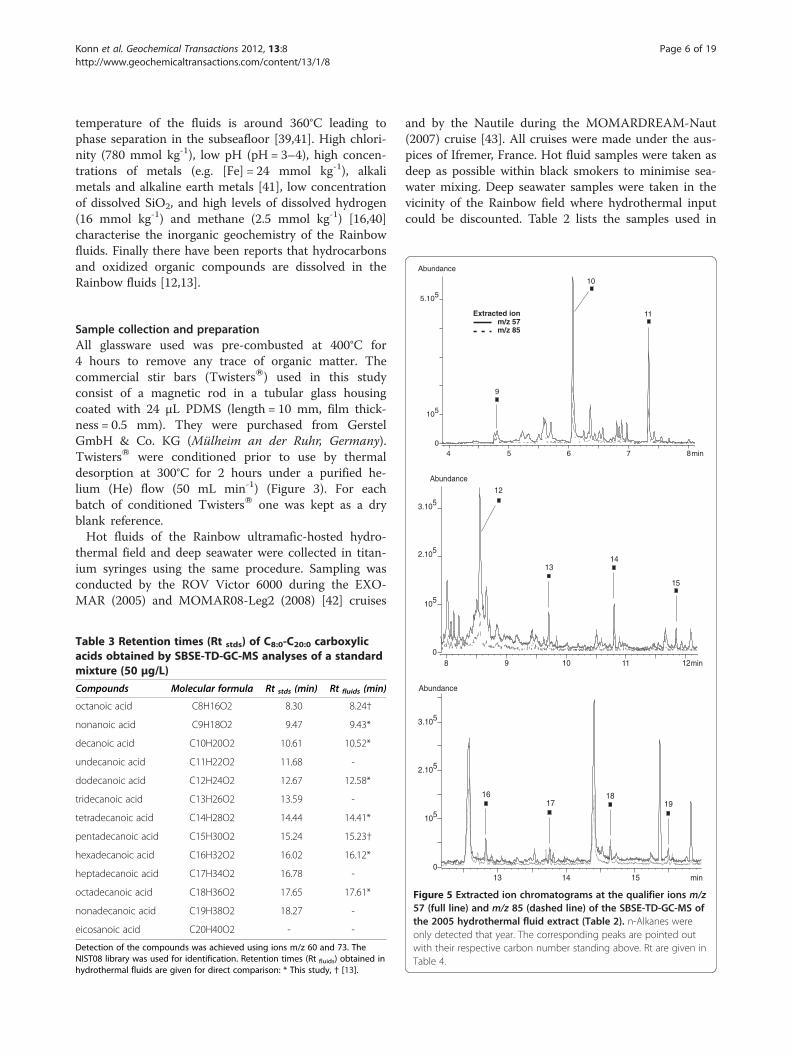
Detection of the compounds was achieved using ions m/z 60 and 73. TheNIST08 library was used for identification. Retention times (Rt fluids) obtained inhydrothermal fluids are given for direct comparison: * This study, † [13].
and by the Nautile during the MOMARDREAM-Naut(2007) cruise [43]. All cruises were made under the aus-pices of Ifremer, France. Hot fluid samples were taken asdeep as possible within black smokers to minimise sea-water mixing. Deep seawater samples were taken in thevicinity of the Rainbow field where hydrothermal inputcould be discounted. Table 2 lists the samples used in
13 14 15 min
510
53.10
0
Abundance
52.10
1617
1819
8 9 10 11 12min0
Figure 5 Extracted ion chromatograms at the qualifier ions m/z57 (full line) and m/z 85 (dashed line) of the SBSE-TD-GC-MS ofthe 2005 hydrothermal fluid extract (Table 2). n-Alkanes wereonly detected that year. The corresponding peaks are pointed outwith their respective carbon number standing above. Rt are given inTable 4.
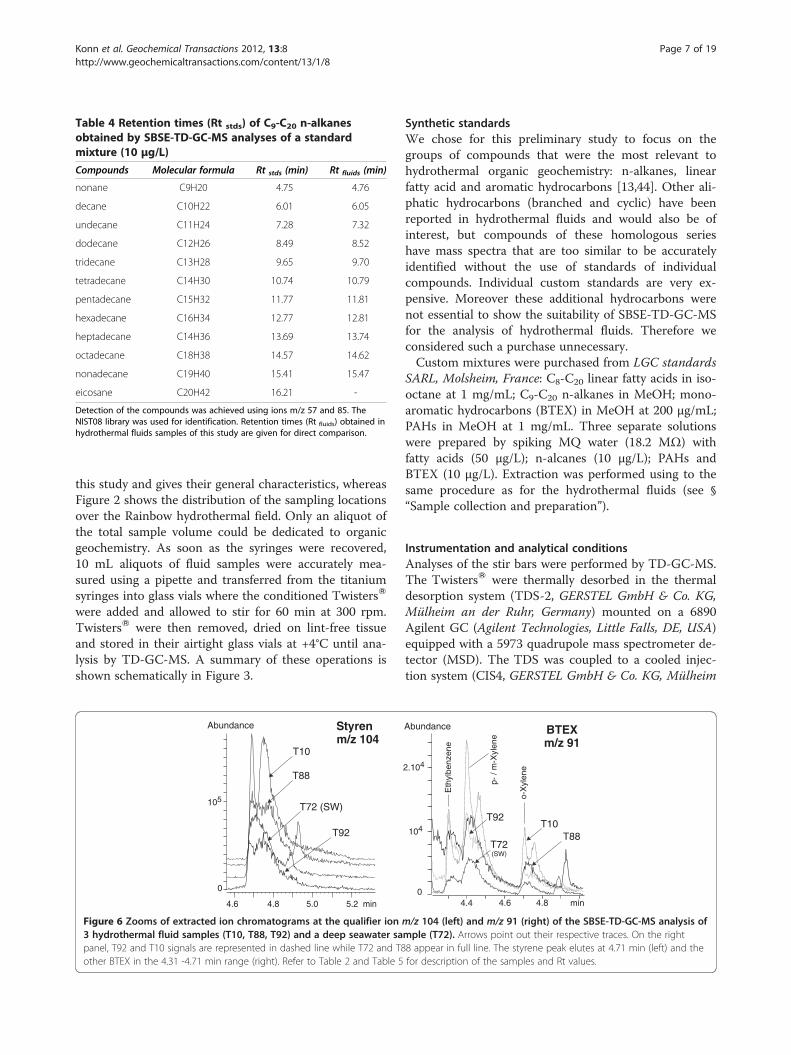
Table 4 Retention times (Rt stds) of C9-C20 n-alkanesobtained by SBSE-TD-GC-MS analyses of a standardmixture (10 μg/L)Compounds Molecular formula Rt stds (min) Rt fluids (min)
nonane C9H20 4.75 4.76
decane C10H22 6.01 6.05
undecane C11H24 7.28 7.32
dodecane C12H26 8.49 8.52
tridecane C13H28 9.65 9.70
tetradecane C14H30 10.74 10.79
pentadecane C15H32 11.77 11.81
hexadecane C16H34 12.77 12.81
heptadecane C14H36 13.69 13.74
octadecane C18H38 14.57 14.62
nonadecane C19H40 15.41 15.47
eicosane C20H42 16.21 -
Detection of the compounds was achieved using ions m/z 57 and 85. TheNIST08 library was used for identification. Retention times (Rt fluids) obtained inhydrothermal fluids samples of this study are given for direct comparison.
Konn et al. Geochemical Transactions 2012, 13:8 Page 7 of 19http://www.geochemicaltransactions.com/content/13/1/8
this study and gives their general characteristics, whereasFigure 2 shows the distribution of the sampling locationsover the Rainbow hydrothermal field. Only an aliquot ofthe total sample volume could be dedicated to organicgeochemistry. As soon as the syringes were recovered,10 mL aliquots of fluid samples were accurately mea-sured using a pipette and transferred from the titaniumsyringes into glass vials where the conditioned TwistersW
were added and allowed to stir for 60 min at 300 rpm.TwistersW were then removed, dried on lint-free tissueand stored in their airtight glass vials at +4°C until ana-lysis by TD-GC-MS. A summary of these operations isshown schematically in Figure 3.
4.6 5.2 min
Styrenm/z 104
4.8 5.0
T92
T10
T72 (SW)
T88
Abundance
0
510
Figure 6 Zooms of extracted ion chromatograms at the qualifier ion3 hydrothermal fluid samples (T10, T88, T92) and a deep seawater sapanel, T92 and T10 signals are represented in dashed line while T72 and T8other BTEX in the 4.31 -4.71 min range (right). Refer to Table 2 and Table 5
Synthetic standardsWe chose for this preliminary study to focus on thegroups of compounds that were the most relevant tohydrothermal organic geochemistry: n-alkanes, linearfatty acid and aromatic hydrocarbons [13,44]. Other ali-phatic hydrocarbons (branched and cyclic) have beenreported in hydrothermal fluids and would also be ofinterest, but compounds of these homologous serieshave mass spectra that are too similar to be accuratelyidentified without the use of standards of individualcompounds. Individual custom standards are very ex-pensive. Moreover these additional hydrocarbons werenot essential to show the suitability of SBSE-TD-GC-MSfor the analysis of hydrothermal fluids. Therefore weconsidered such a purchase unnecessary.Custom mixtures were purchased from LGC standards
SARL, Molsheim, France: C8-C20 linear fatty acids in iso-octane at 1 mg/mL; C9-C20 n-alkanes in MeOH; mono-aromatic hydrocarbons (BTEX) in MeOH at 200 μg/mL;PAHs in MeOH at 1 mg/mL. Three separate solutionswere prepared by spiking MQ water (18.2 MΩ) withfatty acids (50 μg/L); n-alcanes (10 μg/L); PAHs andBTEX (10 μg/L). Extraction was performed using to thesame procedure as for the hydrothermal fluids (see §“Sample collection and preparation”).
Instrumentation and analytical conditionsAnalyses of the stir bars were performed by TD-GC-MS.The TwistersW were thermally desorbed in the thermaldesorption system (TDS-2, GERSTEL GmbH & Co. KG,Mülheim an der Ruhr, Germany) mounted on a 6890Agilent GC (Agilent Technologies, Little Falls, DE, USA)equipped with a 5973 quadrupole mass spectrometer de-tector (MSD). The TDS was coupled to a cooled injec-tion system (CIS4, GERSTEL GmbH & Co. KG, Mülheim
Eth
ylbe
nzen
e
p-/ m
-Xyl
ene
o -X
ylen
e
BTEXm/z 91
4.4 min4.6 4.8
T10
T72(SW)
T92
T88
Abundance
0
410
42.10
m/z 104 (left) and m/z 91 (right) of the SBSE-TD-GC-MS analysis ofmple (T72). Arrows point out their respective traces. On the right8 appear in full line. The styrene peak elutes at 4.71 min (left) and thefor description of the samples and Rt values.
Toluene (T)m/z 91
3.0 min
T88
T10
T72 (SW)
T92
3.4 3.8 4.2 4.6
0
610
Abundance
65.10
3.0 min4.00
610
Abundance
62.10
Toluene (T)m/z 91
10 g/L6 replicates
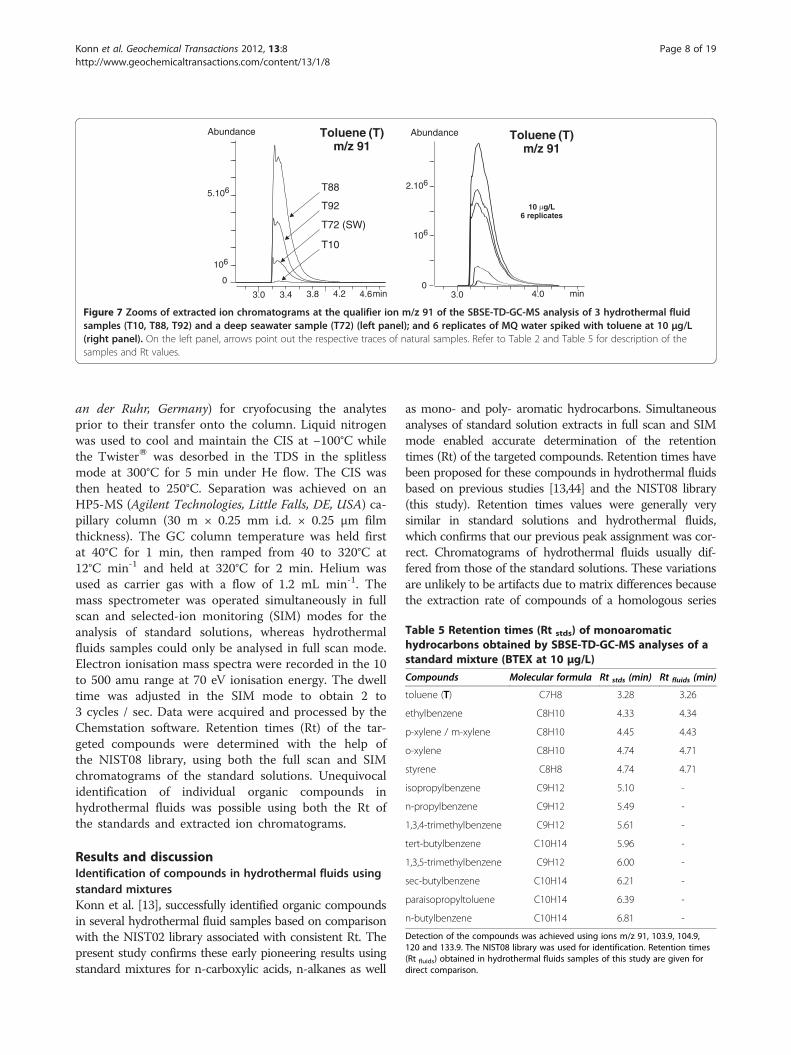
Figure 7 Zooms of extracted ion chromatograms at the qualifier ion m/z 91 of the SBSE-TD-GC-MS analysis of 3 hydrothermal fluidsamples (T10, T88, T92) and a deep seawater sample (T72) (left panel); and 6 replicates of MQ water spiked with toluene at 10 μg/L(right panel). On the left panel, arrows point out the respective traces of natural samples. Refer to Table 2 and Table 5 for description of thesamples and Rt values.
Table 5 Retention times (Rt stds) of monoaromatichydrocarbons obtained by SBSE-TD-GC-MS analyses of astandard mixture (BTEX at 10 μg/L)Compounds Molecular formula Rt stds (min) Rt fluids (min)
toluene (T) C7H8 3.28 3.26
ethylbenzene C8H10 4.33 4.34
p-xylene / m-xylene C8H10 4.45 4.43
o-xylene C8H10 4.74 4.71
styrene C8H8 4.74 4.71
isopropylbenzene C9H12 5.10 -
n-propylbenzene C9H12 5.49 -
1,3,4-trimethylbenzene C9H12 5.61 -
tert-butylbenzene C10H14 5.96 -
1,3,5-trimethylbenzene C9H12 6.00 -
sec-butylbenzene C10H14 6.21 -
paraisopropyltoluene C10H14 6.39 -
n-butylbenzene C10H14 6.81 -
Detection of the compounds was achieved using ions m/z 91, 103.9, 104.9,120 and 133.9. The NIST08 library was used for identification. Retention times(Rt fluids) obtained in hydrothermal fluids samples of this study are given fordirect comparison.
Konn et al. Geochemical Transactions 2012, 13:8 Page 8 of 19http://www.geochemicaltransactions.com/content/13/1/8
an der Ruhr, Germany) for cryofocusing the analytesprior to their transfer onto the column. Liquid nitrogenwas used to cool and maintain the CIS at −100°C whilethe TwisterW was desorbed in the TDS in the splitlessmode at 300°C for 5 min under He flow. The CIS wasthen heated to 250°C. Separation was achieved on anHP5-MS (Agilent Technologies, Little Falls, DE, USA) ca-pillary column (30 m × 0.25 mm i.d. × 0.25 μm filmthickness). The GC column temperature was held firstat 40°C for 1 min, then ramped from 40 to 320°C at12°C min-1 and held at 320°C for 2 min. Helium wasused as carrier gas with a flow of 1.2 mL min-1. Themass spectrometer was operated simultaneously in fullscan and selected-ion monitoring (SIM) modes for theanalysis of standard solutions, whereas hydrothermalfluids samples could only be analysed in full scan mode.Electron ionisation mass spectra were recorded in the 10to 500 amu range at 70 eV ionisation energy. The dwelltime was adjusted in the SIM mode to obtain 2 to3 cycles / sec. Data were acquired and processed by theChemstation software. Retention times (Rt) of the tar-geted compounds were determined with the help ofthe NIST08 library, using both the full scan and SIMchromatograms of the standard solutions. Unequivocalidentification of individual organic compounds inhydrothermal fluids was possible using both the Rt ofthe standards and extracted ion chromatograms.
Results and discussionIdentification of compounds in hydrothermal fluids usingstandard mixturesKonn et al. [13], successfully identified organic compoundsin several hydrothermal fluid samples based on comparisonwith the NIST02 library associated with consistent Rt. Thepresent study confirms these early pioneering results usingstandard mixtures for n-carboxylic acids, n-alkanes as well
as mono- and poly- aromatic hydrocarbons. Simultaneousanalyses of standard solution extracts in full scan and SIMmode enabled accurate determination of the retentiontimes (Rt) of the targeted compounds. Retention times havebeen proposed for these compounds in hydrothermal fluidsbased on previous studies [13,44] and the NIST08 library(this study). Retention times values were generally verysimilar in standard solutions and hydrothermal fluids,which confirms that our previous peak assignment was cor-rect. Chromatograms of hydrothermal fluids usually dif-fered from those of the standard solutions. These variationsare unlikely to be artifacts due to matrix differences becausethe extraction rate of compounds of a homologous series
Konn et al. Geochemical Transactions 2012, 13:8 Page 9 of 19http://www.geochemicaltransactions.com/content/13/1/8
should be affected in the same way. Our results suggestedthat the distribution patterns of each group of compoundsin hydrothermal fluids are specific. Such patterns are likelythe result of the particular geochemical processes control-ling the formation and dissolution of organic compounds inhydrothermal fluids.
n-Carboxylic acidsPeaks of underivatized fatty acid have a tendency to tailon a HP5-MS column due to the polarity of the com-pounds (Figure 4). Therefore peaks may be easily
extracted ions: m/z 154, m
PA
Ace
naph
t hen
e(A
)
Fl u
oren
e(F
)
Phe
nant
hren
e(P
)
Pyr
ene
(P)
8 9 10 11 12 13 14 min
Abundance
510
Flu
oran
then
e(F
l)
Ant
hrac
e ne
( An
)
15 16 17
52.10
53.10
54.10
0
T18
T88
8 9 10 11 12 13 14 min15 16 17
Abundance
410
45.10
510
0
X
Phe
nant
hren
e(P
)
Pyr
ene
(P)
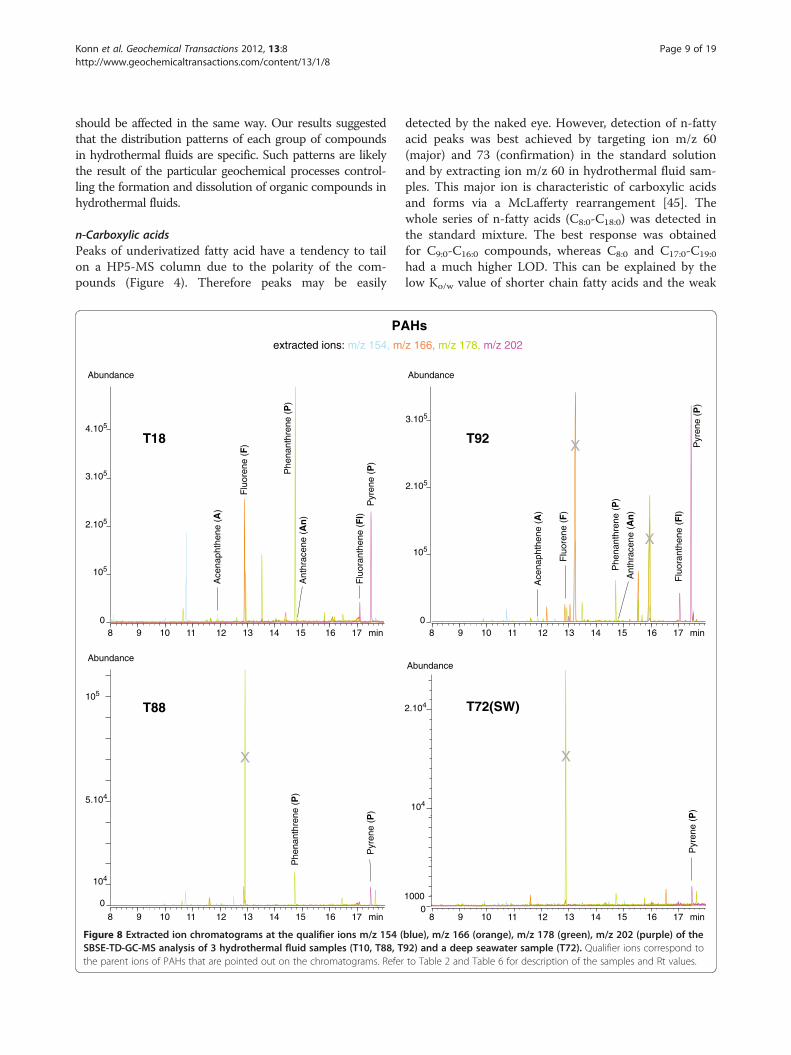
Figure 8 Extracted ion chromatograms at the qualifier ions m/z 154 (SBSE-TD-GC-MS analysis of 3 hydrothermal fluid samples (T10, T88, Tthe parent ions of PAHs that are pointed out on the chromatograms. Refer
detected by the naked eye. However, detection of n-fattyacid peaks was best achieved by targeting ion m/z 60(major) and 73 (confirmation) in the standard solutionand by extracting ion m/z 60 in hydrothermal fluid sam-ples. This major ion is characteristic of carboxylic acidsand forms via a McLafferty rearrangement [45]. Thewhole series of n-fatty acids (C8:0-C18:0) was detected inthe standard mixture. The best response was obtainedfor C9:0-C16:0 compounds, whereas C8:0 and C17:0-C19:0
had a much higher LOD. This can be explained by thelow Ko/w value of shorter chain fatty acids and the weak
/z 166, m/z 178, m/z 202
Hs
8 9 10 11 12 13 14
510
52.10
53.10
0
T92
Abundance
Ace
naph
then
e(A
)
Flu
oren
e(F
)
Phe
nant
hren
e(P
)
X
min15 16 17
Pyr
ene
(P)
Flu
o ran
then
e(F
l)
Ant
hrac
e ne
(An
)
X
8 9 10 11 12 13 14
1000
410
42.10
0
Abundance
T72(SW)
X
min15 16 17
Pyr
ene
( P)
blue), m/z 166 (orange), m/z 178 (green), m/z 202 (purple) of the92) and a deep seawater sample (T72). Qualifier ions correspond toto Table 2 and Table 6 for description of the samples and Rt values.
T92
T10
T72 (SW)
T88
8.4 8.6 min
Naphthalene(extracted ion
m/z 128)
8.50
510
Abundance
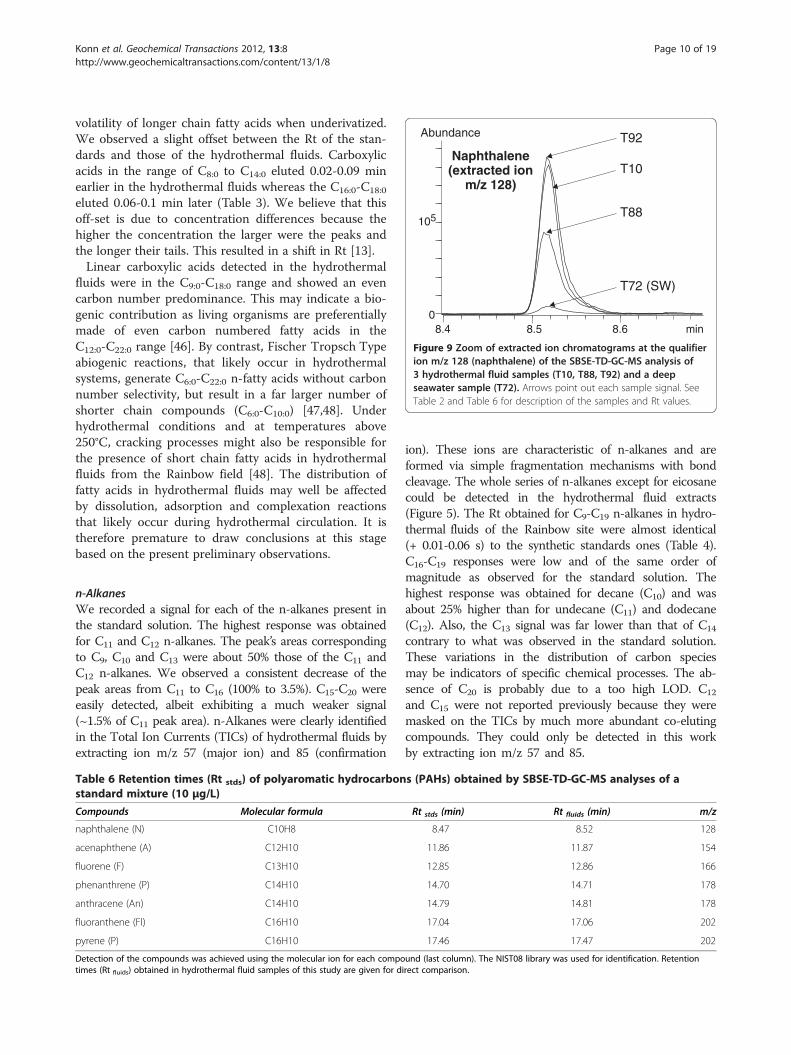
Figure 9 Zoom of extracted ion chromatograms at the qualifierion m/z 128 (naphthalene) of the SBSE-TD-GC-MS analysis of3 hydrothermal fluid samples (T10, T88, T92) and a deepseawater sample (T72). Arrows point out each sample signal. SeeTable 2 and Table 6 for description of the samples and Rt values.
Konn et al. Geochemical Transactions 2012, 13:8 Page 10 of 19http://www.geochemicaltransactions.com/content/13/1/8
volatility of longer chain fatty acids when underivatized.We observed a slight offset between the Rt of the stan-dards and those of the hydrothermal fluids. Carboxylicacids in the range of C8:0 to C14:0 eluted 0.02-0.09 minearlier in the hydrothermal fluids whereas the C16:0-C18:0
eluted 0.06-0.1 min later (Table 3). We believe that thisoff-set is due to concentration differences because thehigher the concentration the larger were the peaks andthe longer their tails. This resulted in a shift in Rt [13].Linear carboxylic acids detected in the hydrothermal
fluids were in the C9:0-C18:0 range and showed an evencarbon number predominance. This may indicate a bio-genic contribution as living organisms are preferentiallymade of even carbon numbered fatty acids in theC12:0-C22:0 range [46]. By contrast, Fischer Tropsch Typeabiogenic reactions, that likely occur in hydrothermalsystems, generate C6:0-C22:0 n-fatty acids without carbonnumber selectivity, but result in a far larger number ofshorter chain compounds (C6:0-C10:0) [47,48]. Underhydrothermal conditions and at temperatures above250°C, cracking processes might also be responsible forthe presence of short chain fatty acids in hydrothermalfluids from the Rainbow field [48]. The distribution offatty acids in hydrothermal fluids may well be affectedby dissolution, adsorption and complexation reactionsthat likely occur during hydrothermal circulation. It istherefore premature to draw conclusions at this stagebased on the present preliminary observations.
n-AlkanesWe recorded a signal for each of the n-alkanes present inthe standard solution. The highest response was obtainedfor C11 and C12 n-alkanes. The peak’s areas correspondingto C9, C10 and C13 were about 50% those of the C11 andC12 n-alkanes. We observed a consistent decrease of thepeak areas from C11 to C16 (100% to 3.5%). C15-C20 wereeasily detected, albeit exhibiting a much weaker signal(~1.5% of C11 peak area). n-Alkanes were clearly identifiedin the Total Ion Currents (TICs) of hydrothermal fluids byextracting ion m/z 57 (major ion) and 85 (confirmation
Table 6 Retention times (Rt stds) of polyaromatic hydrocarbonstandard mixture (10 μg/L)Compounds Molecular formula
naphthalene (N) C10H8
acenaphthene (A) C12H10
fluorene (F) C13H10
phenanthrene (P) C14H10
anthracene (An) C14H10
fluoranthene (Fl) C16H10
pyrene (P) C16H10
Detection of the compounds was achieved using the molecular ion for each compotimes (Rt fluids) obtained in hydrothermal fluid samples of this study are given for d
ion). These ions are characteristic of n-alkanes and areformed via simple fragmentation mechanisms with bondcleavage. The whole series of n-alkanes except for eicosanecould be detected in the hydrothermal fluid extracts(Figure 5). The Rt obtained for C9-C19 n-alkanes in hydro-thermal fluids of the Rainbow site were almost identical(+ 0.01-0.06 s) to the synthetic standards ones (Table 4).C16-C19 responses were low and of the same order ofmagnitude as observed for the standard solution. Thehighest response was obtained for decane (C10) and wasabout 25% higher than for undecane (C11) and dodecane(C12). Also, the C13 signal was far lower than that of C14
contrary to what was observed in the standard solution.These variations in the distribution of carbon speciesmay be indicators of specific chemical processes. The ab-sence of C20 is probably due to a too high LOD. C12
and C15 were not reported previously because they weremasked on the TICs by much more abundant co-elutingcompounds. They could only be detected in this workby extracting ion m/z 57 and 85.
s (PAHs) obtained by SBSE-TD-GC-MS analyses of a
Rt stds (min) Rt fluids (min) m/z
8.47 8.52 128
11.86 11.87 154
12.85 12.86 166
14.70 14.71 178
14.79 14.81 178
17.04 17.06 202
17.46 17.47 202
und (last column). The NIST08 library was used for identification. Retentionirect comparison.
Konn et al. Geochemical Transactions 2012, 13:8 Page 11 of 19http://www.geochemicaltransactions.com/content/13/1/8
Monoaromatic hydrocarbonsIn our standard solution, monoaromatic hydrocarbonswere much easier targeted in the SIM mode, using m/z91, 103.9, 104.9, 120 and 133.9, than in the full scan modebecause of co-elution. Co-elution occurred because of therelatively high initial temperature (40°C) of the GC oven,which could not be lowered. The tropylium ion (m/z 91)is characteristic of BTEX but does not enable identifica-tion. The use of other confirmation ions and the NIST08reference spectra were necessary for discrimination be-tween isomers. All monoaromatic hydrocarbons were suc-cessfully identified in the standard mixture. Only toluene,styrene, p-, m-, o-xylene and ethylbenzene were detectedin the hydrothermal fluids (Figure 6, Figure 7). The Rtobtained for the standard analysis and for hydrothermalfluids correlated very well (Table 5). The toluene responsewas highly variable in the hydrothermal fluids (Figure 7).This was also the case for the standard solutions and iscommonly observed in SBSE-TD-GC-MS because of thehigh volatility of toluene (J. Guyomarch, personal commu-nication). We do not exclude the occurrence of otherBTEX but probably at concentrations below current LOD.Therefore the Rt for all compounds of the standard solu-tion were reported in Table 5.
Polyaromatic hydrocarbons (PAHs)PAHs were clearly evident on both full scan and SIMchromatograms of the standard solution. The resolution
2 4 6 8 10
710
0
Abundance
6100
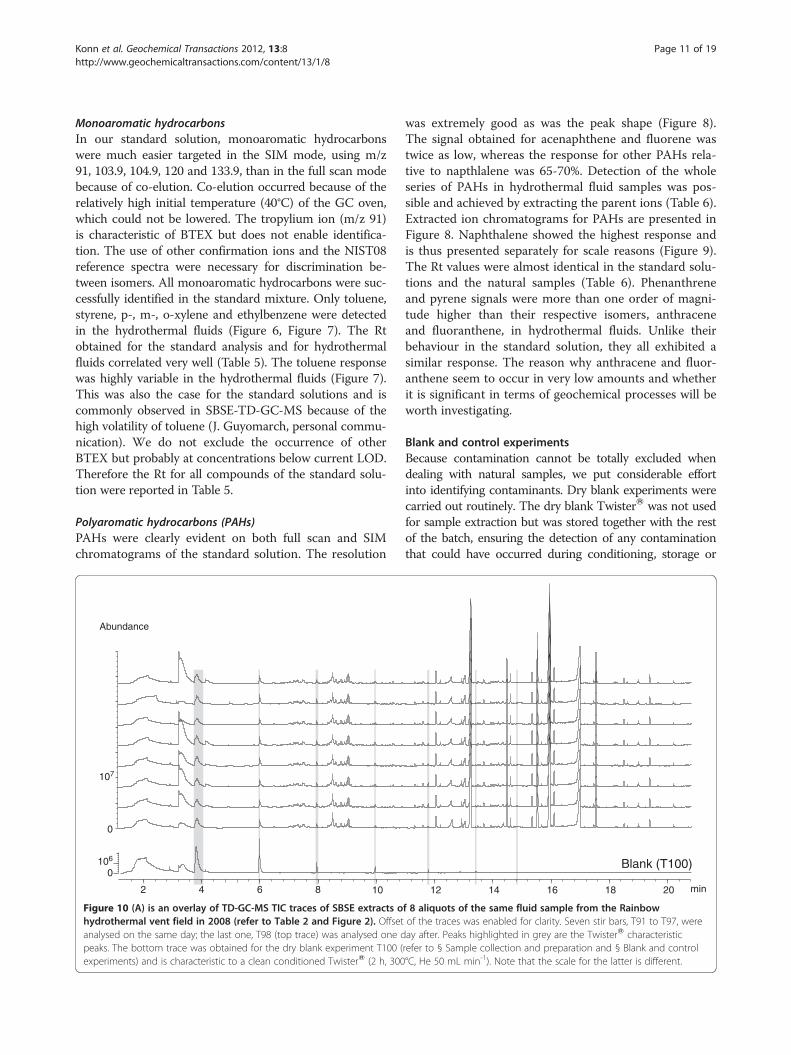
Figure 10 (A) is an overlay of TD-GC-MS TIC traces of SBSE extracts ohydrothermal vent field in 2008 (refer to Table 2 and Figure 2). Offsetanalysed on the same day; the last one, T98 (top trace) was analysed one dpeaks. The bottom trace was obtained for the dry blank experiment T100 (experiments) and is characteristic to a clean conditioned TwisterW (2 h, 300
was extremely good as was the peak shape (Figure 8).The signal obtained for acenaphthene and fluorene wastwice as low, whereas the response for other PAHs rela-tive to napthlalene was 65-70%. Detection of the wholeseries of PAHs in hydrothermal fluid samples was pos-sible and achieved by extracting the parent ions (Table 6).Extracted ion chromatograms for PAHs are presented inFigure 8. Naphthalene showed the highest response andis thus presented separately for scale reasons (Figure 9).The Rt values were almost identical in the standard solu-tions and the natural samples (Table 6). Phenanthreneand pyrene signals were more than one order of magni-tude higher than their respective isomers, anthraceneand fluoranthene, in hydrothermal fluids. Unlike theirbehaviour in the standard solution, they all exhibited asimilar response. The reason why anthracene and fluor-anthene seem to occur in very low amounts and whetherit is significant in terms of geochemical processes will beworth investigating.
Blank and control experimentsBecause contamination cannot be totally excluded whendealing with natural samples, we put considerable effortinto identifying contaminants. Dry blank experiments werecarried out routinely. The dry blank TwisterW was not usedfor sample extraction but was stored together with the restof the batch, ensuring the detection of any contaminationthat could have occurred during conditioning, storage or
12 14 16 18 20 min
Blank (T100)
f 8 aliquots of the same fluid sample from the Rainbowof the traces was enabled for clarity. Seven stir bars, T91 to T97, wereay after. Peaks highlighted in grey are the TwisterW characteristicrefer to § Sample collection and preparation and § Blank and control°C, He 50 mL min-1). Note that the scale for the latter is different.
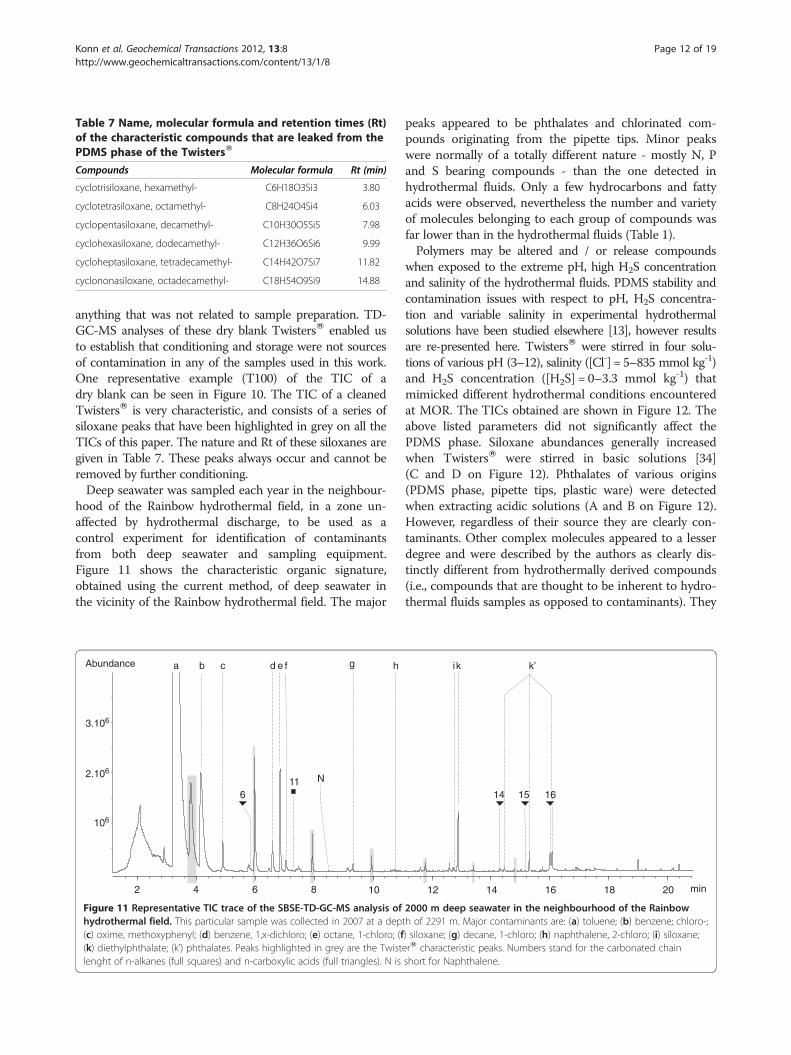
Table 7 Name, molecular formula and retention times (Rt)of the characteristic compounds that are leaked from thePDMS phase of the TwistersW
Compounds Molecular formula Rt (min)
cyclotrisiloxane, hexamethyl- C6H18O3Si3 3.80
cyclotetrasiloxane, octamethyl- C8H24O4Si4 6.03
cyclopentasiloxane, decamethyl- C10H30O5Si5 7.98
cyclohexasiloxane, dodecamethyl- C12H36O6Si6 9.99
cycloheptasiloxane, tetradecamethyl- C14H42O7Si7 11.82
cyclononasiloxane, octadecamethyl- C18H54O9Si9 14.88
Konn et al. Geochemical Transactions 2012, 13:8 Page 12 of 19http://www.geochemicaltransactions.com/content/13/1/8
anything that was not related to sample preparation. TD-GC-MS analyses of these dry blank TwistersW enabled usto establish that conditioning and storage were not sourcesof contamination in any of the samples used in this work.One representative example (T100) of the TIC of adry blank can be seen in Figure 10. The TIC of a cleanedTwistersW is very characteristic, and consists of a series ofsiloxane peaks that have been highlighted in grey on all theTICs of this paper. The nature and Rt of these siloxanes aregiven in Table 7. These peaks always occur and cannot beremoved by further conditioning.Deep seawater was sampled each year in the neighbour-
hood of the Rainbow hydrothermal field, in a zone un-affected by hydrothermal discharge, to be used as acontrol experiment for identification of contaminantsfrom both deep seawater and sampling equipment.Figure 11 shows the characteristic organic signature,obtained using the current method, of deep seawater inthe vicinity of the Rainbow hydrothermal field. The major
11
Abundance
610
62.10
63.10
2 4 6 8 10
N
b d ec g hfa
6
Figure 11 Representative TIC trace of the SBSE-TD-GC-MS analysis ofhydrothermal field. This particular sample was collected in 2007 at a dep(c) oxime, methoxyphenyl; (d) benzene, 1,x-dichloro; (e) octane, 1-chloro; (f(k) diethylphthalate; (k’) phthalates. Peaks highlighted in grey are the Twistlenght of n-alkanes (full squares) and n-carboxylic acids (full triangles). N is
peaks appeared to be phthalates and chlorinated com-pounds originating from the pipette tips. Minor peakswere normally of a totally different nature - mostly N, Pand S bearing compounds - than the one detected inhydrothermal fluids. Only a few hydrocarbons and fattyacids were observed, nevertheless the number and varietyof molecules belonging to each group of compounds wasfar lower than in the hydrothermal fluids (Table 1).Polymers may be altered and / or release compounds
when exposed to the extreme pH, high H2S concentrationand salinity of the hydrothermal fluids. PDMS stability andcontamination issues with respect to pH, H2S concentra-tion and variable salinity in experimental hydrothermalsolutions have been studied elsewhere [13], however resultsare re-presented here. TwistersW were stirred in four solu-tions of various pH (3–12), salinity ([Cl-] = 5–835 mmol kg-1)and H2S concentration ([H2S] = 0–3.3 mmol kg-1) thatmimicked different hydrothermal conditions encounteredat MOR. The TICs obtained are shown in Figure 12. Theabove listed parameters did not significantly affect thePDMS phase. Siloxane abundances generally increasedwhen TwistersW were stirred in basic solutions [34](C and D on Figure 12). Phthalates of various origins(PDMS phase, pipette tips, plastic ware) were detectedwhen extracting acidic solutions (A and B on Figure 12).However, regardless of their source they are clearly con-taminants. Other complex molecules appeared to a lesserdegree and were described by the authors as clearly dis-tinctly different from hydrothermally derived compounds(i.e., compounds that are thought to be inherent to hydro-thermal fluids samples as opposed to contaminants). They
14 15 16
12 14 16 18 20 min
ik k’
2000 m deep seawater in the neighbourhood of the Rainbowth of 2291 m. Major contaminants are: (a) toluene; (b) benzene; chloro-;) siloxane; (g) decane, 1-chloro; (h) naphthalene, 2-chloro; (i) siloxane;erW characteristic peaks. Numbers stand for the carbonated chainshort for Naphthalene.
2 4 6 8 10 12 14 16 18 20 min
synthetic hydrothermal fluids
phtalates
siloxanes
62.10
710
Abundance
ABC
D
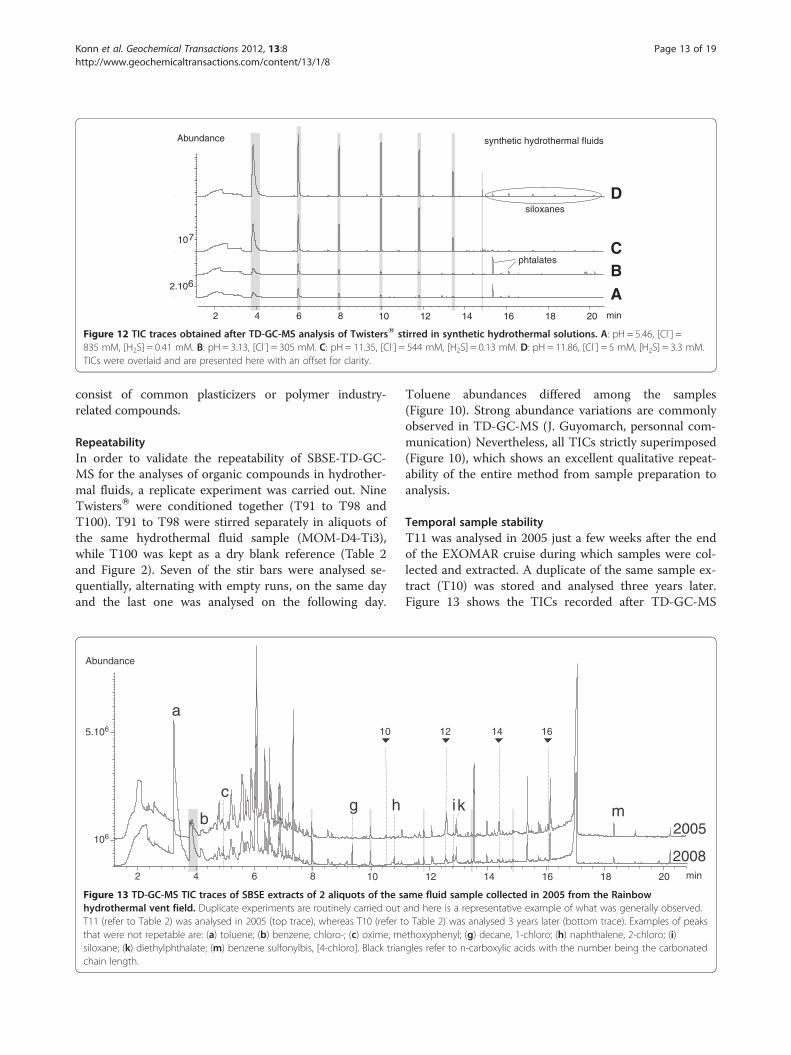
Figure 12 TIC traces obtained after TD-GC-MS analysis of TwistersW stirred in synthetic hydrothermal solutions. A: pH = 5.46, [Cl-] =835 mM, [H2S] = 0.41 mM. B: pH = 3.13, [Cl-] = 305 mM. C: pH = 11.35, [Cl-] = 544 mM, [H2S] = 0.13 mM. D: pH = 11.86, [Cl-] = 5 mM, [H2S] = 3.3 mM.TICs were overlaid and are presented here with an offset for clarity.
Konn et al. Geochemical Transactions 2012, 13:8 Page 13 of 19http://www.geochemicaltransactions.com/content/13/1/8
consist of common plasticizers or polymer industry-related compounds.
RepeatabilityIn order to validate the repeatability of SBSE-TD-GC-MS for the analyses of organic compounds in hydrother-mal fluids, a replicate experiment was carried out. NineTwistersW were conditioned together (T91 to T98 andT100). T91 to T98 were stirred separately in aliquots ofthe same hydrothermal fluid sample (MOM-D4-Ti3),while T100 was kept as a dry blank reference (Table 2and Figure 2). Seven of the stir bars were analysed se-quentially, alternating with empty runs, on the same dayand the last one was analysed on the following day.
2 4 6 8 10
106
5.106
b
cg h
10
Abundance
a
Figure 13 TD-GC-MS TIC traces of SBSE extracts of 2 aliquots of the shydrothermal vent field. Duplicate experiments are routinely carried outT11 (refer to Table 2) was analysed in 2005 (top trace), whereas T10 (refer tthat were not repetable are: (a) toluene; (b) benzene, chloro-; (c) oxime, msiloxane; (k) diethylphthalate; (m) benzene sulfonylbis, [4-chloro]. Black trianchain length.
Toluene abundances differed among the samples(Figure 10). Strong abundance variations are commonlyobserved in TD-GC-MS (J. Guyomarch, personnal com-munication) Nevertheless, all TICs strictly superimposed(Figure 10), which shows an excellent qualitative repeat-ability of the entire method from sample preparation toanalysis.
Temporal sample stabilityT11 was analysed in 2005 just a few weeks after the endof the EXOMAR cruise during which samples were col-lected and extracted. A duplicate of the same sample ex-tract (T10) was stored and analysed three years later.Figure 13 shows the TICs recorded after TD-GC-MS
12 14 16 18 20 min
mi
12 14 16
k2005
2008
ame fluid sample collected in 2005 from the Rainbowand here is a representative example of what was generally observed.o Table 2) was analysed 3 years later (bottom trace). Examples of peaksethoxyphenyl; (g) decane, 1-chloro; (h) naphthalene, 2-chloro; (i)gles refer to n-carboxylic acids with the number being the carbonated
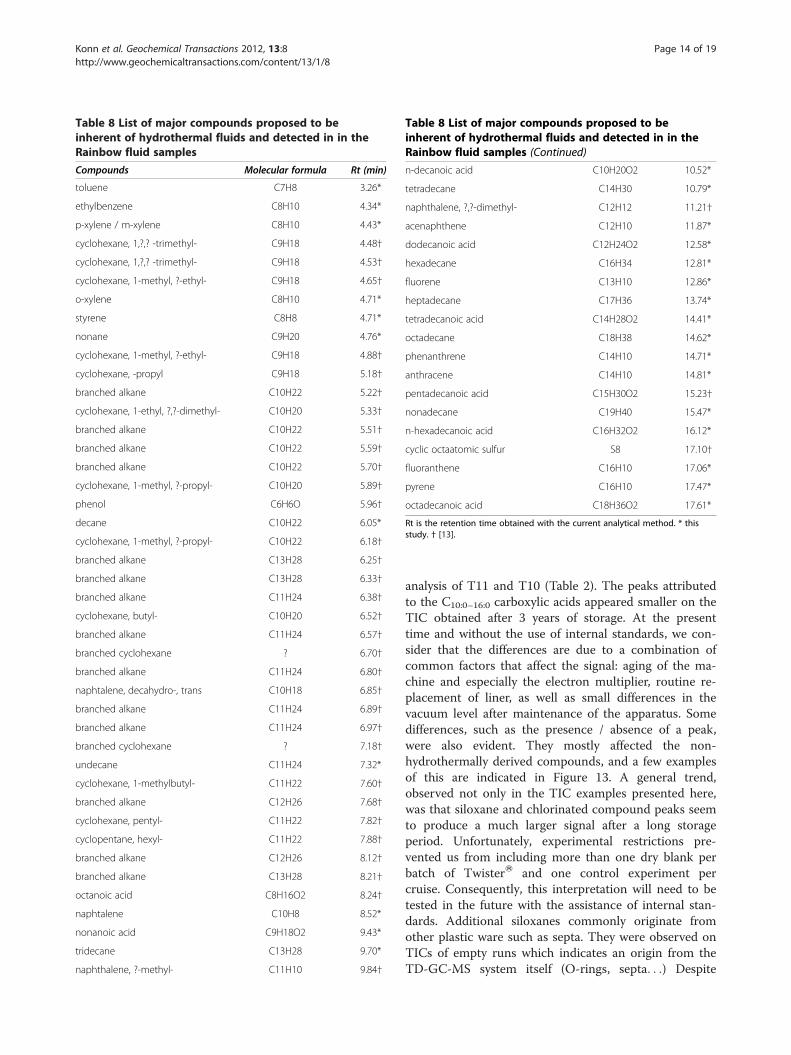
Table 8 List of major compounds proposed to beinherent of hydrothermal fluids and detected in in theRainbow fluid samples
Compounds Molecular formula Rt (min)
toluene C7H8 3.26*
ethylbenzene C8H10 4.34*
p-xylene / m-xylene C8H10 4.43*
cyclohexane, 1,?,? -trimethyl- C9H18 4.48†
cyclohexane, 1,?,? -trimethyl- C9H18 4.53†
cyclohexane, 1-methyl, ?-ethyl- C9H18 4.65†
o-xylene C8H10 4.71*
styrene C8H8 4.71*
nonane C9H20 4.76*
cyclohexane, 1-methyl, ?-ethyl- C9H18 4.88†
cyclohexane, -propyl C9H18 5.18†
branched alkane C10H22 5.22†
cyclohexane, 1-ethyl, ?,?-dimethyl- C10H20 5.33†
branched alkane C10H22 5.51†
branched alkane C10H22 5.59†
branched alkane C10H22 5.70†
cyclohexane, 1-methyl, ?-propyl- C10H20 5.89†
phenol C6H6O 5.96†
decane C10H22 6.05*
cyclohexane, 1-methyl, ?-propyl- C10H22 6.18†
branched alkane C13H28 6.25†
branched alkane C13H28 6.33†
branched alkane C11H24 6.38†
cyclohexane, butyl- C10H20 6.52†
branched alkane C11H24 6.57†
branched cyclohexane ? 6.70†
branched alkane C11H24 6.80†
naphtalene, decahydro-, trans C10H18 6.85†
branched alkane C11H24 6.89†
branched alkane C11H24 6.97†
branched cyclohexane ? 7.18†
undecane C11H24 7.32*
cyclohexane, 1-methylbutyl- C11H22 7.60†
branched alkane C12H26 7.68†
cyclohexane, pentyl- C11H22 7.82†
cyclopentane, hexyl- C11H22 7.88†
branched alkane C12H26 8.12†
branched alkane C13H28 8.21†
octanoic acid C8H16O2 8.24†
naphtalene C10H8 8.52*
nonanoic acid C9H18O2 9.43*
tridecane C13H28 9.70*
naphthalene, ?-methyl- C11H10 9.84†
Table 8 List of major compounds proposed to beinherent of hydrothermal fluids and detected in in theRainbow fluid samples (Continued)
n-decanoic acid C10H20O2 10.52*
tetradecane C14H30 10.79*
naphthalene, ?,?-dimethyl- C12H12 11.21†
acenaphthene C12H10 11.87*
dodecanoic acid C12H24O2 12.58*
hexadecane C16H34 12.81*
fluorene C13H10 12.86*
heptadecane C17H36 13.74*
tetradecanoic acid C14H28O2 14.41*
octadecane C18H38 14.62*
phenanthrene C14H10 14.71*
anthracene C14H10 14.81*
pentadecanoic acid C15H30O2 15.23†
nonadecane C19H40 15.47*
n-hexadecanoic acid C16H32O2 16.12*
cyclic octaatomic sulfur S8 17.10†
fluoranthene C16H10 17.06*
pyrene C16H10 17.47*
octadecanoic acid C18H36O2 17.61*
Rt is the retention time obtained with the current analytical method. * thisstudy. † [13].
Konn et al. Geochemical Transactions 2012, 13:8 Page 14 of 19http://www.geochemicaltransactions.com/content/13/1/8
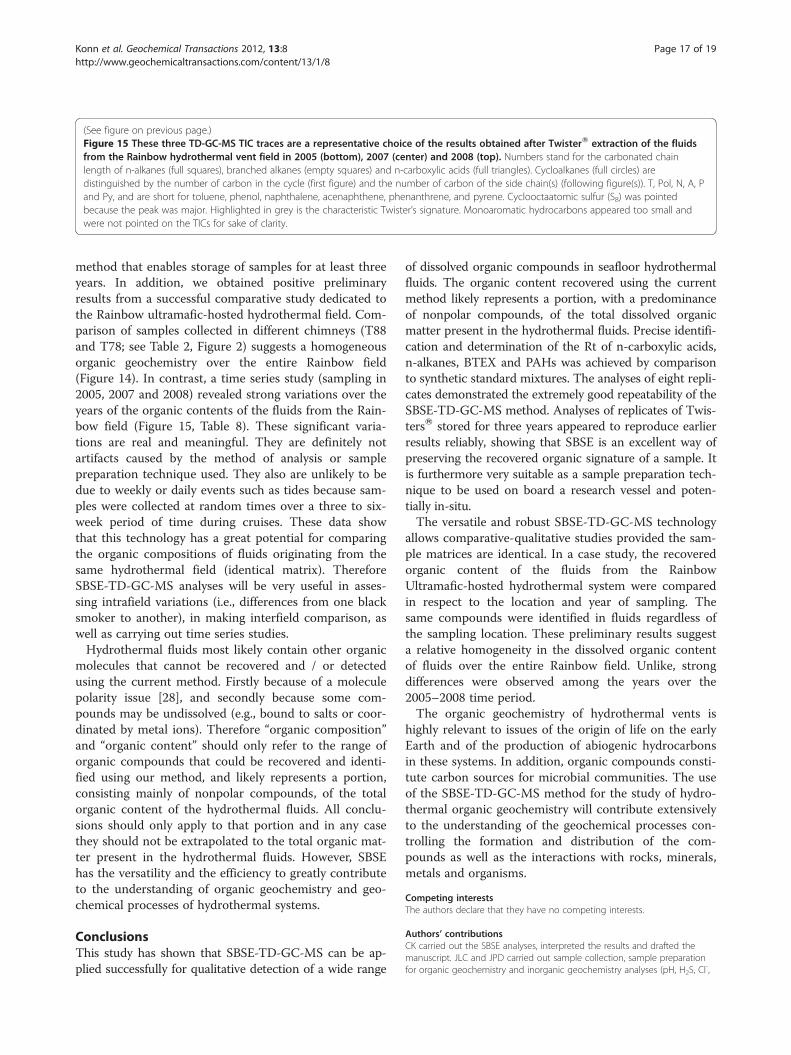
analysis of T11 and T10 (Table 2). The peaks attributedto the C10:0–16:0 carboxylic acids appeared smaller on theTIC obtained after 3 years of storage. At the presenttime and without the use of internal standards, we con-sider that the differences are due to a combination ofcommon factors that affect the signal: aging of the ma-chine and especially the electron multiplier, routine re-placement of liner, as well as small differences in thevacuum level after maintenance of the apparatus. Somedifferences, such as the presence / absence of a peak,were also evident. They mostly affected the non-hydrothermally derived compounds, and a few examplesof this are indicated in Figure 13. A general trend,observed not only in the TIC examples presented here,was that siloxane and chlorinated compound peaks seemto produce a much larger signal after a long storageperiod. Unfortunately, experimental restrictions pre-vented us from including more than one dry blank perbatch of TwisterW and one control experiment percruise. Consequently, this interpretation will need to betested in the future with the assistance of internal stan-dards. Additional siloxanes commonly originate fromother plastic ware such as septa. They were observed onTICs of empty runs which indicates an origin from theTD-GC-MS system itself (O-rings, septa. . .) Despite
Konn et al. Geochemical Transactions 2012, 13:8 Page 15 of 19http://www.geochemicaltransactions.com/content/13/1/8
those few striking differences, TICs superimposed welland a detailed identification of each peak revealed thepresence of the same hydrothermally derived organiccompounds, i.e., n-alkanes, branched alkanes, cycloalk-anes, aromatic hydrocarbons, PAHs and n-carboxylicacids in both samples [13]. Even though some variationsin abundance may occur, no total loss of a compound orstrong variations in terms of hydrothermally derivedcompounds were observed. All this infers that the recov-ered organic composition, using the current approach, isqualitatively preserved over a three-year storage period.
Implication for the study of hydrothermal organicgeochemistryA wide variety of organic compounds have been recov-ered and analysed by SBSE-TD-GC-MS in numeroushydrothermal fluid samples. n-Alkanes, cycloalkanes,branched alkanes, BTEX and PAHs, as well as n-carboxylic acids have been identified and reported byKonn et al. [13] (Table 8). These occurrences are sup-ported by field [4-8,14], experimental ([49] and refer-ences therein) and theoretical observations [50]. Littleis known of the overall geophysical and geochemicalprocesses that control, on the one hand, the formationof organic compounds in hydrothermal systems andon the other hand, their distribution and dissolution inthe fluid. First of all, mantle CO2 and living organismsare potential primary carbon sources to build up mole-cules. Secondly, several processes either abiogenic(catalytic reactions such as Fischer-Tropsch synthesis)[11,12,16], thermogenic [44] or biogenic (e.g. methano-gens archaea) may be involved in the organic synthesis
2 4 6 8 10
106
5.106
a
b
c ef
Abundance
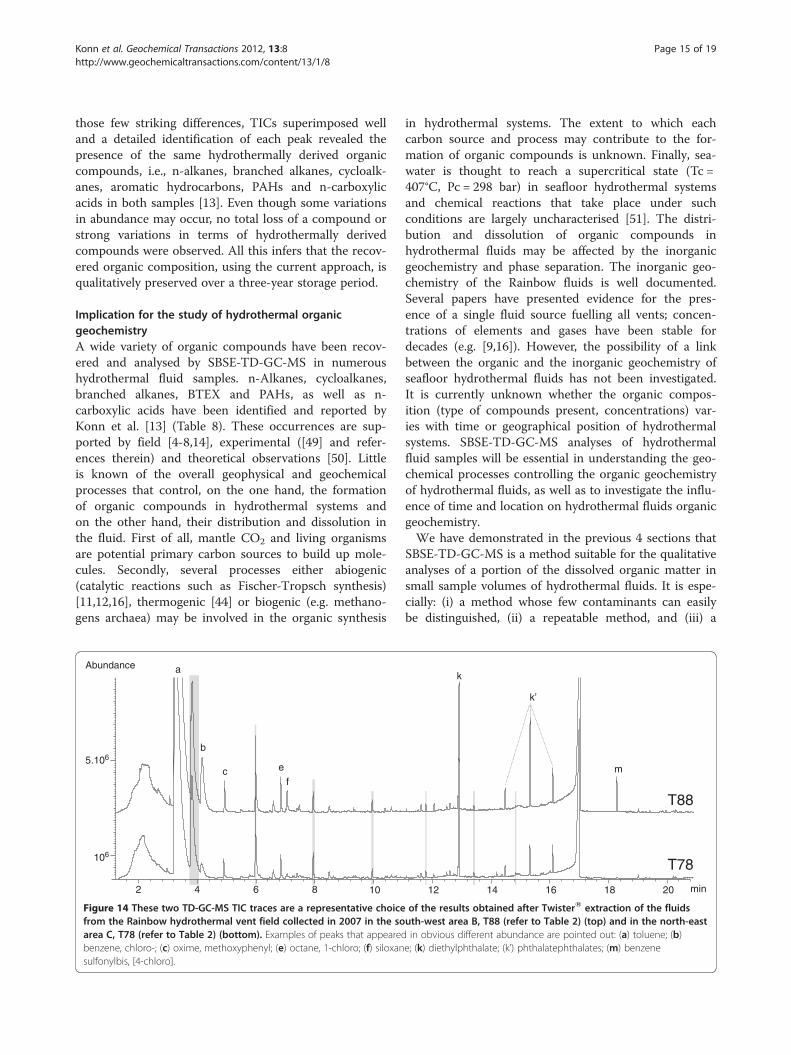
Figure 14 These two TD-GC-MS TIC traces are a representative choicefrom the Rainbow hydrothermal vent field collected in 2007 in the soarea C, T78 (refer to Table 2) (bottom). Examples of peaks that appearedbenzene, chloro-; (c) oxime, methoxyphenyl; (e) octane, 1-chloro; (f) siloxansulfonylbis, [4-chloro].
in hydrothermal systems. The extent to which eachcarbon source and process may contribute to the for-mation of organic compounds is unknown. Finally, sea-water is thought to reach a supercritical state (Tc =407°C, Pc = 298 bar) in seafloor hydrothermal systemsand chemical reactions that take place under suchconditions are largely uncharacterised [51]. The distri-bution and dissolution of organic compounds inhydrothermal fluids may be affected by the inorganicgeochemistry and phase separation. The inorganic geo-chemistry of the Rainbow fluids is well documented.Several papers have presented evidence for the pres-ence of a single fluid source fuelling all vents; concen-trations of elements and gases have been stable fordecades (e.g. [9,16]). However, the possibility of a linkbetween the organic and the inorganic geochemistry ofseafloor hydrothermal fluids has not been investigated.It is currently unknown whether the organic compos-ition (type of compounds present, concentrations) var-ies with time or geographical position of hydrothermalsystems. SBSE-TD-GC-MS analyses of hydrothermalfluid samples will be essential in understanding the geo-chemical processes controlling the organic geochemistryof hydrothermal fluids, as well as to investigate the influ-ence of time and location on hydrothermal fluids organicgeochemistry.We have demonstrated in the previous 4 sections that
SBSE-TD-GC-MS is a method suitable for the qualitativeanalyses of a portion of the dissolved organic matter insmall sample volumes of hydrothermal fluids. It is espe-cially: (i) a method whose few contaminants can easilybe distinguished, (ii) a repeatable method, and (iii) a
12 14 16 18 20 min
k’
m
k
T88
T78
of the results obtained after TwisterW extraction of the fluidsuth-west area B, T88 (refer to Table 2) (top) and in the north-eastin obvious different abundance are pointed out: (a) toluene; (b)
e; (k) diethylphthalate; (k’) phthalatephthalates; (m) benzene
2007Abundance
2 4 6 8 10 12 14 16 18 20 min
610
62.10
63.10
64.10
10
T N
9 108
Py
P
S8
2008
Abundance
2 4 6 8 10 12 14 16 18 20 min
610
62.10
63.10
64.10
S8
T NPol
Py
PFA
10 12 14 169
10
16:
:3
CH
12
24
10 13 12
2005
9
10
01
61:
1:1
:
16:
:23
6:
1111
6:1:
3 6:1:
2
10 11
12
11
46:
16:
:1:1
5:6
6:5
10
T
13
N
9 10 12 14 15 16 18
610
62.10
63.10
Abundance
2 4 6 8 10 12 14 16 18 20 min
14
Pol
Py
PF
S8
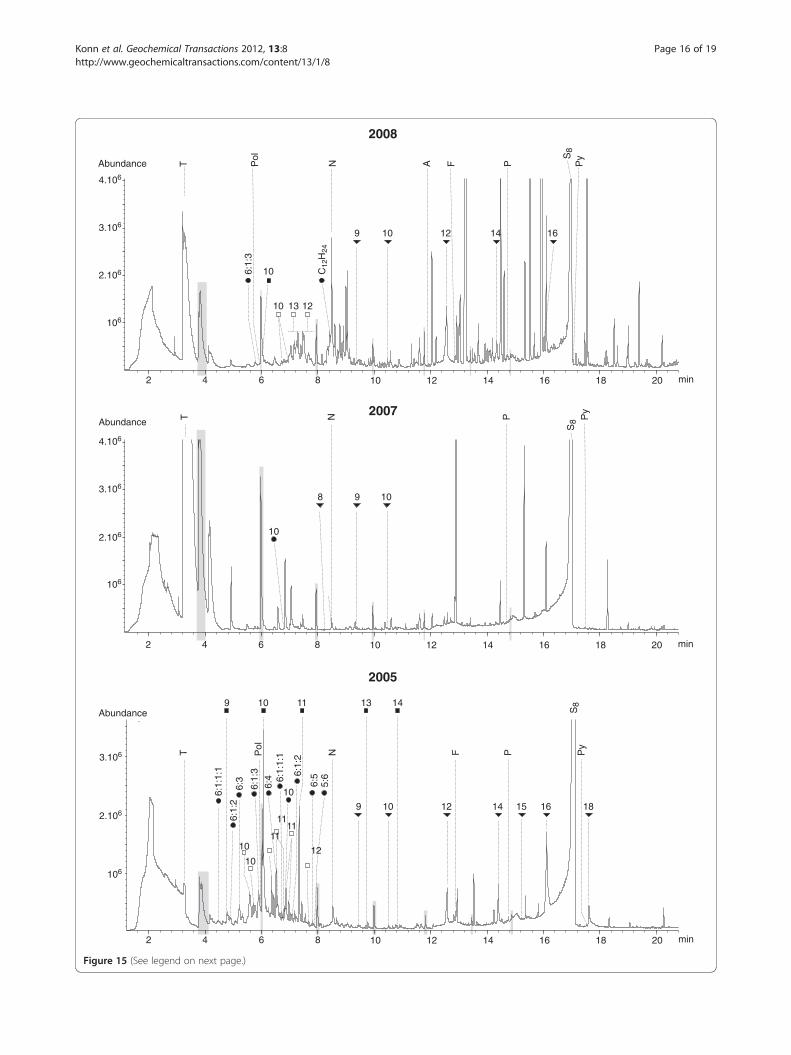
Figure 15 (See legend on next page.)
Konn et al. Geochemical Transactions 2012, 13:8 Page 16 of 19http://www.geochemicaltransactions.com/content/13/1/8
(See figure on previous page.)Figure 15 These three TD-GC-MS TIC traces are a representative choice of the results obtained after TwisterW extraction of the fluidsfrom the Rainbow hydrothermal vent field in 2005 (bottom), 2007 (center) and 2008 (top). Numbers stand for the carbonated chainlength of n-alkanes (full squares), branched alkanes (empty squares) and n-carboxylic acids (full triangles). Cycloalkanes (full circles) aredistinguished by the number of carbon in the cycle (first figure) and the number of carbon of the side chain(s) (following figure(s)). T, Pol, N, A, Pand Py, and are short for toluene, phenol, naphthalene, acenaphthene, phenanthrene, and pyrene. Cyclooctaatomic sulfur (S8) was pointedbecause the peak was major. Highlighted in grey is the characteristic Twister’s signature. Monoaromatic hydrocarbons appeared too small andwere not pointed on the TICs for sake of clarity.
Konn et al. Geochemical Transactions 2012, 13:8 Page 17 of 19http://www.geochemicaltransactions.com/content/13/1/8
method that enables storage of samples for at least threeyears. In addition, we obtained positive preliminaryresults from a successful comparative study dedicated tothe Rainbow ultramafic-hosted hydrothermal field. Com-parison of samples collected in different chimneys (T88and T78; see Table 2, Figure 2) suggests a homogeneousorganic geochemistry over the entire Rainbow field(Figure 14). In contrast, a time series study (sampling in2005, 2007 and 2008) revealed strong variations over theyears of the organic contents of the fluids from the Rain-bow field (Figure 15, Table 8). These significant varia-tions are real and meaningful. They are definitely notartifacts caused by the method of analysis or samplepreparation technique used. They also are unlikely to bedue to weekly or daily events such as tides because sam-ples were collected at random times over a three to six-week period of time during cruises. These data showthat this technology has a great potential for comparingthe organic compositions of fluids originating from thesame hydrothermal field (identical matrix). ThereforeSBSE-TD-GC-MS analyses will be very useful in asses-sing intrafield variations (i.e., differences from one blacksmoker to another), in making interfield comparison, aswell as carrying out time series studies.Hydrothermal fluids most likely contain other organic
molecules that cannot be recovered and / or detectedusing the current method. Firstly because of a moleculepolarity issue [28], and secondly because some com-pounds may be undissolved (e.g., bound to salts or coor-dinated by metal ions). Therefore “organic composition”and “organic content” should only refer to the range oforganic compounds that could be recovered and identi-fied using our method, and likely represents a portion,consisting mainly of nonpolar compounds, of the totalorganic content of the hydrothermal fluids. All conclu-sions should only apply to that portion and in any casethey should not be extrapolated to the total organic mat-ter present in the hydrothermal fluids. However, SBSEhas the versatility and the efficiency to greatly contributeto the understanding of organic geochemistry and geo-chemical processes of hydrothermal systems.
ConclusionsThis study has shown that SBSE-TD-GC-MS can be ap-plied successfully for qualitative detection of a wide range
of dissolved organic compounds in seafloor hydrothermalfluids. The organic content recovered using the currentmethod likely represents a portion, with a predominanceof nonpolar compounds, of the total dissolved organicmatter present in the hydrothermal fluids. Precise identifi-cation and determination of the Rt of n-carboxylic acids,n-alkanes, BTEX and PAHs was achieved by comparisonto synthetic standard mixtures. The analyses of eight repli-cates demonstrated the extremely good repeatability of theSBSE-TD-GC-MS method. Analyses of replicates of Twis-tersW stored for three years appeared to reproduce earlierresults reliably, showing that SBSE is an excellent way ofpreserving the recovered organic signature of a sample. Itis furthermore very suitable as a sample preparation tech-nique to be used on board a research vessel and poten-tially in-situ.The versatile and robust SBSE-TD-GC-MS technology
allows comparative-qualitative studies provided the sam-ple matrices are identical. In a case study, the recoveredorganic content of the fluids from the RainbowUltramafic-hosted hydrothermal system were comparedin respect to the location and year of sampling. Thesame compounds were identified in fluids regardless ofthe sampling location. These preliminary results suggesta relative homogeneity in the dissolved organic contentof fluids over the entire Rainbow field. Unlike, strongdifferences were observed among the years over the2005–2008 time period.The organic geochemistry of hydrothermal vents is
highly relevant to issues of the origin of life on the earlyEarth and of the production of abiogenic hydrocarbonsin these systems. In addition, organic compounds consti-tute carbon sources for microbial communities. The useof the SBSE-TD-GC-MS method for the study of hydro-thermal organic geochemistry will contribute extensivelyto the understanding of the geochemical processes con-trolling the formation and distribution of the com-pounds as well as the interactions with rocks, minerals,metals and organisms.
Competing interestsThe authors declare that they have no competing interests.
Authors’ contributionsCK carried out the SBSE analyses, interpreted the results and drafted themanuscript. JLC and JPD carried out sample collection, sample preparationfor organic geochemistry and inorganic geochemistry analyses (pH, H2S, Cl
-,
Konn et al. Geochemical Transactions 2012, 13:8 Page 18 of 19http://www.geochemicaltransactions.com/content/13/1/8
etc.. . .). NGH participated in the design of the study and helped to draft themanuscript. All authors read and approved the final manuscript.
AcknowledgementsWe thank Anne Godfroy, Françoise Gaill and Jerôme Dyment chief scientistsof the EXOMAR (2005), MOMARDREAM-Naut (2007) and MOMAR08-Leg2(2008) cruises, respectively, who allowed us to participate to their cruise andto collect and use hydrothermal fluid samples for this study. We are also verythankful to IFREMER, the ROV Victor 6000 team, the Nautile team, the R/VPourquoi pas? crew and the R/V l’Atalante crew for organisation andprecious help. We are very grateful to Julien Guyomarch and all anonymzousreviewers for their constructive comments. This work has been carried outpartly within the MoMARnet (Monitoring deep seafloor hydrothermalenvironments on the Mid-Atlantic Ridge: A Marie Curie Research Trainingnetwork) framework, that provided the research funding.
Received: 27 October 2011 Accepted: 2 August 2012Published: 7 November 2012
References1. Engel MH, Macko SA: Organic Geochemistry: Principles and Applications. New
York: Plenum Press; 1993.2. Macleod G, McKeown C, Hall AJ, Russell MJ: Hydrothermal and oceanic pH
conditions of possible relevance to the origin of life. Origins Life Evol. B.1994, 24(1):19–41.
3. Russell MJ, Hall AJ, Boyce AJ, Fallick AE: 100th Anniversary Special Paper:On Hydrothermal Convection Systems and the Emergence of Life. EconGeol 2005, 100(3):419–438.
4. Simoneit BRT, Lein AY, Peresypkin VI, Osipov GA: Composition and originof hydrothermal petroleum and associated lipids in the sulfide depositsof the Rainbow field (Mid-Atlantic Ridge at 36°N). Geochim. Cosmochim.Acta 2004, 68(10):2275.
5. Delacour A, Früh-Green GL, Bernasconi SM, Schaeffer P, Kelley DS: Carbongeochemistry of serpentinites in the Lost City Hydrothermal System(30°N, MAR). Geochim Cosmochim Acta 2008, 72(15):3681–3702.
6. Bradley AS, Fredricks H, Hinrichs K-U, Summons RE: Structural diversity ofdiether lipids in carbonate chimneys at the Lost City Hydrothermal Field.Org Geochem 2009, 40(12):1169–1178.
7. Bradley AS, Hayes JM, Summons RE: Extraordinary 13C enrichment ofdiether lipids at the Lost City Hydrothermal Field indicates a carbon-limited ecosystem. Geochim Cosmochim Acta 2009, 73:102–118.
8. Peng X, Li J, Zhou H, Wu Z, Li J, Chen S, Yao H: Characteristics andsource of inorganic and organic compounds in the sediments fromtwo hydrothermal fields of the Central Indian and Mid-Atlantic Ridges.J. Asian Earth Sci. 2011, 41:355–368.
9. Charlou JL, et al: High production and fluxes of H2 and CH4 andevidence of abiotic hydrocarbon synthesis by serpentinization inultramafic-hosted hydrothermal systems on the Mid-Atlantic Ridge. InDiversity of Hydrothermal Systems on Slow-spreading Ocean Ridges. Edited byRona P, Devey C, Dyment J, Murton B. Washington DC: GeophysicalMonograph Series; 2010:265–296.
10. Kelley DS, Baross JA, Delaney JR: Volcanoes, Fluids, and Life at Mid-OceanRidge Spreading Centers. Annu. Rev. Earth Pl. Sc. 2002, 30(1):385–491.
11. Proskurowski G, Lilley MD, Seewald JS, Fruh-Green GL, Olson EJ, Lupton JE,Sylva SP, Kelley DS: Abiogenic Hydrocarbon Production at Lost CityHydrothermal Field. Science 2008, 319(5863):604–607.
12. Holm NG, Charlou JL: Initial indications of abiotic formation ofhydrocarbons in the Rainbow ultramafic hydrothermal system.Mid-Atlantic Ridge. Earth Planet. Sc. Let. 2001, 191(1–2):1–8.
13. Konn C, Charlou JL, Donval JP, Holm NG, Dehairs F, Bouillon S:Hydrocarbons and oxidized organic compounds in hydrothermal fluidsfrom Rainbow and Lost City ultramafic-hosted vents. Chem Geol 2009,258(3–4):299–314.
14. Lang SQ, Butterfield DA, Schulte M, Kelley DS, Lilley MD: Elevatedconcentrations of formate, acetate and dissolved organic carbon foundat the Lost City hydrothermal field. Geochim Cosmochim Acta 2010,74(3):941–952.
15. Butterfield DA, Massoth GJ, McDuff RE, Lupton JE, Lilley MD: Geochemistryof Hydrothermal Fluids From Axial Seamount Hydrothermal EmissionsStudy Vent Field. Juan de Fuca Ridge: Subseafloor Boiling and
Subsequent Fluid-Rock Interaction. J Geophys Res-Solid 1990,95(B8):12895–12921.
16. Charlou JL, Donval JP, Fouquet Y, Jean-Baptiste P, Holm N: Geochemistryof high H2 and CH4 vent fluids issuing from ultramafic rocks at theRainbow hydrothermal field (36°14'N, MAR). Chem Geol 2002,191(4):345–359.
17. Foustoukos DI, Seyfried WE Jr: Fluid Phase Separation Processes in SubmarineHydrothermal Systems. Rev Mineral Geochem 2007, 65(1):213–239.
18. Von Damm KL, Buttermore LG, Oosting SE, Bray AM, Fornari DJ, Lilley MD,Shanks Iii WC: Direct observation of the evolution of a seafloor 'blacksmoker' from vapor to brine. Earth Planet. Sc. Let. 1997, 149(1–4):101–111.
19. Hennion M-C: Solid-phase extraction: method development, sorbents, andcoupling with liquid chromatography. J Chromatogr A 1999, 856(1–2):3–54.
20. Arthur CL, Pawliszyn J: Solid phase microextraction with thermal desorptionusing fused silica optical fibers. Anal Chem 1990, 62(19):2145–2148.
21. Segal A, Górecki T, Mussche P, Lips J, Pawliszyn J: Development ofmembrane extraction with a sorbent interface-micro gaschromatography system for field analysis. J Chromatogr A 2000,873(1):13–27.
22. Handley AJ: Extraction Methods in Organic Analysis. Sheffield: Academic PressLtd.; 1999.
23. Smith RM: Supercritical fluids in separation science - the dreams, thereality and the future. J Chromatogr A 1999, 856(1–2):83–115.
24. Carabias-Martínez R, Rodríguez-Gonzalo E, Revilla-Ruiz P, Hernández-MéndezJ: Pressurized liquid extraction in the analysis of food and biologicalsamples. J Chromatogr A 2005, 1089(1–2):1–17.
25. Shu YY, Lao RC, Chiu CH, Turle R: Analysis of polycyclic aromatichydrocarbons in sediment reference materials by microwave-assistedextraction. Chemosphere 2000, 41(11):1709–1716.
26. Grosjean E, Logan GA: Incorporation of organic contaminants intogeochemical samples and an assessment of potential sources: Examplesfrom Geoscience Australia marine survey S282. Org Geochem 2007,38(6):853.
27. David F, Sandra P: Stir bar sorptive extraction for trace analysis.J Chromatogr A 2007, 1152(1–2):54–69.
28. Baltussen E, Sandra P, David F, Cramers C: Stir bar sorptive extraction(SBSE), a novel extraction technique for aqueous samples: Theory andprinciples. J. Microcolumn Sep. 1999, 11(10):737–747.
29. Sandra P, Baltussen E, David F, Hoffmann A: A Novel Extraction Techniquefor Aqueous Samples: Stir Bar Sorptive Extraction. Gerstel ApplicationNotes 2000, 1:2000.
30. Ochiai N, Nakamura S: Application of Stir Bar Sorptive Extraction (SBSE)Coupled to Thermal Desorbtion GC-MS for Determination of Ultra-TraceLevel Compounds of Aqueous Samples. Gerstel Application Note 2005,5:2005.
31. Roy G, Vuillemin R, Guyomarch J: On-site determination of polynucleararomatic hydrocarbons in seawater by stir bar sorptive extraction (SBSE)and thermal desorption GC-MS. Talanta 2005, 66(3):540–546.
32. Pérez-Carrera E, León VML, Parra AG, González-Mazo E: Simultaneousdetermination of pesticides, polycyclic aromatic hydrocarbons andpolychlorinated biphenyls in seawater and interstitial marine watersamples, using stir bar sorptive extraction-thermal desorption-gaschromatography–mass spectrometry. J Chromatogr A 2007, 1170(1–2):82–90.
33. León VM, Llorca-Pórcel J, Álvarez B, Cobollo MA, Muñoz S, Valor I: Analysisof 35 priority semivolatile compounds in water by stir bar sorptiveextraction-thermal desorption-gas chromatography–mass spectrometry:Part II: Method validation. Anal Chim Acta 2006, 558(1–2):261–266.
34. Pfannkoch E, Whitecavage J, Hoffmann A: Stir Bar Sorptive Extraction:Enhancing Selectivity of the PDMS Phase. Gerstel Application Note 2001,2:2001.
35. Bicchi C, Cordero C, Rubiolo P, Sandra P: Impact of water/PDMS phaseratio, volume of PDMS, and sampling time on Stir Bar SorptiveExtraction (SBSE) recovery of some pesticides with different Ko/w.J Sep Sci 2003, 26:1650–1656.
36. MacNamara K, Leardi R, McGuigan F: Comprehensive investigation andoptimisation of the main experimental variables in stir-bar sorptiveextraction (SBSE)-thermal desorption-capillary gas chromatography(TD-CGC). Anal Chim Acta 2009, 636(2):190–197.
37. Pfannkoch E, Whitecavage J, Kinton V: Stir Bar Sorptive Extraction:Recovery of Organic Acids and Amines. Gerstel Application Note 2003,5:2003.
Konn et al. Geochemical Transactions 2012, 13:8 Page 19 of 19http://www.geochemicaltransactions.com/content/13/1/8
38. Sanderson H, Thomsen M: Comparative analysis of pharmaceuticalsversus industrial chemicals acute aquatic toxicity classification accordingto the United Nations classification system for chemicals. Assessment ofthe (Q)SAR predictability of pharmaceuticals acute aquatic toxicity andtheir predominant acute toxic mode-of-action. Toxicol Lett 2009,187(2):84–93.
39. Fouquet Y, Charlou JL, Ondreas H, Knoery J, Donval JP, Douville E:Discovery and first submersible investigations on the Rainbowhydrothermal field on the MAR (36°140N). EOS Trans-Am Geophys Union1997, 78:832.
40. Charlou JL, Fouquet Y, Bougault H, Donval JP, Etoubleau J, Jean-Baptiste P,Dapoigny A, Appriou P, Rona PA: Intense CH4 plumes generated byserpentinization of ultramafic rocks at the intersection of the 15°20'Nfracture zone and the Mid-Atlantic Ridge. Geochim Cosmochim Acta 1998,62(13):2323–2333.
41. Douville E, Charlou JL, Oelkers EH, Bienvenu P, Jove Colon CF, Donval JP,Fouquet Y, Prieur D, Appriou P: The rainbow vent fluids (36 Deg14'N,MAR): the influence of ultramafic rocks and phase separation on tracemetal content in Mid-Atlantic Ridge hydrothermal fluids. Chem Geol 2002,184(1–2):37.
42. Dyment J, et al: Detailed investigation of hydrothermal site Rainbow,Mid-Atlantic Ridge, 36°13’N: Cruise MoMARDream. InterRidge News 2009,18:22–24.
43. Gaill F, et al: Cruise MoMARDREAM-Naut and other MoMAR Experimentsat Rainbow and Lucky Strike in Summer 2007. InterRidge News 2007,16:15–16.
44. Konn C, Testemale D, Querellou J, Holm NG, Charlou JL: New insight intothe contributions of thermogenic processes and biogenic sources to thegeneration of organic compounds in hydrothermal fluids. Geobiology2011, 9:79–93.
45. McLafferty FW: Mass Spectrometric Analysis. Molecular Rearrangements.Anal Chem 1959, 31:82–87.
46. Rezanka T, Sigler K: Odd-numbered very-long-chain fatty acids from themicrobial, animal and plant kingdoms. Prog Lipid Res 2009, 48:206–238.
47. McCollom TM, Simoneit BR: Abiotic formation of hydrocarbons andoxygenated compounds during thermal decomposition of iron oxalate.Origins Life Evol B 1999, 29:167–186.
48. Rushdi AI, Simoneit BRT: Lipid Formation by Aqueous Fischer-Tropsch-Type Synthesis over a Temperature Range of 100 to 400°C. Origins LifeEvol B 2001, 31:103–118.
49. McCollom TM, Seewald JS: Abiotic Synthesis of Organic Compounds inDeep-Sea Hydrothermal Environments. Chem Rev 2007, 107(2):382–401.
50. Shock EL: Chapter 5 Chemical environments of submarine hydrothermalsystems. Origins Life Evol B 1992, 22(1):67–107.
51. Peterson AA, Vogel F, Lachance RP, Froling M, Antal MJ Jr, Tester JW:Thermochemical biofuel production in hydrothermal media: A review ofsub- and supercritical water technologies. Energy Environ Sci 2008,1(1):32–65.
doi:10.1186/1467-4866-13-8Cite this article as: Konn et al.: Characterisation of dissolved organiccompounds in hydrothermal fluids by stir bar sorptive extraction - gaschomatography - mass spectrometry. Case study: the Rainbow field (36°N, Mid-Atlantic Ridge). Geochemical Transactions 2012 13:8.
Submit your next manuscript to BioMed Centraland take full advantage of:
• Convenient online submission
• Thorough peer review
• No space constraints or color figure charges
• Immediate publication on acceptance
• Inclusion in PubMed, CAS, Scopus and Google Scholar
• Research which is freely available for redistribution
Submit your manuscript at www.biomedcentral.com/submit