Embed Size (px)
Citation preview

The Role of Geothermal in Enhancing Energy Diversity and Security The Role of Geothermal in Enhancing Energy Diversity and Security
in the Western USin the Western US
Roger HillGeoPowering the West
Sandia is a multiprogram laboratory operated by Sandia Corporation, a Lockheed Martin Company,for the United States Department of Energy’s National Nuclear Security Administration
under contract DE-AC04-94AL85000.
[GEOTHERMAL LARGE AND SMALL][GEOTHERMAL LARGE AND SMALL]
Sandia Energy ProgramsSandia Energy Programs
Technologies include Concentrating Solar Power, Photovoltaics, Wind, Geothermal, Energy Storage, Well Construction, Reservoir Evaluation and Production, Storage and Transmission, Energy and Water, Fuel Utilization
,

GPW State Working Groups ListGPW State Working Groups List
State Working Groups
1. Alaska, est. in 2002
2. Arizona, est. in 2002
3. California, est. in 2003
New Geothermal PlantsNew Geothermal Plants
GPW State Working Groups ListGPW State Working Groups List
State Working Groups
1. Alaska, est. in 2002
2. Arizona, est. in 2002
3. California, est. in 2003
4. Hawaii, est. in 2003
5. Idaho, est. in 2002
6. Oregon, est. in 2003
7. Nevada, est. in 2000
8. New Mexico, est. in 2000
9. Texas, est. in 2005
10. Utah, est. in 2002
11. Washington, est. in 2002
4. Hawaii, est. in 2003
5. Idaho, est. in 2002
6. Oregon, est. in 2003
7. Nevada, est. in 2000
8. New Mexico, est. in 2000
9. Texas, est. in 2005
10. Utah, est. in 2002
11. Washington, est. in 2002
Current Projected

Western US: Load GrowthWestern US: Load Growth
Source:
Renewable
Energy Atlas

Electricity GenerationElectricity Generation
Source:
Renewable
Energy Atlas

Regional Power Plant EmissionsRegional Power Plant Emissions
Source:
Renewable Energy Atlas

15.0
20.0
25.0
US Natural Gas Prod. Will Grow 13% Imports Will Grow 157%US Natural Gas Prod. Will Grow 13% Imports Will Grow 157%
Production
TC
F
LNG Imports
0.0
5.0
10.0
15.0
2005 2010 2015 2020 2025
Other Imports
Source: DOE/EIA AEO2005
TC
F
LNG Imports

EIA has consistently underestimated gas EIA has consistently underestimated gas
pricesprices
4
5
AEO 1997
AEO 1998
AEO 1999
Wellhead Natural Gas Prices (2002$/Mcf)
0
1
2
3
1993 1997 2001 2005 2009 2013 2017 2021 2025
AEO 1999
AEO 2000
AEO 2001
AEO 2002
AEO 2003
AEO 2004
Source: Union of Concerned Scientists

The Role of Geothermal in Enhancing Energy Diversity The Role of Geothermal in Enhancing Energy Diversity
and Security in the Western USand Security in the Western US
A MeanA Mean--Variance Portfolio Optimization of the Region’s Generating Mix to 2013Variance Portfolio Optimization of the Region’s Generating Mix to 2013
Prepared for Sandia National Labs
Roger Hill
Contract OfficerContract Officer
By
Shimon Awerbuch, Ph.D.
Tyndall Centre Visiting Fellow - SPRU-University of Sussex
Jaap C. Jansen & Luuk Beurskens
ECN - Energy Research Centre of the Netherlands
Thomas Drennen, Ph.D.
Hobart College and Sandia National Labs
February 28, 2005

Geothermal Potential and CostGeothermal Potential and Cost
Band
Resource Availability
Generating Cost
MW 2003 2013
Optimization Defines Four Bands for Optimization Defines Four Bands for
New Geothermal Based on Resource AccessibilityNew Geothermal Based on Resource Accessibility
Existing 2,543 $.062 $.062
Geothermal-1 2,457 $.047 $.045
Geothermal-2 2,500 $.052 $.049
Geothermal-3 2,500 $.057 $.054
Geothermal-4 20,000 $.071 $.067
Total 30,000 - -

EIA Generating Mixes (TWh)
2003 and Projected 2013
300
400
500
600
TW
h
Geothermal
Hydro
Wind
EIA 2003 and 2013 Generating Mixes
Geothermal Shares
2003: 2% 2013: 4%
0
100
200
300
2003 2013
TW
h
Nuclear
Gas
Coal
Reference_Mix.xl_Sandia_2003.xls

Generating Cost Inputs: Nominal $/kWhGenerating Cost Inputs: Nominal $/kWh
Technology Existing New Existing New
Coal $0.037 $0.049 $0.049 $0.068
Gas $0.048 $0.037 $0.075 $0.067
US Western Region Portfolio analysis
Nominal Technology Cost Inputs Assuming 3% Inflation
(Nominal $/kWh)
2003 2013
Nuclear $0.014 $0.062 $0.018 $0.081
Wind $0.043 $0.047 $0.056 $0.062
Hydro $0.046 $0.046 $0.060 $0.060
Geothermal $0.064 $0.083
New Geo 1 $0.049 $0.060
New Geo 2 $0.053 $0.066
New Geo 3 $0.058 $0.072
New Geo 4 $0.073 $0.090Based on US-EIA and Sandia National Laboratories cost estimates, adjusted for 3% inflation

Understanding RiskUnderstanding Risk
• Portfolio optimization locates generating mixes with minimum expected cost and risk
• For each technology, risk is the year-to-year variability (standard deviation) of the three generating cost inputs: fuel, O&M and capital (construction period risk)
– Fossil fuel standard deviations are estimated from historic US data – Fossil fuel standard deviations are estimated from historic US data
• e.g. standard deviation for natural gas over the last 10 years is 0.30
– Standard deviations for capital and O&M are estimated using proxy procedures (see Awerbuch and Berger, IEA, 2003)
• The construction period risk for embedded technologies is 0.0
• ‘New’ technologies are therefore riskier than embedded ones
– e.g. new coal is riskier than ‘old’ coal

Construction
Period b/ Fuel c/Variable
O&M
Fixed
O&M
Coal 0.20 0.020 0.2 0.087
Gas 0.15 0.300 0.2 0.087
Nuclear 0.20 0.194 0.2 0.087
Wind 0.05 - 0.2 0.087
Hydro 0.20 - 0.2 0.087
Technology Risk Estimates
(Standard Deviation) a/
Total Risk for each generating technology is a weighted statistical summation of the component risks
Geothermal d/ 0.15 - 0.2 0.087
a. Estimation procedures developed in Awerbuch and Berger (Paris, IEA, 2003)
b. Construction period costs for existing (embedded) technologies is 0.0
c. Empirical estimate based on 1994-2003 data
cost_variance_correlation_fuel_tech.xls
d. Four geothermal categories are used in the analysis. While exploration and other costs increase,
construction period risk is assumed to remain constant.

Western US - 2013 Accelerated Geo
New Nuclear
Old Wind
Old geothermal
Old hydroNew Wind
New Coal
New Geo 4
New Geo 3
New Geo 2
New Geo 1New hydro
Old Gas
New gas
EIA Mix 2013
$40
$50
$60
$70
Po
rtfo
lio
Co
st
($/M
Wh
)2013 EIA Technology Generating Costs 2013 EIA Technology Generating Costs
and Estimated Technology Riskand Estimated Technology Risk
Old nuclear
Old Wind
Old coal
EIA Mix 2003
$10
$20
$30
$40
0.00 0.05 0.10 0.15 0.20
Risk (standard deviation)
Po
rtfo
lio
Co
st
($/M
Wh
)
Sandia_2013_Accel_geo

Western US, 2013New Nuclear
Old Wind
Old geothermal
Old hydro
New Coal
New Geo 3
New Geo 2
New Geo 1New hydro
Old Gas
New gas
EIA Mix 2013
Mix P
Mix NMix Q
Mix S
$40
$45
$50
$55
$60
Po
rtfo
lio
Co
st
($/M
Wh
)
2013 Baseline Portfolio Optimization2013 Baseline Portfolio Optimization
Portfolio Risk-Cost and Technology Shares
© Shimon Awerbuch Feb-05
Old nuclear
Old coal
$25
$30
$35
$40
0.00 0.05 0.10 0.15 0.20
Risk (Standard Deviation)
Po
rtfo
lio
Co
st
($/M
Wh
)
Sandia_2013_baseline_2
Mix P: Costs $.003/KWh more than EIA Mix: 9x as much Geo
Mix N costs the same as EIA Mix: 5x as much Geo
Mix S costs less than EIA Mix: 75% more Geo
Mix P Mix N
EIA Mix
2013 Mix S Mix Q
Risk 0.05 0.05 0.06 0.06 0.07
Cost $49.21 $46.28 $46.28 $44.03 $44.02
Coal 23% 31% 31% 29% 23%
Gas 9% 10% 20% 25% 30%
Nuclear 4% 4% 9% 4% 4%
Wind 3% 3% 2% 3% 3%
Hydro 27% 33% 34% 34% 34%
Geothermal 35% 20% 4% 7% 7%
Portfolio Risk-Cost and Technology Shares
Technology Energy Share

Western US - 2013 Accelerated Geo
New NuclearOld geothermal
New Geo 4
New Geo 3
Old Gas$60
$70
Po
rtfo
lio
Co
st
($/M
Wh
)
Western Region Generating CostWestern Region Generating Cost--Risk TrendsRisk Trends
• 2013 EIA Mix has higher cost and risk relative to 2003
– Driven by 32% demand increase, decommissioning existing plant, resource shortages and limitations on available options
• Move to larger gas/coal shares adds to portfolio cost and risk
– Increases year-to-year expected generating cost volatility
• Reduces Energy Diversity/ Security
Old nuclear
Old Wind
Old hydroNew Wind
Old coal
New CoalNew Geo 3
New Geo 2
New Geo 1New hydro
New gas
EIA Mix 2013
EIA Mix 2003
$10
$20
$30
$40
$50
0.00 0.05 0.10 0.15 0.20
Risk (standard deviation)
Po
rtfo
lio
Co
st
($/M
Wh
)
Sandia_2013_Accel_geo
Diversity/ Security
• Geothermal and wind are ideally positioned to diversify the generating mix and reduce cost/risk

A MeanA Mean--Variance Portfolio Optimization of the Variance Portfolio Optimization of the
Western Region’s Generating Mix to 2013Western Region’s Generating Mix to 2013
• Portfolio optimization locates generating mixes with lowest-expected cost at every level of risk
– Risk is the year-to-year variability of technology generating costs
• EIA (NEMS) projected generating mixes serve as a benchmark or starting point; starting point; – Detailed decommissioning date assumptions using World Electricity Power
Plant Database age of existing plants
• The optimal results generally indicate that compared to EIA target mixes, there exist generating mixes with larger geothermal shares at no greater expected cost or risk
– There exist mixes with larger geothermal shares that exhibit lower expected cost and risk

Undiscovered
Resources
National R&Dhelps to expandthe geothermalresource base:�Geophysics and
Geologic Assurance and Economic Feasibility
Decreasing information about resource
Decre
asin
g q
ualit
y of
resourc
eReserves
Undiscovered
Resources
Sub-Economic
Resources
�Geophysics andgeoscience tolocate and definereservoirs
�Drilling researchto reduce costs
� Improving capabilities andefficiencies ofpower plants.
Decre
asin
g q
ualit
y of
resourc
e
Resources
Sub-Economic
Resources
“The
McKelvey
Diagram”

Low-Temp Resources are
More Common
• 83% of the sites
require binary plants
(also, EGS/HDR will
most likely need binary20
25
30
35
Binary Flash
most likely need binary
plants)
• And 50% of the
available energy is
below temperatures
requiring binary plants
(170C)Frequency of occurrence and energy of
hydrothermal convection systems identified by
the USGS in 1978
0
5
10
15
20
110 130 150 170 190 210 230 250 270 290 310 330
Resource Temp C
%
systems
energy
Source: NREL

Geothermal Resource Prospecting
The Early Years!

Geothermal Applications in Summary

Attributes of Geothermal Attributes of Geothermal
PowerPowerAdvantages
• Enormous potential
• High, reliable plant capacity factor
• Greenhouse gas reduction
• Low environmental impact
•
Disadvantages
• Expensive drilling
• Regional resource
• Resource uncharacterized
• Threshold plant size
• Plant prefers constant load
•• Much mature technology• Plant prefers constant load
• Environmental perception

Expected Trends in Future Expected Trends in Future
Energy System EvolutionEnergy System Evolution
Energy safety, security, reliability, and sustainability have become important energy system design parameters
This will change how energy systems are optimized and upgraded
This will impact future decisions on energy 2
3
4
5Cost Effectiveness
SecuritySustainability
Case A
Case B
This will impact future decisions on energy policy, supply, and use
How do we efficiently and cost-effectively transition to this new future infrastructure?
0
1
2Security
ReliabilityEnvironmental
Attractiveness
Sustainability

The primary role of PIER Renewables is to help the State meet aggressive renewable energy policy goals by investing in high pThe primary role of PIER Renewables is to help the State meet aggressive renewable energy policy goals by investing in high prioriority rity
RD&D issues.RD&D issues.
Policy Goals Projected Renewables to Meet Policy Goals
Projected Renewables to Meet California Policy Goals
80
100
Ren
ew
ab
le E
nerg
y G
en
era
ted
Sta
tew
ide (
'000
Gap
Total: 29,000 GWh(~11% Renewables)
Target: 54,000 GWh(20% RPS)
Target: 98,000 GWh(33% RPS w/ 3 GW Solar and 1.5 GW Biomass)
Gap
0
20
40
60
80
2004 2010 2020Ren
ew
ab
le E
nerg
y G
en
era
ted
Sta
tew
ide (
'000
GW
h)
GapSmall Hydro/OceanSolar PVSolarCSPBiomassGeoWind
Data Sources: 2004, CEC Electricity Report which includes all renewables in the State, not just IOUs; 2010 and 2020, PIER Renewables Projections.
Gap
Source: CEC
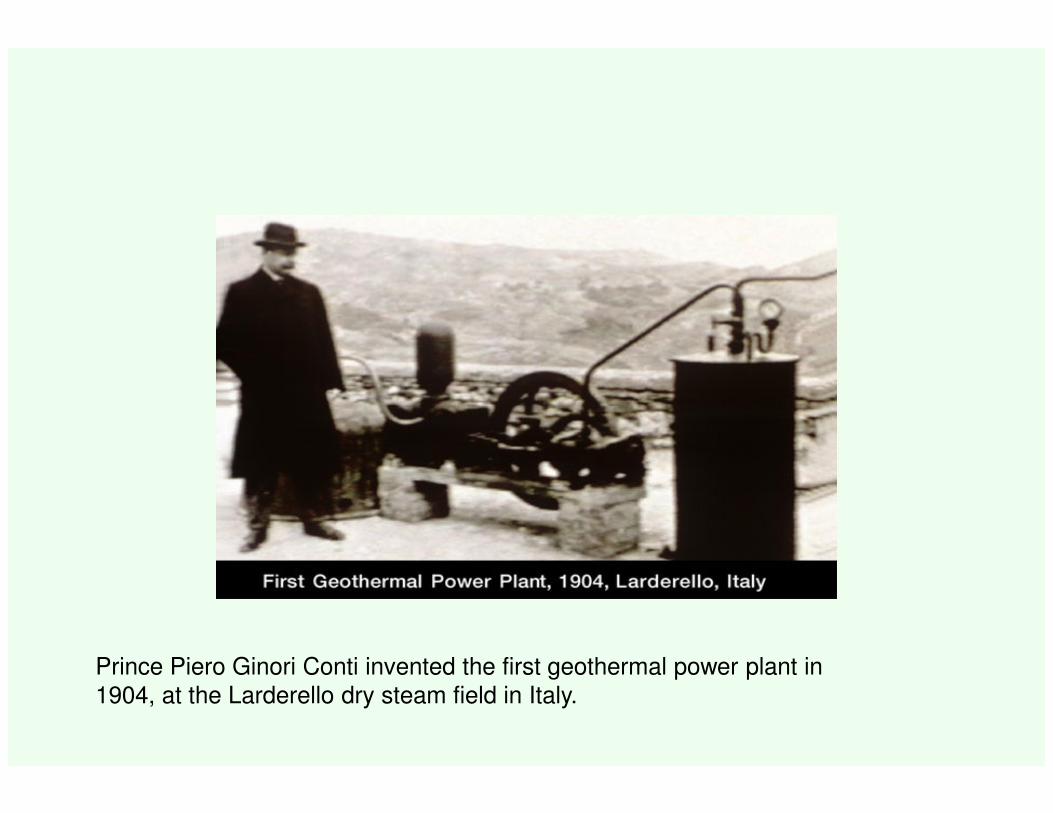
Prince Piero Ginori Conti invented the first geothermal power plant in 1904, at the Larderello dry steam field in Italy.

Source: Chena Hot Springs
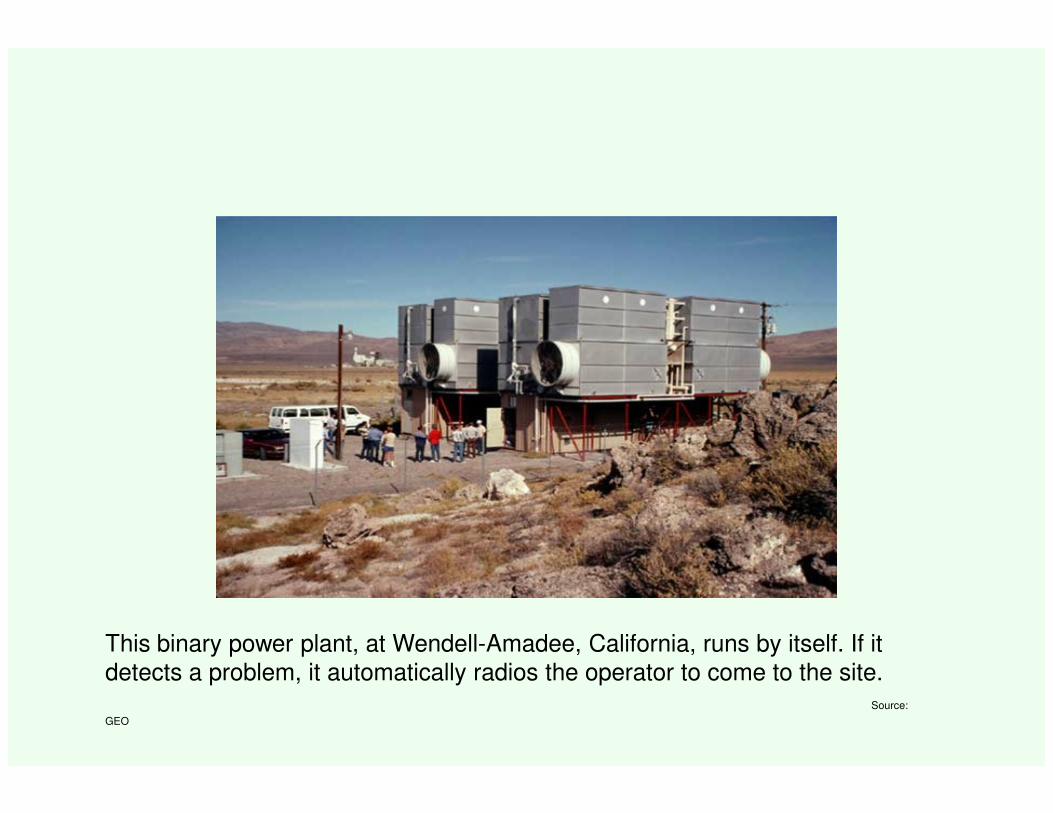
This binary power plant, at Wendell-Amadee, California, runs by itself. If it detects a problem, it automatically radios the operator to come to the site.
Source:
GEO

Ormat small power plantOrmat small power plant
This small binary power plant is in Fang, Thailand.

Small Geothermal Power Small Geothermal Power
Plants in the Oil PatchPlants in the Oil Patch
Advantages for O&G industry•Helps to service pumping •O&G industry has similar technology and infrastructure •Potentially supplements resources exploitation
Economic advantagesEconomic advantages•Distributed power at full retail cost•Enhanced or extended operations uneconomical•Exploration already is largely characterized•Modular and can start small
Advantages for the Nation•Offers addition energy choice

Transmission
Substation
Load
Oil and Gas
Gas
Utility Systems
Generator
Distribution
Coal
Wind
Geothermal in
utility portfolio or at the load

You’ve Heard of Combined Heat and Power? You’ve Heard of Combined Heat and Power?
Geothermal offers combined:
Heat…………Power……… and Pleasure!
Sources: Geothermal Education Office

Geothermal Energy
Roger HillRoger HillSandia National LaboratoriesSandia National Laboratories
[email protected], [email protected], 505--844844--61116111