Embed Size (px)
Citation preview
The Role of Friction and Shear stress in the Jamming Transition
Antonio Coniglio
Università di Napoli “Federico II”
Lorentz Center Leiden 6-10 July 2009
M.Pica Ciamarra, Univ Naples, Italy M. Nicodemi, Univ Warwick, UKR. Pastore Univ Naples, ItalyD. Grebenkov Ecole Polytechnique Orsay, France
Collaborators:
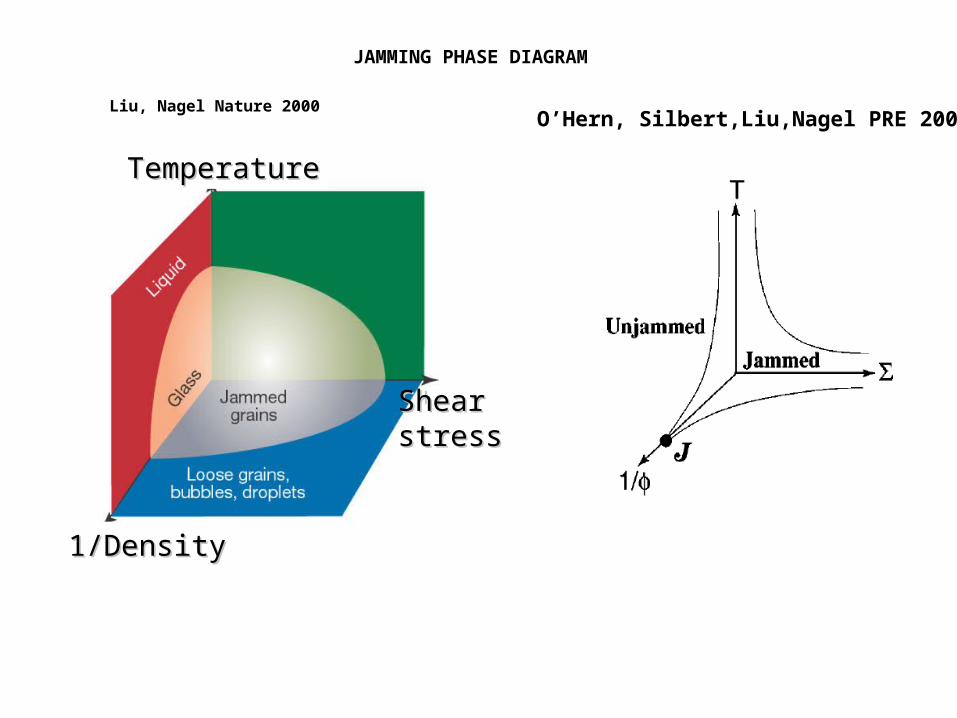
JAMMING PHASE DIAGRAM
Liu, Nagel Nature 2000
Shear Shear stressstress
TemperatureTemperature
1/Density1/Density
O’Hern, Silbert,Liu,Nagel PRE 2003
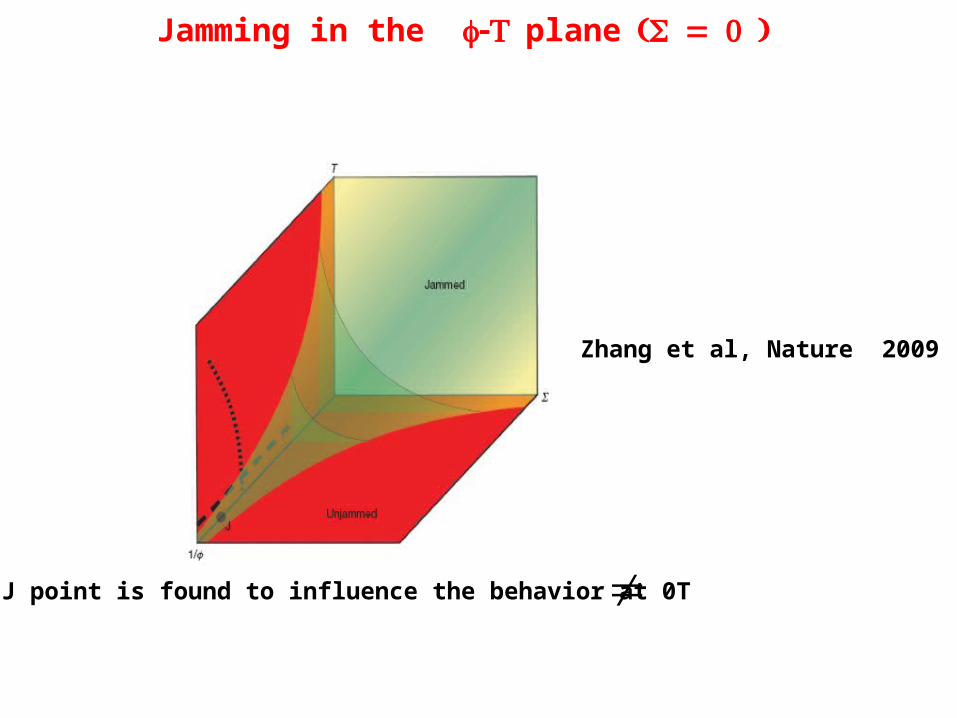
Zhang et al, Nature 2009
Jamming in the plane
The J point is found to influence the behavior at T 0
Study the Jamming phase diagram at T= 0 in the density-shear stress plane:
OUTLINE
a) Effect of the applied shear stress on the Jamming transition for a system of soft frictionless particles.
b) Extend the study to soft frictional particles.
Conclusions
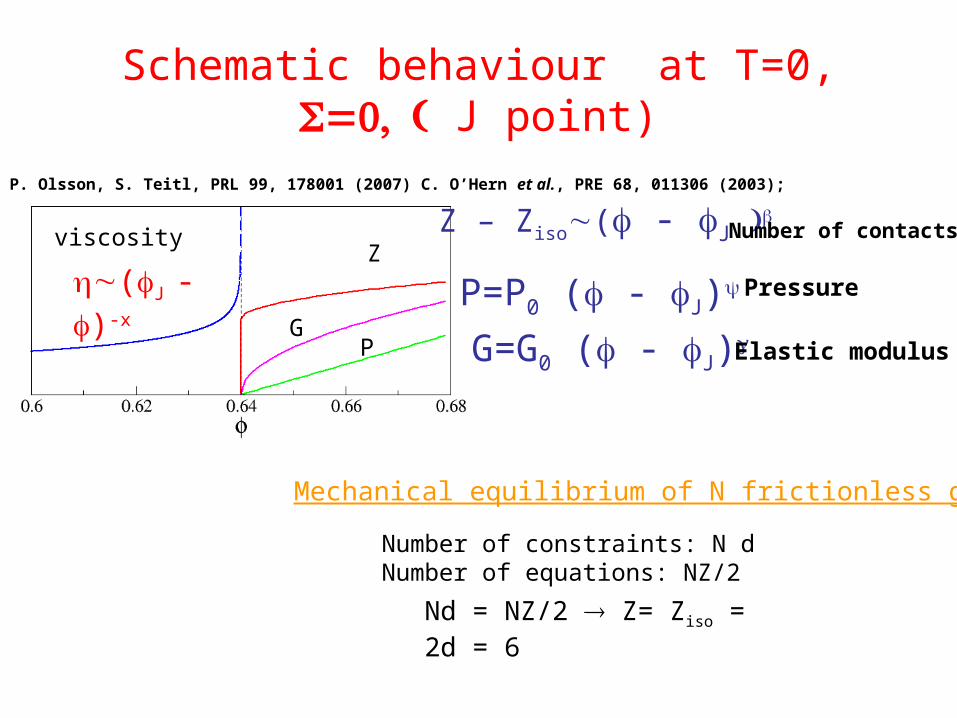
Schematic behaviour at T=0, J point)
Z – Ziso( - J
P=P0 ( - J)
G=G0 ( - J)
(J - )-x
viscosity
P. Olsson, S. Teitl, PRL 99, 178001 (2007) C. O’Hern et al., PRE 68, 011306 (2003);
Number of contacts
Pressure
Elastic modulus
Nd = NZ/2 Z= Ziso = 2d = 6
Mechanical equilibrium of N frictionless grains
Number of constraints: N dNumber of equations: NZ/2
Z
PG
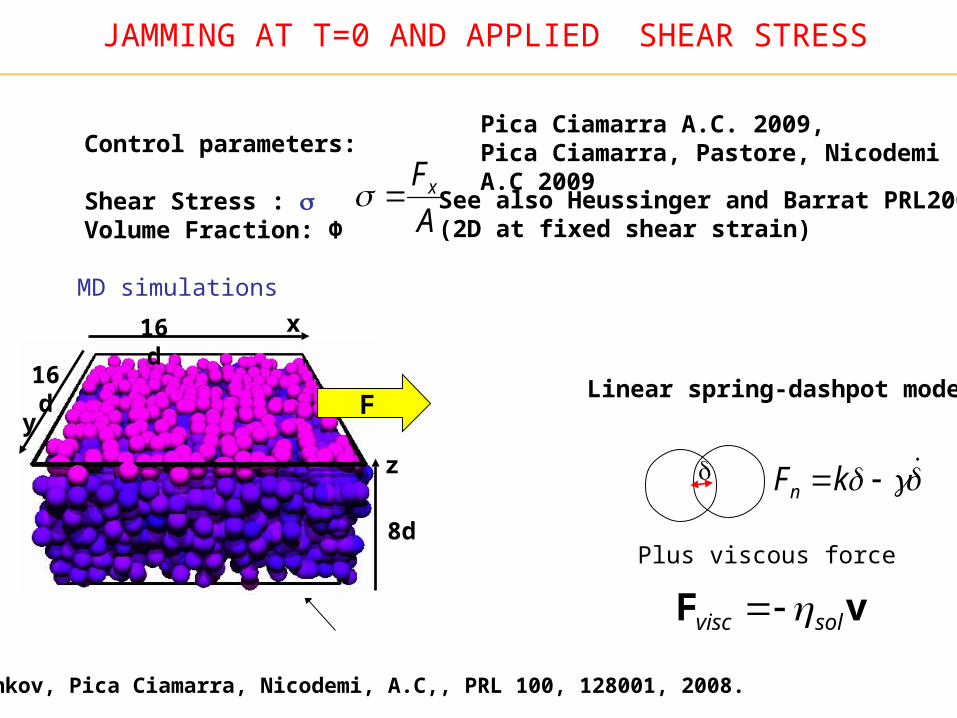
Grebenkov, Pica Ciamarra, Nicodemi, A.C,, PRL 100, 128001, 2008.
A
Fx
kFn
JAMMING AT T=0 AND APPLIED SHEAR STRESS
Plus viscous force
vF solvisc
Linear spring-dashpot model
8d
z
x16 d
16 d
yF
MD simulations
Control parameters: Shear Stress : Volume Fraction: Φ
Pica Ciamarra A.C. 2009,Pica Ciamarra, Pastore, Nicodemi A.C 2009
See also Heussinger and Barrat PRL2009(2D at fixed shear strain)
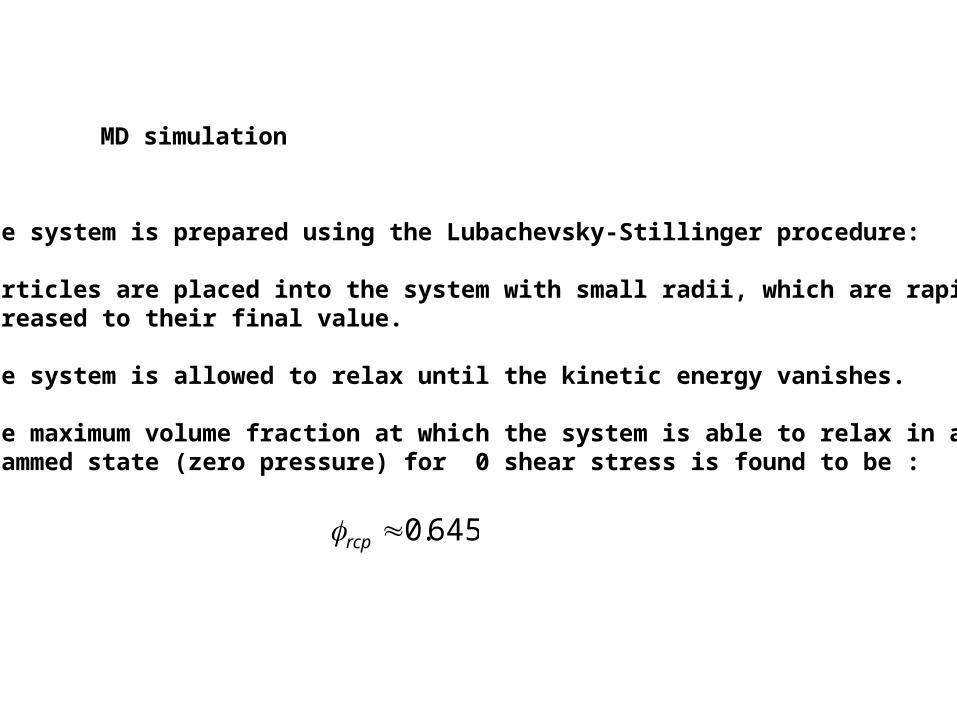
MD simulation
•The system is prepared using the Lubachevsky-Stillinger procedure:
•Particles are placed into the system with small radii, which are rapidly increased to their final value.
•The system is allowed to relax until the kinetic energy vanishes.
•The maximum volume fraction at which the system is able to relax in an unjammed state (zero pressure) for 0 shear stress is found to be :
645.0rcp
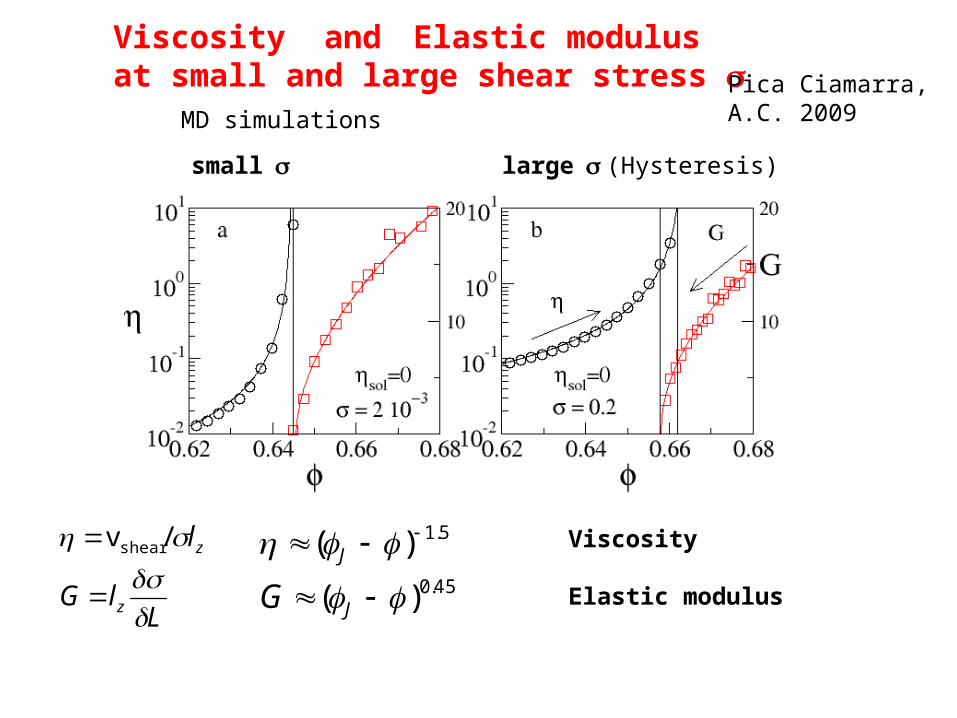
(Hysteresis)
LlG
l
z
z
/vshear Viscosity
Elastic modulus45.0
5.1
)(
)(
J
J
G
Viscosity andElastic modulus at small and large shear stress
small large
MD simulations
Pica Ciamarra, A.C. 2009
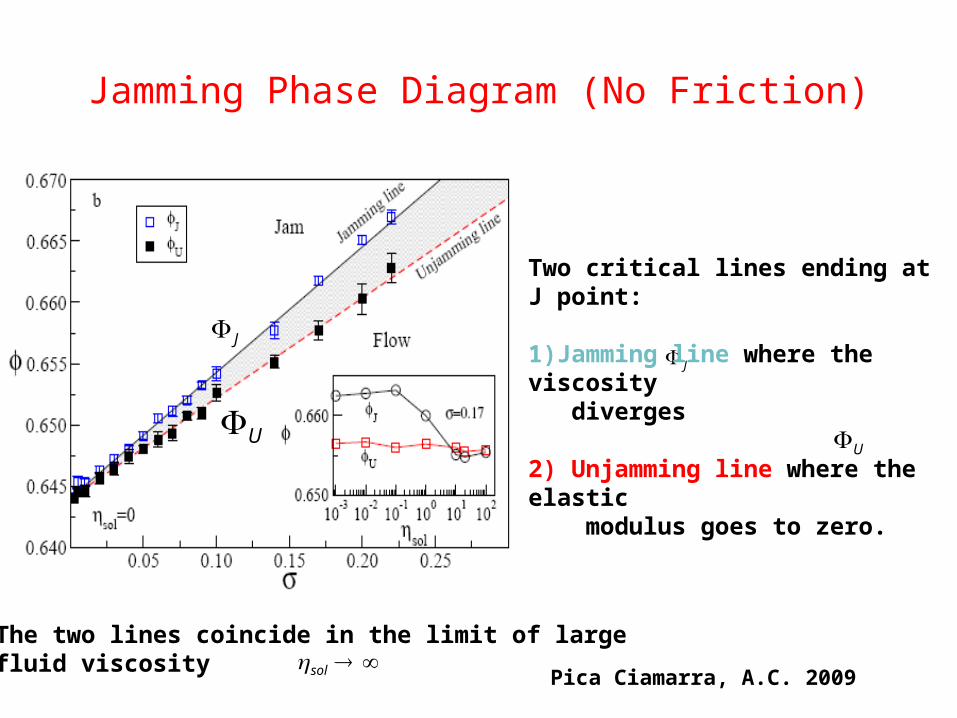
Jamming Phase Diagram (No Friction)
J
sol
J
Pica Ciamarra, A.C. 2009
Two critical lines ending at J point:
1)Jamming line where the viscosity diverges
2) Unjamming line where the elastic modulus goes to zero.
The two lines coincide in the limit of largefluid viscosity
UU
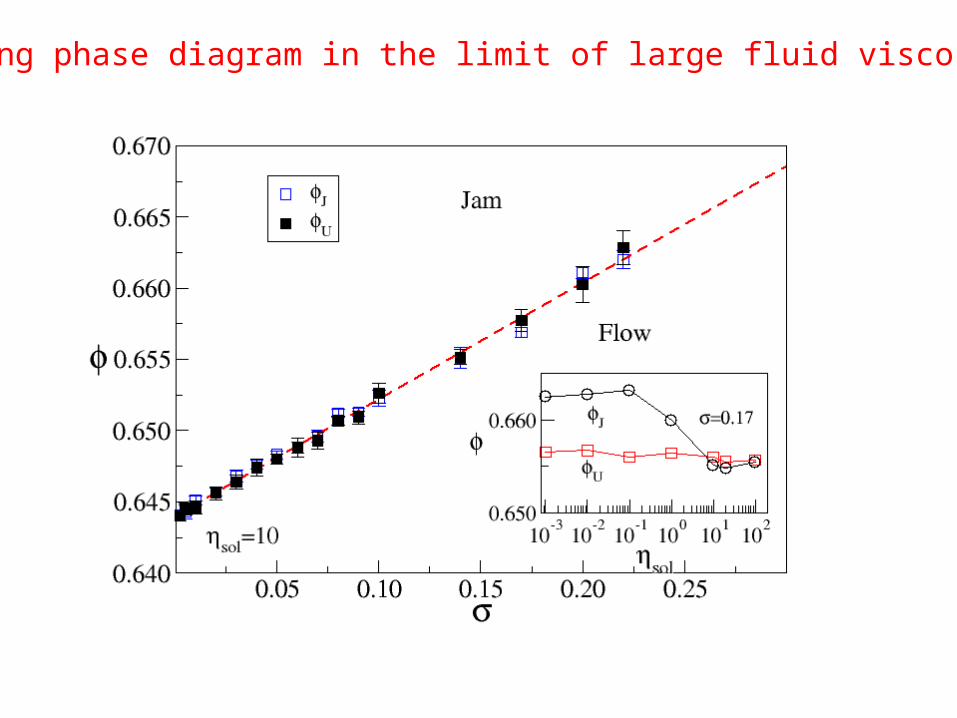
Jamming phase diagram in the limit of large fluid viscosity
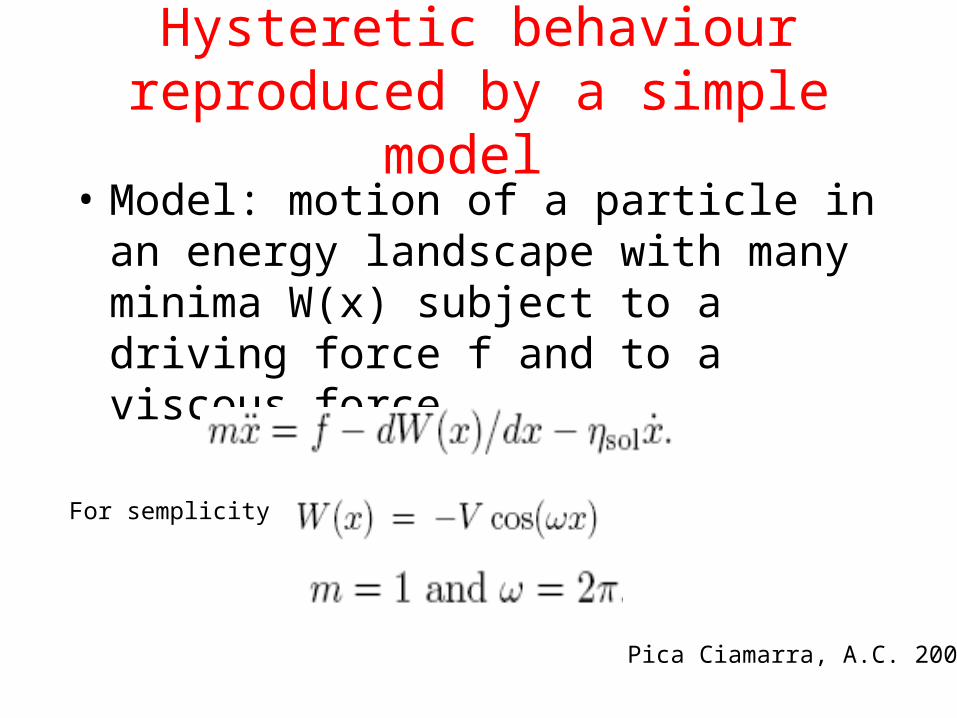
Hysteretic behaviour reproduced by a simple model
• Model: motion of a particle in an energy landscape with many minima W(x) subject to a driving force f and to a viscous force.
For semplicity
Pica Ciamarra, A.C. 2009
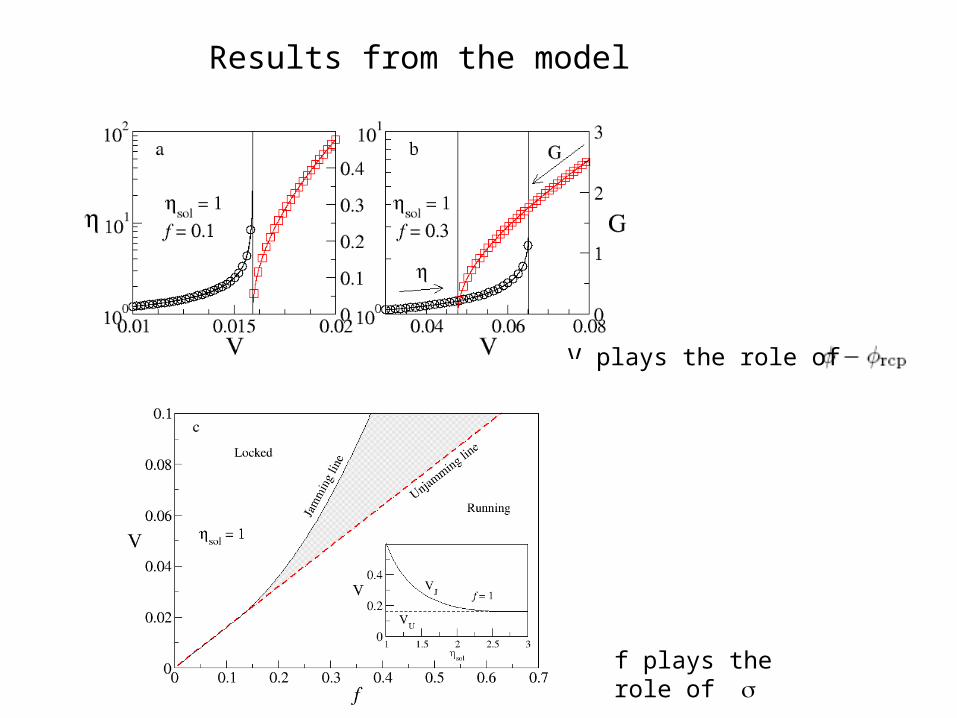
Results from the model
V plays the role of
f plays the role of
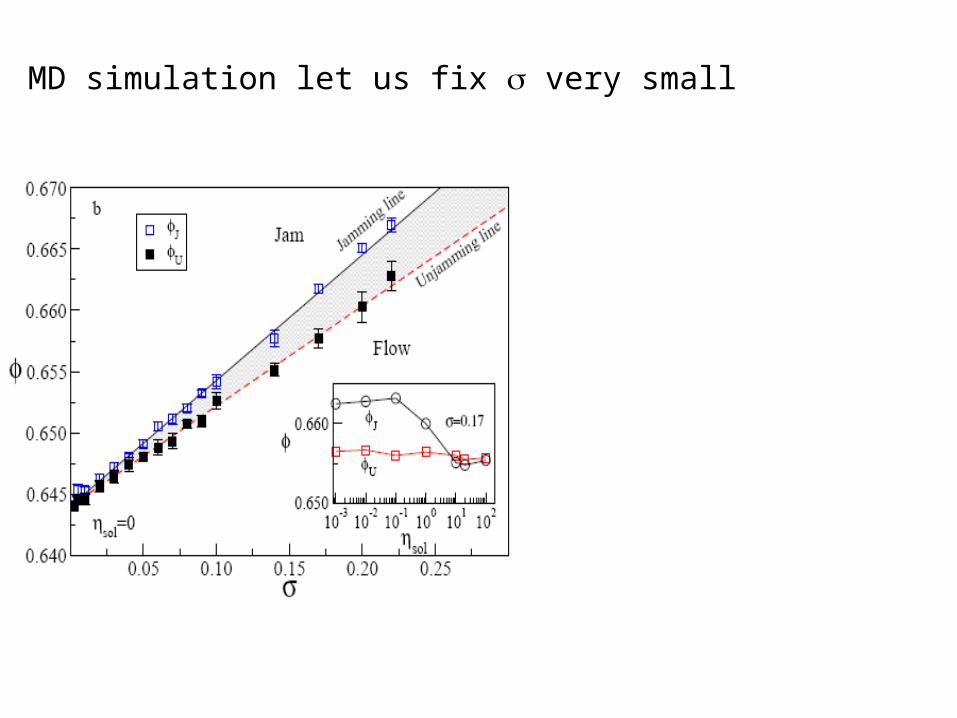
MD simulation let us fix very small
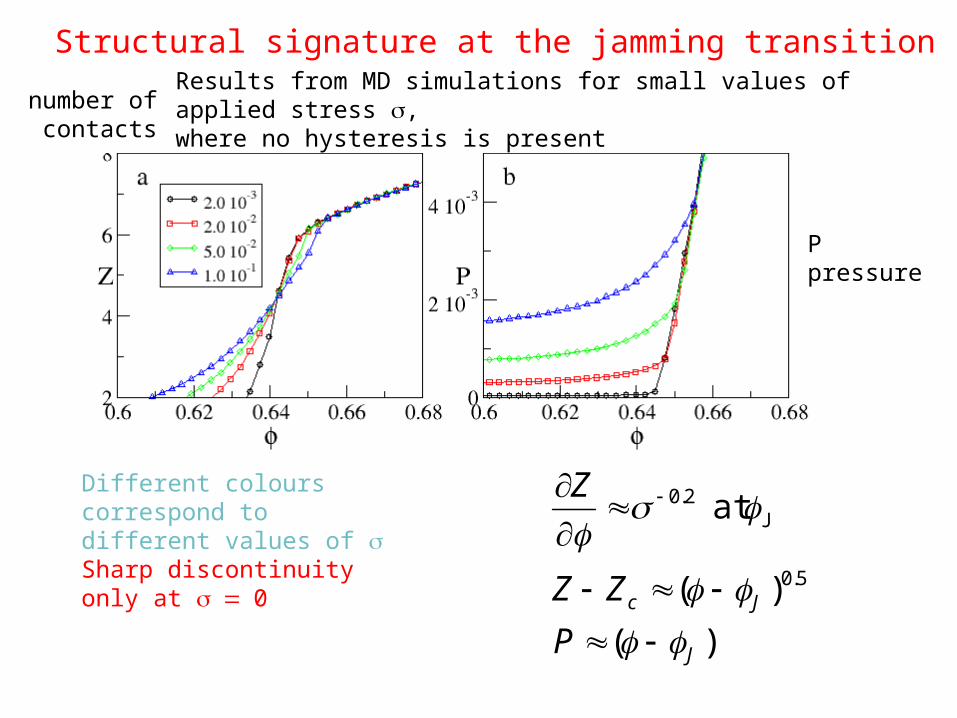
Structural signature at the jamming transition
Different colours correspond to different values of Sharp discontinuity only at 0
Results from MD simulations for small values of applied stress ,where no hysteresis is present number of
contacts
P pressure
)(
)(
at
5.0
J2.0
J
Jc
P
ZZ
Z
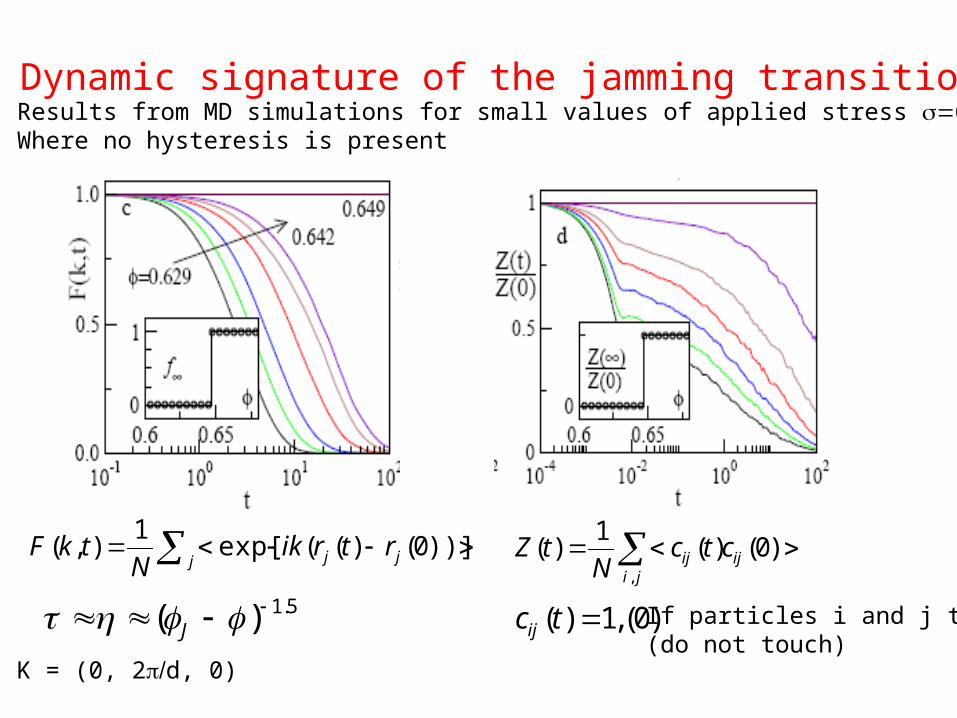
If particles i and j touch(do not touch)
))]0()((exp[1
),(j jj rtrik
NtkF
jiijij ctc
NtZ
,
)0()(1
)(
)0(,1)( tcij
Dynamic signature of the jamming transition
5.1)( J
Results from MD simulations for small values of applied stress ,Where no hysteresis is present
K = (0, 2d, 0)
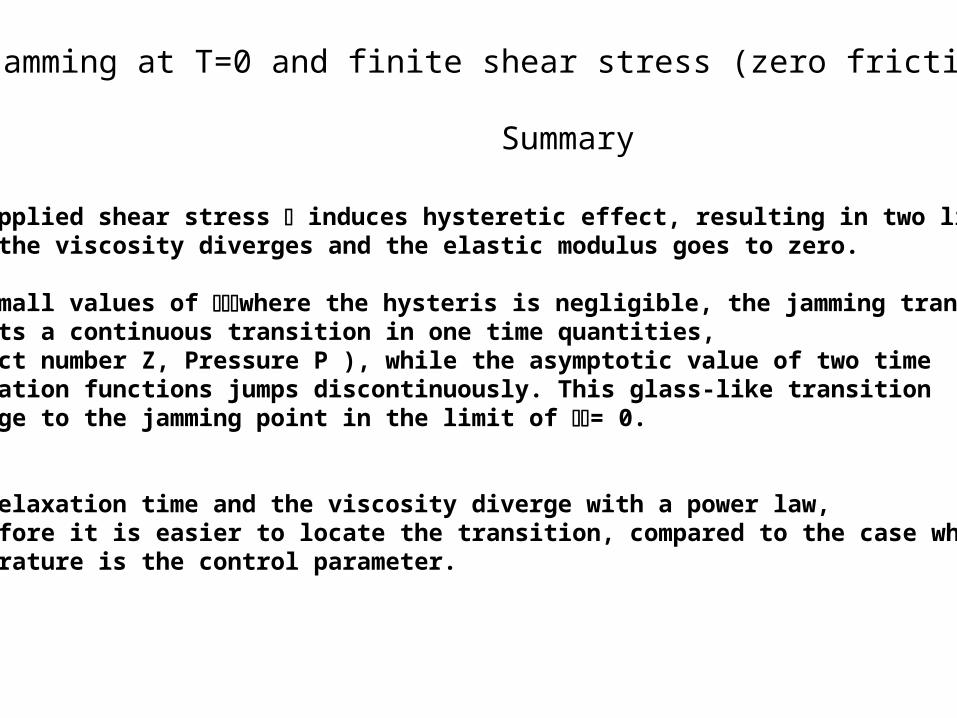
Jamming at T=0 and finite shear stress (zero friction) Summary
•The applied shear stress induces hysteretic effect, resulting in two lines where the viscosity diverges and the elastic modulus goes to zero.
•For small values of where the hysteris is negligible, the jamming transition, exhibits a continuous transition in one time quantities, (contact number Z, Pressure P ), while the asymptotic value of two time correlation functions jumps discontinuously. This glass-like transition converge to the jamming point in the limit of = 0.
•The relaxation time and the viscosity diverge with a power law, therefore it is easier to locate the transition, compared to the case where the temperature is the control parameter.
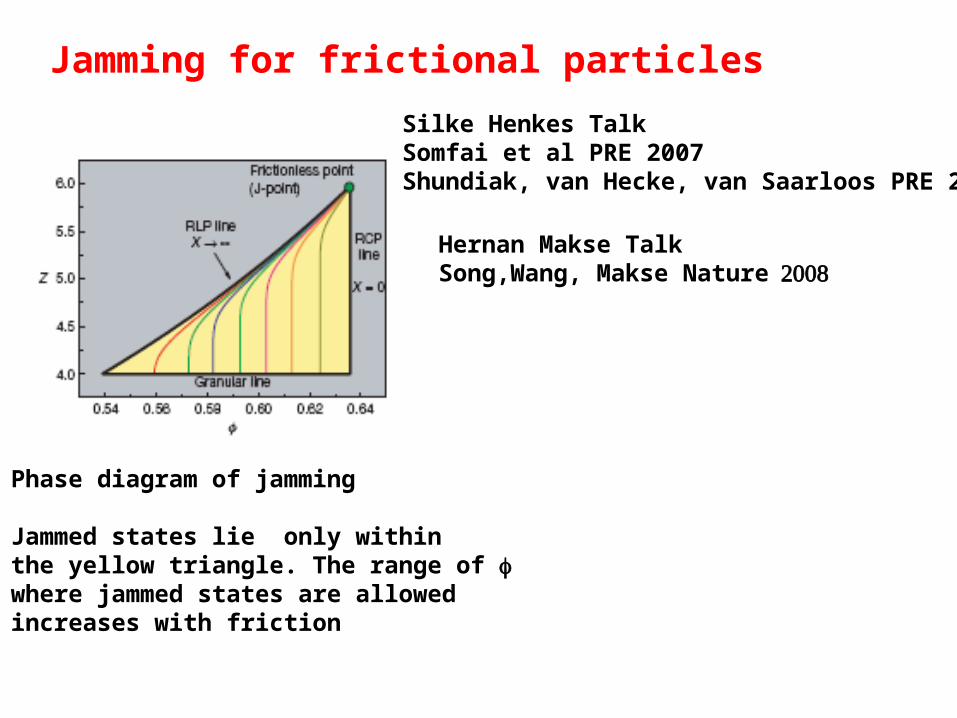
Hernan Makse TalkSong,Wang, Makse Nature
Jamming for frictional particles
Phase diagram of jamming
Jammed states lie only within the yellow triangle. The range of where jammed states are allowed increases with friction
Silke Henkes TalkSomfai et al PRE 2007Shundiak, van Hecke, van Saarloos PRE 2007
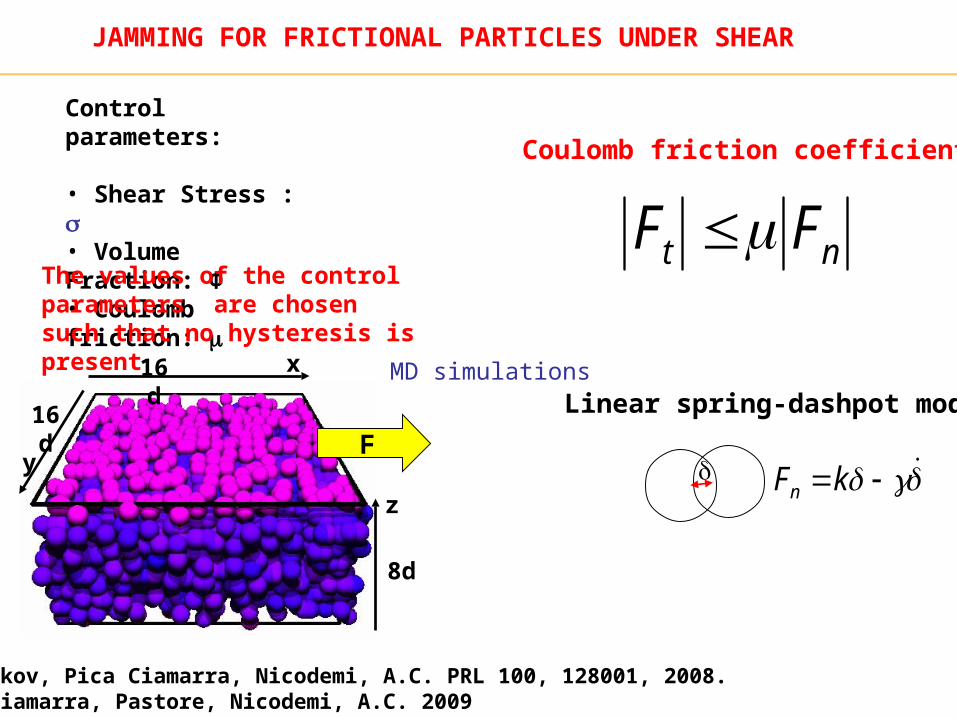
Grebenkov, Pica Ciamarra, Nicodemi, A.C. PRL 100, 128001, 2008.Pica Ciamarra, Pastore, Nicodemi, A.C. 2009
Lz Linear spring-dashpot model
nt FF Coulomb friction coefficient
kFn
8d
z
x16 d
16 d
yF
Control parameters: • Shear Stress : • Volume Fraction: Φ • Coulomb friction:
MD simulations
The values of the control parameters are chosen such that no hysteresis is present
JAMMING FOR FRICTIONAL PARTICLES UNDER SHEAR
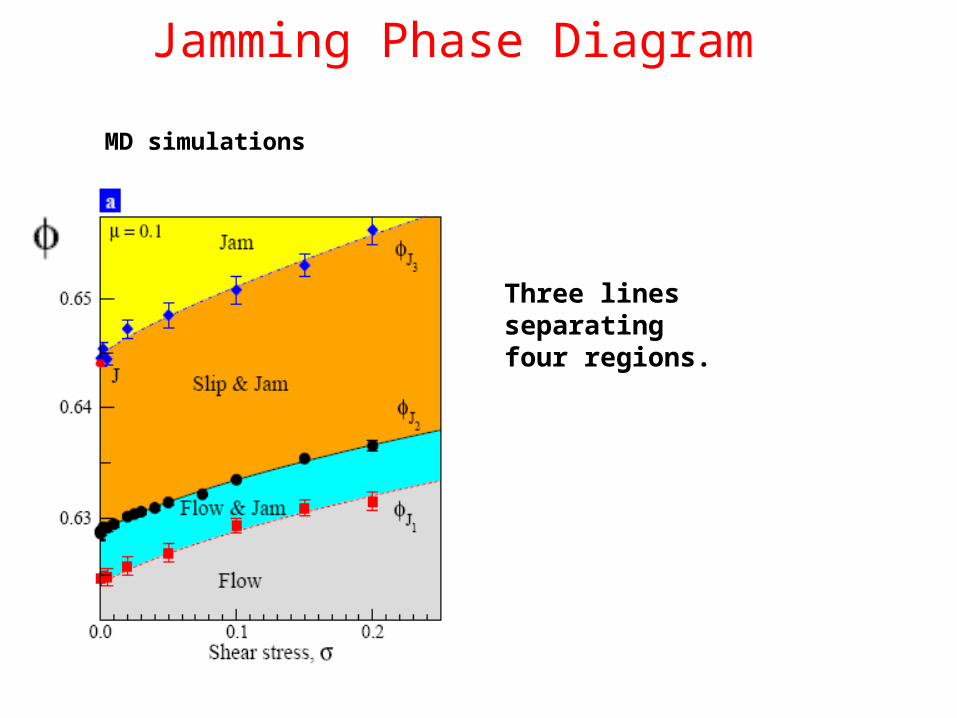
Jamming Phase Diagram
Three lines separating four regions.
MD simulations
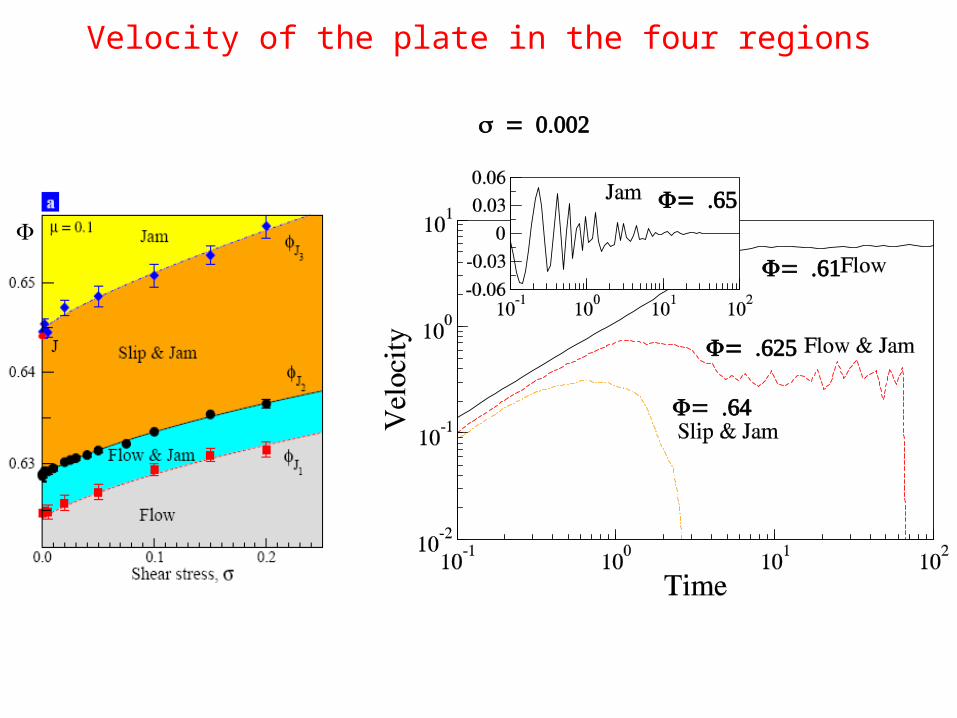
Velocity of the plate in the four regions
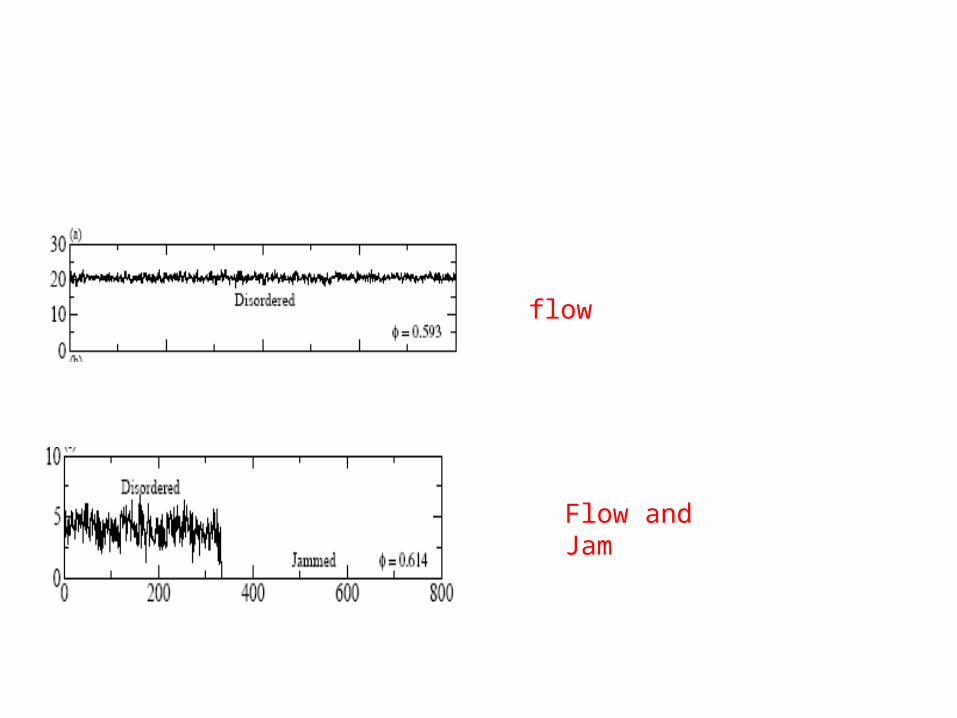
flow
Flow and Jam
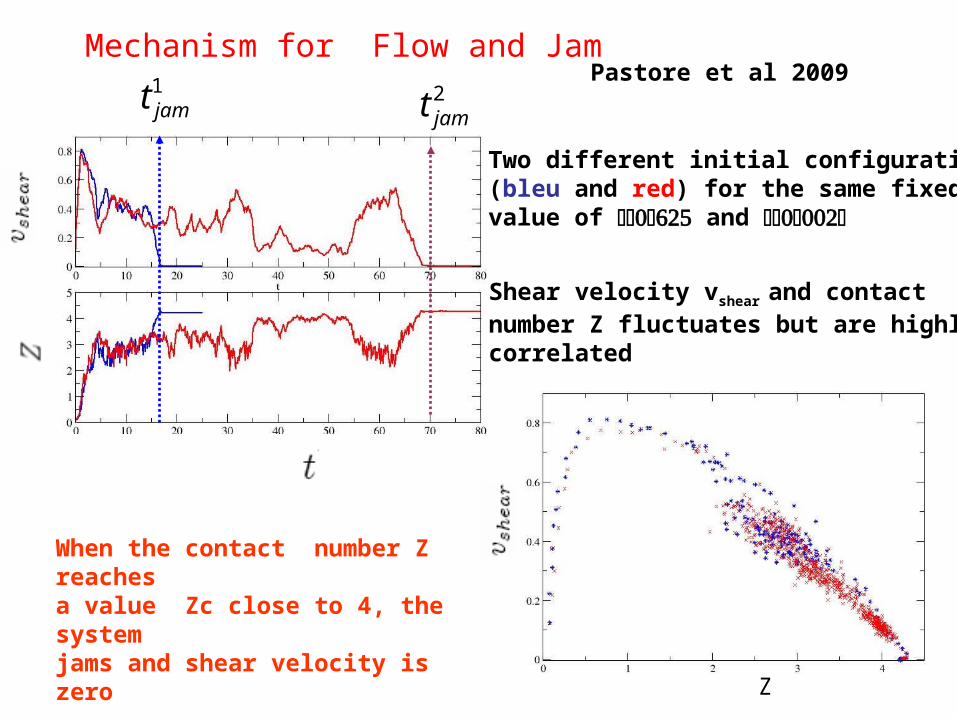
Shear velocity vshear and contactnumber Z fluctuates but are highly correlated
Mechanism for Flow and Jam
When the contact number Z reaches a value Zc close to 4, the system jams and shear velocity is zero
Two different initial configurations(bleu and red) for the same fixed value of and
1jamt 2
jamt
Z
Pastore et al 2009
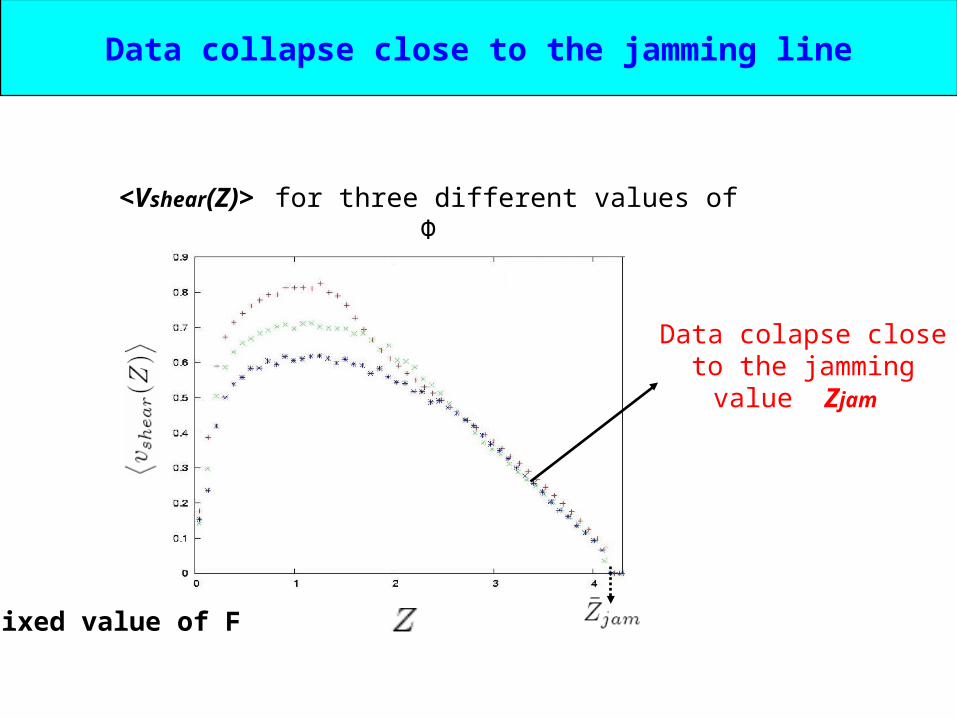
Data collapse close to the jamming line
Data colapse close to the jamming value Zjam
<Vshear(Z)> for three different values of Φ
Fixed value of F
The flow and jamming region is found to shrink when the number of particles gets larger, due to the decrease of fluctuations of the contact number Z.
However the flow and jamming region is present even when the number of particles N is of the order of 20000.
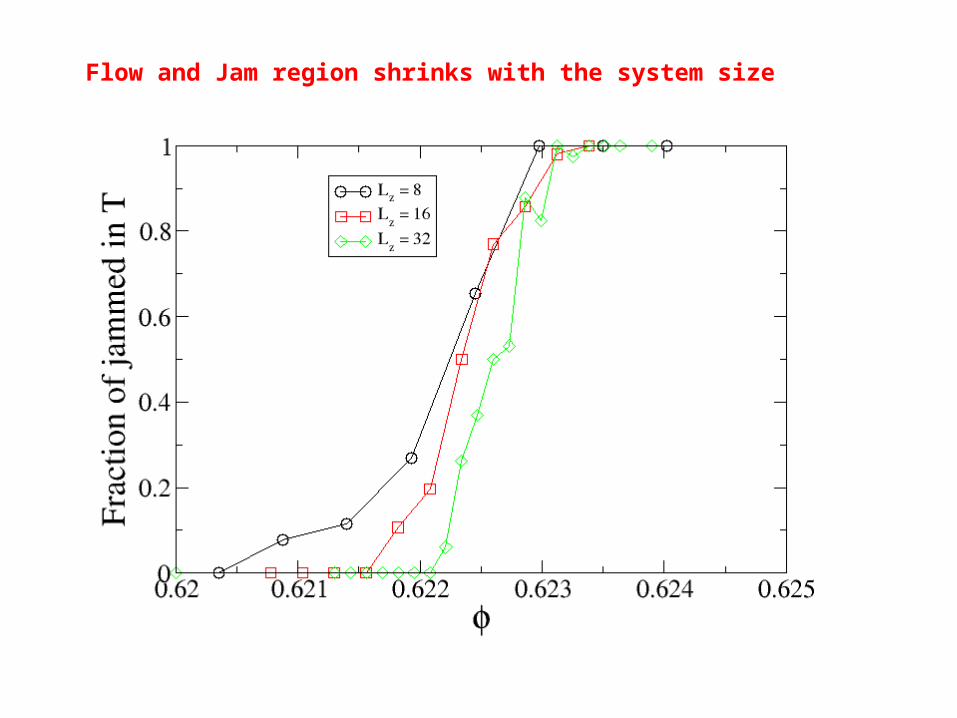
Flow and Jam region shrinks with the system size
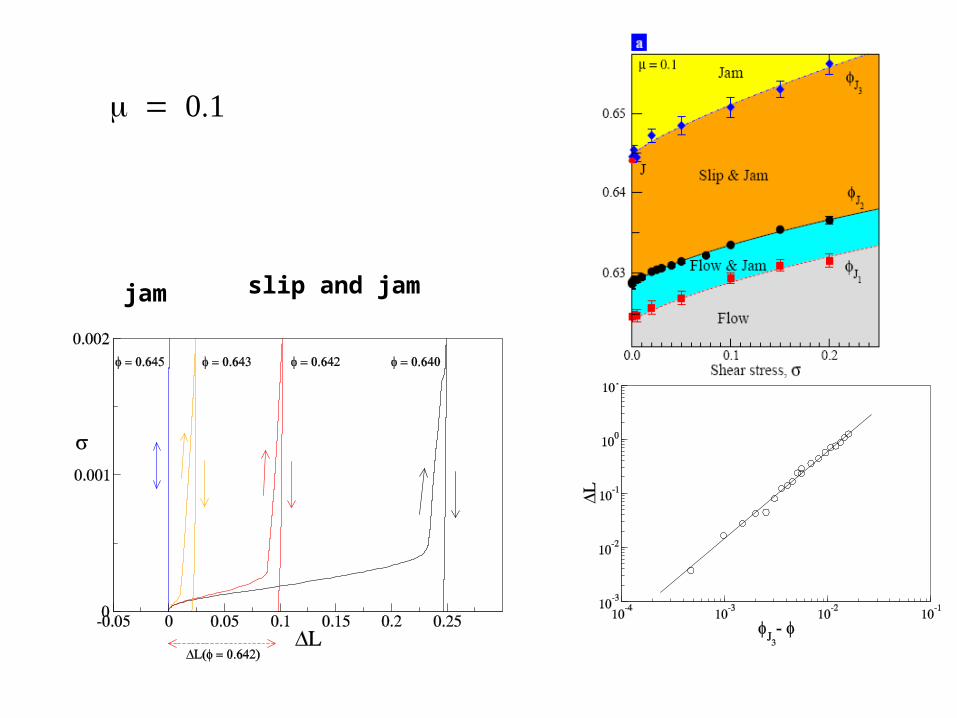
jam slip and jam
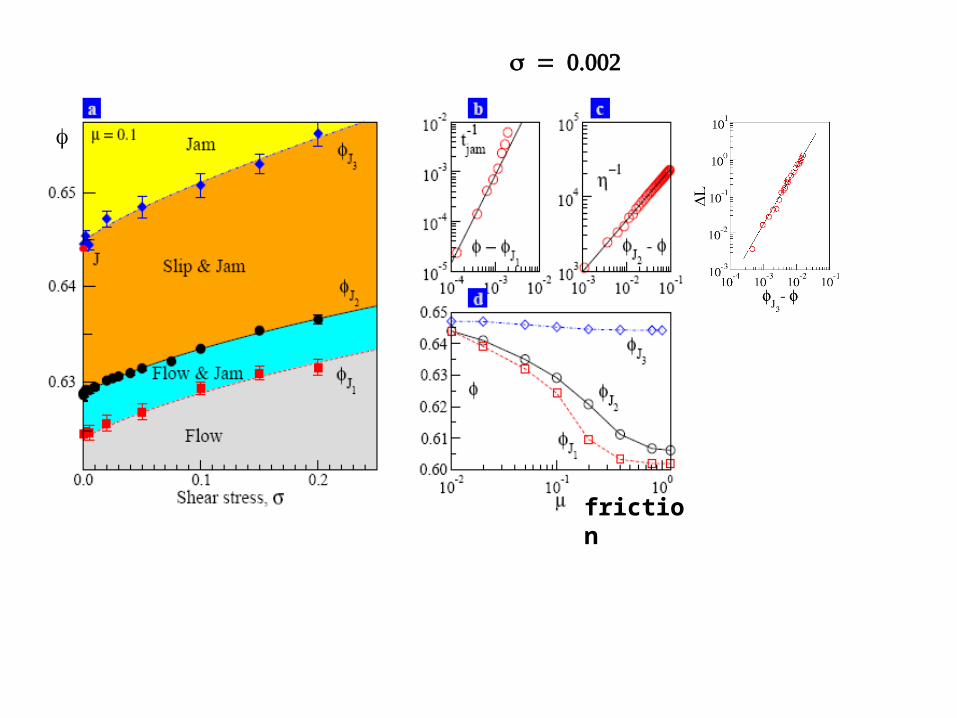
friction
=0.1
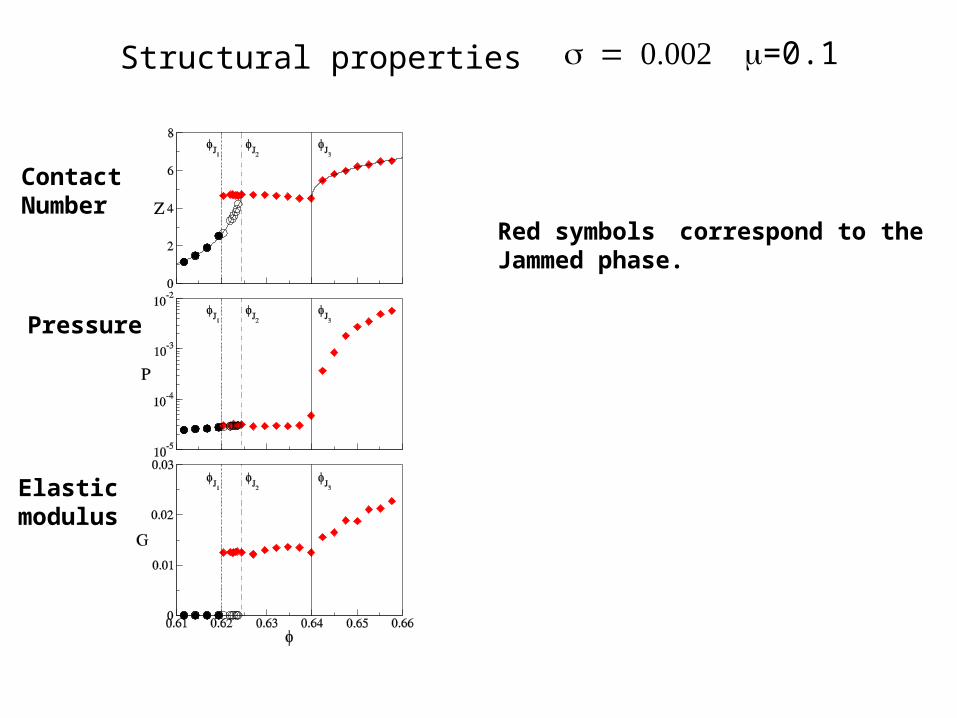
ContactNumber
Pressure
Elastic modulus
Structural properties
Red symbolscorrespond to theJammed phase.
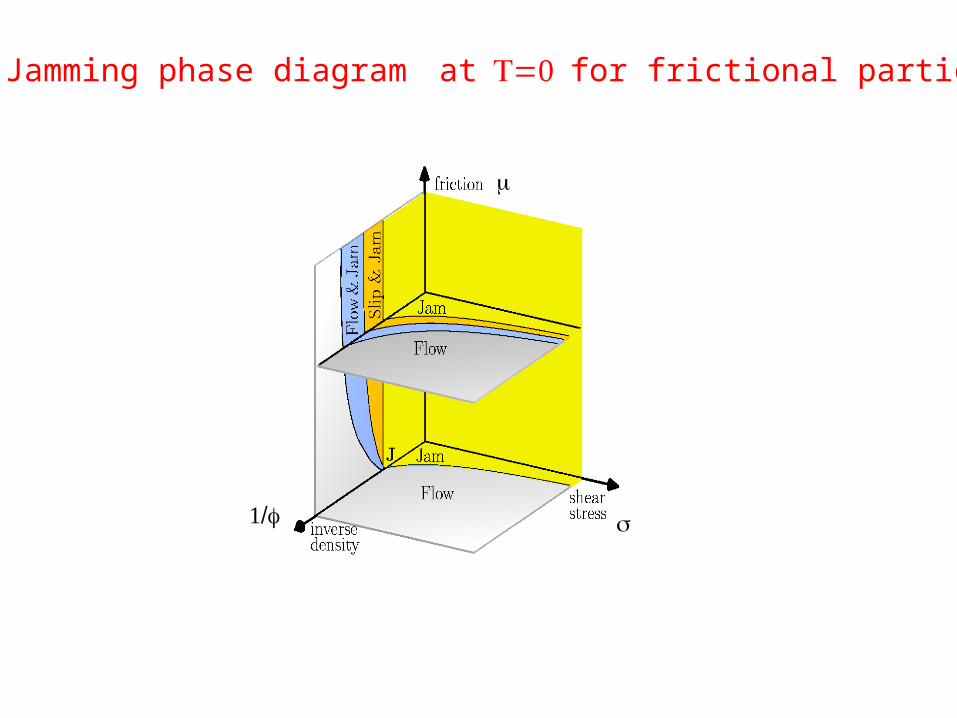
Jamming phase diagramatfor frictional particles
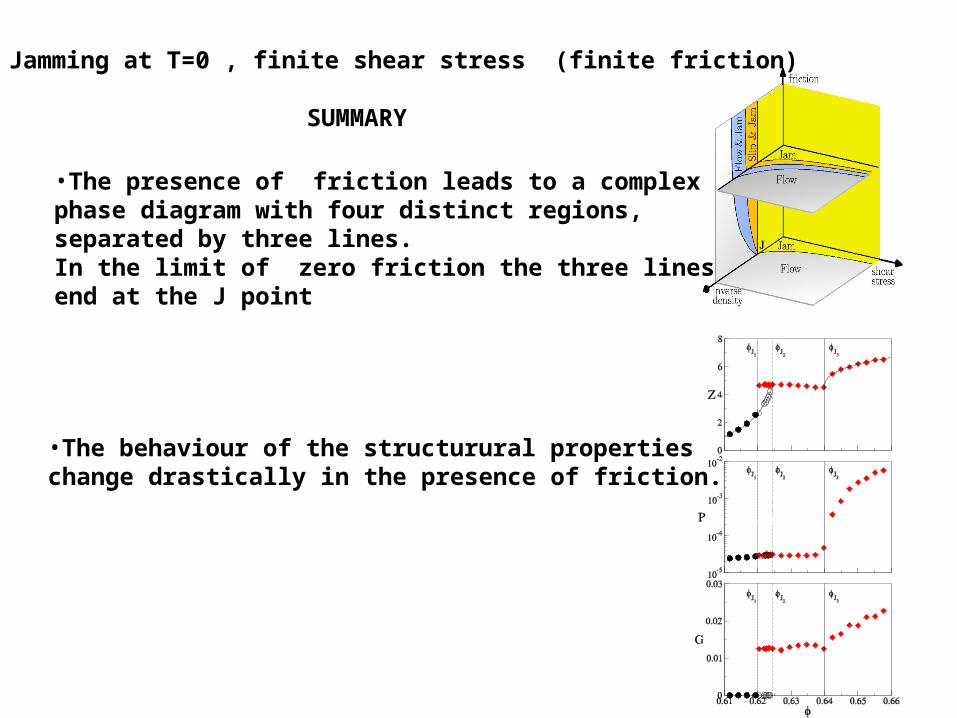
Jamming at T=0 , finite shear stress (finite friction)
•The presence of friction leads to a complex phase diagram with four distinct regions, separated by three lines.In the limit of zero friction the three linesend at the J point
•The behaviour of the structurural properties change drastically in the presence of friction.
SUMMARY