Embed Size (px)
Citation preview

The role of fault zones on structure, operation and
prospects of geothermal reservoirs
-
A case study in Lahendong, Indonesia
Dissertation
zur Erlangung des mathematisch-naturwissenschaftlichen Doktorgrades
"Doctor rerum naturalium"
der Georg-August-Universität Göttingen
im Promotionsprogramm Geowissenschaften
der Georg-August University School of Science (GAUSS)
vorgelegt von
Maren Brehme
aus Berlin
Göttingen 2015

Betreuungsausschuss
Prof. Dr. Martin Sauter, GZG – Abteilung Angewandte Geologie,
Universität Göttingen
Prof. Dr. Günter Zimmermann, Internationales Geothermiezentrum –
Helmholtz-Zentrum Potsdam, Deutsches GeoForschungsZentrum
GFZ
Mitglieder der Prüfungskommission
Referent:
Prof. Dr. Martin Sauter, GZG – Abteilung Angewandte Geologie,
Universität Göttingen
Korreferent:
Prof. Dr. Günter Zimmermann, Internationales Geothermiezentrum –
Helmholtz-Zentrum Potsdam, Deutsches GeoForschungsZentrum
GFZ
weitere Mitglieder der Prüfungskommission:
Prof. Dr. Ernst Huenges, Internationales Geothermiezentrum –
Helmholtz-Zentrum Potsdam, Deutsches GeoForschungsZentrum
GFZ
Dr. Iulia Ghergut, GZG – Abteilung Angewandte Geologie, Universität
Göttingen
Dr. Simona Regenspurg, Internationales Geothermiezentrum –
Helmholtz-Zentrum Potsdam, Deutsches GeoForschungsZentrum
GFZ
Dr. Bettina Wiegand, GZG – Abteilung Angewandte Geologie, Universität
Göttingen
Tag der mündlichen Prüfung: 7.4.2015

i
Eidesstattliche Erklärung
Hiermit erkläre ich, dass ich die vorliegende Dissertation selbstständig verfasst und keine anderen
als die angegebenen Hilfsmittel genutzt habe. Alle wörtlich oder inhaltlich übernommenen Stellen
habe ich als solche gekennzeichnet. Ich versichere außerdem, dass ich die vorliegende
Dissertation nur in diesem und keinem anderen Promotionsverfahren eingereicht habe und, dass
diesem Promotionsverfahren keine endgültig gescheiterten Promotionsverfahren vorausgegangen
sind.
_____________________ Ort, Datum ______________________________ Unterschrift

ii

iii
Bu tezi sevgili hocama adanmıştır.
Bana en güzel ve en önemli seyler öğreten hocam.

iv

v
Short Summary
Expiration of fossil fuels and climate irregularities directs the energy demands towards
renewable energy sources for the energy supply in future. In this frame, geothermal energy
gives a substantial contribution to the strategies of renewable-source based energy production.
Efficiency of this component requires to develop new geothermal sites and to improve the
performance of existing systems. The main contribution of geoscience is to optimize and
characterize the potential of geothermal sites.
One of the essential steps of reservoir characterisation is the understanding of fluid flow in the
reservoir. Fluid flow in tectonic active areas is mainly controlled by fault zones. In this study,
structural mapping and hydrogeological analysis is used to provide insights into the regional
reservoir setup. Here, geohydrochemical analysis is performed to characterize fluid- and rock-
composition and the interaction between fluids and rocks. On the other hand, numerical
simulations are used to explain the role of fault hydraulic conductivity and fluid properties on
temperature and pressure distribution in the study area.
The study area is the high-enthalpy geothermal field Lahendong in Sulawesi-Indonesia. It
hosts a producing geothermal power plant producing 80 MW of electricity. Geoscientific
investigations in the Lahendong geothermal field have started early 1970s. However, the
evolution and distribution of thermal fluids within the target area is still in debate. The present
day conceptual model shows that the geothermal field consists of two sub-reservoirs separated
by horizontally less permeable fault zones. Brine of low pH is predominantly seen in the north
while moderate pH fluids exist in the south and east. Accordingly, production rates vary
between the northern and southern parts by a factor of five. However, faults behave
permeable sub-parallel to the strike. Therefore, hot springs arise mostly along or at junction of
faults. Lahendong area is characterized by basaltic andesite, tuff and volcanic breccia.
Detailed investigations on hydraulic conductivity of fault zones show that faults either act as
fault-normal flow barriers due to sealing of the fault core, or as conductive pathways in the
damage zone sub-parallel to the fault strike. The damage zone, especially in case of
extensional faults, is characterized by fractures. The impermeable fault core is a barrier
between one reservoir section, which is characterized by acidic water, considerable gas
discharge, high productivity and strongly altered and fractured rocks and another section,
which hosts pH-neutral waters, high temperatures and less altered rocks. Those reservoir
conditions observed on-site have been converged in numerical hydrochemical models. The
fault-controlled vertical and horizontal fluid flow is used to simulate different reservoir
sections. Recharge and discharge in the model occurs along the faults. However, fluid flow is
also influenced by fluid phase transition. Steam propagation at top of faults stimulates vertical
fluid rise, because steam propagates faster due to lower density. Therefore, in case of 2-phase

vi
flow simulations, permeabilities have to be lower to satisfy same pressure and temperature
conditions.
The main contribution of this study is to show that systematically performed structural
analysis helps to understand the fluid flow in geothermal reservoirs. It has been confirmed
that the hydrotectonic concept combining the tectonic and hydrogeological information
essentially improves the understanding of subsurface flow of thermal fluids, which is the
basic source of geothermal power plants. This is crucial for site selection and smart drilling
strategies, which supports a sustainable exploitation of the geothermal field avoiding risks,
such as low-productive wells or the production of highly corroding waters. Results also guide
reservoir management in case of a potential for field extension, as performed in Lahendong.

vii
Kurzfassung
Der weltweit steigende Energiebedarf stellt die Menschheit vor immer größere
Herausforderungen. Im Angesicht des Klimawandels und der begrenzten Verfügbarkeit von
fossilen Energieträgern liegt eine besondere Verantwortung bei der Entwicklung von
erneuerbaren Energieressourcen. Dabei spielt die Geothermie eine besondere Rolle, da sie zur
Deckung der Grundlast geeignet ist. Zu der Bewertung von geothermischen Potentialen
leisten die Geowissenschaften einen großen Beitrag.
Das geothermische Potential eines Standorts hängt vor allem von der Art und Ausbreitung
von Störungszonen ab, da sie wesentlich den Grundwasserfluss kontrollieren. In dieser Arbeit
werden verschiedene geowissenschaftliche Methoden miteinander kombiniert, um die
Wirksamkeit von Störungszonen zu bewerten. Strukturgeologische Kartierungen und
hydrogeologische Felduntersuchungen erklären die Ausbreitung und hydraulische Funktion
von Störungszonen im Untersuchungsgebiet. Geohydrochemische Untersuchungen geben
Auskunft über Fluid- und Gesteinszusammensetzung und deren Wechselwirkungen.
Numerische Simulationen des Gebietes zeigen, dass sowohl Störungszonen als auch
Fluideigenschaften wichtig für die Verteilung von Druck und Temperatur im Reservoir sind.
Das Untersuchungsgebiet ist das Hochenthalpy-Geothermiefeld Lahendong in Sulawesi
(Indonesien). Ein Kraftwerk produziert hier 80 MW Elektrizität. Die ersten Untersuchungen
im Gebiet starteten in den 1970er Jahren. Jedoch sind Genese und Verteilung der thermalen
Wässer noch nicht komplett verstanden. Das aktuelle konzeptionelle Modell zeigt eine
Aufteilung in mehrere Reservoirbereiche. Die verschiedenen Bereiche sind durch horizontal
impermeable Störungszonen voneinander getrennt. Den nördlichen Bereich kennzeichnen
saure Wässer und den südlichen Teil pH-neutrale Wässer. Auch die Produktivität variiert
stark zwischen den beiden Reservoirbereichen. In vertikaler Richtung sind Störungszonen
jedoch durchlässig, was dazu führt, dass heiße Quellen entlang von Störungen oder deren
Kreuzungspunkten auftreten. Die Reservoirgesteine in Lahendong sind basaltische Andesite,
Tuffe und vulkanische Brekkzien.
Die Permeabilitätsverteilung der Störungszonen wird durch die Ausbreitung von Rissen
kontrolliert. Risse sind vor allem in der Bruchzone der Störung verbreitet, was zu einer
hydraulischen Durchlässigkeit parallel zur Störung führt. Die Unterteilung des Reservoirs in
Lahendong wird durch diese Rissverteilung bestimmt. Der nördliche saure Teil des Reservoirs
ist durch höhere Produktivitätsraten, Gasaustritte an der Oberfläche und stark alterierte und
geklüftete Gesteine im Untergrund charakterisiert. Der südliche Abschnitt ist heißer und hat
weniger stark alterierte Gesteine. Die beobachteten Reservoireigenschaften wurden von
hydrochemischen und hydraulischen Modellierungen bestätigt. Der Grundwasserfluss mit
Neubildung und Austritten aus dem Reservoir ist im Gelände und im Modell vor allem durch

viii
Störungszonen kontrolliert. Jedoch ist der Grundwasserfluss auch durch den Aggregatzustand
des Wassers beeinflusst. Für die Modellierung von 2-Phasen-Ausbreitung müssen die
Permeabilitäten angepasst werden, um gleiche Temperatur- und Druckbedingungen zu
modellieren.
Der Hauptbeitrag dieser Arbeit liegt in der Demonstration, dass eine systematische
strukturgeologische Analyse für das Verständnis von Grundwasserfluss in geothermischen
Reservoiren unentbehrlich ist. Es wurde bestätigt, dass die Kombination von tektonischen,
hydrogeologischen und geohydrochemischen Informationen den wichtigsten Beitrag für das
Verständnis von Grundwasserströmungen leistet. Die Grundwasserströmung ist der wichtigste
Faktor für die Wahl des richtigen Standortes für Produktion und Injektion in geothermischen
Feldern. Eine detaillierte Analyse gewährleistet eine nachhaltige Nutzung des Feldes und
verringert Risiken, wie schwach produzierende Bohrungen oder die Produktion von stark
korrosiven Wässern. Auf dieser Grundlage kann eine Felderweiterung geplant werden, wie es
in Lahendong angedacht ist.

ix

x

xi
Table of Contents
Kurzfassung .............................................................................................................. vii
Table of Contents ...................................................................................................... xi
List of Figures ......................................................................................................... xiii
List of Tables ............................................................................................................ xv
1 Introduction .......................................................................................................................... 1
1.1 Objective ....................................................................................................................... 1
1.2 State of knowledge at the Lahendong geothermal site .................................................. 3
Structural-geology ...................................................................................................... 3
Geochemistry ............................................................................................................. 4
Well-log analysis ........................................................................................................ 4
Geophysics ................................................................................................................. 4
Numerical reservoir simulation .................................................................................. 4
1.3 State of the art in characterizing fault-controlled geothermal systems ......................... 5
1.3.1 Physical set-up of faults ......................................................................................... 5
1.3.2 Characterizing the efficiency of fault zones ........................................................... 6
1.3.3 Geometry of and subsurface fluid flow in fault-controlled geothermal fields ....... 7
1.3.4 Geohydrochemistry in fault-controlled geothermal systems ................................. 8
1.3.5 Numerical Simulation of subsurface fluid flow controlled by faults and fluid
properties .......................................................................................................................... 10
1.4 Thesis outline .............................................................................................................. 12
2 Results ................................................................................................................................ 13
2.1 A hydrotectonic model of a geothermal reservoir – A study in Lahendong, Indonesia
.................................................................................................................................... 13
2.1.1 Introduction .......................................................................................................... 13
2.1.2 Setting of the geothermal system Lahendong ...................................................... 15
2.1.3 Methods ................................................................................................................ 19
2.1.4 Results .................................................................................................................. 20
Borehole log data ..................................................................................................... 20
Structural geology in the field .................................................................................. 21
Faults ...................................................................................................................... 21
Joints ....................................................................................................................... 23
Temporal evolution of the two stress regimes ....................................................... 23
Fluid properties ........................................................................................................ 25
Hydrochemical patterns .......................................................................................... 25
Hydraulic characteristics ........................................................................................ 28
2.1.5 Permeability characteristics of fault zones ........................................................... 29
2.1.6 Conclusions .......................................................................................................... 32

xii
2.2 Geohydrochemical processes controlled by fault permeability in the Lahendong
geothermal field .................................................................................................................... 35
2.2.1 Introduction .......................................................................................................... 35
2.2.2 Methods ................................................................................................................ 36
Water sampling and analysis .................................................................................... 36
Rock sampling and analysis ..................................................................................... 37
Geohydrochemical model ........................................................................................ 37
Geothermometer ....................................................................................................... 38
2.2.3 Results .................................................................................................................. 40
Water ........................................................................................................................ 40
Rocks ........................................................................................................................ 43
Geohydrochemical model ........................................................................................ 46
Geothermometer calculations ................................................................................... 47
2.2.4 Discussion ............................................................................................................ 48
2.2.5 Conclusion ............................................................................................................ 52
2.3 Influence of fault zones and fluid-properties on subsurface fluid flow in the
Lahendong geothermal field - insights from numerical simulations .................................... 53
2.3.1 Introduction .......................................................................................................... 53
2.3.2 Precondition ......................................................................................................... 55
Hydrogeological set-up ............................................................................................ 55
Lithology .................................................................................................................. 55
2.3.3 Model set-up and parameter estimation ............................................................... 56
FEFLOW-model ....................................................................................................... 56
TOUGH2-model ....................................................................................................... 58
2.3.4 Results .................................................................................................................. 58
Parameter testing ...................................................................................................... 59
Pressure .................................................................................................................... 59
Temperature ............................................................................................................. 60
2-phase ..................................................................................................................... 60
2.3.5 Discussion ............................................................................................................ 61
2.3.6 Conclusion ............................................................................................................ 64
3 Conclusions and outlook .................................................................................................... 67
Acknowledgements .................................................................................................. 71
4 References .......................................................................................................................... 73
Curriculum vitae ....................................................................................................................... 83

xiii
List of Figures
Fig. 1 Topographic map showing the location of the study area 3
Fig. 2 Schematic set up of a strike slip fault zone with fractured damage zones (Gudmundsson et al., 2001) 5
Fig. 3 Fluid flow along fault zones with fluid rise and infiltration in permeable fault damage zones 8
Fig. 4 Two different reservoir sections separated by an impermeable fault zone 9
Fig. 5 Different hydraulic conditions at each side of the fault lead to 2-phase propagation and different
reservoir pressures 11
Fig. 6 Location of the study area and wells at Lahendong, North Sulawesi. Deviated wells are shown as lines,
vertical wells as dots 14
Fig. 7 Tectonic setting in East Indonesia and North Sulawesi 16
Fig. 8 Cross-sections in the northern and southern well clusters as shown in Figs. 1 and 4 with geological
layering, fault location, temperature distribution, casing of wells and reservoir location according to
hydrochemical and borehole data 18
Fig. 9 Conceptual structural model of the tectonic elements observed in the study area (lineaments in black:
Phase I, lineaments in green: Phase II, details in Fig. 5) including prominent examples of outcrop information
(lower hemisphere plot of fault structures and Rose diagrams of fracture distribution in manifestations). In
orange: cross section lines as presented in Fig. 8 20
Fig. 10 (Top) Focal mechanisms and lower hemisphere plot of two stress phases acting in Lahendong with
maximum and minimum stress direction and the induced faults in top view. (Below) Secondary structures in
Phase I induce dilational and compressional step-over regions. Picture: Example for temporal evolution: N-S
striking normal fault cuts a NE-SW striking strike-slip fault 22
Fig. 11 Location of sampled spring, lake and river water in the study area and their location relative to faults
(properties in Table 1) 27
Fig. 12 Schematic explanation of the acid water evolution by degassing magma under Lake Linau. Meteoric
water (blue) infiltrates through fractures along normal faults and mixes with gases (orange) from the
magma source (red) and already acidified water (green) before rising again 28
Fig. 13 Different groundwater flow systems with hydraulic head distributions dominated by fault structures.
Black numbers are elevations of wells where the hydraulic head was measured, to explain the location of
artesian conditions. Discharge measurements in rivers with discharge in L/s show water losses in the river
across normal faults 30
Fig. 14 Hydrotectonic conceptual model showing the different reservoir compartments in Lahendong (acid:
green colour and neutral: blue colour) 32
Fig. 15 Topographic map of the study area with main faults and hydrochemical characteristics (EC: electrical
conductivity, T: temperature). Red and black lines show deviated wells (modified from Brehme et al., 2014) 36
Fig. 16 Plot of water samples in Giggenbach-diagram correlating Cl-, SO4- and HCO3, (A) well water, (B)
spring water. Green: acidic water, blue: neutral water. M11 and M14 are not shown due to missing HCO3
concentrations 41
Fig. 17 Plot of pH with SO4 for (A) reservoir water and (B) hot spring samples. Green: acidic water, blue:
neutral water 42
Fig. 18 Correlation of B with Cl of reservoir water with respective concentrations and ratios. Green: acidic
water, blue: neutral water, concentrations in mg/L 43
Fig. 19 Top: Photographs of core samples from geothermal wells representing different rock types (breccia
and andesite) with their main components (B&C) and examples for porosity (A&D) 44
Fig. 20 XRD patterns from surface rock samples (evaluated by Rietveld and EVA). GS9 as example for
unaltered andesite, GS5-1, 5-3, 5-5 and GS15-A are highly altered samples with main phases as indicated 46

xiv
Fig. 21 Comparison of modelled and measured reservoir temperatures based on well water samples (A) and
hot spring samples (B). Acidic samples in green, neutral samples in blue 48
Fig. 22 Conceptual geohydrochemical model of the study area, described by cross-sections with geological
layering, fault location, temperature distribution, sample points and alteration patterns, (modified after
Brehme et al., 2014; Utami, 2011) 50
Fig. 23 Topographic map of the study area with geological features, water and rock sample locations and
model cross section 54
Fig. 24 Cross section of the modelled area with boundary conditions and location of observation points 58
Fig. 25 Modelled temperature and pressure distribution in the study area 60
Fig. 26 Modelled 2-phase distribution in the study area. 1 is 100% steam and 0 is 100% fluid 61
Fig. 27 Modelled versus measured hydraulic head and temperature at selected observation points 62

xv
List of Tables
Table 1 Hydrochemical properties of different types of hot springs and surface water (- : no measurement, M:
Manifestation, L: Lake, RI: River) _________________________________________________________________________________ 23
Table 2 Hydrochemical properties, reservoir temperature, water table, true vertical depth and permeable
zone depth of reservoir water (TVD: true vertical depth, bgl: below ground level, asl: above sea level, colours
from wells refer to the different types and the compartments: see Fig. 14) ____________________________________ 25
Table 4 (A) Reservoir rock composition from core samples, (B) Surface rock composition from XRD analysis,
(C) Selected XRF analysis from surface samples, locations see Fig. 15 __________________________________________ 45
Table 5 PHREEQC calculations of equilibrated and supersaturated minerals (A) in reservoir water (B) in hot
spring water, SI: Saturation Index ________________________________________________________________________________ 47
Table 6 Thermal and hydraulic parameters of the Lahendong reservoir rocks measured in laboratory _____ 56
Table 7 Parameters of the best models obtained in FEFLOW and TOUGH2 ____________________________________ 63

xvi
1
1 Introduction
1.1 Objective
Growing energy demands of human being requires an extension towards renewable energy
sources to provide a healthy energy-nature loop. Furthermore, in the frame of expiration of
fossil fuels and climate irregularities, renewable energy sources play a key role for the energy
supply in future. In order to satisfy the entire demand, the performance of existing energy
systems should be improved while new reserves should be explored. In this context,
geothermal energy gives a substantial contribution to the strategies of renewable-source based
energy production.
Currently, geothermal energy component is being developed in many countries worldwide.
This development is locally accelerated establishing supportive rules developed by
governments, e.g. in Germany (Renewable Energy Law) and Indonesia (Law Nr.23/2003).
Total capacity of the geothermal power plants worldwide remains at 12.1 GWe while the total
potential is estimated to be between 200 and 240 GWe (Bertani, 2015, 2010; Stefansson,
2005). The largest budget of this total amount (29 GWe - 12%) is covered by the Republic of
Indonesia, where the use of geothermal energy is planned to be broadened adding 9.5 GWe
more capacity until 2025 (Erbaş et al., 2011).
The main contribution of geoscience to this developing energy component is to quantify
potential of geothermal sites. The geothermal potential is strongly depending on the
geological characteristics e.g. hydrogeological regime, fluid properties, faults and lithology
(Moeck, 2014). The primary focus, of the study presented here, is the role of fault
zones/fracture networks on operation and potential of geothermal reservoirs. This requires
combination of broad range of multidisciplinary approaches. The challenge is to find the
optimum balance between effort and relevance of adopted methodology to characterize fault
zones/fractures and their effect on reservoir potential.
In this context, potential methods are evaluated to suggest an optimized workflow. The test
ground of this study is located in North-Sulawesi, Indonesia. Lahendong geothermal field is a
magmatic, fault-controlled high-enthalpy geothermal system. The site hosts a producing
geothermal system, which has potential for further development and optimization. In
particular, this study aims at optimizing the use of geothermal potential of the Lahendong
geothermal field. The workflow developed here is generalized for characterization of
geothermal fields with fault-controlled fluid flow.

2
The primary objective of this thesis is to assess the best-available workflow to evaluate the
effect of fault zones on behavior of geothermal reservoirs. In this frame, key questions to be
addressed are:
General questions:
What is the role of fault zones in geothermal fields?
What is the best combination of methods to characterize the efficiency of fault
zones at geothermal sites?
Specific questions:
How do fault zones control the set-up of a geothermal system?
What is the influence of fault zones on subsurface fluid flow?
How do geohydrochemical features change along faulted areas?
What is the best way to numerically simulate a fault-controlled geothermal field?

3
1.2 State of knowledge at the Lahendong geothermal site
The target area, Lahendong geothermal field, is located in North Sulawesi-Indonesia. It hosts
a producing geothermal power plant producing 80 MW of electricity. The site is being
monitored and investigated since early 1970s. Several studies focused on resource of the
Lahendong geothermal field. Investigations basically employ structural-geology,
geochemistry, geophysics, well-logs and reservoir simulation.
Fig. 1 Topographic map showing the location of the study area
Structural-geology
The structural development of Lahendong geothermal field is dominated by volcano-tectonic
depression of Tondano. The region is surrounded by active volcanoes in the north and in the
south (Surachman et al., 1987). The central area is the Linau hydrothermal eruption crater
reflecting rather a hilly topography (Siahaan et al., 2005). The complex tectonic setting
combined with rich volcanic activity resulted in lots of calderas and faults in the target area
and its surrounding. The main faulting zone is located around the Lake Linau consisting of
NE-SW, NW-SE, E-W and N-S striking normal or strike-slip faults (Koestono et al., 2010).
Stratigraphic units in the area exemplify pre- and post-caldera formations. Predominant types
of rocks are andesite, tuff, ignimbrite, sediment intercalations and volcanic breccia
(Sumintadireja et al., 2001).

4
Geochemistry
In the Lahendong area, two basic types of water exist in hot springs, namely, pH neutral and
acidic types. Neutral water covers the southern section of the geothermal field with relatively
low salt content. The acidic water appears in and around the Lake Linau with high SO4
concentration and relatively low temperatures (Koestono et al., 2010). Element concentrations
of the different fluids give rise to specific minerals, which control the mineral composition of
the penetrated rock (Utami, 2011). Sulfate minerals, i.e., arise in rocks penetrated by fluids
with high SO4-concentrations. Furthermore, minerals exposed to high temperatures and
aggressive fluids undergo the process of alteration. The Lahendong reservoir is characterized
by three different alteration zones, e.g., kaolinite-anhydrite, epidote-chlorite and sericite-
actinolite zone. The kaolinite-anhydrite zone represents the acidic alteration effect at
temperatures of 100 – 250°C while the epidote-chlorite zone hosts medium-temperature
minerals, i.e. epidote, chlorite, crystalline quartz, calcite, illite and kaolinite. The sericite-
actinolite zone is associated with a micro-diorite intrusion and temperatures of 300 – 350°C
(Ganda, 1987).
Well-log analysis
Well-logs collected at exploration holes show that the reservoir formation consists of Tertiary
and Quaternary aged volcanic rocks (Sulasdi, 1986). Main rock types are andesite, basalt, tuff,
volcanic breccia and pyroclasts. Lithological and pressure distribution from well-logs show
that the reservoir is in 1100 – 2300 m depth. Pressure distribution is near to hydrostatic
pressure, which indicates a fluid-dominated regime and an overall subsurface fluid flow
direction from S to N (Sumintadireja et al., 2001). This fluid flow controls the temperature in
the reservoir by convection regime. The highest temperature is measured south of Lake Linau
as 300°C at 1000 m depth (Koestono et al., 2010).
Geophysics
The Lahendong area has been previously intensively studied using geophysical approaches.
Investigations focus on the central study area hosting the main upflow zones. The center of
the study area, the Linau Caldera, is projected in gravity data in the same shape as at surface.
The reservoir extent in vertical axis is visible in magnetotelluric data. Resistive structures,
which represent the reservoir, appear at 500 m depth in the north and at 1500 m depth in the
south. The reservoir is overlain by a non-resistive cap rock. Location of this low resistivity
cap rock correlates with the main upflow area. Outflow from the reservoir goes through
geothermal manifestations, such as hot springs and fumaroles (Sumintadireja et al., 2001).
Numerical reservoir simulation
Available three-dimensional model for the Lahendong area shows the system in natural state
before production start. It forecasts the performance of the system for the next 30 years. The
fit of the model to the measured data depends on the data quality. Modeled scenario forecasts

5
that the production of 60 MWe for a time period of 30 years leads to a pressure drop of 10 bar
(Yani, 2006).
1.3 State of the art in characterizing fault-controlled geothermal
systems
1.3.1 Physical set-up of faults
Internal structure of fault zones is in principle the same for all fault types. The central fault
core is surrounded by two symmetrically arranged fracture zones (Fig. 2). Dimension of core
and distribution of fractures are varying depending on fault history. The faults are classified in
terms of degree of fracturing as thin/wide fracture zones with a distinct/small fault core
(Caine et al., 1996).
The temporal evolution of a fault zone develops as follows: 1) The fractured damage zone
initiates to evolve under the control of local stress conditions in the host rock. 2) Fractured
areas are partially transferred into fault core merging and rotating the rock fragments (Billi et
al., 2003). 3) Filling the fractures by those small rock particles builds the fault core and leads
to less permeability, while the fractured zones remain permeable in direction of fracture
opening, e.g. sub-parallel to the strike. This is why faults can be impermeable perpendicular
to fault plane while being permeable parallel to the strike of the fault. Hydraulic conductivity
of fault zones varies up to ten orders of magnitude independent from the fault type (Caine et
al., 1996).
Fig. 2 Schematic set up of a strike slip fault zone with fractured damage zones (Gudmundsson et al., 2001)

6
However, understanding hydraulic conductivity of faults is still in debate due to their complex
set-up and limited in-situ observations (Aydin, 2000; Fairley, 2009). The hydraulic
conductivity of faults can be determined by permeability measurements of rock samples from
the faulted area. Permeability is measured in-situ or in the laboratory or can be estimated by
geohydrochemical or geophysical analysis or numerical reservoir modeling. Permeability
dominates the behavior of fluid flow in the subsurface even in micro-scale. Therefore,
detecting permeability variations requires high-resolution methods. Measurement points have
to be in a proper set-up to detect even small varieties in permeability (Antonellini and Aydin,
1994; Barton et al., 1995; Evans et al., 1997; McDermott et al., 2006; Zimmermann et al.,
2000).
1.3.2 Characterizing the efficiency of fault zones
Sustainable operation of a geothermal site requires a detailed understanding of subsurface
fluid flow. In tectonic active areas fluid flow is mainly controlled by hydraulic conductivity of
the fault zone. The faults control the flow rate, flow direction and hydrochemistry through a
geothermal area. In particular, faults act as barriers, conductors or composite systems against
the fluid flow depending on their state within the surrounding stress-field (Moeck and Dussel,
2007).
Investigation of a geothermal site starts with first exploration period where the main focus is
to characterize faults, their stress field and the resulting hydraulic efficiency. This initial
information is updated integrating the results from borehole measurements or numerical
simulations. Final model for the fault network is developed based on location, geometry and
the other properties of the surrounding faults compiling all available information obtained
from structural geology, geochemistry, geophysics, well testing and reservoir modeling
(Hatherton et al., 1965; Hochstein, 1990; Wanjie, 2012).
Geological and structural measurements are performed through the outcrops and eventually
combined to generate structural-geological map of the target area. The structural data are
further analyzed to understand regional stress field. The field studies are extended towards
understanding the properties of surface water, such as hot springs, creeks and lakes as well as
rocks. Those geochemical and hydrogeological investigations are performed analyzing
physicochemical and physical parameters in the laboratory, e.g., major ions of gas and water
samples, rock composition and permeability.
Geophysical approaches are implemented to cover deeper depth ranges. Approaches use the
different responses of subsurface layers to addresses different issues at depth, such as bedrock
basement, structural displacements, distribution of alteration and water saturation. The
methods comprise gravity, magnetotelluric, seismic and electrical resistivity studies.
Furthermore, well-logs provide directly measured subsurface data. Here, the most important

7
measurements are temperature, pressure, porosity and alteration patterns. Finally, a numerical
model is designed based on all available data to reconstruct the initial state of the field and
afterwards forecast spatiotemporal behavior of the reservoir.
The methods to be used are selected considering the scale of interest. Surface observations are
flexible in spatial sampling frequency as long as the structural or geological features are
available, e.g., hot springs or outcrops. Geophysical techniques are able to satisfy a resolved
scale of meters depending on topography and field accessibility. Well-logging samples only
one spot at surface but provides a high resolution in vertical axis. The amount of field
observations as well as well-log measurements determines the resolution of numerical
modeling, which is used to understand evolution of the geothermal field.
It is important to understand the fault set-up in detail in order to elaborate on production and
injection sites and ultimately to place new wells, which will enhance the sustainability of the
geothermal system. In this study, a proposed scheme of combined methods is used to better
characterize geothermal potential of green fields as well as to optimize the performance of
producing geothermal systems.
1.3.3 Geometry of and subsurface fluid flow in fault-controlled geothermal
fields
Since the early 1970´s, hydrothermal systems have been investigated using structural and
geological approaches (Nukman, 2014). These investigations show that the most prominent
geothermal sites have been found in the vicinity of active fault systems (Nukman and Moeck,
2013). Especially, fault intersections host appropriate physical settings for geothermal sites as
the permeability and therefore the fluid flow is substantially enhanced at such spots (Curewitz
and Karson, 1997). The influence of faults/fractures on fluid flow is obviously seen at hot
springs located along the fault zones (Fig. 3). In that frame, the structural variation as well as
the hot spring locations along the fault zones should be investigated to understand subsurface
permeability and its control on fluid flow (Moeck, 2014).
At the Taupo Volcanic Zone the permeability and therefore the fluid flow is enhanced at
highly fractured regions, resulting in upward movement of water towards the hot springs at
surface (Rowland and Sibson, 2004). Another example is located at the Ohaki geothermal
site, where conjugate active fault zones provide the highest hydraulic conductivity and
therefore the location for the most productive boreholes (Grindley, 1961). The upward
movement of water is not the only reason controlling the fluid flow patterns. Fluid infiltration
into the faults/fractures is also important to consider for characterizing the fluid flow. In
addition, absence of recharge must be avoided to keep up the lifetime of a geothermal system
(Portugal et al., 2000).

8
Similar characteristics have been observed in the Lahendong geothermal area. There is a
systematic relation between hot spring location and fault intersections in the Lahendong field.
Hydraulic conductivity of faults enhances fluid rise towards the surface (Brehme et al., 2014).
Therefore, alignment of hot springs allows locating permeable and highly fractured zones in
case the outcrops are rare due to dense tropical vegetation.
Fig. 3 Fluid flow along fault zones with fluid rise and infiltration in permeable fault damage zones
Combining hydrogeological knowledge obtained from hot springs as well as outcrops
displays an integrated picture of permeability in a geothermal field. However, hydrochemical
properties of rising water provide additional insight into the directional dependence of
permeability within faults. Variations in water types are in general interpreted to represent
different sources in geothermal fields due to large separation distances (Simsek, 2003).
1.3.4 Geohydrochemistry in fault-controlled geothermal systems
Geohydrochemical investigations focus on fluid composition and rock formation through the
geothermal area. This combined information allows understanding the water-rock interaction.
Geohydrochemical measurements, in particular, allow to investigate fluid flow, temperature-
patterns, the ratio between steam and water and scaling/corrosion potential of fluids along the
reservoir field (Arnorsson, 2000). Conclusions are integrated to generate a conceptual model,
which gives a first order idea about the production capabilities as well as the sustainability of
the reservoir.
Productivity of geothermal reservoirs is strongly dependent on subsurface fluid flow that is
enhanced in highly fractured areas leading to enhancement in water-rock-interaction. During
chemical reaction between water and rocks, both change their composition to get into

9
equilibrium stage. This change results in alteration of rocks by dissolution, precipitation or
replacement of minerals. Change in water characteristics are measured by salinity, pH and
temperature. Those measurements are finally used to trace fractured zones since fluid and
rock properties change as a result of high fluid movement. Therefore, geohydrochemical
measurements provide an alternative approach to resolve subsurface structures.
Fig. 4 Two different reservoir sections separated by an impermeable fault zone
Fractured zones cause leakage from the geothermal reservoir, which results in upward
movement of fluids towards hot springs at surface (Fig. 4). The geohydrochemical
investigation of hot springs allows understanding the upward movement because every
substance in water composition acts differently during this process. Boron concentrations, i.e.,
accumulates in a narrow area of the Lardarello geothermal field and resolves the subsurface
temperature, lithology and fluid flow patterns of the field because boron concentration
increase while condensation and precipitates under certain lithological circumstances
(Tonami, 1970). In addition, the extent and the type of alteration patterns give another
constraint to subsurface fluid flow. Quartz-adularia and kaolinite alteration, i.e., is used to
trace main upflow spots in Ohakuri geothermal field (Henneberger and Browne, 1988).
In the Lahendong geothermal field, two different types of water rise at the surface. The fluid
composition controls alteration of subsurface host rocks (Utami, 2011). The higher chemical
activity results in more distinctive alteration patterns. Therefore, performing
geohydrochemical measurements is essential to understand subsurface fluid content and rock
properties in order to verify the processes and the structures controlling the fluid flow.

10
1.3.5 Numerical Simulation of subsurface fluid flow controlled by faults
and fluid properties
Examples from different geological settings show that the geothermal potential increases at
highly fractured areas (Moeck, 2014). Fault-controlled geothermal resources and energy
recovery are nowadays routinely investigated by reservoir modeling (Pruess and Narasimhan,
1982; Sanyal et al., 2000). The models are developed in 2D sections or 3D volumes through
the reservoir depending on the complexity of the reservoir addressed. A starting conceptual
model is defined using a priori information about flow of groundwater, major permeable
zones, recharge and discharge areas and heat flow (O’Sullivan et al., 2001).
A numerical model developed for the Rhine Graben reveals that graben-parallel fluid
convection is controlled by highly permeable faults. It has been understood that major
geothermal systems there evolve as superposition of such permeable faults (Bächler et al.,
2003). In a second model, developed for Basin and Range geothermal site, vertical fluid rise
has been observed along active fault systems. Hydraulic conductivity of fault zones is
therefore the main parameter controlling fluid flow and temperature distribution (Wisian and
Blackwell, 2004). Here, vertical flow paths play an important role for performance of
geothermal fields.
Basically, numerical models are used to represent the natural state of a geothermal system
before start of production. The models are calibrated with real measured data, which are
collected in the field. Modeling results fit the temperature measurements easily while
simulated enthalpy and pressure values give high residuals. This is due to phase change of
water, which substantially changes the pressure and enthalpy in principle. At the Momotombo
geothermal site in Nicaragua flow rates and enthalpies have not been sufficiently converged
by modeling results, especially for the wells producing steam (Porras et al., 2007). This is
caused by complex fluid flow due to changing fluid properties during phase transition. In
consequence, besides the hydraulic conductivity, phase transition controls subsurface fluid
flow in fault-controlled geothermal fields.
Subsurface fluid flow in the Lahendong geothermal field has been simulated using two
numerical models, namely: a thermal-hydraulic model and a 2-phase model. Proposed
pathways for major fluid flow have been confirmed by the numerical models assuming that
most of the fluid flow and heat transport occurs through faults and fractures. However, 2-
phase propagation gives constrain on reconstructing natural temperature, pressure and 2-phase
patterns in the Lahendong reservoir.

11
Fig. 5 Different hydraulic conditions at each side of the fault lead to 2-phase propagation and different reservoir
pressures
However, modeling the Lahendong geothermal field brought certain difficulties during
pressure- and 2-phase-simulation, especially due to simplified representation of reservoir
geometry and therefore imprecise 2-phase distribution in TOUGH2 modeling approach.
Inaccuracy in modeling of pressure distribution is therefore due to 2-phase flow in the
reservoir. Flow velocity and pressure patterns in geothermal reservoir strongly depend on
phase change of hydrothermal fluids. Hydraulic conductivity of faults as well as the fluid
properties are the main parameters controlling the temperature and pressure patterns in a
geothermal field and therefore must be adjusted carefully in order to simulate realistic
reservoir behavior (Fig. 5).

12
1.4 Thesis outline
The primary objective of this thesis is to develop a workflow investigating the effect of fault
zones on behavior of geothermal reservoirs. The fault zones are characterized using various
methods designed for hydraulic conductivity determination. The most feasible methods are
combined to ensure fast and reliable results. This is reasonable in terms of temporal and
financial investment for the assessment of geothermal resources. Furthermore, this study
shows the importance of continuous data update for the performance of producing geothermal
fields. Extension of energy producing fields should be planned based on the knowledge
gained through the combined methods.
The first chapter presents a hydro-/geological approach. Methods used here are structural
mapping, water sampling, tracer experiments and well-log analysis. Results have been
combined to generate a comprehensive conceptual model, which is presented in 2D view. It
explains the local fault network, fluid properties, fluid flow as well as pressure and
temperature distribution. This chapter has been published in ISI Journal - Geothermics as “A
hydrotectonic model of a geothermal reservoir – A study in Lahendong, Indonesia”.
http://dx.doi.org/10.1016/j.geothermics.2014.01.010
The second chapter covers geohydrochemical investigations on water and rock samples
collected in the Lahendong area. The samples are investigated using fluid analysis,
geochemical analysis of rocks, recognition of alteration patterns and numerical simulation of
geohydrochemical and thermal patterns. Results are considered to elaborate on the
composition of water and mineral phases of rocks. Rock-water interaction leads to an increase
in alteration at highly fractured areas. Results show that the fluid flow in faults has a strong
influence on water and rock characteristics. This chapter is ready for submission to an ISI
Journal.
The third chapter presents numerical models, which are developed based on all data gathered
during the geological and geohydrochemical investigations. Additional data are obtained from
thermal as well as hydraulic laboratory measurements. Simulations show the thermal and
hydraulic behavior of the Lahendong geothermal field at natural state. Fault permeability
controls fluid flow in the reservoir. Phase transition of fluids has been observed in fractured
areas at shallow depths. Outcomes are ready for submission to an ISI Journal.

13
2 Results
2.1 A hydrotectonic model of a geothermal reservoir – A study in
Lahendong, Indonesia
2.1.1 Introduction
High temperature geothermal systems are observed along active plate margins that
accommodate different geological settings, e.g. active volcanism at subduction zones or
crustal spreading in extensional regimes. Hochstein (1990) points out that elevated
temperature and a degree of convection are the main controlling factors in the classification of
geothermal systems. High temperature geothermal systems can be further subdivided into
brine-, two-phase- and vapour-dominated systems.
Various exploration methods are employed to investigate undeveloped geothermal resources.
Hochstein (1988) suggests to study surface thermal springs and the geochemistry of surface
and groundwater as a first step in reservoir characterisation. Further, Cumming (2009)
proposes to combine geological observations, analysis of geophysical investigations
especially magnetotelluric resistivity, hydrogeological models, and chemical composition of
fluids in thermal springs to provide insight into the internal functioning of a reservoir system.
One of the essential elements in reservoir characterisation is the assessment of the role of fault
zones and fractures because they control fluid flow in the reservoir as shown by Marques et
al. (2011) and Goyal and Kassoy (1980). The ability of fractures to channel fluids is related to
the present-day stress field which need to be in a favourable orientation for the fractures to
display some aperture to transmit fluids (e.g. Banks et al., 1996; Ferrill and Morris, 2003;
Larsson, 1972).
Caine et al. (1996) suggest a detailed visualisation of the internal fault structure with a fault
core permeability primarily controlled by the lithology and its degree of alteration and the
adjacent fractured damage zone dominating permeability. The damage zone permeability can
be up to 10,000 times larger than the permeability in the fault core (Evans et al., 1997).

14
Fig. 6 Location of the study area and wells at Lahendong, North Sulawesi. Deviated wells are shown as lines,
vertical wells as dots
This overall interaction between state of stress, fault structure, and fluid flow can be described
as hydrotectonics (Moeck, 2005). The author describes the spectrum of fracture permeabilities
by changes in fault orientations resulting in significant variations in fault-normal stresses
despite a homogeneous stress field at a larger scale.
The area of investigation is located in North Sulawesi, East Indonesia and is the location of an
operating geothermal power plant with a production capacity of 80 MWe. North Sulawesi is
dominated by calc alkali potassic volcanism, which is detached from its source due to
migration of the north branch of Sulawesi (Walpersdorf et al., 1998a). Furthermore, North
Sulawesi is influenced by subduction from north and from east. The northern subduction does
not display volcanic activity as is still relatively young (Walpersdorf et al., 1998a). However,
subduction of the Molucca Sea from the east causes arc volcanism (Silver and Moore, 1978).
Such evolved magmas result in ash-flow tuffs consisting of rhyodacites and rhyolites. Lake
Linau located in an explosion crater is the most recent demonstration of this activity (Lécuyer
et al., 1997).
In our study, we use field-based methods (e.g. detailed geological mapping and fault
structure analyses) to provide insight into the regional geology, structural geology,
hydrochemistry, and the hydrogeological regime. Here we combine tectonic as well as

15
hydrogeological approaches to better constrain the effect of faults on reservoir fluid flow in a
frame of a hydrotectonic model for a magmatic, structurally controlled geothermal system.
Detailed investigations of the hydro- and geochemistry of fluids and rocks in Lahendong are
the focus of another publication (section 2.2). Isotopic studies on fluid and rock samples as
well as a thermal-hydraulic model from before and after production start of the Lahendong
site are under progress and will be published in forthcoming papers.
2.1.2 Setting of the geothermal system Lahendong
Lahendong is located in North Sulawesi, approximately 30 km south of Manado (Fig. 6). The
topography of the area is basically formed by volcanoes and two lakes. Lake Tondano at ca.
680 m above sea level (asl) east of the study area is the largest lake in North Sulawesi. The
smaller Lake Linau is located 780 m asl west of Lake Tondano. The lake water is of light
green colour, but the most significant property is the acidity with a pH of 2.7. Between the
lakes volcano summits rise up to 1,150 m asl. The area is surrounded by Mount Soputan,
Mount Mahawu and Mount Empung. Mount Lengkoan and Mount Tampusu are located
inside the study area. Currently, Mount Empung, which is located 10 km Northwest of
Lahendong, is one of the most active volcanoes in Indonesia. Abundant vegetation and small
rivers cover the rolling hill landscape. Lake Linau is fed and drained by a creek.
North Sulawesi located in the wet tropical climate zone has a constant temperature of 25.9°C
throughout the year (DWD, 2012). Regional rainfall is controlled by the Intertropical
Convergence Zone that accommodates heavy rainfall from November to May (Dam et al.
2001). The average annual rainfall is 2,662 mm (DWD, 2012). This large precipitation depth
either discharges as surface runoff via creeks or infiltrates as recharge into the subsurface.
Infiltration is basically determined by the topographic relief and infiltration capacity
contributing to fluid flow within the reservoir system (Hochstein, 1988). The overall
hydraulic gradient is oriented in a SW to NE direction.

16
Fig. 7 Tectonic setting in East Indonesia and North Sulawesi
The Lahendong geothermal field is owned and operated by P.T. Pertamina Geothermal
Energy. It has an installed capacity of 80 MWe fed by 8,300 tonnes of steam per day
produced by 10 production wells for the last 12 years. Since the estimated potential is still
significantly beyond the present-day production (ca. 120 MWe) it is planned to enlarge the
system by drilling new wells (Koestono, 2010). Therefore, it is necessary to characterise the
reservoir and to identify the major controls for fluid flow in order to optimise injection and
production rates and ultimately to site new wells.
Four production clusters, each including several wells, provide steam directly used for
electricity generation (Fig. 7). The borehole clusters comprise both vertical and deviated
wells. Deviated wells in the Northern clusters have their landing zone below Lake Linau. In
the South, production wells are deviated towards the flank of Mount Lengkoan and also
towards Northeast (Fig. 6). True vertical depth reached by the production wells span the range
between 1,118 and 1,975 m below ground level (bgl), which corresponds to ca. 308 m and
1,120 m below sea level (bsl). Injection is performed at the Northern boundary of the area.

17
Generally, the reservoir is a two-phase-system (Koestono, 2010). However, the Northern part
has a lower steam proportion compared to the Southern part. Temperatures in the reservoir
range from 200°C to 340°C, which is therefore classified as a high-enthalpy-reservoir
following Hochstein (1990).
Available geophysical information from previous exploration campaigns are for example
composed of magnetotelluric data. The results from the three-dimensional analysis of
magnetotelluric data show a higher resistivity (propylitic zone) as a dome overlain by a
shallow conductor that is interpreted to present a hydrothermal alteration zone under Lake
Linau (Raharjo et al., 2010). Alteration was verified also by surface observations, e.g. thermal
springs (Raharjo et al., 2010).
Siahaan et al. (2005) described the geological evolution of the Minahasa area: Minahasa, the
Northeastern part of North Sulawesi, is an active volcanic arc, along a subduction zone of
oceanic plates from N and SE. During the Miocene, volcanic rocks and marine sediments
such as carbonates were deposited during a concurrent marine transgression and volcanic
activity. The interbedded sediments form the basement rocks of the area. A regression and
accelerated volcanic activity in Northern Sulawesi caused the explosion of Tondano, later
followed by the Pangalombian eruption during the Pliocene / Pleistocene. The two calderas
still dominate the present day topography and were transformed by Lake Linau and Lake
Tondano (Fig. 2 and Lécuyer et al., 1997). Other eruptions like Kasuratan, Tampusu, Kasuan,
Linau, and Masarang occurred during the Holocene (Yani, 2006). Around the crater rims
basaltic andesitic lava, breccia, rhyolite, tuff, and lapilli-tuff were deposited (Siahaan et al.,
2005). Geological units in the Lahendong area are divided into Pre-Tondano (basement from
Miocene), Tondano, and Post-Tondano rocks and further subdivided into Pre-Pangolombian
and Pangolombian units from Plio- to Pleistocene (Koestono et al., 2010; Siahaan et al., 2005;
Yani, 2006).
North Sulawesi is located at a triple junction between the Eurasian, Australian, and Philippine
plates, accommodating a relative plate motion of 7.5 – 9 mm/year (Fig. 2 and Walpersdorf et
al., 1998b). The junction is explained by subduction of the Australian (AUS) and Philippines
(PHI) plates under the Eurasian (EUR) and sinistral movement along the Australian-
Philippine boundary (Fig. 7). However, Walpersdorf et al. (1998a) interpret the double
subduction zone in the Molucca Sea to be a result of the Eurasian-Philippine collision.
Whereas the Sangihe subduction started 25 Ma ago, the Halmahera subduction (start: 7 Ma
ago) and the North Sulawesi Trench, for which the subduction started 5-8 Ma ago, is much
younger (Fig. 2 and Di Leo et al., 2012).
The four diverging branches of Sulawesi indicate different origins and have developed within
a complex subduction and faulting process. The Palu fault represents a boundary between
North and West Sulawesi. South and East Sulawesi merges along the Matano fault.

18
Paleomagnetic (Otofuji et al., 1981; Surmont et al., 1994) and geophysical investigations
(Hamilton, 1979; Silver et al., 1983) show a clockwise rotation of the Northern Arm of
Sulawesi. A 20° rotation is dated back to early Pliocene (Silver et al., 1983). The pole of
rotation is located in the Northeast of North Sulawesi (Otofuji et al., 1981; Socquet et al.,
2006; Walpersdorf et al., 1998a). However, according to Otofuji et al. (1981), the rotation was
already completed before the volcanic activity started during the Plio- to Pleistocene period.
Fig. 8 Cross-sections in the northern and southern well clusters as shown in Figs. 1 and 4 with geological
layering, fault location, temperature distribution, casing of wells and reservoir location according to
hydrochemical and borehole data
Structural investigations conducted in the Lahendong area are being carried out by P.T.
Pertamina Geothermal Energy since 1982. This resulted in many scientific contributions, e.g.
Koestono et al. (2010), Lécuyer et al. (1997), Siahaan et al. (2005), Sumintadireja et al.
(2001), Surachman et al. (1987), Utami et al. (2004) and Yani (2006). Observed structures are
basically strike-slip faults, normal faults, and caldera rims. Lécuyer et al. (1997) and Siahaan
et al. (2005) describe a major strike-slip fault oriented in NE-SW direction, presently located
between Lake Linau and Lake Tondano, affecting the development of Tondano and
Pangalombian caldera (Fig. 7B). Some major faults are also striking NW-SE in the north and
south of Lake Linau (Fig. 7B). The Lahendong geothermal system is strongly related to the
Linau caldera but also influenced by local fault systems. As indicated by the location of
thermal springs that are close to fault exposures at the surface, all faults are considered to
have a hydraulic conductivity (Koestono et al., 2010; Siahaan et al., 2005; Surachman et al.,
1987). Fault locations within the reservoir are well correlated with the zones of circulation

19
loss in the boreholes (Fig. 8). Thus, fluid pathways are expected to be mostly characterised by
fracture dominated permeability (Yani, 2006).
2.1.3 Methods
The area surrounding the Lahendong site was tectonically mapped with particular emphasis
on relevant features and subsurface circulation. These are fault orientations, discontinuities
and joints, location of thermal springs, and the hydrogeochemical composition of
groundwater from wells and hot springs. We measured orientation (strike and dip) of faults
and joint planes as well as the slip direction (indicated by slickensides) (section 2.1.4, Fig. 9,
Fig. 10).
Fault plane analysis includes measurements of striations and fault planes, and for better
statistics, each fault plane/striation pair was measured at least four times. A total of 50 sites
(outcrops and manifestations) have been visited. In average 10 measurements at faults and
fractures have been performed. Fault planes are plotted in a lower hemisphere convention
including stress inversion after Angelier (1979). The plots were prepared using TectonicsFP
software (Ortner et al., 2002).
Hydrochemical properties are measured on-site by hand-held instruments at wellhead, in hot
springs, rivers and lakes (e.g. pH, temperature, and electrical conductivity). Samples were
obtained using a Mini-Separator to separate brine from steam. Logging was conducted by the
operator providing downhole temperature, slotted liner zones, permeable zone and hydraulic
heads. Permeable zones represent the area of total circulation loss during drilling. The
perforated areas of casing are in the depth of main permeable zones. Temperature logs in
wells were measured before the start of production and after having obtained a stable
temperature and potential field following drilling and completion. They, therefore, represent
initial conditions. Equipotentials were constructed using the Delaunay-Triangulation-Method
based on data from permeable zones (Henderson, 2007).
Discharge measurements in rivers were performed using tracer dilution method with
instantaneous injection. A fixed amount of tracer substance (NaCl) is injected instantaneously
upstream. The tracer concentration breakthrough is recorded and integrated over time after
having subtracted a natural background (Benischke and Harum, 1990).

20
Fig. 9 Conceptual structural model of the tectonic elements observed in the study area (lineaments in black:
Phase I, lineaments in green: Phase II, details in Fig. 5) including prominent examples of outcrop information
(lower hemisphere plot of fault structures and Rose diagrams of fracture distribution in manifestations). In
orange: cross section lines as presented in Fig. 8
2.1.4 Results
Borehole log data
The geological cross-sections shown in Fig. 3 are based on lithological information (mud-
logs) of the boreholes. According to Sumintadireja et al. (2001), the wells in Lahendong
intersect the Post-Tondano unit at the top (0 – 850 m bgl), the Tondano unit at 350 -
1,100 m bgl and the Pre-Tondano unit at the bottom (1,100 - 1,600 m bgl). Three main rock
types were identified i.e. andesite, volcanic breccias, and tuff.
The lithological units vary between the northern and southern part of the reservoir (Fig. 8).
Bedding layers below Lake Linau is nearly horizontal. Geological layers host breccia and
andesite; slim layers of tuff occur in the NE. Here, the wells reach a true vertical depth of
1,897 m. Permeable zones in the acid reservoir are located in the depth range between
1,481 m bgl and 1,918 m bgl. The average pressure at this depth is 117 bar and the average
temperature 237°C. Two faults border the reservoir. Both are normal faults, striking NW-SE
and dip below Lake Linau. Highest temperature of 300°C was measured at a depth of
1,500 m, which corresponds to a thermal gradient of 200°C/km. Nevertheless, a significant

21
temperature decrease was observed in the NE in the direct vicinity of an inferred fault zone.
This decrease is probably due to the circulation of cooling groundwater within the NE-SW
striking and SE dipping fault zone.
Geological layers in the southern cross-section are also horizontally bedded. Thick layers of
tuff extend across the whole area. Also the neutral reservoir is situated in a thick layer of
breccia. Pressure and temperature are 121 bar and 319°C on average, respectively. The
thermal gradient in this area is 145°C/km. A sinistral NE-SW oriented strike slip fault borders
the reservoir to the NW. Compared to the north, temperatures in general are higher in the
same depth range (i.e. 300°C is measured at 1,000 m depth). Isotherms suggest an upward
flow in the SE and a temperature drop in the NW.
Structural geology in the field
Faults
The main faults strike in a NE-SW orientation in the Lahendong geothermal field. The
azimuth is roughly 40° and the dip between 72° and 81° towards SE. Riedel shears and
slickensides indicate left-lateral movement along the NE-SW faults. Stress inversion of the
fault slip data results in a strike-slip regime where the maximum horizontal stress SH is the
maximum principal stress SH=S1 striking N-S, the minimum horizontal stress is the
minimum principal stress Sh=S3 striking E-W, and the vertical stress is the intermediate
principal stress SV=S2. In this stress field, NE-SW striking faults are sinistral.
At least four different sinistral strike-slip faults develop in the region of interest. Between the
faults step-over regions can be clearly recognised (Fig. 9). Segmentation of strike-slip faults is
typically observed in the shallow crust and the direction of fault step-over controls the
development of extension or push-up structures (Miller, 1994). While a left step-over of
sinistral faults is characterised by extensive strain between the faults, right step-over show
compressive strain due to the relative movement of fault-blocks (Fig. 10). Dilational zones are
dominated by normal faults bordering an extensional basin. Thrust faults, however, connect
sinistral faults with right step-over (Fig. 9). The secondary faults were attributed to the same
development phase as that of the strike-slip faults. Both phenomena, extension and
compression, were observed in the study area. Thrust faults representing a compression zone
were observed in outcrops in the North and South. The northern fault plane strikes 129 - 162°
and dips 30 - 66° towards SW, the southern one strikes 142 - 149° with a dip of 33 – 45°
towards NE. The presence of normal faults surrounding Lake Linau confirms extensional
movement. They dip towards the lake with an inclination ranging between 70° and 82° (Fig.
9). The extensional basin coincides with the Linau crater.

22
Fig. 10 (Top) Focal mechanisms and lower hemisphere plot of two stress phases acting in Lahendong with
maximum and minimum stress direction and the induced faults in top view. (Below) Secondary structures in
Phase I induce dilational and compressional step-over regions. Picture: Example for temporal evolution: N-S
striking normal fault cuts a NE-SW striking strike-slip fault
A second dominating fault pattern is identified in a set of N-S and E-W striking faults. These
faults are normal faults and are apparent from topographic traces at Mount Tampusu and
visible in outcrops near Lake Tondano and Lake Linau (Fig. 9). The strike of the N-S faults
ranges between 0° and 15°, the dip between 78° and 88° ESE, SSW, respectively. Stress field
inversion indicates that the maximum principal stress is vertical, the maximum horizontal
stress SH=S2 is in N-S direction and the minimum principal stress Sh=S3 is in E-W direction
(Fig. 10). Previously mapped faults are presented in Fig. 2B and where mapped among others
by Koestono (2010), Koestono et al. (2010) and Utami et al. (2004). Here, we added the type
of faults and dip directions in this study.

23
Joints
At geothermal hot springs, joints observed within well-consolidated or cemented rocks and
sinter units provide an additional constrain for the present-state of the stress. In particular,
sinter-hosted joints can be assumed to be recently generated and they therefore provide a
measure of currently active movements and stresses. In the target area, our observations
indicate that the joints mostly develop in a direction of NE-SW, N-S and E-W, and to some
extent NW-SE (Fig. 9). E-W and N-S sets or corresponding NE-SW and NW-SE striking
joints presumably indicate a fault-related stress-regime. In hydrothermal discharge areas, E-W
and N-S sinter joints are of a dilative nature. Mineral precipitations from supersaturated
geothermal fluids in the joints are evidence of extensional processes. The joints and the
surrounding rocks (up to 2 cm) are highly altered by Fe-mineralization suggesting circulation
of hot fluids.
Table 1 Hydrochemical properties of different types of hot springs and surface water (- : no measurement, M:
Manifestation, L: Lake, RI: River)
Elevation
[m] asl
EC
[µS/cm]
pH T
[°C]
SO4
[mg/L]
Cl
[mg/L]
Si
[mg/L]
Acid hot springs
M1 744 3,865 2.1 82 3047 27 155
M2 647 2,480 2.4 53 653 116 55
M4 751 6,880 1,8 66 1936 2 67
M9 883 7,835 2.0 57 2985 2 123
M10 856 1,291 2.7 80 1517 20 133
M12
M13
744
775
2,250
4,460
2.7
2.4
40
62
535
3236
43
1
42
124
Neutral hot
springs
M3 756 385 6.1 58 104 1 83
M5 704 1,156 6.6 47 102 122 67
M6
M11
M14
693
709
714
434
522
1,228
7.0
5.8
6.7
41
45
45
7
151
80
21
4
121
58
56
73
Surface water
LL 792 1,951 2.7 28 379 147 64
LP 913 92 7.5 26 12 2 12
LT 680 288 8.1 27 7 12 < 1
RI 1 746 284 6.9 29 75 5 19
RI 2
RI 3
RI 4
RI 5
RI 6
760
743
735
792
756
1,716
-
1,903
684
2,060
2.8
2.6
2.9
5.9
3.5
34
42
29
55
28
481
-
352
163
310
53
-
184
140
343
46
-
49
43
63
-: no measurement
Temporal evolution of the two stress regimes
The present geometric constellation of the fault zones in the study area is explained by fault
kinematics and their geodynamic cycle. Furthermore, the stress analysis is used to elaborate
on the correlation between the fault kinematics and the major geodynamic events in the area.
Fault evolution is split into two phases based on stress inversion of slip data.

24
A stress tensor with maximum principal stress in N-S direction generated NE-SW striking
sinistral strike-slip faults. This phase of faulting possibly occurred during the rotation of
North Sulawesi and relevant compressional stress from northern directions. Today’s
clockwise rotation started ca. 5 Ma ago (Walpersdorf et al., 1998a). This movement increased
the N-S oriented horizontal stress and generated NE-SW striking sinistral strike-slip faults.
The pattern of N-S and E-W striking faults might have developed because of a regional uplift
in this area. The NW-subducting Molucca Sea plate might represent a driving force for an
extensive melting process of the subducted slab in the mantle. A local to regional uplift could
have been induced by individual magma chambers out of extensive melting processes of the
subducted slab below Lahendong. This uplift in turn caused a break-up of the shallow crust
into orthogonal fault patterns. The orthogonal pattern is most likely caused by radial extension
with a vertical maximum principal stress axis typical for uplifting regions.
The relative temporal evolution of the two fault phases is supported by outcrop observations
(Fig. 10). Measurements showed N-S striking normal faults cutting across NE-SW striking
lateral faults. N-S and E-W striking faults are younger than the NE-SW oriented strike-slip
faults and their accompanying secondary structures.
Since these dilative orthogonal fractures are found to be the youngest structures, the present
day stress field is interpreted as a normal faulting regime with similar horizontal stresses
resulting in SV>SH>Sh. Normal faults developed in that stage are supposed to be younger
than 5 Ma. The thermal uplift might even have reactivated older strike-slip faults, which
currently act as oblique normal faults.
The fault kinematics of older sinistral NE-SW striking faults and reactivated oblique sinistral
normal faults with the accompanying orthogonal fracture pattern indicate an overall change in
stress regime with rotation of stress axes. In the former stress field the maximum principal
stress S1 is oriented in N-S and Sh in E-W (black labelled faults in Fig. 9). However, in the
current stage the maximum principal stress axis rotates from horizontal to vertical confirming
a change in the stress regime from strike-slip towards normal faulting (Fig. 9). The rotation
pole is the minimum principal stress axis S3=Sh. S1 has also rotated from horizontal to
vertical.

25
Fluid properties
Hydrochemical patterns
Physicochemical properties of groundwater and surface water have been extensively sampled
during several field campaigns. Electrical conductivity (EC), pH and temperature have been
measured on-site in hot springs, lakes, rivers and wells (Table 1, Table 2). Well-temperature
measurements have been performed downhole before the start of production.
The Lahendong geothermal field is subdivided into two hydrochemical regimes based on
temperature, electrical conductivity, and pH of the fluids. High electrical conductivities in the
range of 4,620 – 9,700 µS/cm, pH in the range of 2.7 – 3.2, and temperatures in the range of
200 – 274°C characterise the acidic type of the well waters. On the other hand low electrical
conductivities of ca. 400 to 1,729 µS/cm, moderate pH (4.2 – 6.5), and temperatures of 232 –
341°C define a neutral type of water. The acidic type of water is found in the north-western
wells (beneath Lake Linau), the neutral type of water is observed in the south and northeast of
Lake Linau. The different water types were also measured at depth. Acid highly saline water
originated from deeper permeable zones, which can be assumed to be located below Lake
Linau (Fig. 8). The average reservoir depth is ca. 2,000 m bgl compared to ca. 1,500 m bgl
average depth for the neutral reservoir.
Table 2 Hydrochemical properties, reservoir temperature, water table, true vertical depth and permeable zone
depth of reservoir water (TVD: true vertical depth, bgl: below ground level, asl: above sea level, colours from
wells refer to the different types and the compartments: see Fig. 14)
Well
number
Wellhead
elevation
[m] asl
EC
[µS/cm]
pH SO4
[mg/L]
Cl
[mg/L]
Si
[mg/L]
RES-
T
[°C]
Water
table
[m] asl
TVD
[m]
bgl
Permeable
zone from to
[m] bgl
Type 1 23 879.2 9,700 2.7 1609 1559 461 274 605 1,693 1,481 1,693
28 820.0 4,620 3.2 523 991 364 200 620 1,897 1,750 1,918
Type 2
5 877.9 400 4.2 17 12 15 232 677 1,550 1,550 1,700
8 854.9 1,729 6.5 114 348 163 316 854 1,183 1,156 1,318
10 854.9 1,533 5.9 109 295 218 308 854 1,975 1,837 1,905
11 854.9 972 5.9 52 215 146 312 854 1,252 1,266 1,542
12 855.0 1,541 5.3 46 452 322 327 855 1,500 1,500 1,800
15 855.0 1,513 6.1 50 388 242 341 855 1,237 1,236 1,555
17 809.7 402 5.3 29 178 157 330 810 1,118 1,150 1,416
18 809.7 831 4.7 39 61 101 287 810 1,369 1,424 1,510
Spring water can be also subdivided into two types (Table 1). Hot springs with temperatures
of 40 - 82°C, low pH-values of ca. 2 and EC of 1,291 to 7,835 µS/cm are acid springs.
However, neutral springs show lower EC (385 - 1,228 µS/cm), lower temperatures of 41 -
58°C, and higher pH values (~6.5). Acidic hot springs are located mostly in the NW of the
study area, where also the acid reservoir water is situated while the neutral springs surround
the study area (Fig. 11). Hot springs rise in the vicinity of faults but also occur in
manifestations far from fault zones, which could then be interpreted as steam heated shallow
groundwater. The hot springs M4, M9 and M13 can be regarded as examples for steam-heated

26
shallow groundwater since they are positioned right above the neutral-pH reservoir. Besides
high concentrations of sulphate steam heated groundwater is normally associated with low
concentrations of chloride and high dissolved metal contents (Arnorsson et al., 2007). They
discharge at the surface as muddy hot springs often in combination with fumaroles at the
flanks of stratovolcanoes (Utami, 2011). Moreover, the acid water dissolves the rock and
forms collapse craters and caves (Nicholson, 1993).
River and lake waters differ from each other, depending on the location within the study area,
with respect to their physicochemical properties, i.e. Lake Linau shows a pH of 2.7, located
near acid hot springs and above the acid reservoir, and river water displays variable acidity
depending on nearby hot springs feeding the creeks.
In typical geothermal systems neutral spring water is interpreted as surface discharge of the
reservoir. Nevertheless, the Lahendong geothermal reservoir is a magmatic and fault
controlled system. At the Lahendong site the neutral springs occur far from the reservoir. In
between the reservoir and the discharge areas are low permeable faults. Therefore it is
unlikely that they represent typical outflow areas. Moreover, the hydraulic head distribution
supports this conceptual model. Hot spring discharges have higher hydraulic heads than the
nearest well. Nonetheless, the flow direction suggests a typical outflow area in this area.
The presence of acid water in the reservoir and in thermal springs is interpreted to originate
from fluids in contact with gases emanating from an old magma chamber, i.e. today’s heat
source (Fig. 12). The chamber is assumed to have remained from the eruption and evolution
of the Linau Caldera (0.45 Ma years ago). The degassing magma contributes to the
acidification of the aquifer by reaction of O2-rich groundwater with H2S and CO2 to acids
such as H2SO4 or H2CO3. A circulation process with infiltration of meteoric water through
fault zones and mixing with deep acidified magmatic water is suggested for this acid aquifer
beneath Lake Linau. Heating stimulates the rise and discharge of hot acid water to the surface.
The infiltration of cold meteoric water occurs through fractures parallel to the fault.
Moreover, the fault core itself can be assumed to be of low hydraulic conductivity, while the
adjacent damage zone is believed to display considerable permeability. During infiltration
cold water is heated up and together with gas components rises upward through parallel
fractures to the surface, where it discharges in acid springs at the shore or the lake bottom.
Hence, the lake water is a mixture of water from an acidified aquifer and acidic condensate
water.

27
Fig. 11 Location of sampled spring, lake and river water in the study area and their location relative to faults
(properties in Table 1)
The previous description of the Lahendong water types allows a preliminary classification and
evaluation of the hydrochemistry of the study site. Nevertheless, a detailed hydrochemical and
geochemical investigation is necessary to fully understand the Lahendong hydrothermal
system. The study presented here was accompanied by an investigation of the hydrochemical,
geochemical and isotopic characteristics (Brehme et al., submitted, Wiegand et al., in prep.).
However, a short report of the main conclusions is presented in the following to support the
preliminary characterisation in this publication.
Acid water occurring in Lahendong has to be divided into deep acid water and acid spring
water discharging at the surface. Both are characterised by high sulphate (SO4) concentrations
due to the oxidation of H2S, but deep acid water contains up to three orders of magnitudes
higher chloride (Cl) concentrations and three times higher silicium (Si) concentrations (Table
1, Table 2). In contrast neutral waters have considerably lower concentrations of SO4 but also
lower Cl and Si (Brehme et al., 2011). Based on the ionic ratios of Cl/SO4, Cl/Si or Fe/Si the
deep, shallow, acid and neutral waters can clearly be distinguished. Therefore, it is assumed
that deep and acid waters from hot springs do not necessarily originate from the same source.
Acid water in hot springs can also be interpreted as steam-heated groundwater.
Moreover, Utami (2011) showed different types of alteration and various alteration minerals
for different production wells in Lahendong. The composition of reservoir water is controlled

28
by equilibration with the host rock. The contact of acid water with reservoir rocks rather
results in a direct deposition than in a replacement of minerals. This is due to a higher salt
content of acid reservoir water. Precipitating minerals from acid water contain mostly
sulphates and alkaline earth silicates. Neutral water additionally causes precipitation of iron
oxides. Likewise behaviour was observed in our own thin section analyses and XRD-analyses
(section 2.2.3).
Fig. 12 Schematic explanation of the acid water evolution by degassing magma under Lake Linau. Meteoric
water (blue) infiltrates through fractures along normal faults and mixes with gases (orange) from the magma
source (red) and already acidified water (green) before rising again
Hydraulic characteristics
Local groundwater flow in the Lahendong area is obviously dominated by fault structures.
Three different groundwater systems can be distinguished (Fig. 13). Nevertheless, directions
are generally from SW to NE. Artesian conditions prevail at the southern well clusters and
west of Lake Linau. Hydraulic heads in the SE show groundwater flow from the southern
production cluster to the injection wells (SW – NE). Beneath Lake Linau the local flow is
aligned approximately W – E. North of Lahendong the flow direction is SW to NE, i.e.
parallel to the southern flow field. It is assumed that all three flow systems are independent
from each other. The lowest water levels are observed near the injection cluster the highest
29
levels south of Lake Linau (Fig. 13). Slightly higher groundwater levels occur below Lake
Linau, which matches the depth of permeable zones and hence the reservoir depth, displayed
in Fig. 8.
Additionally, the reservoirs can be assumed to be vertically separated. Less permeable layers
isolate the different reservoir horizons. In the Lahendong area andesites are believed to form
aquicludes, while the reservoirs are located in the higher permeable breccias. As a result
perched aquifer systems could also possibly develop. An example for a perched aquifer could
be the local acid aquifer beneath Lake Linau. However, the horizontal separation is a result of
the hydraulic properties of the fault zones. Independent groundwater flow systems are
bordered by fault systems with a low permeability orthogonal to the fault plane.
To verify the assumptions of hydraulic properties of faults in the Lahendong area, the
discharge of rivers and creeks was measured before and after fault zones. We qualitatively
tested if the infiltration into fault zones is an issue at the site investigated. The discharge,
which was obtained with a dilution method (Benischke and Harum, 1990) ranges between ca.
10 L/s and 190 L/s (Fig. 13). Influence of recharge from hot springs or anthropogenic
discharge by farmers on the measurements was minimised by measuring if possible in
unaffected areas. A significant drop of discharge in the vicinity of faults is observed. The
water volume in the river decreases by 12 L/s while crossing the normal fault SW of Lake
Linau. A similar trend is observed for the complementary NE fault zone (drop in discharge by
ca. 5 L/s).
2.1.5 Permeability characteristics of fault zones
Various properties of the reservoir in Lahendong were already discussed in the previous
paragraphs. Hydrochemical patterns, temperature anomalies, and hydraulic heads are strongly
influenced by fault systems.
The different hydrochemical patterns in the study area suggest various origins of water. The
superposition of the effects of the complex geological and tectonic history can possibly
explain the proximity of the large contrast in water types. Furthermore, the subsequent
differentiation of the hydraulic flow regime and the consequential characteristic
hydrogeochemical development of the fluids support this model. The tectonic structural
elements, i.e. fault zones, are considered as the most significant feature since they provide
either fluid pathways or barriers and therefore explain easily flow paths to different rock types
and therefore water types. In our study area the two reservoir types appear to be separated by
low permeability faults; a strike-slip fault south of Lake Linau and a normal fault east of Lake
Linau.

30
Furthermore, hydraulic heads in the geothermal system suggest three different flow regimes.
Flow direction south and north of Lake Linau is from SW to NE but beneath the lake from
WSW to ENE. Both the hydrochemical and the hydraulic patterns are isolated regimes, which
are controlled by fault systems. Sinistral strike-slip as well as normal faults act as flow
barriers (Fig. 13, Fig. 14).
Fig. 13 Different groundwater flow systems with hydraulic head distributions dominated by fault structures.
Black numbers are elevations of wells where the hydraulic head was measured, to explain the location of
artesian conditions. Discharge measurements in rivers with discharge in L/s show water losses in the river
across normal faults
In contrast, the distribution of hot springs suggests some fault permeability. Since the
southern wells display artesian conditions and because hardly any hot springs are observed in
this area, it is conclusive that the hot water rise is limited to fault zones. Furthermore, hot
springs are frequently located at fault intersections. Especially in the surroundings of Lake
Linau the thermal springs are aligned in NE-SW direction (Fig. 9, Fig. 11). Hot springs
regularly occur together with fumaroles and are associated with regions of substantially
altered rocks. Along each fault only one type of hot spring occurs. Neutral-pH springs occur
for example along the most north-western and most north-eastern strike slip fault. Acid
springs appear along the sinistral strike slip fault near Leilem and south of Lake Linau. M4,
M9 and M13 are assumed to be steam heated groundwater and therefore occur independently
of fault zones mapped at the surface.

31
Furthermore, borehole temperature data show infiltration of cold meteoric water along the
fault zones. A significant temperature drop was observed along a strike-slip fault in the south
as well as along a normal fault in the north of reservoir area. The cooling process is most
obvious close to the normal fault NE of Lake Linau. Isotherms uniformly drop in the vicinity
of the fault, demonstrating a clear progress of cold water from the surface into the fault. At
the same depth range the temperature drops about 50°C (Fig. 8). This phenomenon most
likely also applies for the opposite normal fault and the strike-slip fault in the southern cross
section (Fig. 8).
Moreover, the hydrochemical model in Fig. 12 supports the model of a permeability
anisotropy with the main axis parallel to the fault strike. The acidic fluids below Lake Linau
circulate in fractures sub-parallel to the main fault zone. Acidic fluids do not only discharge
via hot springs but also contribute to the water budget and acidification of the lake. The rise of
fluids can be observed in large gas bubbles visible in the western part of the lake.
Discharge measurements have been carried out during the field campaigns in order to check
out the hypothesis of infiltration of surface water into faults being permeable parallel to fault
striking in the vicinity of Lake Linau. The loss of water from the river across the fault zones
supports the assumption of vertical infiltration.
The hydraulic conductivity of fracture systems has been widely discussed in the scientific
community. Different studies came up with various conclusions (Barton et al., 1995; Ferrill
and Morris, 2003; Gudmundsson et al., 2001; Caine et al., 1996). Our field observations and
relevant data analysis lead to the conclusion that faults in the Lahendong area are
perpendicular to the strike less permeable irrespective of the stress regime and orientation of
movement.
Therefore, a more detailed consideration of fault structure is necessary to fully understand the
internal fluid flow as the fault core can be 103-10
4 times less permeable than the surrounding
damage zone (Evans et al., 1997; Faulkner et al., 2003). In other words, a detailed analysis of
the fault and fracture pattern is crucial for the understanding of the fluid flow in the reservoir.
These features are apparent at the surface in outcrops and manifestations, where the
orientation, aperture width and possible sealing by mineral precipitation become visible. A
simplified model as proposed by Caine et al. (1996) is also suggested for our study area.
Independent from the fault slip orientation a sealing fault core hinders fluid flow across the
fault (horizontally). Nonetheless, fracture patterns parallel to the fault plane allow fault-
parallel fluids paths, most obviously by discharging hot springs adjacent to the faults and
infiltration of surface water into the fault zones. According to our data, the fracture patterns
are more prevalent along normal fault zones (at the extension basin at Lake Linau). We
suggest a combination of stress analyses and fracture pattern analyses as the method to

32
thoroughly understand the potential fluid pathways in a geothermal reservoir. The results
show that conceptual models of geothermal systems should always consider the effect of
hydrotectonic features on subsurface flow.
The influence of contribution of magmatic history and processes will have to be considered in
the interpretation of the hydrochemical fluid composition and in the analysis of structural
elements such as calderas and their influence on fluid circulation. The presented methods can
be generalised for the analysis of major hydrogeothermal systems.
Fig. 14 Hydrotectonic conceptual model showing the different reservoir compartments in Lahendong (acid:
green colour and neutral: blue colour)
2.1.6 Conclusions
In this study a complex geothermal reservoir system was characterised by an integrated
analysis of the hydrotectonic features and hydrogeological/hydrochemical characterisation of
thermal groundwater.
The currently acting state of stress in the target area was captured by stress inversion of field
observations. Faults zones subdivide the geothermal field into different sub-reservoirs. Fluid
flow in the subsurface is controlled by the hydraulic characteristics of the fault zones, which

33
in turn determines the chemical composition and temperature of the thermal fluids and
therefore the productivity of the geothermal field.
The subdivision into different sub-reservoirs was anticipated based on a conceptual fault
model and confirmed by hydrochemical measurements performed at 12 hot springs, 10 wells,
and 9 surface water samples. In addition to borehole measurements hydraulic heads from 23
wells were available for the analysis of the local flow regimes.
Fault zones can either act as flow barriers due to sealing, of the fault core, or as conductive
pathways (damage zone) parallel to the fault strike. Fractures in the damage zone are more
numerous in tension controlled dilative faults. Furthermore, two main phases of structural
development were identified in the faulting history and the tectonic evolution. This new
observation is describing the role of fault zones in geothermal fields, especially in the
Lahendong area.
The main contribution of this study is its demonstration of the effect of a systematic structural
geological analysis on the understanding of fluid flow in geothermal reservoirs. Integrating
strain and present-day stress fields in a geothermal reservoir provide a better insight into the
hydrogeological role of fault systems. Moreover, the spatial distribution of structural elements
and their temporal evolution has been combined with their hydraulic properties to explain
long-term physical processes. It has been confirmed that this hydrotectonic concept of
combining tectonic and hydrogeological information is essential to understand the subsurface
flow of hot fluids, which is the basic source of geothermal power plants. It is appropriate to be
used for similar geological settings.

34

35
2.2 Geohydrochemical processes controlled by fault permeability
in the Lahendong geothermal field
2.2.1 Introduction
Geothermal potential is nowadays an indispensable component to supply energy demands
within a frame of future energy strategies built on renewable sources. Efficiency of this
component requires using proper approaches for reservoir characterization to optimize
reservoir performance. Usually, the characterization is done using geophysical, geological and
hydrochemical measurements. In this study, geohydrochemical investigations are performed
to evaluate the influence of fault zones on reservoir properties.
Understanding geohydrochemical properties is inevitable for the sustainable use of a
geothermal site. Acidic fluids, i.e., bring high risk for the geothermal circuit because highly
acidic water might lead to corrosion that extremely risks the stability of pipes and wells
(Keserovic and Bäßler, 2015). Therefore, it is important to understand fluid properties, their
distribution and source in order to set up a sustainable geothermal circuit. Geohydrochemical
properties are strongly influenced by subsurface fluid flow. In tectonic active areas fluid flow,
in turn, is controlled by distribution of permeable and impermeable faults. Therefore,
geohydrochemical features provide reliable constrains for permeability of faulted areas. The
aim of this study is to allocate these faulted areas based on geohydrochemical observations.
Geohydrochemical characteristics are controlled by fluid-rock-interaction, which is enhanced
in permeable areas.
The presented approach is applied at a geothermal site in Sulawesi-Indonesia. Lahendong is a
high-enthalpy geothermal field operated by P.T. Pertamina Geothermal Energy. It has an
installed capacity of 80 MWe fed by 8,300 tons of steam per day through 10 production wells.
Geohydrochemical investigations in the Lahendong geothermal field have started early 1970s.
However, the evolution and distribution of thermal fluids within the target area is still in
debate. The present day conceptual model that has been recently proposed for the Lahendong
geothermal field is summarized as follows (Fig. 15, Brehme et al., 2014): The geothermal
field consists of two sub-reservoirs separated by horizontally less permeable fault zones and
permeable fault-parallel patterns. Hot springs arise often along or at junction of conjugate
faults. Brine of low pH is predominantly seen in the north while moderate pH fluids exist in
the southern and eastern margin of study area. Accordingly, production rates vary between the
northern and southern parts by a factor of five. Lahendong area is characterized by basaltic
andesites, tuff and volcanic breccia intruded by diorites at some locations.
Up to now, geohydrochemistry was used as an instrument to interpret the potential of a
geothermal field. This study will make use of this information also to characterize the role of

36
fault zones in geothermal systems. Geohydrochemical investigations allow to characterize the
geothermal field size, subsurface temperatures, water and rock composition and their
physicochemical properties (Arnorsson, 2000). Besides generating a conceptual model,
subsurface fluid flow will be investigated to understand role of faults and their permeabilities.
Fig. 15 Topographic map of the study area with main faults and hydrochemical characteristics (EC: electrical
conductivity, T: temperature). Red and black lines show deviated wells (modified from Brehme et al., 2014)
2.2.2 Methods
Water sampling and analysis
Water samples have been collected from production wells and hot springs in the Lahendong
geothermal field (Fig. 14, Fig. 15). Well water samples have been extracted from the mixture
of brine and steam using a “miniseparator”, which excludes liquid phase from gas phase at
wellhead. Sampling has been done according to the hydrogeological procedure, following the
steps described by Brehme et al. (2010). Acidification has been done using hydrochloric acid.
Major element concentrations have been analyzed by inductively coupled plasma atomic
emission spectroscopy (ICP-AES, VISTA-MPX, Varian) and ion chromatography (ICS3000,
Dionex). Quantitatively analyzed elements are Ca, Fe, K, Mg, Mn, Na, Si, Sr, Zn, Li, B, Ba,
Al, Cs and As (using ICP-AES) and F, Cl, NO2, Br, NO3, SO4, PO4 (using ICS). Figures and
tables show acidic and neutral water wells as labeled in green and blue, respectively.

37
Rock sampling and analysis
Rock samples have been taken from cores, outcrops and manifestations along the Lahendong
area. Combining thin sections of core samples, XRD- and cutting-analysis allows constraining
reservoir rock types in detail. Surface rock samples from outcrops are analyzed using X-ray
diffraction (XRD) and X-ray fluorescence (XRF) methods in order to measure their contact
rate with hot fluids. To quantify mineral composition as well as fraction of the rocks, the
samples have been crushed and sieved to 63 μm. Powder XRD patterns have been recorded
using a fully automated STOE STADI P diffractometer.
The diffractograms have been refined using the EXPGUI-GSAS method (Belsky et al., 2002;
Larson and Von Dreele, 2004; Toby, 2001) and reference crystal structures from the ICDS
database (Bergerhof and Brown, 1987). This refinement method allows a quantitative
determination for amount of minerals in a rock sample. The accuracy of those measurements
is up to 5 wt. % due to very late stage of alteration and occurrence of water in the samples
(H2O). The clay mineral fraction has not been quantified, but determined qualitatively. To
identify the peaks of the XRD pattern the EVA diffraction suite method has been used, which
is developed by Bruker (Giencke, 2007).
XRF analysis has been performed on a Bruker S4 Pioneer instrument, equipped with a 4kW
Rh tube. Details about the measurement conditions and refinement procedures are described
in Deon et al. (2013).
Geohydrochemical model
The aim of numerical modeling is to predict potential supersaturation (SI), precipitation and
dissolution of the minerals. In the first step, each reservoir water analysis has been adapted to
the predominant in-situ conditions, e.g., pressure, temperature and the gas phase equilibrium.
Under these conditions, certain minerals became supersaturated. In a second step, the
supersaturated mineral phases have been set into equilibrium with the reservoir water and
allowed to precipitate.
Hot spring water has been simulated mixing reservoir water with cold low saline water by the
factor of 10 reaching the measured temperature of hot springs. This average factor has been
estimated from the difference of Cl concentrations in hot spring and reservoir water. CO2 and
H2S have been degassed at atmospheric conditions and the spring water has been equilibrated
with O2. Neutral and acidic water has been set into equilibration with silica-minerals. Neutral
water has been represented using M3 and M11, acidic samples are M1, M2, M10. After these
steps, oversaturated minerals have been assumed to precipitate under the given conditions.
Eventually, these simulated mineral phases have been compared with observed mineral
phases from surface and subsurface samples.
For the simulation, the geochemical code PHREEQC with the included database (phreeqc.dat,
Parkurst et al., 1980, Parkhurst and Appelo, 2013) has been used which allows calculating the
pressure impact on the equilibrium constants of chemical reactions. The reaction of gas

38
phases with the solutions has been calculated using the Peng-Robinson’s state equation
(Robinson et al., 1985). The mineral reactions have been calculated as equilibrium reactions.
Geothermometer
Temperature estimations using geothermometers have been calculated for well water and hot
spring samples. Out of four quartz and six cation-geothermometers the best two/three fits are
chosen and presented in this study. Following Powell and Cumming (2010), formulas are as
follows:
Chalcedony (conductive): T [°C]= 1032 / (4.69 – log[Si]) -273.15 (Fournier, 1981)
Quartz (conductive): T [°C]= 1309 / (5.19 – log[Si]) -273.15 (Fournier, 1981)
Quartz (adiabatic): T [°C]= 1522 / (5.75 – log[Si]) -273.15 (Fournier, 1981)
Na/K: T [°C]= 1217 / (1.483 + log[Na/K]) -273.15 (Fournier, 1983)
Na/K: T [°C]= 856 / (0.857 + log[Na/K]) -273.15 (Truesdell, 1976)
Na/K: T [°C]= 1390 / (1.75 + log[Na/K]) -273.15 (Giggenbach, 1988)
Theoretical temperatures from hot spring samples are compared to the nearest maximum and
average measured well temperatures in reservoir depth. Theoretical temperatures calculated
from well samples serve as verification for geothermometry calculation, measured
temperatures and water source.

39
Ta
ble
3 H
ydro
chem
ica
l co
mpo
siti
on
of
wel
l w
ate
r (T
op
) a
nd
ho
t sp
rin
g w
ate
r (B
ott
om
)
Mea
n v
alu
es o
f co
nce
ntr
ati
ons
in m
g/L
, el
ectr
ica
l co
nd
uct
ivit
y (E
C)
in µ
S/c
m.
Tem
per
atu
re (
T)
in °
C i
s re
serv
oir
tem
per
atu
re o
bta
ined
fro
m b
ore
ho
le-m
easu
rem
ents
,
ga
s p
ha
ses
in m
mo
l/kg
ste
am
. “
-“ n
o m
easu
rem
ent
EC
[µ
S/c
m]
pH
T R
ES
HC
O3
FC
lN
O2
Br
NO
3S
O4
PO
4C
aF
eK
Mg
Mn
Na
Si
Sr
Zn
Li
BB
aA
lC
sA
sC
O2
H2S
LH
D 5
400
4.2
232
60.1
12
<0.15
<0.1
0.10
17
1.3
4.5
<10
0.69
<0.1
20
15
<0.1
0.9
0.04
1.1
0.0
0024
3.2
80.0
10.1
4134
9
LH
D 8
1729
6.5
316
68
3.4
348
<0.15
1.42
<0.1
114
<0.1
2.9
0.7
27
0.13
<0.1
316
163
0.01
1.3
0.24
8.9
0.0
0063
0.9
20.2
52.2
0126
23
LH
D 1
01533
6308
64
1.5
295
1.08
<0.1
109
<0.1
7.4
0.6
45
<0.1
<0.1
228
218
0.03
<0.1
0.58
3.1
0.0
0079
0.5
6134
23
LH
D 1
1972
5.9
312
29
1.0
215
<0.15
0.72
<0.1
52
<0.1
4.4
1.0
31
0.52
<0.1
174
146
0.01
2.0
0.58
3.1
0.0
0042
1.8
81.0
83.9
811
430
LH
D 1
21541
5.3
327
23
1.4
452
<0.16
1.59
<0.1
46
<0.1
3.8
0.7
80
0.15
<0.1
282
322
0.01
0.7
1.50
4.3
0.0
0067
1.2
71.2
41.4
075
22
LH
D 1
51513
6.1
341
29
1.8
388
<0.17
1.27
<0.1
50
<1
<0.1
60
<0.1
<0.1
303
242
<0.1
<0.1
1.62
1.0
22.0
140
19
LH
D 1
7402
5.3
330
57
1.0
178
<0.18
0.59
<0.1
29
<0.1
4.1
2.8
12
0.56
<0.1
83
157
<0.1
1.2
0.14
9.8
0.0
0049
2.9
20.0
43.5
776
22
LH
D 1
8831
4.7
387
19
0.8
61
<0.19
0.29
0.22
39
1.6
4.1
1.0
29
0.58
<0.1
136
101
0.01
2.2
0.72
1.2
0.0
0036
1.6
50.9
90.6
0135
18
LH
D 2
39700
2.7
274
01.9
1559
<0.1
<0.1
1609
<0.1
3.2
9.4
173
5.00
6.4
1637
461
0.04
0.8
2.20
13.1
0.0
0702
1.2
2355
24
LH
D 2
84620
3.2
200
01.9
991
<0.15
2.57
<0.1
523
5.8
9.1
124
0.76
1.1
853
364
<0.1
<0.1
2.25
1.3
62.2
9
EC
[µ
S/c
m]
pH
T [°C
]H
CO
3F
Cl
NO
2B
rN
O3
SO
4P
O4
Ca
Fe
KM
gM
nN
aS
iS
rZ
nL
iB
Ba
Al
Cs
As
M1
3865
2.1
82
00.9
327
< 0
.15
0.1
20.2
83047
4123
236
23
40
2.0
340
155
0.1
80.8
40.0
30.4
49
0.0
01
57.5
47
0.0
04
0.0
44
M2
2480
2.4
53
00.2
611
6<
0.1
0.3
70.1
2653
214
14
17
50.5
811
055
0.0
5<
0.1
0.4
11.9
64
0.0
05
6.3
19
0.0
52
0.1
84
M4
6880
1.8
66
01.2
22
< 0
.1<
0.1
< 0
.11936
< 0
.57
20
< 1
05
0.4
0<
10
67
<0
.1<
0.1
0.0
02
0.0
00
0.0
04
M9
7835
2.0
57
00.4
52
< 0
.1<
0.1
< 0
.12985
< 0
.528
61
13
17
1.1
915
123
0.2
60.1
6
M1
01291
2.7
80
00.6
220
< 0
.1<
0.1
< 0
.11517
< 0
.562
199
23
34
3.8
546
133
0.2
40.3
4
M1
34640
2.4
61
0.3
61
< 0
.1<
0.1
< 0
.13236
149
251
< 1
081
7.0
022
124
0.4
60.4
1
M3
385
6.1
58
135
0.0
31
< 0
.1<
0.1
< 0
.1104
< 0
.572
0.2
612
91.1
020
83
0.3
3<
0.1
0.0
10.0
01
0.0
02
M5
11
56
6.6
47
186
0.2
9122
< 0
.15
0.2
6<
0.1
102
77
0.7
520
39
0.5
598
67
0.1
9<
0.1
0.1
10.0
02
0.0
17
M6
452
7.0
41
104
1.1
921
< 0
.1<
0.1
< 0
.17
11
0.2
9<
10
50.3
978
58
<0
.1<
0.1
0.1
10.0
01
0.0
02
M11
460
5.8
45
<0
.14
< 0
.1<
0.1
1.1
7151
< 0
.547
4.1
011
80.8
729
56
0.2
9<
0.1
M1
41228
6.7
45
0.2
4121
< 0
.10.2
7<
0.1
80
77
< 0
.123
41
0.7
6106
73
0.1
8<
0.1

40
2.2.3 Results
Water
Water has been sampled from ten production wells and eleven hot springs. In general,
water is found to be either highly acidic (pH of 1.8 – 3.2) or neutral (pH of 4.2 – 7.0).
Reservoir water is of chloride type or acid sulphate-chloride type, while hot springs
discharge bicarbonate type waters or sulphate type waters. Waters have been classified
according to Arnorsson et al. (2007), Ellis and Mahon (1977), Nicholson (1993), Utami
(2011) and White (1957).
Major ions in acidic reservoir water are Cl, SO4, Na, Si (as total silica) and K. Anions
have concentrations of 991 to 1,559 mg/L for Cl and of 523 to 1,609 mg/L for SO4.
Neutral reservoir water mainly consists of Cl, SO4, HCO3, Na, Si (as total silica) and K.
Cl ranges between 12 and 452 mg/L, SO4 between 17 and 114 mg/L and HCO3 between
6 and 68 mg/L. Main gas phases are CO2 and H2S (Table 3).
Major ions in acidic springs are Cl, SO4, Fe, Ca and Si (as total silica). Cl concentrations
reach from 1 to 116 mg/L, while SO4 has concentrations of 653 to 3,236 mg/L. Neutral
spring water mainly consists of Cl, SO4, HCO3, Na, Si (as total silica) and Ca.
Bicarbonate ranges between 104 and 186 mg/L, Cl between 1 and 122 mg/L and SO4 has
values between 7 and 151 mg/L (Table 3).

41
Fig. 16 Plot of water samples in Giggenbach-diagram correlating Cl-, SO4- and HCO3, (A) well water, (B)
spring water. Green: acidic water, blue: neutral water. M11 and M14 are not shown due to missing HCO3
concentrations
The ternary Giggenbach-diagram displays the relation between Cl-, SO4- and HCO3-
concentrations in geothermal waters (Giggenbach, 1988). Plotting the samples from the
Lahendong geothermal field reveals a clear distinction between two types of reservoir and
hot spring water (Fig. 16). Neutral reservoir samples show mostly pre-dominant Cl-
concentrations and therefore are classified as mature waters. On the other hand, non-
HCO3 acidic reservoir waters remain between volcanic and mature waters. Neutral

42
springs with high chloride and bicarbonate concentrations host peripheral water while
acidic springs host volcanic or steam heated water (Fig. 16).
Accordingly, the correlation of pH with SO4 and Cl with B reveals a clear separation
between acidic and neutral waters (Fig. 17, Fig. 18). In the Cl/B-plot three different water
groups have been observed in our target area: Most neutral waters show a linear trend
with low B concentrations (1- 4 mg/L). Wells LHD 8 and LHD 17 are shifted to the left,
while LHD 23 shows the highest Cl and B concentration as well as the highest ratio. The
smallest concentrations and ratio occur in well LHD 5.
Fig. 17 Plot of pH with SO4 for (A) reservoir water and (B) hot spring samples. Green: acidic water, blue:
neutral water

43
Fig. 18 Correlation of B with Cl of reservoir water with respective concentrations and ratios. Green: acidic
water, blue: neutral water, concentrations in mg/L
Rocks
Rock specimen collected from the reservoir and the surface have been analyzed on type
and composition of rocks, and occurrence of fluid pathways. The Lahendong area is
typically characterized by andesite and volcanic breccia. Andesitic reservoir rock mostly
bears altered and unaltered plagioclase, quartz, epidote, pyroxene and olivine (Fig. 19
Top B). However, volcanic breccia consists of different rock fragments and minerals (e.g.
plagioclase, quartz) hosted in a microcrystalline matrix (Fig. 19 Top B). Both rock types
show hydrothermally altered colorful minerals under the cross nichols light in thin
sections (Fig. 19 Bottom B and D).
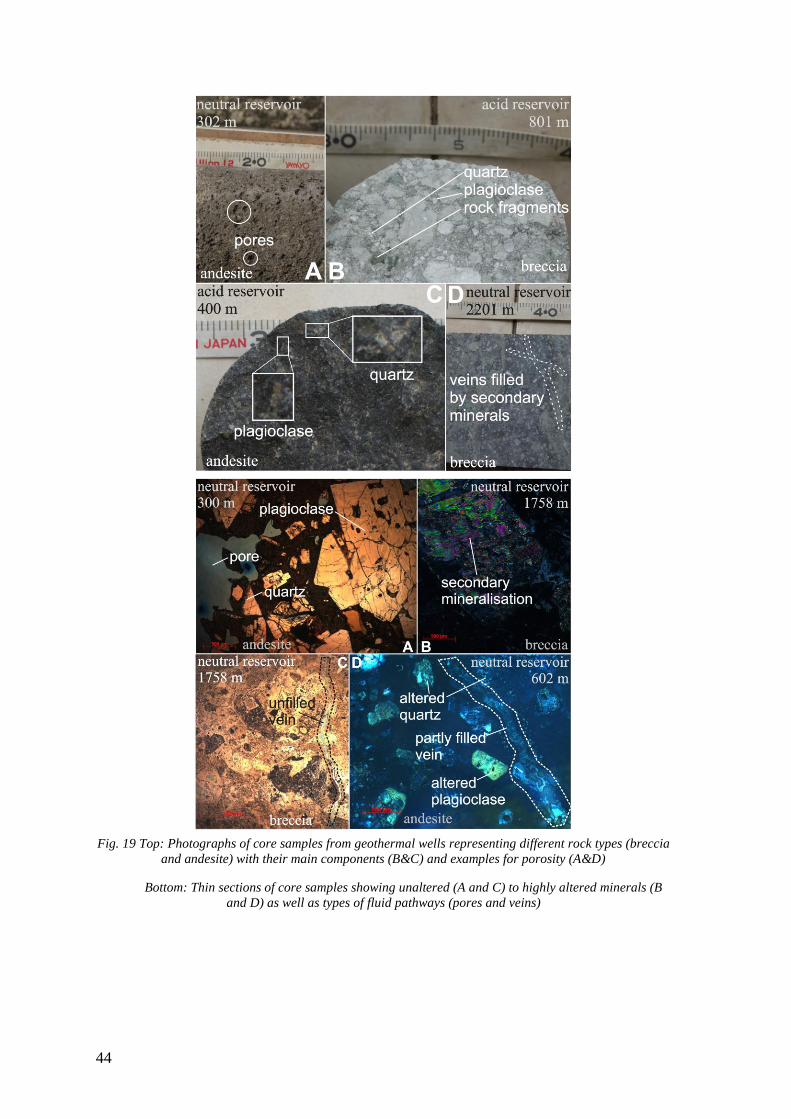
44
Fig. 19 Top: Photographs of core samples from geothermal wells representing different rock types (breccia
and andesite) with their main components (B&C) and examples for porosity (A&D)
Bottom: Thin sections of core samples showing unaltered (A and C) to highly altered minerals (B
and D) as well as types of fluid pathways (pores and veins)

45
Potential fluid pathways in reservoir rocks are unfilled primary pore spaces (Fig. 19 Top
A) or veins. However, veins are often filled by secondary minerals (Fig. 19 Top D).
Comparable examples have been observed in thin sections (Fig. 19). Unaltered andesite
shows pores between quartz and plagioclase (Fig. 19Top A). Altered andesite shows a
partly filled vein among altered minerals (Fig. 19 Top D).
XRD- and cutting-analyses, furthermore, report phyllosilicates, e.g. chlorite and clays, to
be more abundant in rocks hosting acidic water (Fig. 20). Surface sample GS9 is a fresh
andesite sample (Fig. 20). The most abundant phases of the GS9 XRD pattern belong to
plagioclase, diopside and forsterite. GS5-1, GS5-3, GS5-5 and GS15-A samples represent
altered material from manifestations in the Lahendong area hosting acidic hot springs and
fumaroles. Alteration products from those samples are mainly sulphur (GS5-1) and clay
minerals, i.e. kaolinite (GS15-A) (Fig. 20). Kaolinite indicates a hydrothermal alteration
of a pre-existing plagioclase. Further alteration minerals are goethite, antigorite and
alunite (observed in GS5-3 and GS5-5). Rutile appears most likely as relict from the pre-
altered rock (Fig. 20). Minority of rutile type of minerals is seen in XRF data where the
chemical content of whole rocks show 1.45% of TiO2 (Table 4).
Table 4 (A) Reservoir rock composition from core samples, (B) Surface rock composition from XRD
analysis, (C) Selected XRF analysis from surface samples, locations see Fig. 15
(A)
Sample Analysis method Major mineral phases
Neutral reservoir (LHD2,4,5,7)
Cores, thin sections quartz, plagioclase, olivine, biotite, pyroxene, epidote, pyrite, muscovite
Acid reservoir (LHD1) Cores, thin sections quartz, plagioclase, pyroxene, biotite, epidote, muscovite
Acid reservoir (LHD23,24,28) XRD, Mudlog, Cutting-Report
quartz, plagioclase, chlorite, pyrite, clay (smectite, illite), epidote, muscovite
(B)
Sample Rock type XRD Refinement method
Major mineral phases
GS 5-1 (manifestation with acid springs) Altered material Rietveld sulphur
GS 5-3 (manifestation with acid springs) Red alteration on andesite
EVA christobalite, quartz, antigorite, goethite
GS 5-5 (manifestation with acid springs) Green alteration on andesite
EVA christobalite, alunite
GS 9 (fresh andesite) Unaltered andesite Rietveld plagioclase
GS 15-A (manifestation with fumaroles) Highly altered material EVA quartz, kaolinite, rutile
(C)
Sample SiO2 TiO2 Al2O3 Fe2O3 MnO MgO CaO Na2O K2O P2O5 Total
GS 5-3 65.4 1.222 11.0 7.62 0.07 1.83 0.93 0.18 0.18 0.120 99.2
GS 5-5 81.8 1.095 6.9 0.27 < 0.01 0.01 0.10 0.09 1.17 0.161 99.1
GS15-A 79.8 1.448 7.4 1.95 0.02 0.14 0.15 < 0.01 0.22 0.076 99.2

46
Fig. 20 XRD patterns from surface rock samples (evaluated by Rietveld and EVA). GS9 as example for
unaltered andesite, GS5-1, 5-3, 5-5 and GS15-A are highly altered samples with main phases as indicated
Models
Geohydrochemical model
Geohydrochemical modeling with PHREEQC intends to predict possibly precipitating
minerals under certain pressure and temperature conditions. The first modeling step is to
adjust the reservoir water samples for the physical conditions of reservoir and main gas
phases of CO2 and H2S (Table 5A). Under these theoretical conditions, supersaturation is
controlled by Fe-, S-, Al- and K-concentrations forming muscovite, kaolinite, pyrite,
sulphur, chalcedony/quartz, alunite and gibbsite (Table 5). In a second step, reservoir
water has been set into equilibrium with these supersaturated minerals. However, the
acidic reservoir water (LHD23) remained supersaturated with respect to clay minerals
such as chlorite, chrysotile or talc. Hydrochemical simulation of hot spring water was in a
first step cooling, degassing and mixing of reservoir water. This water has been set into

47
mineral equilibration with supersaturated SiO2 minerals. After this second step, the water
is supersaturated in a high variety of mineral phases dominated by chlorite, muscovite,
silica-minerals (chrysotile, talc) and pyrite (Table 5).
Table 5 PHREEQC calculations of equilibrated and supersaturated minerals (A) in reservoir water (B) in
hot spring water, SI: Saturation Index
(A)
(B)
Geothermometer calculations
Calculated reservoir temperatures based on well water sample composition mostly
underestimate the measured borehole reservoir temperature (Fig. 21). The best fit for
calculations in acidic regime has been achieved by adiabatic quartz geothermometry.
Na/K-Giggenbach cation geothermometry resolves the second best results. In neutral
conditions, the smallest discrepancies to measured reservoir temperatures are satisfied
with Na/K-Giggenbach geothermometry. Na/K-Fournier geothermometry achieves the
second best results (Fig. 21).
Calculated reservoir temperatures based on hot spring samples using the quartz
conductive geothermometer mostly underestimate observed reservoir temperatures from
borehole-measurements. However, they are overestimated by Na/K Giggenbach
geothermometry (Fig. 21). The error ranges are the smallest in case of quartz conductive
geothermometry for acidic springs and in case of Na/K Giggenbach for neutral springs
(Fig. 21).
Sample In first step supersaturated mineral phases
Reservoir T [°C]
Reservoir p [bar]
Gas Phases [mmol/kg steam]
In final step supersaturated mineral phases (SI)
Neutral reservoir
muscovite (3), pyrite (3), kaolinite (1), sulphur (0.9), gibbsite (0.4), quartz (0.3), chalcedony (0.14)
232-387 89-159 40-135 CO2 9-30 H2S
-
Acid reservoir
muscovite (5), pyrite (4), kaolinite (1), alunite (0.9), sulphur (0.8), gibbsite (0.7)
200-274 121-139 356 CO2 24 H2S
chlorite (5.53), chrysotile (0.16), talc (5.04)
Sample In first step equilibrated mineral phases
In final step supersaturated mineral phases (SI)
Neutral springs quartz (1.4), chalcedony (1), amorphous silica (0.16)
albite, anorthite, aragonite, calcite, chlorite (11), chrysotile, dolomite, fluorite, goethite, hematite (8), illite, k-feldspar, muscovite (11), mackinawite, pyrite, quartz, rhodochrosite, talc (7)
Acid springs quartz (1.8), chalcedony (1.3), amorphous silica (0.5)
albite, anorthite, aragonite, ca- montmorillonite, calcite, chlorite (22), chrysotile (11), dolomite, fluorite, gibbsite, goethite, hematite, illite, k-feldspar, muscovite (7), kaolinite, mackinawite, pyrite (7), quartz, siderite, talc (15)

48
Fig. 21 Comparison of modelled and measured reservoir temperatures based on well water samples (A)
and hot spring samples (B). Acidic samples in green, neutral samples in blue
2.2.4 Discussion
Characterizing fault zones in geothermal systems plays a key role to improve the
reservoir performance. As faults might behave as barriers or conductors against the fluids,
they basically control the subsurface fluid flow processes (Moeck and Dussel, 2007). This
fluid flow determines the retention period of fluids in the reservoir rock, which
significantly affects the water-rock interaction. Water-rock-interaction, in turn, is one of
the main processes leading to variety in geohydrochemical properties of fluids and rocks
(Arnorsson, 2000). Therefore, geohydrochemical parameters can be used to locate and
characterize fault zones. In this study, several examples are presented to exemplify how
to trace fault zones using geohydrochemical investigations.
This study shows faults in the Lahendong reservoir acting as barriers in horizontal
direction preventing fluids from diluting each other. Faults are boundaries between two
reservoir compartments containing acidic and neutral water, respectively (Brehme et al.,
2014; Fig. 15, Fig. 22). On the other hand, faults open vertical pathways for fluids to rise
towards the surface. At the surface, hot springs are located along the faults, especially at
fault intersections, e.g. acidic springs appear on top of acidic section of the reservoir (Fig.
15). There, the deep acidic water exists due to H2S degassing from a magma chamber
beneath Lake Linau (Brehme et al., 2014). However, meteoric water infiltrates through
faults and therefore dissolves H2S, which lowers the pH and increases SO4 content. In
detail, H2S reacts with O2-rich meteoric water to SO2 and H2O, which results in acid

49
H2SO3. On map view, M9 and M13 show acidic springs, which are located off-fault spots
(Fig. 15). This spots are off the fault because their rise is not related to permeable fault
zones. Those are steam-heated springs, where the shallow groundwater is heated and
acidified by deeper-originated rising gases. In the steam-heated springs pH and Cl-
concentrations are typically substantially low. The acid water dissolves minerals,
especially metals, from the volcanic host rocks leading to increased SO4-, Fe-, Mn-and
Al-concentrations (Arnorsson et al., 2007).
Another approach to specify the water origin would be to focus on Cl- and B-
concentrations. In thermally heated water, such concentrations are much higher compared
to fresh cold water. This is probably due to the long existence period of thermally heated
water in the reservoir (Arnorsson, 1985). In the Lahendong reservoir, thermally heated
water is produced through the well “LHD 23”. This well brings Cl-concentration of
1559 mg/L and B-concentration of 13.1 mg/L. However, the rest of the neutral water
wells show mostly lower concentrations of Cl and B. The lowest Cl and B concentrations
are seen at the well “LHD 5” (Fig. 18). The content of the water produced at this well is
diluted with cold water near the surface infiltrating through a nearby fault (Fig. 22,
Brehme et al., 2014). Similar trends have been observed for correlation of electrical
conductivity with Cl- and B-concentrations, because Cl is the dominating element in
water composition. Observations are interpreted to represent that the composition and the
location of reservoir water is controlled by fluid flow along the vertically permeable fault
zones in Lahendong field.

50
Fig. 22 Conceptual geohydrochemical model of the study area, described by cross-sections with geological
layering, fault location, temperature distribution, sample points and alteration patterns, (modified after
Brehme et al., 2014; Utami, 2011)
The faults and fractures have an effect also on temperature and productivity of the
reservoir. In Lahendong, the northern section of the reservoir is 60°C cooler than the
southern section while its productivity is five times higher. Despite the lower
temperature, this substantially high productivity is probably due to existence of vertically
permeable fractures increasing the fluid flow. These fractures allow also infiltration of
cold surface water into the reservoir, which leads to lower reservoir temperatures in this
particular area (Fig. 22).
Another important process changing the properties in a geothermal reservoir is the
interaction between water and rock. Basically, mineral composition of reservoir rock
changes during chemical reactions with water. The main requirement for such reactions is
enhanced fluid flow. The modification of rock depends on the fluid type. In Lahendong,
the rocks hosting the acidic water contain more clay and sulphur minerals. Numerical
modeling results from this study show that acidic and neutral content play different roles
on chemical reactions. This confirms that the acidic water alters the host rock more than
the neutral water does (Fig. 22). Clay minerals, such as chlorite, mica and illite exist in
rocks hosting acidic waters due to the chemical process leading to hydrothermal alteration
of primarily abundant minerals. Primary minerals (i.e. feldspar) are altered to secondary
minerals, which are more stable, such as clays, i.e., illite, kaolinite or smectite (John,
2007; Utami, 2011). Mineral modifications have been intensively studied in the

51
Lahendong geothermal field. Alteration patterns are particularly widespread in the
northern section of the reservoir, which is acidic and highly fractured (Utami, 2011, Fig.
22). To sum up, rock alteration is mainly controlled by water-rock-interaction in highly
fractured and therefore permeable areas accommodating increased fluid flow. Therefore,
zones of high alteration indicate areas of increased fluid flow. However, alteration of the
host rock can later decrease the permeability by filling of fractures with secondary
minerals.
Furthermore, the increased fluid flow leads to slow equilibration of waters. Geothermal
waters being in equilibrium stage are suitable for geothermometer calculations. In other
words, large error ranges in geothermometer calculations give a constrain regarding the
equilibration and therefore the fluid flow of a geothermal field. In Lahendong,
geothermometer temperatures have been calculated using the Na/K Giggenbach
geothermometer even though the wells do not satisfy the fully equilibrium stage.
Therefore, the temperature calculation shows high errors ranging between 10% and 30%.
In Lahendong, only water from the well “LHD 10” shows equilibration stage. The well is
located away from fault zones. Calculated temperatures at well “LHD 10” and “LHD 12”
represents the best case, where the errors range at 3-11% bounds compared to the
measured values. Increased fluid flow prevents the wells from equilibration stage in the
Lahendong geothermal field.
Degassing and boiling due to pressure release are the further processes driving the fluid
flow/phase change in this geothermal system. Degassing is mainly observed in the
northern section of the acidic reservoir. This area hosts the highest CO2 and H2S
concentrations, as measured in discharge at the well “LHD 23”. At the surface, gas
discharge is seen at several fumaroles around the Lake Linau. Furthermore, increased
electrical conductivity has been measured in the northern section of the reservoir. This
suggests a high salinity content that is caused by subsurface boiling evaporating the water
and wasting the heat from the geothermal fluid (Arnorsson, 2000). Eventually, the
increased electrical conductivity and therefore high salinity locates low temperature
regions in that area.
In the Lahendong geothermal system, hydraulic conductivity of fault zones strongly
influences geohydrochemical reservoir characteristics. The observations mentioned above
show that the permeability controls fluid flow and distribution of water types. The fluid
flow in fractures influences reservoir-temperature, alteration degree of host rocks and
productivity of the geothermal field. Main processes controlling the fluid flow and phase
change in this environment are degassing and water-rock-interaction.

52
2.2.5 Conclusion
In this study, geohydrochemical data are investigated to understand hydraulic
conductivity of fault zones. Investigated geohydrochemical properties are fluid- and rock-
composition and the interaction between fluids and rocks. These properties depend
strongly on fluid flow, which is increased in high permeable areas.
Geohydrochemical properties are analyzed using on-site measurements, samples and
verified by results from numerical modeling. Measurements show two reservoir sections
reflecting different geohydrochemical properties and therefore suggesting a horizontally
impermeable fault representing a boundary between different chemical regimes. One
section is characterized by acidic water, considerable gas discharge, high productivity and
strongly altered rocks. The other section hosts neutral waters, high temperatures and less
altered rocks. Those reservoir conditions observed on-site have been confirmed by
numerical models.
The combination of methods in this study suggests that the geohydrochemical reactions
are mainly controlled by fluid flow through the faults/fractures. Fluid flow increases in
permeable areas and causes rise or infiltration of fluids at such vertically permeable spots.
Therefore, the location of hot springs or fluid loss is used to investigate permeability of
fault zones.
Subsurface fluid flow causes enhanced water-rock-interaction. Increased chemical
activity results in alteration of rocks. Hence, altered rocks give evidence for areas with
primary permeability reflecting increased water-rock-interaction. Reactions between
water and rock, and the thermal environment are reasonably converged by numerical
models. Combination of all those approaches allows characterizing the permeability
distribution along the geothermal reservoirs.
Investigating the permeability distributions along the geothermal reservoir is crucial for
site selection and smart drilling strategies. They support a sustainable exploitation of the
geothermal field avoiding risks, such as low-productive wells or the production of highly
corroding waters. In this frame, the developed conceptual models allow reconstructing
observed patterns and therefore forecasting potential physical developments in response
to the use of a geothermal field.

53
2.3 Influence of fault zones and fluid-properties on subsurface
fluid flow in the Lahendong geothermal field - insights
from numerical simulations
2.3.1 Introduction
Geothermal energy is an essential component to supply future energy demands. However,
it is required to develop new geothermal sites and improve the performance of existing
systems to satisfy this demand. Different geoscientific approaches are combined to assess
the potential of new sites as well as to improve existing geothermal systems.
The productivity of a geothermal field mainly depends on subsurface fluid flow, which is
in active tectonic regions controlled by permeability of fault zones (Moeck, 2014). In that
frame, the primary focus is to locate and characterize faulted areas in geothermal fields.
Subsurface fluid flow is controlled by pressure and temperature in the reservoir. Those
parameters control the phase transition, density and viscosity of the fluids and therefore
provide additional constraints for reservoir characterization. This study employs
numerical modeling for reservoir analysis to quantify influence of fault zone
permeability, physical fluid properties and phase transition on subsurface fluid flow in
geothermal reservoirs.
The test ground for this study is the Lahendong geothermal field located in Sulawesi,
Indonesia. The field is owned and operated by P.T. Pertamina Geothermal Energy and
has an installed capacity of 80 MWe. Geothermal exploration started in the early 1970´s
including geophysical and geohydrochemical approaches. It is a magmatic structurally
controlled system. Faults generally act as horizontal fluid barriers and vertical fluid
conductors (Brehme et al., 2014). As a result, hot springs mainly arise upward along the
vertically permeable faults. Numerous drilling data and surface measurements allowed a
detailed characterization of the geological and hydrogeological setting of the study area
(Fig. 23, Brehme et al., 2011, 2013, 2014; Wiegand et al., 2013). The presented models
here are developed for investigating subsurface fluid flow including the fault zones in the
Lahendong geothermal field. The preconditions of the field are presented and followed by
an introduction to the modeling approach. The results reproduce measured pressure,
temperature and 2-phase proportion in the model domain.
Numerical models for hydraulic, thermal and fluid phase conditions have been
increasingly used to understand the set up and productivity of geothermal systems. A
general overview of geothermal models has been given by O’Sullivan et al. (2001).
Additionally, there are several sites exemplifying similar characteristics. The Kakkonda

54
geothermal site consists of two reservoirs in various depths with different fluid properties.
There, results from fluid flow analysis show the importance of fractures for fluid
transport enhancing the recharge into or discharge from the reservoir (McGuinness et al.,
1995). Models for the Seferihisar–Balçova field focus on the fluid flow inside of faults.
Results show an enhanced upward heat transport through fluids from bottom of the
geothermal system (Magri et al., 2011). Dachny geothermal models show fault controlled
temperature, pressure and phase propagation in this reservoir. Taking everything into
account, phase transition-based consideration of fluids allowed a more realistic simulation
of fluid/head flow compared to the assumption of stable water phase in the reservoir
(Kiryukhin, 1996).
Detailed investigation of subsurface fluid flow is a crucial step for site selection and
smart drilling strategies. The presented numerical simulations will provide insight into
understanding the subsurface fluid flow considering hydraulic conductivity of faults and
physical properties of the fluids. It ensures productive as well as sustainable operation of
geothermal fields avoiding risks, such as wells drilled on non-fractured or cold zones, and
the circulation of highly corroding waters. Although the target area is Lahendong, the
models are applicable for other geothermal sites consisting of similar boundary
conditions.
Fig. 23 Topographic map of the study area with geological features, water and rock sample locations and
model cross section

55
2.3.2 Precondition
Hydrogeological set-up
The overall driving force for the fluid flow in the Lahendong geothermal system is the
SW-NE oriented natural hydraulic gradient. Beneath Lake Linau, the direction of fluid
flow is slightly rotated to WSW – ENE. The direction of fluid flow varies through the
geothermal site due to horizontal partitioning of reservoir by relatively less permeable
fault zones. The basic sections are located in the south, in the east and beneath of Lake
Linau. The types of fluid change from one section to another, e.g., an acidic highly saline
type beneath Lake Linau and a neutral low saline type south and east of Lake Linau. The
horizontally impermeable faults prevent the fluids from diluting each other. However,
faults are rather permeable in vertical axis, which allows recharge of the system through
the faults. Rainwater infiltrates at a fault in the NW, at Mt. Lengkoan, and creek water
infiltrates into the normal faults at Lake Linau. The hydrothermal system discharges into
Lake Linau and towards the NE, as driven by the hydraulic gradient.
The fracture network along the area is characterized by strike slip faults and normal
faults. The sinistral faults strikes N 40° clockwise and dips towards the SE. Left step over
on the strike slip faults forms an extension basin in the central study area. Normal faults
at the extension basin strike NW and dip 70° - 80° beneath Lake Linau (Brehme et al.,
2014).
Lithology
Lahendong area is mainly characterized by Pre-, Post- and Tondano formation of Plio- to
Pleistocene age (Koestono et al., 2010). The rocks are typically andesite, volcanic breccia
and tuff. Those types have been sampled from borehole-cores and used to determine
porosity, permeability and thermal conductivity. Effective porosity and matrix
permeability has been analyzed using cylindrical shaped specimen with a dimension of
5cm x 5cm x 2.5cm parallel to the bedding. Thermal conductivity has been measured on
plain sections of dried cores. The experimental set-up consists of a gas-permeameter for
determining matrix permeability, of a helium pycnometry for effective porosity
measurements and of an optical scanner for thermal conductivity measurements (Popov et
al., 1999). These parameters have been measured and averaged for the three rock types
(Table 6). Andesite has an effective porosity of 3.7%, a permeability of 5.26E-15 m2 and
a thermal conductivity of 1.782 W/m/K. Tuff has a porosity of 7.7% but the lowest
permeability of 1.97E-15 m2 and a thermal conductivity of 1.615 W/m/K. Volcanic
breccia is the most permeable layer with an effective porosity of 10.5%, a permeability of
2.32E-14 m2 and a thermal conductivity of 1.624 W/m/K. Reservoir rocks reflect

56
generally low matrix permeability suggesting fracture-controlled fluid flow through the
aquifer.
Table 6 Thermal and hydraulic parameters of the Lahendong reservoir rocks measured in laboratory
Sample Rock type
Effective
Porosity
[%]
Thermal
conductivity dry
[W/m/K]
Matrix-
Permeability
[m2]
LHD1 500-501 A 1.1 1.980
LHD1 801-802 B 14.5 1.629 1.53E-14
LHD1 1000-1001 T 5.0 1.834 8.90E-16
LHD1 2100-2101 T 7.2 1.449 3.31E-15
LHD2 300-302 A 12.5 6.11E-14
LHD3 2201-2203 B 5.7 2.103 1.49E-14
LHD4 652-653 B 6.3 1.26E-14
LHD4 850-852 A 1.6 1.786 2.25E-14
LHD4 1001-1002 B 16.4 1.371 6.82E-14
LHD4 2304-2305 A 1.6 1.759 3.38E-16
LHD5 602-603 B 16.3 1.381 1.12E-14
LHD5 752-753 A 2.7 1.08E-16
LHD5 1102-1103 A 5.2 7.88E-14
LHD5 1404-1406 A 3.6 1.925 2.95E-15
LHD5 1575-1576 A 0.6 7.92E-18
LHD7 901-902,3 A 4.6 1.483 7.15E-16
LHD7 1567.8-1568 T 11.0 1.563 1.70E-15
LHD7 1756-1758 B 3.9 2.122 1.68E-14
average values
Andesite (A) 3.7 1.782 5.26E-15
Breccia (B) 10.5 1.624 2.32E-14
Tuff (T) 7.7 1.615 1.97E-15
2.3.3 Model set-up and parameter estimation
Numerical models developed for the study area represent the initial condition of the
reservoir. In this study, the commercial finite-element software FEFLOW is used to
model pressure-driven and thermally induced density- and viscosity-driven fluid flow.
Details on the software and the parameterization can be found in (Diersch, 2014).
TOUGH2 and the equation of state module for water is used for modeling 2-phase-
propagation in the reservoir (Pruess, 1991).
FEFLOW-model
The FEFLOW model geometry is a 2D vertical NE-SW trending cross section extending
6 and 3 km in horizontal and vertical axis, respectively. The homogeneous and isotropic
geological layers are layered horizontally. Two faults in the middle of the model, striking
perpendicular to the cross section, dip with 84° towards a magma chamber beneath Lake
Linau (Fig. 24). Details on structural and geological components of the modeled region
have been already explained in section 2.1 (Brehme et al., 2014).

57
The mesh used for the numerical simulation in FEFLOW consists of 81,579 nodes and
150,723 elements that are more intensified surrounding the faults because of expected
gradients due to parameter contrast. Accordingly, physical properties of the faults are
slightly adapted, e.g. lower and higher permeability in horizontal and vertical axis,
respectively. The definitions for the modeled grids along the faults are as follows:
Vertical permeability of 1.3E-11 m2, horizontal permeability within the range of 1.3E-13
m2 - 1.04E-19m
2, porosity at 30%, and a thermal conductivity of 1.782 W/m/K. The Lake
Linau is included in the model and the corresponding grids are defined by a porosity of
30%, a permeability of 1.3E-11 m2 and a thermal conductivity of 0.597 W/m/K. Grids for
remaining geological layers have been defined based on the laboratory measurements
(Table 6). The model simulates transient flow and thermohaline transport in saturated
media. The modeling is done for 1,000,000 years of time period with an increment of 1E-
06 days at the beginning.
Hydraulic boundary conditions in the model describe groundwater heads and recharge
amounts. The hydraulic head at the left model border is 860 m and at the right border
485 m. The left hydraulic head represents infiltration of surface water into a fault, striking
perpendicular to the model. Hydraulic head at the right border is adapted to borehole
measurements in that area (Brehme et al., 2014). Fluid movement is constrained by no-
flow boundary at the bottom, recharge through the surrounding fault zones and the spots
of low hydraulic heads in the right model area. Infiltration into the fault zone to the
southwest of Lake Linau is described by limited fluid-influx. The quantity is depending
on the hydraulic head throughout simulation and at maximum 1037 m3/d. Injection into
the fault right of Lake Linau is constant 432 m3/d as described by an injection well.
Groundwater recharge is set at the NE top surface to 1.13 mm/d. Discharge of the system
is in the central study area mainly towards Lake Linau and across the NE model
boundary. Initial hydraulic head condition is 500 m (Fig. 25).
Initial temperature is set to 200°C. The thermal boundary conditions are time-invariant
and fixed temperatures and heat flux. Thermal gradient is 120°C/km at the model
boundary on the left and constant temperature is 350°C at the magma chamber.
Temperature of water infiltrating into faults and groundwater recharge is 28°C. Heat flux
is set to 60 mW/m2
at the bottom model boundary. This value is fixed based on the results
from Neben et al. (1998) and Delisle et al. (1998). Increased heat flux in volcanic areas,
as mentioned by Nagao and Uyeda (1995), is incorporated in this model by high
temperature at the magma chamber (Fig. 24).

58
TOUGH2-model
Geometry of the TOUGH2 model is similar to the FEFLOW set up besides the top and
bottom model boundary. Top surface is at the bottom of the lake and bottom model
boundary is the top of the magma chamber. The model consists of 10,254 elements that
are more intensified surrounding the faults. The modeling is done for a time period of
1,000,000 years. The model set up is held simple with four different geological elements,
e.g. two faults, area between the faults and the rest of the model. The porosity,
permeability and heat conductivity is averaged for each element.
Boundary and initial conditions have been fixed according to the FEFLOW model despite
some slight changes, e.g., infiltration in TOUGH2 is fixed at the top of the faults and
expressed by mass flow and enthalpy and the temperature gradient of 120°C/km is set
throughout the entire model (Fig. 24).
Fig. 24 Cross section of the modelled area with boundary conditions and location of observation points
2.3.4 Results
Numerical simulation is performed to obtain the best fit to the measured data changing
the permeability, physical properties and 2-phase propagation of fluids. Simulated
pressure, temperature and 2-phase patterns giving the best data fit are considered to
generate the final model developed for the Lahendong.

59
Parameter testing
Parameters tested are temperature, permeability and infiltration rates. Porosity change and
heat flux variation is negligible and therefore remained constant (Ondrak et al., 1998).
Initial values are defined based on bore log data and laboratory measurements. The
parameters are adjusted in a stepwise way according to the modeling results. Temperature
conditions tested in the model are the thermal gradient and temperature at the magma
chamber. The natural thermal gradient of 120°C/km is found to be the best fitting
simulated gradient. A temperature range of 100 – 150°C/km has been tested during the
simulation. The temperature of magma chamber is tested within a range of 50°C – 400°C,
and the optimum value is found at 350°C. Permeability has been tested at different
sections of the model, separately, e.g. faults and the rest of the model area. Simulation
results show strong discrepancies between modeled and measured pressures and
temperatures beneath Lake Linau. These large misfits are minimized including an
additional fault zone, which is not seen at the surface in this area. The permeability test
range varies between 1E-05 and 1E-20 m2 in horizontal direction and between 1E-03 and
1E-20 m2 in vertical direction. In general, defining a direction dependent permeability
improves the data fit rather than using similar permeabilities in all directions. This is
probably due to the fractures increasing the permeability mostly in vertical axis. The best
directional combinations of permeability are not the same for FEFLOW and for
TOUGH2 model. The permeability range (x/y) for the faulted/fractured zones: 1E-13/1E-
11 m2 (FEFLOW) and 1E-12/1E-10 m
2 (TOUGH2); for the area falling between the
faults: 1E-15/1E-13 m2 (FEFLOW) and 1E-19/1E-15 m
2 (TOUGH2) and for the model
rest: 1E-17/1E-13 m2 (FEFLOW best fit for temperature) or 1E-13/1E-13 m
2 (FEFLOW
best fit for pressure) and 1E-10/1E-13 m2 (TOUGH2). Surprisingly, TOUGH2-values for
the model rest vary from the assumption, that the vertical permeability is higher than the
horizontal. Infiltration rates have been tested considering water recharge through the
faults. The tested range is 0.0007 – 12 kg/s at 28°C. The best fitting values of 5 and
12 kg/s are in good agreement with measured rates. The total number of models run is
100 (Table 7).
Pressure
The pressure distribution in the study area is controlled by groundwater flow in low
permeable rocks and vertically high permeable fault zones. Isobars drop following the
natural hydraulic gradient from SW to NE. The SW section of the system is over-
pressurized, which is caused by infiltration into low permeable layers. The wells existing
in this region are artesian-type. Overpressure releases through the fault zone southwest of
Lake Linau and discharge towards surface. The pressure drops occur up to 20 bars while
entering the faults. Nevertheless, the constrained fluid flux boundary condition on top of

60
the fault causes limited outflow and pressure increase in the upper part of the fault (Fig.
25).
Temperature
Convective heat transport dominates the temperature distribution along the Lahendong
geothermal reservoir. Isotherms generally follow the SW-NE oriented flow pattern, the
rise and the infiltration of fluids. Upwelling of isotherms between the faults verifies water
rise towards the Lake Linau. Infiltration of cold water causes down welling of isotherms
particularly on the northeast section of the model. Temperature is locally increased at the
bottom of the model surrounding the magma chamber. The highest temperatures therefore
appear at the bottom of the model in the southwest (Fig. 25).
Fig. 25 Modelled temperature and pressure distribution in the study area
2-phase
2-phase propagation of fluids through the reservoir depends on local pressure and
temperature distribution. Due to high pressure at depth, the fluid remains in liquid phase.
Pressure release in shallower depths causes phase transition to steam, especially near the
faults. Steam proportion goes up to 100% inside the faults and remains at 40% to 70% at
off-fault locations (Fig. 26).
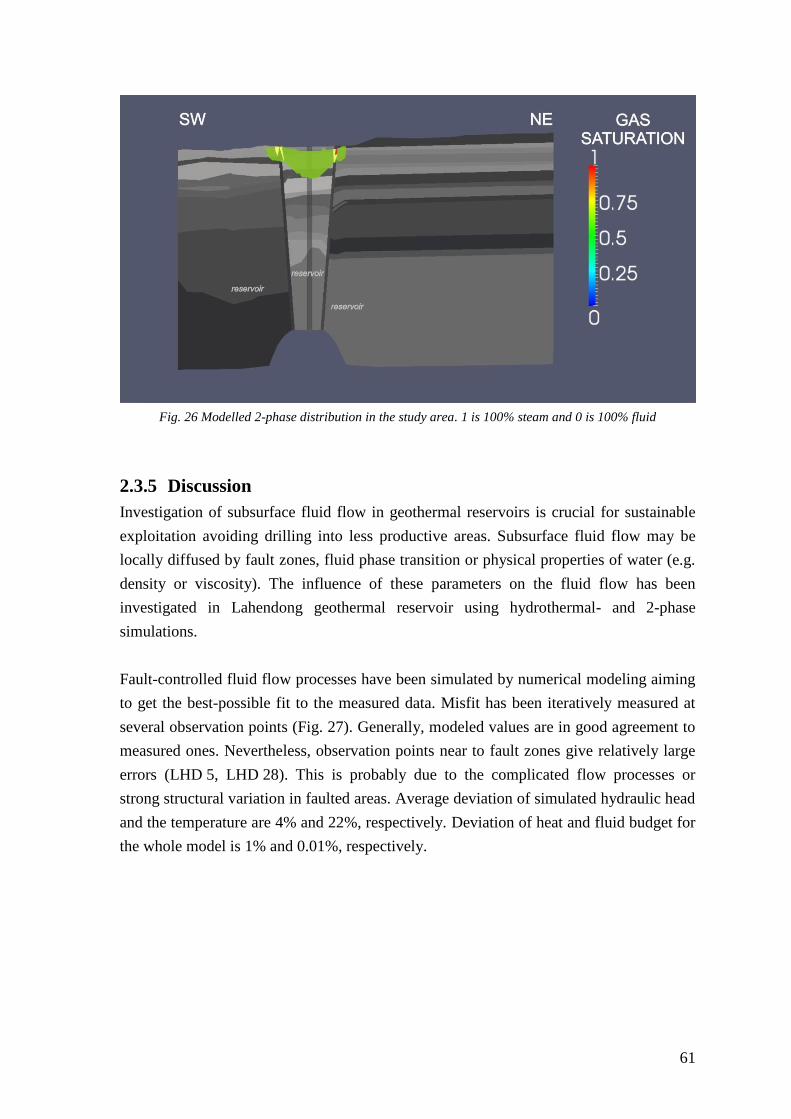
61
Fig. 26 Modelled 2-phase distribution in the study area. 1 is 100% steam and 0 is 100% fluid
2.3.5 Discussion
Investigation of subsurface fluid flow in geothermal reservoirs is crucial for sustainable
exploitation avoiding drilling into less productive areas. Subsurface fluid flow may be
locally diffused by fault zones, fluid phase transition or physical properties of water (e.g.
density or viscosity). The influence of these parameters on the fluid flow has been
investigated in Lahendong geothermal reservoir using hydrothermal- and 2-phase
simulations.
Fault-controlled fluid flow processes have been simulated by numerical modeling aiming
to get the best-possible fit to the measured data. Misfit has been iteratively measured at
several observation points (Fig. 27). Generally, modeled values are in good agreement to
measured ones. Nevertheless, observation points near to fault zones give relatively large
errors (LHD 5, LHD 28). This is probably due to the complicated flow processes or
strong structural variation in faulted areas. Average deviation of simulated hydraulic head
and the temperature are 4% and 22%, respectively. Deviation of heat and fluid budget for
the whole model is 1% and 0.01%, respectively.

62
Fig. 27 Modelled versus measured hydraulic head and temperature at selected observation points
Adjusted model parameters are porosity, permeability and heat conductivity. From those
parameters, only permeability has been tested in a specific range during simulation. The
influence of porosity and heat conductivity on fluid flow is negligible (Ondrak et al.,
1998). Measured permeabilities represent matrix permeability of rocks. Nevertheless, the
permeability in reservoir rocks might be locally increased due to fracture formation. It
might also be decreased due to alteration and sealing in faults. The measured permeability
is 7.4E-15 m2 on average, which remains within typical permeability range for fractured
igneous rocks (Schön, 2004). Permeability for volcanic breccias ranges typically between
5.1E-12 m2 and 3E-15 m
2 and tuff permeabilities range between 7E-12 m
2 and 7E-17 m
2
(Klavetter and Peters, 1987). In the Wairakei geothermal field, simulating the
impermeable layers resulted in permeabilities of E-14 m2 and E-18 m
2, in horizontal and
vertical axis, respectively (Mercer and Faust, 1979).
Permeability is the main factor influencing subsurface fluid flow and temperature
distribution in the Lahendong reservoir area. Subsurface fluid flow is characterized by
local hydraulic heads, which shows high variations at different sections of the study area.
Each section has its own flow regime. The sections are separated by faults in the south
and the north of Lake Linau, acting as fluid barriers. Across these barriers, the hydraulic
head drops by 150 m. A similar pattern has been observed beneath the Lake Linau. In this
area, another fault zone has been implemented into the model in order to get a reasonable
fit between the modeled and the measured data. The fault zone beneath Lake Linau
remains under lake water and therefore is not traced at the surface. The low permeability
in horizontal axis through the faults pushes the fluids vertically towards the hot springs at
surface. It also allows surface water to infiltrate into the reservoir in case the pressure

63
within the fault zone is low enough. This vertical fluid movement eventually controls the
temperature distribution in the reservoir. Upward migration of deep hot water increases
the temperature, while infiltration of cold surface water causes local drop of temperature
within the fault damage zone.
Also, fluid phase transition has a major effect on fluid flow and temperature field in the
reservoir. Modeling the 2-phase flow requires adapting the permeability in a parameter
range in the order of magnitude 4 compared to models based on pure water. This is
because fluid flow properties, especially density, dramatically change during the phase
transition. The area reflecting the most prominent phase change remains beneath Lake
Linau. Especially, the modeled permeabilities are substantially low in this area. Average
error for temperature simulation remains at 25% adjusting the best possible permeability
range. The best fit for pressure simulation is 69%. Here, relatively high error bounds are
probably due to a simplified model setup in TOUGH2. Furthermore, it might be caused
by more complicated flow characteristics in comparison to pure water simulation in
FEFLOW. The simplification has no influence on the overall understanding of the system
based on the direction of fluid flow as well as the distribution of pressure, which remain
almost identical in all models.
Table 7 Parameters of the best models obtained in FEFLOW and TOUGH2
In summary, the most important factors influencing the reliability of numerical reservoir
models are permeability and fluid phase transition. The permeability of fractures directly
influences the productivity of the reservoir (Blöcher et al., 2010). Permeabilities should
be decreased to realize similar flow behavior in 2-phase regimes because flow behavior of
steam and pure water is similar only in case of low permeability. Pure water cannot move
at permeabilities below 5E-18 m2 (Pruess and Narasimhan, 1982).
A previous numerical model for the Lahendong site has been set up in TOUGH2 and
aimed at forecasting the reservoir behavior during exploitation until 2036. With a
Geology Porosity [%] according to
laboratory measurements
Heat conductivity [W/m/K]
according to laboratory
measurements
Permeability x
best fit [m^2]
Permeability z
best fit [m^2]
FEFLOW best
temperature fit
best
pressure fit
Andesite 3.7 1.782 1.30E-18 1.3E-14 1.3E-14
Volcanic breccia 10.5 1.624 1.30E-16 1.3E-12 1.3E-12
Tuff 7.7 1.615 1.30E-17 1.3E-13 1.3E-13
Faults 30 1.782 1.3E-13 1.3E-13 1.3E-11
between faults according to layer according to layer 1.3E-15 1.3E-15 1.3E-13
Lake 30 0.597 1.3E-13 1.3E-13 1.3E-13
TOUGH2 rest of model 7.3 2 1.3E-10 1.3E-13
faults 30 2 1.3E-12 1.3E-10
between faults 7.3 2 1.3E-19 1.3E-15

64
production of 60 MWe it predicts a pressure drop of 10 bar. However, the forecast results
are uncertain due to lack of measured pressure draw down data (Yani, 2006).
2.3.6 Conclusion
The primary focus of this study is to understand the influence of fault zones and fluid
properties on subsurface fluid flow in geothermal reservoirs. This is done using numerical
reservoir simulation. Understanding the fluid flow is important for analyzing the
productivity of geothermal sites. The fluid flow mainly depends on rock and fault zone
permeability, and also fluid properties. These processes have been considered in
numerical models, which simulate local temperature and pressure conditions.
The numerical models represent the initial reservoir conditions, which refers to the case
before production starts. Models are developed based on the conceptual models of the
study area, which explain reservoir geometry, geological structures, temperature and
hydraulic conditions. Temperature and pressure well-logs have been used for model
calibration. The models are used to investigate the effect of permeability and fluid phase
transition on fluid flow behavior.
Vertical and horizontal fluid flow is controlled by fault permeability. This characteristic is
used to simulate different reservoir sections and vertical fluid rise towards the surface.
Fluid flow is also influenced by fluid phase transition. Steam propagation at top of faults
stimulates vertical fluid rise. However, in case of 2-phase flow simulations,
permeabilities have to be lower to achieve same pressure and temperature conditions.
The overall shape of fluid flow direction trends in a SW-NE direction. Main recharge
occurs by infiltration the surface water into the faults, especially in the SW and near to
Lake Linau. Discharge is enhanced in highly fractured areas towards Lake Linau. Vertical
permeability of faults allows fluids rising towards the hot springs at surface.
Results show that permeability and fluid properties have a similar weight to consider for
simulation of a geothermal system. The geothermal system is mainly controlled by fluid
flow in fractures/faults as well as phase transition depending on temperature and pressure
conditions. The locally modified fluid flow can considerably influence the productivity of
a geothermal field. Results also guide reservoir management in case of a potential for
field extension, as performed in Lahendong.

65

66

67
3 Conclusions and outlook
The most efficient way for characterizing geothermal systems is the combination of
methods to one multidisciplinary approach. This approach aims primarily at assessing the
energy potential of a geothermal system. The energy potential is controlled by several
reservoir conditions, while the most important one is fluid flow. Fluid flow in geothermal
reservoirs is characterized by composition of fluids and permeability distribution along
the field.
The composition of fluids and its effect on fluid flow is commonly considered to
characterize geothermal reservoirs. However, the distribution of hydraulic conductivity in
the subsurface, which is in active tectonic regimes mainly controlled by fault zones, is
underestimated in geothermal reservoir characterization. Therefore, in this study, we
addressed essential questions regarding characterization of geothermal fields, i.e., “What
is the role of fault zones in geothermal fields?” or “What is the best combination of
methods to characterize the efficiency of fault zones at geothermal sites?”. Test ground
for this study is the Lahendong geothermal field. The approach integrates geological and
geohydrochemical results with numerical simulation.
Geological methods used in this study consist of structural-geological mapping,
physicochemical measurements in fluids, surface tracer experiments and well-log
analysis. Results from these investigations are combined in a conceptual fault model,
which shows that the Lahendong reservoir is subdivided into different sections. The
subdivision occurs at fault zones, which either act as fault-normal flow barriers due to
sealing of the fault core, or as conductive pathways in the damage zone sub-parallel to the
fault strike. The damage zone, especially in case of extensional faults, is characterized by
fractures. Two fundamental phases of faulting have been identified by the structural
investigations. These new observations describe the role of fault zones in geothermal
fields, especially in the Lahendong area.
The main contribution of this study is to show that systematically performed structural
analysis helps to understand the fluid flow in geothermal reservoirs. In that frame,
present-day stress field provide insights into the hydrogeological role of fault systems.
The spatial distribution of structural elements and their temporal evolution has been
combined with their hydraulic properties to explain subsurface fluid flow. It has been
confirmed that the hydrotectonic concept combining the tectonic and hydrogeological
information essentially improves the understanding of subsurface flow of thermal fluids,
which is the basic source of geothermal power plants.

68
Geohydrochemical methods used in this study consist of on-site physicochemical
measurements, chemical analysis of samples and verification of those observations by the
results from numerical modeling. Those investigations allow characterizing fluid- and
rock-composition and the interaction between fluids and rocks. Measurements show two
reservoir sections reflecting different geohydrochemical properties and therefore
suggesting a horizontally impermeable fault representing a boundary between different
chemical regimes. One section is characterized by acidic water, considerable gas
discharge, high productivity and strongly altered and fractured rocks. The other section
hosts neutral waters, high temperatures and less altered rocks. These reservoir conditions
observed on-site have been confirmed by numerical models.
The results from geohydrochemical analysis show that the chemical reactions are mainly
controlled by fluid flow through the faults/fractures. Fluid flow increases in fractured
permeable areas and causes enhanced water-rock-interaction. Hence, evidences for
enhanced water-rock-interaction, such as alteration patterns or type and location of hot
springs, allow characterizing the permeability distribution along the geothermal
reservoirs. This is crucial for site selection and smart drilling strategies, which supports a
sustainable exploitation of the geothermal field avoiding risks, such as low-productive
wells or the production of highly corroding waters with low pH values.
Numerical hydraulic simulations consider rock and fault zone permeability as well as
fluid properties for the study area. Numerical analysis is performed built on the
previously derived conceptual models in order to simulate local temperature and pressure
conditions. Temperature and pressure well-logs have been used for model calibration.
The main conclusion is that vertical and horizontal fluid flow is controlled by fault
permeability. This characteristic behavior is used to simulate different reservoir sections
with a general fluid flow in SW-NE direction. Recharge and discharge occurs along the
faults, especially in the SE and near to Lake Linau. Fluid flow is also influenced by fluid
phase transition. Steam propagation at top of faults stimulates vertical fluid rise, because
steam propagates faster due to lower density. Therefore, in case of 2-phase flow
simulations, permeabilities have to be lower to satisfy same pressure and temperature
conditions.
Results from numerical simulations show that permeability and fluid properties has a
similar weight to consider for simulation of a geothermal system. The geothermal system
is mainly controlled by fluid flow in fractures/faults as well as phase transition depending
on temperature and pressure conditions. Those parameters must be carefully considered
for a sustainable exploitation of a geothermal reservoir. In summary, numerical
69
simulations allow predicting reservoir conditions in areas without measurements and for
future scenarios.
The main conclusion of this study is that fault zones have an essential influence on
geothermal reservoir behavior. The hydraulic conductivity of fault zones controls the
subsurface fluid flow. To characterize hydraulic conductivity of fault zones, it is proposed
to combine structural geological mapping with hydrogeological investigations.
Furthermore, geohydrochemical analysis of fluids and rocks broadens the understanding
of flow directions and of quantity of fluid flow while numerical simulations allow
modeling the permeability distribution in sparsely sampled spots of the target area.
The subsurface permeability distribution can also be characterized by tracer tests in wells
or geophysical measurements at the surface. Tracer tests cover the local permeability
distribution around the tested well or between several wells. Seismic investigations reveal
subsurface distribution of geological layers and fault zones based on impedance-contrasts.
Magnetotellurics measure the electrical conductivity and give information on geological
layer properties. However, the resolution often does not allow to detect small
heterogeneities on reservoir scale.
Understanding the permeability distribution along a geothermal reservoir is crucial for a
sustainable exploitation of the reservoir. It allows managing a profitable set-up for
production and injection locations before production starts. On the other hand, it ensures
the constant fluid flow towards production wells in producing geothermal fields and
reduces the risk for further drilling in the frame of field extension.

70
71
Acknowledgements
First of all I would like to thank my supervisors Prof. Dr. Martin Sauter and Prof. Dr.
Günter Zimmermann for their support, encouragement and supervision. They gave me the
chance to conduct the Ph.D. within the excellent research group of Prof. Dr. Huenges
„International Research Centre for Geosciences (ICGR)“ at GeoForschungsZentrum
Potsdam. Special thanks go to Prof Dr. Inga Moeck, Dr. Simona Regenspurg, Dr. Bettina
Wiegand and Dr. Guido Blöcher for co-supervising my study.
The work has been funded by the German Federal Ministry of Education and Research
under grant 03G0753A. This support is gratefully acknowledged. However, this study
would not have been possible without support from Pertamina Geothermal Energy, who
gave me access to the field and to data in Lahendong. Thanks a lot for the warm welcome
and support during my visits to Indonesia, especially to Yustin Kamah and his team, to
Harry, Agung, Marihot as well as Pudyo, Cici, Dhanie, Syamsul, Anggo, Imam, Wahyu,
Sigit, Uus and all the teams from Lahendong, Ulubelu and Sibayak.
Special thanks to my colleagues at GFZ, especially to those involved in the project and
those who assisted me during my accident in Indonesia: Ernst, Kemal, Makky, David,
Philippe, Andhika, Nukman, Amela, Fiore, Sintia, Muksin, Yodha, Wiyono and to
Bettina Wiegand, Ikhlas, Firman and Rasi at Georg-August-Universität Göttingen. I
would like to appreciate Andhikas help during my first stay in Indonesia and the further
support while communicating with our Indonesian colleagues. Special thanks to Kemal
for always facing me with challenging questions and having a good word in hard times.
Thanks to Alireza and Luca for the nice atmosphere in our office, which made it always
easier to work. Special thanks go to Henning for teaching me fundamental physical laws
if not accompanying me on a crazy trip through Iceland or North-Germany.
Prof. Dr. Manfred Hochstein is acknowledged for the fruitful discussions on
geochemistry. Dr. Mauro Cacace and Dr. Warwick Kissling setting up the basis for the
TOUGH2-model and always being a helping throughout improving the models and Dr.
Till Francke for support in experimental setup of the tracer tests. I thank I.Piper, S. Tonn
and K. Günther for fluid-analyses, R. Naumann, A. Gottsche, Mr. Liep and Ms. Ospald
for geochemical analyses at GFZ Potsdam and TU Berlin. I acknowledge Prof. Dr.
Dresen for access to the Helium-pycnometer, Dr. A. Förster for access to the optical
scanning instrument and Dr. Harald Milsch, Bendix and Daniel for helping at the Gas-
Permeameter. Thank you Harald for giving us advises how to handle the permeameter
and answering all the questions coming up while interpreting the data.

72
I am very happy to have had my parents, my sister, the rest of my family and my friends
by my side during the last four years. I would like to thank them for their continuous and
unconditional support, encouragement and understanding. Thank you Christian for
always trusting in me.
Finally, I owe a special gratitude to Fatih Bulut, who reviewed all the thesis one by one,
took care of linguistic issues, provided me with matlab scripts, discussed scientific
problems and questioned my conclusions. Fatih thank you for coming into my life and
staying there.

73
4 References
Antonellini, M., Aydin, A., 1994. Effect of faulting on fluid flow in porous sandstones:
petrophysical properties. Am. Assoc. Pet. Geol. Bull. 78, 355–377.
Arnorsson, S., 1985. The use of mixing models and chemical geothermometers for
estimating underground temperatures in geothermal systems. J. Volcanol. Geotherm.
Res. 23, 299–335.
Arnorsson, S., 2000. Arnorsson-Isotopic and chemical techniques in geothermal
exploration, development and use. Report, International Atomic Energy Agency,
p.12.
Arnorsson, S., Stefansson, A., Bjarnason, J.O., 2007. Fluid-Fluid Interactions in
Geothermal Systems. Rev. Mineral. Geochemistry 65, 259–312.
Aydin, A., 2000. Fractures, faults, and hydrocarbon entrapment, migration and flow. Mar.
Pet. Geol. 17, 797–814.
Bächler, D., Kohl, T., Rybach, L., 2003. Impact of graben-parallel faults on hydrothermal
convection––Rhine Graben case study. Phys. Chem. Earth, Parts A/B/C 28, 431–
441.
Banks, D., Odling, N.E., Skarphagen, H., Rohr-Torp, E., 1996. Permeability and stress in
crystalline rocks. Terra Nov. 8, 223–235.
Barton, C. a., Zoback, M.D., Moos, D., 1995. Fluid flow along potentially active faults in
crystalline rock. Geology 23, 683-686.
Belsky, A., Hellenbrandt, M., Karen, V.L., Luksch, P., 2002. New developments in the
Inorganic Crystal Structure Database (ICSD): accessibility in support of materials
research and design. Acta Crystallogr. Sect. B Struct. Sci. 58, 364–369.
Benischke, R., Harum, T., 1990. Determination of discharge rates in turbulent streams by
salt tracer dilution applying a microcomputer system . Comparison with current
meter measurements, in: Hydrology in Mountainous Regions. I - Hydrological
Measurements. pp. 215–222.

74
Bergerhof, G., Brown, I.D., 1987. Inorganic crystal structure database. Chrystallographic
Database, International Union of Chrystallography.
Bertani, R., 2010. Geothermal Power Generation in the World 2005 – 2010 Update
Report, in: Proceedings World Geothermal Congress 2010 Bali, Indonesia, 25-29
April 2010.
Bertani, R., 2015. Geothermal Power Generation in the World, in: Proceedings World
Geothermal Congress 2015 Melbourne, Australia, 19-25 April 2015.
Billi, A., Salvini, F., Storti, F., 2003. The damage zone-fault core transition in carbonate
rocks: implications for fault growth, structure and permeability. J. Struct. Geol. 25,
1779–1794.
Blöcher, M.G., Zimmermann, G., Moeck, I., Brandt, W., Hassanzadegan, A., Magri, F.,
2010. 3D numerical modeling of hydrothermal processes during the lifetime of a
deep geothermal reservoir. Geofluids 10, 406–421.
Brehme, M., Haase, C., Regenspurg, S., Moeck, I., Deon, F., Wiegand, B.A., Kamah, Y.,
Zimmermann, G., Sauter, M., 2013. Hydrochemical patterns in a structurally
controlled geothermal system. Mineral. Mag. 77, pp.767.
Brehme, M., Moeck, I., Kamah, Y., Zimmermann, G., Sauter, M., 2014. A hydrotectonic
model of a geothermal reservoir – A study in Lahendong, Indonesia. Geothermics
51, 228–239.
Brehme, M., Regenspurg, S., Zimmermann, G., 2011. Hydraulic-hydrochemical
modelling of a geothermal reservoir in Indonesia. Mineral. Mag. 75, pp.577.
Brehme, M., Scheytt, T., Çelik, M., Dokuz, U.E., 2010. Hydrochemical characterisation
of ground and surface water at Dörtyol/Hatay/Turkey. Environ. Earth Sci. 63, 1395–
1408.
Caine, J.S., Evans, J.P., Forster, C.B., 1996. Fault zone architecture and permeability
structure. Geology 24, 1025–1028.
Cherubini, Y., 2013. Influence of faults on the 3D coupled fluid and heat transport.
Dissertation, University of Potsdam, p. 166.

75
Cumming, W., 2009. Geothermal resource conceptual models using surface exploration
data, in: Proceedings 34th Workshop in Geothermal Reservoir Engineering,
Stanford.
Curewitz, D., Karson, J. a, 1997. Structural settings of hydrothermal outflow: Fracture
permeability maintained by fault propagation and interaction. J. Volcanol.
Geotherm. Res. 79, 149–168.
Dam, R.A.C., Fluin, J., Suparan, P., Kaars, S. Van Der, 2001. Palaeoenvironmental
developments in the Lake Tondano area (N. Sulawesi, Indonesia) since 33,000 yr
BP. Palaeogeogr. Palaeoclimatol. Palaeoecol. 171, 147–183.
Delisle, G., Beiersdorf, H., Neben, S., Steinmann, D., 1998. The geothermal field of the
North Sulawesi accretionary wedge and a model on BSR migration in unstable
depositional environments. Geol. Soc. London, Spec. Publ. 137, 267–274.
Deon, F., Regenspurg, S., Zimmermann, G., 2013. Geothermics Geochemical interactions
of Al2O3 -based proppants with highly saline geothermal brines at simulated in situ
temperature conditions. Geothermics 47, 53–60.
Di Leo, J.F., Wookey, J., Hammond, J.O.S., Kendall, J.-M., Kaneshima, S., Inoue, H.,
Yamashina, T., Harjadi, P., 2012. Deformation and mantle flow beneath the Sangihe
subduction zone from seismic anisotropy. Phys. Earth Planet. Inter. 194-195, 38–54.
Diersch, H.-J.G., 2014. Finite Element Modeling of Flow, Mass and Heat Transport in
Porous and Fractured Media. Springer, p.996.
DWD, 2012. Deutscher Wetterdienst. Offenbach/Main, www.dwd.de (accessed June
2012).
Ellis, A.J., Mahon, W.A.J., 1977. Chemistry and geothermal systems. Academic Press
Inc, New York, p.392.
Erbaş, K., Jaya, M., Moeck, I., Deon, F., Brehme, M., Regenspurg, S., Frick, S., Kranz,
S., Bäßler, R., Huenges, E., 2011. Concepts for Sustainable Geothermal Energy
Development in Remote Geothermal Areas of Indonesia, in: GRC Transactions.
Evans, J.P., Forster, C.B., Goddard, J. V., 1997. Permeability of fault-related rocks, and
implications for hydraulic structure of fault zones. J. Struct. Geol. 19, 1393–1404.

76
Fairley, J.P., 2009. Modeling fluid flow in a heterogeneous, fault-controlled hydrothermal
system. Geofluids 9, 153–166.
Faulkner, D.., Lewis, A.., Rutter, E.., 2003. On the internal structure and mechanics of
large strike-slip fault zones: field observations of the Carboneras fault in
southeastern Spain. Tectonophysics 367, 235–251.
Ferrill, D., Morris, A., 2003. Dilational normal faults. J. Struct. Geol. 25, 183–196.
Ganda, S., 1987. The filling minerals in hydrothermal system of Lahendong, North
Sulawesi, Indonesia, in: Proceedings of the 9th NZ Geothermal Workshop.
Giencke, J., 2007. Introduction to EVA. Bruker Cooperation, Billerica, p.31.
Giggenbach, W.F., 1988. Geothermal solute equilibria. Derivation of Na-K-Mg-Ca
geoindicators. Geochim. Cosmochim. Acta 52, 2749–2765.
Goyal, K.P., Kassoy, D.R., 1980. Fault Zone Controlled Charging of a Liquid-Dominated
Geothermal Reservoir. J. Geophys. Res. 85, 1867–1875.
Grindley, G.W., 1961. Subsurface Structures and Relation to Steam Production in the
Broadlands Geothermal Field, New Zealand. Geothermics 94, 248-261.
Gudmundsson, A., Berg, S.S., Lyslo, K.B., Skurtveit, E., 2001. Fracture networks and
fluid transport in active fault zones. J. Struct. Geol. 23, 343–353.
Hamilton, W.B., 1979. Tectonics of the Indonesian Region. U.S. Govt. Print. Off.
(Washington), 1078, p.345
Hatherton, T., Macdonald, W.J.P., Thompson, G.E.K., 1965. Geophysical Methods in
Geothermal Prospecting in New Zealand, p.14.
Henderson, A., 2007. ParaView Guide, A Parallel Visualization Application. Kitware,
New York, p.407.
Henneberger, R.C., Browne, P.R.L., 1988. Hydrothermal alteration and evolution of the
Ohakuri hydrothermal system, Taupo volcanic zone, New Zealand. J. Volcanol.
Geotherm. Res. 34, 211–231.
Hochstein, M., 1988. Assessment and modelling of geothermal reservoirs (small
utilization schemes). Geothermics 17, 15–49.

77
Hochstein, M., 1990. Classification and assessment of geothermal resources, in: Dickson,
M.H., Fanelli, M. (Eds.), Small Geothermal Resources: A Guide to Development
and Utilization. UNITAR, New York, pp. 31–57.
John, L., 2007. Hydrothermal alteration mineralogy in geothermal fields with case
examples from Olkaria Domes geothermal field, Kenya. Report, UNU-GTP, p.26.
Keserovic, A., Bäßler, R., 2015. Suitability of UNS S31603 steel for geothermal brines in
volcanic areas – Influence of different physicochemical conditions on its corrosion
behavior. Geothermics 53, 479–487.
Kiryukhin, A. V., 1996. Modeling studies: The Dachny geothermal reservoir, Kamchatka,
Russia. Geothermics 25, 63–90.
Klavetter, E., Peters, R., 1987. An evaluation of the use of mercury porosimetry in
calculating hydrologic properties of tuffs from Yucca Mountain, Nevada, Nevada
Nuclear Waste Storage Investigations Project. Project-Report, Nevada Nuclear
Waste Storage Investigations Project, p.155.
Koestono, H., 2010. Lahendong Geothermal Field , Indonesia : Geothermal model based
on wells LHD-23 and LHD-28. Master-Thesis at University of Iceland, p.123.
Koestono, H., Siahaan, E.E., Silaban, M., Franzson, H., 2010. Geothermal Model of the
Lahendong Geothermal Field , Indonesia, in: Proceedings World Geothermal
Congress 2010, Bali, Indonesia, 25-29 April 2010.
Larson, A.C., Von Dreele, R.B., 2004. GSAS - General Structure Analysis System. Los
Alamos National Laboratory Report LAUR, University of California, pp. 86-748.
Larsson, I., 1972. Groundwater in granite rocks and tectonic models. Nord. Hydrol. 3,
111–129.
Lécuyer, F., Bellier, O., Gourgaud, A., VIncent, P.M., 1997. Tectonique active du Nord-
Est de Sulawesi (Indonésie) et contrôle structural de la caldeira de Tondano.
Comptes Rendus l’Académie des Sci. - Ser. IIA - Earth Planet. Sci. 325, 607–613.
Magri, F., Akar, T., Gemici, U., Pekdeger, A., 2011. Numerical investigations of fault-
induced seawater circulation in the Seferihisar-Balçova Geothermal system, western
Turkey. Hydrogeol. J. 20, 103–118.

78
Marques, J.M., Carreira, P.M., Marques, J.E., Chaminé, H.I., Fonseca, P.E., Monteiro
Santos, F.A., Eggenkamp, H.G.M., Teixeira, J., 2011. The role of geosciences in the
assessment of low-temperature geothermal resources (N-Portugal): a review. Geosci.
J. 14, 423–442.
McDermott, C.I., Lodemann, M., Ghergut, I., Tenzer, H., Sauter, M., Kolditz, O., 2006.
Investigation of coupled hydraulic-geomechanical processes at the KTB site:
pressure-dependent characteristics of a long-term pump test and elastic interpretation
using a geomechanical facies model. Geofluids 6, 67–81.
McGuinness, M., White, S., Young, R., Ishizaki, H., Ikeuchi, K., Yoshida, Y., 1995. A
model of the Kakkonda geothermal reservoir 24, 1–48.
Mercer, J.W., Faust, C.R., 1979. Geothermal reservoir simulation: 3. Application of
liquid‐and vapor‐dominated hydrothermal modeling techniques to Wairakei, New
Zealand. Water Resour. Res. 15, 653–671.
Miller, R.B., 1994. A mid-crustal contractional stepover zone in a major strike-slip
system, North Cascades, Washington. J. Struct. Geol. 16, 47–60.
Moeck, I., 2005. Hydrotektonik von Grundwasserleitern: Rekonstruktion von
Spannungsfeldern und 3D Modellierung einer geologischen Karte des Zentral-
Algarve (Südportugal). Dissertation, Technische Universität Berlin, p.129.
Moeck, I., Dussel, M., 2007. Fracture networks in Jurassic carbonate rock of the Algarve
Basin (South Portugal): Implications for aquifer behaviour related to the recent stress
field. IHA Sel. Pap. Ser. 9, 479–488.
Moeck, I.S., 2014. Catalog of geothermal play types based on geologic controls. Renew.
Sustain. Energy Rev. 37, 867–882.
Nagao, T., Uyeda, S., 1995. Heat-flow distribution in Southeast Asia with consideration
of volcanic heat 251, 153–159.
Neben, S., Hinz, K., Beiersdorf, H., 1998. Reflection characteristics, depth and
geographical distribution of bottom simulating reflectors within the accretionary
wedge of Sulawesi. Geol. Soc. London, Spec. Publ. 137, 255–265.
Nicholson, K., 1993. Geothermal Fluids - Chemistry and Exploration Techniques.
Springer, Berlin-Heidelberg, p.263.

79
Nukman, M., 2014. Geothermal exploration involving structuralgeology and
hydrochemistry in the Tarutung Basin, Northern Central Sumatra (Indonesia).
Dissertation, Technische Universität Berlin, p.100.
Nukman, M., Moeck, I., 2013. Journal of Asian Earth Sciences Structural controls on a
geothermal system in the Tarutung Basin , north central Sumatra. J. Asian Earth Sci.
74, 86–96.
O’Sullivan, M.J., Pruess, K., Lippmann, M.J., 2001. State of the art of geothermal
reservoir simulation. Geothermics 30, 395–429.
Ondrak, R., Wenderoth, F., Scheck, M., Bayer, U., 1998. Integrated geothermal modeling
on different scales in the Northeast German basin. Geol. Rundschau 87, 32–42.
Ortner, H., Reiter, F., Acs, P., 2002. Easy handling of tectonic data: the programs
TectonicVB for Mac and TectonicsFP for Windows (TM). Comput. Geosci. 28,
1193–1200.
Otofuji, Y., Sasajima, S., Nishimura, S., Dharma, A., Hehuwat, F., 1981. Paleomagnetic
evidence for clockwise rotation of the northern arm of Sulawesi, Indonesia. Earth
Planet. Sci. Lett. 54, 272–280.
Parkhurst, D., Appelo, C.A.J., 2013. Description of Input and Examples for PHREEQC
Version 3a Computer Program for Speciation, Batch-reaction, One-dimensional
Transport, and Inverse Geochemical Calculations. Model. Tech. B. 6, p.497.
Parkurst, D., Thorstenson, D., Plummer, L., 1980. PHREEQE, a computer program for
geochemical calculations, US Geological Survey Water. Report, USGS, p.213.
Popov, Y., Pribnow, D., Sass, J., 1999. Characterization of rock thermal conductivity by
high-resolution optical scanning. Geothermics 28, 253–276.
Porras, E., Tanaka, T., Fujii, H., Itoi, R., 2007. Numerical modeling of the Momotombo
geothermal system, Nicaragua. Geothermics 24–29.
Portugal, E., Birkle, P., Tello, E., Tello, M., 2000. Hydrochemical–isotopic and
hydrogeological conceptual model of the Las Tres Vırgenes geothermal field, Baja
California Sur, México. J. Volcanol. Geotherm. Res. 101, 223–244.

80
Pruess, K., 1991. TOUGH2 - A General Purpose Numerical Simulator for Multiphase
Fluid and Heat Flow. Lawrence Berkeley Laboratory Report LBL-29400, Berkeley,
CA.
Pruess, K., Narasimhan, T.N., 1982. On fluid reserves and the production of superheated
steam from fractured, vapor-dominated geothermal reservoirs. J. Geophys. Res. 87,
9329.
Raharjo, I.B., Maris, V., Wannamaker, P.E., Chapman, D.S., 2010. Resistivity Structures
of Lahendong and Kamojang Geothermal Systems Revealed from 3-D
Magnetotelluric Inversions , A Comparative Study, in: Proceedings World
Geothermal Congress 2010, Bali, Indonesia, 25-29 April 2010.
Robinson, D., Peng, D., Chung, S., 1985. The development of the Peng-Robinson
equation and its application to phase equilibrium in a system containing methanol.
Fluid Phase Equilib. 24, 25–41.
Rowland, J. V., Sibson, R.H., 2004. Structural controls on hydrothermal flow in a
segmented rift system, Taupo Volcanic Zone, New Zealand. Geofluids 4, 259–283.
Sanyal, S.K., Butler, S.J., Swenson, D., Hardeman, B., 2000. Review of the state-of-the-
art of numerical simulation of geothermal systems, in: Proceedings World
Geothermal Congress 2000.
Schön, J.H., 2004. Physical properties of rocks. Elsevier Ltd, p.583.
Siahaan, E.E., Soemarinda, S., Fauzi, A., Silitonga, T., Azimudin, T., Raharjo, I.B., 2005.
Tectonism and Volcanism Study in the Minahasa Compartment of the North Arm of
Sulawesi Related to Lahendong Geothermal Field, Indonesia, in: Proceedings World
Geothermal Congress 2005, Antalya, Turkey, 24-29 April 2005.
Silver, E.A., McCaffrey, R., Smith, R.B., 1983. Collision, rotation, and the initiation of
subduction in the evolution of Sulawesi, Indonesia. J. Geophys. Res. 88, 9407–9418.
Silver, E.A., Moore, J.C., 1978. The Molucca Sea Collision Zone, Indonesia. J. Geophys.
Res. 83, 1681–1691.
Simsek, S., 2003. Hydrogeological and isotopic survey of geothermal fields in the Buyuk
Menderes graben, Turkey. Geothermics 32, 669–678.

81
Socquet, A., Simons, W., Vigny, C., McCaffrey, R., Subarya, C., Sarsito, D., Ambrosius,
B., Spakman, W., 2006. Microblock rotations and fault coupling in SE Asia triple
junction (Sulawesi, Indonesia) from GPS and earthquake slip vector data. J.
Geophys. Res. 111, 1–15.
Stefansson, V., 2005. World Geothermal Assessment, in: Proceedings World Geothermal
Congress 2005 Antalya, Turkey, 24-29 April 2005.
Sulasdi, D., 1986. Exploration of Lahendong Geothermal field in North Sulawesi,
Indonesia. Geothermics 15, 609–611.
Sumintadireja, P., Sudarman, S., Zaini, I., 2001. Lahendong geothermal field boundary
based on geological and geophysical data, in: Proceedings of the 5th INAGA Annual
Scientific Conference & Exhibitions.
Surachman, S., Tandirerung, S.A., Buntaran, T., Robert, D., 1987. Assessment of the
Lahendong geothermal field, North Sulawesi, Indonesia, in: Proceeding Indonesian
Petroleum Association, Sixteenth Annual Convention, October 1987. pp. 385–398.
Surmont, J., Laj, C., Kissel, C., Rangin, C., Bellon, H., Priadi, B., 1994. New
paleomagnetic constraints on the Cenozoic tectonic evolution of the North Arm of
Sulawesi, Indonesia. Earth Planet. Sci. Lett. 121, 629–638.
Toby, B., 2001. EXPGUI, a graphical user interface for GSAS. J. Appl. Crystallogr. 34,
pp.210–213.
Tonami, F., 1970. Geochemical methods of exploration for geothermal energy.
Geothermics 2, 492–515.
Utami, P., 2011. Hydrothermal alteration and the evolution of the Lahendong geothermal
system, North Sulawesi, Indonesia. Dissertation, University of Auckland, p.468.
Utami, P., Siahaan, E.E., Azimudin, T., Browne, P.R.L., Simmons, S.F., 2004. Overview
of the Lahendong geothermal field, North Sulawesi, Indonesia: A progress report, in:
Proceedings of the 26th NZ Geothermal Workshop 2004. pp. 1–6.
Walpersdorf, A., Rangin, C., Vigny, C., 1998. GPS compared to long-term geologic
motion of the north arm of Sulawesi. Earth Planet. Sci. Lett. 159, 47–55.

82
Walpersdorf, A., Vigny, C., Manurung, P., Subarya, C., Sutisna, S., 1998. Determining
the Sula block kinematics in the triple junction area in Indonesia by GPS. Geophys.
J. Int. 135, 351–361.
Wanjie, C., 2012. Overview of Geothermal Surface Exploration Methods, United Nations
University. Report, United Nations University.
White, D.E., 1957. Thermal Water of Volcanic origin. Bull. Geol. Soc. Am. 68, 1637–
1658.
Wiegand, B.A., Brehme, M., Teuku, F., Amran, I.A., Prasetio, R., Kamah, Y., Sauter, M.,
2013. Geochemical and isotopic investigation of fluids from Lahendong geothermal
field. Mineral. Mag. 77, 2491.
Wisian, K.W., Blackwell, D.D., 2004. Numerical modeling of Basin and Range
geothermal systems. Geothermics 33, 713–741.
Yani, A., 2006. Numerical modelling of the Lahendong geothermal system, Indonesia,
United Nations University, p.34.
Zimmermann, G., Körner, A., Burkhardt, H., 2000. Hydraulic pathways in the crystalline
rock of the KTB. Geophys. J. Int. 142, 4–14.

83
Curriculum vitae
Maren Brehme
Personal details
Date and place of birth October 14 1983, Berlin
Nationality German
Positions held
10/2010 – 08/2014 Research assistant within the project “Sustainability concepts for
exploitation of geothermal reservoirs in Indonesia – capacity
building and methodologies for site deployment”
Helmholtz-Center Potsdam, German Research Centre for
Geosciences (GFZ-Potsdam), International Centre for
Geothermal Research
11/2009 – 10/2010 Research assistant within the project “Research Network Water
in Central Asia (CAWa)” studying the “Dynamics of Ground-
Surface-Water Interaction in the Aral Sea Region”
GFZ-Potsdam, Climate Dynamics and Landscape Evolution
09/2009 – 10/2009 Project engineer
KWS Geotechnik GmbH, Berlin, (Consulting Engineers for
Hydrogeology)
03/2009 – 06/2009 Project coordination assistant
GFZ-Potsdam, Scientific Executive Board
12/2005 – 10/2007 Student research assistant
GFZ-Potsdam, Scientific Executive Board
Education
Since 10/2010 Georg-August-Universität Göttingen; PhD-Student
“The role of fault zones on structure, operation and prospects of
geothermal reservoirs - A case study in Lahendong, Indonesia”
10/2003 – 11/2008 Technische Universität Berlin; Dipl.-Ing. (Hydrogeology)
“Groundwater composition and groundwater flow in the area of
Dörtyol/Hatay/Turkey”; grade: 1.7
09/1996 – 06/2003 Droste-Hülshoff-Gymnasium; Abitur