Embed Size (px)
Citation preview
Energy Policy 38 (2010) 6820–6829
Contents lists available at ScienceDirect
Energy Policy
0301-42
doi:10.1
n Corr
E-m
journal homepage: www.elsevier.com/locate/enpol
The role of energy efficiency spending in Maryland’s implementationof the Regional Greenhouse Gas Initiative
Anthony Paul a,n, Karen Palmer a, Matthias Ruth b,c,d, Benjamin F. Hobbs e, Daraius Irani f,Jeffrey Michael g, Yihsu Chen h, Kimberly Ross b, Erica Myers a
a Resources for the Future, Washington, DC, USAb Center for Integrative Environmental Research, University of Maryland, USAc Engineering and Public Policy Program, University of Maryland, USAd Environmental Policy Program, School of Public Policy, University of Maryland, USAe Department of Geography and Environmental Engineering, Whiting School of Engineering, The Johns Hopkins University, USAf Regional Economic Studies Institute, Towson University, Towson, MD, USAg Business Forecasting Center, Eberhardt School of Business, University of the Pacific, USAh School of Engineering, Social Sciences, Humanities and Arts, University of California, Merced, CA, USA
a r t i c l e i n f o
Article history:
Received 27 August 2009
Accepted 30 June 2010Available online 5 August 2010
Keywords:
Climate policy
Energy efficiency
Electricity demand
15/$ - see front matter & 2010 Elsevier Ltd. A
016/j.enpol.2010.06.055
esponding author.
ail address: [email protected] (A. Paul).
a b s t r a c t
What are the economic consequences of increased state spending on electricity consumption
efficiency? The State of Maryland faces this question in deciding how much of its CO2 allowances
auction proceeds (under the Regional Greenhouse Gas Initiative) to devote to such programs. Starting at
a base of 25% of the proceeds, we consider the energy savings, emissions reductions, employment, and
other impacts of increasing that percentage to 50% and 100%. A series of models – Haiku, JHU-OUTEC,
and IMPLAN – are used for the analysis. We conclude that increasing the state’s expenditures on energy
efficiency programs would result in a decline in electricity consumption in the state and a
corresponding decline in expenditures on electricity. Program implementation would lead to net
positive growth in statewide economic activity and include growth in both jobs and wages.
& 2010 Elsevier Ltd. All rights reserved.
1. Introduction
In 2007, Maryland joined the Regional Greenhouse GasInitiative (RGGI), which is a cooperative agreement amongten Northeastern and Mid-Atlantic states designed to reduceemissions of carbon dioxide (CO2) from major power generatorsthrough a cap and trade program (Regional Greenhouse GasInitiative, 2005, 2007, 2008). With the first auction of RGGIallowances (permits) held in September 2008 and subsequentauctions held every 3 months since, Maryland is receiving RGGIauction proceeds and must rapidly develop and implement aprogram to use these funds.
One use for auction proceeds is funding for energy efficiencyprograms designed to decrease energy use, and in particularelectricity use. Such programs could lower electricity bills andthereby partially or fully offset the higher power prices that willotherwise be faced by households and firms under RGGIimplementation. Several of the RGGI states are planning touse much or all of their shares of the proceeds for such programs;
ll rights reserved.
other uses include direct subsidies to consumer’s electricity billsand grants of free allowances to industry.
Maryland has historically been not as aggressive in promotingenergy efficiency as other states in the region. For example, in2006, Maryland spent only 0.001% of State GDP on energyefficiency, compared with 0.01% percent in New York or 0.06%in Vermont. Closing this gap could help the state reduce energyimports, improve environmental quality, and create jobs in theenergy efficiency field. In the 2008 session of the MarylandGeneral Assembly, a law was enacted to devote 23% of the state’sRGGI proceeds to rate relief through rebate programs and the restto efficiency (46%), low income electricity assistance (17%), cleanenergy, education, and climate change (10.5%) programs, leavingthe remainder (3.5%) for administrative costs.
This paper presents the methodology and results from ananalysis of the environmental, energy, and economy implicationsthat derive from increasing shares of the RGGI auction revenue insupport of consumer benefit programs, notably efficiencyprograms that target end-use consumption of electricity throughsubsidies to avoided consumption. Specifically, the studyexamines the following questions. What would be the effects ofdifferent levels of spending in Maryland on improvements inefficiency in electricity consumption? These impacts are assessedin terms of electricity demand, electricity prices and expenditures,
A. Paul et al. / Energy Policy 38 (2010) 6820–6829 6821
RGGI CO2 allowance prices and revenue, electricity supplyin Maryland, generator competitiveness and market power,generation adequacy and transmission import capability, andoverall economic impacts within Maryland. How robust are theconclusions for different modeling assumptions about energymarkets and market power, and transmission capability?
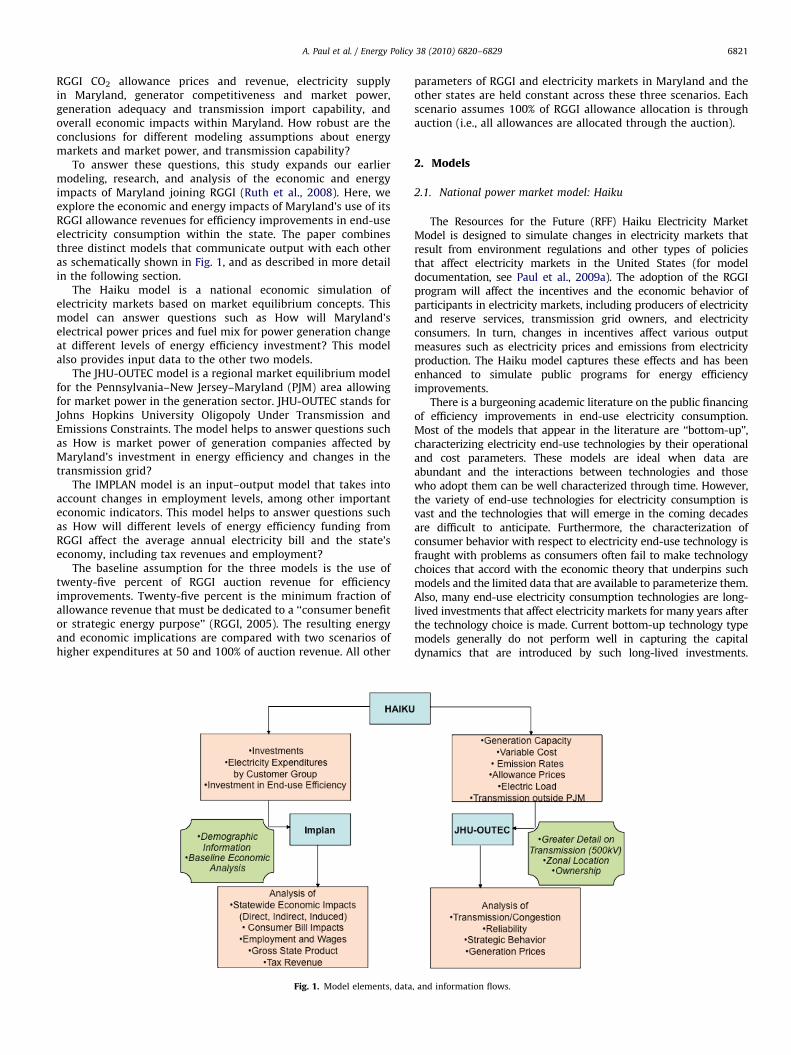
To answer these questions, this study expands our earliermodeling, research, and analysis of the economic and energyimpacts of Maryland joining RGGI (Ruth et al., 2008). Here, weexplore the economic and energy impacts of Maryland’s use of itsRGGI allowance revenues for efficiency improvements in end-useelectricity consumption within the state. The paper combinesthree distinct models that communicate output with each otheras schematically shown in Fig. 1, and as described in more detailin the following section.
The Haiku model is a national economic simulation ofelectricity markets based on market equilibrium concepts. Thismodel can answer questions such as How will Maryland’selectrical power prices and fuel mix for power generation changeat different levels of energy efficiency investment? This modelalso provides input data to the other two models.
The JHU-OUTEC model is a regional market equilibrium modelfor the Pennsylvania–New Jersey–Maryland (PJM) area allowingfor market power in the generation sector. JHU-OUTEC stands forJohns Hopkins University Oligopoly Under Transmission andEmissions Constraints. The model helps to answer questions suchas How is market power of generation companies affected byMaryland’s investment in energy efficiency and changes in thetransmission grid?
The IMPLAN model is an input–output model that takes intoaccount changes in employment levels, among other importanteconomic indicators. This model helps to answer questions suchas How will different levels of energy efficiency funding fromRGGI affect the average annual electricity bill and the state’seconomy, including tax revenues and employment?
The baseline assumption for the three models is the use oftwenty-five percent of RGGI auction revenue for efficiencyimprovements. Twenty-five percent is the minimum fraction ofallowance revenue that must be dedicated to a ‘‘consumer benefitor strategic energy purpose’’ (RGGI, 2005). The resulting energyand economic implications are compared with two scenarios ofhigher expenditures at 50 and 100% of auction revenue. All other
Fig. 1. Model elements, data
parameters of RGGI and electricity markets in Maryland and theother states are held constant across these three scenarios. Eachscenario assumes 100% of RGGI allowance allocation is throughauction (i.e., all allowances are allocated through the auction).
2. Models
2.1. National power market model: Haiku
The Resources for the Future (RFF) Haiku Electricity MarketModel is designed to simulate changes in electricity markets thatresult from environment regulations and other types of policiesthat affect electricity markets in the United States (for modeldocumentation, see Paul et al., 2009a). The adoption of the RGGIprogram will affect the incentives and the economic behavior ofparticipants in electricity markets, including producers of electricityand reserve services, transmission grid owners, and electricityconsumers. In turn, changes in incentives affect various outputmeasures such as electricity prices and emissions from electricityproduction. The Haiku model captures these effects and has beenenhanced to simulate public programs for energy efficiencyimprovements.
There is a burgeoning academic literature on the public financingof efficiency improvements in end-use electricity consumption.Most of the models that appear in the literature are ‘‘bottom-up’’,characterizing electricity end-use technologies by their operationaland cost parameters. These models are ideal when data areabundant and the interactions between technologies and thosewho adopt them can be well characterized through time. However,the variety of end-use technologies for electricity consumption isvast and the technologies that will emerge in the coming decadesare difficult to anticipate. Furthermore, the characterization ofconsumer behavior with respect to electricity end-use technology isfraught with problems as consumers often fail to make technologychoices that accord with the economic theory that underpins suchmodels and the limited data that are available to parameterize them.Also, many end-use electricity consumption technologies are long-lived investments that affect electricity markets for many years afterthe technology choice is made. Current bottom-up technology typemodels generally do not perform well in capturing the capitaldynamics that are introduced by such long-lived investments.
, and information flows.
A. Paul et al. / Energy Policy 38 (2010) 6820–68296822
Nor do they represent feedback effects in which the price elasticityeffects resulting from the changed supply-demand conditions couldeither magnify or partially counter-act the direct impacts of theenergy efficiency programs.
This study utilizes a new ‘‘top–down’’ approach to project theeffects of public financing for efficiency programs. A functionalform for demand modeling, known as partial adjustment(Houthakker and Taylor, 1970), is used in this study. The partialadjustment demand system finds annual electricity demand bycustomer class given a sequence of electricity prices. The systemis dynamic in that the electricity price at any time t0 is one of thedeterminants of demand at all subsequent times t4t0. The modelsimultaneously captures the short- and long-run price elasticitiesof electricity demand and is implemented inside of Haiku toproject demand using the parameterized functions and endogen-ous electricity prices. The demand functions operate on annualstate-level data. For details of the partial adjustment demandsystem, see Paul et al. (2009b).
An issue in market-based approaches to environmentalregulation, such as the use of tradable emissions allowances, ishow the allowances are allocated to facilities or how the publiclyowned auction or tax revenue is allocated. A related issue iswhether some portion of the allowances should be allocated tospecific purposes to provide special incentives. The DemandConservation Incentive (DCI) in Haiku provides for the allocationof a portion of allowance revenue to consumers in the form of asubsidy to energy conservation. The DCI module returns theamount of electricity saved per annum (kWh/yr) based on anannual stream of funding ($/yr) and a set of endogenous variables,including retail electricity prices and natural gas prices. Inequilibrium, the DCI mechanism lowers electricity consumptionand retail electricity price.
In each period, we calculate electricity demand as a function ofthe endogenously determined retail electricity prices and theslope and location of the demand curve. This is the baseline levelof demand, which is altered in each period due to DCI-inducedreductions. The core concept of the DCI is that consumers will bepaid a specific dollar amount for each MWh they conserve beyondthe pre-determined baseline of consumption. The payment perMWh is endogenously determined each period based onthe amount of allowance revenue and the slopes and interceptsof the demand curve. Consumers will choose to accept the DCIpayment rather than using electricity if the money is worth moreto them than the energy services derived from another MWh ofconsumption. The subsidy to conservation effectively increasesthe cost of consumption, thus lowering demand for electricity. Wespecify partial adjustment electricity demand models, so that aDCI program that reduces consumption in this period willsubsequently lead to lower consumption in the next period, allother things equal. Consumers can be thought of as reducingdemand in response to the DCI either through behavioralmodifications, or investment in energy efficient capital.
Subsidy programs such as the DCI described here areconstrained by several administrative factors. In our analysis weaccount for three of these following factors: the cost of programadministration, efficiency funds that are captured by free riders(those who would have made efficiency enhancing investments orbehavioral changes anyway in the absence of the program), andthe portion of the retail electricity market that is inaccessible tothe administrator.
These are captured in Haiku according to Eqs. (1)–(3). Thesefunctions show the amount of demand reductions delivered byconsumers for a DCI of D $/MWh, given a simplified electricitydemand function and an achievable fraction of demandreductions (the percent of potential reductions that the regulatoris able to obtain through the program). The amount of money the
program administrator must spend to achieve these reductions isgiven by Eq. (3), and incorporates the effects of having to spendsome of the money on administrative costs, which do not go toconsumers, and being unable to distinguish free riders from otherprogram participants:
Q0 ¼ APe ð1Þ
QR ¼Q0 1� 1þD
P
� �e� �Ach ð2Þ
S¼DQR
ð1�FRÞð1�AdminÞð3Þ
where Q0 is the electricity demand in the absence of DCI [MWh], A
the electricity demand covariates except for electricity price, P theretail electricity price [$/MWh], e the short-run price elasticity[dimensionless], QR the demand reductions achieved by DCI[MWh], D the DCI payment [$/MWh], Ach the achievablepercentage of economic reductions [dimensionless], S the govern-ment spending on efficiency program [$], FR the free-riderrate [dimensionless], and Admin the administrative cost rate[dimensionless].
Haiku is a national model that divides the continental US. into21 regions, with Maryland as one of the regions. The system ofEqs. (1)–(3) is defined for a single year in a single region and thevariables in the equation will generally vary across bothdimensions. The exceptions to this rule are the three cost factorsAch, FR, and Admin, which are assumed constant across the nationand in time. Ach takes the value 60%, FR is 20%, and Admin is 40%.The other exogenous parameters, e and A, are defined according toPaul et al., 2009b.
2.2. Regional oligopolistic power market model: JHU-OUTEC
Haiku’s national scope accounts rigorously for interactionsbetween the Maryland power market and all other power marketsin the US. This allows for careful consideration, for instance, ofwhether increases in fossil fuel use in other states would partiallyor fully offset CO2 emission reductions in Maryland.
This scope is made possible by certain simplifications. One isHaiku’s assumption that generators behave in a perfectlycompetitive manner. However, large generation companies intransmission-constrained areas such as Maryland may behavestrategically, raising prices and altering the patterns of electricgeneration and consumption. Another simplification is Haiku’sapproximation of the electric power network as a ‘‘path-based’’network in which power can flow along the least expensivepath between source and sink. Haiku also treats Marylandand neighboring states as single nodes in the network, ratherthan considering within-state transmission bottlenecks. Thesegrid simplifications disregard the fact that power flows along allparallel paths between source and sink, satisfying Kirchhoff’svoltage and current laws.
These simplifications could, in theory, distort the results of ourstudy in several ways. The tighter transmission constraintsresulting from a more realistic transmission representation mightmean, for instance, less ‘‘leakage’’ of CO2 emissions to neighboringregions, as imports might be more constrained. If powerexchanges are more limited, then energy efficiency programswithin Maryland would have a larger effect on power prices in thestate, as imports would have a smaller buffering effect. Finally,under oligopoly, the energy efficiency programs might have anadditional benefit of mitigating market power by lessening thebenefit to generators of raising prices, as there would be fewersales for which generators would receive higher prices.
A. Paul et al. / Energy Policy 38 (2010) 6820–6829 6823
To assess whether these simplifications might significantlyimpact our answers to the questions posed in the introduction, wealso apply a detailed regional-level model that includes a morerealistic representation of transmission flows while consideringpotential strategic behavior by electric generators. The JohnsHopkins University Oligopoly Under Transmission and EmissionsConstraints model (JHU-OUTEC) is a computational game-theore-tic model that includes the so-called ‘‘linearized DC load flow’’model of transmission flows (Chen and Hobbs, 2005). In thismodel, real power flows satisfy analogues of Kirchhoff’s laws(Schweppe et al., 1988), but reactive power flows and resistancelosses are disregarded, and voltage magnitudes are assumed to beconstant. This approximation is now used widely in detailedmodels of competitive and oligopolistic power markets (Ventosaet al., 2005). JHU-OUTEC’s representation of strategic behavior isbased on the widely used notion of Cournot competition, in whichgenerators optimize their sales in each sub-market assuming thatother generation companies do not change their sales strategies.The transmission-constrained Cournot framework is frequentlyused to project power market outcomes under policy andstructural changes (e.g., Hobbs and Helman, 2004; Yao et al.,2008). JHU-OUTEC has been previously subjected to validationtests against PJM market outcomes (Chen and Hobbs, 2005).
JHU-OUTEC separates Maryland into four nodes based on flowpatterns and network constraints (Chen and Hobbs, 2005). Onezone is Delmarva Power and Light (DPLC), which includesDelaware and is recognized by PJM as a separate constrainedzone (or Local Demand Area—LDA) in its future capacity market.PJM’s Reliability Pricing Model (RPM) also recognizes centralMaryland and the District of Columbia (the PEPCO and BGEservice territories) as a separate LDA within RPM. This zone isfurther divided into northern and southern halves (designatedBGE_2 and BGE_PEPCO, respectively). Finally, western Marylandis separated out (designated here as APMD, the Allegheny Powerservice territory within Maryland). Justifying this is an analysis ofPJM Locational Marginal Prices (LMPs) from selected buses inAPMD and PEPCO that shows that PEPCO’s hourly prices arestatistically higher than those of APMD. Also included inJHU-OUTEC are the neighboring states of West Virginia, Virginia,Pennsylvania, New Jersey, and the District of Columbia; thus,unlike Haiku, interactions with other US. power markets aredisregarded.
To maintain consistency with the Haiku analysis, theestimated generating capacity for the future years (i.e., 2010,2015, 2020, and 2025) from Haiku was directly incorporated inthe JHU-OUTEC model. The same operating capacity for eachseason was maintained for each type of plant. However, it isnecessary to disaggregate the Haiku model generators to17 individual zones and 13 owners. These owners include 10large companies that can behave strategically and a price-taking‘‘competitive fringe’’. The location and ownership of existinggenerators by zone were identified using public data sources.To ensure an appropriate representation of the potential formarket power under the current ownership, it is assumed thatoperational decisions (generation and sale) are controlled by theparent company, replacing any subsidiaries with the correspond-ing parent company. New capacity that Haiku projects forconstruction is allocated to each zone in proportion to existinggeneration by type and ownership. If this procedure results inunrealistically small capacity additions, those amounts areinstead distributed among other owners or zones, as appropriate.
There are variables other than generating capacity that aretreated by JHU-OUTEC as exogenous and taken from Haikuoutput. These include non-fuel variable operations andmaintenance costs, emissions allowance costs, and fuel costs.The shadow prices of emissions arising from the Maryland
Healthy Air Act are obtained endogenously, since all affectedplants are inside of JHU-OUTEC.
One challenge in coordinating Haiku and JHU-OUTEC is thedistribution of spatially aggregate regional electricity load datafrom Haiku to the specific zones in JHU-OUTEC model. Forsimplicity, load was allocated to the nodes in JHU-OUTEC inproportion to PJM historical experience (PJM, 2001).
The same number and duration of periods used by Haiku(12 periods per year of varying length) are used here. Lineardemand functions with �0.2 elasticity are assumed, but areshifted downwards to account for the difference betweenwholesale and retail prices for energy (the latter includingdistribution costs, for example). Adjustments are also madefor distribution losses (about 6%). Finally, JHU-OUTEC assumesthat quantity demanded in a given period is a function only ofprice in that period, whereas Haiku has more complicatedrelationships (e.g., Haiku averages marginal costs over periodswithin a season).
Network data, including transmission capacities (thermal orsurge impedance loading (SIL) limits, as appropriate) andreactances required for deriving the power transmission distribu-tion factors (PTDFs) used in the DC approximation, were obtainedfrom the PowerWorld website (PowerWorld, 2003). Only the500 kV grid is considered, which is the backbone of the PJMsystem. In 2015, additional transmission capacity is assumed tocome on-line. Information on the capacity and reactance of thoselines was obtained from publicly available sources.
As is well known, the extent to which a supplier can benefitfrom exercising market power depends on the degree to which itis pre-committed, through forward contracts or vertical integra-tion, to providing a particular amount of energy to the market.Because of the lack of publicly available data on forwardcontracting positions, the model assumes the extreme boundingcase of no forward contracts. This results in the largestprice mark-ups under the oligopoly assumption. Comparingthese bounding results to the competitive case provides an upperbound to the effects of assuming oligopoly rather than competi-tion when answering the questions addressed by this study.JHU-OUTEC is used in both the perfect competition and Cournotoligopoly modes. Comparing the former runs to the Haiku resultsallows us to investigate whether Haiku’s representation of thetransmission grid affects the conclusions of this study. Thencomparing the perfect competition and Cournot results permitsan assessment of the impact of strategic competition assumptionson the results.
2.3. IMPLAN
In order to quantify the economic impact of joining RGGI, theIMPLAN input/output model is used (Minnesota IMPLAN Group,2006). It enumerates the employment and fiscal impact of eachdollar earned and spent by the following: employees of the newbusiness, other supporting vendors (business services, retail, etc.),each dollar spent by these vendors on other firms, and each dollarspent by the households of the new business’ employees, othervendors’ employees, and other businesses’ employees.
To quantify the economic impact of a new business enteringinto an area, economists measure three types of economicimpacts: direct, indirect, and induced. The direct economic effectsare generated as new businesses hire workers to fill newpositions. The indirect economic impacts occur as new firmspurchase goods and services from other firms. In either case,increase in employment generate corresponding increases inhousehold income—as new job opportunities are created andincome levels rise. This drives the induced economic impacts that
A. Paul et al. / Energy Policy 38 (2010) 6820–68296824
result from households increasing their purchases at localbusinesses.
The centerpiece of an economic impact study is the classificationof impacts. In the case of the RGGI impacts, direct impacts includethe creation of jobs in specific industries and businesses. Indirectimpacts measure the positive effect on the economy resulting frombusinesses selling goods and services to households. Inducedimpacts include the effects of increased household spendingresulting from direct and indirect effects.
Indirect and induced impacts are estimated by applyingmultipliers to direct impacts. Multipliers are factors that areapplied to a dollar expended towards a particular use. Thesefactors estimate the total value of that dollar as it moves throughthe economy. For instance, suppose a dollar is spent in a certainindustry. That dollar will increase the number of jobs in thatindustry by a certain amount. Furthermore, some of the moneywill go to pay the increased earnings in that industry, resulting inhigher personal income. In turn, consumers will spend a share ofthat increase in personal income. Thus, the ultimate impact of adollar – initially spent in a certain industry – is greater than itsdirect impact on the earnings of that industry. Multipliers areindustry-specific factors that estimate the value of a dollar spentin an industry, including not only its direct impacts, but also itsindirect and induced impacts.
The input data for the IMPLAN model, which included theDemand Conservation Incentive (DCI) expenditures, householdand commercial savings due to lower utility bills, and the surplusas well as the disinvestment in power plants, were drawn fromthe analysis conducted by Haiku and JHU-OUTEC. To transformthese data into the direct inputs into the IMPLAN model, theimpacted industries had to be identified first as wellas distributing the savings across households and types ofcommercial energy users.
The determination of how the DCI expenditures would enterinto the state economy was a two step process. As much of theDCI expenditures were focused towards energy efficiency gains inthe home and businesses through the addition of new windows,HVAC upgrades, better lighting, etc., a commercial and residentialconstruction reference guide was accessed. The guide providedthe costs as well as a breakdown by type of cost – wholesale,plumber, HVAC, architecture fees, etc. – for these types of projectsfor both commercial and residential. The allocation of DCIexpenditures was in three sectors: construction, wholesale, and
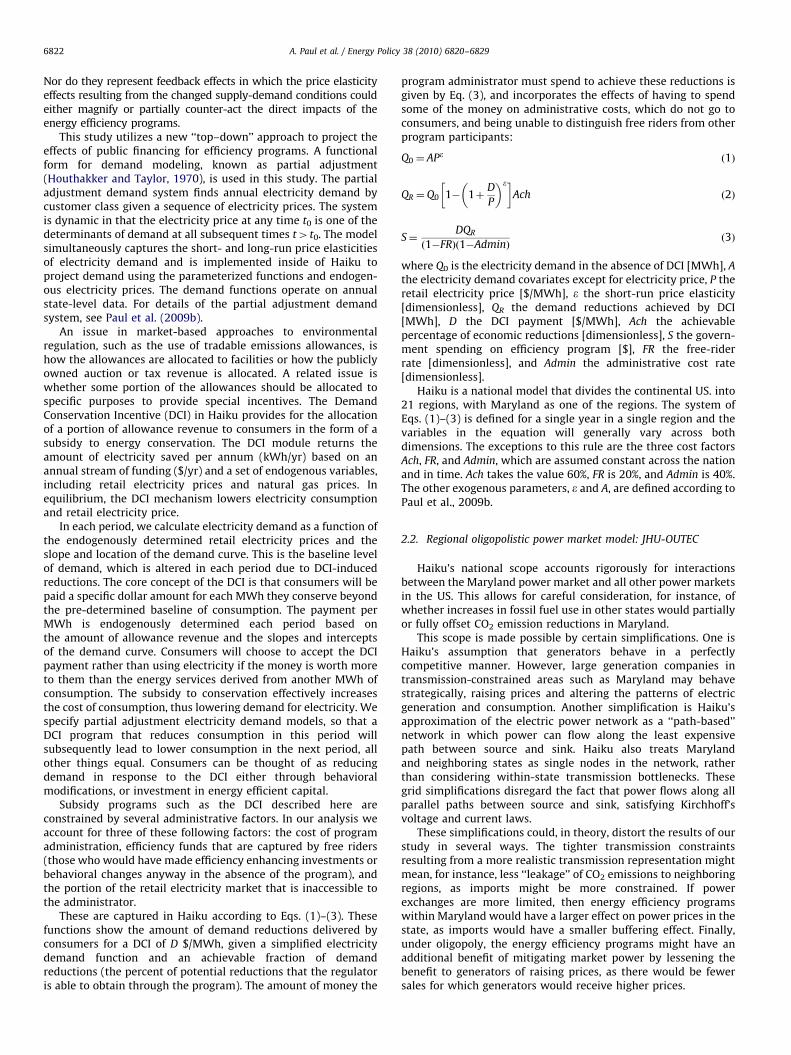
MD Efficiency Expenditure [M$]
2010 2015 2020 202525% - - - -50% 92.0% 92.0% 92.0% 91.7%100% 263.6% 263.6% 263.9% 284.2%
% Increase f rom Baseline
Fig. 2. Total spending on energy efficiency and contempor
professional services. The construction sector is the sectorresponsible for all of the installation activity, the wholesale sectoris the impacted by the purchase of the energy saving devices fromwindows to light bulbs, and the professional services sector isidentified with the architects who will provide the design servicesfor the retrofits as well as new buildings.
The energy savings realized by the residential were allocatedacross households on the basis of income and energy usage. Forthe commercial sector the energy savings were allocated acrossindustry sectors on the basis of energy usage. The energy savingswere treated for both the residential and commercial sectors asadditional expenditures by each sector and by each household byincome category in IMPLAN. The surplus and the disinvestment inpower plants were treated as a negative expenditure on behalf ofthe public sector and the power plant sector in IMPLAN.
One of the shortcomings of the IMPLAN model along withother static input–output models is that the model assumes thatsupply curve for inputs is perfectly elastic, implying no priceeffects associated with the rising demand. However, given therelatively small scale of these expenditures in comparison withthe Maryland’s Gross State Product, the price effects will likely bevery small if not inconsequential.
3. Results
3.1. Efficiency program costs, demand reductions, and electricity
consumption
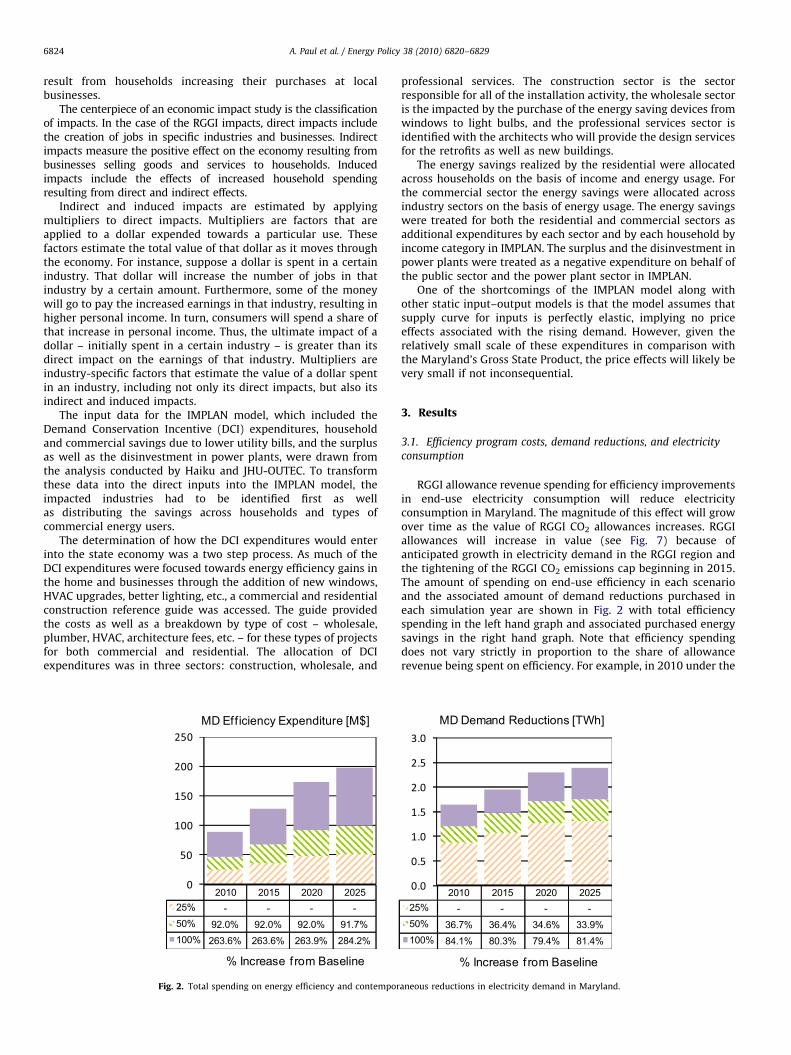
RGGI allowance revenue spending for efficiency improvementsin end-use electricity consumption will reduce electricityconsumption in Maryland. The magnitude of this effect will growover time as the value of RGGI CO2 allowances increases. RGGIallowances will increase in value (see Fig. 7) because ofanticipated growth in electricity demand in the RGGI region andthe tightening of the RGGI CO2 emissions cap beginning in 2015.The amount of spending on end-use efficiency in each scenarioand the associated amount of demand reductions purchased ineach simulation year are shown in Fig. 2 with total efficiencyspending in the left hand graph and associated purchased energysavings in the right hand graph. Note that efficiency spendingdoes not vary strictly in proportion to the share of allowancerevenue being spent on efficiency. For example, in 2010 under the
MD Demand Reductions [TWh]
2010 2015 2020 202525% - - - -50% 36.7% 36.4% 34.6% 33.9%100% 84.1% 80.3% 79.4% 81.4%
% Increase f rom Baseline
aneous reductions in electricity demand in Maryland.
A. Paul et al. / Energy Policy 38 (2010) 6820–6829 6825
baseline scenario (25% efficiency spending) $24 million is spenton efficiency but in the 100% efficiency spending scenario only$89 million is spent on efficiency. This relationship is generallynot proportional because greater spending on efficiency will havean effect on the RGGI allowance price, which is discussed below,and thus on allowance revenue.
The right hand side of Fig. 2 clearly shows that greater spendingon efficiency enables greater purchases of demand reductions. Notunexpectedly, demand reductions directly attributable to efficiencyspending in any given year increase less than proportionately withspending. For example in 2020, efficiency expenditures under the100% scenario are 3.6 times as large as in the 25% scenario, but thepurchased savings are only 1.8 times as large as in the baselinescenario. This result occurs because the next megawatt hour ofdemand reduction becomes more expensive as the amount ofmegawatt hour reductions being purchased increases.
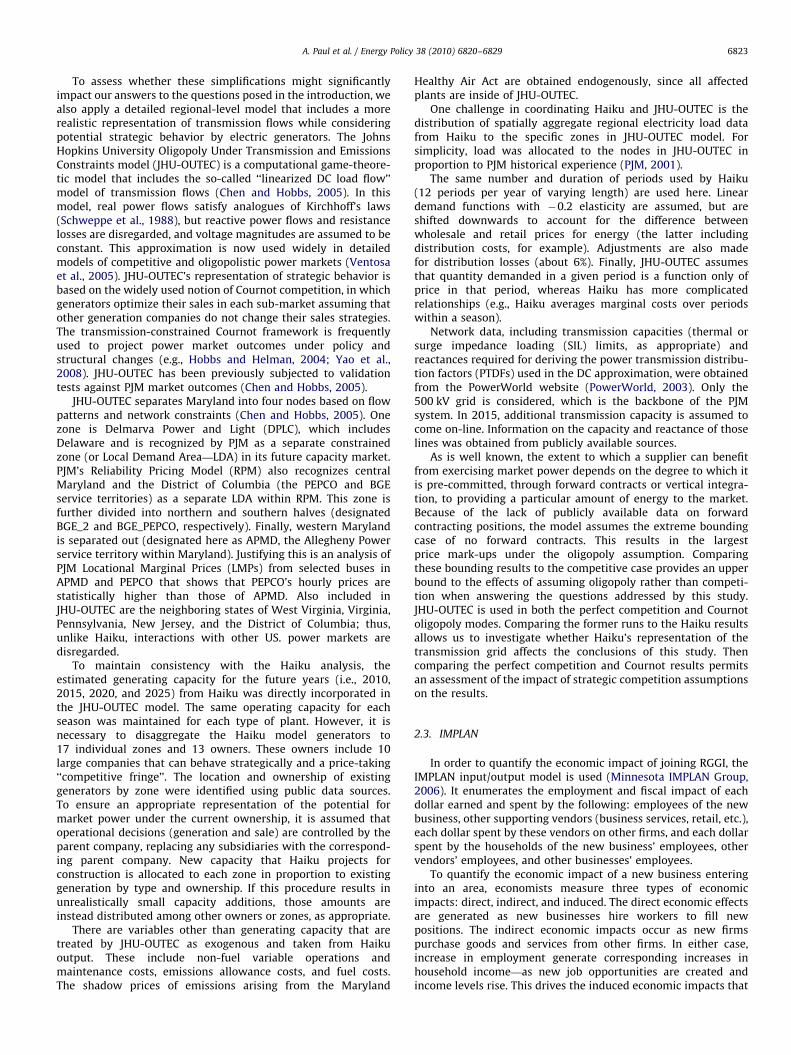
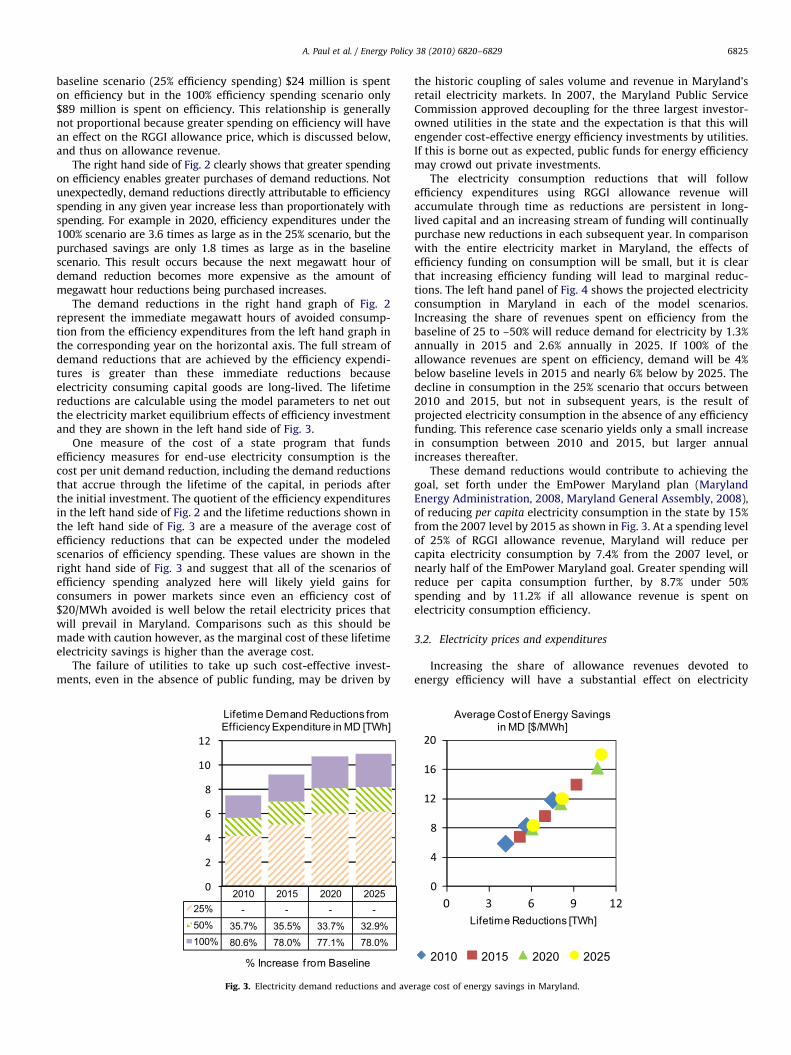
The demand reductions in the right hand graph of Fig. 2represent the immediate megawatt hours of avoided consump-tion from the efficiency expenditures from the left hand graph inthe corresponding year on the horizontal axis. The full stream ofdemand reductions that are achieved by the efficiency expendi-tures is greater than these immediate reductions becauseelectricity consuming capital goods are long-lived. The lifetimereductions are calculable using the model parameters to net outthe electricity market equilibrium effects of efficiency investmentand they are shown in the left hand side of Fig. 3.
One measure of the cost of a state program that fundsefficiency measures for end-use electricity consumption is thecost per unit demand reduction, including the demand reductionsthat accrue through the lifetime of the capital, in periods afterthe initial investment. The quotient of the efficiency expendituresin the left hand side of Fig. 2 and the lifetime reductions shown inthe left hand side of Fig. 3 are a measure of the average cost ofefficiency reductions that can be expected under the modeledscenarios of efficiency spending. These values are shown in theright hand side of Fig. 3 and suggest that all of the scenarios ofefficiency spending analyzed here will likely yield gains forconsumers in power markets since even an efficiency cost of$20/MWh avoided is well below the retail electricity prices thatwill prevail in Maryland. Comparisons such as this should bemade with caution however, as the marginal cost of these lifetimeelectricity savings is higher than the average cost.
The failure of utilities to take up such cost-effective invest-ments, even in the absence of public funding, may be driven by
Lifetime Demand Reductions from Efficiency Expenditure in MD [TWh]
2010 2015 2020 202525% - - - -50% 35.7% 35.5% 33.7% 32.9%100% 80.6% 78.0% 77.1% 78.0%
% Increase f rom Baseline
Fig. 3. Electricity demand reductions and ave
the historic coupling of sales volume and revenue in Maryland’sretail electricity markets. In 2007, the Maryland Public ServiceCommission approved decoupling for the three largest investor-owned utilities in the state and the expectation is that this willengender cost-effective energy efficiency investments by utilities.If this is borne out as expected, public funds for energy efficiencymay crowd out private investments.
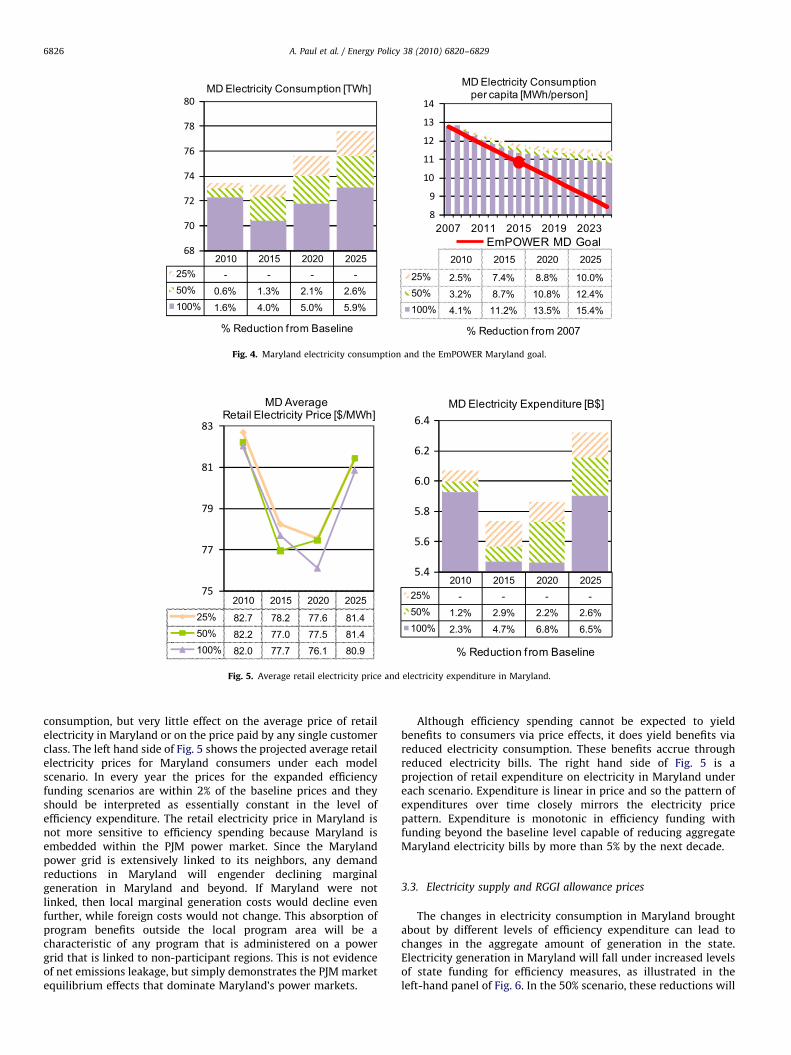
The electricity consumption reductions that will followefficiency expenditures using RGGI allowance revenue willaccumulate through time as reductions are persistent in long-lived capital and an increasing stream of funding will continuallypurchase new reductions in each subsequent year. In comparisonwith the entire electricity market in Maryland, the effects ofefficiency funding on consumption will be small, but it is clearthat increasing efficiency funding will lead to marginal reduc-tions. The left hand panel of Fig. 4 shows the projected electricityconsumption in Maryland in each of the model scenarios.Increasing the share of revenues spent on efficiency from thebaseline of 25 to –50% will reduce demand for electricity by 1.3%annually in 2015 and 2.6% annually in 2025. If 100% of theallowance revenues are spent on efficiency, demand will be 4%below baseline levels in 2015 and nearly 6% below by 2025. Thedecline in consumption in the 25% scenario that occurs between2010 and 2015, but not in subsequent years, is the result ofprojected electricity consumption in the absence of any efficiencyfunding. This reference case scenario yields only a small increasein consumption between 2010 and 2015, but larger annualincreases thereafter.
These demand reductions would contribute to achieving thegoal, set forth under the EmPower Maryland plan (MarylandEnergy Administration, 2008, Maryland General Assembly, 2008),of reducing per capita electricity consumption in the state by 15%from the 2007 level by 2015 as shown in Fig. 3. At a spending levelof 25% of RGGI allowance revenue, Maryland will reduce percapita electricity consumption by 7.4% from the 2007 level, ornearly half of the EmPower Maryland goal. Greater spending willreduce per capita consumption further, by 8.7% under 50%spending and by 11.2% if all allowance revenue is spent onelectricity consumption efficiency.
3.2. Electricity prices and expenditures
Increasing the share of allowance revenues devoted toenergy efficiency will have a substantial effect on electricity
Lifetime Reductions [TWh]
Average Cost of Energy Savingsin MD [$/MWh]
2010 2015 2020 2025
rage cost of energy savings in Maryland.
MD Electricity Consumption [TWh]
2010 2015 2020 202525% - - - -50% 0.6% 1.3% 2.1% 2.6%100% 1.6% 4.0% 5.0% 5.9%
% Reduction f rom Baseline
2007 2011 2015 2019 2023
MD Electricity Consumptionper capita [MWh/person]
2010 2015 2020 2025
25% 2.5% 7.4% 8.8% 10.0%50% 3.2% 8.7% 10.8% 12.4%100% 4.1% 11.2% 13.5% 15.4%
% Reduction f rom 2007
EmPOWER MD Goal
Fig. 4. Maryland electricity consumption and the EmPOWER Maryland goal.
2010 2015 2020 202525% 82.7 78.2 77.6 81.450% 82.2 77.0 77.5 81.4100% 82.0 77.7 76.1 80.9
MD AverageRetail Electricity Price [$/MWh]
MD Electricity Expenditure [B$]
2010 2015 2020 202525% - - - -50% 1.2% 2.9% 2.2% 2.6%100% 2.3% 4.7% 6.8% 6.5%
% Reduction f rom Baseline
Fig. 5. Average retail electricity price and electricity expenditure in Maryland.
A. Paul et al. / Energy Policy 38 (2010) 6820–68296826
consumption, but very little effect on the average price of retailelectricity in Maryland or on the price paid by any single customerclass. The left hand side of Fig. 5 shows the projected average retailelectricity prices for Maryland consumers under each modelscenario. In every year the prices for the expanded efficiencyfunding scenarios are within 2% of the baseline prices and theyshould be interpreted as essentially constant in the level ofefficiency expenditure. The retail electricity price in Maryland isnot more sensitive to efficiency spending because Maryland isembedded within the PJM power market. Since the Marylandpower grid is extensively linked to its neighbors, any demandreductions in Maryland will engender declining marginalgeneration in Maryland and beyond. If Maryland were notlinked, then local marginal generation costs would decline evenfurther, while foreign costs would not change. This absorption ofprogram benefits outside the local program area will be acharacteristic of any program that is administered on a powergrid that is linked to non-participant regions. This is not evidenceof net emissions leakage, but simply demonstrates the PJM marketequilibrium effects that dominate Maryland’s power markets.
Although efficiency spending cannot be expected to yieldbenefits to consumers via price effects, it does yield benefits viareduced electricity consumption. These benefits accrue throughreduced electricity bills. The right hand side of Fig. 5 is aprojection of retail expenditure on electricity in Maryland undereach scenario. Expenditure is linear in price and so the pattern ofexpenditures over time closely mirrors the electricity pricepattern. Expenditure is monotonic in efficiency funding withfunding beyond the baseline level capable of reducing aggregateMaryland electricity bills by more than 5% by the next decade.
3.3. Electricity supply and RGGI allowance prices
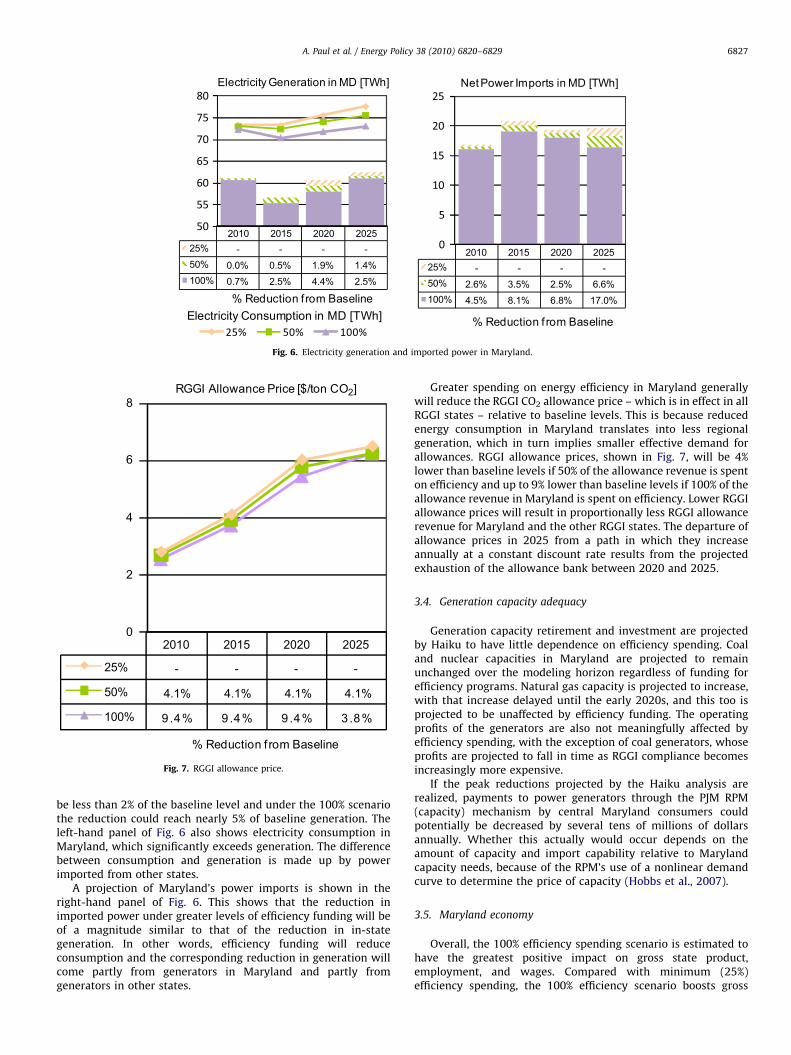
The changes in electricity consumption in Maryland broughtabout by different levels of efficiency expenditure can lead tochanges in the aggregate amount of generation in the state.Electricity generation in Maryland will fall under increased levelsof state funding for efficiency measures, as illustrated in theleft-hand panel of Fig. 6. In the 50% scenario, these reductions will
Electricity Generation in MD [TWh]
Electricity Consumption in MD [TWh]
2010 2015 2020 202525% - - - -50% 0.0% 0.5% 1.9% 1.4%100% 0.7% 2.5% 4.4% 2.5%
% Reduction f rom Baseline
Net Power Imports in MD [TWh]
2010 2015 2020 202525% - - - -50% 2.6% 3.5% 2.5% 6.6%100% 4.5% 8.1% 6.8% 17.0%
% Reduction f rom Baseline
Fig. 6. Electricity generation and imported power in Maryland.
RGGI Allowance Price [$/ton CO2]
2010 2015 2020 2025
25% - - - -
50% 4.1% 4.1% 4.1% 4.1%
100% 9.4% 9.4% 9.4% 3.8%
% Reduction f rom Baseline
8
6
4
2
0
Fig. 7. RGGI allowance price.
A. Paul et al. / Energy Policy 38 (2010) 6820–6829 6827
be less than 2% of the baseline level and under the 100% scenariothe reduction could reach nearly 5% of baseline generation. Theleft-hand panel of Fig. 6 also shows electricity consumption inMaryland, which significantly exceeds generation. The differencebetween consumption and generation is made up by powerimported from other states.
A projection of Maryland’s power imports is shown in theright-hand panel of Fig. 6. This shows that the reduction inimported power under greater levels of efficiency funding will beof a magnitude similar to that of the reduction in in-stategeneration. In other words, efficiency funding will reduceconsumption and the corresponding reduction in generation willcome partly from generators in Maryland and partly fromgenerators in other states.
Greater spending on energy efficiency in Maryland generallywill reduce the RGGI CO2 allowance price – which is in effect in allRGGI states – relative to baseline levels. This is because reducedenergy consumption in Maryland translates into less regionalgeneration, which in turn implies smaller effective demand forallowances. RGGI allowance prices, shown in Fig. 7, will be 4%lower than baseline levels if 50% of the allowance revenue is spenton efficiency and up to 9% lower than baseline levels if 100% of theallowance revenue in Maryland is spent on efficiency. Lower RGGIallowance prices will result in proportionally less RGGI allowancerevenue for Maryland and the other RGGI states. The departure ofallowance prices in 2025 from a path in which they increaseannually at a constant discount rate results from the projectedexhaustion of the allowance bank between 2020 and 2025.
3.4. Generation capacity adequacy
Generation capacity retirement and investment are projectedby Haiku to have little dependence on efficiency spending. Coaland nuclear capacities in Maryland are projected to remainunchanged over the modeling horizon regardless of funding forefficiency programs. Natural gas capacity is projected to increase,with that increase delayed until the early 2020s, and this too isprojected to be unaffected by efficiency funding. The operatingprofits of the generators are also not meaningfully affected byefficiency spending, with the exception of coal generators, whoseprofits are projected to fall in time as RGGI compliance becomesincreasingly more expensive.
If the peak reductions projected by the Haiku analysis arerealized, payments to power generators through the PJM RPM(capacity) mechanism by central Maryland consumers couldpotentially be decreased by several tens of millions of dollarsannually. Whether this actually would occur depends on theamount of capacity and import capability relative to Marylandcapacity needs, because of the RPM’s use of a nonlinear demandcurve to determine the price of capacity (Hobbs et al., 2007).
3.5. Maryland economy
Overall, the 100% efficiency spending scenario is estimated tohave the greatest positive impact on gross state product,employment, and wages. Compared with minimum (25%)efficiency spending, the 100% efficiency scenario boosts gross
A. Paul et al. / Energy Policy 38 (2010) 6820–68296828
state product (GSP) by $150 million in 2010 and more than $500million in 2020. This can be compared with the incrementalexpenditure of RGGI funds on efficiency of $64 million and $125million, respectively, in those years, as shown in the left-handpanel of Fig. 2. The 50% efficiency scenario provides less than halfthe boost, increasing GSP by around $25 million in 2010 and over$250 million in 2020, comparable with incremental expendituresof $23 million and $44 million. Although positive, these impactsare small relative to the overall state economy, equaling about0.1% or less of GSP in each period.
Both scenarios have a net positive impact on jobs and totalwages. One hundred percent efficiency spending will create about4300 new jobs in 2020, whereas 50% efficiency will result in 1700more jobs than the baseline scenario. These are net gains, as theanalysis accounts for the economic impact of decreased directpayments to consumers out of RGGI auction proceeds as well asthe effects of expenditures on energy efficiency. While theseemployment gains may appear large, in the context of theMaryland’s 2.5 million jobs, they are fairly small.
Committing more allowance revenue to energy efficiencyspending reduces the revenue available to other state programs.However, new tax revenues generated from growth in the stateeconomy resulting from the energy efficiency investment offsetthese reductions by 20–30% in 2020.
3.6. Robustness of results to model formulation:
Transmission and market power
The effects of the 50% and 100% efficiency spending scenarios(compared with the 25% baseline) on wholesale energy costs forMaryland consumers are very similar in the analysis performedusing the Haiku model and that using both the competitive andoligopolistic version JHU-OUTEC model. The JHU-OUTEC modelhas a more detailed representation of mid-Atlantic powertransmission constraints and allows for market power in theformation of wholesale electricity prices. Thus, the assumptionsconcerning the transmission grid and oligopolistic behavior donot change the fundamental conclusion that under the costsassumed here for energy efficiency, consumers would benefitfrom an expansion of the programs.
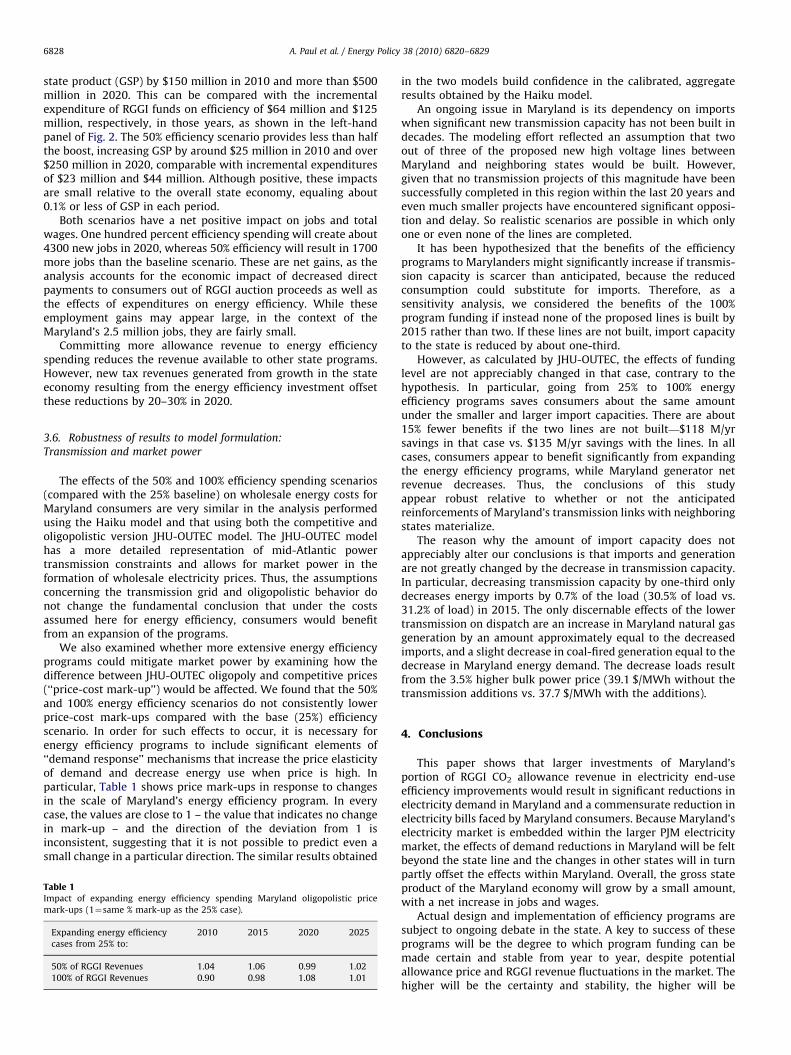
We also examined whether more extensive energy efficiencyprograms could mitigate market power by examining how thedifference between JHU-OUTEC oligopoly and competitive prices(‘‘price-cost mark-up’’) would be affected. We found that the 50%and 100% energy efficiency scenarios do not consistently lowerprice-cost mark-ups compared with the base (25%) efficiencyscenario. In order for such effects to occur, it is necessary forenergy efficiency programs to include significant elements of‘‘demand response’’ mechanisms that increase the price elasticityof demand and decrease energy use when price is high. Inparticular, Table 1 shows price mark-ups in response to changesin the scale of Maryland’s energy efficiency program. In everycase, the values are close to 1 – the value that indicates no changein mark-up – and the direction of the deviation from 1 isinconsistent, suggesting that it is not possible to predict even asmall change in a particular direction. The similar results obtained
Table 1Impact of expanding energy efficiency spending Maryland oligopolistic price
mark-ups (1¼same % mark-up as the 25% case).
Expanding energy efficiency
cases from 25% to:
2010 2015 2020 2025
50% of RGGI Revenues 1.04 1.06 0.99 1.02
100% of RGGI Revenues 0.90 0.98 1.08 1.01
in the two models build confidence in the calibrated, aggregateresults obtained by the Haiku model.
An ongoing issue in Maryland is its dependency on importswhen significant new transmission capacity has not been built indecades. The modeling effort reflected an assumption that twoout of three of the proposed new high voltage lines betweenMaryland and neighboring states would be built. However,given that no transmission projects of this magnitude have beensuccessfully completed in this region within the last 20 years andeven much smaller projects have encountered significant opposi-tion and delay. So realistic scenarios are possible in which onlyone or even none of the lines are completed.
It has been hypothesized that the benefits of the efficiencyprograms to Marylanders might significantly increase if transmis-sion capacity is scarcer than anticipated, because the reducedconsumption could substitute for imports. Therefore, as asensitivity analysis, we considered the benefits of the 100%program funding if instead none of the proposed lines is built by2015 rather than two. If these lines are not built, import capacityto the state is reduced by about one-third.
However, as calculated by JHU-OUTEC, the effects of fundinglevel are not appreciably changed in that case, contrary to thehypothesis. In particular, going from 25% to 100% energyefficiency programs saves consumers about the same amountunder the smaller and larger import capacities. There are about15% fewer benefits if the two lines are not built—$118 M/yrsavings in that case vs. $135 M/yr savings with the lines. In allcases, consumers appear to benefit significantly from expandingthe energy efficiency programs, while Maryland generator netrevenue decreases. Thus, the conclusions of this studyappear robust relative to whether or not the anticipatedreinforcements of Maryland’s transmission links with neighboringstates materialize.
The reason why the amount of import capacity does notappreciably alter our conclusions is that imports and generationare not greatly changed by the decrease in transmission capacity.In particular, decreasing transmission capacity by one-third onlydecreases energy imports by 0.7% of the load (30.5% of load vs.31.2% of load) in 2015. The only discernable effects of the lowertransmission on dispatch are an increase in Maryland natural gasgeneration by an amount approximately equal to the decreasedimports, and a slight decrease in coal-fired generation equal to thedecrease in Maryland energy demand. The decrease loads resultfrom the 3.5% higher bulk power price (39.1 $/MWh without thetransmission additions vs. 37.7 $/MWh with the additions).
4. Conclusions
This paper shows that larger investments of Maryland’sportion of RGGI CO2 allowance revenue in electricity end-useefficiency improvements would result in significant reductions inelectricity demand in Maryland and a commensurate reduction inelectricity bills faced by Maryland consumers. Because Maryland’selectricity market is embedded within the larger PJM electricitymarket, the effects of demand reductions in Maryland will be feltbeyond the state line and the changes in other states will in turnpartly offset the effects within Maryland. Overall, the gross stateproduct of the Maryland economy will grow by a small amount,with a net increase in jobs and wages.
Actual design and implementation of efficiency programs aresubject to ongoing debate in the state. A key to success of theseprograms will be the degree to which program funding can bemade certain and stable from year to year, despite potentialallowance price and RGGI revenue fluctuations in the market. Thehigher will be the certainty and stability, the higher will be
A. Paul et al. / Energy Policy 38 (2010) 6820–6829 6829
participation in efficiency programs and the larger consistentcy ofour model assumptions with long-term behavior.
The Maryland Department of the Environment and the State ofMaryland are interested in shrinking the state’s carbon footprintand lowering overall greenhouse gas emissions while stimulatingeconomic activity and improvements in the quality of life ofMaryland citizens. RGGI addresses CO2 emissions from electricitygenerators with a capacity of at least 25 MW. Other targets forreductions of greenhouse gas emissions could include industrialgeneration of electricity, natural gas combustion for purposesother than electricity generation (e.g., home heating), and thetransportation sector. To date, no comprehensive assessmentexists of such opportunities for reductions outside the RGGItargets. Such an assessment would include analysis of theimplications for energy markets, their effects on consumers andassociated business enterprises, as well as overall economic,social, and environmental dynamics.
Acknowledgements
The authors wish to thank the Maryland Department of theEnvironment for funding. Paul, Palmer, and Myers also wish toacknowledge partial support from US EPA Science to AchieveResults (STAR) Grant RD83183601 and the funders of the RFFElectricity and Environment Program, including a special grantfrom Exelon for work on Energy Efficiency.
References
Chen, Y., Hobbs, B.F., 2005. An oligopolistic power market model with tradable NOx
permits. IEEE Transactions on Power Systems 20 (1), 119–129.Hobbs, B.F., Helman, U., 2004. Complementarity-based equilibrium modeling for
electric power markets.. In: Bunn, D. (Ed.), Modeling Prices in CompetitiveElectricity Markets.. J. Wiley Series in Financial Economics, London.
Hobbs, B.F., Hu, M.C., Inon, J., Bhavaraju, M., Stoft, S., 2007. A dynamic analysis of ademand curve-based capacity market proposal: the PJM reliability pricingmodel. IEEE Transactions on Power Systems 22 (1), 3–11.
Houthakker, H.S., Taylor, Lester D., 1970. Consumer Demand in the UnitedStates: Analyses and Projections.. Harvard University Press, Cambridge,Massachusetts.
Maryland Energy Administration, 2008. Maryland Strategic Electricity Plan.Maryland Energy Administration (MEA), Annapolis, MD. Available online:/http://energy.maryland.gov/about/reports/documents/MEASTRATEGICELECTRICITYPLAN.pdfS.
Maryland General Assembly, 2008. Fiscal and Policy Note: EmPOWER MarylandEnergy Efficiency Act of 2008. Available online /http://mlis.state.md.us/2008rs/fnotes/bil_0004/hb0374.pdfS.
Minnesota IMPLAN Group, Inc. (MIG, Inc.), 2006. Viewed at /http://www.implan.comS.
Paul, Anthony, Dallas Burtraw, and Karen Palmer. 2009a. Haiku documentation:RFF’s Electricity Market Model Version 2.0. RFF Report, January. /http://www.rff.org/RFF/Documents/RFF-Rpt-Haiku.v2.0.pdfS.
Paul, Anthony, Erica Myers, Karen Palmer. 2009b. A partial adjustment model ofU.S. electricity demand by region, season, and sector. RFF Discussion Paper 08-50, April /http://www.rff.org/Publications/Pages/PublicationDetails.aspx?PublicationID=20773S.
PJM, 2001. PJM Hourly Load. Available online: /ftp://ftp.pjm.com/pub/market_system_data/system/hourly_prelim_loads/dailyS.
PowerWorld, 2003. Available online: /www.powerworld.com/downloads.htmlS.Regional Greenhouse Gas Initiative, 2005. Memorandum of understanding.
Regional Greenhouse Gas Initiative (RGGI), available online: /http://rggi.org/docs/mou_12_20_05.pdfS.
Regional Greenhouse Gas Initiative, 2007. Overview of RGGI CO2 Budget TradingProgram (p4). Regional Greenhouse Gas Initiative (RGGI), available online:/http://rggi.org/docs/program_summary_10_07.pdfS.
Regional Greenhouse Gas Initiative, 2008. Final report of the RGGI emissionsleakage multi-state staff working group to the RGGI agency heads (March).Regional Greenhouse Gas Initiative (RGGI), available on-line: /http://www.rggi.org/docs/20080331leakage.pdfS.
Ruth, M., Gabriel, S., Palmer, K., Burtraw, D., Paul, A, Chen, Y., Hobbs, B., Irani, D.,Michael, J., Ross, K., Conklin, R., Miller, J., 2008. Economic and energy impactsfrom participation in the regional greenhouse gas initiative: a case study of thestate of Maryland. Energy Policy 36, 2279–2289.
Schweppe, F.C., Caramanis, M.C., Tabors, R.D., Bohn, R.E., 1988. Spot Pricing ofElectricity. Kluwer Academic Publishers.
Ventosa, M., Baıllo, A., Ramos, A., Rivier, M., 2005. Electricity market modelingtrends. Energy Policy 33 (7), 897–913.
Yao, J., Adler, I., Oren, S., 2008. Modeling and computing two-settlementoligopolistic equilibrium in congested electricity networks. OperationsResearch 56 (1), 34–47.