Embed Size (px)
Citation preview

1
The Role of Alternative Respiration Pathways and the
Effect of Nutrient Loading on Peat Decomposition in Plum
Island Marsh Sediment
David A. Dodge1, 2
Collaborator: Austin Ritter1, 2
Advisor: Anne Giblin3
1Middlebury College, Middlebury, VT, 05753
2Semester in Environmental Science, Woods Hole, MA, 02543
3The Ecosystems Center, MBL, Woods Hole, MA 02543

2
Abstract
The combined effects of sea level rise and eutrophication are responsible for the
observed global decline in coastal wetland ecosystems. Nutrient loading is thought to
stimulate rates of nitrate reduction in belowground marsh sediment, weakening soil
structure and contributing to marsh subsidence. In this study, rates of aerobic respiration,
nitrate reduction, and sulfate reduction were compared under pristine and eutrophic
conditions. Nitrate reduction was also compared in pristine marsh sediment and sediment
exposed to chronic fertilization over a seven-year period under the TIDE project at Plum
Island LTER. Nitrate reduction had the lowest rates of respiration in sediment slurries
over a fourteen day period, however, results showed evidence of increased rates of nitrate
reduction in belowground sediment with nutrient loading. Comparison of TIDE and
pristine marsh sediment showed evidence of shifts in the composition of the microbial
community and organic carbon composition of the soil. Conservation efforts therefore
should aim to decrease anthropogenic nitrogen loading to wetland ecosystems.
Key Words: Wetland, Eutrophication, Microbial Respiration Pathways, Plum Island
LTER, TIDE
Introduction
The Intergovernmental Panel on Climate Change estimates that global sea levels
have risen approximately 1.7-1.8 millimeters per year over the last 150 years (IPCC,
2010). Climate change models predict that sea level rise will accelerate in the 21st century
as ice caps and glaciers continue to melt (Giblin, 2010). The implications of sea level rise
are numerous and in some cases yet to be defined; however, one clear effect is the global

3
loss of wetland ecosystems. The IPCC predicts that by 2080, 33 percent of the world’s
coastal wetlands will have been converted to open water (Giblin, 2010).
Wetland ecosystems provide habitat to many species, play important roles in
nutrient uptake, and prevent flooding in many coastal communities (Giblin, 2010). In
cities that are particularly vulnerable to storm flooding, like New Orleans, the
consequences of wetland loss are especially significant.
Wetlands can keep pace with rising sea levels by decomposing trapped sediment
from the land and ocean, thereby accumulating belowground organic matter (Giblin).
Eutrophication disrupts this natural process by stimulating soil metabolism and increasing
translocation of belowground resources to aboveground plant biomass via roots and
rhizomes (Turner et al., 2007). Loss of belowground biomass can compromise soil
structure in marsh sediment. A 2010 study by Turner found that high nitrogen and
phosphorous loading to a Louisiana salt marsh caused a 35% decline in soil strength at a
depth of 60-100 cm (Turner, 2010). Weakened soil may degrade and/or collapse during
flooding events, contributing to marsh subsidence. Understanding the combined effects of
eutrophication and sea level rise on soil processes in belowground marsh sediment is key
to advancing long-term maintenance of salt marshes (Turner 2007).
This study focuses on the effects of eutrophication on three microbial respiration
pathways in belowground marsh sediment: aerobic respiration, nitrate reduction
(denitrification), and sulfate reduction. Aerobic respiration uses oxygen as an electron
acceptor to oxidize organic carbon, releasing CO2 in the process (table 1). Aerobic
respiration generally occurs within the top centimeter of marsh sediment after which
oxygen availability rapidly declines (figure 1 and 2). Nitrate reduction uses nitrate as an

4
electron acceptor to oxidize organic carbon, releasing CO2 and nitrogen gas in the process
(see table 1). Nitrate reduction generally occurs within a narrow depth range (around 2
centimeters) at which nitrate is present but oxygen is absent from the soil (figure 1 and
2). Sulfate reduction uses sulfate as an electron acceptor to decompose organic carbon
and release CO2 and hydrogen sulfide in the process (figure 1 and 2). Hydrogen sulfide
produces a strong odor that is easily recognizable at low concentrations. In addition to
reducing sulfate, some strains of sulfate reducing bacterium use nitrate as an electron
acceptor producing ammonia in the process (Dalsgaard et al., 1994). Sulfate reduction
generally occurs in deep anoxic, typically below 4 centimeters.
These heterotrophic respiration reactions have accompanying energetic
efficiencies, expressed as delta G of the reaction and measured in kcal mol-1
(table 2). A
reaction with a negative delta G releases energy. Aerobic respiration has a delta G of -114
kcal mol-1
and is the most energetically favorable of the three respiration pathways. With
a delta G of -108 kcal mol-1
nitrate reduction does not proceed as favorably as aerobic
respiration. Sulfate reduction has a delta G of -20 kcal mol-1
and is therefore the least
energetically favorable of the three reactions. The delta Gs of the reactions determine the
efficiency at which microbial populations are able to break down certain kinds organic
carbon compounds via one of these three pathways.
Aerobic respiration and sulfate reduction account for all or nearly all carbon
decomposition in marsh sediment. Nitrate reduction, although energetically favorable,
only occurs within a narrow depth range. Aerobic respiration rates are not intrinsically
higher than anaerobic rates, however, they are typically greater than aerobic
decomposition rates at depth because most labile carbon has already been consumed
5
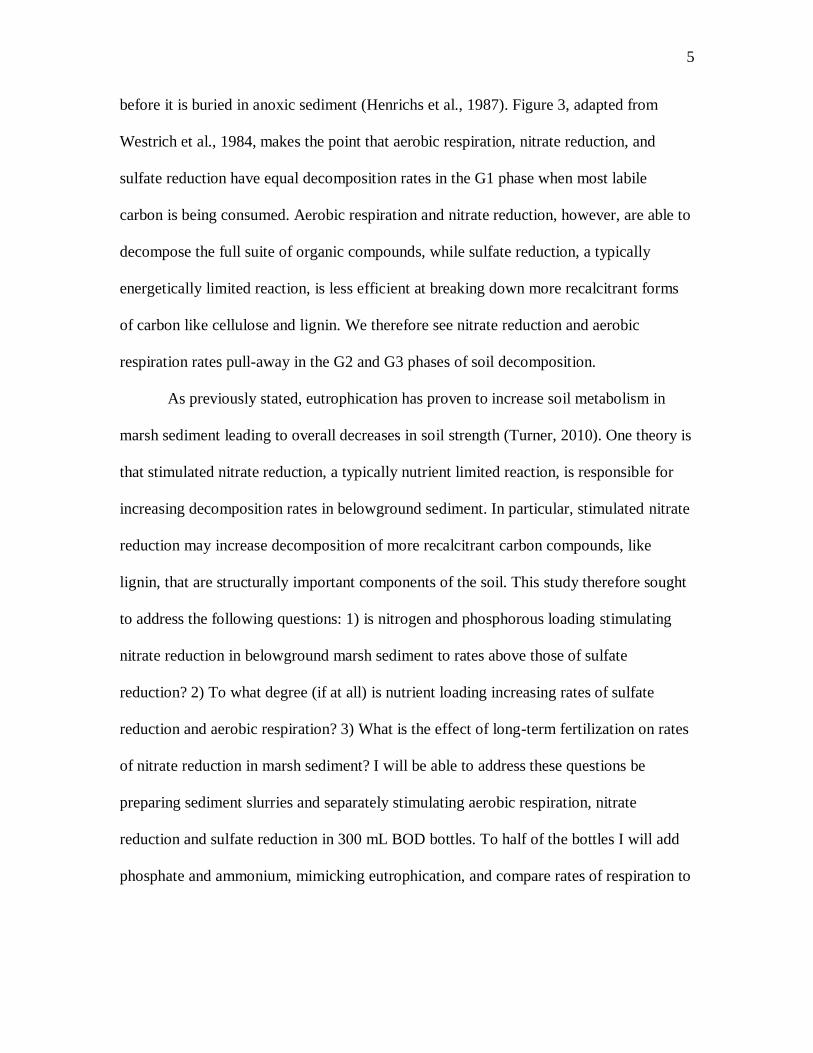
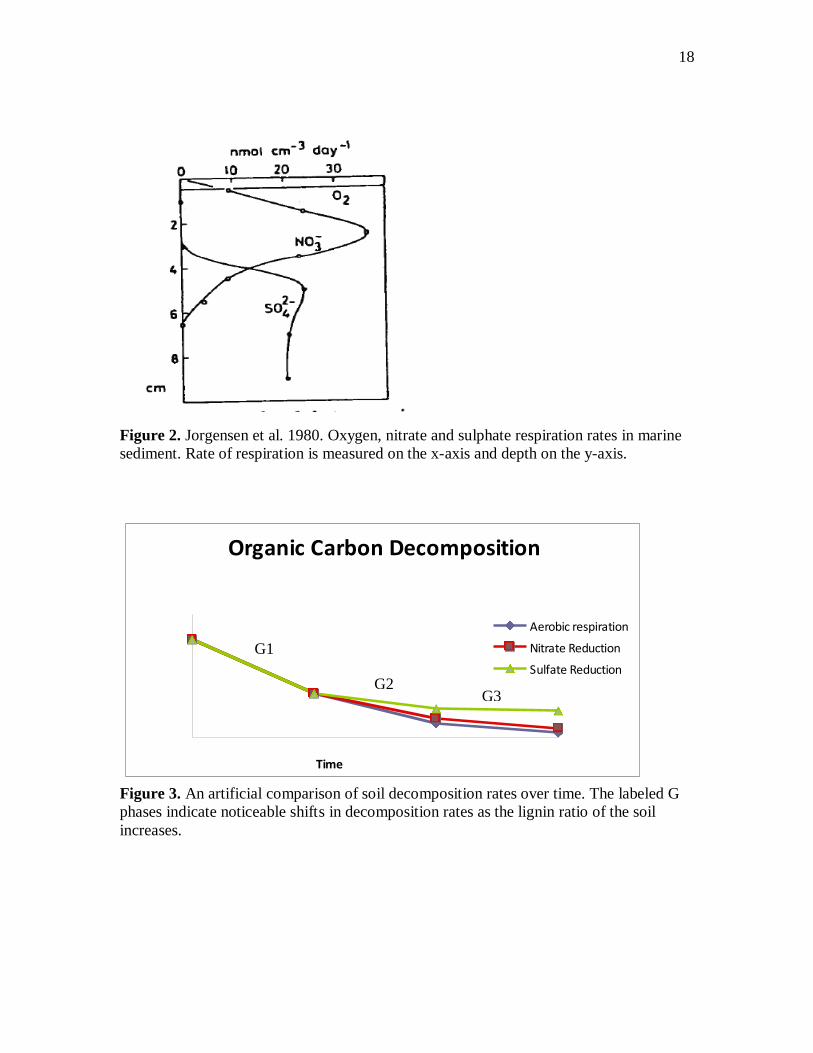
before it is buried in anoxic sediment (Henrichs et al., 1987). Figure 3, adapted from
Westrich et al., 1984, makes the point that aerobic respiration, nitrate reduction, and
sulfate reduction have equal decomposition rates in the G1 phase when most labile
carbon is being consumed. Aerobic respiration and nitrate reduction, however, are able to
decompose the full suite of organic compounds, while sulfate reduction, a typically
energetically limited reaction, is less efficient at breaking down more recalcitrant forms
of carbon like cellulose and lignin. We therefore see nitrate reduction and aerobic
respiration rates pull-away in the G2 and G3 phases of soil decomposition.
As previously stated, eutrophication has proven to increase soil metabolism in
marsh sediment leading to overall decreases in soil strength (Turner, 2010). One theory is
that stimulated nitrate reduction, a typically nutrient limited reaction, is responsible for
increasing decomposition rates in belowground sediment. In particular, stimulated nitrate
reduction may increase decomposition of more recalcitrant carbon compounds, like
lignin, that are structurally important components of the soil. This study therefore sought
to address the following questions: 1) is nitrogen and phosphorous loading stimulating
nitrate reduction in belowground marsh sediment to rates above those of sulfate
reduction? 2) To what degree (if at all) is nutrient loading increasing rates of sulfate
reduction and aerobic respiration? 3) What is the effect of long-term fertilization on rates
of nitrate reduction in marsh sediment? I will be able to address these questions be
preparing sediment slurries and separately stimulating aerobic respiration, nitrate
reduction and sulfate reduction in 300 mL BOD bottles. To half of the bottles I will add
phosphate and ammonium, mimicking eutrophication, and compare rates of respiration to

6
the without nutrient bottles. I will also compare rates of nitrate reduction between pristine
sediment and sediment exposed to chronic fertilization (see table 3).
I expect aerobic respiration to have the highest respiration rate due to its more
negative delta G (table 2). I predict that nitrate reduction will have a slightly lower
respiration rate and sulfate reduction rates to be substantially lower than the other two
respiration pathways (figure 5). I expect carbon decomposition to be higher in the
chronically fertilized plot than in the control plot, owing perhaps to changes in the
composition of the microbial community. Nitrogen loading over a seven-year period
would likely favor nitrate reducers over sulfur reducing bacteria in the belowground
sediment.
I expected ammonium and phosphate addition to have little to no effect on the
rates of nitrate and sulfate reduction in the sediments because nitrate reduction is
typically nitrate limited and sulfate reduction is typically energetically limited. In the
aerobic sediment I expected nutrient addition to increase carbon decomposition because
oxic respiration is generally a nutrient limited pathway (Jorgensen, 1980).
Methods
Six sediment cores were extracted from the Plum Island salt marshes on Nov.
15th, 2010 (figure 4). Four cores were extracted from a pristine reference site (“West”)
and two cores from a site exposed to chronic fertilization over a seven-year period under
the TIDE project. Addition of mineral nitrogen to the “TIDE” plot ended this past
summer (2010). All six cores were extracted from areas of the marsh that are in the

7
process of falling into the river channel. Cores were sealed and brought back to Loeb lab
for treatment and analysis.
In order to compare the relative efficiencies of different microbial respiration
pathways in the belowground marsh sediment, I stimulated aerobic respiration, nitrate
reduction, and sulfate reduction separately in 300 mL BOD bottles. In the TIDE
sediment, I was most interested in the effects of long-term nitrogen fertilization on rates
of nitrate reduction. I therefore did not stimulate aerobic respiration or sulfate reduction
in the TIDE sediment. In order to test the effects of eutrophication on each of the three
respiration pathways, I added low concentrations of ammonium and phosphate to half of
the treatment bottles. For each treatment I prepared 3 replicates and 1 blank control,
totaling 27 BOD bottles. The experimental design is presented in Table 3.
Anaerobic sediment between 5 and 10 cm was removed from the cores and
homogenized separately by site in plastic bags. The bags were pumped with nitrogen gas
to keep the sediment anaerobic. Two 25-30 g sediment samples from the TIDE plot and
two samples from the West plot were weighed and placed in an oven to dry. The samples
were reweighed at the end of the experiment and CHN analysis was performed on the
dried samples. Approximately 2 grams of sediment went into each labeled BOD bottle,
excluding the oxygen, nitrate and sulfate blank bottles (table 4). Stir bars were placed in
the oxygen treatment bottles in order to measure dissolved oxygen over the course of the
experiment. Sediment slurries were prepared by adding oxygen, sulfate, and nitrate
artificial seawater solutions to the oxygen, sulfate, and nitrate treatment bottles.
The seawater solutions were prepared from 5-micron filtered Marine Resources
Center seawater. The filtered seawater was diluted 10:1 in a carboy and NaCl was
8
subsequently added. The resulting stock solution had low nutrient background and
standard seawater salinity of 7 ppt (175 mM C). This solution was added directly to the
oxygen treatment bottles. For the sulfate seawater solution, MgSO4 was added to make a
27.5 mM sulfate solution. For the nitrate seawater solution KNO3 was added to the stock
to make a 1 mM nitrate solution. The nitrate and sulfate solutions were bubbled with
nitrogen gas until no oxygen was present in the water. These solutions were then added to
the appropriate treatment bottles. Phosphate and ammonium were additionally added to
the 12 nutrient bottles in order to obtain concentrations of 20 uM PO4 and 100 uM NH4.
The bottles were then placed on a shaker table to mix over the next 14 days. A black
plastic bag was wrapped around the apparatus to prevent autotrophic respiration in the
bottles.
Water samples were extracted from the bottles on day 3, day 11, and day 14 of the
14-day experiment using 30 mL syringes. The bottles were quickly refilled with the
appropriate seawater solution after sampling. Water samples were transferred to
scintillation vials and stored in the freezer for subsequent analysis. I left 5 mL of sample
in the syringe for subsequent DIC analysis.
I ran nitrate, sulfate, phosphate, ammonium and DIC on all of the water samples.
Nitrate concentrations were measured according to the SES “Lachat Flow Injection
Analysis for Measuring Nitrate” protocol 2010. Sulfate concentrations were measured
according to the SES “Dionex for Sulfate Analysis” protocol 2010. Phosphate
concentrations were measured with a spectrophotometer according to SES “Phosphate”
protocol 2010. Ammonium concentrations were also measured using a spectrophotometer
according to SES “Ammonium” protocol 2010. DIC was measured with a gas

9
chromatograph according to SES “Total Dissolved Inorganic Carbon in Aqueous
Samples” protocol 2010. These measurements of concentrations over three time points
were used to estimate rates of respiration in the oxygen, sulfate, nitrate, and TIDE nitrate
treatment bottles.
Results
Sediment from the Plum Island West site had roughly the same percent water
weight as sediment from the TIDE research site (see figure 6). Two samples from each
site were weighed and dried for CHN analysis. TIDE sediment was approximately 36%
water weight and West sediment was approximately 39% water weight. This difference is
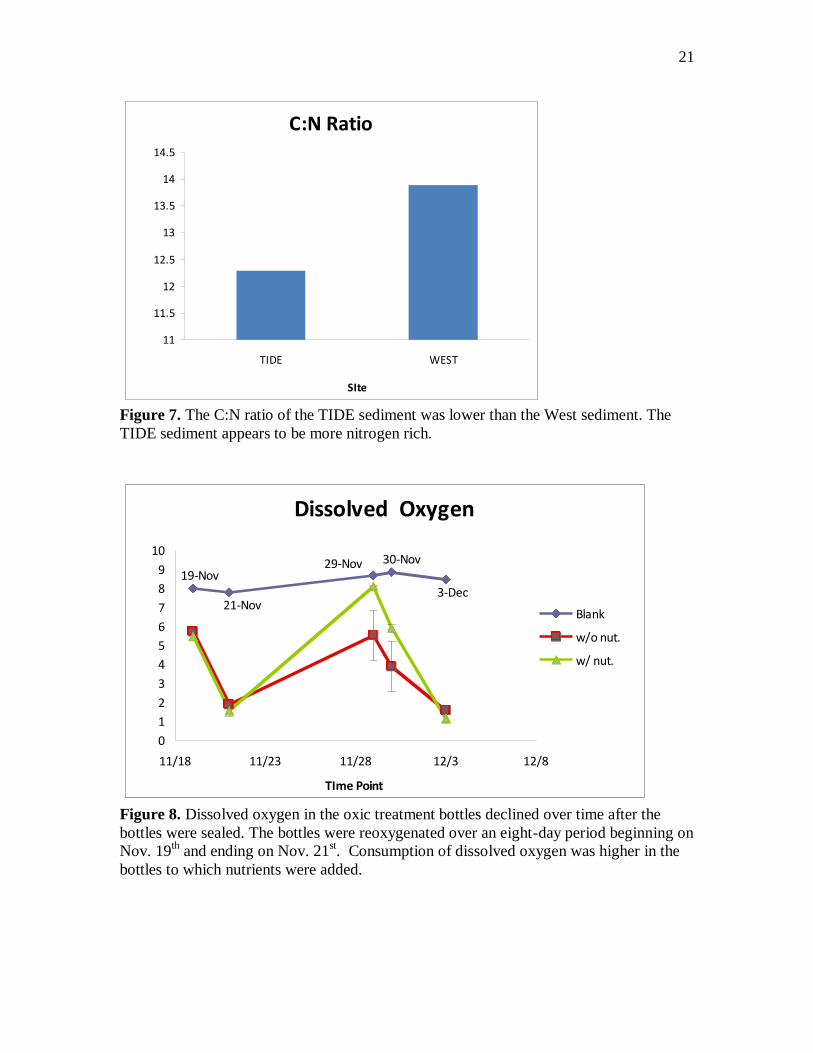
not statistically significant given the small sample set. The C:N ratio of the TIDE
sediment was lower than the C:N ratio of the pristine West sediment (figure 7). The
average C:N ratio of the two TIDE sediment samples was 12.29 vs. 13.88 in the two
West samples. The TIDE plot is therefore more nitrogen rich. Mineral nitrogen was
added to the TIDE research plot over a seven-year period that ended this past summer
(2010).
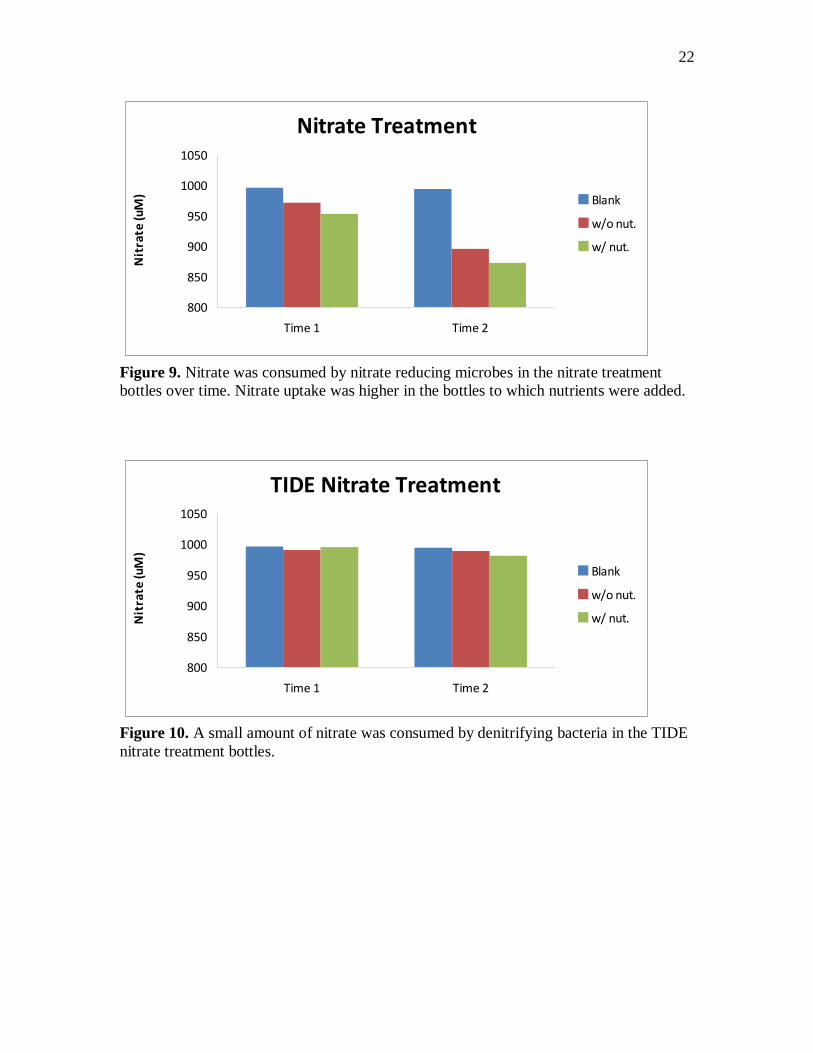
In the oxygen treatment bottles D.O. decreased rapidly from the first time point
on 11/19 to the second time point on 11/21 (see figure 8). Rates of decrease were
equivalent in “with nutrient” and “without nutrient" bottles. The bottles were left on a
shaker table with a 30 mL headspace to reoxygenate over a seven-day period
(thanksgiving break). The D.O. in the nutrient bottles climbed to 8 mg/L vs. 5.5 in the
w/o nutrient bottles over this period of time. There was greater variation in the w/out
nutrient oxygen readings (see error bars). D.O. decreased faster in the nutrient bottles

10
between time points 3 and 5 than in the w/o nutrient bottles. D.O. fell from 5.5 mg/L to
1.6 mg/L in w/o nutrient bottles vs. from 8.1 mg/L to 1.2 mg/L in the nutrient bottles.
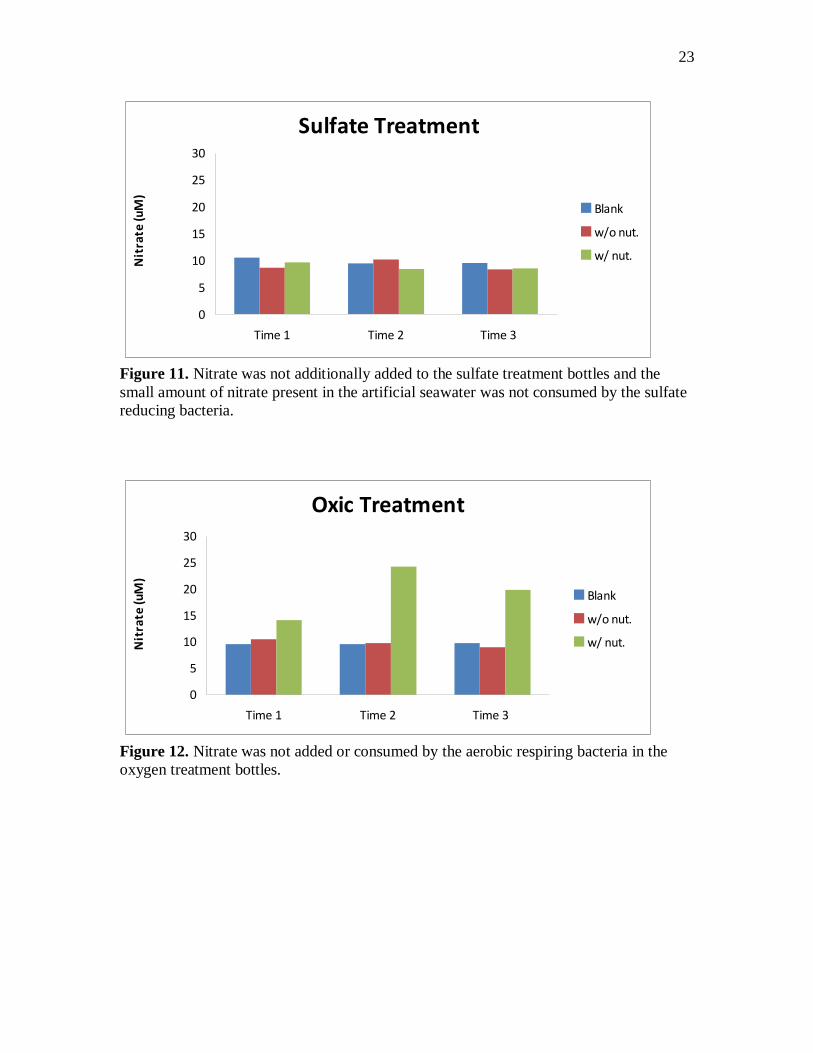
Nitrate concentrations dropped 100 uM between time points 1 and 2 the nitrate
treatment bottles (figure 9). Nitrate concentrations were 15-20 uM higher in the nutrient
bottles. In the TIDE treatment bottles, concentrations of nitrate fell only 2 uM in the
w/out nutrient bottles and 14 uM in the nutrient bottles (figure 10). In the sulfate and
oxygen treatment bottles no additional nitrate was added to the slurry and no nitrate
appears to have been consumed (figure 11 and 12). There are low concentrations of
nitrate present in the dilute standard ASW I prepared. In the oxygen treatment bottles
nitrate concentrations go up over time in the nutrient bottles.
Sulfate concentrations dropped 1000 uM between time 1 and time 0 (figure 13).
The blank bottle was used as a reference for time 0. Data from time points 2 and 3 was to
variable to present in this report. The error bars show that sulfate concentrations were not
significantly different in w/ nutrient and w/out bottles.
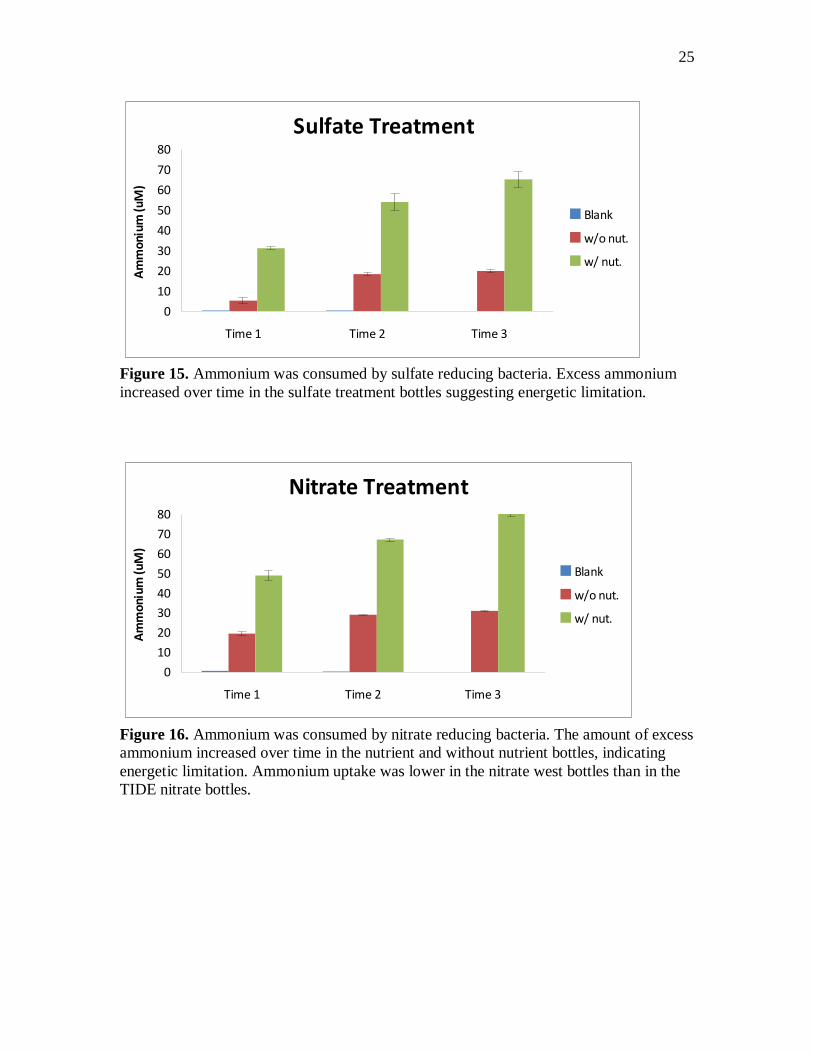
Ammonium was added to the nutrient bottles at time points 0, 1, and 2. If no
ammonium uptake occurred, then we would expect to see 300 uM concentrations in the
nutrient bottles. In all of the treatment bottles ammonium concentrations were below 80
uM. In the oxic treatment, ammonium was completely consumed by aerobic respiring
microbes in the w/out nutrient bottles (figure 14). Excess ammonium accumulated in the
nutrient bottles. Approximately 90 uM ammonium was consumed between each time
point, leaving behind 10-20 uM ammonium at each time point. In the w/ nutrient sulfate
treatment bottles, there was an excess of approximately 30 uM at time 1 (figure 15). The
amount of excess ammonium decreased to a difference of 10 uM at time point 3,

11
indicating greater ammonium uptake over time in the nutrient bottles. In the nitrate and
sulfate w/out nutrient bottles, ammonium concentrations went up slightly over time
indicating mineralization (figure 15 and 16). Ammonium concentrations were lower in
both nutrient and w/out nutrient TIDE sediment than in the West sediment (figures 16
and 17).
DIC and phosphate analysis did not yield usable results. DIC data showed
substantial inconsistencies, even after accounting for outliers. As a result, DIC did not
serve as an accurate tool for measuring respiration rates in this experiment. Phosphate
data showed a complete set of blanks and there was no sample left to run another set.
Rates of oxygen and nutrient flux were used to estimate respiration rates in umol
CO2 per gram sediment per day. In calculating respiration rates, I made sure to balance
the reaction. For every mole of sulfate consumed, 2 moles of carbon dioxide are respired
in sulfate reduction (table 1). For every mole of nitrate consumed, 1.25 moles of carbon
dioxide are respired via nitrate reduction. For every mole of oxygen consumed, a mole of
carbon dioxide is respired in aerobic respiration. These respiration rates were all
converted to umol per gram of sediment per day by multiplying uM concentrations by the
size of each bottle (0.3 liters) and dividing by the weight of each sediment sample added
to each bottle at the start of the experiment.
Sulfate reduction rates were than10 times higher than aerobic respiration and
nitrate reduction rates (see figure 18). Sulfate reduction rates in the nutrient and w/out
nutrient were statistically the similar. Rates of aerobic respiration in the oxygen treatment
bottles were higher than rates of nitrate reduction in the nitrate treatment bottles by
approximately 4 umol CO2 g-1 (wet) day-1 (figure 19). Nitrate reduction in sediment

12
from the West plot was higher than in sediment from the TIDE plot. Denitrification in the
TIDE plot was very low at 0.18 umol CO2 g-1 (wet) day-1. Addition of nutrients to the
oxygen and nitrate treatment bottles significantly increased respiration rates.
Discussion
The TIDE sediment was more nitrogen rich than the West sediment (figure 7).
This data indicates higher rates of immobilization by soil microbes in the TIDE plot after
seven years of chronic fertilization. This conclusion is consistent with the findings of
Deegan et al. (2010), who observed significant alterations in the composition of the
microbial community in the TIDE plot over time. Rates of nitrate reduction, however,
were higher in the West sediment than in the TIDE sediment (figure 19). This result is
inconsistent with the CHN data, but may be explained by shifts in the organic carbon
composition of the TIDE plot over time. If lignin analysis were run on sediments from
the two sites, I would expect the TIDE sediment to have a significantly higher lignin to
nitrogen ratio than West sediment. Chronic fertilization may have stimulated
decomposition of labile carbon in the belowground sediment via nitrate and sulfate
reduction leaving behind more recalcitrant carbon compounds, like lignin. The West
sediment would therefore have higher rates of nitrate reduction because oxidation of
labile carbon is more efficient than oxidation of lignin-like compounds.
Addition of ammonium and phosphate to the nitrate treatment bottles increased
nitrate reduction in the West sediment. There was an excess of ammonium and nitrate in
the nutrient and without nutrient bottles at each measured time point. Nitrate reduction is
typically limited by the availability of nitrate, however, phosphate data may have

13
indicated a phosphate limited system. This would have been an interesting result. Overall,
the data supports the conclusion that eutrophication will initially increase rates of nitrate
reduction in belowground sediment, however, there is little evidence to support the theory
that nutrient loading significantly increases oxidation of more recalcitrant carbon
compounds, thereby weakening soil structure. I would need to perform lignin analysis in
order to make conclusions about the kinds of organic compounds that were being
decomposed in the nitrate bottles.
As predicted, nutrient loading significantly increased aerobic respiration in the
oxygen treatment bottles. The dissolved oxygen data shows increased rates of oxygen
consumption in the nutrient bottles and the ammonium data shows strong evidence of
ammonium limitation in the without nutrient bottles. In addition, more ammonium was
consumed in the oxygen treatment bottles than in the sulfate or nitrate treatment bottles.
These results suggest that eutrophication will increase soil decomposition rates in the
aerobic layer of the sediment and that aerobic respiring bacteria will immobilize large
amounts of ammonium entering a system (i.e. the top centimeter of sediment).
As expected, there was no observed difference in the sulfate nutrient and without
nutrient bottles and the ammonium data shows that ammonium concentrations did not
change in the sulfate treatment bottles over time. This data supports the conclusion that
sulfate reduction is an energetically limited process. Eutrophication would therefore have
minimal effects on rates of sulfate reduction in belowground sediment.
The data shows that the rate of sulfate reduction was much higher than aerobic
respiration and nitrate reduction rates in the sediment. This was an unexpected result
because sulfate reduction has a less negative delta G and is therefore less efficient at
14
decomposing organic carbon than nitrate and aerobic respiration. Although some human
and machine error may be involved, a plausible explanation is that the microbial
population of sulfate reducers was already very high in the belowground soil from the
sediment cores. Fourteen days may have been too short a time for populations of
denitrifying bacteria and aerobic respiring bacteria to reach comparable levels. Excess
ammonium decreased in the nutrient bottles over time, suggesting that microbial
populations were in the process of growing. With more funding and time, I would ideally
conduct this experiment over the course of year. Disregarding sulfate reduction, aerobic
respiration rates were, as predicted from the delta Gs of the reactions, higher than nitrate
reduction rates.
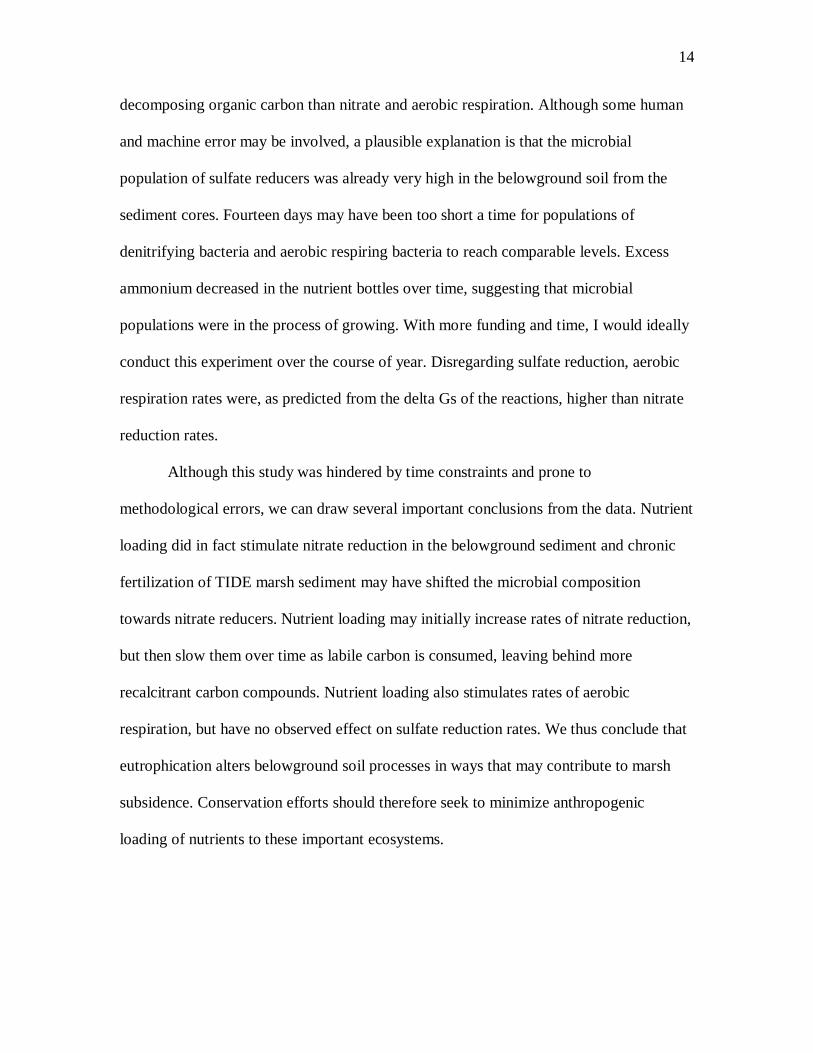
Although this study was hindered by time constraints and prone to
methodological errors, we can draw several important conclusions from the data. Nutrient
loading did in fact stimulate nitrate reduction in the belowground sediment and chronic
fertilization of TIDE marsh sediment may have shifted the microbial composition
towards nitrate reducers. Nutrient loading may initially increase rates of nitrate reduction,
but then slow them over time as labile carbon is consumed, leaving behind more
recalcitrant carbon compounds. Nutrient loading also stimulates rates of aerobic
respiration, but have no observed effect on sulfate reduction rates. We thus conclude that
eutrophication alters belowground soil processes in ways that may contribute to marsh
subsidence. Conservation efforts should therefore seek to minimize anthropogenic
loading of nutrients to these important ecosystems.

15
Acknowledgments
I would like to specially thank to Anne Giblin for all of her help as my project
advisor. She was a crucial resource in designing, conducting and interpreting the results
of this experiment. Thanks also to Rich Mchorney for his instruction in running lab
machines and for his innovation when things didn’t go exactly to plan. Thanks also to
Will Daniels and Stefanie Strebel for their help gathering materials and making
themselves available at odd hours of the day. Thanks to Austin Ritter for his help in the
field and to David Johnson for being our marsh tour guide and photographer.

16
Literature Cited Ammonium Determination in Natural Waters. Methods. The Semester in Environmental Science.
Woods Hole, MA.
CHN Samples Preparation and Packing. Methods. The Semester in Environmental Science.
Woods Hole, MA.
Daalgard, T., and G. Bak. 1992. Nitrate Reduction in a Sulfate-Reducing Bacterium,
Desulfovibrio desulfuricans, Isolated from Rice Paddy Soil: Sulfide Inhibition, Kinetics, and
Regulation. Environmental Microbiology, 60, 1, 291-297.
Darby, F. A. and R. E. Turner. 2008. Below- and Aboveground Spartina Alterniflora Production
in a Louisiana Salt Marsh. Estuaries and Coasts, 31, 223-231.
Deegan, L. A., and 18 co-authors. 2010. Susceptibility of salt marshes to nutrient enrichment and
predator removal. Ecological Applications, 17, 542-563.
Dissolved Inorganic Carbon by Headspace Equilibrium & Gas Chromatography. Methods. The
Semester in Environmental Science. Woods Hole, MA.
Dionex protocol for Sulfate Depletion. Methods. The Semester in Environmental Science. Woods Hole, MA.
Giblin, A. 2010. Annual Report on Sea Level Rise. The Ecosystems Center. Marine Biological Laboratory. Woods Hole, MA.
Giblin, A. 2010. Gibbs Free Energy lecture. The Semester in Environmental Science. Marine Biological Laboratory. Woods Hole, MA.
Henrichs, S. M., and W. S. Reeburgh. 1987. Anaerobic mineralization of marine sediment
organic matter: Rates and the role of anaerobic processes in the oceanic carbon economy. Geomicrobiology Journal, 5(3,4), 191-237.
Jorgensen, B. B. 1980. Mineralization and the Bacterial Cycling of Carbon, Nitrogen and Sulphur in Marine Sediments. Institute of Ecology and Genetics. University of Aarhus, Ny Munkegade.
DK-8000 Aarhus C, Denmark.
Nitrate Analysis using automated Flow Injection Analyzer. Methods. The Semester in
Environmental Science. Woods Hole, MA.
Phosphate (dissolved). Methods. The Semester in Environmental Science. Woods Hole, MA.
Turner, R. E. 2010. Beneath the Salt Marsh Canopy: Loss of Soil Strength with Increasing
Nutrient Loads.
Westrich, J. T., and R. A. Berner. 1984. The role of sedimentary organic matter in bacterial
sulfate reduction: The G model tested. Limnology and Oceanography, 29(2), 236-249.

17
Figures and Tables
Microbial Respiration Pathway Chemical Equation
Aerobic Respiration
Nitrate Reduction
Sulfate Reduction
Table 1. Microbial respiration pathways in marsh sediment and their accompanying
chemical equations.
Pathway
ΔG
Oxic Respiration
-114
Nitrate Reduction
(denitrification)
-108
Sulfate Reduction
-20
Table 2. A comparison of the energetic efficiencies of three heterotrophic respiration
reactions carried out by soil microbes in marsh sediment.
Figure 1. Jorgensen et al. 1980. Distribution of three electron acceptors used for
respiration in coastal sediments. Concentration is measured on the x-axis and depth on
the y-axis.
18
Figure 2. Jorgensen et al. 1980. Oxygen, nitrate and sulphate respiration rates in marine
sediment. Rate of respiration is measured on the x-axis and depth on the y-axis.
Organic Carbon Decomposition
0
0.5
1
1.5
2
2.5
0 5 10 15 20 25 30Time
Dec
ompo
siti
on R
ate Aerobic respiration
Nitrate Reduction
Sulfate Reduction
Figure 3. An artificial comparison of soil decomposition rates over time. The labeled G
phases indicate noticeable shifts in decomposition rates as the lignin ratio of the soil
increases.
G2 G3
G1

19
Figure 4. An image of the Plum Island LTER site. The area labeled “West” is a pristine
reference site from which I extracted several sediment cores. Cores were also taken from
the “TIDE” site, which had been chronically fertilized with mineral nitrogen over a 7-
year period. (Google maps).
Plot W/out NH4 + PO4 W/ NH4 + PO4
Control Aerobic Resp. O2 Aerobic Resp. O2
Control Sulfate Reduction. SO4 Sulfate Reduction. SO4
Control Nitrate Reduction. NO3 Nitrate Reduction. NO3
TIDE plot Nitrate Reduction. NO3 Nitrate Reduction. NO3
Table 3. The experimental design.
O2 weight (g) SO4 weight (g) NO3 weight (g) TIDE NO3 weight (g)
1 2.13 2.12 2.06 2.05
2 2.12 2.08 2.03 2.06
3 2.09 2.17 2.11 2.07
Nut. 1 2.14 2.06 2.15 2.03
Nut. 2 2.07 2.09 2.13 2.09
Nut. 3 2.1 2.1 2.17 2.03
Table 4. Wet weight in grams of sediment added to the BOD bottles at the beginning of
the experiment.
West
TIDE

20
Figure 5. This is a graph of my expected results. I predicted that aerobic respiration
would have the highest rate of respiration and sulfate reduction the lowest. I also
predicted nutrient addition of ammonium and phosphate would increase respiration rates
in all but the sulfate treatment bottles.
Wet and Dry Weights
0
5
10
15
20
25
30
TIDE WEST
Site
Wei
ght
(g)
11/19 Wet
12/6 Dry
Figure 6. Wet weight and dry weight of soil samples collected from the TIDE and West
sites in Plum Island sound. The percent water weight of sediment was same at both sites.
21
C:N Ratio
11
11.5
12
12.5
13
13.5
14
14.5
TIDE WEST
SIte
C:N
Rat
io
Figure 7. The C:N ratio of the TIDE sediment was lower than the West sediment. The
TIDE sediment appears to be more nitrogen rich.
Dissolved Oxygen
3-Dec
30-Nov29-Nov
21-Nov
19-Nov
0
1
2
3
4
5
6
7
8
9
10
11/18 11/23 11/28 12/3 12/8
TIme Point
D.O
. (m
g/L) Blank
w/o nut.
w/ nut.
Figure 8. Dissolved oxygen in the oxic treatment bottles declined over time after the
bottles were sealed. The bottles were reoxygenated over an eight-day period beginning on
Nov. 19th and ending on Nov. 21
st. Consumption of dissolved oxygen was higher in the
bottles to which nutrients were added.
22
Nitrate Treatment
800
850
900
950
1000
1050
Time 1 Time 2
Nit
rate
(uM
) Blank
w/o nut.
w/ nut.
Figure 9. Nitrate was consumed by nitrate reducing microbes in the nitrate treatment
bottles over time. Nitrate uptake was higher in the bottles to which nutrients were added.
TIDE Nitrate Treatment
800
850
900
950
1000
1050
Time 1 Time 2
Nit
rate
(uM
)
Blank
w/o nut.
w/ nut.
Figure 10. A small amount of nitrate was consumed by denitrifying bacteria in the TIDE
nitrate treatment bottles.
23
Sulfate Treatment
0
5
10
15
20
25
30
Time 1 Time 2 Time 3
Nit
rate
(uM
)
Blank
w/o nut.
w/ nut.
Figure 11. Nitrate was not additionally added to the sulfate treatment bottles and the
small amount of nitrate present in the artificial seawater was not consumed by the sulfate
reducing bacteria.
Oxic Treatment
0
5
10
15
20
25
30
Time 1 Time 2 Time 3
Nit
rate
(uM
)
Blank
w/o nut.
w/ nut.
Figure 12. Nitrate was not added or consumed by the aerobic respiring bacteria in the
oxygen treatment bottles.

24
Sulfate Treatment
14.5
15.0
15.5
16.0
16.5
17.0
Time 1
Sulf
ate
(mM
) Blank
w/o nut.
w/ nut.
Figure 13. Sulfate was consumed in the sulfate treatment bottles between time point 0
and 1. The blank sulfate bottle is used as a reference. Measured sulfate concentrations at
time points 2 and 3 were highly variable and therefore not presented in this report.
Oxic Treatment
0
10
20
30
40
50
60
70
80
Time 1 Time 2 Time 3
Am
mon
ium
(uM
)
Blank
w/o nut.
w/ nut.
Figure 14. Ammonium was consumed in the oxic treatment bottles over time. In the
nutrient bottles ammonium was added at time points 0, 1 and 2. Excess ammonium
increased over time in the nutrient bottles indicating respiration was energetically limited.
Ammonium was completely consumed by the aerobic bacteria in the without treatment
bottles suggesting that they were nutrient limited.
25
Sulfate Treatment
0
10
20
30
40
50
60
70
80
Time 1 Time 2 Time 3
Am
mon
ium
(uM
)
Blank
w/o nut.
w/ nut.
Figure 15. Ammonium was consumed by sulfate reducing bacteria. Excess ammonium
increased over time in the sulfate treatment bottles suggesting energetic limitation.
Nitrate Treatment
0
10
20
30
40
50
60
70
80
Time 1 Time 2 Time 3
Am
mon
ium
(uM
)
Blank
w/o nut.
w/ nut.
Figure 16. Ammonium was consumed by nitrate reducing bacteria. The amount of excess
ammonium increased over time in the nutrient and without nutrient bottles, indicating
energetic limitation. Ammonium uptake was lower in the nitrate west bottles than in the
TIDE nitrate bottles.
26
TIDE Nitrate Treatment
0
10
20
30
40
50
60
70
80
Time 1 Time 2 Time 3
Am
mon
ium
(uM
)
Blank
w/o nut.
w/ nut.
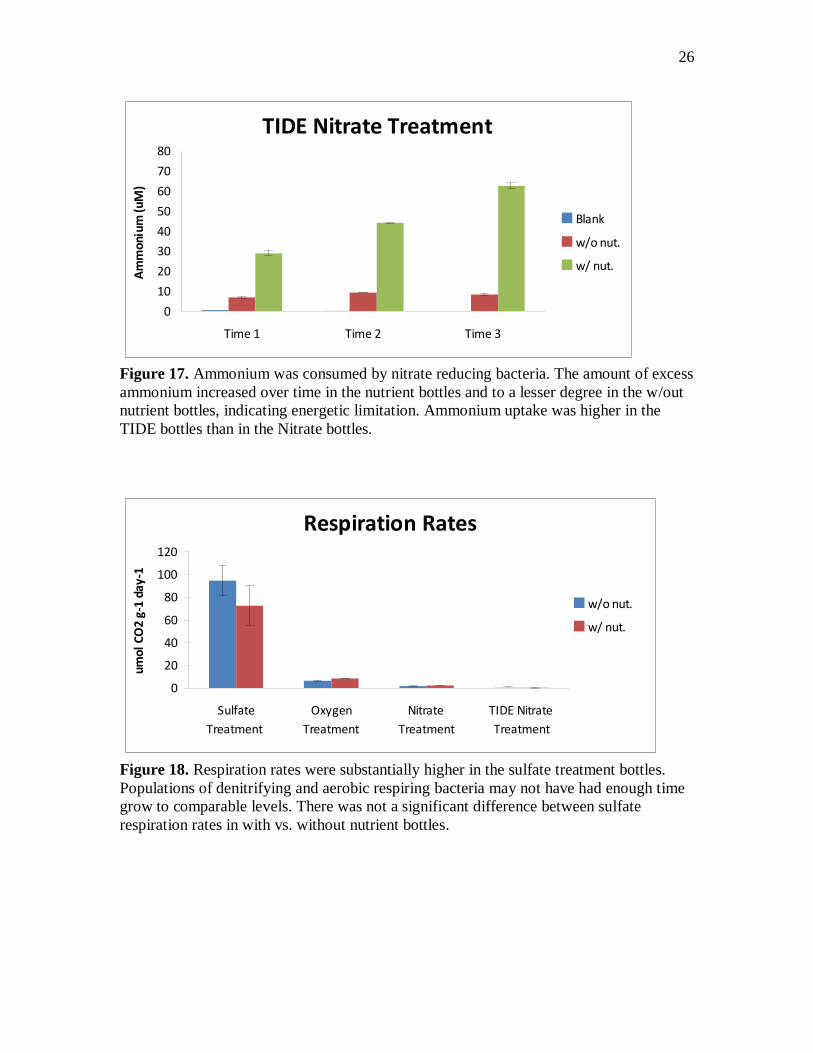
Figure 17. Ammonium was consumed by nitrate reducing bacteria. The amount of excess
ammonium increased over time in the nutrient bottles and to a lesser degree in the w/out
nutrient bottles, indicating energetic limitation. Ammonium uptake was higher in the
TIDE bottles than in the Nitrate bottles.
Respiration Rates
0
20
40
60
80
100
120
Sulfate
Treatment
Oxygen
Treatment
Nitrate
Treatment
TIDE Nitrate
Treatment
umol
CO
2 g-
1 da
y-1
w/o nut.
w/ nut.
Figure 18. Respiration rates were substantially higher in the sulfate treatment bottles.
Populations of denitrifying and aerobic respiring bacteria may not have had enough time
grow to comparable levels. There was not a significant difference between sulfate
respiration rates in with vs. without nutrient bottles.

27
Respiration Rates
0
2
4
6
8
10
Oxygen Treatment Nitrate Treatment TIDE Nitrate Treatment
umol
CO
2 g-
1 da
y-1
w/o nut.
w/ nut.
Figure 19. Aerobic respiration was higher than nitrate reduction in the TIDE and West
sediment. Nitrate reduction was higher in the west sediment than in the TIDE sediment.
Chronic fertilization over a seven-year period may have decreased the percent labile
carbon in the TIDE plot over the time. Addition of nutrients increased respiration in the
oxygen and nitrate bottles.