Embed Size (px)
Citation preview
TECHNO-ECONOMIC ANALYSIS OF ALTERNATIVE PATHWAYS
FOR ISOPROPANOL PRODUCTION
A Thesis
by
WARISSARA PANJAPAKKUL
Submitted to the Office of Graduate and Professional Studies of
Texas A&M University
in partial fulfillment of the requirements for the degree of
MASTER OF SCIENCE
Chair of Committee, Mahmoud El-Halwagi
Committee Members, M. Sam Mannan
Ahmad Hilaly
Head of Department, M. Nazmul Karim
May 2018
Major Subject: Chemical Engineering
Copyright 2018 Warissara Panjapakkul
ii
ABSTRACT
The price fluctuations and unpredictability of a secure supply of fossil fuels create
uncertainty in chemical production. One of the chemicals impacted by uncertainty is
isopropanol, which has traditionally been manufactured from propylene. The shale gas
boom has led to propylene shortages. Along with the high growth rate of propylene based-
products, the propylene market has been tight and prices are expected to increase.
Therefore, it is necessary to identify alternative, cost-effective, and sustainable pathways
for the production of isopropanol. Isopropanol is projected to grow annually at a rate of
about two percent across the globe. It is primarily used as a solvent in cosmetics, in
personal care products, and in pharmaceutical products. Other uses include as a motor oil
in the automotive industry, and as a cleaning and drying agent in the electronics industry.
The objective of this research is to find alternative pathways to produce isopropanol and
to select viable pathways while considering technology and economic factors. The
methodology to achieve this objective includes branching and matching, prescreening,
pathway selection, techno-economic analysis, and selecting the most sustainable pathway.
A superstructure is created to show routes that can produce isopropanol from a variety of
feedstocks. The techno-economic assessments of processes are also performed to compare
the profitability of possible processes. The result shows that the propane dehydrogenation
is still the best pathway to produce propylene. The result also reveals that the most
promising pathway for isopropanol production is direct hydration. The advantages of the
direct hydration method over the indirect hydration method include less dependency of
iii
annual ROI on the price of propylene (the feedstock of hydration processes), and
avoidance of corrosion and environmental problems.

iv
DEDICATION
To my parents
v
ACKNOWLEDGEMENTS
I would like to acknowledge my academic supervisor, Dr. Mahmoud El-Halwagi,
for always providing enthusiastic encouragement and valuable guidance of my research
work. I would also like to thank my committee members, Dr. Sam Mannan and Dr. Ahmad
Hilaly, for their advice and assistance.
I would also like to express my deep gratitude to my family for their support and
inspiration throughout my study. My grateful thanks are also extended to Juliet Campbell
for her help in proofreading my thesis. Finally, special thanks should be given to my group
members and Thai friends for creating my memorable experience at Texas A&M
University.
vi
CONTRIBUTORS AND FUNDING SOURCES
Contributors
This work was supported by a thesis committee consisting of Professor Mahmoud
El-Halwagi and Ahmad Hilaly of the Department of Chemical Engineering and Professor
M. Sam Mannan of the Department of Petroleum Engineering.
All work for this the thesis was completed by the student, under the advisement of
Professor Mahmoud El-Halwagi of the Department of Chemical Engineering.
Funding Sources
There are no outside funding contributions to acknowledge related to the research
and compilation of this document.
vii
TABLE OF CONTENTS
Page
ABSTRACT .......................................................................................................................ii
DEDICATION .................................................................................................................. iv
ACKNOWLEDGEMENTS ............................................................................................... v
CONTRIBUTORS AND FUNDING SOURCES ............................................................. vi
TABLE OF CONTENTS .................................................................................................vii
LIST OF FIGURES ........................................................................................................... ix
LIST OF TABLES ............................................................................................................. x
1. INTRODUCTION ...................................................................................................... 1
1.1 Overview ............................................................................................................ 1 1.2 Isopropanol ......................................................................................................... 2
1.3 Isopropanol manufacture .................................................................................... 4 1.4 Isopropanol market ............................................................................................. 9
2. PROBLEM STATEMENT ...................................................................................... 10
3. METHODOLOGY ................................................................................................... 11
3.1 Generating a superstructure of alternatives ...................................................... 12
3.2 Prescreening pathways ..................................................................................... 15 3.3 Synthesis and simulation of flowsheet ............................................................. 16
3.4 Techno-Economic analysis .............................................................................. 17 3.5 Final selection .................................................................................................. 19
4. RESULTS AND DISCUSSIONS ............................................................................ 20
4.1 Superstructure of alternatives ........................................................................... 20 4.2 Prescreening pathways ..................................................................................... 24 4.3 Techno-economic analysis ............................................................................... 33 4.4 Alternatives comparison for final selection ..................................................... 57
5. CONCLUSIONS ...................................................................................................... 65
viii
Page
REFERENCES ................................................................................................................. 67
APPENDIX A .................................................................................................................. 72
APPENDIX B .................................................................................................................. 73
APPENDIX C .................................................................................................................. 74
ix
LIST OF FIGURES
Page
Figure 1 Methodology diagram ........................................................................................ 11
Figure 2 Branching approach .......................................................................................... 13
Figure 3 Branching approach for isopropanol production ............................................... 13
Figure 4 Matching approach ............................................................................................ 14
Figure 5 Matching approach for isopropanol production ................................................. 14
Figure 6 Pathways for isopropanol production ................................................................ 21
Figure 7 The superstructure of the synthesized pathways from prescreening step .......... 29
Figure 8 The final superstructure with a two-step maximum from the product............... 29
Figure 9 Two sections of the result from the superstructure ............................................ 31
Figure 10 A flowsheet of glycerol hydro-deoxygenation ................................................ 37
Figure 11 A flowsheet of indirect hydration process ....................................................... 44
Figure 12 A flowsheet of direct hydration process .......................................................... 51
Figure 13 A flowsheet of acetone hydrogenation process ............................................... 55
Figure 14 Sensitivity analysis for the annual ROI of hydro-deoxygenation from raw
glycerol (a) and from purified glycerol (b) ....................................................... 60
Figure 15 Sensitivity analysis for the annual ROI of indirect hydration (a) and direct
hydration (b) processes ..................................................................................... 61
Figure 16 Sensitivity analysis for the annual ROI of (a) propylene purchasing
scenario and (b) propylene manufacturing scenario ......................................... 64
x
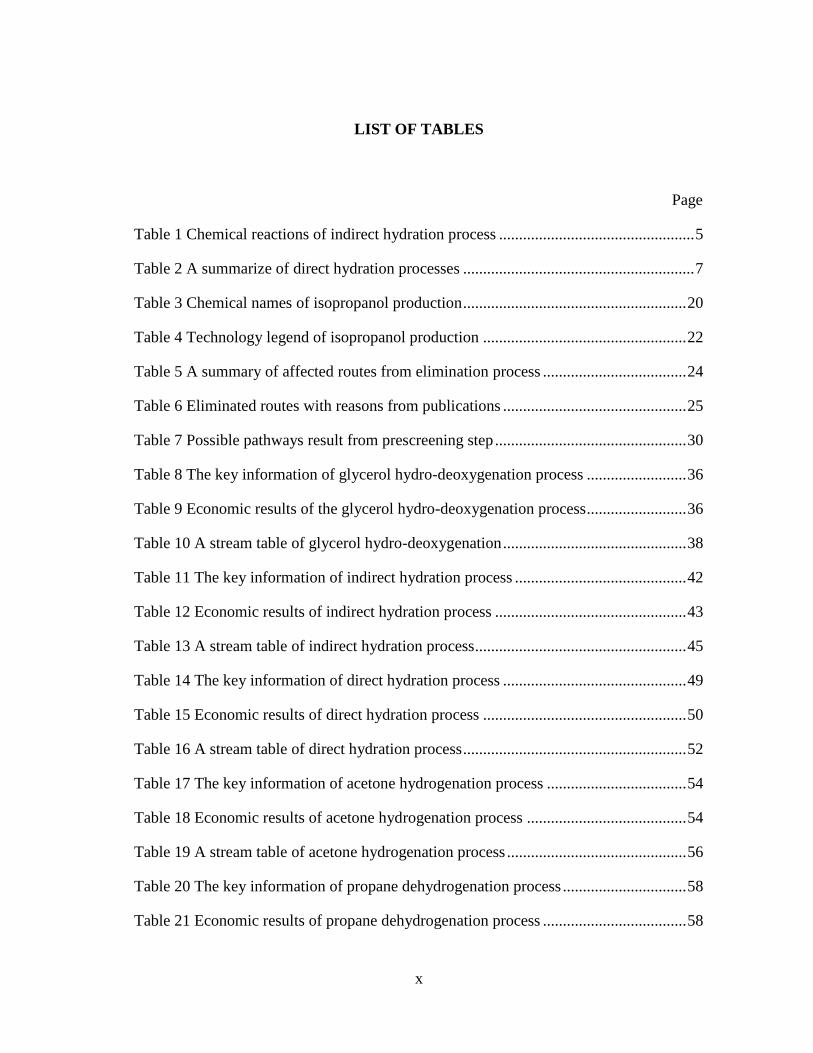
LIST OF TABLES
Page
Table 1 Chemical reactions of indirect hydration process ................................................. 5
Table 2 A summarize of direct hydration processes .......................................................... 7
Table 3 Chemical names of isopropanol production ........................................................ 20
Table 4 Technology legend of isopropanol production ................................................... 22
Table 5 A summary of affected routes from elimination process .................................... 24
Table 6 Eliminated routes with reasons from publications .............................................. 25
Table 7 Possible pathways result from prescreening step ................................................ 30
Table 8 The key information of glycerol hydro-deoxygenation process ......................... 36
Table 9 Economic results of the glycerol hydro-deoxygenation process ......................... 36
Table 10 A stream table of glycerol hydro-deoxygenation .............................................. 38
Table 11 The key information of indirect hydration process ........................................... 42
Table 12 Economic results of indirect hydration process ................................................ 43
Table 13 A stream table of indirect hydration process ..................................................... 45
Table 14 The key information of direct hydration process .............................................. 49
Table 15 Economic results of direct hydration process ................................................... 50
Table 16 A stream table of direct hydration process ........................................................ 52
Table 17 The key information of acetone hydrogenation process ................................... 54
Table 18 Economic results of acetone hydrogenation process ........................................ 54
Table 19 A stream table of acetone hydrogenation process ............................................. 56
Table 20 The key information of propane dehydrogenation process ............................... 58
Table 21 Economic results of propane dehydrogenation process .................................... 58
xi
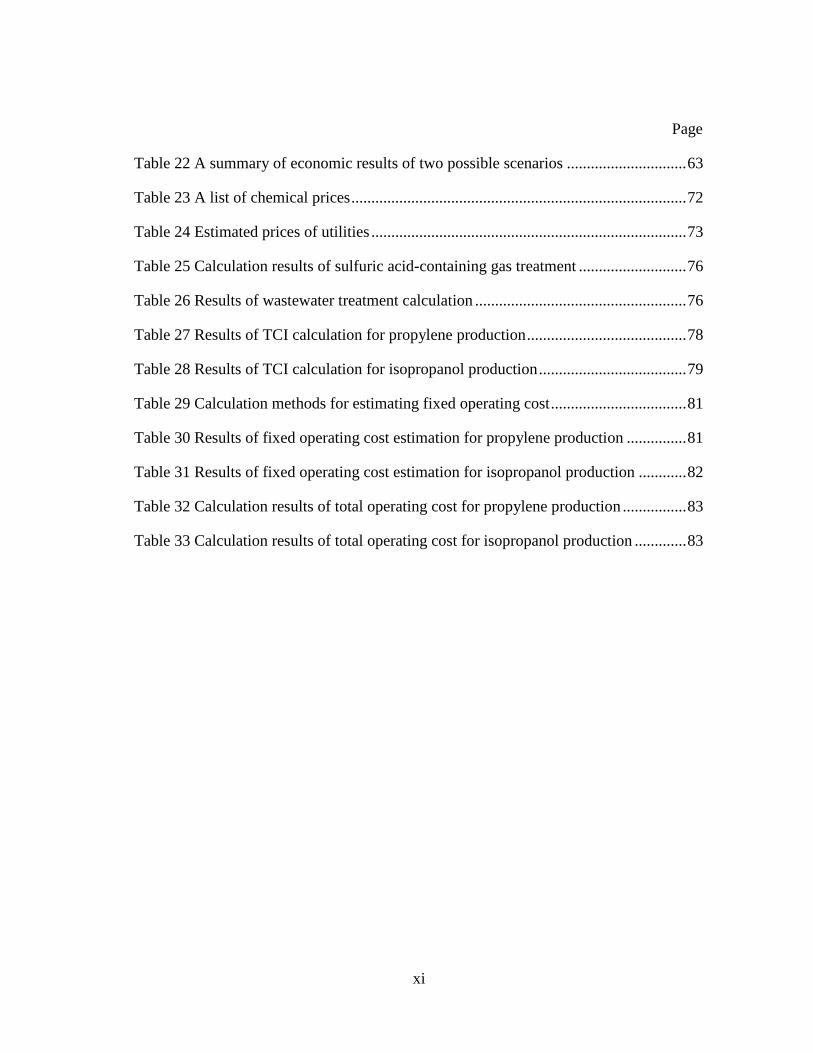
Page
Table 22 A summary of economic results of two possible scenarios .............................. 63
Table 23 A list of chemical prices .................................................................................... 72
Table 24 Estimated prices of utilities ............................................................................... 73
Table 25 Calculation results of sulfuric acid-containing gas treatment ........................... 76
Table 26 Results of wastewater treatment calculation ..................................................... 76
Table 27 Results of TCI calculation for propylene production ........................................ 78
Table 28 Results of TCI calculation for isopropanol production ..................................... 79
Table 29 Calculation methods for estimating fixed operating cost .................................. 81
Table 30 Results of fixed operating cost estimation for propylene production ............... 81
Table 31 Results of fixed operating cost estimation for isopropanol production ............ 82
Table 32 Calculation results of total operating cost for propylene production ................ 83
Table 33 Calculation results of total operating cost for isopropanol production ............. 83
1
1. INTRODUCTION
1.1 Overview
Crude oil and natural gas are significant fossil fuels and feedstocks for chemical
production. The price of oil and natural gas rely on its supply and demand, which depends
on the global business cycle and unexpected situations. According to a record in mid-2003
and mid-2008, the WTI (West Texas Intermediate) crude oil price went from $28/barrel
to $134/barrel because of demand mainly driven by Asian markets. However, the global
recession dropped the oil price down to $39/barrel in February 2009. Following this drop,
the price increased until July 2014 before falling again as a consequence of the unexpected
growth of U.S. shale gas[1]. It is clearly seen that oil price fluctuates and is difficult to
predict. The natural gas price has been inconsistent too.
Currently, the shale gas boom causes a great impact on the chemical industry. This
growth not only causes oil and natural gas prices to swing, but it also creates both
opportunities and challenges of value-added shale gas supply chain. Shale gas provides a
supply of natural gas and natural gas liquid, and the shale gas growth has consequently
caused the natural gas price to drop, affecting chemical price production costs. The U.S.
chemical industry benefited most from this trend as it changed its position in the market
from the world’s highest-cost producer in 2005 to lowest-cost producer in 2015[3].
Following this trend, it can be forecasted that manufacturing from shale gas will be
prosperous. While this is enticing, it must be recognized that shale gas is a nonrenewable
resource and the reliance on natural gas from shale gas as a feedstock will lead to shale
2
gas shortages, causing the price of shale gas to be higher and increase downstream
production cost.
Due to uncertainty and price fluctuations of chemicals including oil and natural
gas, society has started looking for alternative sources for chemical production that are
both economical and sustainable to be able to withstand highly fluctuating fossil fuel price
environment. Bio-based production is an interesting alternative option as it reduces carbon
emission and effect of global warming which is a major environmental concern. It is
expected that biomass-based routes will make a worthwhile impact on the chemical
production within 10-20 years[5].
Following through the shale gas revolution, a shift from naphtha cracking to ethane
cracking has occurred. As the amount of propylene from ethane cracking is less than
propylene from naphtha cracking, the propylene in the market is inadequate[6]. The
inadequacy of propylene in the market is confirmed by US Energy Information
Administration (EIA) weekly statistics which reports that the US propylene supply in 2016
has been reduced about 40-50% from 2015[7]. The shortages of propylene along with the
rapid growth in propylene-based products cause propylene price to be higher. Due to the
propylene supply and price trend, there is motivation to study numerous options to produce
propylene or propylene based-products.
1.2 Isopropanol
Isopropyl alcohol is a clear liquid which has an alcoholic odor. It is also called
isopropanol, 2-propanol, or propan-2-ol. It is miscible in water and ethyl alcohol. It
3
strongly reacts with oxidants. Isopropanol is a precursor of methyl isobutyl ketone
(MIBK), isopropylamines, and isopropyl ester[8].
Isopropanol is one of the most widely used solvents in the world. It is used in
various field including households, cosmetic and personal care products, pharmaceuticals,
veterinary, electronics, and automotive industry. Isopropanol is categorized into grades
based on its applications. For the industrial grade, it can be used as extraction solvents,
carrier solvents, detergents, surface coatings, paints and inks, pesticide formulations,
resins and household cleaners. For the cosmetic grade, it can be used as personal care
products, rubbing alcohol, and antiseptics. For the pharmaceutical grade, it can be used as
a solvent in drug/capsule manufacture, medical wipes, and medical formulation. For the
electronic grade, it can be used as drying agents and cleaner for printed circuit boards, flat
panel displays, and other electronic devices[9]. Isopropanol can also be applied as
antifreeze agents, coupling agents and polymerization modifiers[8]. Beyond these graded
applications and uses, isopropanol has other industrial applications too. For instance,
isopropanol can be used as a coolant in beer manufacture, and a motor oil from low-graded
isopropanol[8]. Additionally, it can be used in acetone production. However, according to
IHS Markit[10], isopropanol application as the production of acetone has decreased to less
than one percent in 2014. This is likely due to the growth of phenol production. Acetone
is a coproduct of phenol production so an increase in phenol simultaneously presents an
increase in acetone.
4
1.3 Isopropanol manufacture
There are three commercial routes to produce isopropanol. These routes are
indirect hydration of refinery-grade propylene, direct hydration of chemical-grade
propylene, and hydrogenation of acetone.
1.3.1 Indirect hydration
Indirect hydration is a two-step reaction process converting propylene to
isopropanol. The reactions are esterification and hydrolysis. The indirect hydration
process, also called a sulfuric acid process, uses sulfuric acid as a solvent. This method is
known as the first commercial process of isopropanol production. Its conversion is very
high (conversion=93%), and its selectivity to isopropanol and its main byproduct
(diisopropyl ether, DIPE) is above 98%[12]. Stoichiometric equations of this process are
provided in Table 1.
5
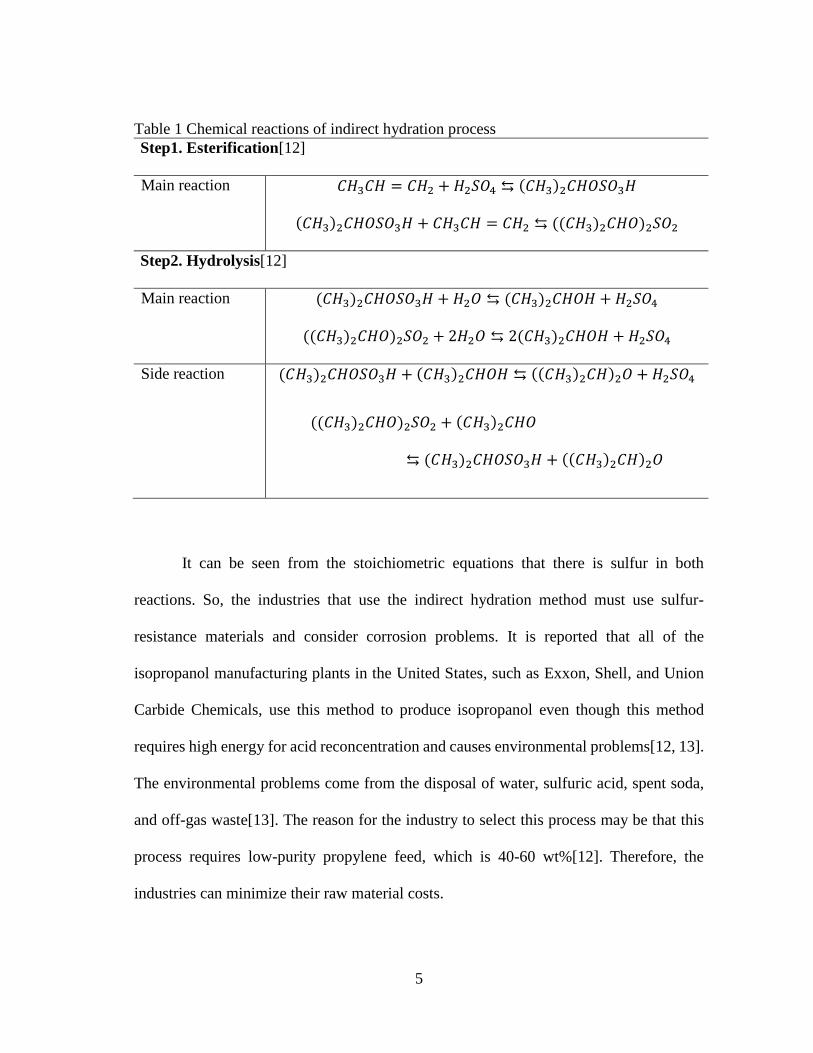
Table 1 Chemical reactions of indirect hydration process
Step1. Esterification[12]
Main reaction 𝐶𝐻3𝐶𝐻 = 𝐶𝐻2 + 𝐻2𝑆𝑂4 ⇆ (𝐶𝐻3)2𝐶𝐻𝑂𝑆𝑂3𝐻
(𝐶𝐻3)2𝐶𝐻𝑂𝑆𝑂3𝐻 + 𝐶𝐻3𝐶𝐻 = 𝐶𝐻2 ⇆ ((𝐶𝐻3)2𝐶𝐻𝑂)2𝑆𝑂2
Step2. Hydrolysis[12]
Main reaction (𝐶𝐻3)2𝐶𝐻𝑂𝑆𝑂3𝐻 + 𝐻2𝑂 ⇆ (𝐶𝐻3)2𝐶𝐻𝑂𝐻 + 𝐻2𝑆𝑂4
((𝐶𝐻3)2𝐶𝐻𝑂)2𝑆𝑂2 + 2𝐻2𝑂 ⇆ 2(𝐶𝐻3)2𝐶𝐻𝑂𝐻 + 𝐻2𝑆𝑂4
Side reaction (𝐶𝐻3)2𝐶𝐻𝑂𝑆𝑂3𝐻 + (𝐶𝐻3)2𝐶𝐻𝑂𝐻 ⇆ ((𝐶𝐻3)2𝐶𝐻)2𝑂 + 𝐻2𝑆𝑂4
((𝐶𝐻3)2𝐶𝐻𝑂)2𝑆𝑂2 + (𝐶𝐻3)2𝐶𝐻𝑂
⇆ (𝐶𝐻3)2𝐶𝐻𝑂𝑆𝑂3𝐻 + ((𝐶𝐻3)2𝐶𝐻)2𝑂
It can be seen from the stoichiometric equations that there is sulfur in both
reactions. So, the industries that use the indirect hydration method must use sulfur-
resistance materials and consider corrosion problems. It is reported that all of the
isopropanol manufacturing plants in the United States, such as Exxon, Shell, and Union
Carbide Chemicals, use this method to produce isopropanol even though this method
requires high energy for acid reconcentration and causes environmental problems[12, 13].
The environmental problems come from the disposal of water, sulfuric acid, spent soda,
and off-gas waste[13]. The reason for the industry to select this process may be that this
process requires low-purity propylene feed, which is 40-60 wt%[12]. Therefore, the
industries can minimize their raw material costs.
6
The indirect hydration process can be divided into two sub-processes according to
a sulfuric acid concentration used in the process. The process with a high sulfuric acid
concentration (more than 80 wt%) is called a strong acid process. This process operates at
low temperature and pressure (T = 293-303 K, P = 10-12 bar) and requires stainless steel
as the material of construction to avoid corrosion problems from a high concentration of
sulfuric acid. Another process is a weak acid process or a process with a low sulfuric acid
concentration (60-80 wt%). This process occurs at higher temperature (T = 333-338 K).
The weak acid process can minimize the cost of reconcentration and corrosion problems
as it requires lower sulfuric concentration[12].
1.3.2 Direct hydration
Direct hydration process is a process converting propylene to isopropanol via a
single-step reaction, propylene hydration. It is a general process that is used in Europe and
Japan[14]. This method is different from the indirect hydration process as this process
operates at high temperature and high pressure in order to improve the effectiveness of the
reaction. Although this process deals with a high-pressure condition, it has some
significant advantages over the indirect hydration process. The direct hydration process
uses water as a solvent instead of a sulfuric acid. Therefore, it does not have corrosion and
environmental problems from an acid solution. However, the main hindrance of this
method is that the process requires high-purity feed (at least 90 wt% propylene)[12]. The
stoichiometric equation of the propylene hydration process is provided below.
𝐶𝐻3𝐶𝐻 = 𝐶𝐻2 + 𝐻2𝑂 ⇆ (𝐶𝐻3)2𝐶𝐻𝑂𝐻
7
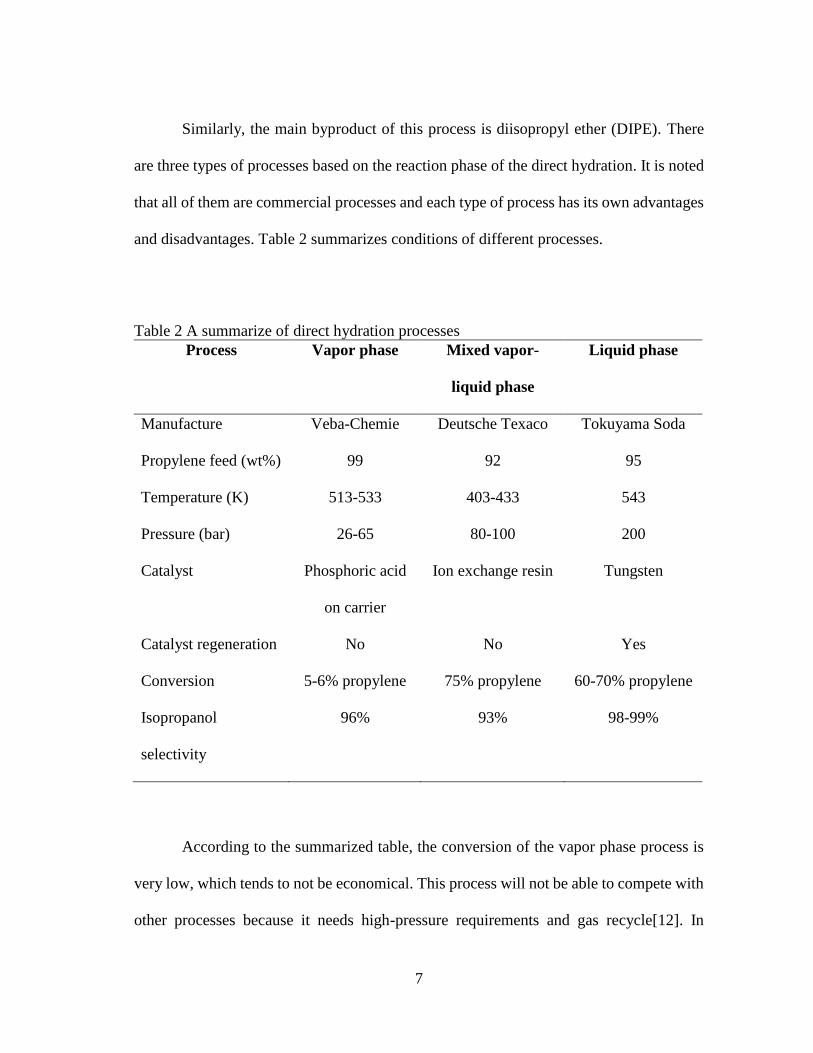
Similarly, the main byproduct of this process is diisopropyl ether (DIPE). There
are three types of processes based on the reaction phase of the direct hydration. It is noted
that all of them are commercial processes and each type of process has its own advantages
and disadvantages. Table 2 summarizes conditions of different processes.
Table 2 A summarize of direct hydration processes
Process Vapor phase Mixed vapor-
liquid phase
Liquid phase
Manufacture Veba-Chemie Deutsche Texaco Tokuyama Soda
Propylene feed (wt%) 99 92 95
Temperature (K) 513-533 403-433 543
Pressure (bar) 26-65 80-100 200
Catalyst Phosphoric acid
on carrier
Ion exchange resin Tungsten
Catalyst regeneration No No Yes
Conversion 5-6% propylene 75% propylene 60-70% propylene
Isopropanol
selectivity
96% 93% 98-99%
According to the summarized table, the conversion of the vapor phase process is
very low, which tends to not be economical. This process will not be able to compete with
other processes because it needs high-pressure requirements and gas recycle[12]. In
8
addition, it is reported that the catalyst lifetime in the mixed vapor-liquid phase process is
short[12]. Therefore, the process in the mixed vapor-liquid phase will lose benefits to the
liquid phase process. In the final conclusion, the liquid phase process is the most
interesting process for producing isopropanol by the direct hydration method.
1.3.3 Acetone hydrogenation
Acetone hydrogenation process is the most recent technology of isopropanol
production. The reaction can be done by mixing acetone and hydrogen in the presence of
a fixed catalyst bed. An example of an appropriate catalyst for the acetone hydrogenation
is Rayney catalyst. The conversion and selectivity of this process are extremely high.
While the conversion is 99.9%, the selectivity equals 99.99%[13]. Even though the
acetone does not need to be pure, the reaction is preferable when the water content in the
acetone feed is between 1.2-4 wt% based on solution of water and acetone. It is reported
that adding water in the feed can improve the yield of isopropanol. However, it increases
the amount of byproduct in the process so that a large amount of energy is required for the
additional separation process to purify isopropanol. Balancing its benefits and drawbacks,
extra water in the feed will lead to an adverse economic condition[15].
1.3.4 Other processes
Beyond these conventional routes, there are many ways to produce isopropanol
from different chemicals. The examples include oxidation of propane, transesterification
of isopropyl acetate, and fermentation. As there are many pathways other than the
9
conventional methods, it is important to investigate other possible routes for an advantage
of feedstock availability.
1.4 Isopropanol market
The global isopropanol market has been growing over the past few years. Its
compound annual growth rate (CAGR) is approximately seven percent with global
demand growth of two percent[10, 16]. The reason for the moderate demand growth is
because of the environmental regulations on volatile organic compounds in Europe and
North America. However, the market growth rate is expected to be greater in the future
owing to the potential of the pharmaceutical market in Asia-Pacific region, especially in
China and India. It is important to note that the demand for isopropanol Asia-Pacific
accounts for 39.6% of the isopropanol global demand and it is expected to rise[16].
Despite the increasing demand, the price is decreasing. The market price of isopropanol is
approximately $0.6/lb in 2015 but dropped to $0.34-0.36/lb in 2016. According to the
ICIS, the isopropanol price in 2016 is the lowest price during past seven years due to the
low price of the propylene feedstock[17]. However, the price is expected to rise because
of predicted demand.
Experts believe that expansion of pharmaceutical and household industry will push
the potential of the isopropanol market up. The global pharmaceutical growth is estimated
to be over five percent from 2013 to 2018, signaling for the growth of the isopropanol
market[18]. An improvement in motor oils and automotive industry can also raise
isopropanol demand[8].
10
2. PROBLEM STATEMENT
The price of propylene is expected to increase as a result of shale gas revolution.
Therefore, it is imperative to find alternative pathways to produce propylene derivatives
for a long-term, cost-effective, and sustainable production. One of the most attractive
chemicals from propylene is isopropanol because of its high demand growth and wide
applications. The objective of this research is to determine alternative pathways for
isopropanol production, select the possible routes using MISR as an economic indicator,
and select the most sustainable pathway through a techno-economic analysis.
In this research, it is specified that a superstructure covers all possible pathways,
including experimental processes. The number of synthesis per route is limited to a two-
step maximum from the product. In addition, for an economic analysis, a 30% tax rate and
a ten-year linear depreciation are assumed to calculate the return on investment (ROI). It
is noted that the catalyst cost was not included in the cost calculation.
This research will allow industry to have more choices when they want to produce
isopropanol in complex situations and can choose the pathway corresponding to their
feedstock availability. Furthermore, it provides the most economical way to produce
isopropanol, which will be beneficial to chemical industries who want to start or improve
the production in the future.
11
3. METHODOLOGY
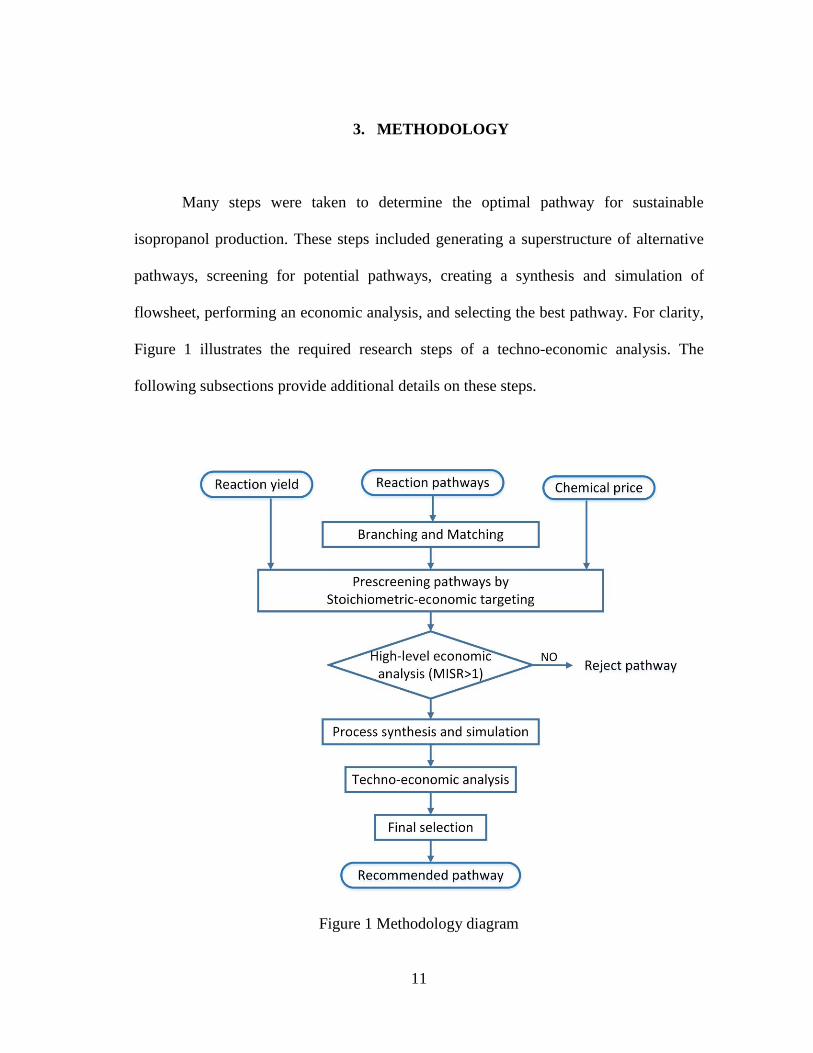
Many steps were taken to determine the optimal pathway for sustainable
isopropanol production. These steps included generating a superstructure of alternative
pathways, screening for potential pathways, creating a synthesis and simulation of
flowsheet, performing an economic analysis, and selecting the best pathway. For clarity,
Figure 1 illustrates the required research steps of a techno-economic analysis. The
following subsections provide additional details on these steps.
Figure 1 Methodology diagram
12
3.1 Generating a superstructure of alternatives
According to the steps in the methodology, the first step was creating a
superstructure of alternative ways to produce isopropanol. The superstructure was
constructed based on a branching, matching and interception approach.
3.1.1 Branching
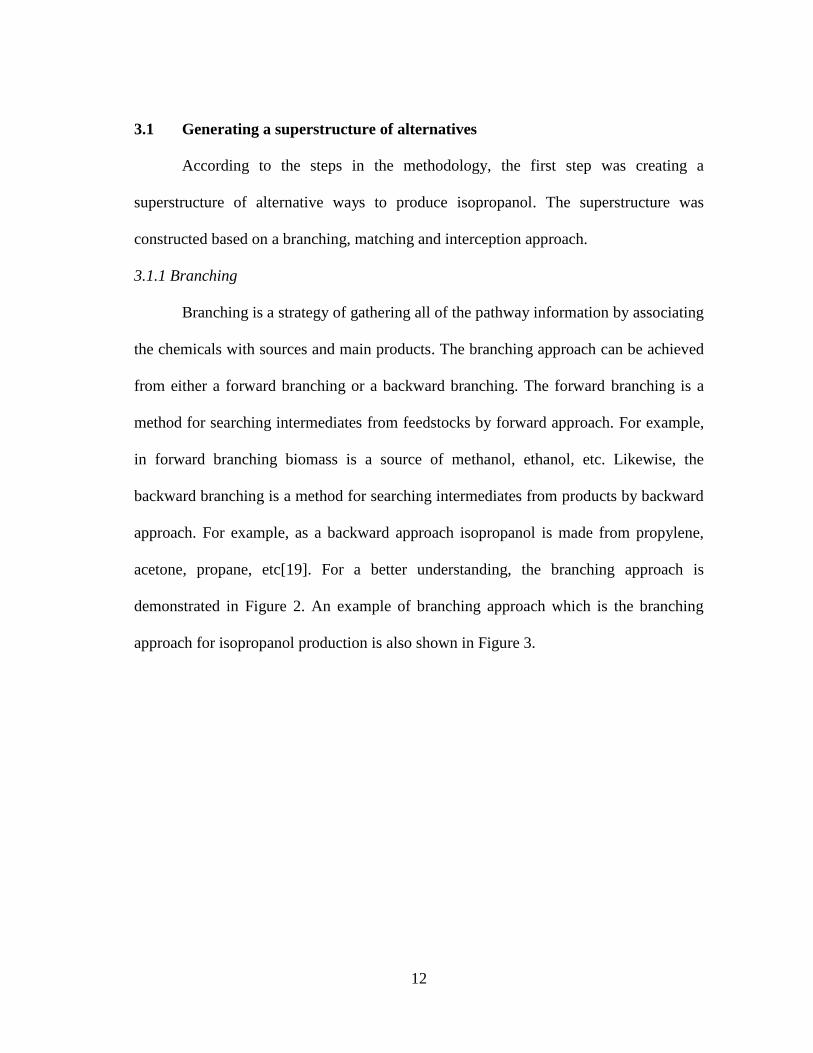
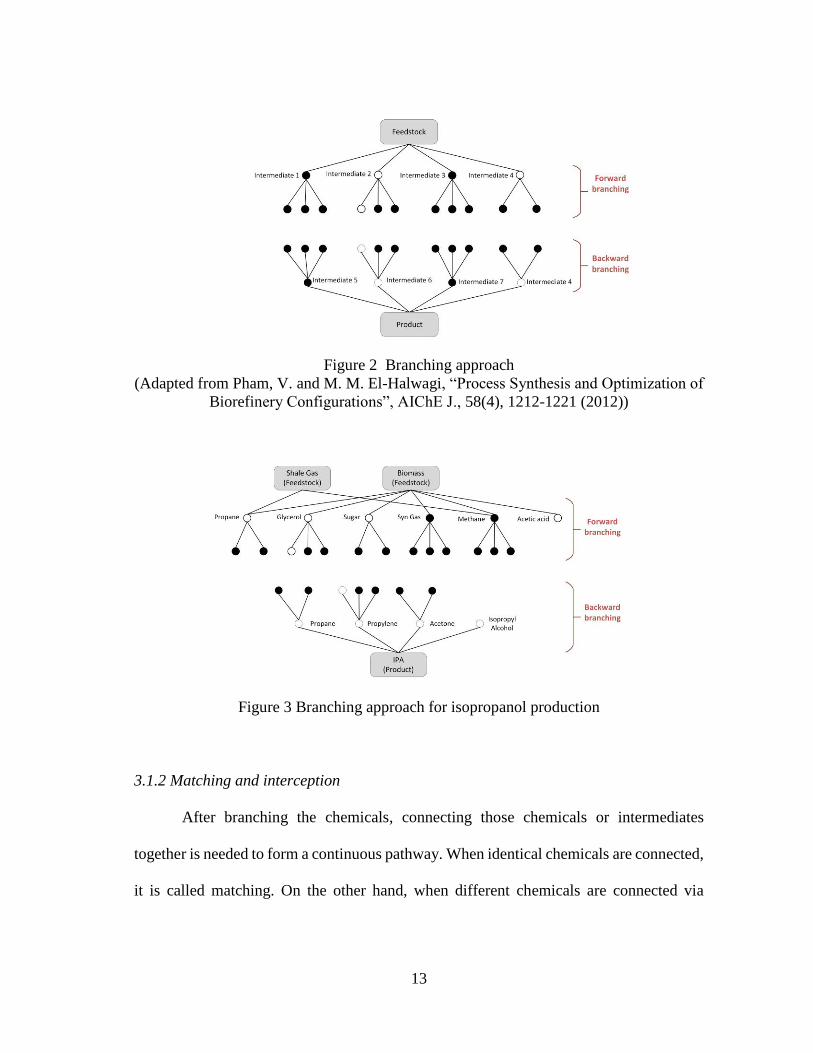
Branching is a strategy of gathering all of the pathway information by associating
the chemicals with sources and main products. The branching approach can be achieved
from either a forward branching or a backward branching. The forward branching is a
method for searching intermediates from feedstocks by forward approach. For example,
in forward branching biomass is a source of methanol, ethanol, etc. Likewise, the
backward branching is a method for searching intermediates from products by backward
approach. For example, as a backward approach isopropanol is made from propylene,
acetone, propane, etc[19]. For a better understanding, the branching approach is
demonstrated in Figure 2. An example of branching approach which is the branching
approach for isopropanol production is also shown in Figure 3.
13
Figure 2 Branching approach
(Adapted from Pham, V. and M. M. El-Halwagi, “Process Synthesis and Optimization of
Biorefinery Configurations”, AIChE J., 58(4), 1212-1221 (2012))
Figure 3 Branching approach for isopropanol production
3.1.2 Matching and interception
After branching the chemicals, connecting those chemicals or intermediates
together is needed to form a continuous pathway. When identical chemicals are connected,
it is called matching. On the other hand, when different chemicals are connected via
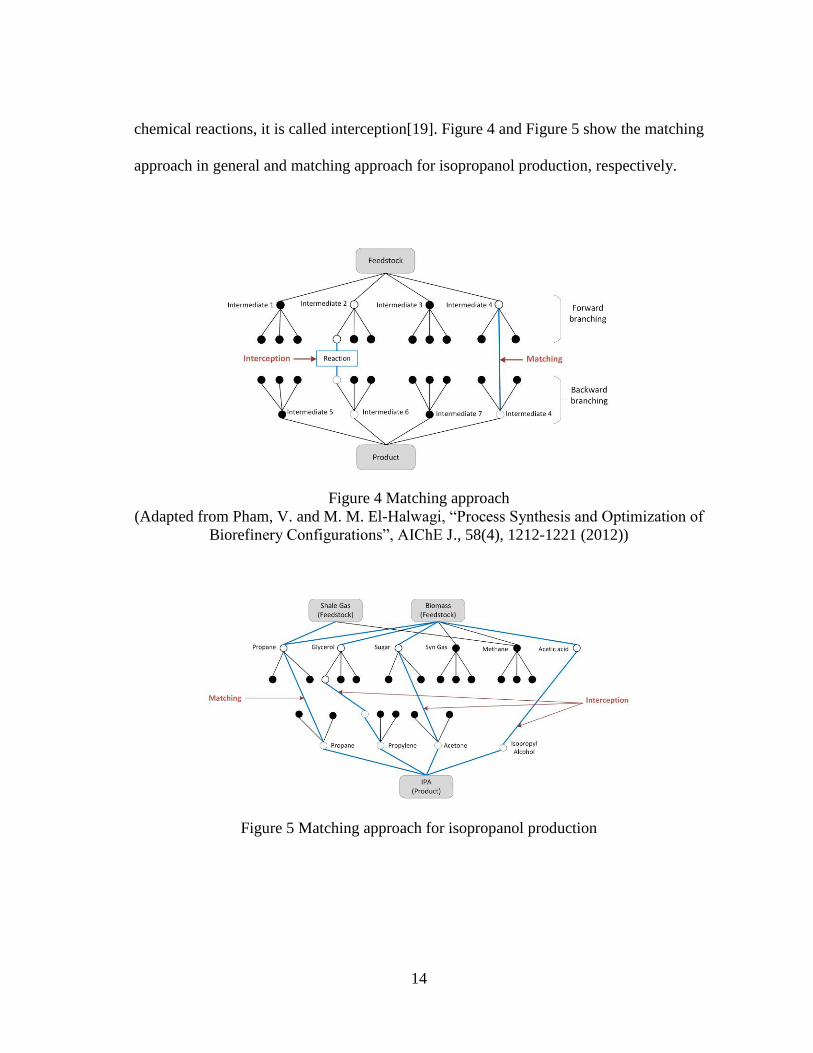
14
chemical reactions, it is called interception[19]. Figure 4 and Figure 5 show the matching
approach in general and matching approach for isopropanol production, respectively.
Figure 4 Matching approach
(Adapted from Pham, V. and M. M. El-Halwagi, “Process Synthesis and Optimization of
Biorefinery Configurations”, AIChE J., 58(4), 1212-1221 (2012))
Figure 5 Matching approach for isopropanol production
15
3.2 Prescreening pathways
After getting the superstructure of alternatives for isopropanol production, the next
step was screening the potential pathways in order to provide benchmarks for economic
analysis. Metric for Inspecting Sales and Reactants (MISR), an indicator of
‘Stoichiometric-Economic Targeting’ (Stoichio-nomic) method, was used for the
preliminary screening in this research.
MISR is defined as [19]:
𝑀𝐼𝑆𝑅 =∑ 𝐹𝑝 × 𝑆𝑝
𝑁𝑝𝑟𝑜𝑑𝑢𝑐𝑡𝑠
𝑝=1
∑ 𝐹𝑟 × 𝐶𝑟 𝑁𝑟𝑒𝑎𝑐𝑡𝑎𝑛𝑡𝑠𝑟=1
Where 𝐹𝑝 is the annual production rate of product 𝑝, 𝑆𝑝 is the selling price of product 𝑝,
𝐹𝑟 is the annual feed rate of reactant 𝑟 and 𝐶𝑟 is the purchase cost of reactant 𝑟.
The chemical prices for MISR calculation are listed in Appendix A. This pricing data was
obtained from ICIS Chemical Business and https://www.icis.com/chemicals/channel-
info-chemicals-a-z/.
A pathway that should be deliberated for detailed analysis is a pathway that has a
minimum MISR value of 1. It should be noted that a pathway that has value of MISR
slightly more than 1 should not be considered as this MISR value does not include
additional process costs such as reaction conversion losses, fixed cost, and operating cost
of the processes.
Besides the Stoichio-nomic method, additional information of reactions from
publications was considered in order to improve the screening performance. Unpromising
pathways included the routes with low-yield reactions and the routes with low-conversion
16
reactions. This research also excluded routes that had the interested chemical as a
coproduct or byproduct of the reaction because the interested chemical productivity would
be insufficient to reach market demand. Furthermore, publications that compared different
methods for converting the same feed to the same product were also applicable to this
research. The most efficient method was selected as the best pathway in the final
superstructure.
In case where more than one pathway that had the same feed and same product,
but had different number of routes, a pathway that contained the least number of routes
was selected.
3.3 Synthesis and simulation of flowsheet
Simulation flowsheets were created based on the results from prescreening step.
The program selected for process simulation was Aspen Plus. Some important information
was needed to be examined to run the simulation such as reaction conversion, product
specification, and operating condition. It is noted that this research simulated only base-
case scenario, and the existing processes in the publications were not simulated.
17
3.4 Techno-Economic analysis
Following the simulation part, an economic analysis was performed to evaluate
feasible pathways. The analysis was carried out by hand-calculation and Activated
Economics in Aspen Plus, which accounted for capital investment and operating cost in
its calculation. The return on investment (ROI) was used to evaluate the efficiency of an
investment on each process.
A total capital investment (TCI) is a cost associated with starting up a chemical
plant, which is a combination of a fixed capital investment (FCI) and a working capital
investment (WCI). The fixed capital investment in this research included equipment costs,
installation expenses, engineering costs, and contingency charges. The FCI in the cost
estimation is equal to five times of a total purchased equipment cost according to
Sustainable design through process integration[19]. A working capital investment is the
amount of money needed to pay for an unexpected plan or stock-pilling raw materials
before production. The working capital is usually equal to 10-25% of TCI, depending on
a project’s size[20]. This research estimated the working capital to be 15% of TCI.
An operating cost is an expense associated with production. Total operating cost
can be broken down into two categories: a fixed operating cost and a variable operating
cost. A fixed operating cost is an operating expense that is independent of the production
line. The fixed operating cost in this research included salaries and wages, maintenance
costs, property taxes and insurances, plant overheads. Additionally, a variable operating
cost is an operating expense that depends on the production line. In this research, the
variable operating cost included raw materials costs, utilities costs, and waste disposal
18
costs[20]. It should be noted that the catalyst cost was not included in this economic
analysis.
Even though it is called techno-economic analysis, environmental and safety
concerns were not neglected. This research also considered laws and regulations from The
United States organizations such as Environmental Protection Agency (EPA),
Occupational Safety and Health Administration (OSHA). It is significant to note that the
industries must not trespass those regulations to avoid any negative circumstances. The
costs of air control and wastewater treatment were taken into account for process cost
evaluation. These treatment costs were added to the fixed capital or operating cost,
depending on treatment cases. For example, a wastewater treatment cost was included in
the operating cost, a pollution control equipment cost was included in the fixed capital
investment. In this research, the treatment methods and their cost estimations were
obtained from EPA Air Pollution Control Cost Manual[21].
An economic comparison of alternative pathways was performed using a return on
investment (ROI) as a profitability criteria. ROI is a simple tool to determine a project
profitability without considering interest or the time-value of money.
Rate on investment is defined as[19]:
𝑅𝑂𝐼 =𝐴𝑛𝑛𝑢𝑎𝑙 𝑛𝑒𝑡 (𝐴𝑓𝑡𝑒𝑟 − 𝑡𝑎𝑥) 𝑝𝑟𝑜𝑓𝑖𝑡
𝑇𝐶𝐼× 100%
Where 𝐴𝑛𝑛𝑢𝑎𝑙 𝑛𝑒𝑡(𝐴𝑓𝑡𝑒𝑟 − 𝑡𝑎𝑥) 𝑝𝑟𝑜𝑓𝑖𝑡 =
(𝐴𝑛𝑛𝑢𝑎𝑙 𝑖𝑛𝑐𝑜𝑚𝑒 − 𝐴𝑛𝑛𝑢𝑎𝑙 𝑜𝑝𝑒𝑟𝑎𝑡𝑖𝑛𝑔 𝑐𝑜𝑠𝑡 − 𝐷𝑒𝑝𝑟𝑒𝑐𝑖𝑎𝑡𝑖𝑜𝑛) ∗ (1 − 𝑇𝑎𝑥 𝑟𝑎𝑡𝑒)
+ 𝐷𝑒𝑝𝑟𝑒𝑐𝑖𝑎𝑡𝑖𝑜𝑛
In this calculation, a 30% tax rate and a ten-year linear depreciation were assumed.
19
3.5 Final selection
The process with the highest value of ROI was the most attractive pathway.
However, it should be noted that the margin of error in this calculation was about 10-20%.
So, if the difference of ROI values of processes was in the range of error, a sensitivity
analysis of the processes was perform to assess the impact of feedstock price on the ROI
of processes. The process with a low impact of the feedstock price was selected as the
most promising pathway.
20
4. RESULTS AND DISCUSSIONS
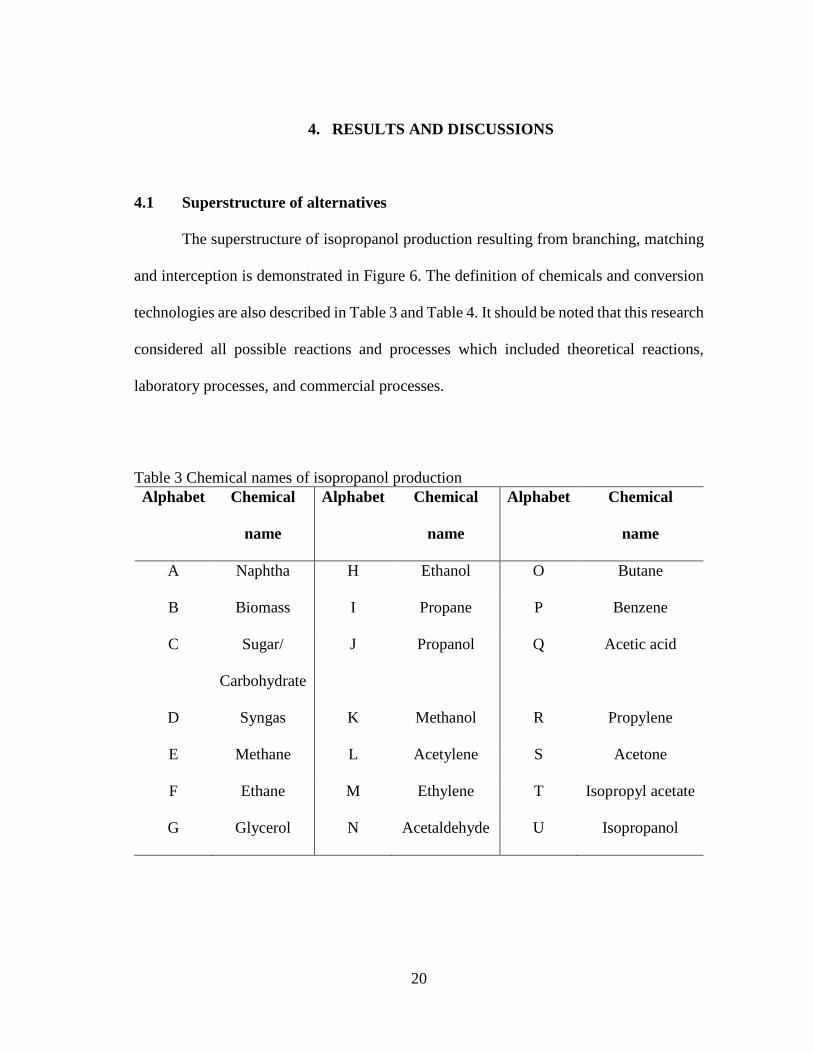
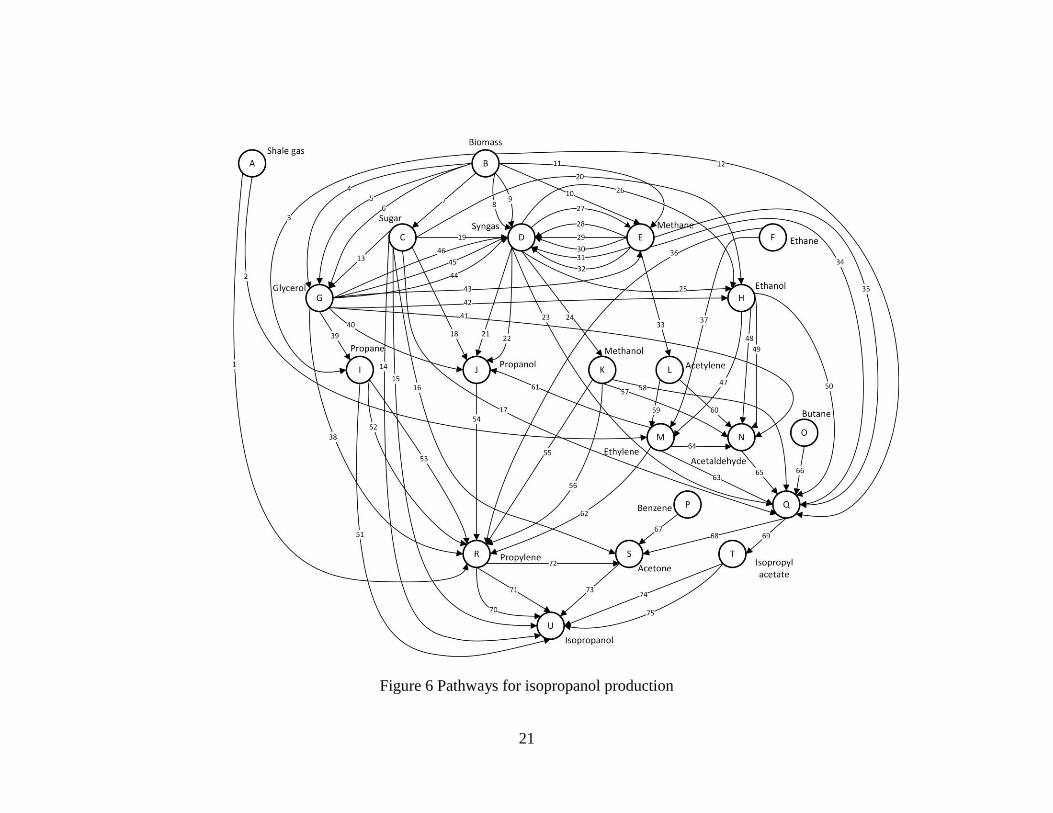
4.1 Superstructure of alternatives
The superstructure of isopropanol production resulting from branching, matching
and interception is demonstrated in Figure 6. The definition of chemicals and conversion
technologies are also described in Table 3 and Table 4. It should be noted that this research
considered all possible reactions and processes which included theoretical reactions,
laboratory processes, and commercial processes.
Table 3 Chemical names of isopropanol production
Alphabet Chemical
name
Alphabet Chemical
name
Alphabet Chemical
name
A Naphtha H Ethanol O Butane
B Biomass I Propane P Benzene
C Sugar/
Carbohydrate
J Propanol Q Acetic acid
D Syngas K Methanol R Propylene
E Methane L Acetylene S Acetone
F Ethane M Ethylene T Isopropyl acetate
G Glycerol N Acetaldehyde U Isopropanol
21
Figure 6 Pathways for isopropanol production
22
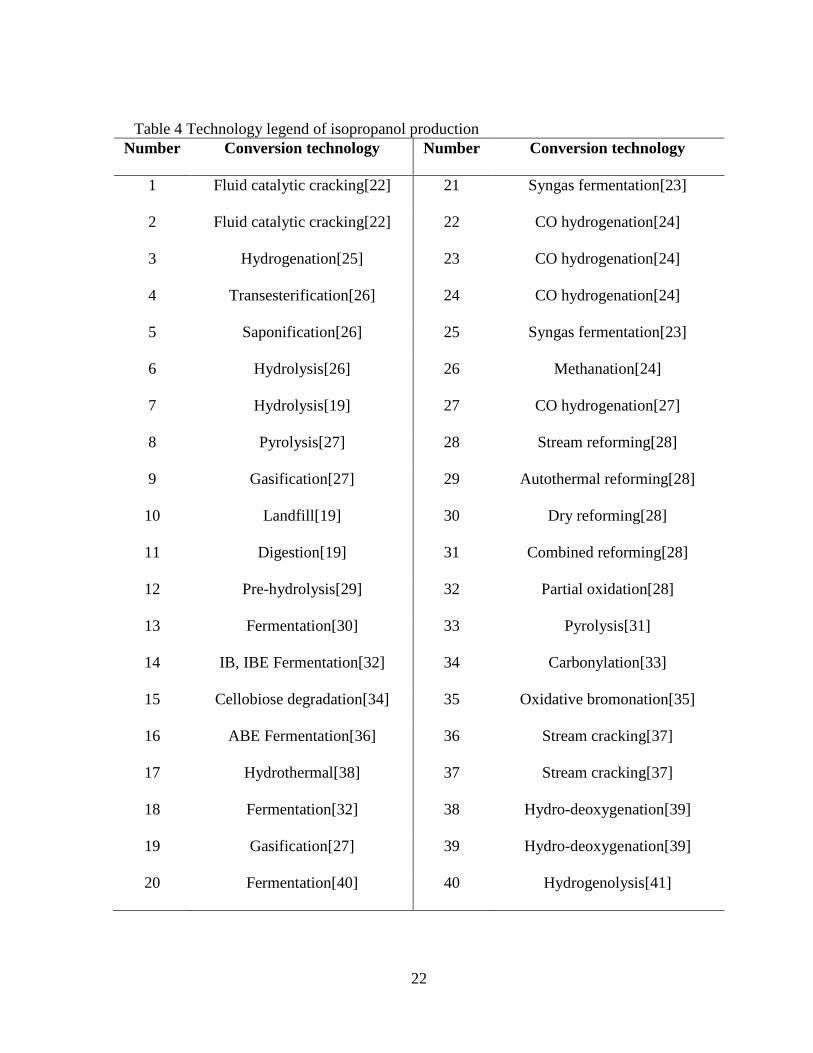
Table 4 Technology legend of isopropanol production
Number Conversion technology Number Conversion technology
1 Fluid catalytic cracking[22] 21 Syngas fermentation[23]
2 Fluid catalytic cracking[22] 22 CO hydrogenation[24]
3 Hydrogenation[25] 23 CO hydrogenation[24]
4 Transesterification[26] 24 CO hydrogenation[24]
5 Saponification[26] 25 Syngas fermentation[23]
6 Hydrolysis[26] 26 Methanation[24]
7 Hydrolysis[19] 27 CO hydrogenation[27]
8 Pyrolysis[27] 28 Stream reforming[28]
9 Gasification[27] 29 Autothermal reforming[28]
10 Landfill[19] 30 Dry reforming[28]
11 Digestion[19] 31 Combined reforming[28]
12 Pre-hydrolysis[29] 32 Partial oxidation[28]
13 Fermentation[30] 33 Pyrolysis[31]
14 IB, IBE Fermentation[32] 34 Carbonylation[33]
15 Cellobiose degradation[34] 35 Oxidative bromonation[35]
16 ABE Fermentation[36] 36 Stream cracking[37]
17 Hydrothermal[38] 37 Stream cracking[37]
18 Fermentation[32] 38 Hydro-deoxygenation[39]
19 Gasification[27] 39 Hydro-deoxygenation[39]
20 Fermentation[40] 40 Hydrogenolysis[41]
23
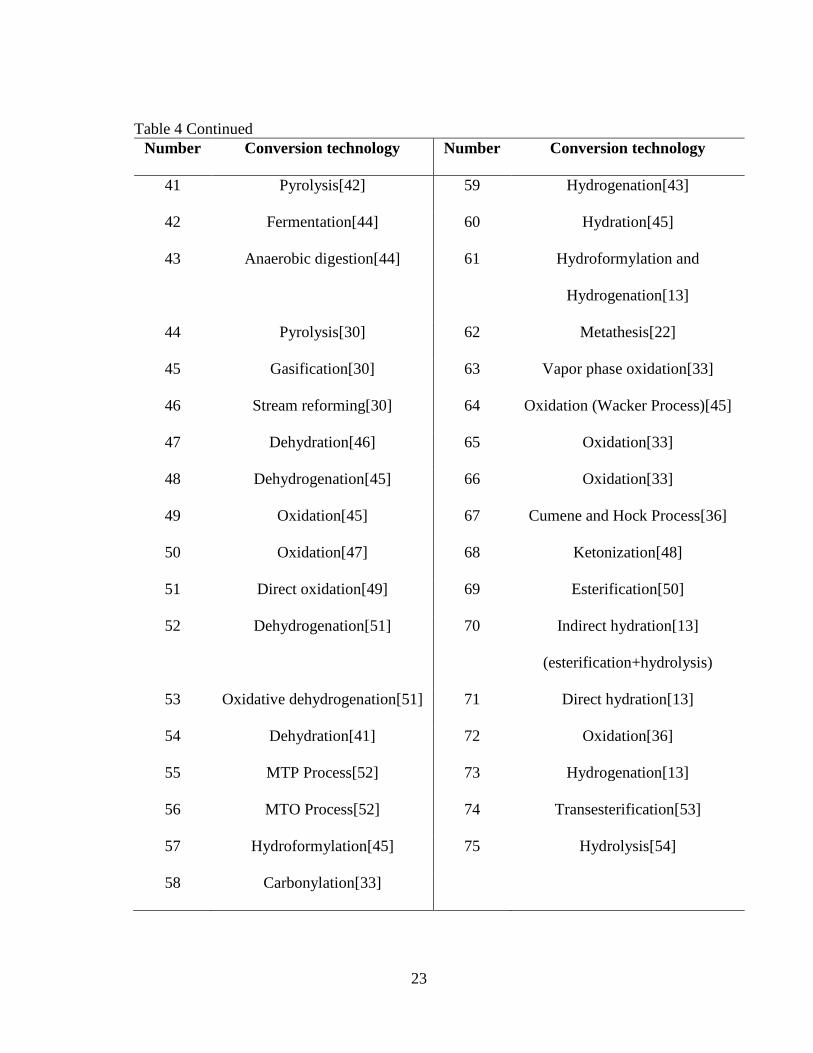
Table 4 Continued
Number Conversion technology Number Conversion technology
41 Pyrolysis[42] 59 Hydrogenation[43]
42 Fermentation[44] 60 Hydration[45]
43 Anaerobic digestion[44] 61 Hydroformylation and
Hydrogenation[13]
44 Pyrolysis[30] 62 Metathesis[22]
45 Gasification[30] 63 Vapor phase oxidation[33]
46 Stream reforming[30] 64 Oxidation (Wacker Process)[45]
47 Dehydration[46] 65 Oxidation[33]
48 Dehydrogenation[45] 66 Oxidation[33]
49 Oxidation[45] 67 Cumene and Hock Process[36]
50 Oxidation[47] 68 Ketonization[48]
51 Direct oxidation[49] 69 Esterification[50]
52 Dehydrogenation[51] 70 Indirect hydration[13]
(esterification+hydrolysis)
53 Oxidative dehydrogenation[51] 71 Direct hydration[13]
54 Dehydration[41] 72 Oxidation[36]
55 MTP Process[52] 73 Hydrogenation[13]
56 MTO Process[52] 74 Transesterification[53]
57 Hydroformylation[45] 75 Hydrolysis[54]
58 Carbonylation[33]
24
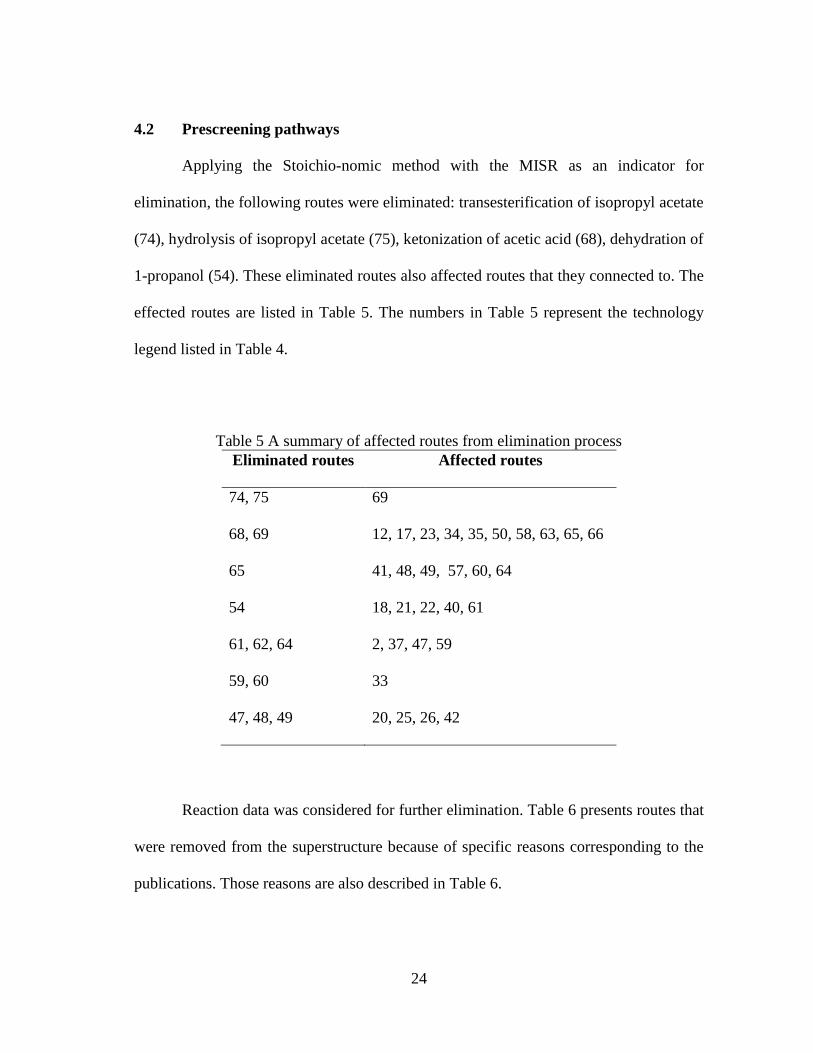
4.2 Prescreening pathways
Applying the Stoichio-nomic method with the MISR as an indicator for
elimination, the following routes were eliminated: transesterification of isopropyl acetate
(74), hydrolysis of isopropyl acetate (75), ketonization of acetic acid (68), dehydration of
1-propanol (54). These eliminated routes also affected routes that they connected to. The
effected routes are listed in Table 5. The numbers in Table 5 represent the technology
legend listed in Table 4.
Table 5 A summary of affected routes from elimination process
Eliminated routes Affected routes
74, 75 69
68, 69 12, 17, 23, 34, 35, 50, 58, 63, 65, 66
65 41, 48, 49, 57, 60, 64
54 18, 21, 22, 40, 61
61, 62, 64 2, 37, 47, 59
59, 60 33
47, 48, 49 20, 25, 26, 42
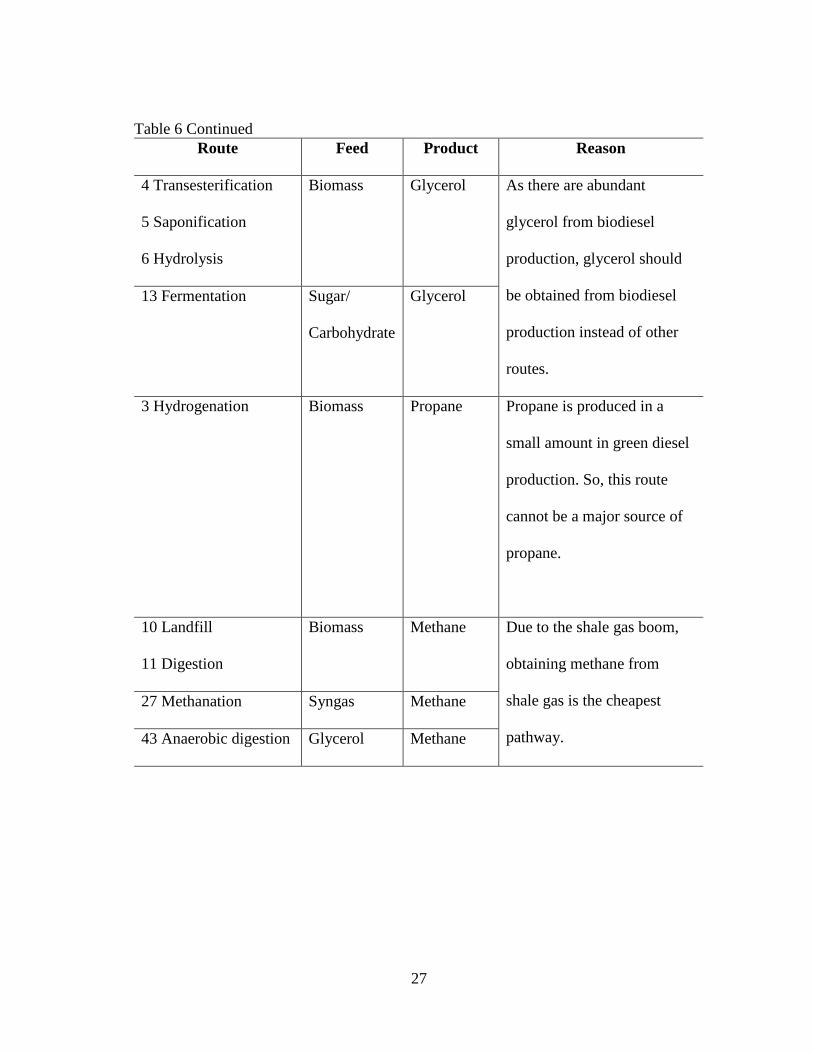
Reaction data was considered for further elimination. Table 6 presents routes that
were removed from the superstructure because of specific reasons corresponding to the
publications. Those reasons are also described in Table 6.
25
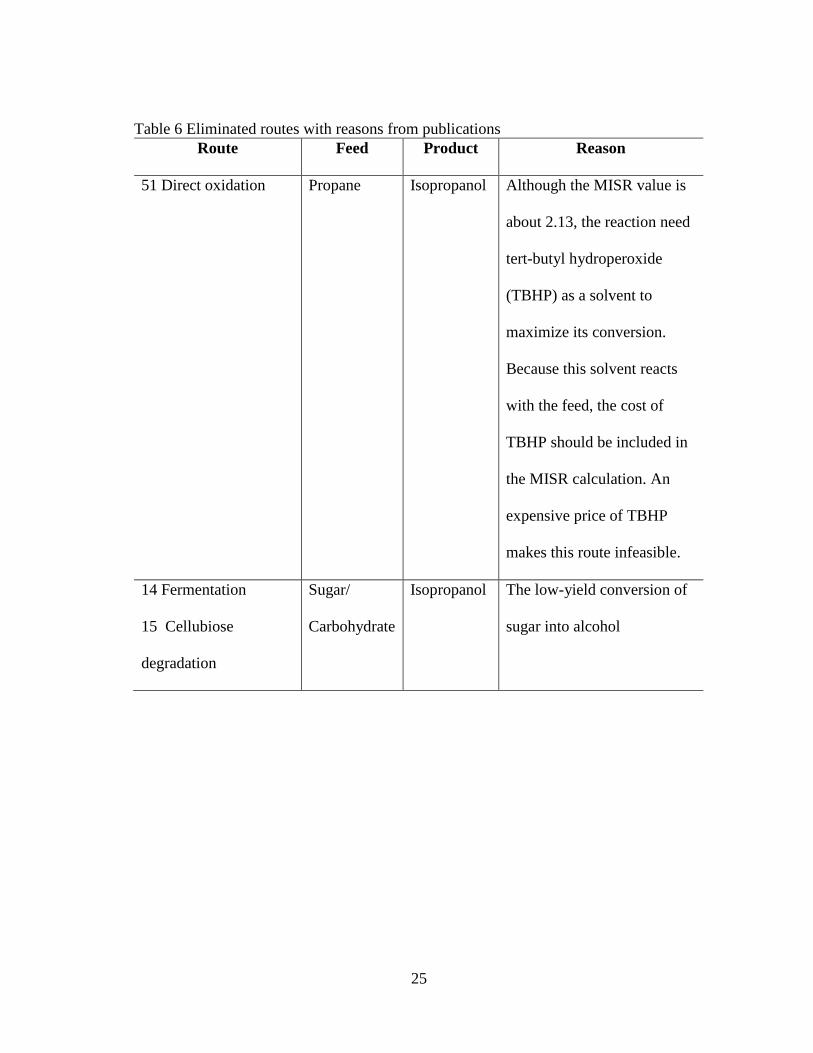
Table 6 Eliminated routes with reasons from publications
Route Feed Product Reason
51 Direct oxidation Propane Isopropanol Although the MISR value is
about 2.13, the reaction need
tert-butyl hydroperoxide
(TBHP) as a solvent to
maximize its conversion.
Because this solvent reacts
with the feed, the cost of
TBHP should be included in
the MISR calculation. An
expensive price of TBHP
makes this route infeasible.
14 Fermentation
15 Cellubiose
degradation
Sugar/
Carbohydrate
Isopropanol The low-yield conversion of
sugar into alcohol
26
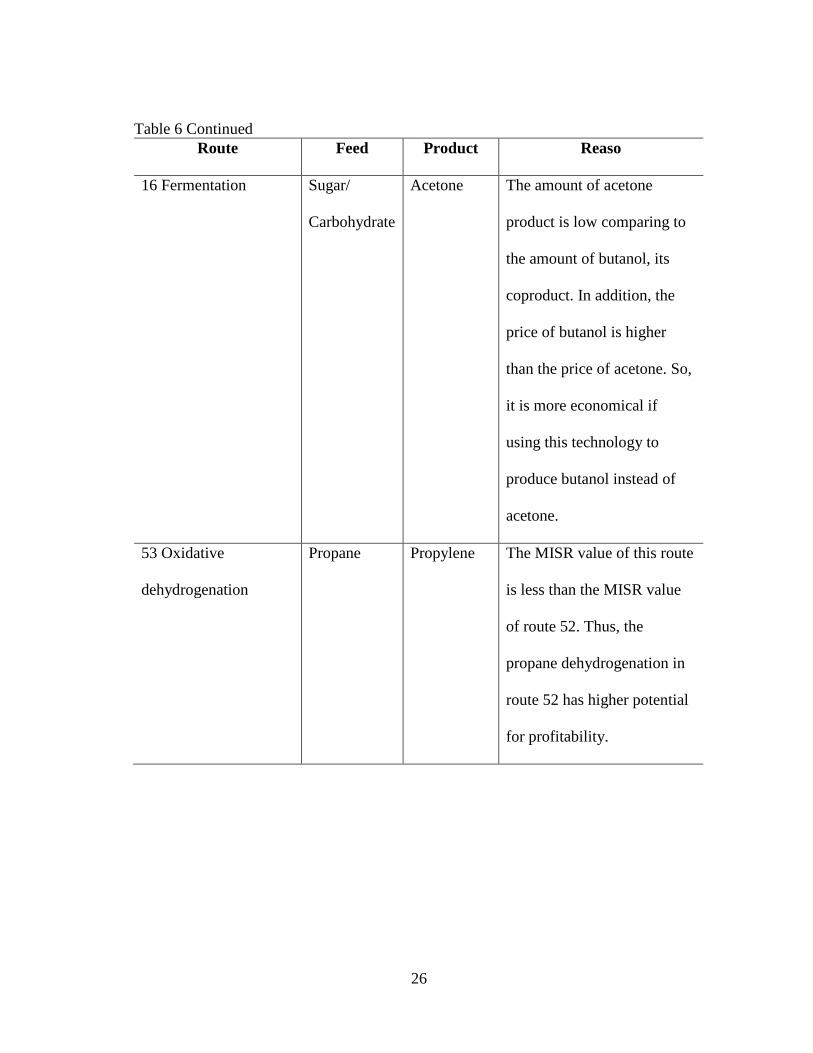
Table 6 Continued
Route Feed Product Reaso
16 Fermentation Sugar/
Carbohydrate
Acetone The amount of acetone
product is low comparing to
the amount of butanol, its
coproduct. In addition, the
price of butanol is higher
than the price of acetone. So,
it is more economical if
using this technology to
produce butanol instead of
acetone.
53 Oxidative
dehydrogenation
Propane Propylene The MISR value of this route
is less than the MISR value
of route 52. Thus, the
propane dehydrogenation in
route 52 has higher potential
for profitability.
27
Table 6 Continued
Route Feed Product Reason
4 Transesterification
5 Saponification
6 Hydrolysis
Biomass Glycerol As there are abundant
glycerol from biodiesel
production, glycerol should
be obtained from biodiesel
production instead of other
routes.
13 Fermentation Sugar/
Carbohydrate
Glycerol
3 Hydrogenation Biomass Propane Propane is produced in a
small amount in green diesel
production. So, this route
cannot be a major source of
propane.
10 Landfill
11 Digestion
Biomass Methane Due to the shale gas boom,
obtaining methane from
shale gas is the cheapest
pathway.
27 Methanation Syngas Methane
43 Anaerobic digestion Glycerol Methane
28
Like the previous approach, as the routes in Table 6 were removed from the
superstructure, the hydrolysis of biomass (route 7) was eliminated because it was affected
by route 13, 14, 15, 16, 17, 18, 19, and route 20.
A literature review compared different technologies to produce methane from
syngas. Julian-Duran, L.M., et al. performed a techno-economic assessment for methanol
production from syngas[55]. The result indicates that partial oxidation is the most suitable
route to convert syngas to methane from an economic aspect by using ROI as an indicator.
Therefore, route 32 was selected as a viable pathway to convert syngas to methane.
Moreover, Jasper, S. and M.M. El-Halwagi reported that producing propylene from
methanol by Methanol to Olefins process (MTO process) is more economical than by
Methanol to Propylene process (MTP process)[52]. Therefore, route 55 was also excluded
from the superstructure. It should be noted that even though propylene is a coproduct in
MTO process, MTO is a commercial process and can be controlled to produce more
propylene than ethylene[22]. Hence, route 56 was retained in the superstructure.
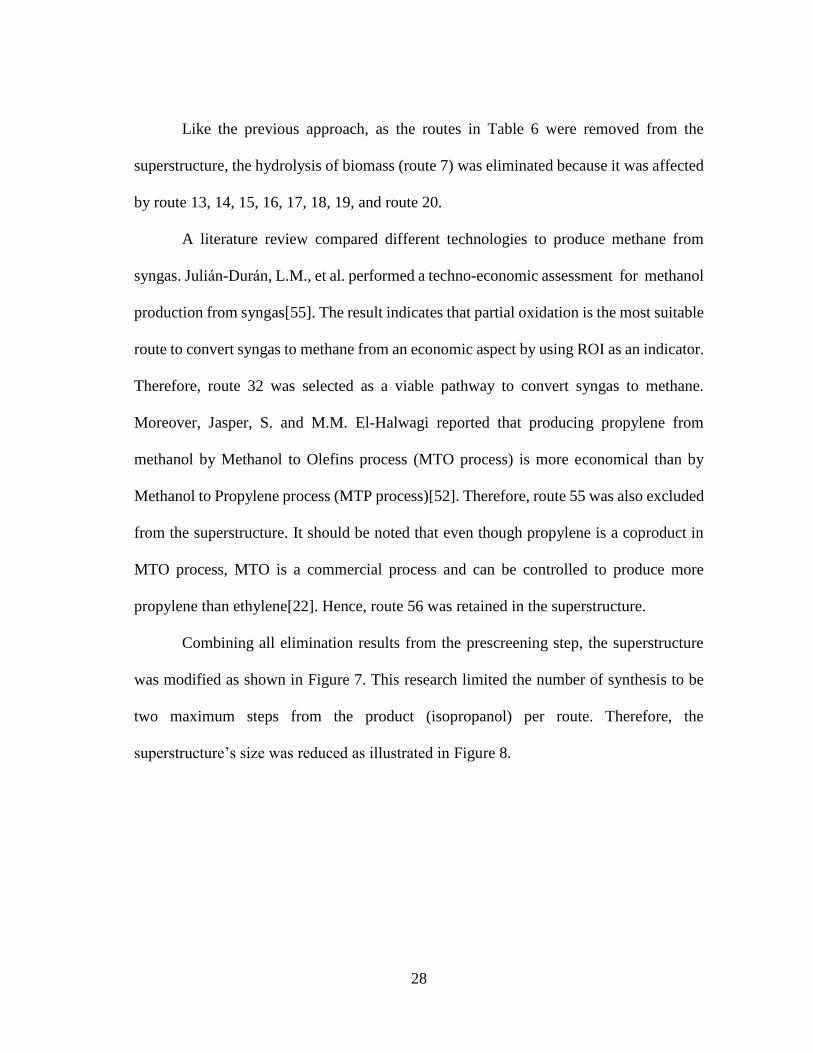
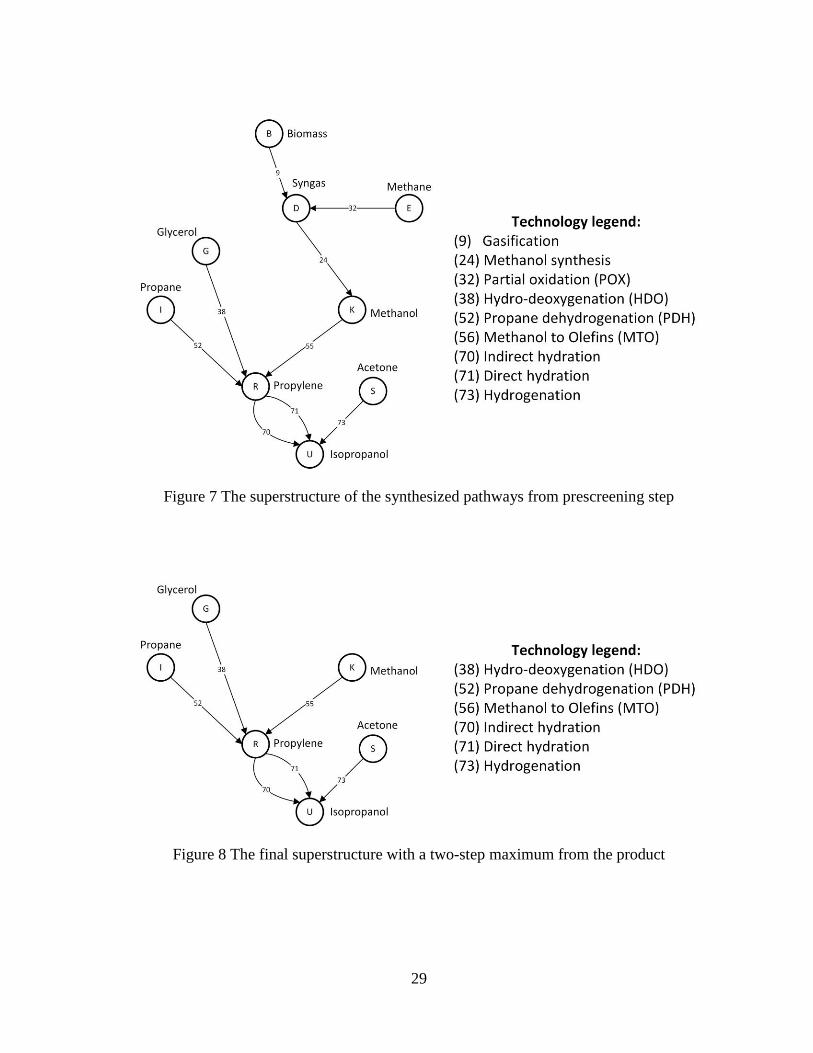
Combining all elimination results from the prescreening step, the superstructure
was modified as shown in Figure 7. This research limited the number of synthesis to be
two maximum steps from the product (isopropanol) per route. Therefore, the
superstructure’s size was reduced as illustrated in Figure 8.
29
Figure 7 The superstructure of the synthesized pathways from prescreening step
Figure 8 The final superstructure with a two-step maximum from the product
30
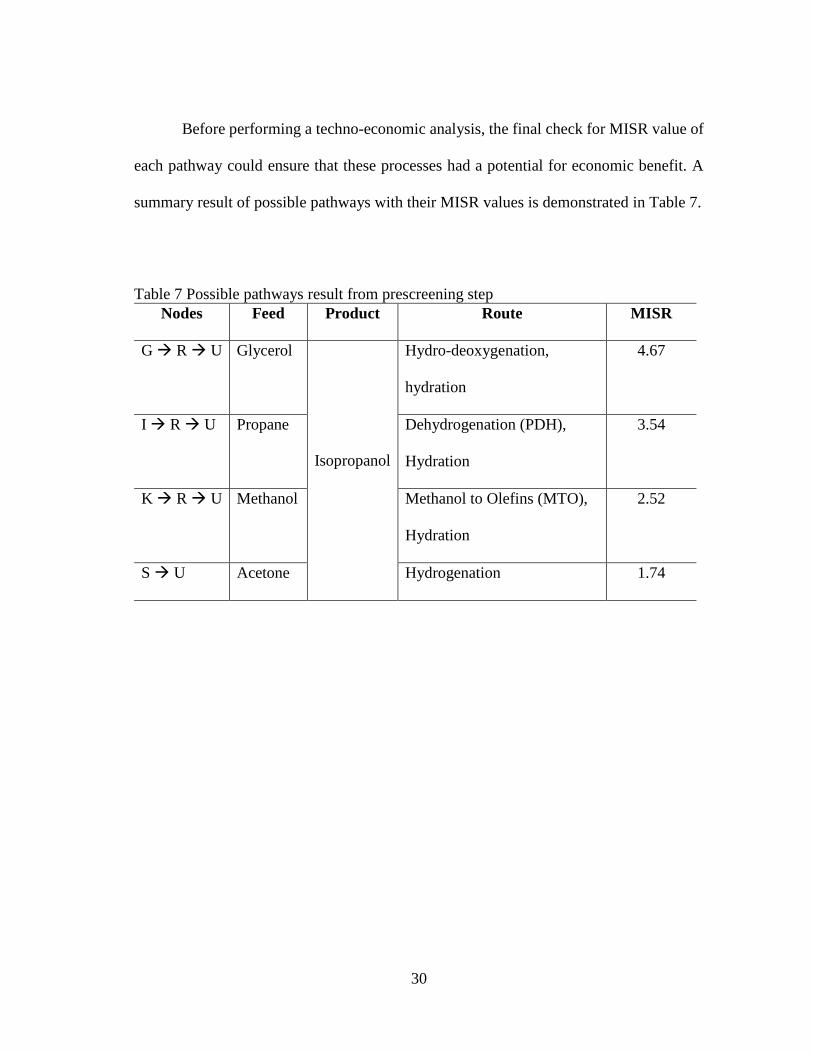
Before performing a techno-economic analysis, the final check for MISR value of
each pathway could ensure that these processes had a potential for economic benefit. A
summary result of possible pathways with their MISR values is demonstrated in Table 7.
Table 7 Possible pathways result from prescreening step
Nodes Feed Product Route MISR
G R U Glycerol
Isopropanol
Hydro-deoxygenation,
hydration
4.67
I R U Propane Dehydrogenation (PDH),
Hydration
3.54
K R U Methanol Methanol to Olefins (MTO),
Hydration
2.52
S U Acetone Hydrogenation 1.74
31
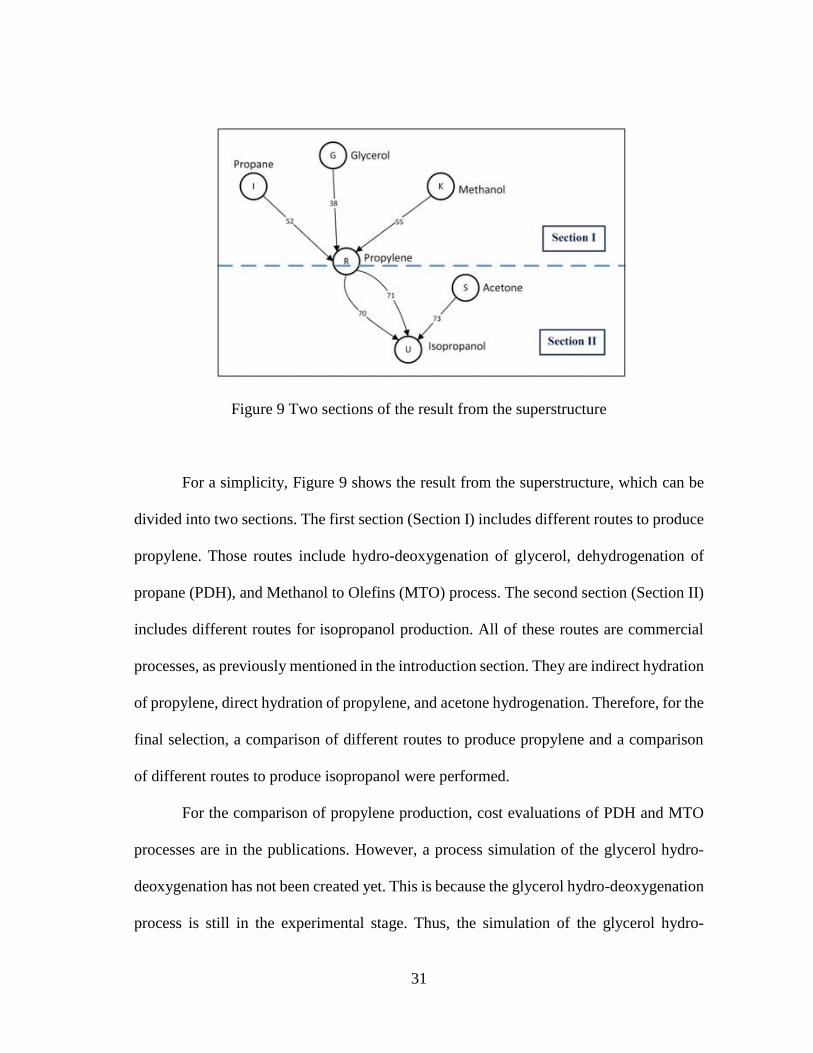
Figure 9 Two sections of the result from the superstructure
For a simplicity, Figure 9 shows the result from the superstructure, which can be
divided into two sections. The first section (Section I) includes different routes to produce
propylene. Those routes include hydro-deoxygenation of glycerol, dehydrogenation of
propane (PDH), and Methanol to Olefins (MTO) process. The second section (Section II)
includes different routes for isopropanol production. All of these routes are commercial
processes, as previously mentioned in the introduction section. They are indirect hydration
of propylene, direct hydration of propylene, and acetone hydrogenation. Therefore, for the
final selection, a comparison of different routes to produce propylene and a comparison
of different routes to produce isopropanol were performed.
For the comparison of propylene production, cost evaluations of PDH and MTO
processes are in the publications. However, a process simulation of the glycerol hydro-
deoxygenation has not been created yet. This is because the glycerol hydro-deoxygenation
process is still in the experimental stage. Thus, the simulation of the glycerol hydro-
32
deoxygenation reaction was conducted in this research. The simulations were carried out
based on the capacity of 350,000 tonnes of propylene per annum.
For the comparison of isopropanol production, even though three viable methods
to produce isopropanol in the superstructure are all commercial processes, the economic
assessments for each process have not been performed yet. Therefore, three simulation
flowsheets for those isopropanol production processes were created. The simulations were
carried out based on the capacity of 400,000 of isopropanol per annum.
4.2.1 C3 from biological synthesis
From the superstructure after the prescreening step, it is discovered that none of
the processes associated with biomaterials is counted as a possible pathway. The reason
behind this is that all C3 fermentation processes have a low yield. It is found that the main
limitation of the low-yield fermentation is because of the redox balance and carbon
inefficiency. However, this obstacle can be alleviated by knocking out cellular effects
with a specific gene[56]. Therefore, the ongoing research in this area is focusing on an
engineering fermentation to find the appropriate genes in order to overcome those
limitations.
Bio-propylene is a good example of chemical production from biological sources.
Rodriguez, B.A., et al. reported that propylene cannot be efficiently produced from sugar
under any fermentation conditions[56]. This is because the cost of raw materials cannot
compete with the price of product. In other word, sugar price is higher than propylene
price. Thus, producers will not get any profit from this process. According to the
assessment from Rodriguez, B.A., et al.’s publications, it is predicted that the sugar price
33
should reduce to about $0.13/kg in order to compete with the conventional process[56].
The report provided by Walther, T. and J.M. François also stated that propanol production
from the metabolic engineering fermentation still cannot compete with the conventional
synthesis even though the current technology is used[32].
4.3 Techno-economic analysis
Based on the results from the prescreening step, a techno-economic assessment of
the following processes was performed: glycerol hydro-deoxygenation for propylene
production, indirect hydration for isopropanol production, direct hydration for isopropanol
production, and acetone hydrogenation for isopropanol production.
This section discusses the technical and economic analysis of these processes. The
technical component consists of a process simulation flowsheet and a process description.
The economic analysis assesses significant data for cost estimation and economic results.
The detailed calculation of each process is described in Appendix C.
4.3.1 Glycerol hydro-deoxygenation
As a general description of the glycerol hydro-deoxygenation has not yet been
discussed in this research yet, a brief summary of this process is provided. Glycerol hydro-
deoxygenation is a one-step catalytic propylene formation reaction with a conversion of
88% and a selectivity of 76%. A great advantage of this reaction is that propylene is the
only product in the gas phase so that the separation section is not required[39]. This
process is an enticing process because of its abundance and low-price feedstock. It is worth
noting that glycerol is abundant in the market as it is a byproduct from biodiesel
34
production, which has been increasing in recent years[44]. In addition, this process
provides an alternative resolution for a problem of surplus glycerol in the market and
propylene shortage[41]. However, the main challenge of this process is that the glycerol
from the biodiesel industry is crude and impure. Its contaminants, including methanol,
salts, and free fatty acids, can damage pipes and equipment[57]. Thus, an expensive
glycerol purification technology is required. In this research, the glycerol purification
process design was obtained from Duque, J.’s report[58]. Regarding to Zacharopoulou,
V.’s study, hydrogen is fed to the process with a molar ratio to glycerol of 53:1[39]. Due
to the highly excessive amount of unreacted hydrogen, a hydrogen recovery process was
required. A pressure-swing adsorption (PSA) was used to recover hydrogen in the process
because it was the most suitable method to purify offgas in the chemical and refining
industries[59].
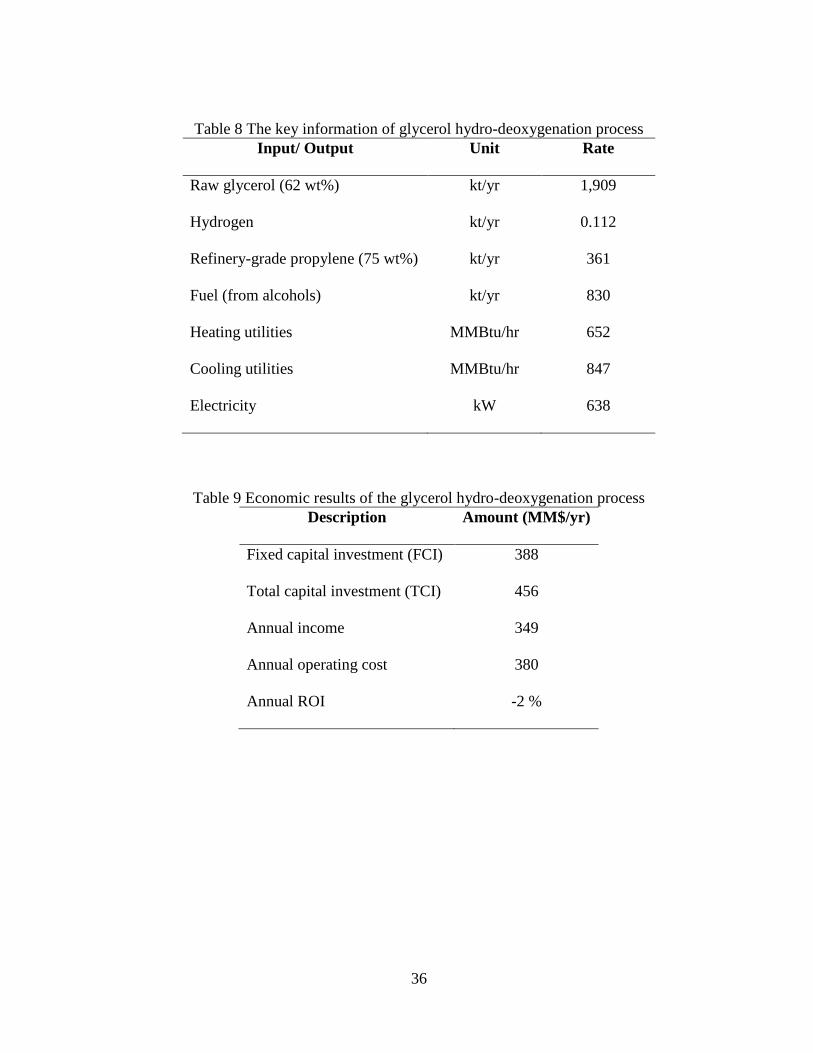
4.3.1.1 Process flowsheet
This process is divided into three sections, which are glycerol pretreatment section,
hydro-deoxygenation reaction section, and hydrogen recovery section. The process
description and process flowsheet of the pretreatment section are illustrated in Design and
analysis of technological schemes for glycerol conversion to added value products[58]. In
the pretreatment section, raw glycerol, which has a purity of 62 wt%, is purified to a purity
of 99.7 wt% before sending to the reaction section. Then, in the hydro-deoxygenation
reaction section, glycerol is pump and preheated to the reaction condition before entering
the reactor. Hydrogen, another feed, is pressurized and mixed with recycled hydrogen.
The combined hydrogen is then preheated to the reaction condition as well. Reactor
35
condition for glycerol and hydrogen are P = 80 bar, T = 573 K. The reactor effluent comes
out as the vapor-liquid mixture. The mixture is sent to flash drum which operates at room
temperature and atmospheric pressure. The only products in the gas phase are propylene
and unreacted hydrogen. The byproducts are all in liquid phase. Therefore, a gas stream
of propylene and hydrogen is sent to the pressure-swing adsorption section to purify the
propylene product and recycle unreacted hydrogen back to the reaction section. A
flowsheet and stream table of the glycerol hydro-deoxygenation process are presented in
Figure 10 and Table 10, respectively.
4.3.1.2 Economic analysis
The economic assessment of this process was performed using both the simulation
and publications. While the equipment cost for glycerol pretreatment and pressure-swing
adsorption (PSA) sections were obtained from the publications, the equipment cost for the
reaction section was acquired from the simulation. The total purchased equipment cost
was calculated by adding the equipment costs of each section together. A summary of the
key information for economic analysis is demonstrated in Table 8 and the economic results
of the glycerol hydro-deoxygenation process are shown in Table 9.
36
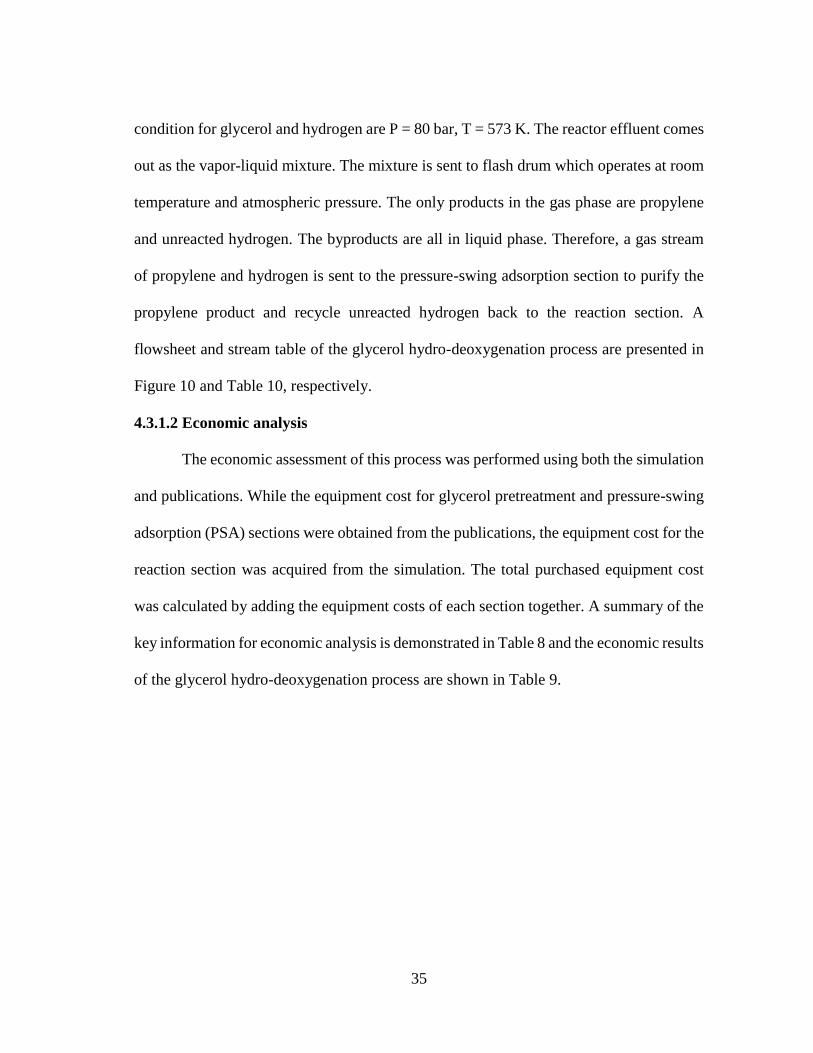
Table 8 The key information of glycerol hydro-deoxygenation process
Input/ Output Unit Rate
Raw glycerol (62 wt%) kt/yr 1,909
Hydrogen kt/yr 0.112
Refinery-grade propylene (75 wt%) kt/yr 361
Fuel (from alcohols) kt/yr 830
Heating utilities MMBtu/hr 652
Cooling utilities MMBtu/hr 847
Electricity kW 638
Table 9 Economic results of the glycerol hydro-deoxygenation process
Description Amount (MM$/yr)
Fixed capital investment (FCI) 388
Total capital investment (TCI) 456
Annual income 349
Annual operating cost 380
Annual ROI -2 %
37
Figure 10 A flowsheet of glycerol hydro-deoxygenation
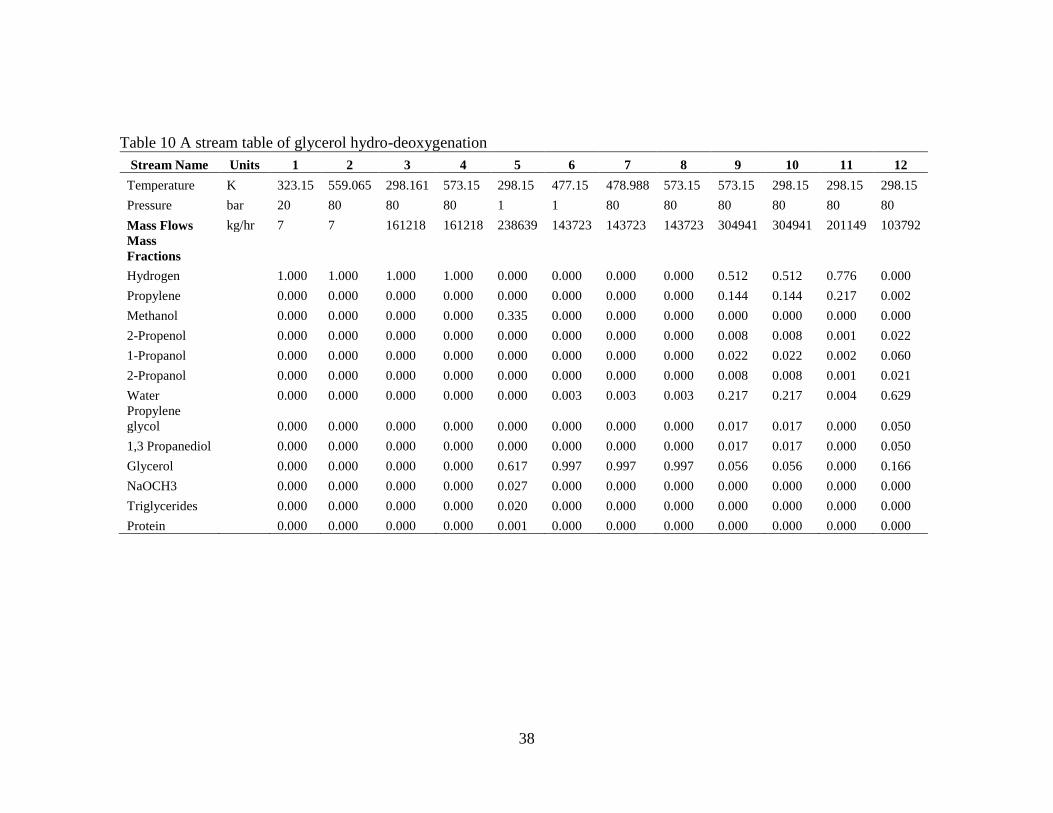
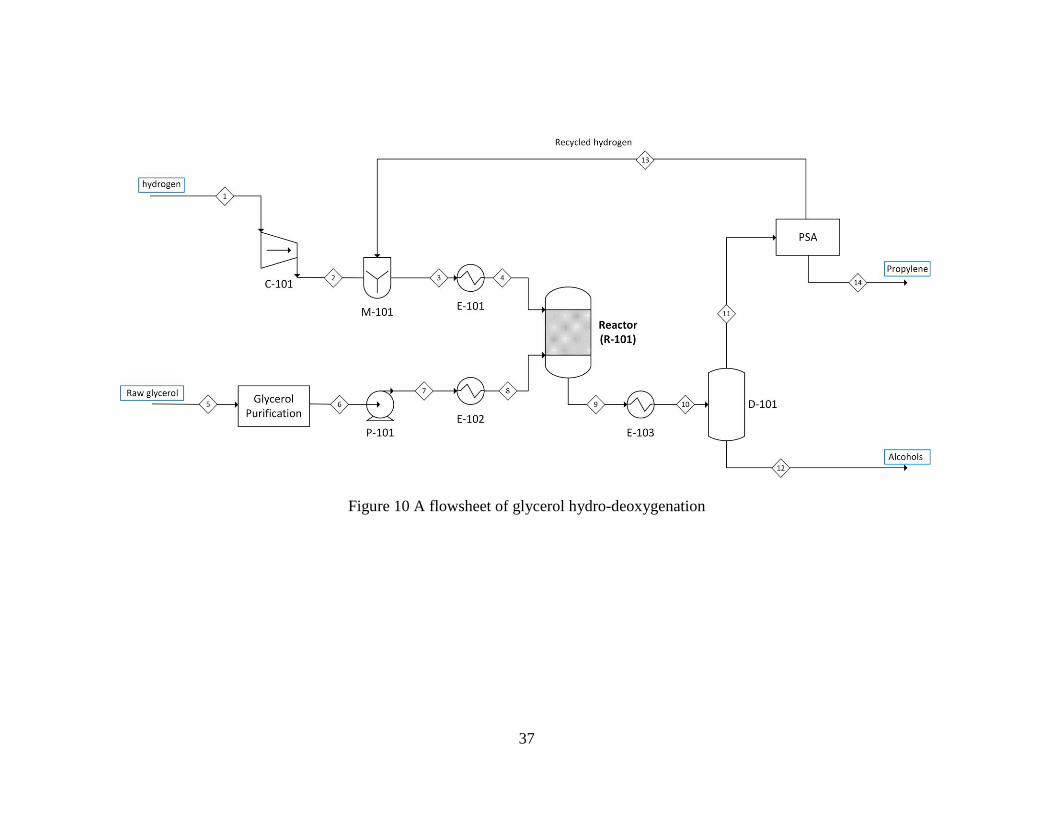
38
Table 10 A stream table of glycerol hydro-deoxygenation
Stream Name Units 1 2 3 4 5 6 7 8 9 10 11 12
Temperature K 323.15 559.065 298.161 573.15 298.15 477.15 478.988 573.15 573.15 298.15 298.15 298.15
Pressure bar 20 80 80 80 1 1 80 80 80 80 80 80
Mass Flows kg/hr 7 7 161218 161218 238639 143723 143723 143723 304941 304941 201149 103792
Mass
Fractions
Hydrogen 1.000 1.000 1.000 1.000 0.000 0.000 0.000 0.000 0.512 0.512 0.776 0.000
Propylene 0.000 0.000 0.000 0.000 0.000 0.000 0.000 0.000 0.144 0.144 0.217 0.002
Methanol 0.000 0.000 0.000 0.000 0.335 0.000 0.000 0.000 0.000 0.000 0.000 0.000
2-Propenol 0.000 0.000 0.000 0.000 0.000 0.000 0.000 0.000 0.008 0.008 0.001 0.022
1-Propanol 0.000 0.000 0.000 0.000 0.000 0.000 0.000 0.000 0.022 0.022 0.002 0.060
2-Propanol 0.000 0.000 0.000 0.000 0.000 0.000 0.000 0.000 0.008 0.008 0.001 0.021
Water 0.000 0.000 0.000 0.000 0.000 0.003 0.003 0.003 0.217 0.217 0.004 0.629
Propylene
glycol 0.000 0.000 0.000 0.000 0.000 0.000 0.000 0.000 0.017 0.017 0.000 0.050
1,3 Propanediol 0.000 0.000 0.000 0.000 0.000 0.000 0.000 0.000 0.017 0.017 0.000 0.050
Glycerol 0.000 0.000 0.000 0.000 0.617 0.997 0.997 0.997 0.056 0.056 0.000 0.166
NaOCH3 0.000 0.000 0.000 0.000 0.027 0.000 0.000 0.000 0.000 0.000 0.000 0.000
Triglycerides 0.000 0.000 0.000 0.000 0.020 0.000 0.000 0.000 0.000 0.000 0.000 0.000
Protein 0.000 0.000 0.000 0.000 0.001 0.000 0.000 0.000 0.000 0.000 0.000 0.000
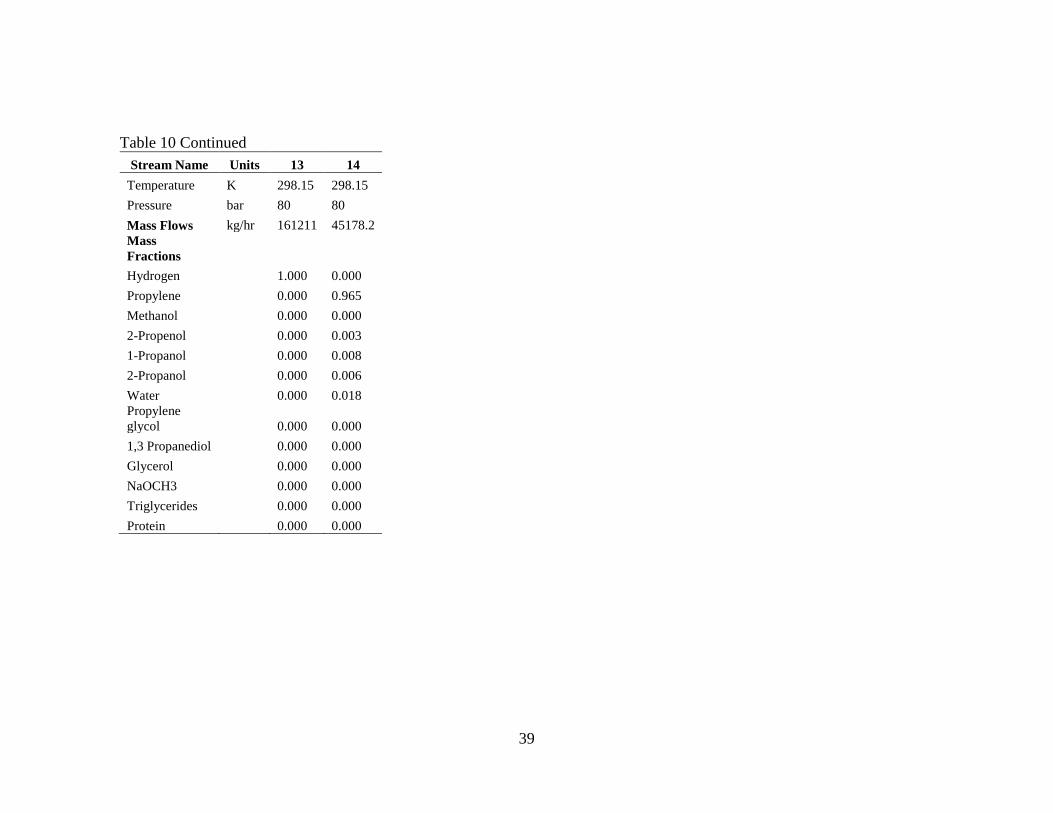
39
Table 10 Continued
Stream Name Units 13 14
Temperature K 298.15 298.15
Pressure bar 80 80
Mass Flows kg/hr 161211 45178.2
Mass
Fractions
Hydrogen 1.000 0.000
Propylene 0.000 0.965
Methanol 0.000 0.000
2-Propenol 0.000 0.003
1-Propanol 0.000 0.008
2-Propanol 0.000 0.006
Water 0.000 0.018
Propylene
glycol 0.000 0.000
1,3 Propanediol 0.000 0.000
Glycerol 0.000 0.000
NaOCH3 0.000 0.000
Triglycerides 0.000 0.000
Protein 0.000 0.000
40
4.3.2 Indirect hydration
4.3.2.1 Process flowsheet
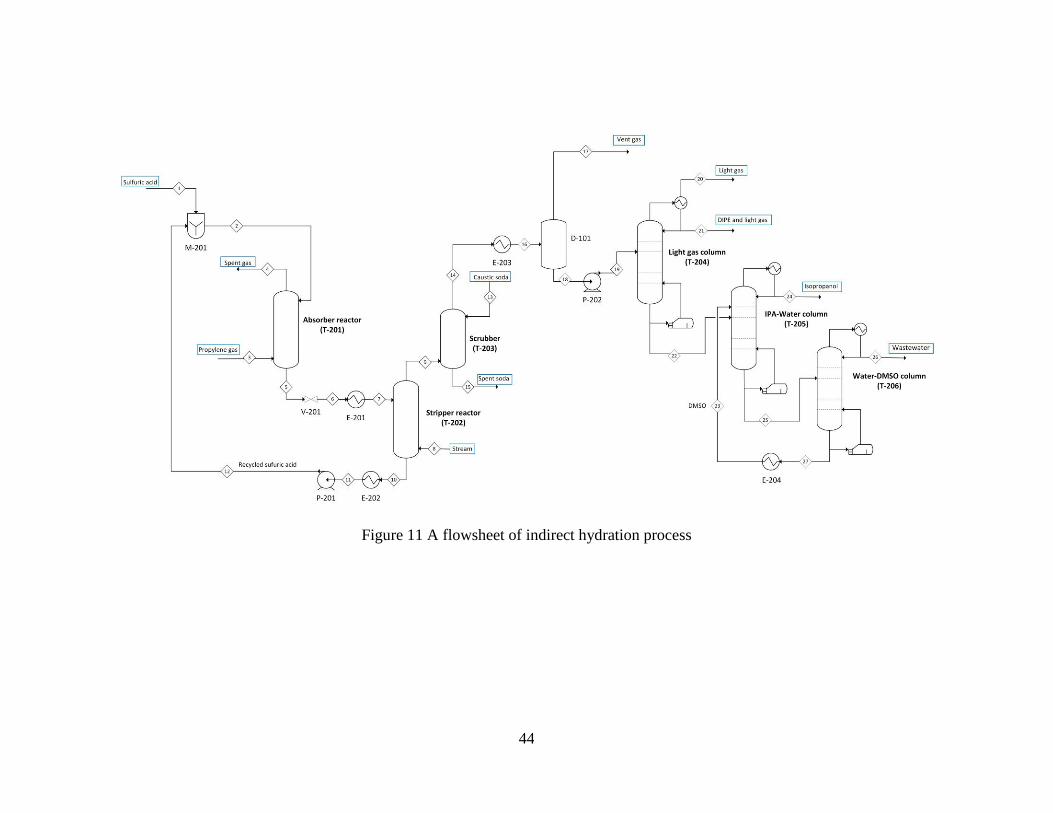
Propylene gas (70 wt% propylene, 30 wt% propane) is fed to the bottom of the
absorber reactor to mix with weak sulfuric acid (80 wt% H2SO4) from the top of the
absorber reactor. In the absorber reactor, propylene is absorbed by the weak sulfuric acid
and forms sulfate solution by esterification at the condition of P = 6 bar and T = 363 K.
While spent gas is vented out of the process from the top of the absorber reactor, the sulfate
mixture from the bottom of the absorber reactor is depressurized and heated before
entering the top of the stripper reactor. To form a hydration reaction at streamed pressure
with T = 407 K, water and low pressure stream (LP stream) are supplied to the lower
section of the stripper reactor. Unreacted sulfuric acid is removed from the bottom of the
stripper reactor and recycled back to the absorber reactor for a further esterification
reaction. Product from the top of the stripper reactor is fed to the scrubber to neutralize
the residual acid with caustic. While spent soda is discharged from the bottom of the
scrubber, neutral product leaves the top of the scrubber as vapor stream. The vapor stream
is condensed and sent to the drum to separate propylene and propane gases from product
stream. The liquid product stream from the drum is pressurized and fed to the first
distillation column. The first distillation column operates with the partial condenser. This
column separates DIPE and the remaining gas from the product stream. The distillate is
sold as fuel. The product stream then enters the isopropanol-water distillation column. As
it is an azeotrope distillation, DMSO is used to separate isopropanol from water.
Isopropanol with a purity of 99 wt% concentrates in this distillation column as the product
41
stream. The heavy stream from the isopropanol-water distillation column is sent to the last
column for separation of water and DMSO. While DMSO is recycled back to the
azeotropic distillation column, water is removed from the process as a wastewater. A
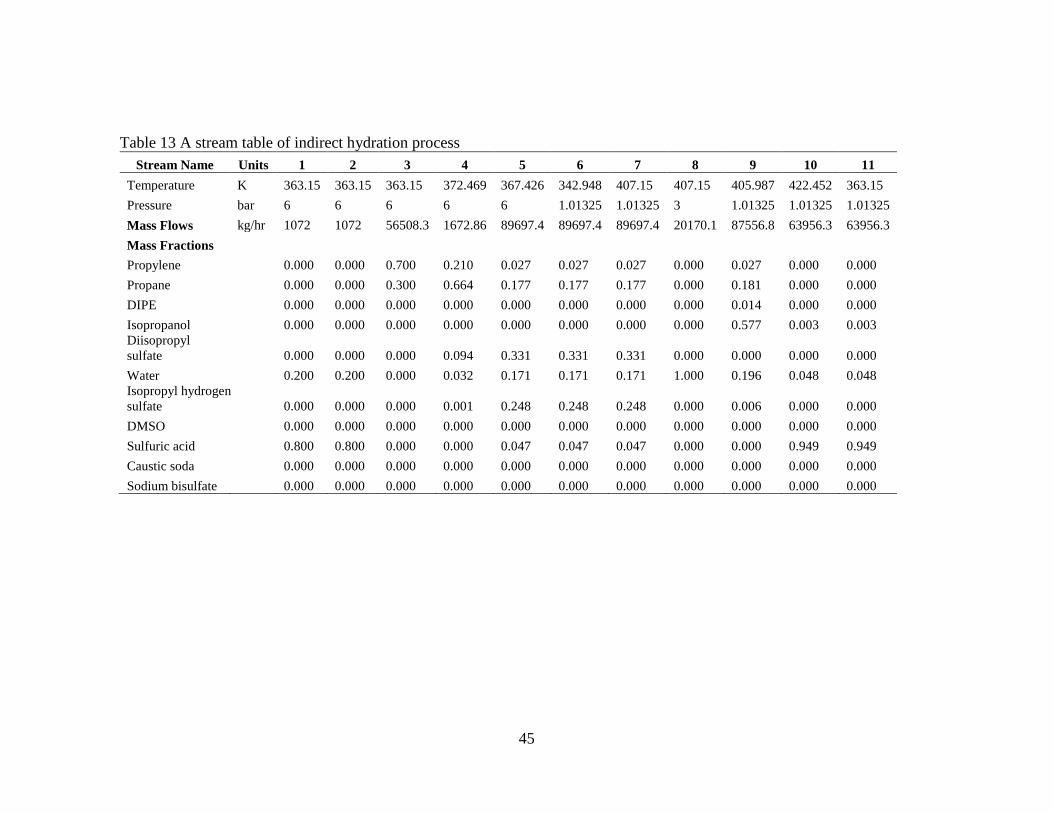
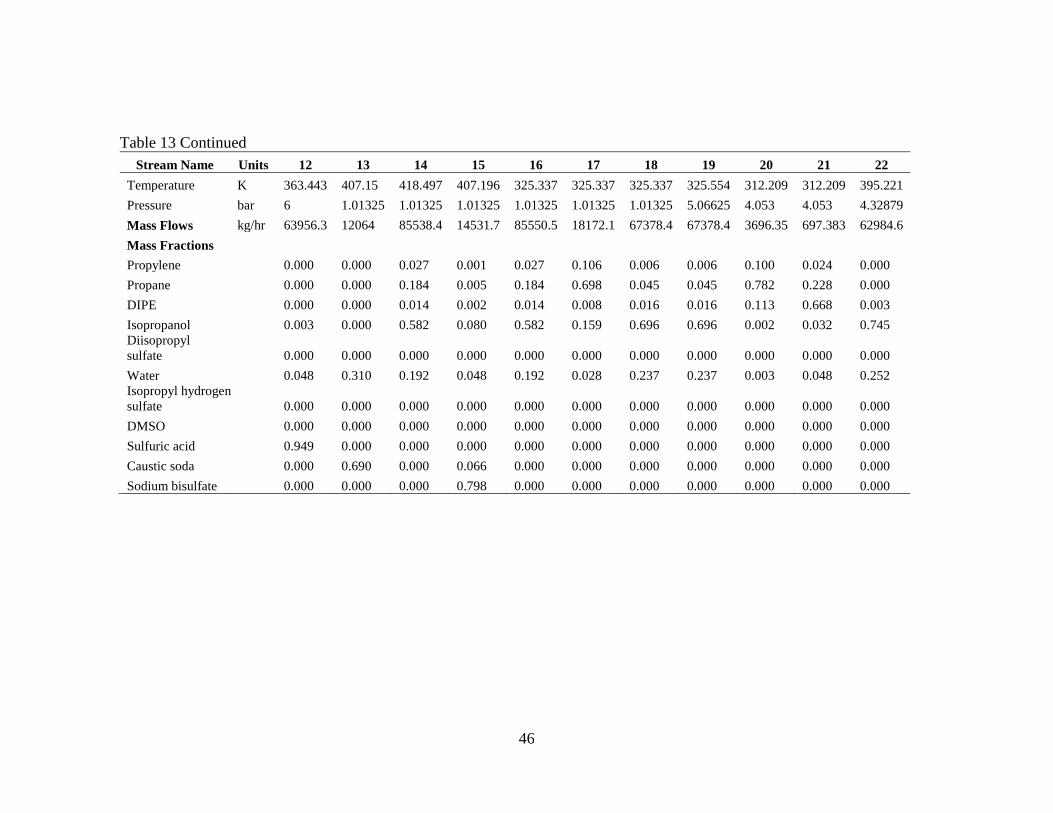
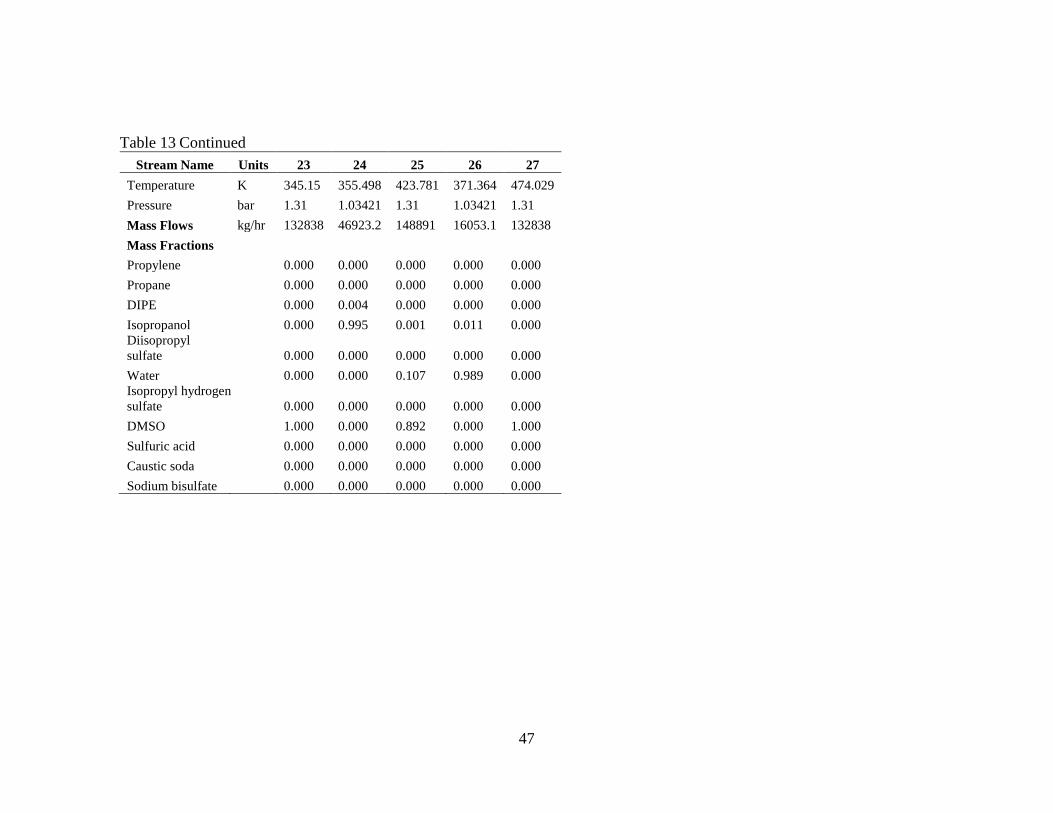
flowsheet of the indirect hydration process is presented in Figure 11. A stream table of the
process is also presented in Table 13.
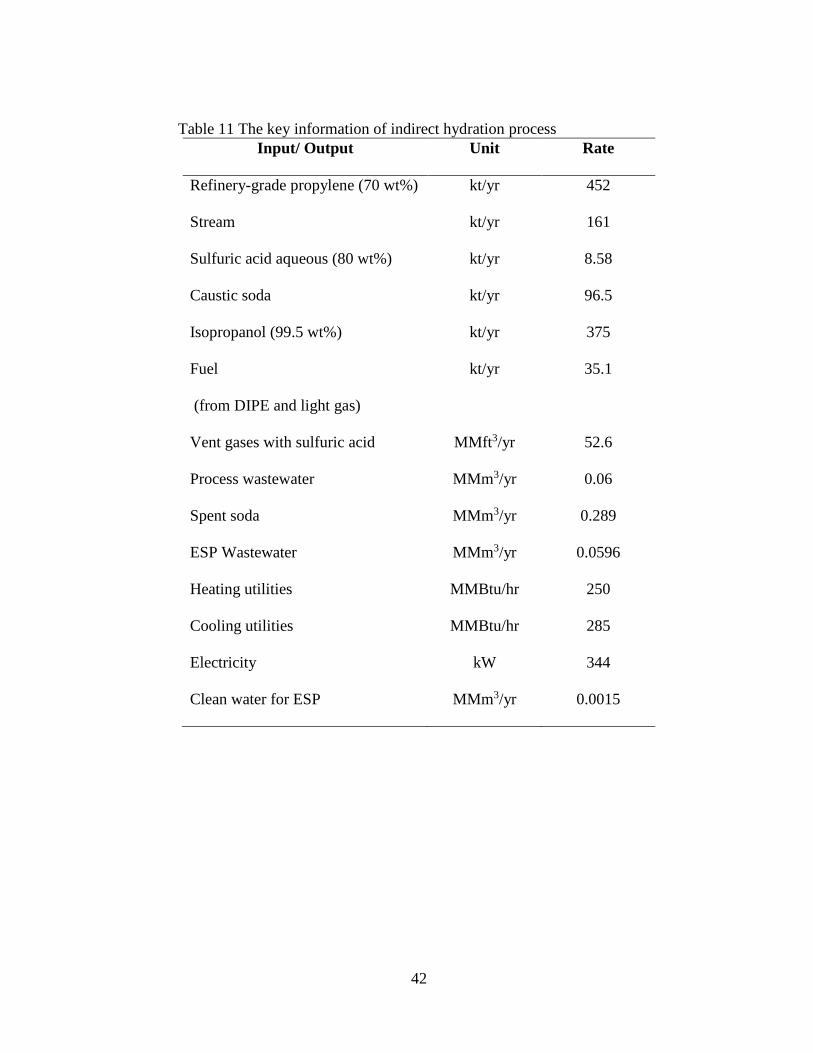
4.3.2.2 Economic analysis
A summary of the key information from the indirect hydration simulation for an
economic analysis is demonstrated in Table 11. The information includes feed flowrates,
product and byproduct flowrates, waste flowrates, required utilities, and electricity
consumption. As this process discharged waste to environment, a waste treatment cost was
included in the profitability calculation. Waste in the process includes sulfuric acid-
containing gases, spent soda, and wastewater. After including all of the cost estimation in
the economic analysis calculation, the economic results of the indirect hydration process
were obtained as shown in Table 12.
42
Table 11 The key information of indirect hydration process
Input/ Output Unit Rate
Refinery-grade propylene (70 wt%) kt/yr 452
Stream kt/yr 161
Sulfuric acid aqueous (80 wt%) kt/yr 8.58
Caustic soda kt/yr 96.5
Isopropanol (99.5 wt%) kt/yr 375
Fuel
(from DIPE and light gas)
kt/yr 35.1
Vent gases with sulfuric acid MMft3/yr 52.6
Process wastewater MMm3/yr 0.06
Spent soda MMm3/yr 0.289
ESP Wastewater MMm3/yr 0.0596
Heating utilities MMBtu/hr 250
Cooling utilities MMBtu/hr 285
Electricity kW 344
Clean water for ESP MMm3/yr 0.0015

43
Table 12 Economic results of indirect hydration process
Description Amount (MM$/yr)
Fixed capital investment (FCI) 135
Total capital investment (TCI) 159
Annual income 497
Annual operating cost 422
Annual ROI 36 %
44
Figure 11 A flowsheet of indirect hydration process
45
Table 13 A stream table of indirect hydration process
Stream Name Units 1 2 3 4 5 6 7 8 9 10 11
Temperature K 363.15 363.15 363.15 372.469 367.426 342.948 407.15 407.15 405.987 422.452 363.15
Pressure bar 6 6 6 6 6 1.01325 1.01325 3 1.01325 1.01325 1.01325
Mass Flows kg/hr 1072 1072 56508.3 1672.86 89697.4 89697.4 89697.4 20170.1 87556.8 63956.3 63956.3
Mass Fractions
Propylene 0.000 0.000 0.700 0.210 0.027 0.027 0.027 0.000 0.027 0.000 0.000
Propane 0.000 0.000 0.300 0.664 0.177 0.177 0.177 0.000 0.181 0.000 0.000
DIPE 0.000 0.000 0.000 0.000 0.000 0.000 0.000 0.000 0.014 0.000 0.000
Isopropanol 0.000 0.000 0.000 0.000 0.000 0.000 0.000 0.000 0.577 0.003 0.003
Diisopropyl
sulfate 0.000 0.000 0.000 0.094 0.331 0.331 0.331 0.000 0.000 0.000 0.000
Water 0.200 0.200 0.000 0.032 0.171 0.171 0.171 1.000 0.196 0.048 0.048
Isopropyl hydrogen
sulfate 0.000 0.000 0.000 0.001 0.248 0.248 0.248 0.000 0.006 0.000 0.000
DMSO 0.000 0.000 0.000 0.000 0.000 0.000 0.000 0.000 0.000 0.000 0.000
Sulfuric acid 0.800 0.800 0.000 0.000 0.047 0.047 0.047 0.000 0.000 0.949 0.949
Caustic soda 0.000 0.000 0.000 0.000 0.000 0.000 0.000 0.000 0.000 0.000 0.000
Sodium bisulfate 0.000 0.000 0.000 0.000 0.000 0.000 0.000 0.000 0.000 0.000 0.000
46
Table 13 Continued
Stream Name Units 12 13 14 15 16 17 18 19 20 21 22
Temperature K 363.443 407.15 418.497 407.196 325.337 325.337 325.337 325.554 312.209 312.209 395.221
Pressure bar 6 1.01325 1.01325 1.01325 1.01325 1.01325 1.01325 5.06625 4.053 4.053 4.32879
Mass Flows kg/hr 63956.3 12064 85538.4 14531.7 85550.5 18172.1 67378.4 67378.4 3696.35 697.383 62984.6
Mass Fractions
Propylene 0.000 0.000 0.027 0.001 0.027 0.106 0.006 0.006 0.100 0.024 0.000
Propane 0.000 0.000 0.184 0.005 0.184 0.698 0.045 0.045 0.782 0.228 0.000
DIPE 0.000 0.000 0.014 0.002 0.014 0.008 0.016 0.016 0.113 0.668 0.003
Isopropanol 0.003 0.000 0.582 0.080 0.582 0.159 0.696 0.696 0.002 0.032 0.745
Diisopropyl
sulfate 0.000 0.000 0.000 0.000 0.000 0.000 0.000 0.000 0.000 0.000 0.000
Water 0.048 0.310 0.192 0.048 0.192 0.028 0.237 0.237 0.003 0.048 0.252
Isopropyl hydrogen
sulfate 0.000 0.000 0.000 0.000 0.000 0.000 0.000 0.000 0.000 0.000 0.000
DMSO 0.000 0.000 0.000 0.000 0.000 0.000 0.000 0.000 0.000 0.000 0.000
Sulfuric acid 0.949 0.000 0.000 0.000 0.000 0.000 0.000 0.000 0.000 0.000 0.000
Caustic soda 0.000 0.690 0.000 0.066 0.000 0.000 0.000 0.000 0.000 0.000 0.000
Sodium bisulfate 0.000 0.000 0.000 0.798 0.000 0.000 0.000 0.000 0.000 0.000 0.000
47
Table 13 Continued
Stream Name Units 23 24 25 26 27
Temperature K 345.15 355.498 423.781 371.364 474.029
Pressure bar 1.31 1.03421 1.31 1.03421 1.31
Mass Flows kg/hr 132838 46923.2 148891 16053.1 132838
Mass Fractions
Propylene 0.000 0.000 0.000 0.000 0.000
Propane 0.000 0.000 0.000 0.000 0.000
DIPE 0.000 0.004 0.000 0.000 0.000
Isopropanol 0.000 0.995 0.001 0.011 0.000
Diisopropyl
sulfate 0.000 0.000 0.000 0.000 0.000
Water 0.000 0.000 0.107 0.989 0.000
Isopropyl hydrogen
sulfate 0.000 0.000 0.000 0.000 0.000
DMSO 1.000 0.000 0.892 0.000 1.000
Sulfuric acid 0.000 0.000 0.000 0.000 0.000
Caustic soda 0.000 0.000 0.000 0.000 0.000
Sodium bisulfate 0.000 0.000 0.000 0.000 0.000
48
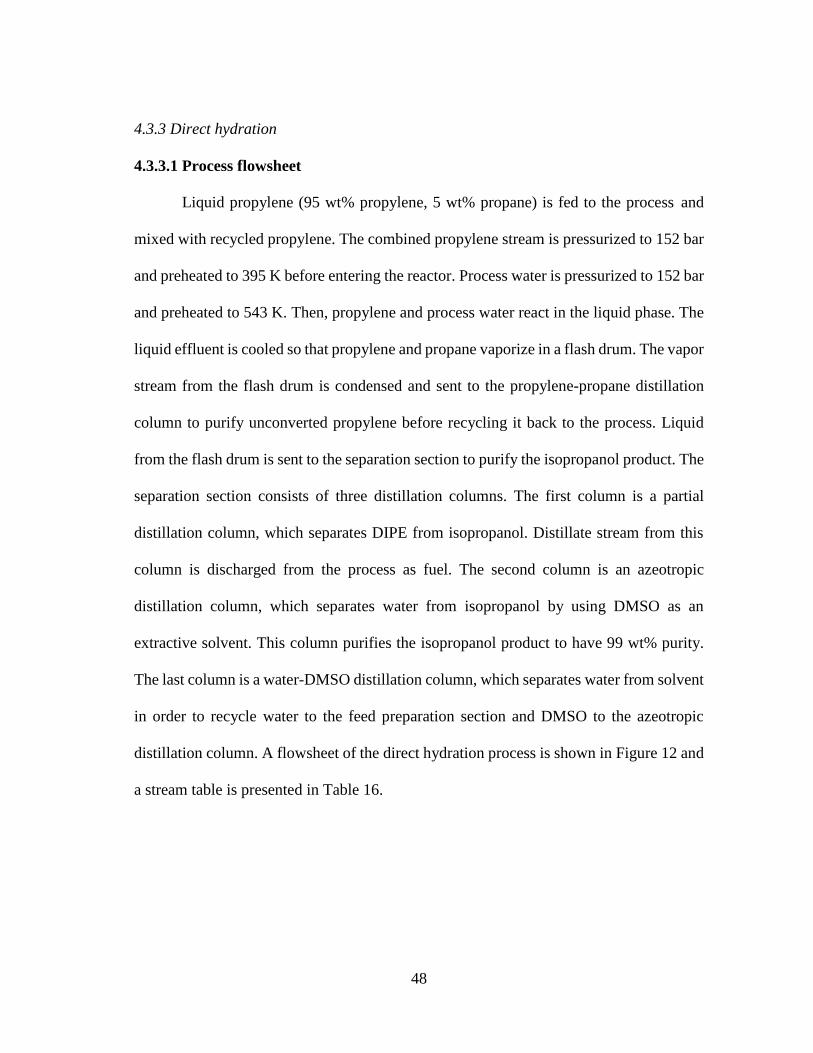
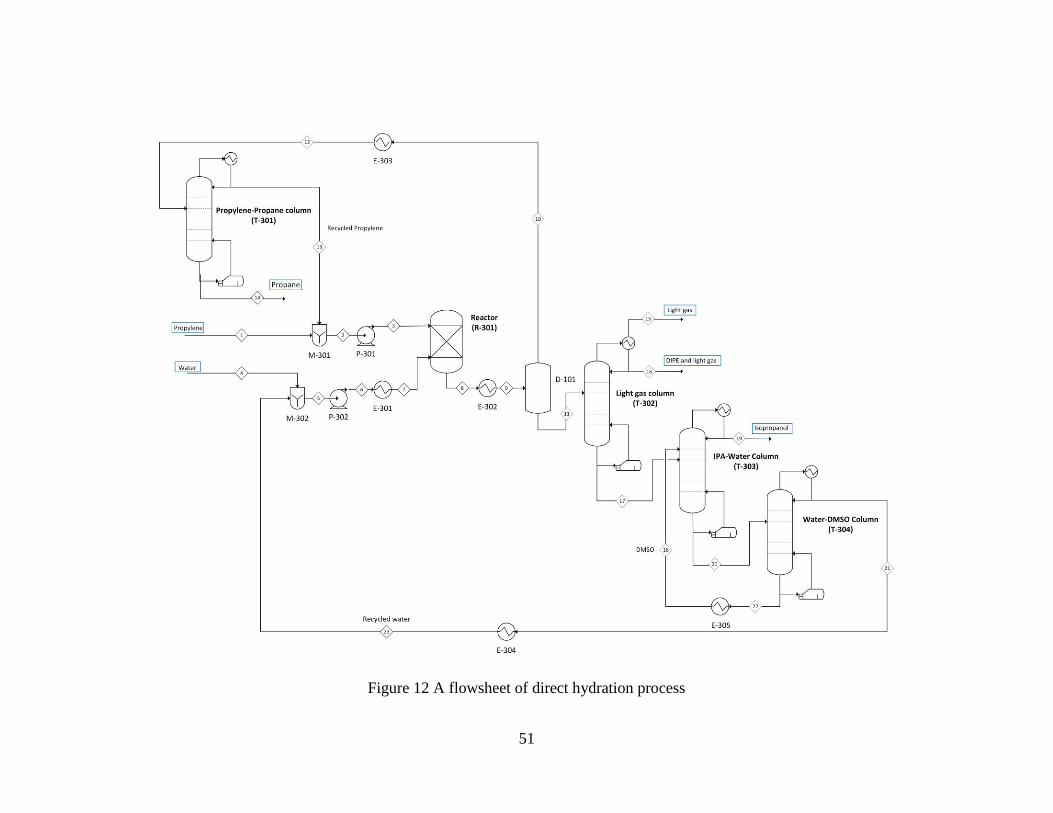
4.3.3 Direct hydration
4.3.3.1 Process flowsheet
Liquid propylene (95 wt% propylene, 5 wt% propane) is fed to the process and
mixed with recycled propylene. The combined propylene stream is pressurized to 152 bar
and preheated to 395 K before entering the reactor. Process water is pressurized to 152 bar
and preheated to 543 K. Then, propylene and process water react in the liquid phase. The
liquid effluent is cooled so that propylene and propane vaporize in a flash drum. The vapor
stream from the flash drum is condensed and sent to the propylene-propane distillation
column to purify unconverted propylene before recycling it back to the process. Liquid
from the flash drum is sent to the separation section to purify the isopropanol product. The
separation section consists of three distillation columns. The first column is a partial
distillation column, which separates DIPE from isopropanol. Distillate stream from this
column is discharged from the process as fuel. The second column is an azeotropic
distillation column, which separates water from isopropanol by using DMSO as an
extractive solvent. This column purifies the isopropanol product to have 99 wt% purity.
The last column is a water-DMSO distillation column, which separates water from solvent
in order to recycle water to the feed preparation section and DMSO to the azeotropic
distillation column. A flowsheet of the direct hydration process is shown in Figure 12 and
a stream table is presented in Table 16.
49
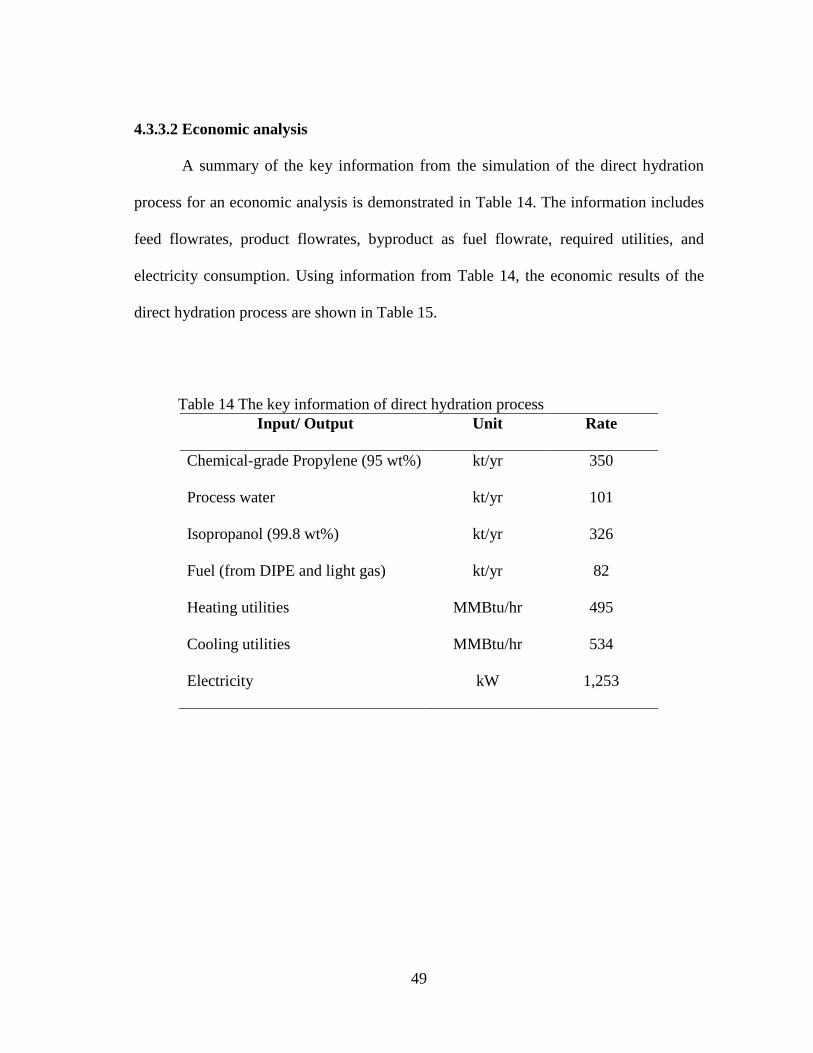
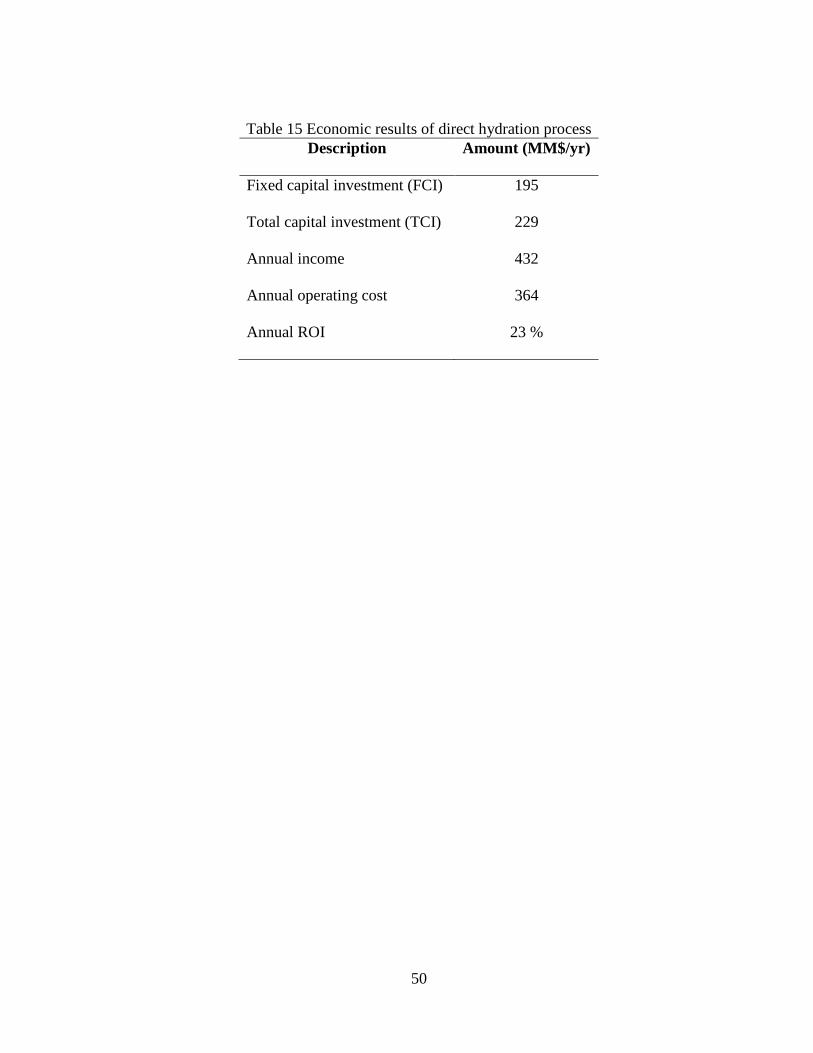
4.3.3.2 Economic analysis
A summary of the key information from the simulation of the direct hydration
process for an economic analysis is demonstrated in Table 14. The information includes
feed flowrates, product flowrates, byproduct as fuel flowrate, required utilities, and
electricity consumption. Using information from Table 14, the economic results of the
direct hydration process are shown in Table 15.
Table 14 The key information of direct hydration process
Input/ Output Unit Rate
Chemical-grade Propylene (95 wt%) kt/yr 350
Process water kt/yr 101
Isopropanol (99.8 wt%) kt/yr 326
Fuel (from DIPE and light gas) kt/yr 82
Heating utilities MMBtu/hr 495
Cooling utilities MMBtu/hr 534
Electricity kW 1,253
50
Table 15 Economic results of direct hydration process
Description Amount (MM$/yr)
Fixed capital investment (FCI) 195
Total capital investment (TCI) 229
Annual income 432
Annual operating cost 364
Annual ROI 23 %
51
Figure 12 A flowsheet of direct hydration process
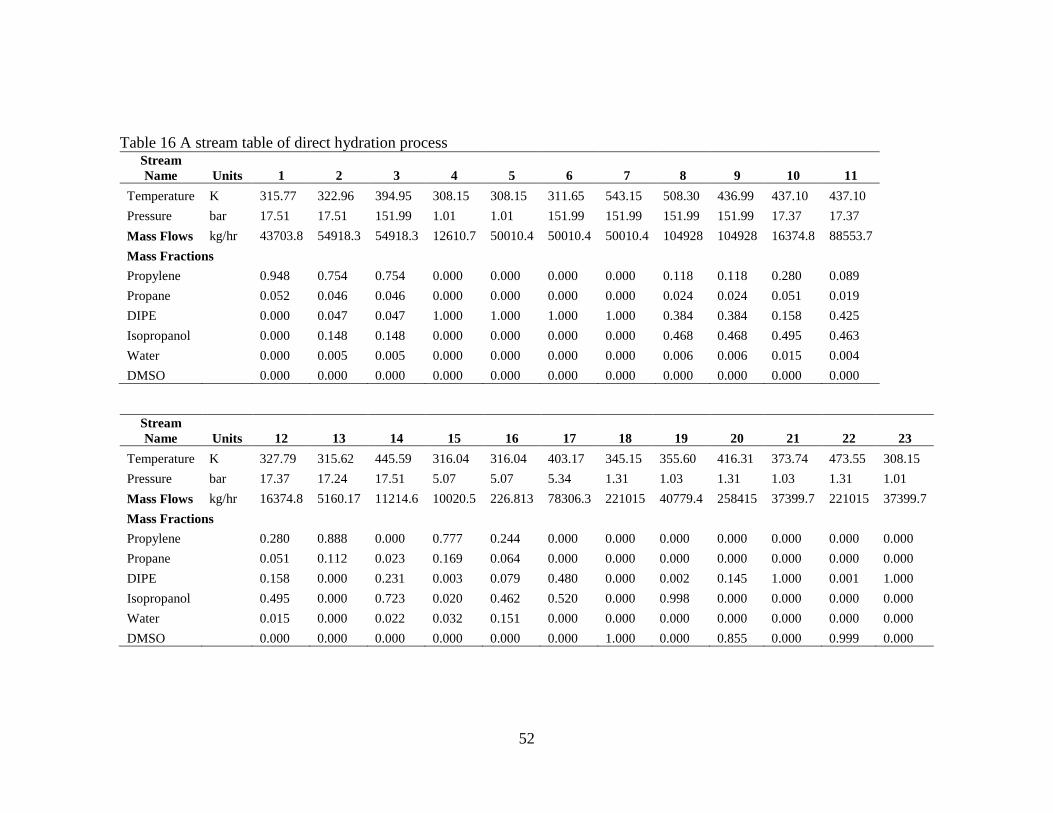
52
Table 16 A stream table of direct hydration process Stream
Name Units 1 2 3 4 5 6 7 8 9 10 11
Temperature K 315.77 322.96 394.95 308.15 308.15 311.65 543.15 508.30 436.99 437.10 437.10
Pressure bar 17.51 17.51 151.99 1.01 1.01 151.99 151.99 151.99 151.99 17.37 17.37
Mass Flows kg/hr 43703.8 54918.3 54918.3 12610.7 50010.4 50010.4 50010.4 104928 104928 16374.8 88553.7
Mass Fractions
Propylene 0.948 0.754 0.754 0.000 0.000 0.000 0.000 0.118 0.118 0.280 0.089
Propane 0.052 0.046 0.046 0.000 0.000 0.000 0.000 0.024 0.024 0.051 0.019
DIPE 0.000 0.047 0.047 1.000 1.000 1.000 1.000 0.384 0.384 0.158 0.425
Isopropanol 0.000 0.148 0.148 0.000 0.000 0.000 0.000 0.468 0.468 0.495 0.463
Water 0.000 0.005 0.005 0.000 0.000 0.000 0.000 0.006 0.006 0.015 0.004
DMSO 0.000 0.000 0.000 0.000 0.000 0.000 0.000 0.000 0.000 0.000 0.000
Stream
Name Units 12 13 14 15 16 17 18 19 20 21 22 23
Temperature K 327.79 315.62 445.59 316.04 316.04 403.17 345.15 355.60 416.31 373.74 473.55 308.15
Pressure bar 17.37 17.24 17.51 5.07 5.07 5.34 1.31 1.03 1.31 1.03 1.31 1.01
Mass Flows kg/hr 16374.8 5160.17 11214.6 10020.5 226.813 78306.3 221015 40779.4 258415 37399.7 221015 37399.7
Mass Fractions
Propylene 0.280 0.888 0.000 0.777 0.244 0.000 0.000 0.000 0.000 0.000 0.000 0.000
Propane 0.051 0.112 0.023 0.169 0.064 0.000 0.000 0.000 0.000 0.000 0.000 0.000
DIPE 0.158 0.000 0.231 0.003 0.079 0.480 0.000 0.002 0.145 1.000 0.001 1.000
Isopropanol 0.495 0.000 0.723 0.020 0.462 0.520 0.000 0.998 0.000 0.000 0.000 0.000
Water 0.015 0.000 0.022 0.032 0.151 0.000 0.000 0.000 0.000 0.000 0.000 0.000
DMSO 0.000 0.000 0.000 0.000 0.000 0.000 1.000 0.000 0.855 0.000 0.999 0.000
53
4.3.4 Acetone hydrogenation
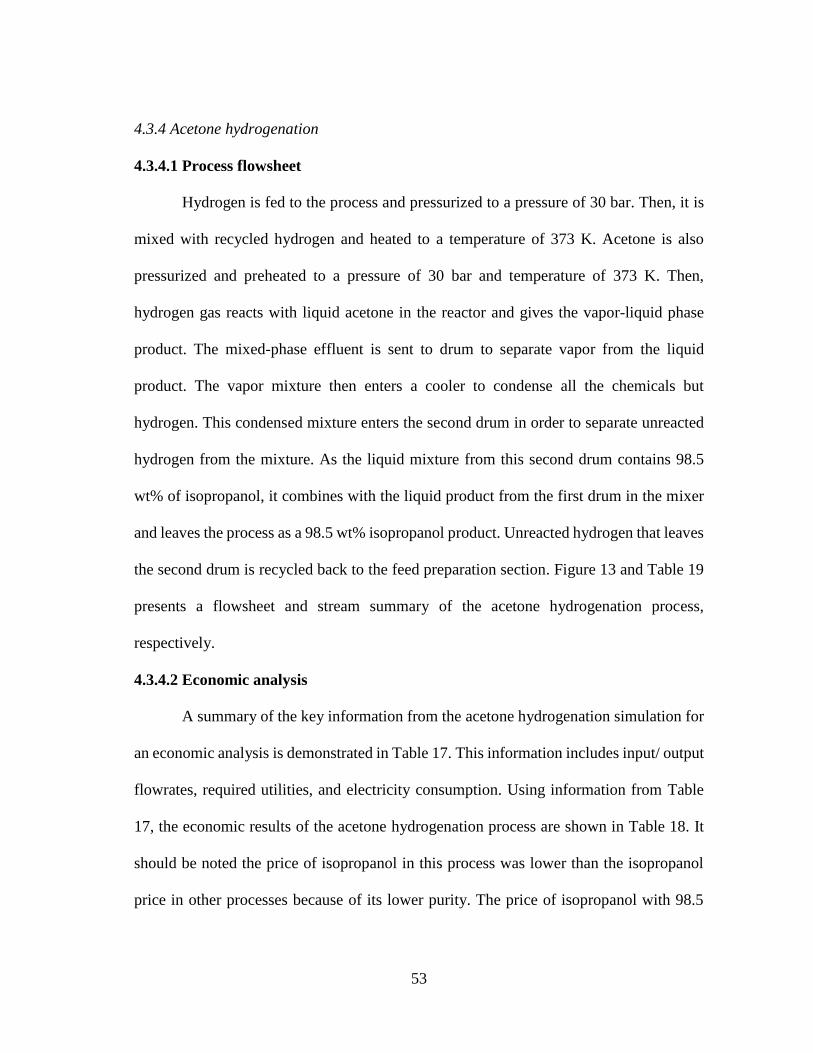
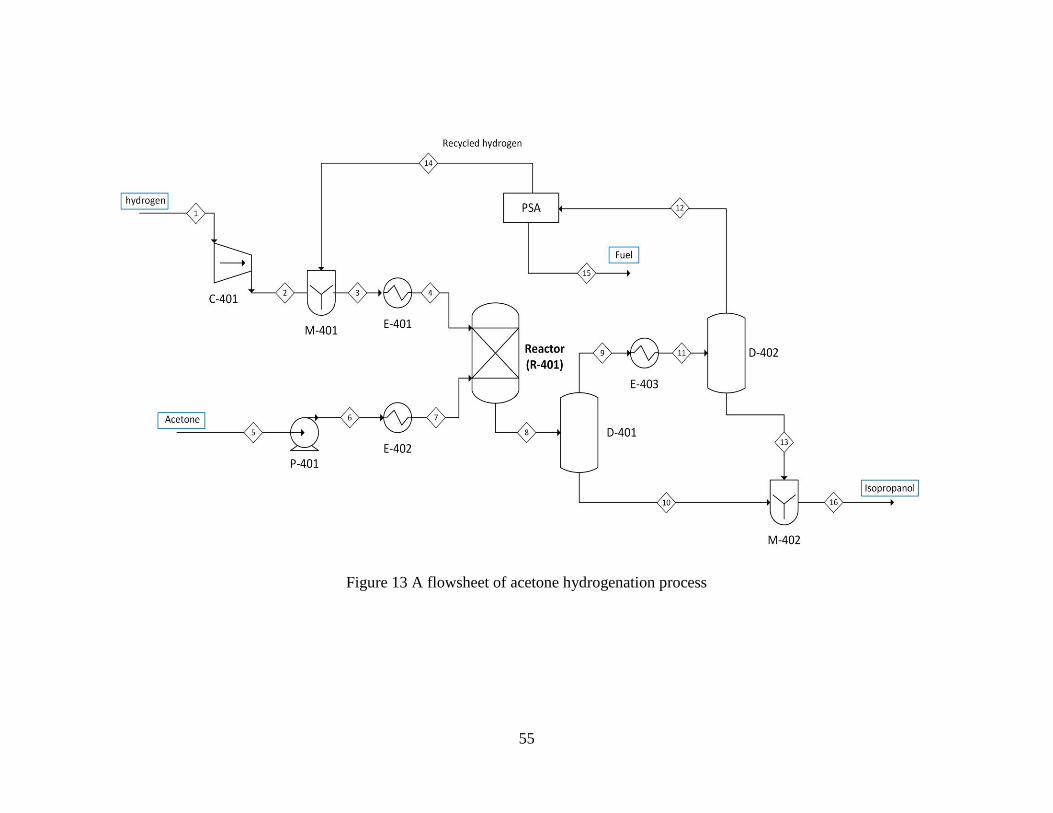
4.3.4.1 Process flowsheet
Hydrogen is fed to the process and pressurized to a pressure of 30 bar. Then, it is
mixed with recycled hydrogen and heated to a temperature of 373 K. Acetone is also
pressurized and preheated to a pressure of 30 bar and temperature of 373 K. Then,
hydrogen gas reacts with liquid acetone in the reactor and gives the vapor-liquid phase
product. The mixed-phase effluent is sent to drum to separate vapor from the liquid
product. The vapor mixture then enters a cooler to condense all the chemicals but
hydrogen. This condensed mixture enters the second drum in order to separate unreacted
hydrogen from the mixture. As the liquid mixture from this second drum contains 98.5
wt% of isopropanol, it combines with the liquid product from the first drum in the mixer
and leaves the process as a 98.5 wt% isopropanol product. Unreacted hydrogen that leaves
the second drum is recycled back to the feed preparation section. Figure 13 and Table 19
presents a flowsheet and stream summary of the acetone hydrogenation process,
respectively.
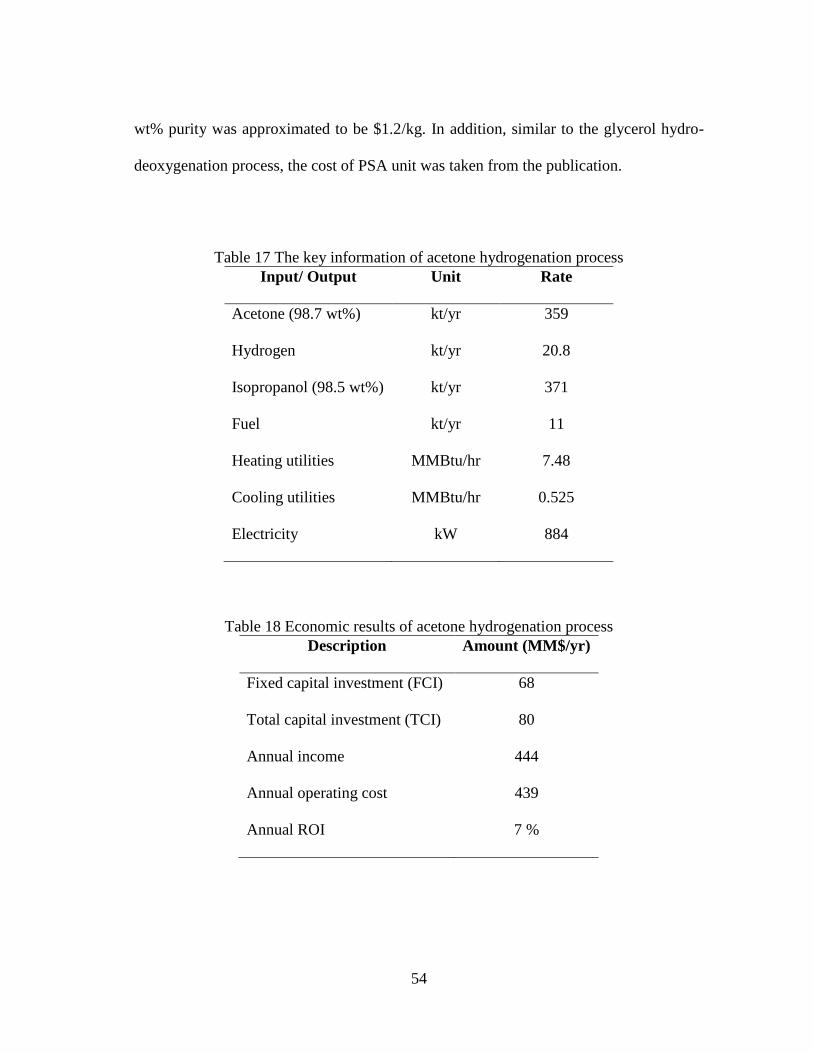
4.3.4.2 Economic analysis
A summary of the key information from the acetone hydrogenation simulation for
an economic analysis is demonstrated in Table 17. This information includes input/ output
flowrates, required utilities, and electricity consumption. Using information from Table
17, the economic results of the acetone hydrogenation process are shown in Table 18. It
should be noted the price of isopropanol in this process was lower than the isopropanol
price in other processes because of its lower purity. The price of isopropanol with 98.5
54
wt% purity was approximated to be $1.2/kg. In addition, similar to the glycerol hydro-
deoxygenation process, the cost of PSA unit was taken from the publication.
Table 17 The key information of acetone hydrogenation process
Input/ Output Unit Rate
Acetone (98.7 wt%) kt/yr 359
Hydrogen kt/yr 20.8
Isopropanol (98.5 wt%) kt/yr 371
Fuel kt/yr 11
Heating utilities MMBtu/hr 7.48
Cooling utilities MMBtu/hr 0.525
Electricity kW 884
Table 18 Economic results of acetone hydrogenation process
Description Amount (MM$/yr)
Fixed capital investment (FCI) 68
Total capital investment (TCI) 80
Annual income 444
Annual operating cost 439
Annual ROI 7 %
55
Figure 13 A flowsheet of acetone hydrogenation process
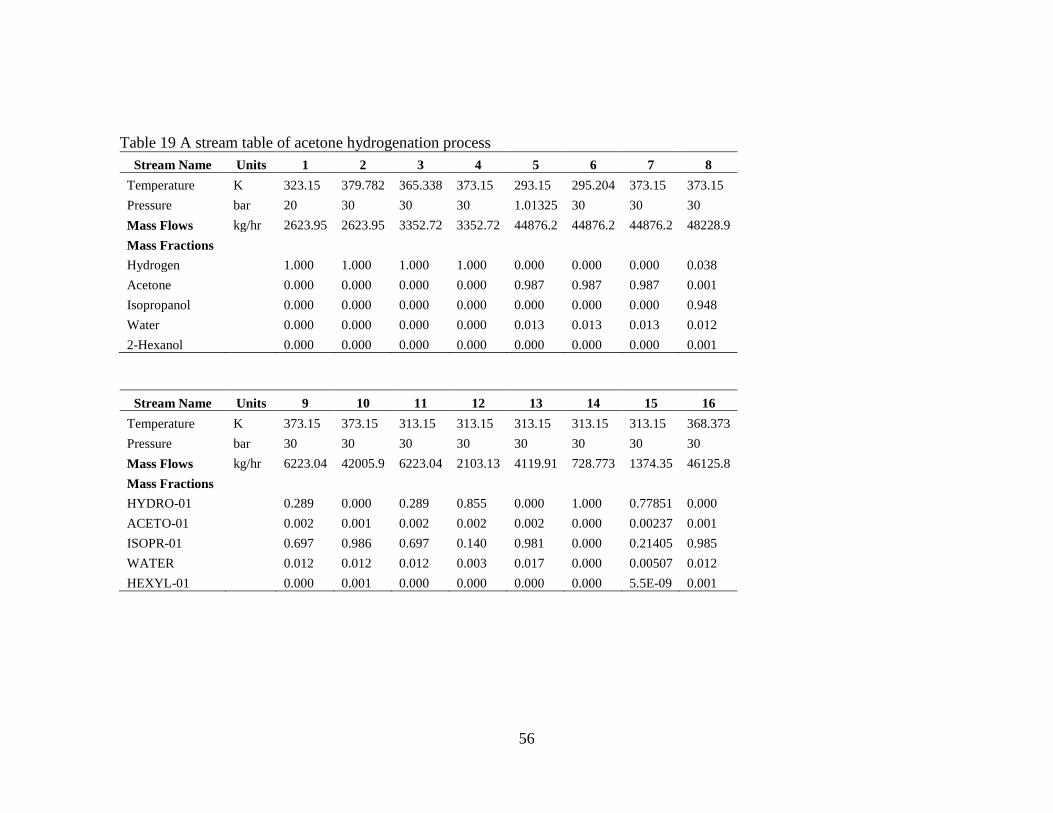
56
Table 19 A stream table of acetone hydrogenation process
Stream Name Units 1 2 3 4 5 6 7 8
Temperature K 323.15 379.782 365.338 373.15 293.15 295.204 373.15 373.15
Pressure bar 20 30 30 30 1.01325 30 30 30
Mass Flows kg/hr 2623.95 2623.95 3352.72 3352.72 44876.2 44876.2 44876.2 48228.9
Mass Fractions
Hydrogen 1.000 1.000 1.000 1.000 0.000 0.000 0.000 0.038
Acetone 0.000 0.000 0.000 0.000 0.987 0.987 0.987 0.001
Isopropanol 0.000 0.000 0.000 0.000 0.000 0.000 0.000 0.948
Water 0.000 0.000 0.000 0.000 0.013 0.013 0.013 0.012
2-Hexanol 0.000 0.000 0.000 0.000 0.000 0.000 0.000 0.001
Stream Name Units 9 10 11 12 13 14 15 16
Temperature K 373.15 373.15 313.15 313.15 313.15 313.15 313.15 368.373
Pressure bar 30 30 30 30 30 30 30 30
Mass Flows kg/hr 6223.04 42005.9 6223.04 2103.13 4119.91 728.773 1374.35 46125.8
Mass Fractions
HYDRO-01 0.289 0.000 0.289 0.855 0.000 1.000 0.77851 0.000
ACETO-01 0.002 0.001 0.002 0.002 0.002 0.000 0.00237 0.001
ISOPR-01 0.697 0.986 0.697 0.140 0.981 0.000 0.21405 0.985
WATER 0.012 0.012 0.012 0.003 0.017 0.000 0.00507 0.012
HEXYL-01 0.000 0.001 0.000 0.000 0.000 0.000 5.5E-09 0.001
57
4.4 Alternatives comparison for final selection
4.4.1 Final selection for propylene production
The viable pathways for propylene production from prescreening step included
hydro-deoxygenation from glycerol, propane dehydrogenation (PDH) from propane, and
Methanol to Olefins process (MTO) from propane. Regarding to Izadi, M’s publication, it
is stated that the PDH has more potential to be a profitable process than the MTO[22].
Therefore, the potential pathways after the prescreening step were PDH and glycerol
hydro-deoxygenation.
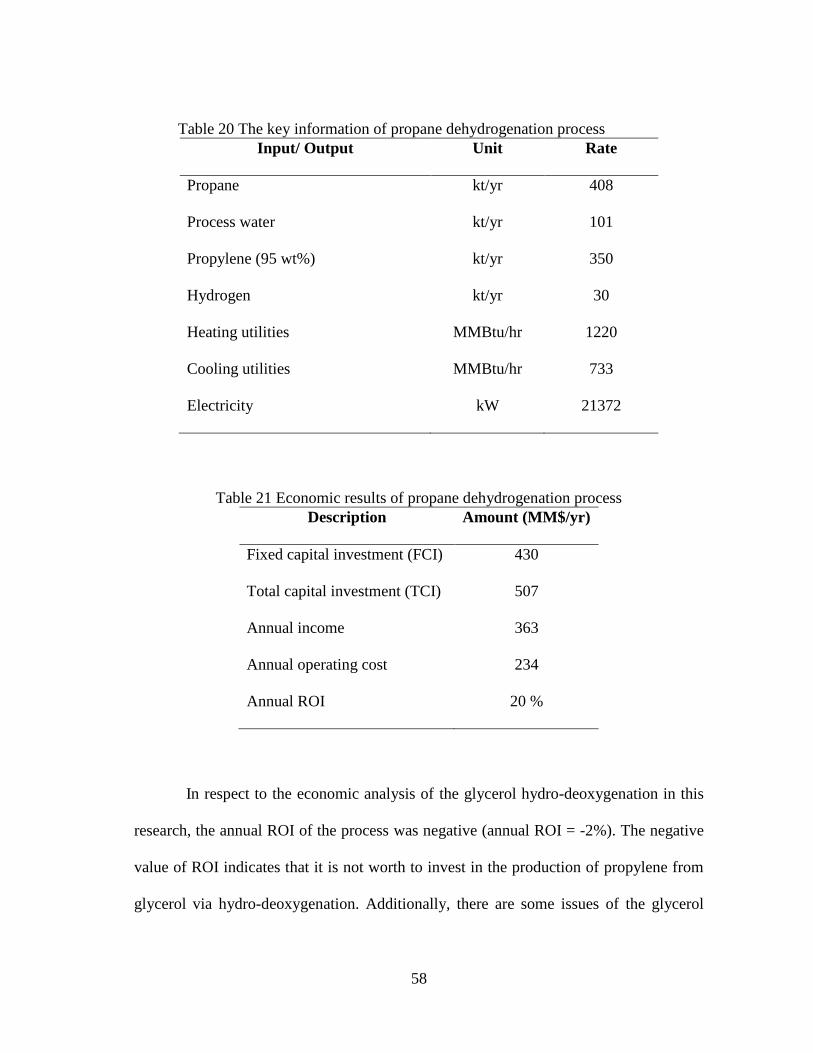
The economic analysis of the PDH process was adapted from Agarwal’s
publication[60]. Based on the calculation approach of this research, the annual ROI of the
base-case design of PDH process was equal to 20%. The key information for economic
evaluation of PDH process and its results are presented in Table 20 and Table 21,
respectively.
58
Table 20 The key information of propane dehydrogenation process
Input/ Output Unit Rate
Propane kt/yr 408
Process water kt/yr 101
Propylene (95 wt%) kt/yr 350
Hydrogen kt/yr 30
Heating utilities MMBtu/hr 1220
Cooling utilities MMBtu/hr 733
Electricity kW 21372
Table 21 Economic results of propane dehydrogenation process
Description Amount (MM$/yr)
Fixed capital investment (FCI) 430
Total capital investment (TCI) 507
Annual income 363
Annual operating cost 234
Annual ROI 20 %
In respect to the economic analysis of the glycerol hydro-deoxygenation in this
research, the annual ROI of the process was negative (annual ROI = -2%). The negative
value of ROI indicates that it is not worth to invest in the production of propylene from
glycerol via hydro-deoxygenation. Additionally, there are some issues of the glycerol
59
hydro-deoxygenation process. Firstly, the amount of available glycerol in Texas is limited
comparing to the amount of required glycerol for propylene production. Biodiesel
Magazine reported that the capacity of biodiesel production in Texas is about 395 MMgy
(Million gallon per year)[61]. Duque, J. also reported that 1 kg glycerol can be obtained
from every 10 kg biodiesel produced[58]. With these two information, it can be estimated
that the amount of availabile glycerol from bioidiesel plants in Texas is about 130
ktonnes/year. This number is not high enough to produce 350 ktonnes/year of propylene,
which is a propylene-plant nominal capacity in this research. Secondly, this process is still
in the experimental stage. There might be some changes in the reaction information and
safety issues for the full-scale plant design, which definitely affect the economic results.
Due to the reasons above, it can be concluded that the PDH is the best pathway for
propylene production.
Although the ROI result of the glycerol hydro-deoxygenation using propylene and
raw glycerol market prices is negative, the ROI of this process can be positive if the price
of raw glycerol decreases and the price of propylene increases. The sensitivity analysis of
hydro-deoxygenation from raw glycerol is shown in Figure 14. When propylene prices are
high (more than $1.1/kg), the process can be operate economically with the raw glycerol
prices ranging from $0.06/kg to $0.13/kg.
In order to compare the profitability of glycerol hydro-deoxygenation from raw
glycerol and from refined glycerol, the sensitivity analysis of the process from refined
glycerol was also performed. According to the sensitivity analysis shown in Figure 14, the
range of refined glycerol price for economically feasible scenario is between

60
$0.32-0.45/kg, depending on the propylene selling price. However, it should be realized
that the market price of purified glycerol is $0.85/kg and the market price of propylene is
in the range of $0.9-1.2/kg. This can be implied that the propylene production from refined
glycerol is hardly economically viable because the market price of refined glycerol is
about twice the highest feasible price of refined glycerol for the propylene market prices.
Therefore, it can be concluded that the propylene production from hydro-deoxygenation
of raw glycerol is preferable.
(a) (b)
Figure 14 Sensitivity analysis for the annual ROI of hydro-deoxygenation from raw
glycerol (a) and from purified glycerol (b)
4.4.2 Final selection of isopropanol production
According to the techno-economic analyses of indirect and direct hydration
processes, the difference of annual ROI values between these processes was about 13%.
While the ROI of the indirect hydration was equal to 36%, the ROI of the direct hydration
0
10
20
30
40
50
0.05 0.1 0.15 0.2 0.25
Annual
RO
I (p
erce
nt)
Price of raw glycerol ($/kg)
$1.1/kg
$1.3/kg
$1.5/kg
0
10
20
30
40
50
0.3 0.35 0.4 0.45 0.5
An
nual
RO
I (p
erce
nt)
Price of purified glycerol ($/kg)
$1.1/kg
$1.3/kg
$1.5/kg
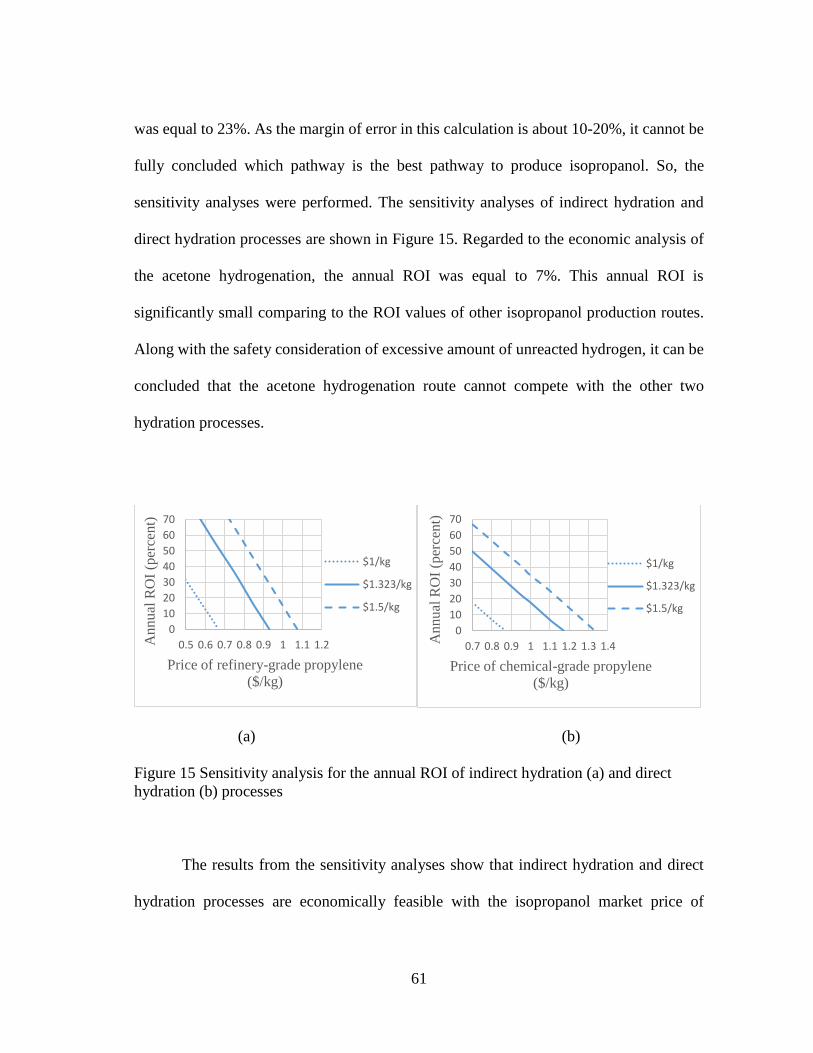
61
was equal to 23%. As the margin of error in this calculation is about 10-20%, it cannot be
fully concluded which pathway is the best pathway to produce isopropanol. So, the
sensitivity analyses were performed. The sensitivity analyses of indirect hydration and
direct hydration processes are shown in Figure 15. Regarded to the economic analysis of
the acetone hydrogenation, the annual ROI was equal to 7%. This annual ROI is
significantly small comparing to the ROI values of other isopropanol production routes.
Along with the safety consideration of excessive amount of unreacted hydrogen, it can be
concluded that the acetone hydrogenation route cannot compete with the other two
hydration processes.
(a) (b)
Figure 15 Sensitivity analysis for the annual ROI of indirect hydration (a) and direct
hydration (b) processes
The results from the sensitivity analyses show that indirect hydration and direct
hydration processes are economically feasible with the isopropanol market price of
0
10
20
30
40
50
60
70
0.5 0.6 0.7 0.8 0.9 1 1.1 1.2Annual
RO
I (p
erce
nt)
Price of refinery-grade propylene
($/kg)
$1/kg
$1.323/kg
$1.5/kg
0
10
20
30
40
50
60
70
0.7 0.8 0.9 1 1.1 1.2 1.3 1.4Annual
RO
I (p
erce
nt)
Price of chemical-grade propylene
($/kg)
$1/kg
$1.323/kg
$1.5/kg
62
$1.323/kg when the price of the refinery–grade propylene drops below $0.93/kg and the
price of the chemical-grade propylene drops below $1.17/kg, respectively. Additionally,
when the price of the refinery-grade propylene is reduced to a range of $0.61-1.03/kg, the
minimum acceptable level of ROI of the indirect hydration process is achieved. It is noted
that the price of propylene for the minimum acceptable level of ROI of the indirect
hydration process depends on the product selling price. Similarly, the minimum acceptable
level of ROI of the direct hydration process is reached when the price of the chemical-
grade propylene is decreased to a range of $0.77-1.24/kg for the different product selling
prices. It should be noted that the minimum acceptable level of the annual ROI in this
research was equal to 10%. Comparing the impacts of the propylene price to the ROI of
indirect hydration and direct hydration processes, the ROI of the direct hydration process
is less dependent on its raw material price than the ROI of the indirect hydration process.
Therefore, it can be concluded that the direct hydration process is the most attractive
method to produce isopropanol.
When considering the direct hydration method as the first candidate for
isopropanol production, it is interesting to look into sources of propylene feedstock and
make a decision for the most cost-effective approach. It should be noted that the propylene
can be obtained by purchasing or manufacturing from the PDH process. In order to make
a comparison, the annual ROI of each route was carried out. The annual ROI for the
purchasing scenario was taken from the annual ROI of the direct hydration process, which
was equal to 23%. For the manufacturing scenario, the annual ROI was calculated based
on the economic assessments of direct hydration and PDH processes. The annual ROI for
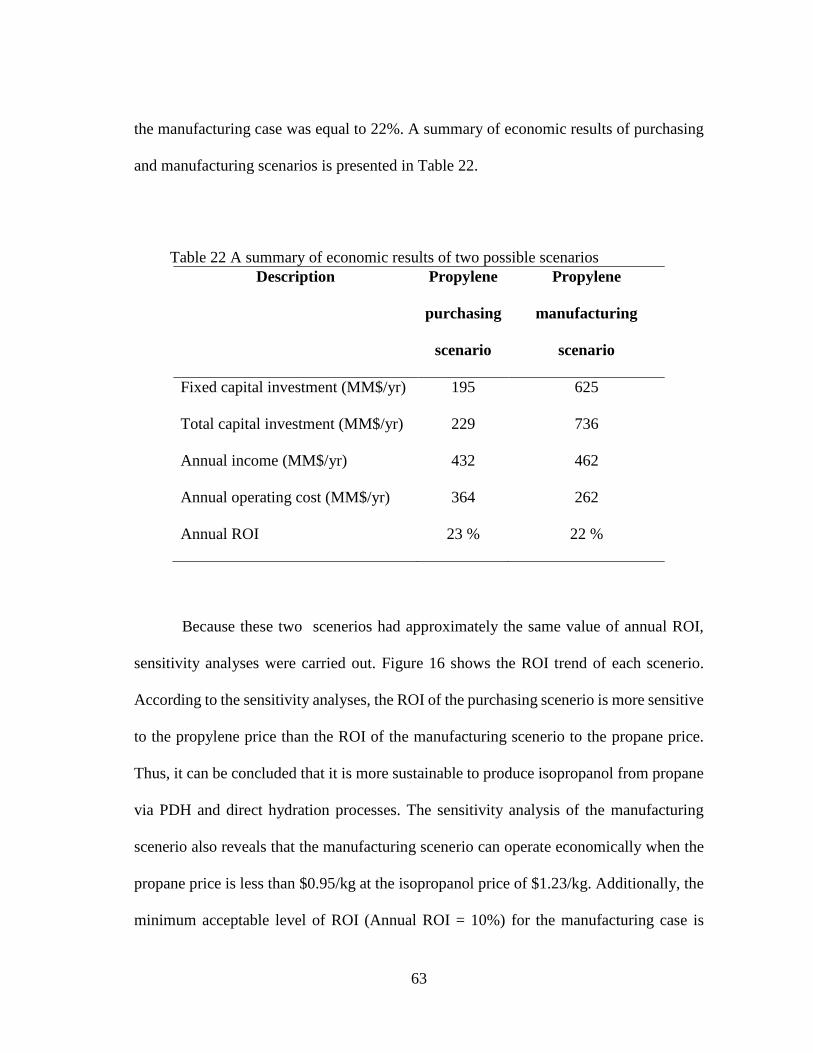
63
the manufacturing case was equal to 22%. A summary of economic results of purchasing
and manufacturing scenarios is presented in Table 22.
Table 22 A summary of economic results of two possible scenarios
Description Propylene
purchasing
scenario
Propylene
manufacturing
scenario
Fixed capital investment (MM$/yr) 195 625
Total capital investment (MM$/yr) 229 736
Annual income (MM$/yr) 432 462
Annual operating cost (MM$/yr) 364 262
Annual ROI 23 % 22 %
Because these two scenerios had approximately the same value of annual ROI,
sensitivity analyses were carried out. Figure 16 shows the ROI trend of each scenerio.
According to the sensitivity analyses, the ROI of the purchasing scenerio is more sensitive
to the propylene price than the ROI of the manufacturing scenerio to the propane price.
Thus, it can be concluded that it is more sustainable to produce isopropanol from propane
via PDH and direct hydration processes. The sensitivity analysis of the manufacturing
scenerio also reveals that the manufacturing scenerio can operate economically when the
propane price is less than $0.95/kg at the isopropanol price of $1.23/kg. Additionally, the
minimum acceptable level of ROI (Annual ROI = 10%) for the manufacturing case is
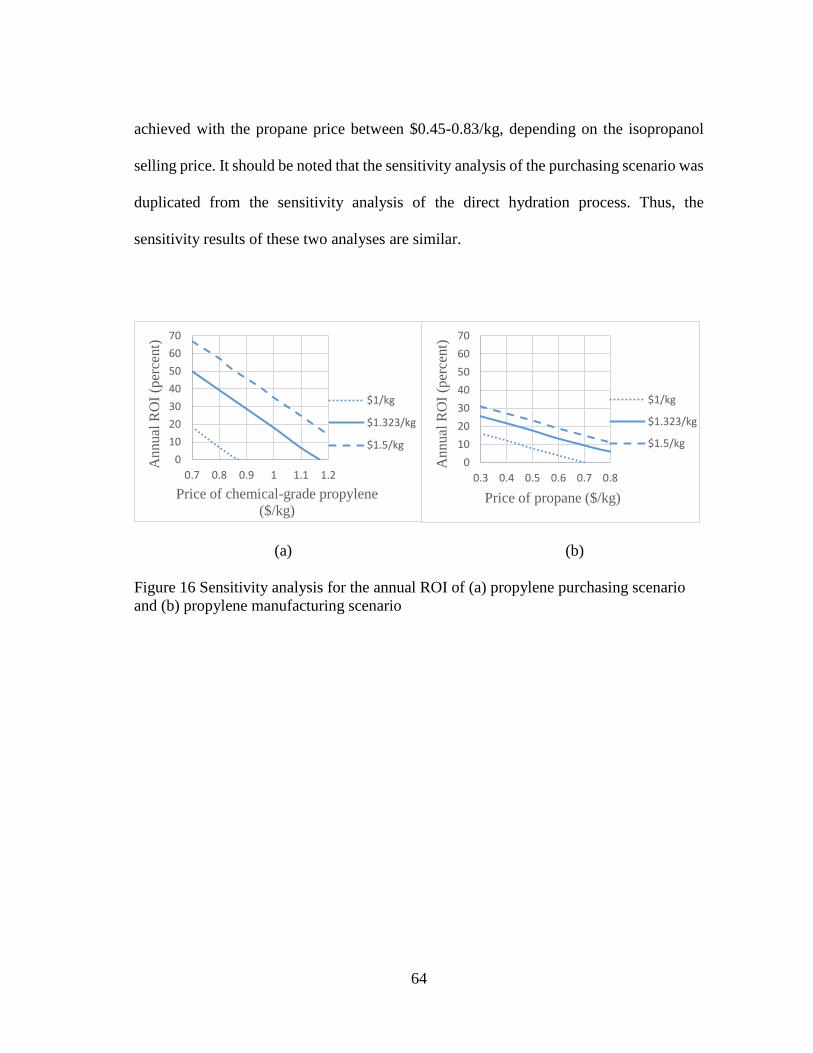
64
achieved with the propane price between $0.45-0.83/kg, depending on the isopropanol
selling price. It should be noted that the sensitivity analysis of the purchasing scenario was
duplicated from the sensitivity analysis of the direct hydration process. Thus, the
sensitivity results of these two analyses are similar.
(a) (b)
Figure 16 Sensitivity analysis for the annual ROI of (a) propylene purchasing scenario
and (b) propylene manufacturing scenario
0
10
20
30
40
50
60
70
0.7 0.8 0.9 1 1.1 1.2
Annual
RO
I (p
erce
nt)
Price of chemical-grade propylene
($/kg)
$1/kg
$1.323/kg
$1.5/kg
0
10
20
30
40
50
60
70
0.3 0.4 0.5 0.6 0.7 0.8
Annual
RO
I (p
erce
nt)
Price of propane ($/kg)
$1/kg
$1.323/kg
$1.5/kg
65
5. CONCLUSIONS
A superstructure of alternative pathways to produce isopropanol was created.
Routes in the superstructure include theoretical reactions, experimental processes, and
commercial processes. After unpromising routes were eliminated by using the MISR as
an indicator, a superstructure of viable alternatives was obtained. A techno-economic
analysis of the following processes was then performed: glycerol hydro-deoxygenation,
indirect hydration process, direct hydration process, and acetone hydrogenation process.
Economic results with annual ROI values were achieved to determine the most attractive
route in each production. The values of annual ROI of processes in this research are listed
as following: annual ROI of glycerol hydro-deoxygenation is -2%, annual ROI of propane
dehydrogenation is 20%, annual ROI of indirect hydration process is 36%, annual ROI of
direct hydration process is 23%, and annual ROI of acetone hydrogenation is 7%.
Regarding to the annual ROI results, it can be concluded that the glycerol hydro-
deoxygenation cannot outperform the propane dehydrogenation process for propylene
production, and the most promising pathway for isopropanol production is the direct
hydration process. Even though the annual ROI values of indirect hydration and direct
hydration processes do not have much difference, the direct hydration process is more
sustainable than the indirect hydration process because its annual ROI is less sensitive to
the price of propylene than the annual ROI of the indirect hydration. Additionally, the
direct hydration method is preferable when considering corrosion and environmental
problems, which are two main problems in the indirect hydration process.
66
The techno-economic assessments in this research were based from base-case
scenarios. Heat integration has not been considered yet. If the integration was included in
the analysis, the processes would benefit from savings in cost of utilities and electricity.
Therefore, further research could be conducted to improve the potential profitability of the
processes.
67
REFERENCES
1. Baumeister, C. and L. Kilian, Forty years of oil price fluctuations: Why the price
of oil may still surprise us. 2015, CFS Working Paper Series.
2. Administration, U.S.E.I. Natural Gas. Henry Hub Natural Gas Spot Price 2017;
Available from: https://www.eia.gov/dnav/ng/hist/rngwhhdm.htm.
3. Bell, A.T., et al., The Changing Landscape of Hydrocarbon Feedstocks for
Chemical Production: Implications for Catalysis: Proceedings of a Workshop.
2016, National Academies of Sciences, Engineering, and Medicine, Washington,
DC (United States).
4. Bruijnincx, P.C. and B.M. Weckhuysen, Shale gas revolution: an opportunity for
the production of biobased chemicals? Angewandte Chemie International
Edition, 2013. 52(46): p. 11980-11987.
5. Haveren, J.v., E.L. Scott, and J. Sanders, Bulk chemicals from biomass. Biofuels,
Bioproducts and Biorefining, 2008. 2(1): p. 41-57.
6. Al-Douri, A., D. Sengupta, and M. El-Halwagi, Shale gas monetization–A review
of downstream processing to chemicals and fuels. Journal of Natural Gas Science
and Engineering, 2017.
7. Dang, T., Propylene, in ICIS Chemical Business. 2016. p. 46.
8. Yanelli, A., Isopropanol, in ICIS Chemical Business. 2016. p. 34.
9. Isopropanol. 2016.
10. Isopropyl Alcohol (IPA). 2015, IHS Markit.
11. Isopropanol. 2014, Pesticide Research Institute for the USDA National Organic
Program. p. 3.
12. Logsdon, J.E. and R.A. Loke, Isopropyl alcohol. Kirk-Othmer encyclopedia of
chemical technology, 2000.
13. Papa, A.J., Propanols. Ullmann's Encyclopedia of Industrial Chemistry, 2011.
14. Dutia, P., Isopropyl alcohol: A techno-commercial profile. Website: http://www.
chemicalweekly. com/Profiles/Isopropyl_Alcohol. pdf (Access Date: May 5,
2016), 2012.
68
15. Morizane, K., et al., Process for producing 2-propanol. 2012, Google Patents.
16. Global Isopropanol Market Research Report. MicroMarketMonitor.
17. Yanelli, A., US MEK, IPA hit multi-year lows, in ICIS Chemical Business 2016.
p. 13.
18. Propanol (Isopropanol & N-Propanol) Market By Applications (Solvents,
Chemical Intermediates, Pharmaceuticals & Others) & Geography - Trends And
Forecasts To 2018. 2013, marketsandmarkets.com.
19. El-Halwagi, M.M., Sustainable design through process integration:
fundamentals and applications to industrial pollution prevention, resource
conservation, and profitability enhancement. 2017: Butterworth-Heinemann.
20. Towler, G. and R.K. Sinnott, Chemical engineering design: principles, practice
and economics of plant and process design. 2012: Elsevier.
21. Mussatti, D.C., et al., EPA air pollution control cost manual. Air Quality
Strategies and Standards Division of the Office of Air Quality Planning and
Standards, US Environmental Protection Agency, Research Triangle Park, NC,
2002. 27711.
22. Izadi, M. A Comparative Evaluation Of On Purpose Propylene Production
Schemes. in 20th World Petroleum Congress. 2011. World Petroleum Congress.
23. Liu, K., et al., Continuous syngas fermentation for the production of ethanol, n-
propanol and n-butanol. Bioresource technology, 2014. 151: p. 69-77.
24. Fang, K., et al., A short review of heterogeneous catalytic process for mixed
alcohols synthesis via syngas. Catalysis Today, 2009. 147(2): p. 133-138.
25. Sotelo-Boyás, R., F. Trejo-Zárraga, and F. de Jesús Hernández-Loyo,
Hydroconversion of triglycerides into green liquid fuels, in Hydrogenation. 2012,
InTech.
26. Tan, H., A.A. Aziz, and M. Aroua, Glycerol production and its applications as a
raw material: A review. Renewable and Sustainable Energy Reviews, 2013. 27:
p. 118-127.
27. Bao, B., et al., A shortcut method for the preliminary synthesis of process-
technology pathways: An optimization approach and application for the
conceptual design of integrated biorefineries. Computers & Chemical
Engineering, 2011. 35(8): p. 1374-1383.
69
28. Noureldin, M.M., N.O. Elbashir, and M.M. El-Halwagi, Optimization and
selection of reforming approaches for syngas generation from natural/shale gas.
Industrial & Engineering Chemistry Research, 2013. 53(5): p. 1841-1855.
29. Saeed, A., et al., Mass balances of components dissolved in the pre-hydrolysis
liquor of kraft-based dissolving pulp production process from Canadian
hardwoods. Biomass and Bioenergy, 2012. 39: p. 14-19.
30. Zhou, C.-H.C., et al., Chemoselective catalytic conversion of glycerol as a
biorenewable source to valuable commodity chemicals. Chemical Society
Reviews, 2008. 37(3): p. 527-549.
31. Porsin, A., et al., Acetylene synthesis by methane pyrolysis on a tungsten wire.
Theoretical Foundations of Chemical Engineering, 2014. 48(4): p. 397-403.
32. Walther, T. and J.M. François, Microbial production of propanol. Biotechnology
advances, 2016. 34(5): p. 984-996.
33. Yoneda, N., et al., Recent advances in processes and catalysts for the production
of acetic acid. Applied Catalysis A: General, 2001. 221(1-2): p. 253-265.
34. Soma, Y., et al., Direct isopropanol production from cellobiose by engineered
Escherichia coli using a synthetic pathway and a cell surface display system.
Journal of bioscience and bioengineering, 2012. 114(1): p. 80-85.
35. Wang, K.X., et al., Acetic acid synthesis from methane by non-synthesis gas
process. Journal of Molecular Catalysis A: Chemical, 2005. 225(1): p. 65-69.
36. Weber, M., et al., Acetone. Ullmann's Encyclopedia of Industrial Chemistry,
2014.
37. Ren, T., M.K. Patel, and K. Blok, Steam cracking and methane to olefins: Energy
use, CO2 emissions and production costs. Energy, 2008. 33(5): p. 817-833.
38. Jin, F. and H. Enomoto, Rapid and highly selective conversion of biomass into
value-added products in hydrothermal conditions: chemistry of acid/base-
catalysed and oxidation reactions. Energy & Environmental Science, 2011. 4(2):
p. 382-397.
39. Zacharopoulou, V., E.S. Vasiliadou, and A.A. Lemonidou, One-step propylene
formation from bio-glycerol over molybdena-based catalysts. Green Chemistry,
2015. 17(2): p. 903-912.
40. Geddes, C.C., I.U. Nieves, and L.O. Ingram, Advances in ethanol production.
Current opinion in biotechnology, 2011. 22(3): p. 312-319.
70
41. Yu, L., et al., Propylene from renewable resources: catalytic conversion of
glycerol into propylene. ChemSusChem, 2014. 7(3): p. 743-747.
42. Stein, Y.S., M.J. Antal Jr, and M. Jones jr, A study of the gas-phase pyrolysis of
glycerol. Journal of Analytical and Applied Pyrolysis, 1983. 4(4): p. 283-296.
43. Choudhary, T., et al., Acetylene hydrogenation on Au-based catalysts. Catalysis
letters, 2003. 86(1-3): p. 1-8.
44. Quispe, C.A., C.J. Coronado, and J.A. Carvalho Jr, Glycerol: production,
consumption, prices, characterization and new trends in combustion. Renewable
and Sustainable Energy Reviews, 2013. 27: p. 475-493.
45. Eckert, M., et al., Acetaldehyde. Ullmann’s encyclopedia of industrial chemistry.
2006, Wiley-VCH.
46. Mohsenzadeh, A., A. Zamani, and M.J. Taherzadeh, Bioethylene Production
from Ethanol: A Review and Techno‐economical Evaluation. ChemBioEng
Reviews, 2017.
47. Christensen, C.H., et al., Formation of Acetic Acid by Aqueous‐Phase Oxidation
of Ethanol with Air in the Presence of a Heterogeneous Gold Catalyst.
Angewandte Chemie International Edition, 2006. 45(28): p. 4648-4651.
48. Pham, T.N., et al., Aqueous-phase ketonization of acetic acid over
Ru/TiO2/carbon catalysts. Journal of catalysis, 2012. 295: p. 169-178.
49. Raja, R., C.R. Jacob, and P. Ratnasamy, Direct oxidation of propane to
isopropanol. Catalysis today, 1999. 49(1-3): p. 171-175.
50. Tang, Y.T., et al., Design of reactive distillations for acetic acid esterification.
AIChE Journal, 2005. 51(6): p. 1683-1699.
51. Wolf, D., et al., Oxidative dehydrogenation of propane for propylene
production—comparison of catalytic processes. Chemical Engineering Science,
2001. 56(2): p. 713-719.
52. Jasper, S. and M.M. El-Halwagi, A techno-economic comparison between two
methanol-to-propylene processes. Processes, 2015. 3(3): p. 684-698.
53. Qiu, T., et al., Novel procedure for production of isopropanol by
transesterification of isopropyl acetate with reactive distillation. Industrial &
Engineering Chemistry Research, 2014. 53(36): p. 13881-13891.
71
54. Sundmacher, K., A. Kienle, and A. Seidel-Morgenstern, Integrated Chemical
Processes: Synthesis, Operation, Analysis and Control. 2006: John Wiley &
Sons.
55. Julian-Duran, L.M., et al., Techno-economic assessment and environmental
impact of shale gas alternatives to methanol. ACS Sustainable Chemistry &
Engineering, 2014. 2(10): p. 2338-2344.
56. Rodriguez, B.A., et al., The production of propionic acid, propanol and
propylene via sugar fermentation: an industrial perspective on the progress,
technical challenges and future outlook. Green Chemistry, 2014. 16(3): p. 1066-
1076.
57. Ciriminna, R., et al., Understanding the glycerol market. European journal of
lipid science and technology, 2014. 116(10): p. 1432-1439.
58. Duque, J., Design and analysis of technological schemes for glycerol conversion
to added value products. Diss. Universidad Nacional De Colombia, 2011.
59. Joanna Benson, A.C., Recovering Hydrogen and Profits Hydrogen-Rich Offgas,
in CEP. 2018. p. 55-59.
60. Agarwal, A., D. Sengupta, and M.M. El-Halwagi, A Sustainable Process Design
Approach for On-Purpose Propylene Production and Intensification. ACS
Sustainable Chemistry & Engineering, 2017.
61. International, B. U.S. Biodiesel Plants. 2018 December 13, 2017; Available
from: http://www.biodieselmagazine.com/plants/listplants/USA/.
62. Sulfuric acid. Available from:
https://www.osha.gov/dts/chemicalsampling/data/CH_268700.html.
63. Woods, D.R., Rules of thumb in engineering practice. 2007: John Wiley & Sons.
64. HEC, L., Pumped Carbon Mining (PCM) Substitute Natural Gas (SNG)
Production Cost Estimate. 2004.
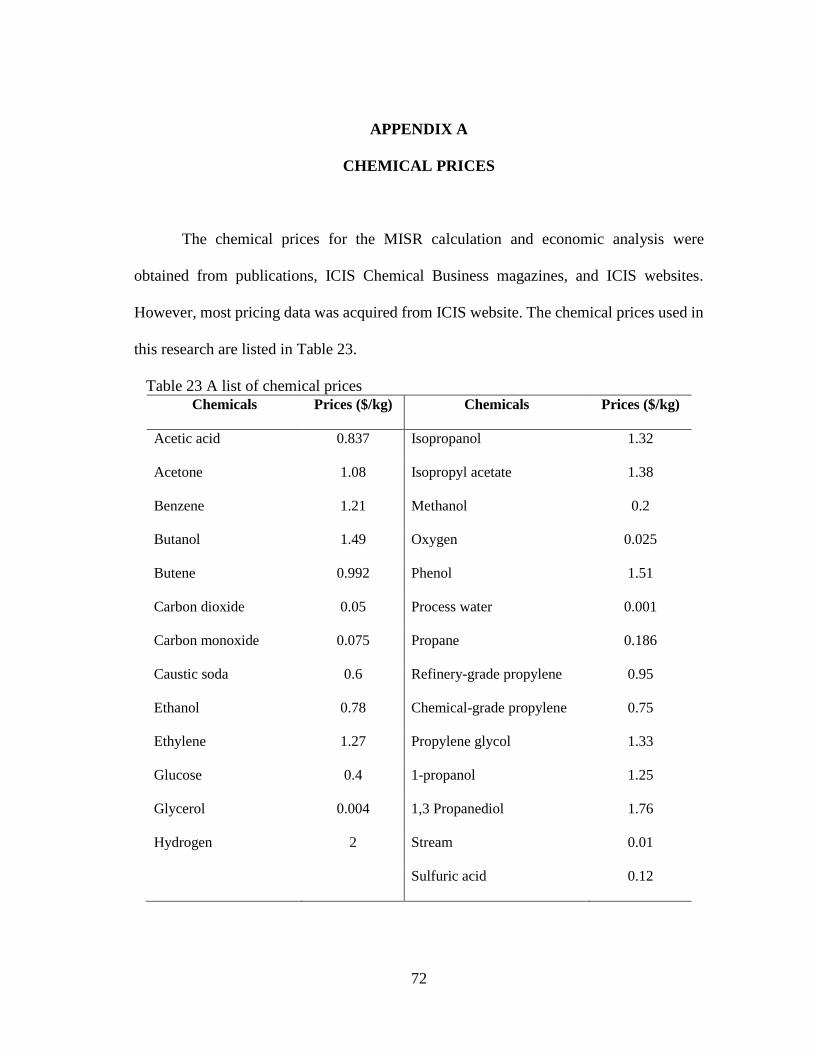
72
APPENDIX A
CHEMICAL PRICES
The chemical prices for the MISR calculation and economic analysis were
obtained from publications, ICIS Chemical Business magazines, and ICIS websites.
However, most pricing data was acquired from ICIS website. The chemical prices used in
this research are listed in Table 23.
Table 23 A list of chemical prices
Chemicals Prices ($/kg) Chemicals Prices ($/kg)
Acetic acid 0.837 Isopropanol 1.32
Acetone 1.08 Isopropyl acetate 1.38
Benzene 1.21 Methanol 0.2
Butanol 1.49 Oxygen 0.025
Butene 0.992 Phenol 1.51
Carbon dioxide 0.05 Process water 0.001
Carbon monoxide 0.075 Propane 0.186
Caustic soda 0.6 Refinery-grade propylene 0.95
Ethanol 0.78 Chemical-grade propylene 0.75
Ethylene 1.27 Propylene glycol 1.33
Glucose 0.4 1-propanol 1.25
Glycerol 0.004 1,3 Propanediol 1.76
Hydrogen 2 Stream 0.01
Sulfuric acid 0.12
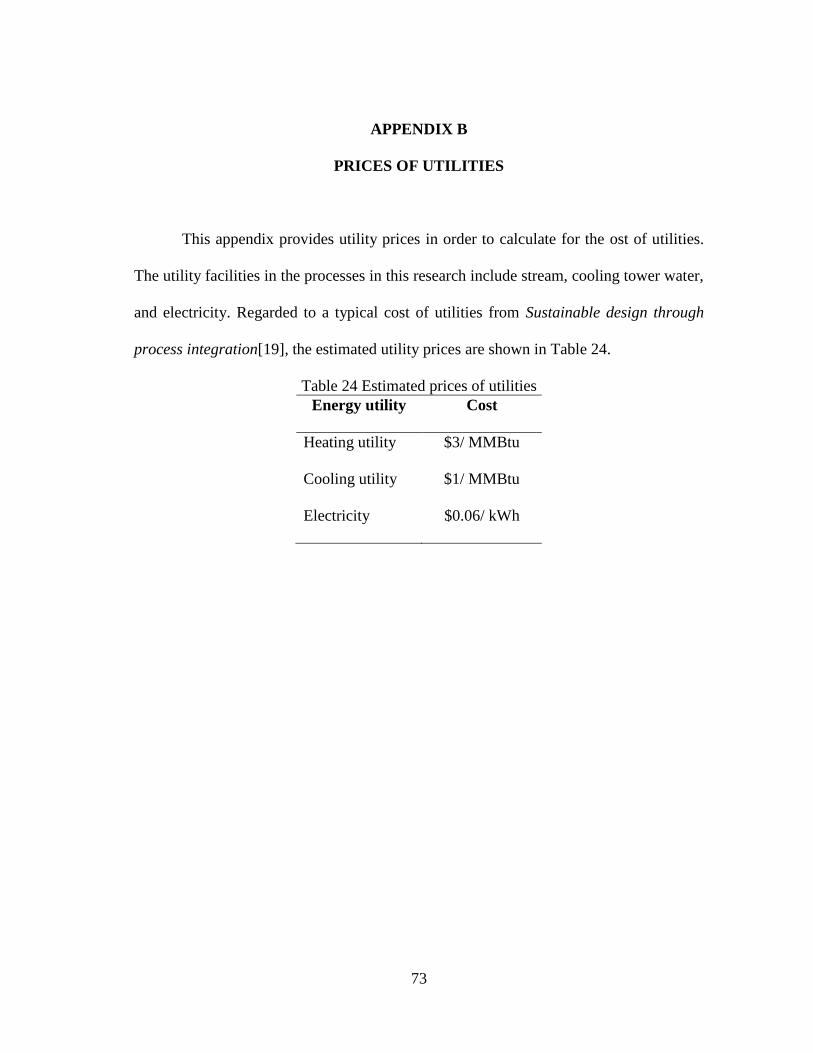
73
APPENDIX B
PRICES OF UTILITIES
This appendix provides utility prices in order to calculate for the ost of utilities.
The utility facilities in the processes in this research include stream, cooling tower water,
and electricity. Regarded to a typical cost of utilities from Sustainable design through
process integration[19], the estimated utility prices are shown in Table 24.
Table 24 Estimated prices of utilities
Energy utility Cost
Heating utility $3/ MMBtu
Cooling utility $1/ MMBtu
Electricity $0.06/ kWh
74
APPENDIX C
ECONOMIC CALCULATION
In order to perform an economic assessment, a total capital investment and an
operating cost were determined. This appendix explains how to estimate these expenses.
This appendix is divided into three sections for a better understanding. The first section
provides the information and calculation of pollution control expenses. The second and
third section describe the calculation of total capital investment and operating cost,
respectively.
1. Cost of pollution control
Due to the environmental concern in this research, an environmental expense
should be added to the cost estimation of the process that released unpleasant chemicals
to the environment. Because the environmental expense can be added to either fixed
capital investment (FCI) or operating cost, it is easier to discuss about environmental
expense before going into these cost estimations in detail. Looking through the simulated
processes, the only process that requires an environmental treatment is the indirect
hydration process. Therefore, the cost of pollution control discussed in this section is based
on the chemicals released from the indirect hydration process.
According to the indirect hydration process, the required treatments were sulfuric
acid-containing gas treatment, spent soda, and wastewater treatment. The sulfuric acid-
containing gases included the spent gas discharged from absorber and vent gas discharged
from drum. It should be noted that it was assumed that there was a trace of sulfuric acid
75
in vent gas even though the sulfuric acid did not appear in the vent stream in the simulation
result. Because the sulfuric concentration in these released gases went beyond the
concentration limit from OSHA, the treatment was necessary. It is noted that OSHA limits
the maximum sulfuric acid concentration in general industry to be 1 mg/m3 TWA[62]. A
wet electrostatic precipitator (wet ESP) was selected as the most appropriate equipment
for collecting the sulfuric acid mist. Additionally, this research assumed that the spent
soda and wastewater were similarly treated by wastewater treatment. Cost estimations of
each treatment are shown below.
1.1 Sulfuric acid-containing gas treatment
As it is previously mentioned that the wet ESP was used to collect the sulfuric acid
mist, the economic assessment of wet ESP is shown here. The cost of wet ESP included
ESP equipment cost, cost of clean water consumption, and wastewater treatment cost.
While the ESP purchased equipment cost was added to the FCI, the cost of clean water
and wastewater treatment were included in the operating cost.
For the cost estimation of ESP equipment, according to EPA Air Pollution Control
Cost Manual, the purchased equipment cost of wet ESP with 95% efficiency is estimated
to be $36.5/in acfm of contaminated gas[21]. The utility information associated with this
wet ESP were also obtained from EPA Air Pollution Control Cost Manual. The amount
of clean water required in this wet ESP is estimated to be 5 gal/min kacfm of contaminated
gas. The cost of wastewater treatment from the wet ESP is equal to $0.002/gallon[21]. The
key information and calculation results of the sulfuric acid-containing gas treatment in
spent gas and vent gas streams are shown in Table 25.
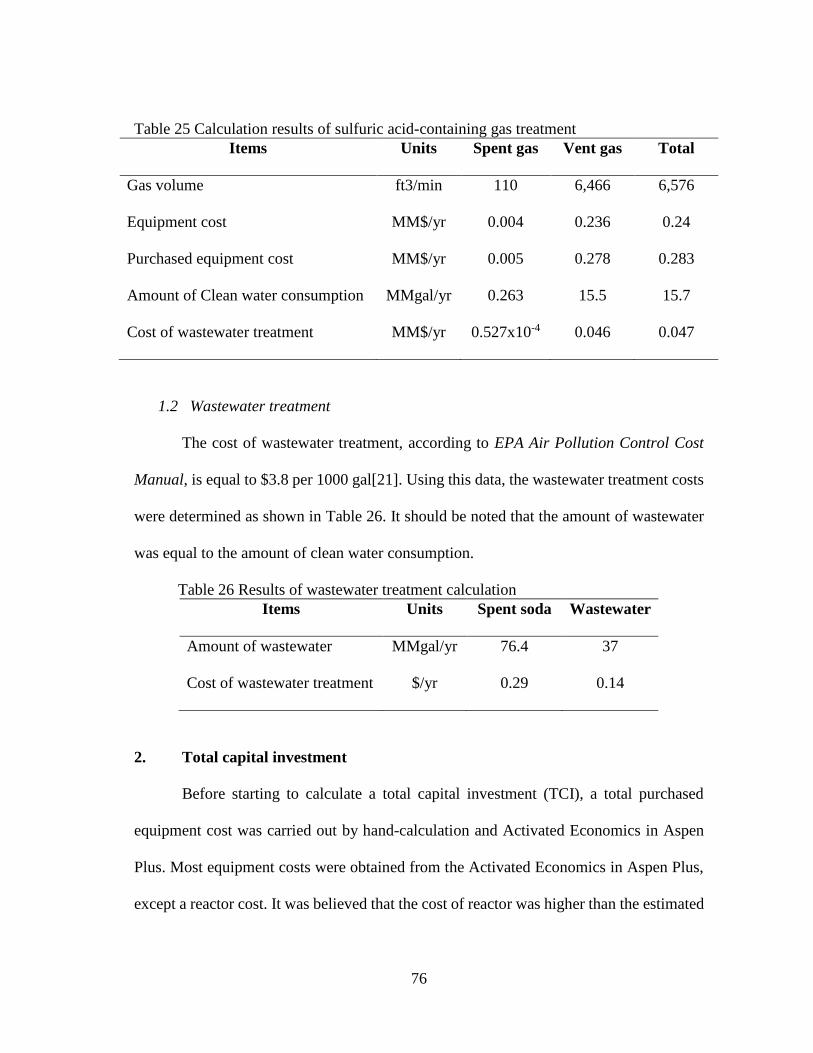
76
Table 25 Calculation results of sulfuric acid-containing gas treatment
Items Units Spent gas Vent gas Total
Gas volume ft3/min 110 6,466 6,576
Equipment cost MM$/yr 0.004 0.236 0.24
Purchased equipment cost MM$/yr 0.005 0.278 0.283
Amount of Clean water consumption MMgal/yr 0.263 15.5 15.7
Cost of wastewater treatment MM$/yr 0.527x10⁻⁴ 0.046 0.047
1.2 Wastewater treatment
The cost of wastewater treatment, according to EPA Air Pollution Control Cost
Manual, is equal to $3.8 per 1000 gal[21]. Using this data, the wastewater treatment costs
were determined as shown in Table 26. It should be noted that the amount of wastewater
was equal to the amount of clean water consumption.
Table 26 Results of wastewater treatment calculation
Items Units Spent soda Wastewater
Amount of wastewater MMgal/yr 76.4 37
Cost of wastewater treatment $/yr 0.29 0.14
2. Total capital investment
Before starting to calculate a total capital investment (TCI), a total purchased
equipment cost was carried out by hand-calculation and Activated Economics in Aspen
Plus. Most equipment costs were obtained from the Activated Economics in Aspen Plus,
except a reactor cost. It was believed that the cost of reactor was higher than the estimated
77
cost from Aspen Plus. Therefore, the costs of reactor in each process were estimated
according to the guidelines in Rules of thumb in engineering practice[63]. Besides the
reactor cost, the costs of additional units including glycerol purification unit, PSA unit,
and wet ESP, were calculated by hand. The total purchased equipment cost of wet EPS
was acquired from the results in Table 25. The FCI values of glycerol purification unit and
PSA unit were determined by applying the ‘Capacity ratio with exponent’ approach to
numerical data from Duque, J’s report [58] and HEC, L’s report[64]. All of the economic
results should be updated to the present cost by using the cost indices.
The ‘Capacity ratio with exponent’ is defined as [19]:
𝐹𝐶𝐼𝐵 = 𝐹𝐶𝐼𝐴(𝐶𝑎𝑝𝑎𝑐𝑖𝑡𝑦𝐵
𝐶𝑎𝑝𝑎𝑐𝑖𝑡𝑦𝐴)𝑥
Where 𝐹𝐶𝐼𝐵 and 𝐹𝐶𝐼𝐴 are the fixed capital investments of plant B and plant A. 𝐶𝑎𝑝𝑎𝑐𝑖𝑡𝑦𝐵
𝐶𝑎𝑝𝑎𝑐𝑖𝑡𝑦𝐴 are the capacities of plant B and plant A. The exponent 𝑥 was assumed to be
0.6 (sixth-tenths-factor rule).
The ‘cost indices’ is defined as [19]:
𝐹𝑂𝐵𝑡2 = 𝐹𝑂𝐵𝑡1(𝐶𝑜𝑠𝑡 𝑖𝑛𝑑𝑒𝑥 𝑎𝑡 𝑡1
𝐶𝑜𝑠𝑡 𝑖𝑛𝑑𝑒𝑥 𝑎𝑡 𝑡2)
Where 𝐹𝑂𝐵𝑡2 and 𝐹𝑂𝐵𝑡1 are the purchased equipment costs at times t2 and t1,
respectively.
According to Sustainable design through process integration[19], the fixed capital
cost (FCI) is estimated to be five times of the total purchased equipment cost. In addition,
this research estimated the working capital (WCI) to be 15% of TCI. Therefore, the value
of TCI was calculated by divided FCI by 0.85. The key information and results of TCI
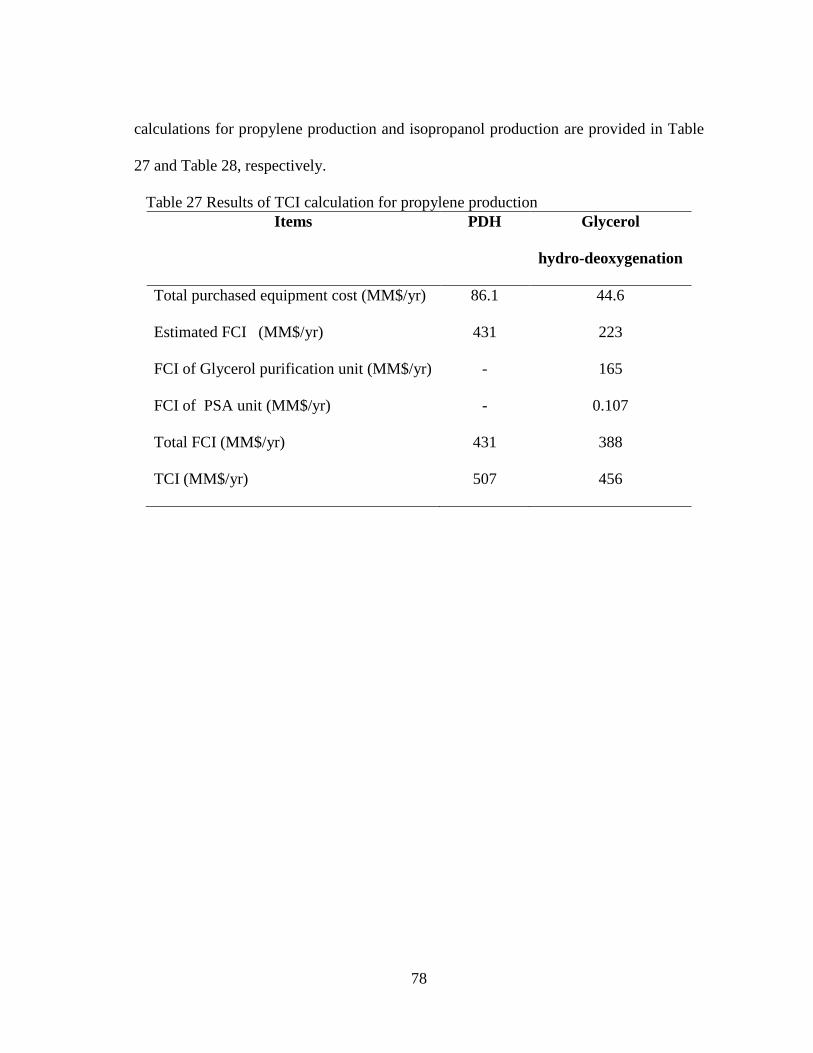
78
calculations for propylene production and isopropanol production are provided in Table
27 and Table 28, respectively.
Table 27 Results of TCI calculation for propylene production
Items PDH Glycerol
hydro-deoxygenation
Total purchased equipment cost (MM$/yr) 86.1 44.6
Estimated FCI (MM$/yr) 431 223
FCI of Glycerol purification unit (MM$/yr) - 165
FCI of PSA unit (MM$/yr) - 0.107
Total FCI (MM$/yr) 431 388
TCI (MM$/yr) 507 456
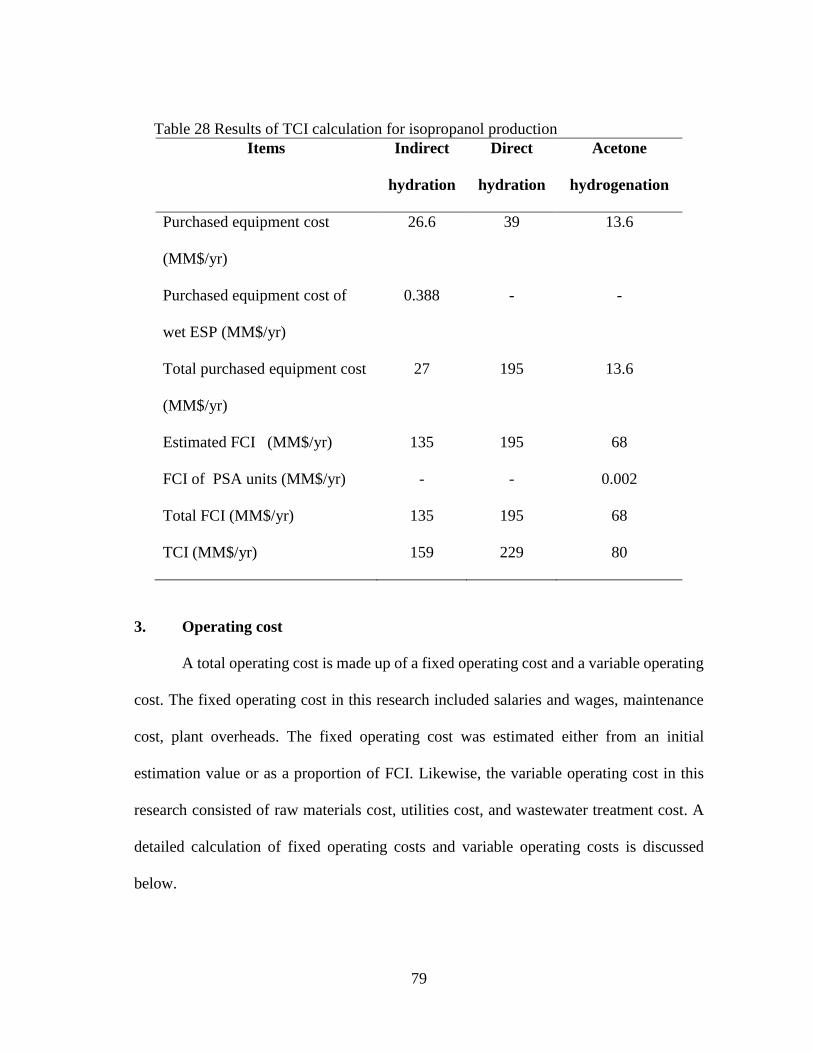
79
Table 28 Results of TCI calculation for isopropanol production
Items Indirect
hydration
Direct
hydration
Acetone
hydrogenation
Purchased equipment cost
(MM$/yr)
26.6 39 13.6
Purchased equipment cost of
wet ESP (MM$/yr)
0.388 - -
Total purchased equipment cost
(MM$/yr)
27 195 13.6
Estimated FCI (MM$/yr) 135 195 68
FCI of PSA units (MM$/yr) - - 0.002
Total FCI (MM$/yr) 135 195 68
TCI (MM$/yr) 159 229 80
3. Operating cost
A total operating cost is made up of a fixed operating cost and a variable operating
cost. The fixed operating cost in this research included salaries and wages, maintenance
cost, plant overheads. The fixed operating cost was estimated either from an initial
estimation value or as a proportion of FCI. Likewise, the variable operating cost in this
research consisted of raw materials cost, utilities cost, and wastewater treatment cost. A
detailed calculation of fixed operating costs and variable operating costs is discussed
below.
80
Starting from the details of the fixed operating cost estimation, the labor cost
consisted of operating labor cost, supervision and management cost, and direct salary
overhead cost. The initial estimation of the operating labor cost was $50,000/shift
position/year. A four-shift position was assumed in this calculation. For the other two
costs, the supervision and management cost was taken as 25% of the operating labor cost,
and the direct salary overhead cost was taken as 50% of the combination of operating labor
and supervision costs[20]. With the calculation method mentioned above, the labor cost
was estimated to be $375,000/year. While it was simple to calculate the maintenance cost
(The maintenance cost was equal to 5% of FCI)[19], it was more complicated to calculate
corporate overhead charges. The corporative overhead charges included the research and
development (R&D) cost, selling and marketing cost, and general and administrative
(G&A) cost. These costs could be estimated as a proportion of revenues and operating
labor cost according to Chemical engineering design[20], as described in Table 29. It
should be noted that the selling and marketing cost highly depended on types of product.
The selling and marketing cost was approaching zero for ASTM standard
commodities[20]. Thus, the selling and marketing cost was assumed to be zero in this
calculation. A summary of calculation methods to determine the fixed operating cost is
listed in Table 29. Moreover, the results of the fixed operating cost of processes for
propylene production and isopropanol production in this research is shown in Table 30
and Table 31.
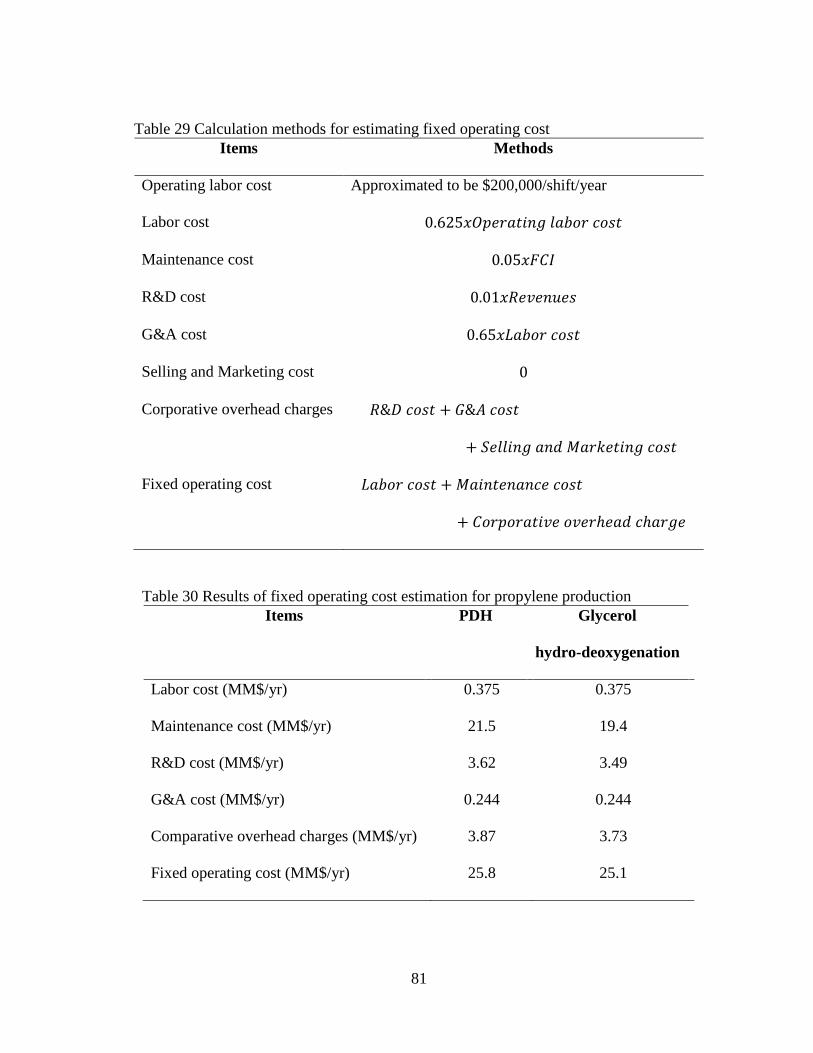
81
Table 29 Calculation methods for estimating fixed operating cost
Items Methods
Operating labor cost Approximated to be $200,000/shift/year
Labor cost 0.625𝑥𝑂𝑝𝑒𝑟𝑎𝑡𝑖𝑛𝑔 𝑙𝑎𝑏𝑜𝑟 𝑐𝑜𝑠𝑡
Maintenance cost 0.05𝑥𝐹𝐶𝐼
R&D cost 0.01𝑥𝑅𝑒𝑣𝑒𝑛𝑢𝑒𝑠
G&A cost 0.65𝑥𝐿𝑎𝑏𝑜𝑟 𝑐𝑜𝑠𝑡
Selling and Marketing cost 0
Corporative overhead charges 𝑅&𝐷 𝑐𝑜𝑠𝑡 + 𝐺&𝐴 𝑐𝑜𝑠𝑡
+ 𝑆𝑒𝑙𝑙𝑖𝑛𝑔 𝑎𝑛𝑑 𝑀𝑎𝑟𝑘𝑒𝑡𝑖𝑛𝑔 𝑐𝑜𝑠𝑡
Fixed operating cost 𝐿𝑎𝑏𝑜𝑟 𝑐𝑜𝑠𝑡 + 𝑀𝑎𝑖𝑛𝑡𝑒𝑛𝑎𝑛𝑐𝑒 𝑐𝑜𝑠𝑡
+ 𝐶𝑜𝑟𝑝𝑜𝑟𝑎𝑡𝑖𝑣𝑒 𝑜𝑣𝑒𝑟ℎ𝑒𝑎𝑑 𝑐ℎ𝑎𝑟𝑔𝑒
Table 30 Results of fixed operating cost estimation for propylene production
Items PDH Glycerol
hydro-deoxygenation
Labor cost (MM$/yr) 0.375 0.375
Maintenance cost (MM$/yr) 21.5 19.4
R&D cost (MM$/yr) 3.62 3.49
G&A cost (MM$/yr) 0.244 0.244
Comparative overhead charges (MM$/yr) 3.87 3.73
Fixed operating cost (MM$/yr) 25.8 25.1
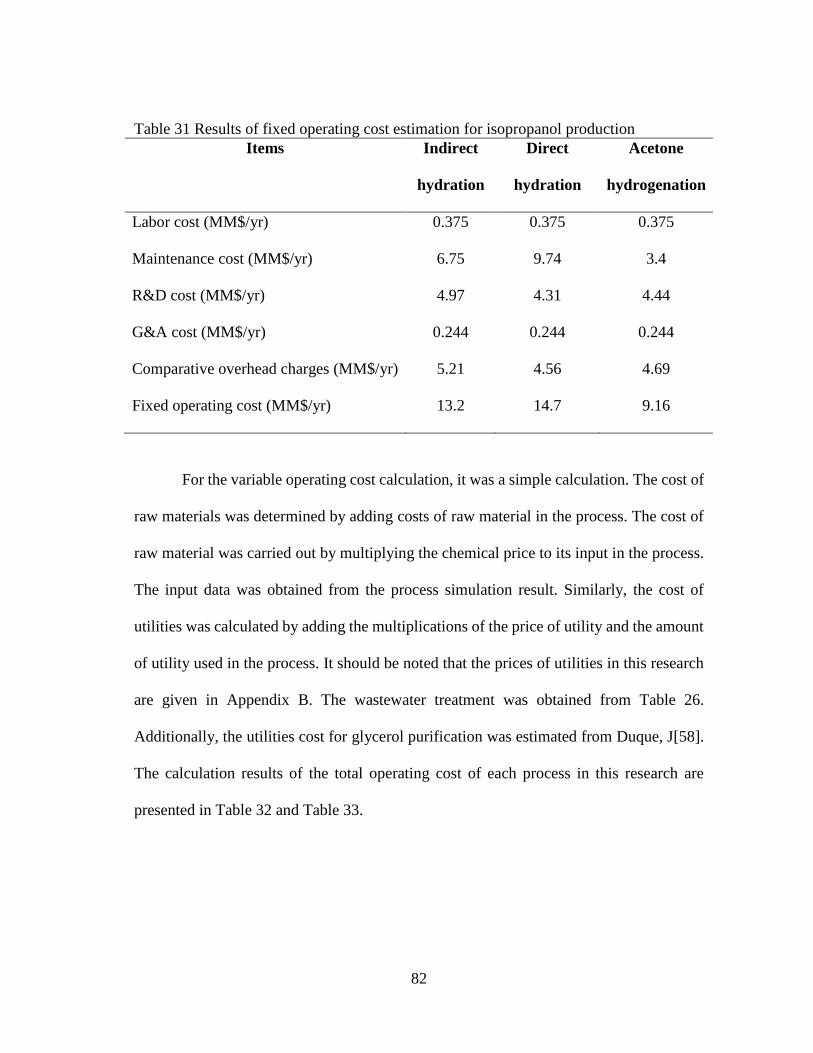
82
Table 31 Results of fixed operating cost estimation for isopropanol production
Items Indirect
hydration
Direct
hydration
Acetone
hydrogenation
Labor cost (MM$/yr) 0.375 0.375 0.375
Maintenance cost (MM$/yr) 6.75 9.74 3.4
R&D cost (MM$/yr) 4.97 4.31 4.44
G&A cost (MM$/yr) 0.244 0.244 0.244
Comparative overhead charges (MM$/yr) 5.21 4.56 4.69
Fixed operating cost (MM$/yr) 13.2 14.7 9.16
For the variable operating cost calculation, it was a simple calculation. The cost of
raw materials was determined by adding costs of raw material in the process. The cost of
raw material was carried out by multiplying the chemical price to its input in the process.
The input data was obtained from the process simulation result. Similarly, the cost of
utilities was calculated by adding the multiplications of the price of utility and the amount
of utility used in the process. It should be noted that the prices of utilities in this research
are given in Appendix B. The wastewater treatment was obtained from Table 26.
Additionally, the utilities cost for glycerol purification was estimated from Duque, J[58].
The calculation results of the total operating cost of each process in this research are
presented in Table 32 and Table 33.
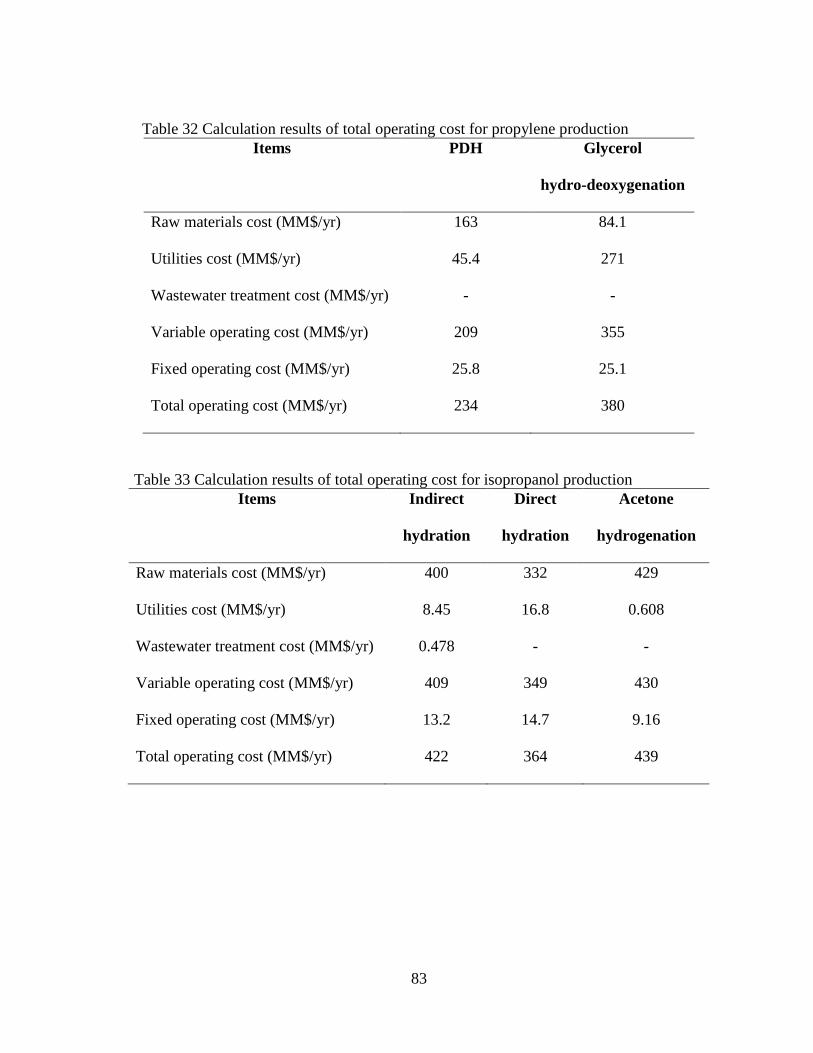
83
Table 32 Calculation results of total operating cost for propylene production
Items PDH Glycerol
hydro-deoxygenation
Raw materials cost (MM$/yr) 163 84.1
Utilities cost (MM$/yr) 45.4 271
Wastewater treatment cost (MM$/yr) - -
Variable operating cost (MM$/yr) 209 355
Fixed operating cost (MM$/yr) 25.8 25.1
Total operating cost (MM$/yr) 234 380
Table 33 Calculation results of total operating cost for isopropanol production
Items Indirect
hydration
Direct
hydration
Acetone
hydrogenation
Raw materials cost (MM$/yr) 400 332 429
Utilities cost (MM$/yr) 8.45 16.8 0.608
Wastewater treatment cost (MM$/yr) 0.478 - -
Variable operating cost (MM$/yr) 409 349 430
Fixed operating cost (MM$/yr) 13.2 14.7 9.16
Total operating cost (MM$/yr) 422 364 439