Embed Size (px)
Citation preview
The Risk Rating System for Noise-induced Hearing Loss in Korean Manufacturing Sites Based
on the 2009 Survey on Work Environments
Young Sun KIM, Youn Ho CHO, Oh Jun KWON, Seong Weon CHOI and Kyung Yong RHEE
Occupational Safety and Health Research Institute, Koera Occupational Safety and Health Agency, Incheon, Korea
pISSN : 2093-7911eISSN : 2093-7997
Saf Health Work 2011;2:336-47 | http://dx.doi.org/10.5491/SHAW.2011.2.4.336
Received: December 7, 2010, Revised: August 16, 2011Accepted: September 9, 2011, Available online: December 5, 2011Correspondence to: Kyung Yong RHEEOccupational Safety and Health Research InstituteKorea Occupational Safety and Health Agency478, Munemi-ro, Bupyeong-gu, Incheon 403-711, KoreaTel: +82-32-5100-751, Fax: +82-32-5100-863E-mail: [email protected]
Objectives: In Korea, an average of 258 workers claim compensation for their noise-induced hearing loss (NIHL) on an annual basis. Indeed, hearing disorder ranks first in the number of diagnoses made by occupational medical check-ups. Against this backdrop, this study analyzed the impact of 19 types of noise-generating machines and equipment on the sound pressure levels in workplaces and NIHL occurrence based on a 2009 national survey on work environments. Methods: Through this analysis, a series of statistical models were built to determine posterior probabilities for each worksite with an aim to present risk ratings for noise levels at work.Results: It was found that air compressors and grinding machines came in first and second, respectively in the number of in-stalled noise-generating machines and equipment. However, there was no direct relationship between workplace noise and NIHL among workers since noise-control equipment and protective gear had been in place. By building a logistic regression model and neural network, statistical models were set to identify the influence of the noise-generating machines and equipment on work-place noise levels and NIHL occurrence.Conclusion: This study offered NIHL prevention measures which are fit for the worksites in each risk grade.
Key Words: Noise-induced hearing loss, Sound pressure level, Survey on work environments
Introduction
Repeated noise, beginning at 4,000 Hz, hurts the delicate struc-
ture of the inner ear, causing hearing loss [1,2]. This illness
is called noise-induced hearing loss (NIHL). Once hearing is
impaired, it is impossible to restore it and therefore, reducing
risk factors is the best way to prevent NIHL [3]. Recent studies
point out that in addition to noise, other factors including or-
ganic solvents, heavy metals, smoking, high blood pressure, and
hyperlipidemia are also related to NIHL [4-11]. However, noise
still serves as the highest risk factor. Unfortunately, it has been
found that a number of manufacturing workers in Korea are
exposed to excessive noise levels. For example, the manufac-
turing sector accounts for over 80% of the 2,324 workers who
claimed occupational insurance compensations for NIHL from
2001 to 2009-tantamount to 258 workers on an annual basis
[12]. Moreover, hearing disorder currently takes the largest pro-
portion of diagnoses made by occupational medical check-ups,
which are regularly done for workers in Korea.
A previous study showed that mine workers were exposed
to significant noises from circular saws (98 dB), line saws (99
dB), grinding machines (88 dB), and pneumatic machines (92
dB) [13]. Another study suggested that agricultural machines
and equipment including hammers (99.6 dB) and grinding ma-
chines (86.6 dB) also generated harmful noises [14]. It was also
Copyright © 2011 by Safety and Health at Work (SH@W)
This is an open-access article distributed under the terms of the Creative Commons Attribution Non-Commercial License (http://creativecommons.org/licenses/by-nc/3.0/), which permits unrestricted non-commercial use, distribution, and reproduction in any medium, provided the original work is properly cited.
Original Article
The Risk Rating System for NIHLSaf Health Work 2011;2:336-47
337
www.e-shaw.org
notable that an air compressor in the piston/motor shaft form
produced as high as 91.1 dB [15].
Senior workers have been found to be more vulnerable
to hearing impairment [16]. With the rapidly aging process
worldwide, Korea entered an aging society in 2007. If the ag-
ing process maintains its current pace, the nation is expected to
become an aged society by 2020 and an ultra-aged society by
2026 [17].
Against this backdrop, this study aimed to analyze the im-
pact of 19 types of noise-generating machines and equipment
on workplace noise and NIHL occurrences among workers.
It used diverse statistical models to present risk ratings for the
equivalent sound pressure levels and NIHL occurrences among
manufacturing workers. By doing so, the author identified the
impact of the noise-generating machines and equipment on
noise levels and the hearing capability of manufacturing work-
ers. These risk ratings are expected to serve as accident preven-
tion indicators.
Materials and Methods
Data collectionThe Korea Occupational Safety and Health Agency (KOSHA)
investigates work environments nationwide and risk factors as
part of its comprehensive plan to prevent occupational illnesses
in cooperation with the Korean Ministry of Employment and
Labor. For example, the agency conducts research on employ-
ment status, general work conditions, high-risk environments,
chemical-handling jobs, and high-risk machinery and equip-
ment on a regular basis. These studies are then reflected in the
government’s policies to improve workers’ safety and health
and to prevent accidents and injuries at work. KOSHA has
also established a management system for high-risk chemicals,
machinery, and equipment. The agency has delivered a survey
on work environments nationwide every five years since its first
round which targeted 52,552 worksites in 1991. The number
of surveyed worksites has steadily rose from 52,070 in 1999, to
80,040 in 2004, and 107,295 in 2009.
The 2009 round performed from April 1 to October 30
had worksites covered by workers’ insurance as the sampling
frame. While manufacturing worksites with five employees or
more were studied through complete enumeration, stratifica-
tion methods considering the locations and industrial traits
were applied to those with below five. When a sample was not
eligible, the substitution sample was set by doublingall figures
in the sample which was originally going to be investigated.
Among 101,010 manufacturing worksites with five employees
or more, 86,415 or 86.5% completed surveys, while 11,497
manufacturing companies with less than five workers did so,
posting 114.9% in survey completion among 1,000 targeted
worksites. Out of 10,000 non-manufacturing companies, 9,383
worksites or 93.8% fulfilled the survey (Table 1).
Experts were recruited as enumerators for the 2009 survey
in related fields including health, occupational safety, and ma-
chinery. They also went through a four-step guidance to ensure
consistency of the survey.
The survey items included: 1) worksite information and
work environment, 2) installed machines, equipment, and fa-
cilities, and 3) chemical-handling jobs. As shown in Table 2,
the worksite information dealt with the number of workers,
welfare facilities, and worksite management numbers, which
were issued by KOSHA to companies covered by workers’
insurance. These numbers served as a key value in comparing
the databases on accidents and injuries at work, each built by
KOSHA, occupation medical institutions, and companies.
The work environment item composed of risk factors, the
number of exposed workers, and their daily work time dealt
with the number of worksites with 19 types of machines gener-
ating noise, the time of their usage, and the number of workers
handling the equipment.
The item machines, equipment, and facilities item mea-
sured the number of 18 types of machines including cranes,
hoists, lifts, gondolas, and forklifts installed in the worksites,
and whether they were bought or rented.
The chemical-handling jobs item encompassed chemicals
belonging to the following five categories:1) dangerous materi-
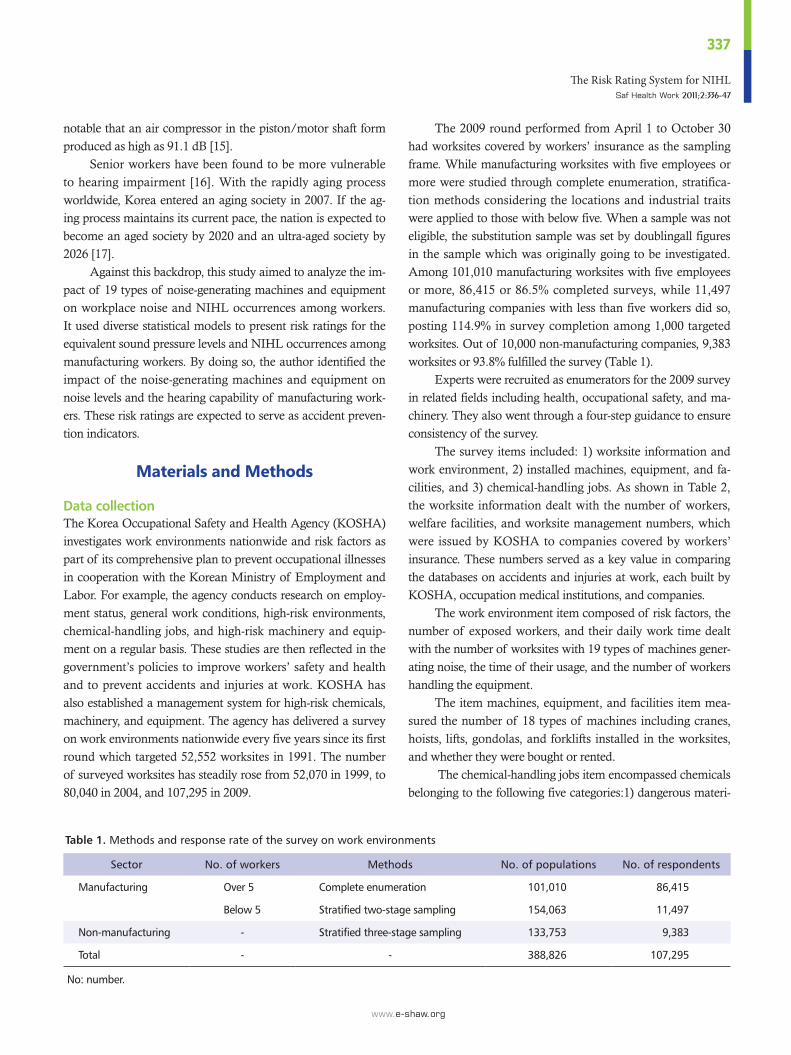
Table 1. Methods and response rate of the survey on work environments
Sector No. of workers Methods No. of populations No. of respondents
Manufacturing Over 5 Complete enumeration 101,010 86,415
Below 5 Stratified two-stage sampling 154,063 11,497
Non-manufacturing - Stratified three-stage sampling 133,753 9,383
Total - - 388,826 107,295
No: number.
Kim YS et al.Safety and Health at Work | Vol. 2, No. 4, Dec. 30, 2011
338
www.e-shaw.org
als requiring approvals, 2) dangerous materials under control, 3)
dangerous materials subject to surveys on work environments,
4) materials with exposure limits, and 5) high-risk materials
(Table 2).
Data integrationUsing workplace identification numbers, the data on occu-
pational medical tests were integrated into the data from the
survey on work environments to analyze the impact by the ma-
chinery and equipment on NIHL.
The occupational medical check-up system was intro-
duced by the Korean Ministry of Employment and Labor and
KOSHA with an aim to improve workers’ health and prevent
work-related disorders by offering annual medical tests. As of
2009, 874,018 workers received the test on an annual basis. The
Ministry has designated 150 hospitals to deliver the check-up
service for workers exposed to risk factors. The diagnoses and
the tests’ results, which are reported to KOSHA, are reflected
in the database on occupational medical check-ups. The data-
base consists of measured values regarding the 220 diagnosis
items’ results and the doctors’ comments.
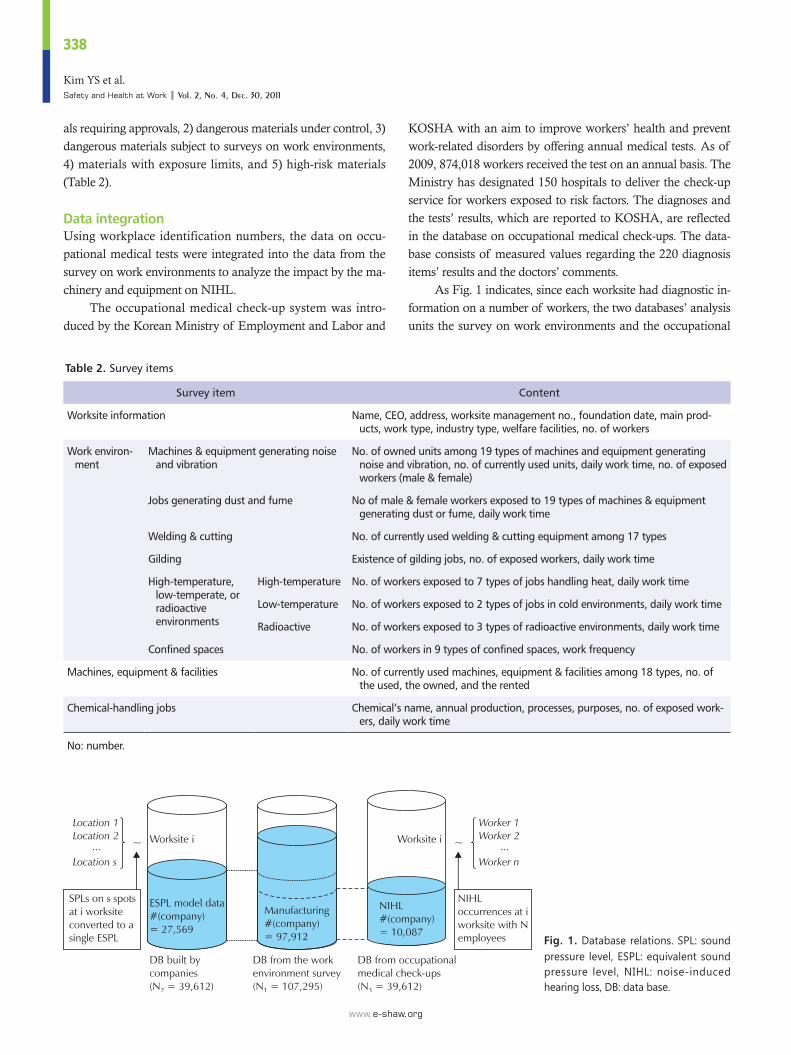
As Fig. 1 indicates, since each worksite had diagnostic in-
formation on a number of workers, the two databases’ analysis
units the survey on work environments and the occupational
Fig. 1. Database relations. SPL: sound pressure level, ESPL: equivalent sound pressure level, NIHL: noise-induced hearing loss, DB: data base.
Table 2. Survey items
Survey item Content
Worksite information Name, CEO, address, worksite management no., foundation date, main prod-ucts, work type, industry type, welfare facilities, no. of workers
Work environ-ment
Machines & equipment generating noise and vibration
No. of owned units among 19 types of machines and equipment generating noise and vibration, no. of currently used units, daily work time, no. of exposed workers (male & female)
Jobs generating dust and fume No of male & female workers exposed to 19 types of machines & equipment generating dust or fume, daily work time
Welding & cutting No. of currently used welding & cutting equipment among 17 types
Gilding Existence of gilding jobs, no. of exposed workers, daily work time
High-temperature, low-temperate, or radioactive environments
High-temperature No. of workers exposed to 7 types of jobs handling heat, daily work time
Low-temperature No. of workers exposed to 2 types of jobs in cold environments, daily work time
Radioactive No. of workers exposed to 3 types of radioactive environments, daily work time
Confined spaces No. of workers in 9 types of confined spaces, work frequency
Machines, equipment & facilities No. of currently used machines, equipment & facilities among 18 types, no. of the used, the owned, and the rented
Chemical-handling jobs Chemical’s name, annual production, processes, purposes, no. of exposed work-ers, daily work time
No: number.
The Risk Rating System for NIHLSaf Health Work 2011;2:336-47
339
www.e-shaw.org
medical check-ups did not match. To address this incompat-
ibility, the units of the work environment database and the
occupational medical check-up database were altered into a
worksite unit to gain information on whether a worksite had
one or more employees proven to have NIHL.
Noise levels are usually measured at various points in a
workplace. The information on noise levels withineach work-
site is converted to a sound pressure level (SPL).
The integrated database covered work environments, oc-
cupational medical check-ups, and SPL. The number of work-
sites with all of three kinds of information reached 10,087,
while those with the first two kinds were 10,087. Those with
the data on work environments and SPL posted 27,569 (Fig. 1).
Risk factor analysisThis study analyzed SPL in workplaces and the diagnoses
made by the occupational medical tests to understand which
machines and equipment out of the 19 types caused NIHL.
In this analysis, j meant the types of machines and equipment
with xj and wi referring to the number of the installed machines
and equipment and the SPL, respectively. As seen in Equation 1,
wi was estimated by calculating the equivalent sound pressure
level (ESPL) through measured values on s spots Lps.
wi = 10 log [(10Lp1 + 10Lp
2 + … + 10Lps)/ s] (1)
The objective variable, zi was created to compare the
worksites (zi = 1) with the wi over 90 dB and those (zi = 0) with
wi below 90 dB. If a noise level exceeded 90 dB, it was consid-
ered harmful. It was found that around 13.46% of the surveyed
worksites surpassed the 90 dB level.
The target variable was also formed for worksites with
employees diagnosed with NIHL (di = 1) and worksites with-
out NIHL patients (di = 0). When an employee was proven to
have a hearing loss over 50 dB at 4,000 Hz through a speech
audiometry and a pure tone audiometry, he/she was diagnosed
with NIHL.
A t-test based on Equation 2 was conducted to see wheth-
er there was a difference in the number of the 19 types of ma-
chines and equipment between the worksites with the ESPL of
90 dB or above and those of under 90 dB.
1
21
0
20
10
ns
ns
XXt
+
−=
(2)
The measurement of the ESPL was the result of noises
from a multiple number of units since each worksite usually
had various types of machines and equipment. In order to ex-
amine worksites using only j type of machines or equipment
(j), a Kruskal-Wallis Test (Equation 3) was delivered to see if
there was any difference between the group over 90 dB and that
below 90 dB [18]. However, since most of the manufacturing
sites in Korea had several types of machines and equipment,
the data did not follow the normal distribution with an extreme
value zone in which worksites with far more types of machines
and equipment than the average existed.
T s1
nR
4N (N 1)
jTj2 g 1
2
jg
jg2
j(N 2
= ; E (3)
In Equation 3, njg referred to the number of worksites with
the j type of machines and equipment in group g (g is defined
by the ESPL), while meant the ranks of the samples in
terms of the number of machines and equipment. During the
process, another Equation, ,
was set. A t-test covering all data aimed to see the gap between
the two groups in terms of the number of installed machines
and equipment. In the meantime, a Kruskal-Wallis statistic was
used to sort out the effects of the j type from other machines
and equipment in worksites with multiple types. Equations 2
and 3 were also utilized to examine the difference between the
worksites with NIHL patients and those free from the disorder.
ESPL and NIHL statistical modelsThe decision model in this paper presented the risk levels by
calculating the effect of the number of installed j-type ma-
chines and equipment (xj) on SPL (wi) and NIHL occurrence
(zi). Since the response variable in this study-NIHL occurrence-
was a binary type, a logistic regression was applied. As a result,
Equation 5 was set with zi referring to NIHL occurrence (1:
occurrence, 0: non-occurrence) and T*itg to the number of in-
stalled machines and equipment [19,20]. This model was com-
pleted by estimating the parameter coefficient, βi.
(4)
Since logistic regression is linear and parametric, its
predictability about new data maintains a certain level. Mean-
while, a number of researchers have investigated the methods
of data mining for non-linear and non-parametric models in-
cluding a neural network, a decision tree, and a support vector
machine [21-24]. Although these models have high predictabil-
ity, they tend to be over-fit to the training sets which are used
for model estimation. To gain an optimal one with proven ex-
sN 11 R 4
N (N 1)j2
jg 12
h 1n
jgh2 j(N 2
ji= -; E
Kim YS et al.Safety and Health at Work | Vol. 2, No. 4, Dec. 30, 2011
340
www.e-shaw.org
cellence, various models should be compared. In this study, the
optimal model for the decision-making system regarding NIHL
occurrence was assumed by comparing the above mentioned
models.
Model validationThere were two standards for model validation: 1) how effec-
tive the model was with as low a number of independent vari-
ables as possible, and 2) how reliable the results were when the
model was applied to new data. In other words, generalization
played a key role. If a model did not have a generalization ca-
pability, it was not effective at all, however high its predictability
was. In most cases, the available data were categorized into the
training set for model assumption and the validation set. In this
study, 70% of the data was assigned for training with the other
30% for validating. To establish excellence of the model, an
accuracy value, a sensitivity value, and a specificity value were
considered. In particular, the sensitivity value was increased to
enhance the predictability regarding the worksites with NIHL
cases and high-level noises.
Noise-generating machines and risk ratingA credit rating estimates the credit worthiness of customers of
financial institutions based on their credit history. Through this
rating process, the customers are graded from poor to excel-
lent. Likewise, this study presented a risk rating process to scale
worksites from poor to excellent in terms of risk factors which
cause NIHL. Equation 5 shows the posterior probability for
each subject through the parameter coefficient assumed in the
logistic model [25-27].
(5)
The posterior probability gained from the above Equation
was used to categorize each subject. In addition, the parameter
coefficient helped to calculate posterior probability for each
observed value when a worksite had a NIHL case [y = 1]. This
posterior probability in turn came up with the NIHL risk rat-
ings, which could be harnessed as prevention indicators.
Results
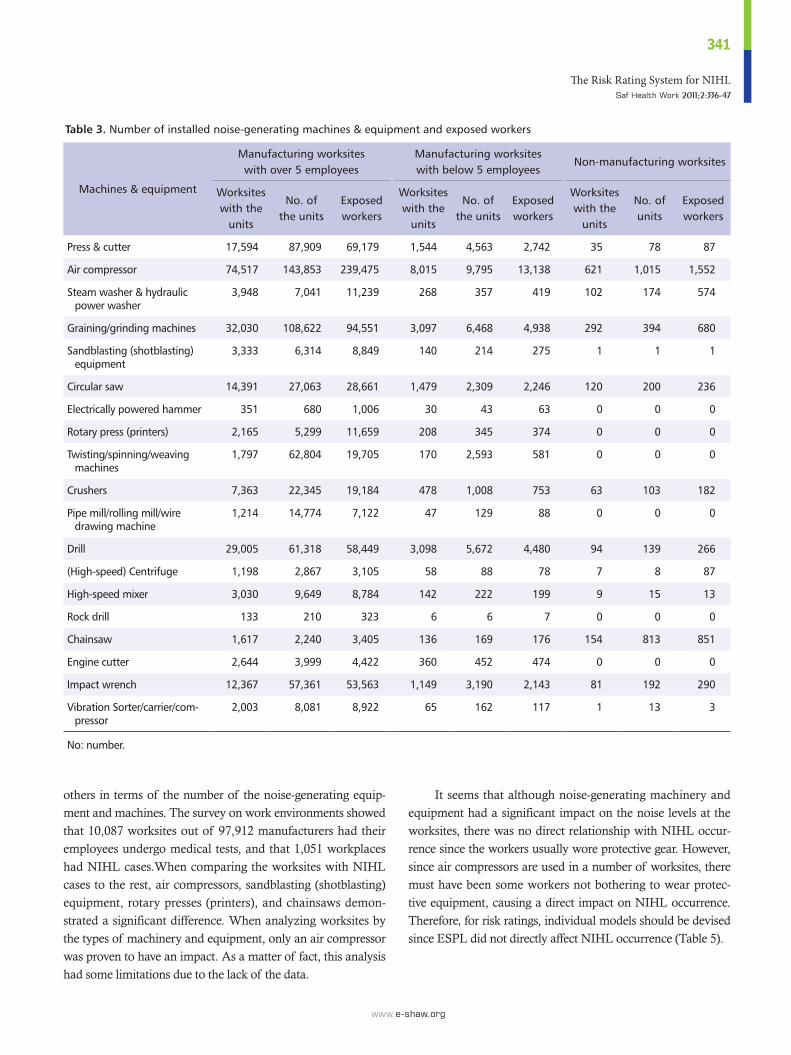
Distribution of noise-generating machines and equipment in Korean manufacturing sitesThe survey on work environments showed that air compressors
took the largest proportion among noise-generating machines
and equipment used by Korean manufacturers. It was found
that 87% of manufacturing sites with five employees or above,
70% of those with under five, and 7% of non-manufacturing
worksites had one or more air compressors, indicating that the
majority of manufacturers are using the machine. Although an
air compressor generates high-level noises over 100.3 dB, the
use of an exhaust shroud can reduce the noise level to 89.3 dB.
Among the 2,420,330 subjects of the survey, 239,479 employ-
ees, around 10%, were found to be exposed to the noise from
air compressors.
Grinding machines, which create over 86.6 dB noise, were
second among the noise-generating machines and equipment
used by worksites. The survey indicated that 32,030 (37%)
manufacturing sites with five employees or more out of 86,415
had one or more grinding machines, while manufacturers with
below five employees and non-manufacturers posted 27% and
3%, respectively.
Although less than 1% of the surveyed worksites used
pipe mills/rolling mills/wire drawing machines, among the
worksites with five or more employees which have such ma-
chines and equipment, the average number of units was as high
as 12 (Table 3).
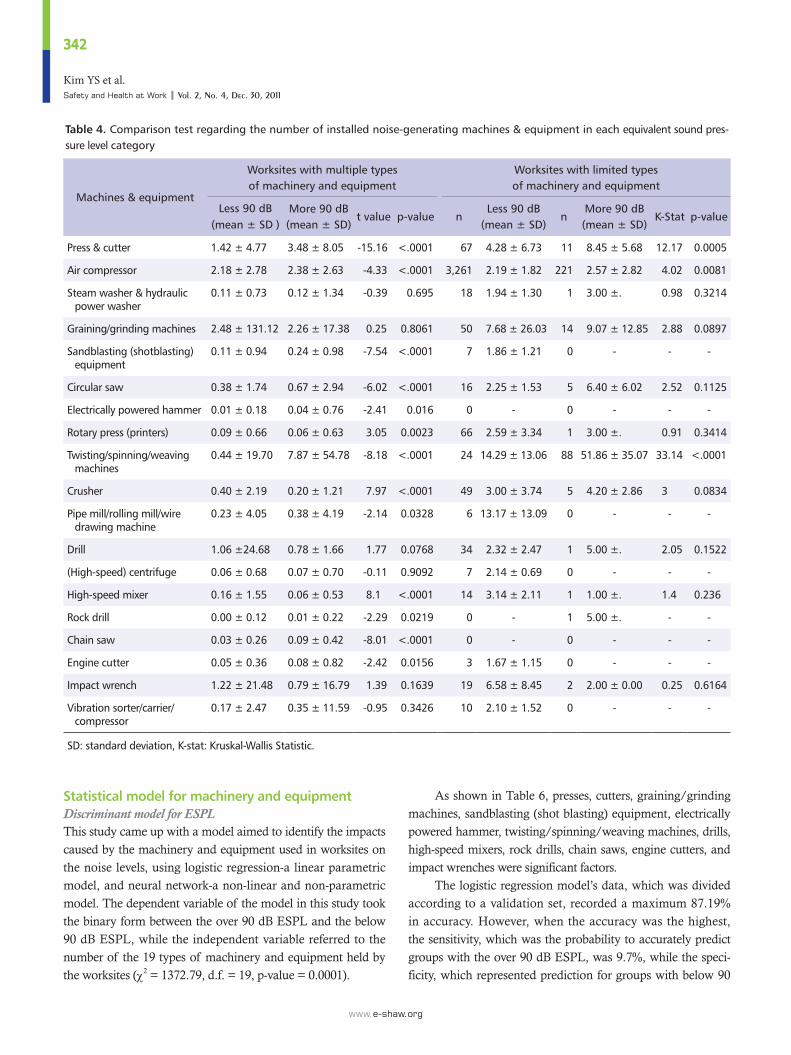
Risk analysis on the number of installed noise-generating machines and equipmentThis study compared worksites with the over 90 dB ESPL to
those with below 90 dB in terms of the number of the 19 types
of noise-generating machines and equipment installed. The
analysis was based on the data from 27,569 worksites out of the
97,912 manufacturers surveyed. The worksites, which had mul-
tiple machines and equipment, and recorded over 90 dB ESPL,
had an average of 1.42 unit of a press or cutter with those of
the below 90 dB ESPL posting 3.48 units. According to a t-test,
between these two surveyed groups, there was a less than 5%
significant level in terms of the number of held presses and
cutters. Since most worksites have multiple types of machines
and equipment, a mere 78 worksites were found to have only
presses and cutters. Among the 78 sites, those with below 90 dB
ESPL had an average of 4.28 units while those with above 90
dB had 8.45 units. The Kruskal-Wallis test showed that the two
groups had a less than 5% significant level. Among the work-
sites with only twisting/spinning/weaving machines, those of
below 90 dB ESPL had an average of 14.29 units, while those
over 90 dB had 51.86 on average. These figures suggested that
the number of machines and equipment installed affected the
ESPL, and consequently the work environments (Table 4).
Against this backdrop, to identify the relationship between
the number of machinery and equipment and workers’ health,
this study compared the worksites with NIHL cases with the
The Risk Rating System for NIHLSaf Health Work 2011;2:336-47
341
www.e-shaw.org
others in terms of the number of the noise-generating equip-
ment and machines. The survey on work environments showed
that 10,087 worksites out of 97,912 manufacturers had their
employees undergo medical tests, and that 1,051 workplaces
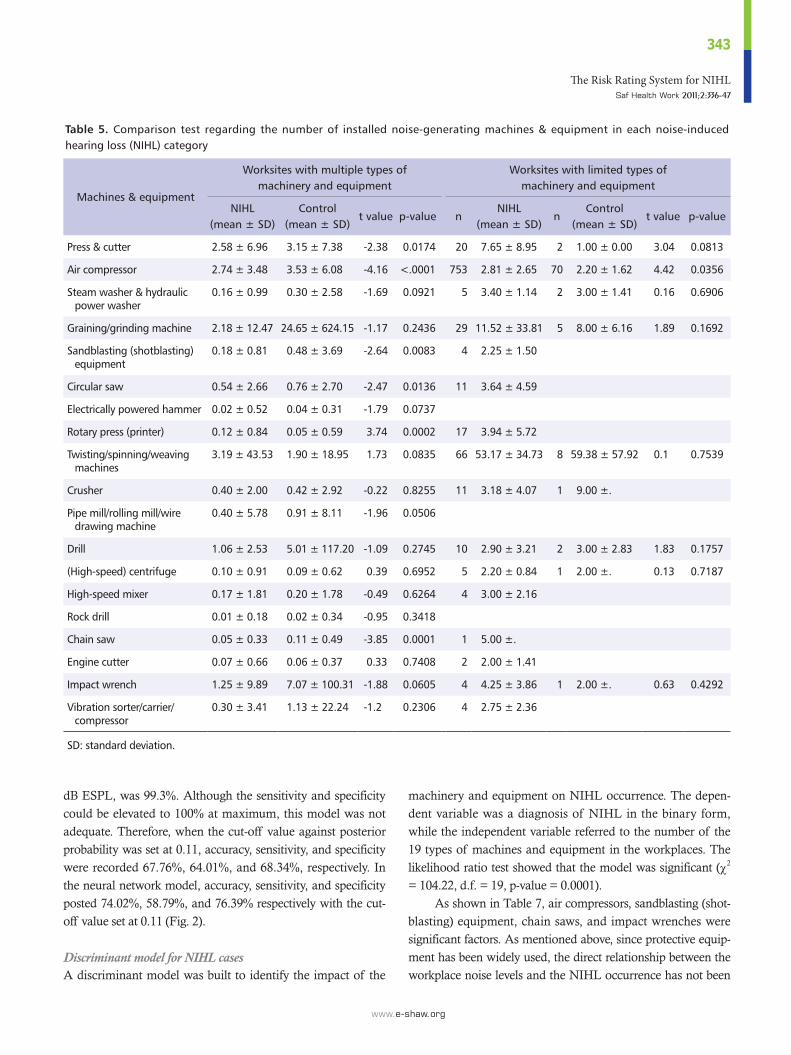
had NIHL cases.When comparing the worksites with NIHL
cases to the rest, air compressors, sandblasting (shotblasting)
equipment, rotary presses (printers), and chainsaws demon-
strated a significant difference. When analyzing worksites by
the types of machinery and equipment, only an air compressor
was proven to have an impact. As a matter of fact, this analysis
had some limitations due to the lack of the data.
It seems that although noise-generating machinery and
equipment had a significant impact on the noise levels at the
worksites, there was no direct relationship with NIHL occur-
rence since the workers usually wore protective gear. However,
since air compressors are used in a number of worksites, there
must have been some workers not bothering to wear protec-
tive equipment, causing a direct impact on NIHL occurrence.
Therefore, for risk ratings, individual models should be devised
since ESPL did not directly affect NIHL occurrence (Table 5).
Table 3. Number of installed noise-generating machines & equipment and exposed workers
Machines & equipment
Manufacturing worksites with over 5 employees
Manufacturing worksites with below 5 employees
Non-manufacturing worksites
Worksites with the
units
No. of the units
Exposed workers
Worksites with the
units
No. of the units
Exposed workers
Worksites with the
units
No. of units
Exposed workers
Press & cutter 17,594 87,909 69,179 1,544 4,563 2,742 35 78 87
Air compressor 74,517 143,853 239,475 8,015 9,795 13,138 621 1,015 1,552
Steam washer & hydraulic power washer
3,948 7,041 11,239 268 357 419 102 174 574
Graining/grinding machines 32,030 108,622 94,551 3,097 6,468 4,938 292 394 680
Sandblasting (shotblasting) equipment
3,333 6,314 8,849 140 214 275 1 1 1
Circular saw 14,391 27,063 28,661 1,479 2,309 2,246 120 200 236
Electrically powered hammer 351 680 1,006 30 43 63 0 0 0
Rotary press (printers) 2,165 5,299 11,659 208 345 374 0 0 0
Twisting/spinning/weaving machines
1,797 62,804 19,705 170 2,593 581 0 0 0
Crushers 7,363 22,345 19,184 478 1,008 753 63 103 182
Pipe mill/rolling mill/wire drawing machine
1,214 14,774 7,122 47 129 88 0 0 0
Drill 29,005 61,318 58,449 3,098 5,672 4,480 94 139 266
(High-speed) Centrifuge 1,198 2,867 3,105 58 88 78 7 8 87
High-speed mixer 3,030 9,649 8,784 142 222 199 9 15 13
Rock drill 133 210 323 6 6 7 0 0 0
Chainsaw 1,617 2,240 3,405 136 169 176 154 813 851
Engine cutter 2,644 3,999 4,422 360 452 474 0 0 0
Impact wrench 12,367 57,361 53,563 1,149 3,190 2,143 81 192 290
Vibration Sorter/carrier/com-pressor
2,003 8,081 8,922 65 162 117 1 13 3
No: number.
Kim YS et al.Safety and Health at Work | Vol. 2, No. 4, Dec. 30, 2011
342
www.e-shaw.org
Statistical model for machinery and equipmentDiscriminant model for ESPLThis study came up with a model aimed to identify the impacts
caused by the machinery and equipment used in worksites on
the noise levels, using logistic regression-a linear parametric
model, and neural network-a non-linear and non-parametric
model. The dependent variable of the model in this study took
the binary form between the over 90 dB ESPL and the below
90 dB ESPL, while the independent variable referred to the
number of the 19 types of machinery and equipment held by
the worksites (χ2 = 1372.79, d.f. = 19, p-value = 0.0001).
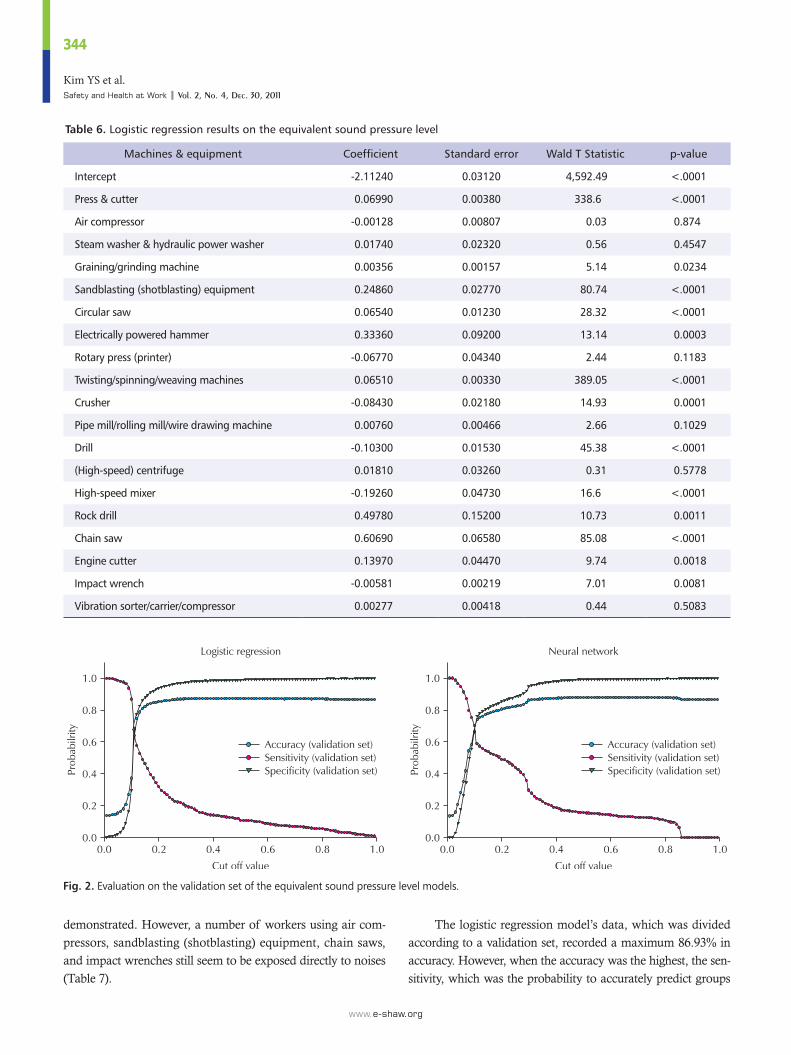
As shown in Table 6, presses, cutters, graining/grinding
machines, sandblasting (shot blasting) equipment, electrically
powered hammer, twisting/spinning/weaving machines, drills,
high-speed mixers, rock drills, chain saws, engine cutters, and
impact wrenches were significant factors.
The logistic regression model’s data, which was divided
according to a validation set, recorded a maximum 87.19%
in accuracy. However, when the accuracy was the highest,
the sensitivity, which was the probability to accurately predict
groups with the over 90 dB ESPL, was 9.7%, while the speci-
ficity, which represented prediction for groups with below 90
Table 4. Comparison test regarding the number of installed noise-generating machines & equipment in each equivalent sound pres-sure level category
Machines & equipment
Worksites with multiple types of machinery and equipment
Worksites with limited types of machinery and equipment
Less 90 dB (mean ± SD )
More 90 dB(mean ± SD)
t value p-value nLess 90 dB
(mean ± SD)n
More 90 dB(mean ± SD)
K-Stat p-value
Press & cutter 1.42 ± 4.77 3.48 ± 8.05 -15.16 <.0001 67 4.28 ± 6.73 11 8.45 ± 5.68 12.17 0.0005
Air compressor 2.18 ± 2.78 2.38 ± 2.63 -4.33 <.0001 3,261 2.19 ± 1.82 221 2.57 ± 2.82 4.02 0.0081
Steam washer & hydraulic power washer
0.11 ± 0.73 0.12 ± 1.34 -0.39 0.695 18 1.94 ± 1.30 1 3.00 ±. 0.98 0.3214
Graining/grinding machines 2.48 ± 131.12 2.26 ± 17.38 0.25 0.8061 50 7.68 ± 26.03 14 9.07 ± 12.85 2.88 0.0897
Sandblasting (shotblasting) equipment
0.11 ± 0.94 0.24 ± 0.98 -7.54 <.0001 7 1.86 ± 1.21 0 - - -
Circular saw 0.38 ± 1.74 0.67 ± 2.94 -6.02 <.0001 16 2.25 ± 1.53 5 6.40 ± 6.02 2.52 0.1125
Electrically powered hammer 0.01 ± 0.18 0.04 ± 0.76 -2.41 0.016 0 - 0 - - -
Rotary press (printers) 0.09 ± 0.66 0.06 ± 0.63 3.05 0.0023 66 2.59 ± 3.34 1 3.00 ±. 0.91 0.3414
Twisting/spinning/weaving machines
0.44 ± 19.70 7.87 ± 54.78 -8.18 <.0001 24 14.29 ± 13.06 88 51.86 ± 35.07 33.14 <.0001
Crusher 0.40 ± 2.19 0.20 ± 1.21 7.97 <.0001 49 3.00 ± 3.74 5 4.20 ± 2.86 3 0.0834
Pipe mill/rolling mill/wire drawing machine
0.23 ± 4.05 0.38 ± 4.19 -2.14 0.0328 6 13.17 ± 13.09 0 - - -
Drill 1.06 ±24.68 0.78 ± 1.66 1.77 0.0768 34 2.32 ± 2.47 1 5.00 ±. 2.05 0.1522
(High-speed) centrifuge 0.06 ± 0.68 0.07 ± 0.70 -0.11 0.9092 7 2.14 ± 0.69 0 - - -
High-speed mixer 0.16 ± 1.55 0.06 ± 0.53 8.1 <.0001 14 3.14 ± 2.11 1 1.00 ±. 1.4 0.236
Rock drill 0.00 ± 0.12 0.01 ± 0.22 -2.29 0.0219 0 - 1 5.00 ±. - -
Chain saw 0.03 ± 0.26 0.09 ± 0.42 -8.01 <.0001 0 - 0 - - -
Engine cutter 0.05 ± 0.36 0.08 ± 0.82 -2.42 0.0156 3 1.67 ± 1.15 0 - - -
Impact wrench 1.22 ± 21.48 0.79 ± 16.79 1.39 0.1639 19 6.58 ± 8.45 2 2.00 ± 0.00 0.25 0.6164
Vibration sorter/carrier/ compressor
0.17 ± 2.47 0.35 ± 11.59 -0.95 0.3426 10 2.10 ± 1.52 0 - - -
SD: standard deviation, K-stat: Kruskal-Wallis Statistic.
The Risk Rating System for NIHLSaf Health Work 2011;2:336-47
343
www.e-shaw.org
dB ESPL, was 99.3%. Although the sensitivity and specificity
could be elevated to 100% at maximum, this model was not
adequate. Therefore, when the cut-off value against posterior
probability was set at 0.11, accuracy, sensitivity, and specificity
were recorded 67.76%, 64.01%, and 68.34%, respectively. In
the neural network model, accuracy, sensitivity, and specificity
posted 74.02%, 58.79%, and 76.39% respectively with the cut-
off value set at 0.11 (Fig. 2).
Discriminant model for NIHL casesA discriminant model was built to identify the impact of the
machinery and equipment on NIHL occurrence. The depen-
dent variable was a diagnosis of NIHL in the binary form,
while the independent variable referred to the number of the
19 types of machines and equipment in the workplaces. The
likelihood ratio test showed that the model was significant (χ2
= 104.22, d.f. = 19, p-value = 0.0001).
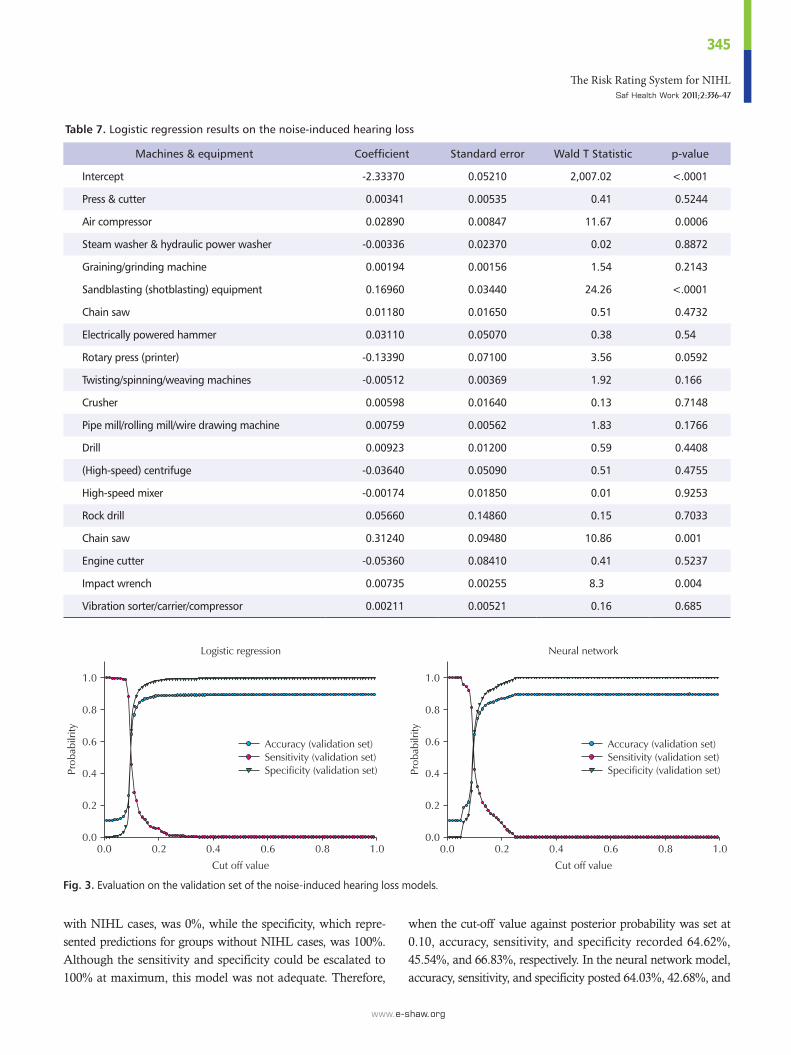
As shown in Table 7, air compressors, sandblasting (shot-
blasting) equipment, chain saws, and impact wrenches were
significant factors. As mentioned above, since protective equip-
ment has been widely used, the direct relationship between the
workplace noise levels and the NIHL occurrence has not been
Table 5. Comparison test regarding the number of installed noise-generating machines & equipment in each noise-induced hearing loss (NIHL) category
Machines & equipment
Worksites with multiple types of machinery and equipment
Worksites with limited types of machinery and equipment
NIHL(mean ± SD)
Control(mean ± SD)
t value p-value nNIHL
(mean ± SD)n
Control(mean ± SD)
t value p-value
Press & cutter 2.58 ± 6.96 3.15 ± 7.38 -2.38 0.0174 20 7.65 ± 8.95 2 1.00 ± 0.00 3.04 0.0813
Air compressor 2.74 ± 3.48 3.53 ± 6.08 -4.16 <.0001 753 2.81 ± 2.65 70 2.20 ± 1.62 4.42 0.0356
Steam washer & hydraulic power washer
0.16 ± 0.99 0.30 ± 2.58 -1.69 0.0921 5 3.40 ± 1.14 2 3.00 ± 1.41 0.16 0.6906
Graining/grinding machine 2.18 ± 12.47 24.65 ± 624.15 -1.17 0.2436 29 11.52 ± 33.81 5 8.00 ± 6.16 1.89 0.1692
Sandblasting (shotblasting) equipment
0.18 ± 0.81 0.48 ± 3.69 -2.64 0.0083 4 2.25 ± 1.50
Circular saw 0.54 ± 2.66 0.76 ± 2.70 -2.47 0.0136 11 3.64 ± 4.59
Electrically powered hammer 0.02 ± 0.52 0.04 ± 0.31 -1.79 0.0737
Rotary press (printer) 0.12 ± 0.84 0.05 ± 0.59 3.74 0.0002 17 3.94 ± 5.72
Twisting/spinning/weaving machines
3.19 ± 43.53 1.90 ± 18.95 1.73 0.0835 66 53.17 ± 34.73 8 59.38 ± 57.92 0.1 0.7539
Crusher 0.40 ± 2.00 0.42 ± 2.92 -0.22 0.8255 11 3.18 ± 4.07 1 9.00 ±.
Pipe mill/rolling mill/wire drawing machine
0.40 ± 5.78 0.91 ± 8.11 -1.96 0.0506
Drill 1.06 ± 2.53 5.01 ± 117.20 -1.09 0.2745 10 2.90 ± 3.21 2 3.00 ± 2.83 1.83 0.1757
(High-speed) centrifuge 0.10 ± 0.91 0.09 ± 0.62 0.39 0.6952 5 2.20 ± 0.84 1 2.00 ±. 0.13 0.7187
High-speed mixer 0.17 ± 1.81 0.20 ± 1.78 -0.49 0.6264 4 3.00 ± 2.16
Rock drill 0.01 ± 0.18 0.02 ± 0.34 -0.95 0.3418
Chain saw 0.05 ± 0.33 0.11 ± 0.49 -3.85 0.0001 1 5.00 ±.
Engine cutter 0.07 ± 0.66 0.06 ± 0.37 0.33 0.7408 2 2.00 ± 1.41
Impact wrench 1.25 ± 9.89 7.07 ± 100.31 -1.88 0.0605 4 4.25 ± 3.86 1 2.00 ±. 0.63 0.4292
Vibration sorter/carrier/ compressor
0.30 ± 3.41 1.13 ± 22.24 -1.2 0.2306 4 2.75 ± 2.36
SD: standard deviation.
Kim YS et al.Safety and Health at Work | Vol. 2, No. 4, Dec. 30, 2011
344
www.e-shaw.org
demonstrated. However, a number of workers using air com-
pressors, sandblasting (shotblasting) equipment, chain saws,
and impact wrenches still seem to be exposed directly to noises
(Table 7).
The logistic regression model’s data, which was divided
according to a validation set, recorded a maximum 86.93% in
accuracy. However, when the accuracy was the highest, the sen-
sitivity, which was the probability to accurately predict groups
Table 6. Logistic regression results on the equivalent sound pressure level
Machines & equipment Coefficient Standard error Wald T Statistic p-value
Intercept -2.11240 0.03120 4,592.49 <.0001
Press & cutter 0.06990 0.00380 338.6 <.0001
Air compressor -0.00128 0.00807 0.03 0.874
Steam washer & hydraulic power washer 0.01740 0.02320 0.56 0.4547
Graining/grinding machine 0.00356 0.00157 5.14 0.0234
Sandblasting (shotblasting) equipment 0.24860 0.02770 80.74 <.0001
Circular saw 0.06540 0.01230 28.32 <.0001
Electrically powered hammer 0.33360 0.09200 13.14 0.0003
Rotary press (printer) -0.06770 0.04340 2.44 0.1183
Twisting/spinning/weaving machines 0.06510 0.00330 389.05 <.0001
Crusher -0.08430 0.02180 14.93 0.0001
Pipe mill/rolling mill/wire drawing machine 0.00760 0.00466 2.66 0.1029
Drill -0.10300 0.01530 45.38 <.0001
(High-speed) centrifuge 0.01810 0.03260 0.31 0.5778
High-speed mixer -0.19260 0.04730 16.6 <.0001
Rock drill 0.49780 0.15200 10.73 0.0011
Chain saw 0.60690 0.06580 85.08 <.0001
Engine cutter 0.13970 0.04470 9.74 0.0018
Impact wrench -0.00581 0.00219 7.01 0.0081
Vibration sorter/carrier/compressor 0.00277 0.00418 0.44 0.5083
Fig. 2. Evaluation on the validation set of the equivalent sound pressure level models.
The Risk Rating System for NIHLSaf Health Work 2011;2:336-47
345
www.e-shaw.org
with NIHL cases, was 0%, while the specificity, which repre-
sented predictions for groups without NIHL cases, was 100%.
Although the sensitivity and specificity could be escalated to
100% at maximum, this model was not adequate. Therefore,
when the cut-off value against posterior probability was set at
0.10, accuracy, sensitivity, and specificity recorded 64.62%,
45.54%, and 66.83%, respectively. In the neural network model,
accuracy, sensitivity, and specificity posted 64.03%, 42.68%, and
Table 7. Logistic regression results on the noise-induced hearing loss
Machines & equipment Coefficient Standard error Wald T Statistic p-value
Intercept -2.33370 0.05210 2,007.02 <.0001
Press & cutter 0.00341 0.00535 0.41 0.5244
Air compressor 0.02890 0.00847 11.67 0.0006
Steam washer & hydraulic power washer -0.00336 0.02370 0.02 0.8872
Graining/grinding machine 0.00194 0.00156 1.54 0.2143
Sandblasting (shotblasting) equipment 0.16960 0.03440 24.26 <.0001
Chain saw 0.01180 0.01650 0.51 0.4732
Electrically powered hammer 0.03110 0.05070 0.38 0.54
Rotary press (printer) -0.13390 0.07100 3.56 0.0592
Twisting/spinning/weaving machines -0.00512 0.00369 1.92 0.166
Crusher 0.00598 0.01640 0.13 0.7148
Pipe mill/rolling mill/wire drawing machine 0.00759 0.00562 1.83 0.1766
Drill 0.00923 0.01200 0.59 0.4408
(High-speed) centrifuge -0.03640 0.05090 0.51 0.4755
High-speed mixer -0.00174 0.01850 0.01 0.9253
Rock drill 0.05660 0.14860 0.15 0.7033
Chain saw 0.31240 0.09480 10.86 0.001
Engine cutter -0.05360 0.08410 0.41 0.5237
Impact wrench 0.00735 0.00255 8.3 0.004
Vibration sorter/carrier/compressor 0.00211 0.00521 0.16 0.685
Fig. 3. Evaluation on the validation set of the noise-induced hearing loss models.
Kim YS et al.Safety and Health at Work | Vol. 2, No. 4, Dec. 30, 2011
346
www.e-shaw.org
66.49% respectively with the cut-off value was set at 0.10 (Fig. 3).
It was rather difficult to come up with adequate models
with high accuracy, but some of them showed the relationship
between NIHL diagnoses and ESPL. It is assumed that more
adequate models can be devised if other factors are considered
including noise control equipment, NIHL patients’ exposure to
organic solvents and heavy metals, and their health conditions
like smoking, blood pressures, diabetes, and hyperlipidemia.
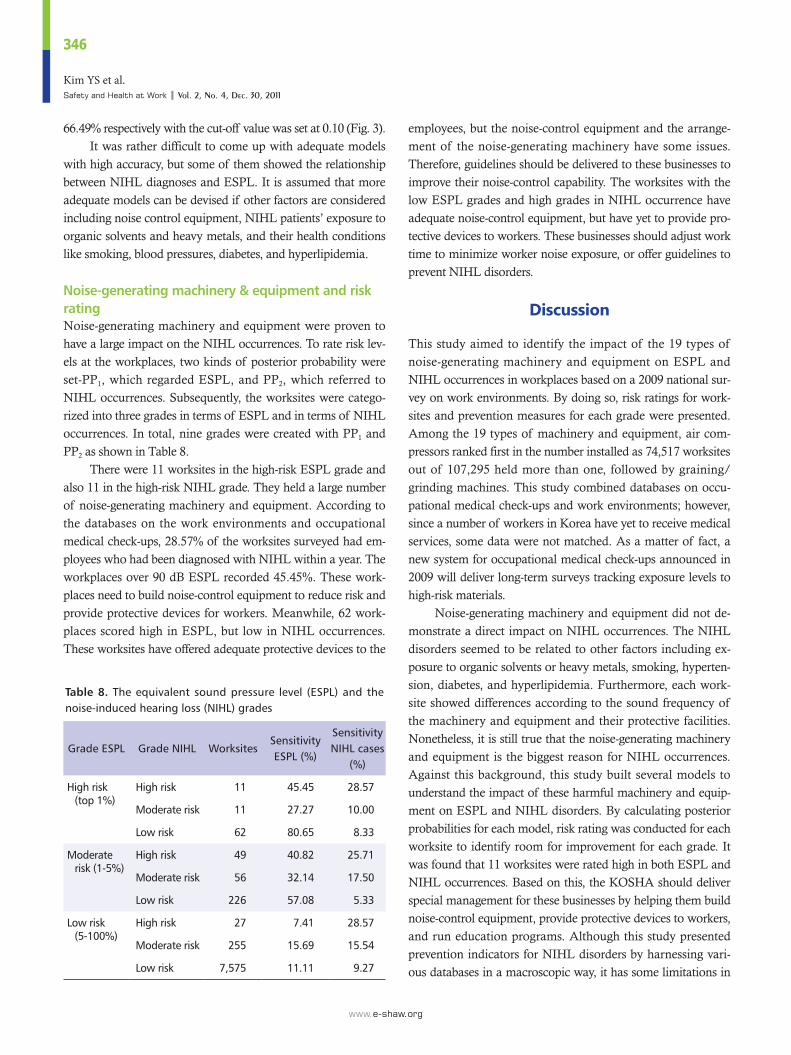
Noise-generating machinery & equipment and risk ratingNoise-generating machinery and equipment were proven to
have a large impact on the NIHL occurrences. To rate risk lev-
els at the workplaces, two kinds of posterior probability were
set-PP1, which regarded ESPL, and PP2, which referred to
NIHL occurrences. Subsequently, the worksites were catego-
rized into three grades in terms of ESPL and in terms of NIHL
occurrences. In total, nine grades were created with PP1 and
PP2 as shown in Table 8.
There were 11 worksites in the high-risk ESPL grade and
also 11 in the high-risk NIHL grade. They held a large number
of noise-generating machinery and equipment. According to
the databases on the work environments and occupational
medical check-ups, 28.57% of the worksites surveyed had em-
ployees who had been diagnosed with NIHL within a year. The
workplaces over 90 dB ESPL recorded 45.45%. These work-
places need to build noise-control equipment to reduce risk and
provide protective devices for workers. Meanwhile, 62 work-
places scored high in ESPL, but low in NIHL occurrences.
These worksites have offered adequate protective devices to the
employees, but the noise-control equipment and the arrange-
ment of the noise-generating machinery have some issues.
Therefore, guidelines should be delivered to these businesses to
improve their noise-control capability. The worksites with the
low ESPL grades and high grades in NIHL occurrence have
adequate noise-control equipment, but have yet to provide pro-
tective devices to workers. These businesses should adjust work
time to minimize worker noise exposure, or offer guidelines to
prevent NIHL disorders.
Discussion
This study aimed to identify the impact of the 19 types of
noise-generating machinery and equipment on ESPL and
NIHL occurrences in workplaces based on a 2009 national sur-
vey on work environments. By doing so, risk ratings for work-
sites and prevention measures for each grade were presented.
Among the 19 types of machinery and equipment, air com-
pressors ranked first in the number installed as 74,517 worksites
out of 107,295 held more than one, followed by graining/
grinding machines. This study combined databases on occu-
pational medical check-ups and work environments; however,
since a number of workers in Korea have yet to receive medical
services, some data were not matched. As a matter of fact, a
new system for occupational medical check-ups announced in
2009 will deliver long-term surveys tracking exposure levels to
high-risk materials.
Noise-generating machinery and equipment did not de-
monstrate a direct impact on NIHL occurrences. The NIHL
disorders seemed to be related to other factors including ex-
posure to organic solvents or heavy metals, smoking, hyperten-
sion, diabetes, and hyperlipidemia. Furthermore, each work-
site showed differences according to the sound frequency of
the machinery and equipment and their protective facilities.
Nonetheless, it is still true that the noise-generating machinery
and equipment is the biggest reason for NIHL occurrences.
Against this background, this study built several models to
understand the impact of these harmful machinery and equip-
ment on ESPL and NIHL disorders. By calculating posterior
probabilities for each model, risk rating was conducted for each
worksite to identify room for improvement for each grade. It
was found that 11 worksites were rated high in both ESPL and
NIHL occurrences. Based on this, the KOSHA should deliver
special management for these businesses by helping them build
noise-control equipment, provide protective devices to workers,
and run education programs. Although this study presented
prevention indicators for NIHL disorders by harnessing vari-
ous databases in a macroscopic way, it has some limitations in
Table 8. The equivalent sound pressure level (ESPL) and the noise-induced hearing loss (NIHL) grades
Grade ESPL Grade NIHL WorksitesSensitivity ESPL (%)
Sensitivity NIHL cases
(%)
High risk (top 1%)
High risk 11 45.45 28.57
Moderate risk 11 27.27 10.00
Low risk 62 80.65 8.33
Moderate risk (1-5%)
High risk 49 40.82 25.71
Moderate risk 56 32.14 17.50
Low risk 226 57.08 5.33
Low risk (5-100%)
High risk 27 7.41 28.57
Moderate risk 255 15.69 15.54
Low risk 7,575 11.11 9.27
The Risk Rating System for NIHLSaf Health Work 2011;2:336-47
347
www.e-shaw.org
building sophisticated models from microscopic perspectives.
To address these issues, it is recommended that other factors
including workers’ exposure to organic solvents or heavy met-
als, smoking, high blood pressure, diabetes, and hyperlipidemia
be considered. Moreover, the arrangements of machinery and
equipment in workplaces, noise-control facilities, frequencies
of the machinery, and protective gear should also be researched
for more accurate analysis. In this context, the author is plan-
ning to consider all of these factors in establishing a more reli-
able risk rating system.
Conflict of Interest
No potential conflict of interest relevant to this article was re-
ported.
Acknowledgments
This study was supported by the intramural research fund
of the Occupational Safety and Health Research Institute
(OSHRI).
References
1. Dobie RA. Medical-Legal Evaluation of Hearing Loss. 2nd ed. San Diego (CA): Singular Publishing Group; 2001. 393 p.
2. Thorne PR, Gavin JB. Changing relationships between struc-ture and function in the cochlea during recovery from intense sound exposure. Ann Otol Rhinol Laryngol 1985;94:81-6.
3. Zenz C, Dickerson OB, Horvath EP. Occupational Medicine. 3rd ed. St. Louis (MO): Mosby; 1994.
4. Hodgkinson L, Prasher D. Effects of industrial solvents on hearing and balance: a review. Noise Health 2006;8:114-33.
5. Gobba F. Sensory perception: an overlooked target of occupa-tional exposure to metals. Bioinorg Chem Appl 2003:199-214.
6. Cruickshanks KJ, Klein R, Klein BE, Wiley TL, Nondahl DM, Tweed TS. Cigarette smoking and hearing loss: the epi-demiology of hearing loss study. JAMA 1998;279:1715-9.
7. de Moraes Marchiori LL, de Almeida Rego Filho E, Matsuo T. Hypertension as a factor associated with hearing loss. Braz J Otorhinolaryngol 2006;72:533-40.
8. Starck J, Pyykkö I, Toppila E, Nieminen O, Pekkarinen J. Factors explaining individual variability in hearing level: Exposure to noise, hearing protection, blood pressure and cholesterol. Sixth US-Finnish Joint Symposium on Occupa-tional Health and Safety, People and Work, Research Report 3. Proceedings of the Sixth FIOH-NIOSH Joint Symposium on Occupational Health and Safety; 1995 Aug 8-10; Espoo, Fin-land. Helsinki (Finland): Finninsh Institute of Occupational Health; 1995. 199 p.
9. Lalwani AK, Liu YH, Weitzman M. Secondhand smoke and
sensorineural hearing loss in adolescents. Arch Otolaryngol Head Neck Surg 2011;137:655-62.
10. Bainbridge KE, Hoffman HJ, Cowie CC. Diabetes and hear-ing impairment in the United States: audiometric evidence from the National Health and Nutrition Examination Survey, 1999 to 2004. Ann Intern Med 2008;149:1-10.
11. Evans MB, Tonini R, Shope CD, Oghalai JS, Jerger JF, Insull W Jr, Brownell WE. Dyslipidemia and auditory function. Otol Neurotol 2006;27:609-14.
12. Ministry of Employment and Labor (KR). The 2009 Survey on Injuries and Illnesses. Gwacheon (Korea): Ministry of Em-ployment and Labor (KR); 2009. 1151 p. Korean.
13. Sensogut C. Occupational noise in mines and its control-A case study. Polish J Environ Stud 2007;16:939-42.
14. Sistkova M, Peterka A. The exposure of working environ-ment noise in the agricultural service workplace. Res Agr Eng 2009;55:69-75.
15. Nathak S, Puranik A, Schut J, Rao MD. Study on noise trans-mission from an air compressor. Proceedings of Noise-Con 2005; 2005 Oct 17-19; Minneapolis, MN. Washington, DC: Institute of Noise Control Engineering; 2005.
16. Nelson DI, Nelson RY, Concha-Barrientos M, Fingerhut M. The global burden of occupational noise-induced hearing loss. Am J Ind Med 2005;48:446-58.
17. Kinsella K, He W; US Census Bureau. An Aging World; 2008. International Population Reports P95/09-1. Washigton, DC: US Government Printing Office; 2009. 191 p.
18. Rosner B. Fundamentals of Biostatistics. 4th ed. Belmont (CA): Duxbury Press; 1995. 681 p.
19. Alan A. Categorical Data Analysis. 2nd ed. New York (NY): Wiley-Interscience; 2002.
20. Hosmer, David W, Lemeshow S. Applied Logistic Regression. 2nd ed. New York (NY): Wiley; 2000. 373 p.
21. Cheng B, Titterington D. Neural networks: a review from a statistical perspective. Statist Sci 1994;9:2-54.
22. Smith M. Neural Nnetworks for Statistical Modeling. Boston (MA): International Thomson Computer Press; 1996. 235 p.
23. Bigg D, De Ville B, Suen E. A method of choosing multiway pathway partitions for classification and decision trees. J Appl Statist 1991;18:49-62.
24. Cristianini N, Shawe-Taylor J. An Introduction to Support Vector Machines and Other Kernel-based Learning Methods. Cambridge (UK): Cambridge University Press; 2000. 189 p.
25. Hu MY, Shanker M, Hung MS. Estimation of posterior prob-abilities of consumer situational choices with neural network classifiers. Int J Res Mark 1999;16:307-17.
26. Ambergen AW, Schaafsma W. Interval estimates for posterior probabilities in a multivariate normal classification model. J Multivariate Anal 1985;16:432-9.
27. Chow GC. A comparison of the information and poste-rior probability criteria for model selection. J Econometrics 1981;16:21-33.