Embed Size (px)
Citation preview
THE REPUBLIC OF UGANDA
MINISTRY OF WORKS AND TRANSPORT
ANNUAL SECTOR PERFORMANCE REPORT
FY2016/17
September, 2017
i Annual Sector Performance Report FY 2016/2017
List of Tables: ……………………………………………………………………………………………………………………………… ii ABBREVIATIONS AND ACRONYMS…………………………………………………………………………………………………v FOREWORD……………………………………………………………………………………………………………………………………vii EXECUTIVE SUMMARY……………………………………………………………………………………………………………….….ix PART A: BACKGROUND ……………………………………………………………………………………………………………………….…1 1.0 INTRODUCTION………………………………………………………………………………………………………………………….1
1.1 Transport Sector Overview…………………………………………………………………………………………………………6
1.2 Monitoring and Evaluation Policy framework………………………………………………………………………..……6
1.3 Golden Indicators …………………………………………………………………………………………………………………...…8
1.4. Programme based Budgeting……………………………………………………………………………………………… …. .8
1.5 Government Annual Performance Report (GAPR) Indicators…………………………………………………….8
2.0 GUIDING POLICY DOCUMENTS AND PLANS FOR THE SECTOR…………………………………………………10
2.1 Uganda Vision 2040………………………………………………………………………………………………………….…… …10
2.2 National Development Plan (NDP II)…………………………………………………………………………………………10
3.0 INSTITUTIONS OF THE TRANSPORT SECTOR……………………………………………………………………………..11
3.1 Ministry of Works and Transport………………………………………………………………………………………………11
3.2 Uganda National Roads Authority……………………………………………………………………………………….……16
3.3 Uganda Road Fund………………………………………………………………………………………………………………..…16
3.4 Civil Aviation Authority……………………………………………………………………………………………………….……17
3.5 Uganda Railways Corporation…………………………………………………………………………………………….…….17
3.6 Other Institutions providing Key Transport Services……………………………………………………………….18
4.0 PERFORMANCE OF THE SECTOR AND SUB-SECTORS ……………………………………………………………….21
4.1 Perfomance on Policies and Strategies …………………………………………………………………………………..21
4.2 Analysis of the Performance Measured against Golden Indicators………………………………………….21
5.0 MINISTRY OF WORKS AND TRANSPORT………………………………………………………………………………….32
5.1 Financial Performance for MoWT…………………………………………………………………………………………….32
5.2 Physical Perfomance………………………………………………………………………………………………………………..33
5.2.1 Policy Planning and support services……………………………………………………………………………………….33
5.2.2 Directorate of Transport ………………………………………………………………………………………………………….35
5.2.3 Directorate of Engineering Works………………………………………………………………………………………………..44
ii Annual Sector Performance Report FY 2016/2017
5.2.4 Local Governments …………………………………………………………………………………………………………………...49
6.0 UGANDA ROAD FUND……………………………………………………………………………………………………….…….55
6.1 Financial Performance…………………………………………………………………………………………………….………55
6.2 Perfomance of Funds inflow…………………………………………………………………………………………………….58
6.3 Perfomance of Fnds Expenditure……………………………………………………………………………………………..61
6.4 Future Plans……………………………………………………………………………………………………………………………..62
6.5 Challenges and Proposed Mitigation Measures…..…………………………………………………………………..62
7.0 UGANDA NATIONAL ROADS AUTHORITY [UNRA]………………………………………………………………………67
7.1 Financial Performance…………………………………………………………………………………………………………….67
7.2 Physical Performance……………………………………………………………………………………………….……………….67
7.3 Performance on Feasibility and Design Studies…………………………………………………………………..…….72
7.4 Performance of National Road Maintenance…………………………………………………………………………….73
7.5 Performance of the Bridges Programme……………………………………………………………………………………74
7.6 Ferry Services……………………………………………………………………………………………………………………………76
7.7 Axle Load Control……………………………………………………………………………………………………………………..79
7.8 Challenges…………………………………………………………………………………………………………………………..……81
8.0 CIVIL AVIATION AUTHORITY…………………………………………………………………………………………………….82
8.1 Financial Performance…………………………………………………………………………………………………..………..82
8.2 PysicalPerformance………………………………………………………………………………………………………………...82
8.2 Challenges……………………………………………………………………………………………………………………………….87
9.0 UGANDA RAILWAYS CORPORATION……………………………………………………………………………………….89
9.1 Financial Performance…………………………………………………………………………………………………..………..89
9.2 Performance projects……………………………………………………………………………………………………………...91
9.3 Challenges and Proposed Mitigation Measures……………………………………………………………………….95
10.0 KAMPALA CAPITAL CITY AUTHORITY (KCCA)…………………………………………………………………………………96
10.1 Introduction………………………………………………………………………………………………………………………………….96
10.2 Financial Performance………………………………………………………………………………………………………………….96
10.3 Performance on the Golden Indicators………………………………………………………………………………………….98
iii Annual Sector Performance Report FY 2016/2017
10.5 Challenges………………………………………………………………………………………………………………………………….105
PART C: ANNEXES……………………………………………………………………………………………………………………………….107
List of Tables:
Table 4.1: Stock of National Paved roads………………………………………………………………………………………….….22 Table 4.2: Physical progress of ongoing upgrading project from gravel to bitumen standard…………....24 Table 4.3: Road Construction/Maintenance Cost per Kilometer (USD)…………………………………………..…..27 Table 4.4: Road Maintenance Unit Costs in the Period FY 2013/14 – FY 2016/17…………………………….…..27 Table 4.5: Maintenance Budget in Fy 2015/16 Relative To Requirements …………………………………………….28 Table 5.1: Vote Expenditures (UShs Billion) 2016/17……………………………………………………………………..…....32 Table 5.2: Ongoing Policy and Regulatory Development Processes as at June,2017……………………….…33 Table 6.1 : Road Maintenance Funding FY2010/11 – FY2017/18…………………………………………………….……..55 Table 6.2 : Allocation of Funds, 2016/17 …………………………………………………………………………………………….…56 Table 6.3 : Physical Performance of the National Roads Maintenance Programme in FY 2016/17…..… 57 Table 6.4 : Physical Performance of the City Roads Maintenance Programme in FY 2016/17………..… ..57 Table 6.5 : Physical Performance of the DUCAR Maintenance Programme in FY 2016/17…………………..58 Table 6.6: Summary of Funds Inflow to Vote 118, FY 2016/17………………………………………………………..….…58 Table 6.7 : Performance on KPIs for Funds Inflow, FY 2016/17…………………………………………………………….59 Table 6.8 : Summary of Funds Disbursements–FY 2016/17………………………………………………………….…….59 Table 6.9: Summary of Expenditures against Available Funds, FY 2016/17…………………………………….……61 Table 6.11: Global Allocation of Funds, FY 2016/2017…………………………………………………………………….…..63 Table 6.12: Summary of Road Maintenance Activities Planned to be funded in FY 2016/17………….….63 Table 6.13: Strategies to Improve Road Maintenance Financing ……………………………………………….….……64 Table 7.1: UNRA Performance 2016/17……………………………………………………………………………………….…….…67 Table 7.2: Percentage achieved and Km-Equiv. by project……………………………………………………………….…69 Table 7.3: Percentage achieved and Km-Equiv. by project……………………………………………………………..……71 Table 7.4: Road Maintenance Achievement for the FY 2011/12- FY 2016/17……………………………………..74 Table 7.5: Ferry Crossings linking National Roads…………………………………………………………………………………76 Table 7.7: Location of Weighbridges …………………………………………………………………………………………..….79 List of Figures:
Figure 1.1: Map Showing Air Fields in Uganda…………………………………………………………………………….…………3 Figure 1.2: Monitoring and Evaluation Process ……………………………………………………………………………….……7 Figure 1.3: Use of M&E Indicators for the Transport Sector…………………………………………………………………..7 List of Graphs
Graph 1.3: Trend in Budget Allocation to the Transport Sector as a Percentage of Total Budget ……………………………………………………………………………………………………………………………………………..……5 Graph 4.1: Trends in improvement in condition of paved road…………………………………………………………...24 Graph 4.2: Trends in improvement of the condition of unpaved roads……………………………………………….25 Graph 4.3: Trends in building the stock of paved roads…………………………………..………………………………..….26
iv Annual Sector Performance Report FY 2016/2017
ABBREVIATIONS AND ACRONYMS
AfDB African Development Bank
ASPR Annual Sector Performance Report
BADEA Arab Bank for Economic Development in Africa
CAA Civil Aviation Authority
CAR Community Access Road
CBD Central Business District
DANIDA Denmark Development Assistance
DAS Designated Agencies
DUCAR District, Urban and Community Access Roads
EAC East African Community
EACAA East African Civil Aviation Academy
EBB Entebbe International Airport
EIA Environmental Impact Assessment
ERB Engineers’ Registration Board
EU European Union
EXIM Export Import Bank of China
FY Financial Year
GAPR Government Annual Performance Report
GDP Gross Domestic Product
GoU Government of Uganda
Ha Hectare
ICAO International Civil Aviation Organisation
IDA International Development Association of the World Bank
IFC International Finance Corporation of the World Bank
ILS Instrument Landing System
IMO International Maritime Organisation
IPFs Indicative Planning Figures
IRI International Roughness Index
IWT Inland Water Transport
JICA Japan International Cooperation Agency
v Annual Sector Performance Report FY 2016/2017
JTSR Joint Transport Sector Review
KCCA Kampala Capital City Authority
KIIDP Kampala Institutional and Infrastructural Development Project
Km Kilometre
KPI Key Performance Indicators
LCs Local Councils
M&E Monitoring and Evaluation
MV Merchant Vessel
MAAIF Ministry of Agriculture, Animal Industry and Fisheries
MDA Ministry, Department and Agency
MELTC Mount Elgon Labour Based Training Centre
MoFPED Ministry of Finance Planning and Economic Development
MoLG Ministry of Local Government
MoPS Ministry of Public Service
MoU Memorandum of Understanding
MoWT Ministry of Works and Transport
MTEF Medium Term Expenditure Framework
MTRA Multi-Sectoral Transport Regulatory Authority
NAVAID Navigation Aid
NEMA National Environmental Management Authority
NMT Non-Motorised Transport
NTPS National Transport Policy and Strategy
NRM National Resistance Movement Organisation
NRSA National Road Safety Authority
OYRMP One Year Road Maintenance Plan
PPDA Public Procurement and Disposal of Public Assets Authority
PPP Private Public Partnership
PRDP Peace, Recovery and Development Plan
PS Permanent Secretary
PSV Public Service Vehicle
PU Privatisation Unit
RFP Request for proposals
vi Annual Sector Performance Report FY 2016/2017
RRP Rural Roads Rehabilitation Programme
RUC Road User Charge
RVR Rift Valley Railways
SG Solicitor General
SGR Standard Gauge Railway
SIP Strategic Implementation Plan
SwaP Sector Wide Approach
SWG Sector Working Group
TA Technical Assistance
TMEA Trade Mark East Africa
TMT Top Management Team
UBOS Uganda Bureau of Statistics
UGX Uganda Shillings
UNRA Uganda National Roads Authority
URA Uganda Revenue Authority
URC Uganda Railways Corporation
URF Uganda Road Fund
USD United States Dollars
VCT Voluntary Counselling and Testing
WB World Bank
vii Annual Sector Performance Report FY 2016/2017
FOREWORD
The Annual Sector Performance Report (ASPR) serves as the definitive record of Sector
performance for consideration by the Joint Transport Sector Review (JTSR). This report has
been prepared by the Ministry of Works and Transport in close collaboration with all Sector
agencies. The report shows the financial and physical performance of the Sector over the last
financial year, in line with the Government’s commitment to transparency and accountability.
The ASPR provides a description of major events, activities and accomplishments during the
reporting period.
The report provides an opportunity to identify the key issues affecting the Sector, and to put
forward the key strategies for improving performance. Each sub-sector has identified key issues
and strategies intended to improve efficiency and levels of service. This report compares the
performance of the Sector for the FY 2016/17 with that of the previous four years.
Iam pleased to report improved performance in:
Upgrading and expansion of Entebbe international Airport.
Coordination of road safety awareness programmes.
Feasibility studies and engineering designs for development of railways.
Monitoring compliance of construction standards
Routine mechanized maintenance of unpaved national road network.
The achievements in the past financial year were significant. Construction of 5 new bridges was
completed in FY 2016/17 and two roads, FortPortal-Kamwenge and Ntungamo-Mirama Hills
were substantially completed in FY 2016/17, adding 100km to the paved roads stock in the year.
This has increased the coverage of paved national roads from 3,264km in FY2010/11 to 4,257km
in FY2016/17.
The Government wishes to acknowledge the support it continues to receive from Development
Partners for the Sector. Service delivery remains the cornerstone of the wider Government
undertakings. Therefore, their support has made it easier for Government to realise this noble
objective.
I wish to thank my Ministry’s staff for their commitment and hard work in delivering on the set
targets in FY 2016/17. I look forward to next year, as we continue to help shape the future of
transport in Uganda.
Lastly, Transport continues to be central to the country’s economic development. All
Stakeholders should keep keen interest in tracking and evaluating its performance. It is
anticipated that this Report will stimulate constructive feedback. I solemnly invite and welcome
feedback to spur further improvement in the performance of the Sector.
Monica Azuba Ntege
Minister of Works and Transport
viii Annual Sector Performance Report FY 2016/2017
EXECUTIVE SUMMARY
Overall Purpose
The purpose of the Annual Sector Performance Report (ASPR) is to profile performance of the
Transport Sector from a policy and strategic perspective. The report is a profile of the progress
made in implementing of commitments in the Ministerial Policy Statement, overall sector
performance against the targets set for the FY 2016/17, and trends in performance of agreed
indicators over the previous FYs.
The report identifies issues that form the background for an analysis of main challenges for the
sector. Challenges focus on needs for adjustment of policy and strategic orientation, institution
reforms, planning and implementation, and budgetary renew. The report will be discussed at the
Annual Joint Transport Sector Review (JTSR), and is based on the assessment of what has been
achieved and what has not, and reasons why, to guide future planning.
The ASPR
This ASPR provides a record of the performance of the Transport Sector for the financial year
2016/2017. This is the seventh report of this nature prepared specifically for the sector. The
report builds on the last six such reports. The M&E Framework consists of 18 Golden Indicators
that summarize the state of works and transport situations in the road, rail, air and water transport
sub-sectors. The assessment of performance is measured against Golden Indicators agreed within
the sector for results-based management, also assessed as well are GAPR (Government Annual
Performance Report) indicators, which are accountability-oriented and include output and
outcome indicators.
Financial Performance
The approved budget for the sector for FY 2016/17 was UGX 3,455.36 billion of which UGX
3,091.88 billion (89.5%) was released and UGX 2,717.18 Bn absorbed. GoU Capital
Development funding (approved) to the sector was UGX 7,593 Bn and UGX 7,458 Billion
(98.2%) of the funds was released by June 2017 compared to 95.5% released during FY
2015/2016. The Ministry of Works and Transport and Uganda Road Fund absorbed all the
released budgets while Uganda National Roads Authority absorbed 82.5% of its released budget
of UGX 2,142.8 Bn. Budget performance for the sector improved to 89.5% in FY 2016/17 from
74.3% in FY 2015/16.
Roads
Construction of 5 new bridges was completed in FY 2016/17 and two roads, Fort Portal-
Kamwenge and Ntungamo-Mirama Hills were substantially completed in FY 2016/17, adding
100km to the paved roads stock in the year. This has increased the coverage of paved national
roads from 3,264km in FY2010/11 to 4,257km in FY2016/17. The percentage of paved national
roads in fair to good condition has improved from 74% to 80% between FY2010/11 and FY
2016/17 while it has increased from 64% to 70% over the same period for unpaved roads. In the
FY2016/17, the sector met the target on routine maintenance of unpaved roads (mechanized) and
160km of the paved roads were rehabilitated to reinstate their serviceability.
ix Annual Sector Performance Report FY 2016/2017
The key operational issue in the road subsector is axle load control. Axle loading on the national
road network continues, thereby resulting in deterioration of the network and the need for
additional finance to rehabilitate damaged roads. During the FY 2016, the number of vehicles
weighed reduced from 654,389 to 575,211. However, the percentage of overloaded vehicles
increased slightly from 2.1% to 3.7% by june 2017
Road Safety
Reports from Uganda Police indicate that by the end of December 2016, a total of 14,474 road
traffic crashes had been recorded which is a decrease from 18,495 crashes recorded in 2015.
However, the fatalities (number of people dying as a result of these accidents) increased from
3,224 to 3,503 persons over the same period and the trend has been the same for the last 5 years.
This rate of deaths as a result of accidents is alarming since the above statistics indicate that on
average almost 10 persons died on Ugandan roads on a daily basis in 2016.
Air Transport
The number of air traffic (international) passengers has been increasing steadily since 2012 from
1.33 million to 1.53 million in 2016. There was also an increase between 2014 and 2015 from
1.43million to 1.50 million passengers. On the other hand, air traffic cargo has been unstable
over the same period reducing from 57,919 tonnes in 2012 to 57,719 tonnes in 2013 and 54,856
tonnes in 2014 before increasing to 56,465 tonnes in 2015 and further to 59,556 tonnes in 2016.
During the FY2016/17, rehabilitation and expansion of Entebbe International Airport was
ongoing with overall physical performance of 13.8 percent by the end of June, 2017. Atleast 95
percent of earthworks for the cargo center was completed and all preliminary designs for cargo
center, terminal building and air craft movement areas were completed. Detailed design for the
cargo center was also completed and work on Apron 1 expansion commenced.
Railway Transport
The performance of the railway infrastructure in terms of rail freight cargo has been unstable
dropping from 157.2 million Net-ton-Km in FY2010/11 to 132.4 million Net-ton-km in
FY2013/14. It increased to 171.1 million tonnes in FY 2014/15 before falling again to 118.9
million ton-Km in FY 2016/17. The wagon transit time (Mombasa-Kampala-Mombasa)
increased from 25 days in FY 2015/16 to 34 days in FY 2016/17.
Inland Water Transport
Inland water transport is dominated by the so-called “informal sector” of small motorised and
non-motorised boats. The country’s inland waterways notably Lake Victoria, can offer
alternative competitive transport of passengers and freight between Uganda and neighbouring
countries. This mode of transport is constrained by various problems. Capacity of service level
and security problems are being addressed by Government through improvements in the
infrastructure, policy and regulatory framework.
x Annual Sector Performance Report FY 2016/2017
Concluding Remarks
Overall, performance of the Transport Sector, during FY 2016/17, was generally positive except
for the railway transport sector where there was a decline. . Even where targets were met they,
were lower than targets set in the National Development Plan (NDPII) for the Transport Sector.
More needs to be done to achieve the NDPII and, by implication, to be able keep Uganda Vision
2040 within reach.
1 Annual Sector Performance Report FY 2016/2017
PART A: BACKGROUND
1.0 INTRODUCTION
Uganda Vision 2040 emphasizes that the country must urgently attain an integrated transport
infrastructure network to spur its own economic growth. This will entail development of a highly
interconnected transport network and services optimizing the use of rail, road, water and air
transport modes. The Transport Sector which also includes the construction industry plays a
crucial role in the country’s economic growth. An efficient and effective transport infrastructure
and services ease domestic and international trade and contribute to national integration. It
provides access to markets, jobs, health care, education and other essential social services. A
vibrant construction industry provides skills, jobs and a market for construction materials.
The Second National Development Plan (NDPII) recognizes infrastructure as one of the
development fundamentals required to attain the middle income status target by 2040. As a
result, a sizeable share of commitments is being directed to infrastructure investments with a
focus on reducing travel times between regions, integrating the national market and connecting it
to other markets in the East African Community. The initiative will create a positive impact on
national competitiveness, growth and regional integration. This recognition has been reflected in
the budget financing where close to 17% of the budget for FY 2017/18 was allocated to finance
activities in the Transport sector.
This Annual Sector Performance Report for FY2016/17 aims at providing stakeholders with an
account of the performance in the delivery of Government Programmes. The report provides
information on budget and the physical performance measured against indicators and the Action
Plan Matrix agreed upon at the 12th Joint Transport Sector Review. It is a requirement that every
Sector prepares an Annual Sector Performance Report outlining its performance every year. This
is the 7th Annual Sector Perfomance Report (ASPR).
The report outlines performance of the Sector over the last FY 2016/17, compared with the
baseline established in FY 2012/13 and the 6th ASPR for FY 2015/16. It is laid out in two parts:
A and B. Part A comprises the introduction, guiding policy documents and plans for the sector
and provides an outline of the intitutions of the sector. Part B details the performance of the
sector and its subsectors.
1.1 Transport Sector Overview
The Transport Sector in Uganda is divided into sub-sectors based on transport mode. These are:
road, railway, water and air. These modes collectively comprise the country’s transport system.
Road transport is the dominant mode, accounting for over 90% of cargo freight and passenger
movements.
1.1.1 Road Transport
The country’s road network falls into four categories:
2 Annual Sector Performance Report FY 2016/2017
i) National Roads
National Roads are managed by the Uganda National Roads Authority (UNRA).
The national roads network totals to 20,544km consisting of paved and unpaved roads. As of June
2017, the paved road network was 4,257 km while the unpaved was 16,388km. The national road
network also comprises of 10 ferries located at strategic points that link national roads across major water bodies..
ii) District Roads,
District roads are managed by the District Local Governments and the total district road network is around 35,566 km.
iii) Urban Roads
Urban roads, are those roads within the boundaries of Urban Councils (Municipal and Town
Councils) but exclude links maintained by UNRA. The urban roads network totals approximately 12,000km.
iv) Community Access Roads.
Community access roads are managed by Local Council III (sub-county) Governments. Community access roads are estimated at 78,000 km.
1.1.2 Railway Transport
Railway transport is internationally recognized as the cheapest form of transport. The rail
network extends for an estimated 1,260 kms. It comprises:
i) The main line from Kampala to Tororo/Malaba, part of the Northern Corridor between
Kampala and Mombasa:250km;
ii) Spur lines to Jinja and Port Bell ferry terminals on Lake Victoria for routes to Kisumu
(Kenya) and Mwanza (Tanzania):21km;
iii) The western line from Kampala to Kasese:333km;
iv) The northern line from Tororo to Pakwach:641km and;
v) The Busoga Loop line: 15km.
The railway transport system in Uganda also includes rail wagon ferry services on Lake Victoria
connecting Port Bell and/or Jinja to rail networks in Tanzania at Mwanza and Kisumu in Kenya.
The Uganda rail track is one metre gauge. The Government is in the processs of constructing a
standard gauge railway between Torororo –Pakwach and Kampala- Tororo and Malaba -
Kampala.
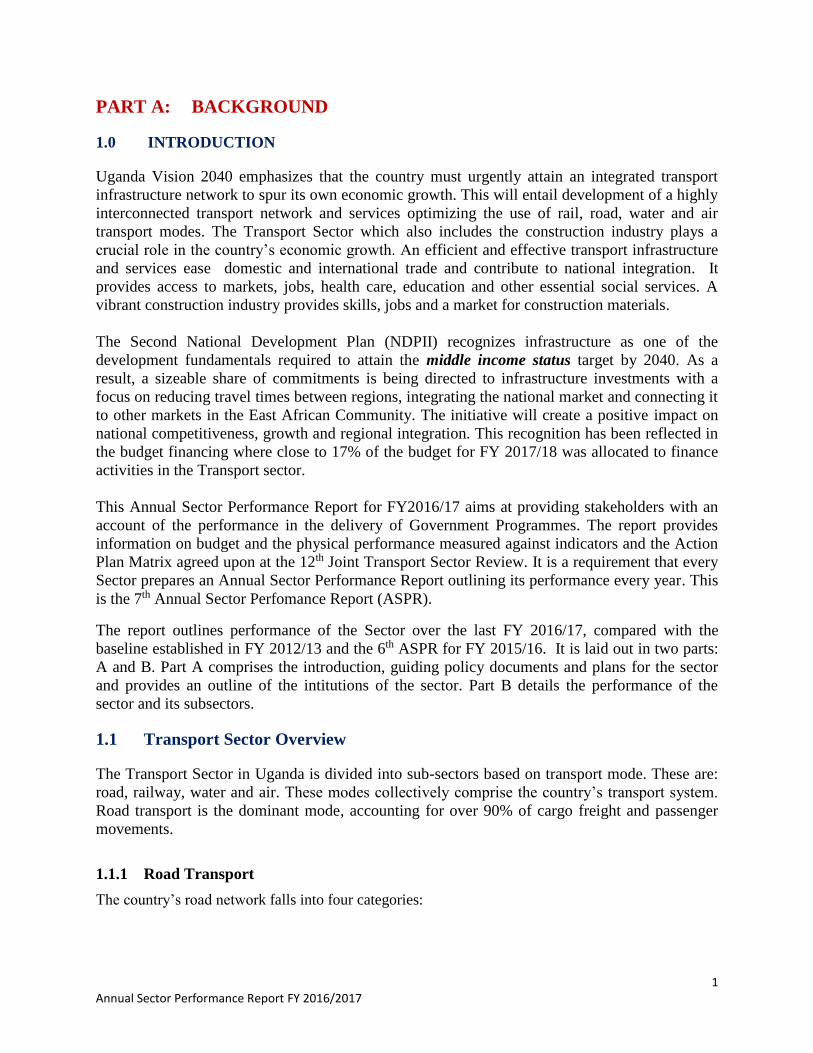
1.1.3 Air Transport
There are fourteen (14) national airports in the country which are managed by Civil Aviation
Authority (CAA). These are; Entebbe, Arua, Gulu, Soroti, Kasese, Kisoro, Jinja, Kidepo, Lira,
3 Annual Sector Performance Report FY 2016/2017
Pakuba, Tororo, Masindi, Mbarara and Moroto.Entebbe International Airport (EBB) is the main
entry and exit point for international air traffic in Uganda. Government designated five other
airports as entry/exit (international) points to promote trade and tourism. These are; Arua, Gulu,
Pakuba, Kidepo and Kasese. The rest of the up-country airports are either privately owned.
Fig1.1 is a map of Uganda showing the distribution of airports and aerodromes in the country.
Figure 1.1: Map Showing Air Fields in Uganda
1.1.4 Water Transport
About 18 per cent of Uganda’s surface area consists of lakes, rivers or swamps. The principal lake
and river system includes Lake Victoria, Lake Kyoga, Lake Albert and Lake George, together with
River Kagera, the Victoria Nile and the Albert Nile. Currently, both motorized and non-motorized
vessels ply the above lakes and rivers.
Apart from the wagon ferries operated by RVR, and ferries operated by UNRA and Kalangala
Infrastructure Services (KIS) vessels, the other formal services are, the MV Kalangala which plies
between Nakiwogo near Entebbe and Lutoboka in the Ssese Islands, Lake Bisina Ferry operated by
the Government of Uganda, and the Uganda Wildlife Authority vessels on Lake Kyoga, Lake Albert
& the River Nile.
4 Annual Sector Performance Report FY 2016/2017
Overall navigation on Uganda water bodies remains risky. This is largely because over 90% of the
vessels are of traditional build and our water bodies lack hydrographical and bathymetrical charts,
except those that were conducted on Lake Victoria charted in 1901. The charts on Lake Victoria are
too old to be relied on for safe navigation especially around populated islands.
The water transport sub-sector has been characterized by disjointed and obsolete laws, regulations
and standards which require review and harmonization. This has heavily deterred implementation of
International Conventions related to safe, secure and environmentally friendly water bodies. It has
also, caused several water sector related causalities due to lack of professional skills in vessel
operations and unskilled seafarers manning the traditionally built vessels.
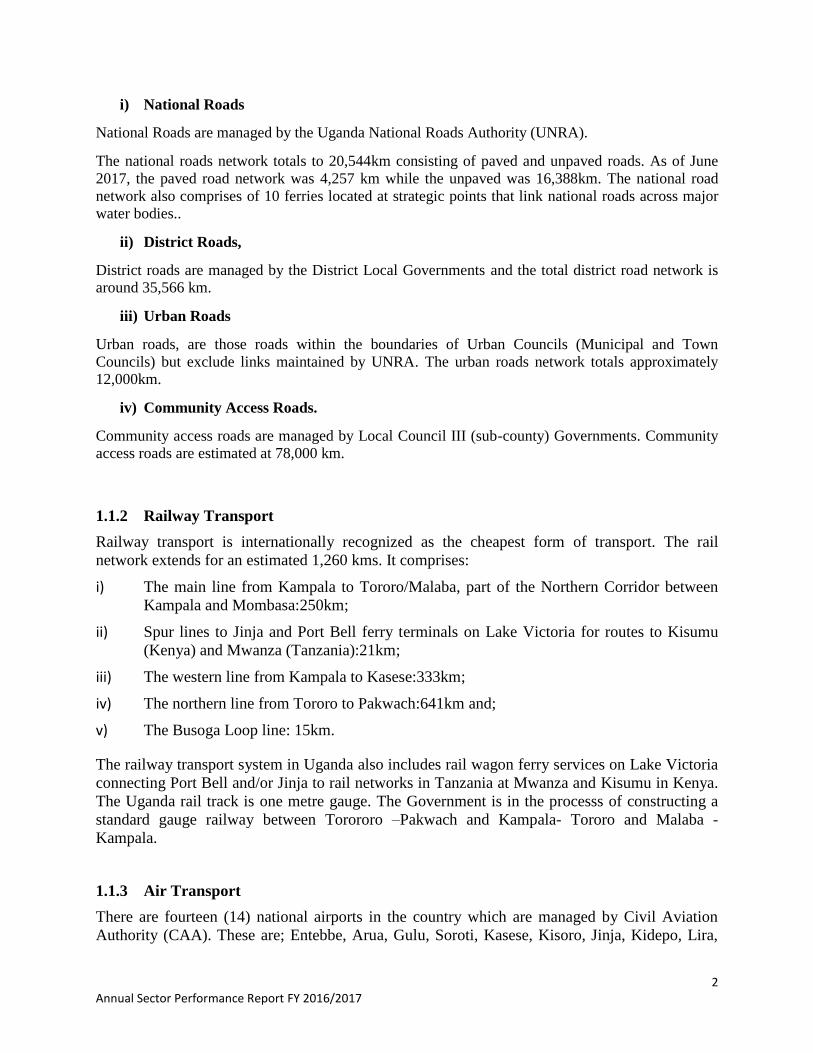
Water transport sub-sector has an estimated passenger crossing of 6-8 million per year at different
landing sites and the number still increasing with the introduction of new ferries like Albert Nile 2 on
Lake Albert (with capacity of 250 passengers and vehicles) and Kyoga 2 Vessel on Lake Kyoga
(with capacity of 220 passengers and vehicles).
UNRA passenger ferry Traditional build boat
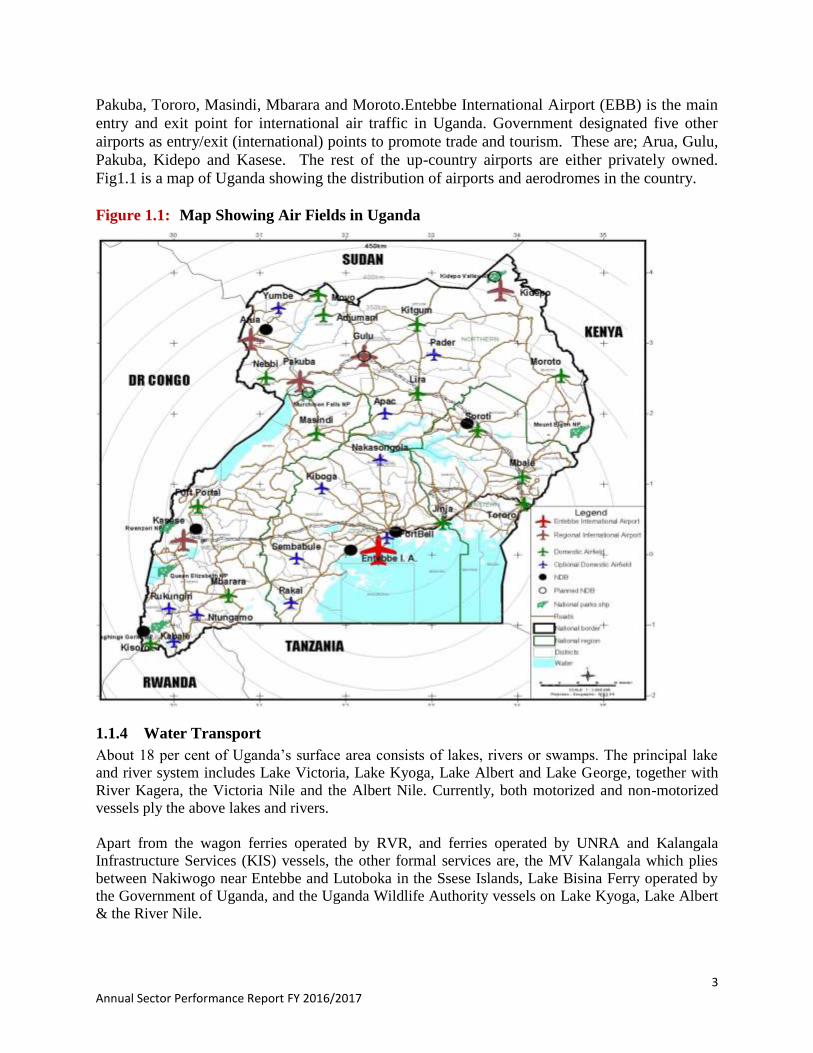
Aqua-tourism
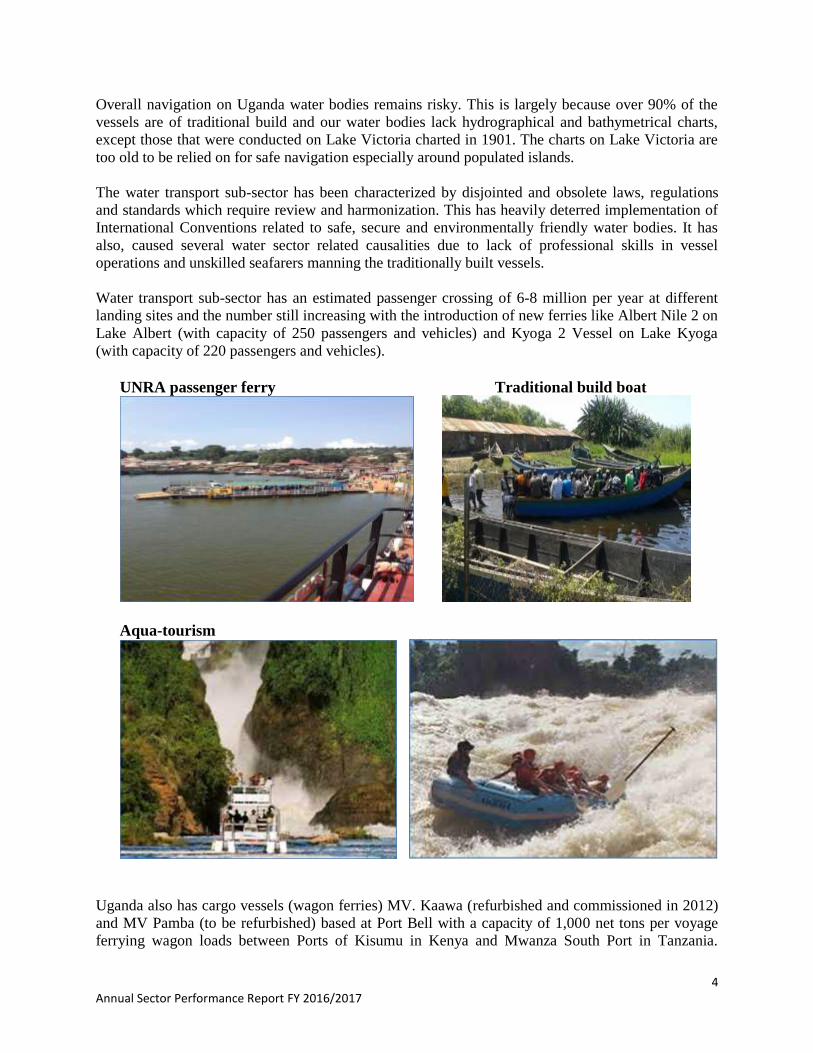
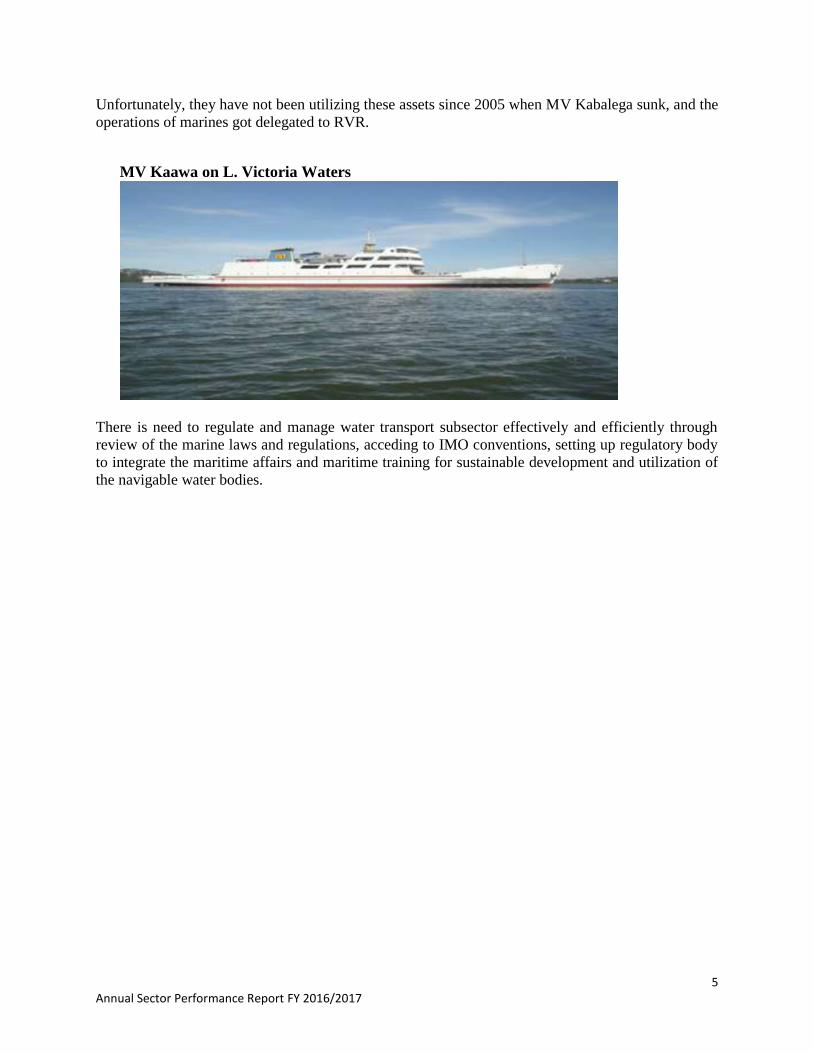
Uganda also has cargo vessels (wagon ferries) MV. Kaawa (refurbished and commissioned in 2012)
and MV Pamba (to be refurbished) based at Port Bell with a capacity of 1,000 net tons per voyage
ferrying wagon loads between Ports of Kisumu in Kenya and Mwanza South Port in Tanzania.
5 Annual Sector Performance Report FY 2016/2017
Unfortunately, they have not been utilizing these assets since 2005 when MV Kabalega sunk, and the
operations of marines got delegated to RVR.
MV Kaawa on L. Victoria Waters
There is need to regulate and manage water transport subsector effectively and efficiently through
review of the marine laws and regulations, acceding to IMO conventions, setting up regulatory body
to integrate the maritime affairs and maritime training for sustainable development and utilization of
the navigable water bodies.
6 Annual Sector Performance Report FY 2016/2017
1.2 Monitoring and Evaluation Policy Framework
Current Sector M&E Framework
The National Public Sector Monitoring and Evaluation Policy
The National M&E policy that was spearheaded by the Office of the Prime Minister (OPM)
provides a clear framework for strengthening the coverage, quality and utility of the
assessment of public policies and investments intended to achieve socio-economic
development. The Policy also aims at improving confidence of Ugandans in the capacity of
Government to hold its Ministries, Departments and Agencies (MDAs) to account based on
reliable data. This framework applies to all policies, strategies, programmes and projects
managed by Ministries, Departments, and Agencies.
The Works and Transport Sector Monitoring and Evaluation Framework
In FY 2012/13, the Ministry of Works and Transport developed a comprehensive Monitoring
and Evaluation framework to enhance monitoring in the Transport Sector. The M&E
framework is based on the national strategy for institutionalizing the use of M&E as a tool for
better public sector management, transparency and accountability. The framework sets out
mechanisms by which the Transport sector monitors its own performance. Monitoring is
routine but reported on annually and the results are reported to the annual Joint Transport
Sector Review (JTSR), as part of the Sector Performance Report. The M&E framework
contains a number of key indicators by which the performance of the sector is measured. The
indicators are related to the mandates and functions of the Ministry and its agencies, and the
objectives of the National Development Plan (NDPII).
Performance Assessment as a Component of M &E
M&E is a process (see Figure 1.2)). Outputs (sub-sector interventions), outcomes (transport
sector objectives) and impacts (GoU objectives and expectations) are the types of indicators
usually compiled, but these are only part of the process. The boxes in the left part of Figure
1.2 have to be completed so that targets can be set against which to measure performance.
Timescales need to be established for targets to be achieved and there must be feedback so
that actions can be established for under-performing areas, whereby either targets or
timescales are amended, or the indicators themselves changed so that performance against
targets can be improved.
7 Annual Sector Performance Report FY 2016/2017
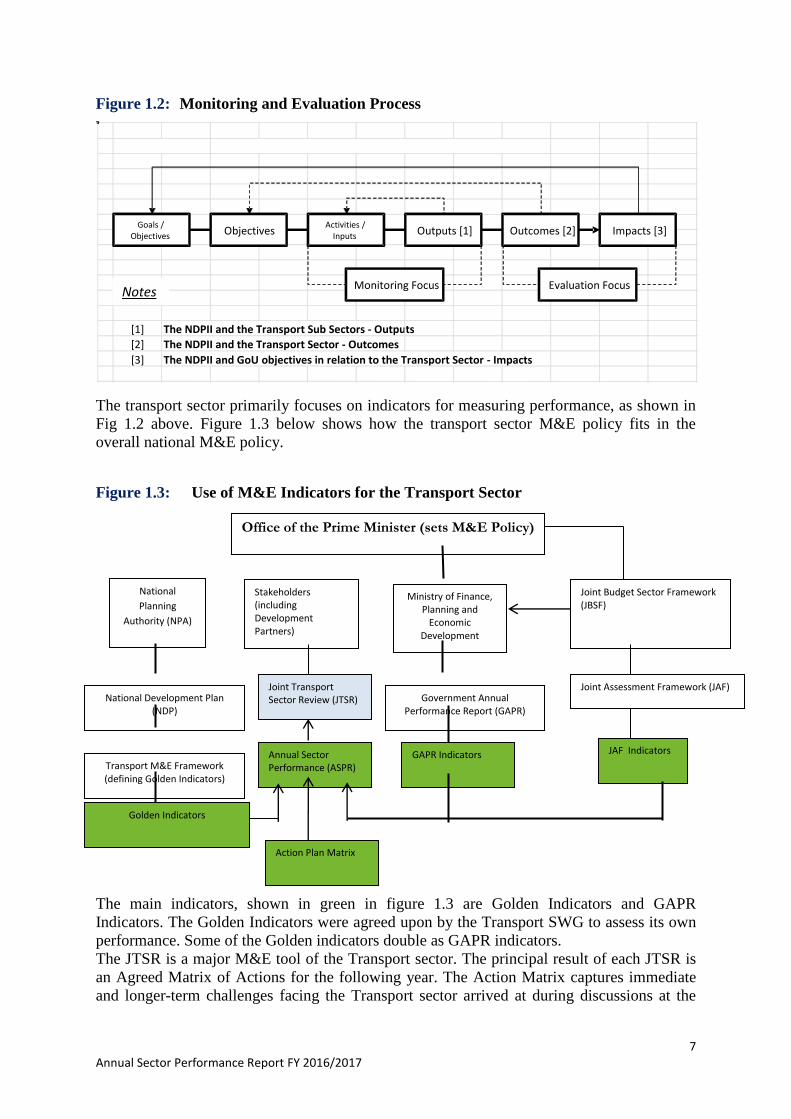
Figure 1.2: Monitoring and Evaluation Process
The transport sector primarily focuses on indicators for measuring performance, as shown in
Fig 1.2 above. Figure 1.3 below shows how the transport sector M&E policy fits in the
overall national M&E policy.
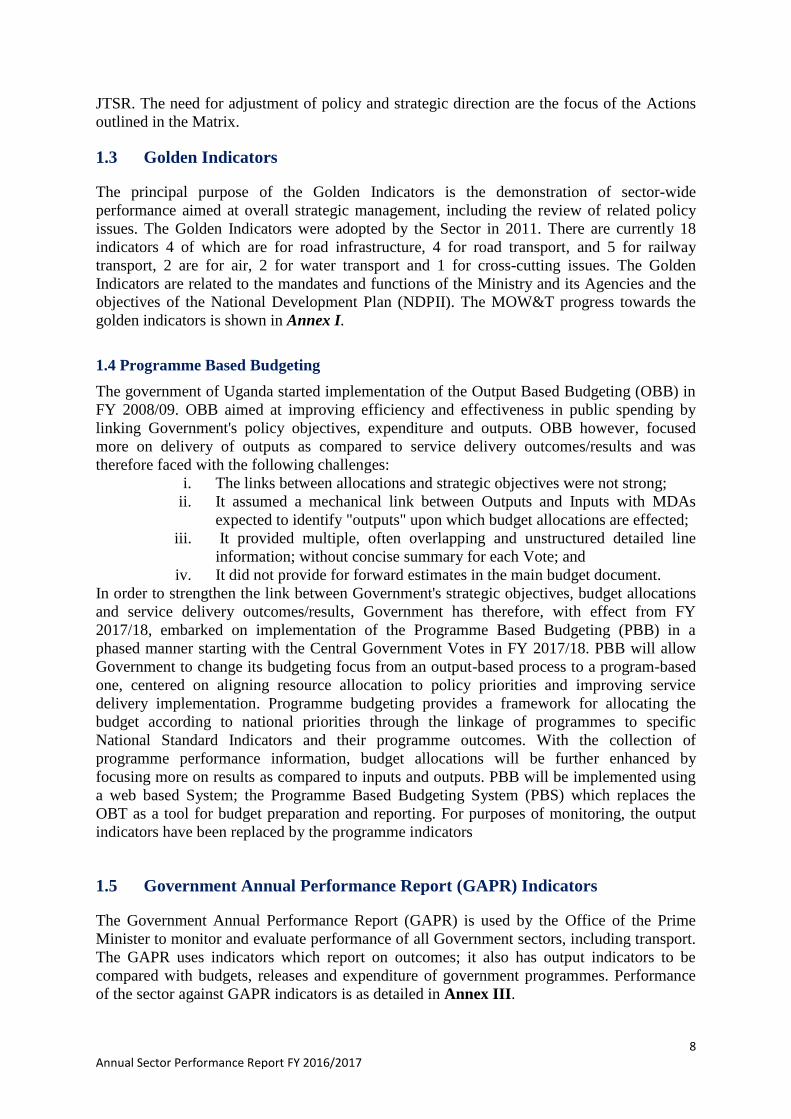
Figure 1.3: Use of M&E Indicators for the Transport Sector
The main indicators, shown in green in figure 1.3 are Golden Indicators and GAPR
Indicators. The Golden Indicators were agreed upon by the Transport SWG to assess its own
performance. Some of the Golden indicators double as GAPR indicators.
The JTSR is a major M&E tool of the Transport sector. The principal result of each JTSR is
an Agreed Matrix of Actions for the following year. The Action Matrix captures immediate
and longer-term challenges facing the Transport sector arrived at during discussions at the
[1] The NDPII and the Transport Sub Sectors - Outputs [2] The NDPII and the Transport Sector - Outcomes [3] The NDPII and GoU objectives in relation to the Transport Sector - Impacts
Monitoring Focus Evaluation Focus
Objectives Goals / Objectives
Activities / Inputs Outputs [1] Outcomes [2] Impacts [3]
Notes
Office of the Prime Minister (sets M&E Policy)
Transport M&E Framework (defining Golden Indicators)
National Development Plan (NDP)
Government Annual Performance Report (GAPR)
Ministry of Finance, Planning and
Economic Development
Joint Budget Sector Framework (JBSF)
National
Planning
Authority (NPA)
Stakeholders (including Development Partners)
Joint Assessment Framework (JAF)
GAPR Indicators Annual Sector Performance (ASPR)
Joint Transport Sector Review (JTSR)
JAF Indicators
Golden Indicators
Action Plan Matrix
8 Annual Sector Performance Report FY 2016/2017
JTSR. The need for adjustment of policy and strategic direction are the focus of the Actions
outlined in the Matrix.
1.3 Golden Indicators
The principal purpose of the Golden Indicators is the demonstration of sector-wide
performance aimed at overall strategic management, including the review of related policy
issues. The Golden Indicators were adopted by the Sector in 2011. There are currently 18
indicators 4 of which are for road infrastructure, 4 for road transport, and 5 for railway
transport, 2 are for air, 2 for water transport and 1 for cross-cutting issues. The Golden
Indicators are related to the mandates and functions of the Ministry and its Agencies and the
objectives of the National Development Plan (NDPII). The MOW&T progress towards the
golden indicators is shown in Annex I.
1.4 Programme Based Budgeting
The government of Uganda started implementation of the Output Based Budgeting (OBB) in
FY 2008/09. OBB aimed at improving efficiency and effectiveness in public spending by
linking Government's policy objectives, expenditure and outputs. OBB however, focused
more on delivery of outputs as compared to service delivery outcomes/results and was
therefore faced with the following challenges:
i. The links between allocations and strategic objectives were not strong;
ii. It assumed a mechanical link between Outputs and Inputs with MDAs
expected to identify "outputs" upon which budget allocations are effected;
iii. It provided multiple, often overlapping and unstructured detailed line
information; without concise summary for each Vote; and
iv. It did not provide for forward estimates in the main budget document.
In order to strengthen the link between Government's strategic objectives, budget allocations
and service delivery outcomes/results, Government has therefore, with effect from FY
2017/18, embarked on implementation of the Programme Based Budgeting (PBB) in a
phased manner starting with the Central Government Votes in FY 2017/18. PBB will allow
Government to change its budgeting focus from an output-based process to a program-based
one, centered on aligning resource allocation to policy priorities and improving service
delivery implementation. Programme budgeting provides a framework for allocating the
budget according to national priorities through the linkage of programmes to specific
National Standard Indicators and their programme outcomes. With the collection of
programme performance information, budget allocations will be further enhanced by
focusing more on results as compared to inputs and outputs. PBB will be implemented using
a web based System; the Programme Based Budgeting System (PBS) which replaces the
OBT as a tool for budget preparation and reporting. For purposes of monitoring, the output
indicators have been replaced by the programme indicators
1.5 Government Annual Performance Report (GAPR) Indicators
The Government Annual Performance Report (GAPR) is used by the Office of the Prime
Minister to monitor and evaluate performance of all Government sectors, including transport.
The GAPR uses indicators which report on outcomes; it also has output indicators to be
compared with budgets, releases and expenditure of government programmes. Performance
of the sector against GAPR indicators is as detailed in Annex III.
9 Annual Sector Performance Report FY 2016/2017
1.6 Progress towards Foreign Funded Projects
Between 2007 and June 2017, the Loans acquired for projects in the Transport Sector were
worth USD 2,161.98 million and 40.5% was released by June 2017 an increase from 35.0%
in June 2016. With support from Development Partners, the Government has been able to
implement a number of road projects in the FY 2016/17. The status of implementation in
terms of physical progress, source of funding and the expected lifespan for some of the
projects is given in Annex IV.
10 Annual Sector Performance Report FY 2016/2017
2.0 GUIDING POLICY DOCUMENTS AND PLANS FOR THE
SECTOR
2.1 Uganda Vision 2040
The Transport Sector operates within various frameworks, the over-arching of which is the
Uganda Vision 2040 (officially launched on 18th April 2013). The Uganda Vision 2040
articulates policy directions to transform Uganda into a competitive upper middle income
country with a per capita income of USD 9,500 by 2040. It is expected that over the Vision
2040 horizon, average real GDP growth rate will be above 8.2 % per annum.
Regarding transport, Uganda must urgently attain a critical mass of transport infrastructure to
support the above GDP growth rate. This will require development of a highly interconnected
transport network optimising the use of rail, road, water and air transport modes. This will
entail development of:
i) A railway system with high speed trains using the latest technology for both
passenger and freight transport;
ii) A road infrastructure that will improve transport connectivity, effectiveness and
efficiency;
iii) Mass public transport system in cities and urban centres along with measures to
eliminate traffic congestion;
iv) Entebbe International Airport and the five identified entry point airports and the
associated infrastructure in other parts of the country;
v) Marine transport infrastructure: and
vi) Setting up an Infrastructure Fund
2.2 National Development Plan (NDP II)
The National Development Plan (NDPII) covers the fiscal period FY 2016/17-2019/20. It
outlines the country’s medium term strategic direction, development priorities and
implementation strategies. It was designed to be the primary Government strategic plan, the
anchor for Government fiscal strategy, and lower level or sectoral plans. Implementation of
the NDPII will require monitoring of the progress to provide a comprehensive assessment of
the country’s socio-economic performance. There are five strategic objectives in the NDPII
for the Transport Sector and they are to:
a) Develop adequate, reliable and efficient multi modal transport network in the country;
b) Improve the human resource and institutional capacity of the Sector to efficiently
execute the planned interventions:
c) Improve the National Construction Industry (policy, legal, regulatory and institutional
framework);
d) Increase safety of transport services.
11 Annual Sector Performance Report FY 2016/2017
3.0 INSTITUTIONS OF THE TRANSPORT SECTOR
3.1 Ministry of Works and Transport
The Ministry of Works and Transport has an important role in advising the Government. As a
policy agency, the Ministry is able to influence the policy and regulatory settings under
which the transport system operates. The Ministry Works with other agencies ensure they
successfully undertake their own roles for the Ministry outcomes to be achieved. The
Ministry of Works and Transport is the Lead Agency in the Transport Sector.
The Vision of the Minsitry is: “To provide reliable and safe Works, Transport
Infrastructure and Services”.
The Mission of the Ministry is: “To promote adequate, safe and well maintained
works and Transport Infrastructure and Services for Social Economic Development of
Uganda”.
a) The mandate of the ministry is to: Plan, develop and maintain an economical, efficient
and effective transport infrastructure;
b) Plan, develop and maintain economical, efficient and effective transport services by
road, rail, water and air;
c) Manage public works including government structures and
d) Promote good standards in the construction industry.
The MoWT has overriding responsibility for the management of all transport functions within
the transport sector and as such performs the following general functions:
a) Initiate, formulate and develop national policies, plans and programmes for safe and
efficient transport infrastructure and services.
b) Monitor and evaluate the implementation of national policies, plans and programmes
for safe and efficient execution of all works including public transport infrastructure
and services.
c) Initiate and review laws and regulations on all works including transport
infrastructure and services.
d) Set national standards for the construction industry including transport infrastructure
and services.
e) Enforce compliance to national policies, laws, regulations, strategies and guidelines
on works, transport infrastructure and services.
f) Provide technical support for construction and maintenance undertaken by
Government Ministries, Departments and Agencies.
g) Carry out research and develop local materials for the construction industry.
12 Annual Sector Performance Report FY 2016/2017
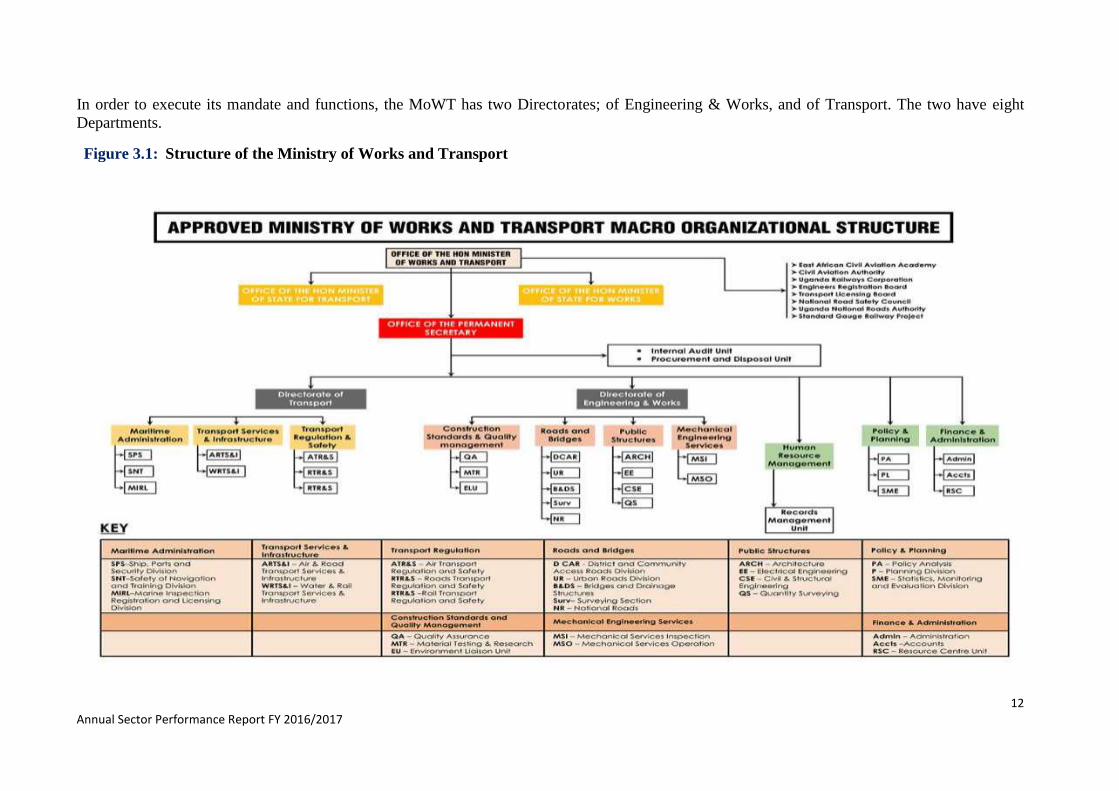
In order to execute its mandate and functions, the MoWT has two Directorates; of Engineering & Works, and of Transport. The two have eight
Departments.
Figure 3.1: Structure of the Ministry of Works and Transport
13 Annual Sector Performance Report FY 2016/2017
14 Annual Sector Performance Report FY 2016/2017
3.3.1 Mandates and Functions of the Departments
a) Finance and Administration Department
The functions of the department are to:
i) Provide management and administrative support services;
ii) Provide public relations and coordination services for the ministry;
iii) Build staff capacity and efficiency;
iv) Ensure goods and services are procured;
v) Ensure that bills/invoices/certificates for service providers are settled.
b) Policy and Planning Department
Functions of the department are to:
i) Coordinate and analyse strategic policy options to guide the Ministry programmes and
projects;
ii) Liase with other Government Ministries in developing and analysing cross-sectoral
policies and issues for guidance in the Ministry;
iii) Coordinate the preparation of the major policy statements namely: Medium Term
Expenditure Framework and Ministerial Budget Policy statement;
iv) Monitor and evaluate the implementation and carry out regulatory impact assessment of
the major policies in the Ministry;
v) Coordinate and monitor Works and Transport sub-sector performance;
vi) Collect, process, analyse, interpret, store and disseminate data on all modes of transport
for strategic planning.
c) Transport Services and Infrastructure
The functions of the department are to:
i) Implement plans for transport services and infrastructure for all modes of transport
(Road, Rail,Water and Air);
ii) Carry out research to identify requirements for development and improvement of
transport infrastructure and services;
iii) Assess the impact of modes of transport in respect to socio-economic development and
poverty eradication in the country;
iv) Monitor and evaluate the performance of public corporations in the sub-sector;
v) Promote collaboration linkages and liason with regional and international organisations
that provide transport infrastructure and services.
15 Annual Sector Performance Report FY 2016/2017
e) Construction Standards and Quality Management
The functions of the department are to conduct regular technical and environment audit as well
as compliance monitoring for Government MDAs Project. In addition, UNRA is supposed to be
monitored and evaluated by the Department on a quarterly basis.
Undertake research and materials testing
Develop adequate engineering specifications and standards;
Promote good standards in the construction industry; and
Promote integration of crosscutting issues namely; Environment, Gender, HIV/AIDS,
Occupational Health and Safety and Disability in the sector.
f) Roads and Bridges The functions of the department are to
Monitor and evaluate performance of agencies, authorities, local governments
involved in the development and maintenance of road infrastructure;
Formulate policies and guidelines for the development and maintenance of road
infrastructure;
Regulate agencies, authorities, local governments involved in the development
and maintenance of road infrastructure;
Collaborate with agencies, authorities, local governments involved in the
development and maintenance of road infrastructure; and
Monitor and evaluate surveys, demarcation, and acquisition of land titles, marking
and protection of road reserves for transport projects for existing and future Road
Infrastructure to avoid large amounts of compensations.
g) Mechanical Engineering Services The functions of the department are to:
Inspect Government vehicles and equipment for condition assessment and onward advice
as to future usage;
Maintain and manage Government vehicle/equipment inventory database;
Evaluate equipment and vehicles for procurement, arbitration or disposal purposes;
Guide in setting policies and standards for models/makes of vehicles for
government usage;
Set standards and requirements for private garages/workshops that repair government
vehicles and equipment; and
Assist the Districts in procurement planning and managing the maintenance of their road
equipment.
h) Transport Regulation The functions of the department are to:
Initiate and develop transport policies, strategies and regulations to ensure effective,
efficient and safe transport services;
Monitor and advise on effective enforcement of transport legislation;
Oversee investigations into causes of accidents and advise on mitigation measures;
16 Annual Sector Performance Report FY 2016/2017
Oversee sensitization programmes of the public about safety and discipline in the
transport industry;
Oversee performance of CAA, TLB, NRSC so as to ensure compliance with the
legislation; and
Co-ordinate formulation and implementation of bilateral, regional and international
agreements to enhance safety of transport in liaison with other respective countries and
organizations.
i) Maritime Administration Department
The functions of the department are to:
Develop Maritime Transport Policy, Laws and regulations
Set Standards for construction of water vehicles
Regulate transport on the country’s water bodies
Maintain instiuational conventions on water bodies
It ensures safe, secure and environmentally friendly water transport
Build capacity for operation in the water transport sub-sector
3.2 Uganda National Roads Authority
The Uganda National Roads Authority became fully operational on 1st July 2008 and has been in
operation for nine years.
UNRA’s Vision is Great Roads, Greater User experience, 20,000km of first class Roads by
2025.
UNRA’s mission is to develop and maintain a sustainable national road network for the
the economic development needs Uganda.
UNRA’s mandate is to manage the provision and maintenance of the national roads network in a
more efficient and effective manner, to render advisory services to government on roads related
matters and manage ferries linking the national roads network
UNRA’s goals are to:
a) Optimize the quality, timeliness and cost effectiveness of road works; and
b) Guarantee all year round safe and efficient movement of people and goods on the roads
throughout the country.
3.3 Uganda Road Fund
Uganda Road Fund (URF) was established by an Act of Parliament in 2008. The objective of
setting up the Fund was to enable steady and reliable funding for routine and periodic
maintenance of public roads mainly from road user charges. The Fund became operational in
January 2010.
URF Vision: Adequate financing for Maintenance of Public Roads.
17 Annual Sector Performance Report FY 2016/2017
URF Mission: To provide effective and sustainable financing of maintenance for public roads,
build partnerships with stakeholders and serve with integrity.
The Fund derives its mandate from Section 6 of the Uganda Road Fund Act 2008. It is
mandatedto collect road user charges (RUCs) and manage the funds so collected to finance the
country’s road maintenance programmes.
3.4 Civil Aviation Authority
The Civil Aviation Authority (CAA) is a corporate body established by an Act of Parliament,
“The Civil Aviation Authority Act, Cap 354”, of 1991.
The Vision of CAA is: “To promote the Safest, Most Efficient and Affordable Air Transport
System in Africa and Beyond”.
The Mission of CAA is: “To Maintain the Highest Standards of Safety, Security and Service in
Civil Aviation”.
The mandate of the Authority is to “promote the safe, regular, secure and efficient use and
development of civil aviation inside and outside Uganda”.
The Authority is also mandated to advise Government on:
a) Policy matters concerning Civil Aviation; and
b) International Conventions relating to Civil Aviation and the adoption of measures
necessary to give effect to the standards and recommended practices under those
Conventions.
3.5 Uganda Railways Corporation
Uganda Railways Corporation (URC) is a corporate body established by the Uganda Railways
Corporation Act (1992).
The Vision of URC is:
“To promote a modern, safe & sustainably efficient high capacity passenger & freight
railway system for both Uganda & the region.”
The mandate of the Corporation is: the construction, operation and maintenance of railway,
marine and road services both in and outside Uganda, for the carriage of passengers and goods.
Uganda Railways Corporation’s functions are to:
Be the lead agency on matters relating to Railways both current and future developments
in the sub-sector;
Monitor and evaluate compliance of the railway concessionaire and its respective
concession obligations;
18 Annual Sector Performance Report FY 2016/2017
Oversee and manage the Corporation’s non-core(non-conceded) assets, the core
(conceded assets) that are yet to be taken over by the concessionaire and any residual
activities and liabilities of the Corporation;
Provide technical assistance in reference to railways matters to the Minister of Works and
to other ministries and government agencies;
Regulate railway transport on behalf of MOWT and manager of government driven
programs.
3.6 Other Institutions providing Key Transport Services
In addition to the above Sector Agencies, there are other Government Agencies who supplement
directly or indirectly to the performance of the Sector. These include:
3.6.1 Ministry of Local Government (MoLG)
Amongst its functions is, “To establish standards, Government policy, laws and
regulations and, guidelines for Local Governments to follow in the implementation of
their programmes and monitor their compliance and implementation”.
Amongst the programmes, is maintenance of district, urban and community access roads.
3.6.2 Kampala Capital City Authority (KCCA)
Kampala Capital City Authority (KCCA) came into force on the 1st of March 2011 by The
Kampala Capital City Act, 2010. It is supervised by the Central Government.
KCCA mandate is:
“To provide services in the city that enable residents and businesses operating in the city
function in an environment that supports development”.
The authority is obliged to plan, implement, and monitor the delivery of public services; amongst
them development and maintenance of the city roads, and direct and control development in the
city. KCCA meets this mandate by implementing programmes financed by Government,
Development Partners as well as its own local revenue.
3.6.3 Uganda Police Force (UPF) - Directorate of Traffic and Road Safety
Uganda Police is responsible for enforcing road transport laws and regulations. It is also
responsible for recording, production and analysis of traffic accident data. Its major output is
the annual traffic and road safety report published every calendar year. The report contains
statistics on road accidents and may inform the road transport policy development.
3.6.4 Uganda Revenue Authority (URA)
The major function of the URA in relation to the transport sector is registration of all vehicles
imported into the country and the maintenance of the central registry of motor vehicles
(registration and de-registration).
19 Annual Sector Performance Report FY 2016/2017
3.6.5 Ministry of Finance Planning and Economic Development
The Ministry of Finance, Planning and Economic Development is responsible for allocation of
resources for transport sector activities including road development, road maintenance, law and
policy development.
3.6.6. Engineers Registration Board (ERB)
The Engineers Registration Board (ERB) is established under the Engineers Registration Act (ERA)
1969 Cap 271, as a statutory body. The board is appointed by the Minister responsible for Works and
Transport.
The Mission of ERB is, “To regulate and control engineers and their practice within Uganda.”
The functions of the Board are to:
Maintain a register of engineers licenced to practice in the country;
Register, de-register, restore registeration, suspend registeration, hold inquiries and hear
appeals in matters related to professional engineering practice; and
Advise Government on matters relating to engineering practice in the country.
3.6.7 National Building Review Board (NBRD)
This has been appointed and its role is to monitor building developments and operations of
Urban and District Building committees
20 Annual Sector Performance Report FY 2016/2017
3.6.8 Key Development Partners
Uganda currently receives around US$ 1.7 billion per year in Official Development Assistance
(ODA) from foreign governments and ‘multilateral’ institutions—the World Bank, African
Development Bank, European Union and UN agencies. This ODA represents approximately one
tenth of Uganda’s Gross National Income (GNI), and one third of government revenues. Aid as
a proportion of both GNI and government revenues has, however, continued to decline as
Uganda’s economy grows.
Most of this official aid, 75% is utilised to fund specific projects agreed between the donor
agency and the government of Uganda. These include projects funded through loans and
grants.The remaining ODA goes directly to the government of Uganda as general budget
support and is not tied to any specific projects. Development Partners that have over the last 20
years been instrumental in the financing of development projects and institutional reforms in the
transport sector include:
a. The European Union (EU)
b. The World Bank (IDA)
c. African Development Bank (ADB)
d. Islamic Development Bank (IDB)
e. Japanese International Cooperation Agency (JICA)
f. Export-Import (EXIM) Bank of China
g. German International Cooperation (GiZ)
h. European Investment Bank (EIB)
i. Trademark East Africa
j. Arab Bank for African Development (BADEA)
k. Korea International Coorperation Agency (KOICA)
l. Danish International Development Agency (DANIDA)
21 Annual Sector Performance Report FY 2016/2017
PART B:
4.0 PERFORMANCE OF THE SECTOR AND SUB-SECTORS
4.1 Performance on Policies and Strategies
The 12th Joint Transport Sector Review (JTSR) of September 2016 discussed and raised key
Policy and Strategy issues. These issues were encapsulated in an agreed Action Plan Matrix.
Progress on the Actions is detailed in Annex II of this report.
4.2 Analysis of the Performance Measured against Golden Indicators
There are currently 18 indicators 4 of which are for road infrastructure, 4 for road transport,
and 5 for railway transport, 2 are for air, 2 for water transport and 1 for cross-cutting issues.
Performance of the Sector measured against Golden Indicators is analysed below.
Golden Indicator 1: Condition of the Roads Network
The condition of the roads is a Key Performance Indicator that is used internationally for the
roads system. It refers to the structure, roughness and unevenness of the road. Golden
Indicator 1 is:
“% of the roads network in fair to good condition”
The measurement of the road condition is by the International Roughness Index (IRI).
Roughness is a good indicator of the condition of the road because it affects the level of
service in terms of the riding quality, speed and cost of vehicle operation and maintenance.
Data was collected using automated data collection vans equipped with bump integrators and
video cameras, and visual surveys.
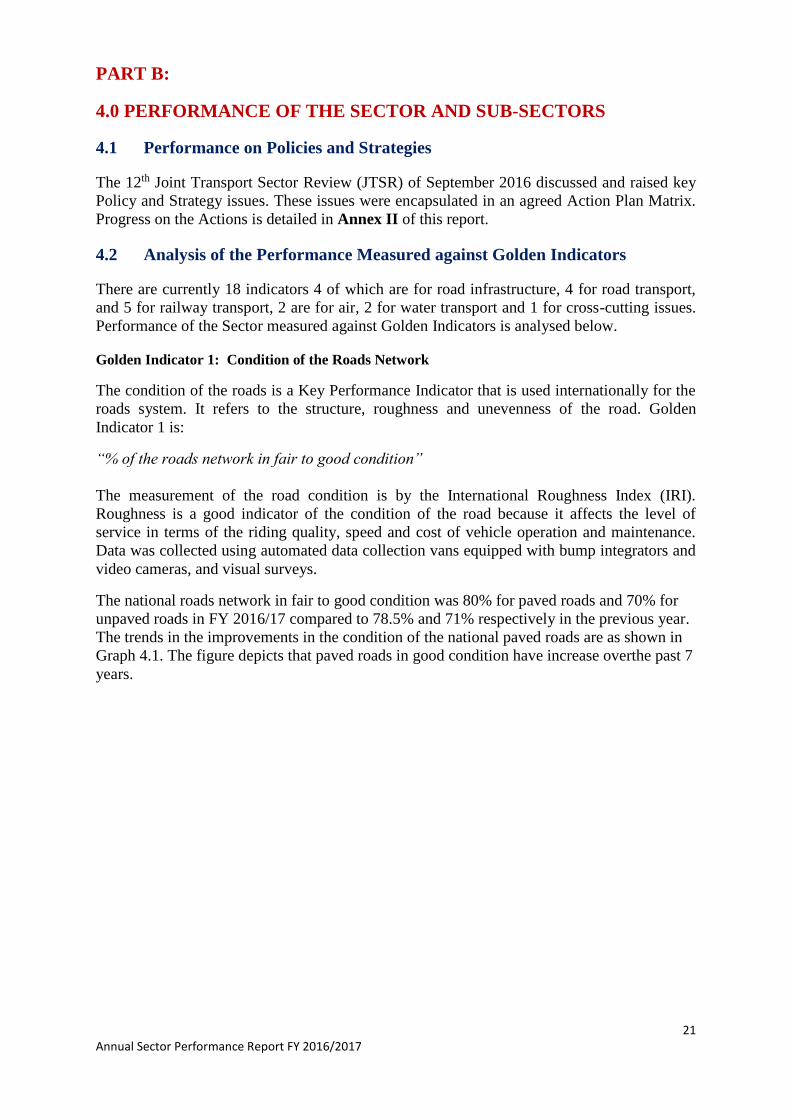
The national roads network in fair to good condition was 80% for paved roads and 70% for
unpaved roads in FY 2016/17 compared to 78.5% and 71% respectively in the previous year.
The trends in the improvements in the condition of the national paved roads are as shown in
Graph 4.1. The figure depicts that paved roads in good condition have increase overthe past 7
years.
22 Annual Sector Performance Report FY 2016/2017
Graph 4.1: Trends in improvement in condition of paved
road
39%
53%
52%
51%
66%
68%
61%
69%
38%
21%
26%
26%
14%
12%
27%
23%
23%
26%
22%
23%
20%
20%
12%
8%
0% 20% 40% 60% 80% 100%
2009/10
2010/11
2011/12
2012/13
2013/14
2014/15
2015/16
2016/17
%
Good
Fair
Poor
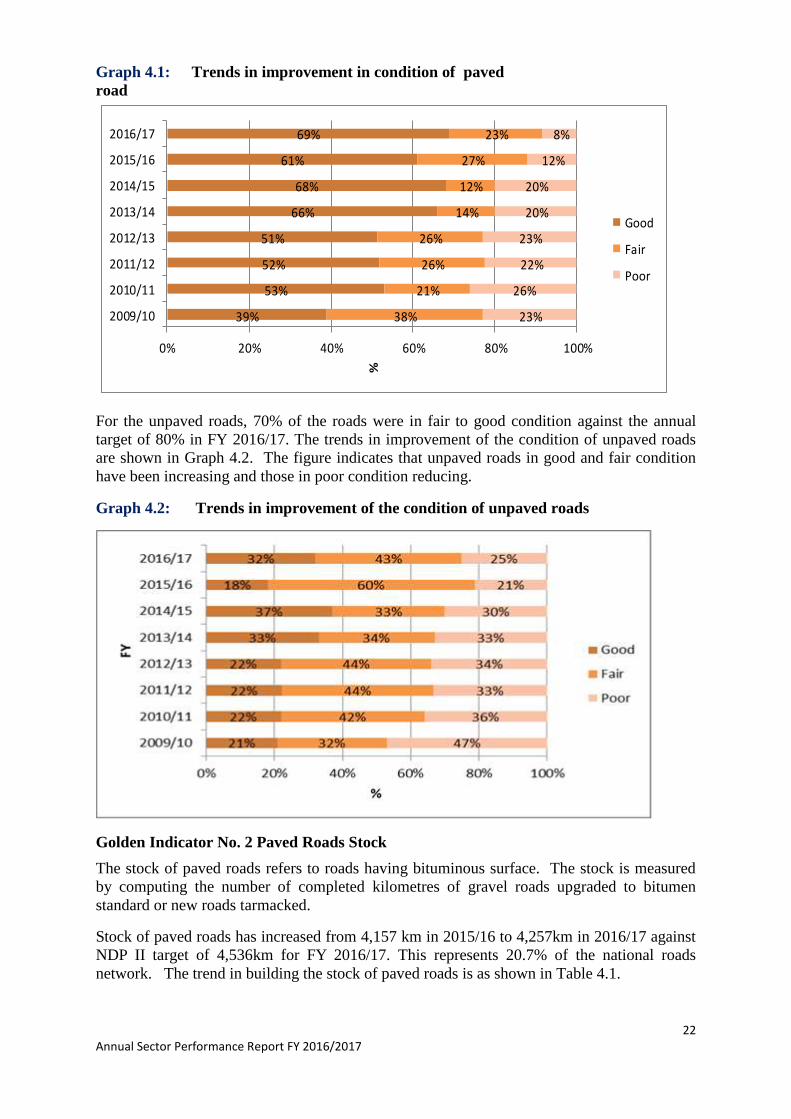
For the unpaved roads, 70% of the roads were in fair to good condition against the annual
target of 80% in FY 2016/17. The trends in improvement of the condition of unpaved roads
are shown in Graph 4.2. The figure indicates that unpaved roads in good and fair condition
have been increasing and those in poor condition reducing.
Graph 4.2: Trends in improvement of the condition of unpaved roads
Golden Indicator No. 2 Paved Roads Stock
The stock of paved roads refers to roads having bituminous surface. The stock is measured
by computing the number of completed kilometres of gravel roads upgraded to bitumen
standard or new roads tarmacked.
Stock of paved roads has increased from 4,157 km in 2015/16 to 4,257km in 2016/17 against
NDP II target of 4,536km for FY 2016/17. This represents 20.7% of the national roads
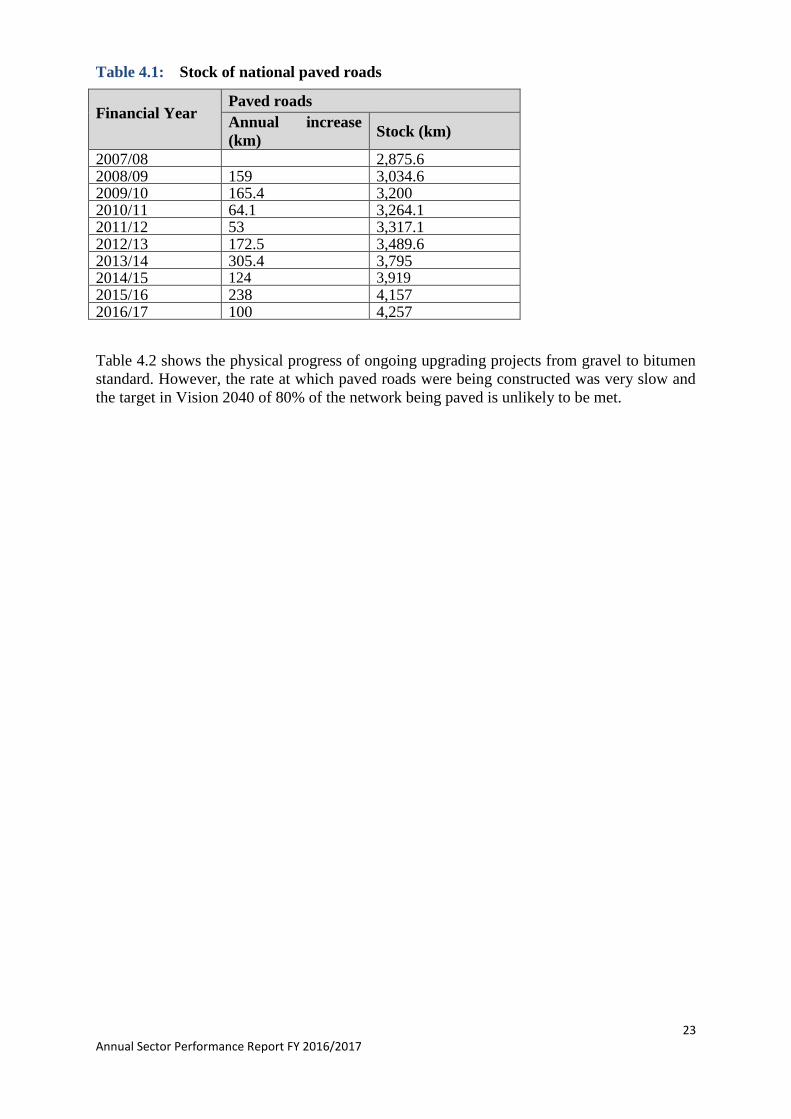
network. The trend in building the stock of paved roads is as shown in Table 4.1.
23 Annual Sector Performance Report FY 2016/2017
Table 4.1: Stock of national paved roads
Financial Year Paved roads
Annual increase
(km) Stock (km)
2007/08 2,875.6 2008/09 159 3,034.6 2009/10 165.4 3,200 2010/11 64.1 3,264.1 2011/12 53 3,317.1 2012/13 172.5 3,489.6 2013/14 305.4 3,795 2014/15 124 3,919 2015/16 238 4,157 2016/17 100 4,257
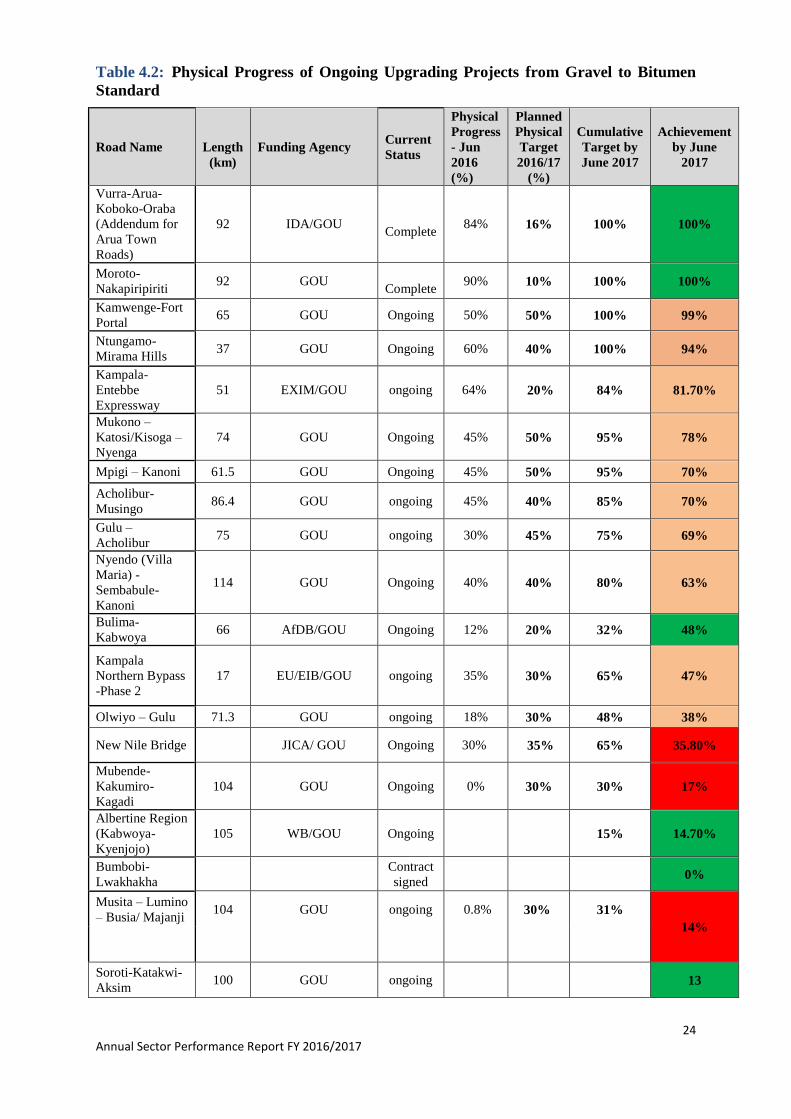
Table 4.2 shows the physical progress of ongoing upgrading projects from gravel to bitumen
standard. However, the rate at which paved roads were being constructed was very slow and
the target in Vision 2040 of 80% of the network being paved is unlikely to be met.
24 Annual Sector Performance Report FY 2016/2017
Table 4.2: Physical Progress of Ongoing Upgrading Projects from Gravel to Bitumen
Standard
Road Name
Length
(km)
Funding Agency Current
Status
Physical
Progress
- Jun
2016
(%)
Planned
Physical
Target
2016/17
(%)
Cumulative
Target by
June 2017
Achievement
by June
2017
Vurra-Arua-
Koboko-Oraba
(Addendum for
Arua Town
Roads)
92 IDA/GOU
Complete 84% 16% 100% 100%
Moroto-
Nakapiripiriti 92 GOU
Complete 90% 10% 100% 100%
Kamwenge-Fort
Portal 65 GOU Ongoing 50% 50% 100% 99%
Ntungamo-
Mirama Hills 37 GOU Ongoing 60% 40% 100% 94%
Kampala-
Entebbe
Expressway
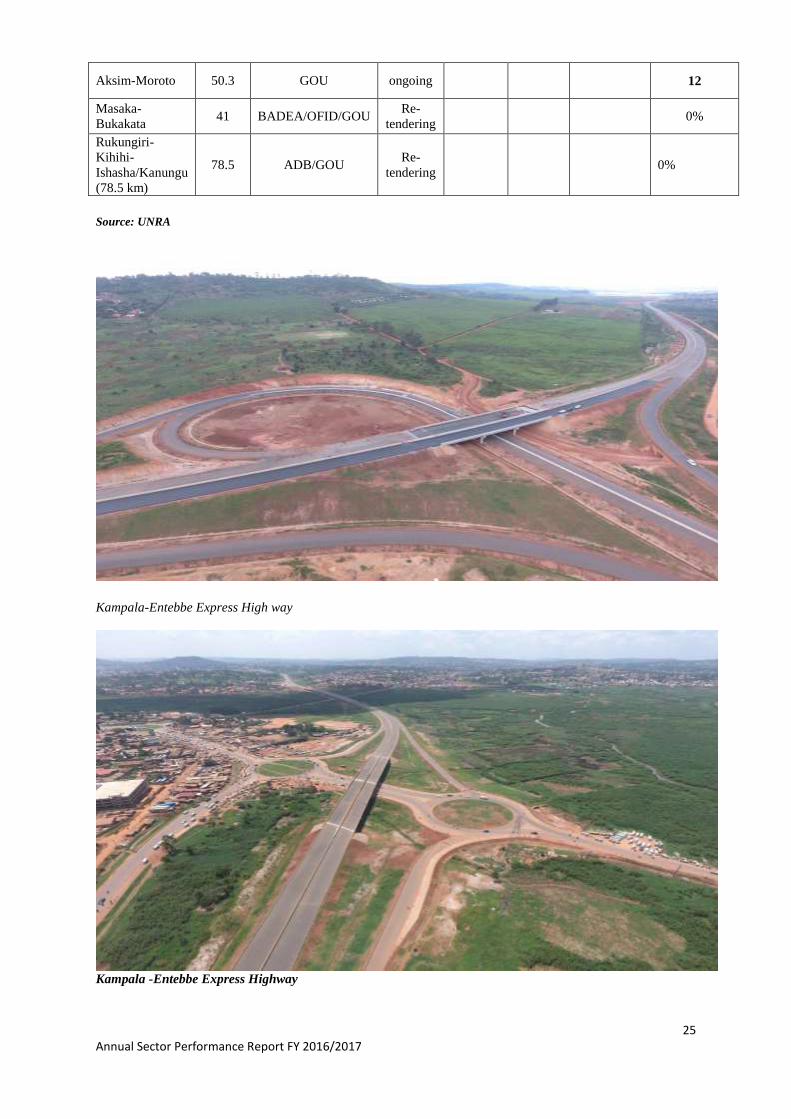
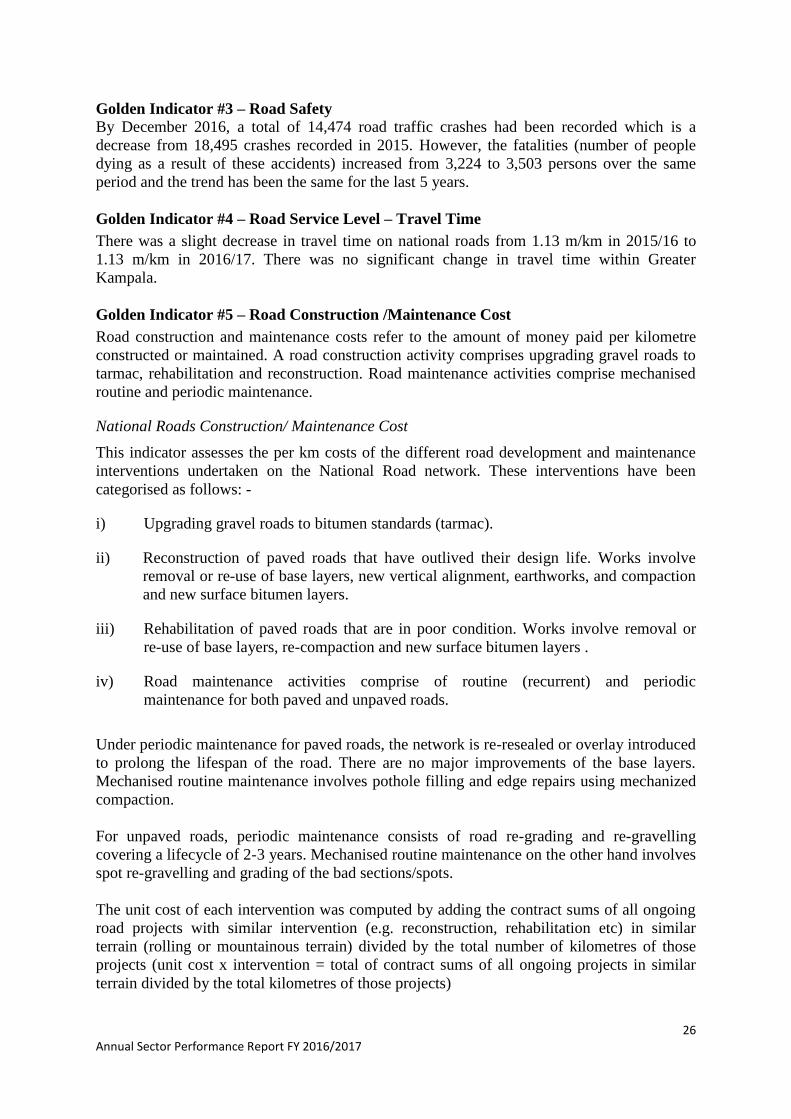
51 EXIM/GOU ongoing 64% 20% 84% 81.70%
Mukono –
Katosi/Kisoga –
Nyenga
74 GOU Ongoing 45% 50% 95% 78%
Mpigi – Kanoni 61.5 GOU Ongoing 45% 50% 95% 70%
Acholibur-
Musingo 86.4 GOU ongoing 45% 40% 85% 70%
Gulu –
Acholibur 75 GOU ongoing 30% 45% 75% 69%
Nyendo (Villa
Maria) -
Sembabule-
Kanoni
114 GOU Ongoing 40% 40% 80% 63%
Bulima-
Kabwoya 66 AfDB/GOU Ongoing 12% 20% 32% 48%
Kampala
Northern Bypass
-Phase 2
17 EU/EIB/GOU ongoing 35% 30% 65% 47%
Olwiyo – Gulu 71.3 GOU ongoing 18% 30% 48% 38%
New Nile Bridge JICA/ GOU Ongoing 30% 35% 65% 35.80%
Mubende-
Kakumiro-
Kagadi
104 GOU Ongoing 0% 30% 30% 17%
Albertine Region
(Kabwoya-
Kyenjojo)
105 WB/GOU Ongoing 15% 14.70%
Bumbobi-
Lwakhakha
Contract
signed 0%
Musita – Lumino
– Busia/ Majanji 104 GOU ongoing 0.8% 30% 31%
14%
Soroti-Katakwi-
Aksim 100 GOU ongoing 13
25 Annual Sector Performance Report FY 2016/2017
Source: UNRA
Kampala-Entebbe Express High way
Kampala -Entebbe Express Highway
Aksim-Moroto 50.3 GOU ongoing 12
Masaka-
Bukakata 41 BADEA/OFID/GOU
Re-
tendering 0%
Rukungiri-
Kihihi-
Ishasha/Kanungu
(78.5 km)
78.5 ADB/GOU Re-
tendering 0%
26 Annual Sector Performance Report FY 2016/2017
Golden Indicator #3 – Road Safety
By December 2016, a total of 14,474 road traffic crashes had been recorded which is a
decrease from 18,495 crashes recorded in 2015. However, the fatalities (number of people
dying as a result of these accidents) increased from 3,224 to 3,503 persons over the same
period and the trend has been the same for the last 5 years.
Golden Indicator #4 – Road Service Level – Travel Time
There was a slight decrease in travel time on national roads from 1.13 m/km in 2015/16 to
1.13 m/km in 2016/17. There was no significant change in travel time within Greater
Kampala.
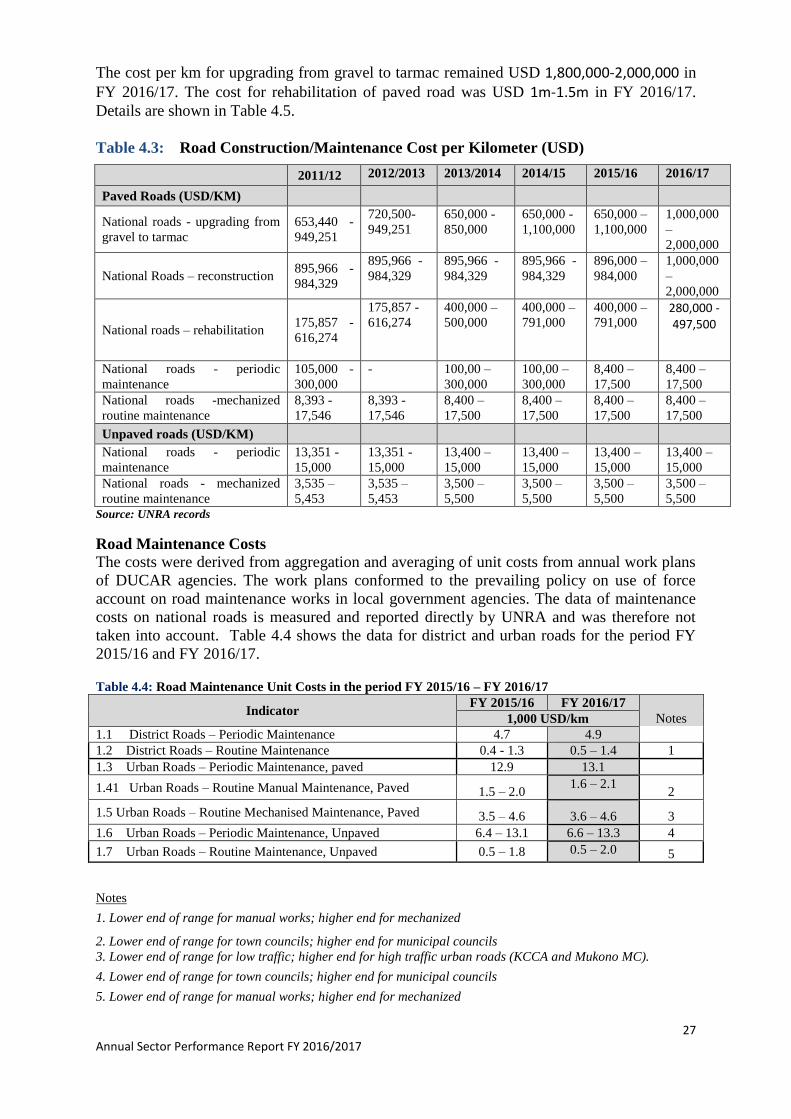
Golden Indicator #5 – Road Construction /Maintenance Cost
Road construction and maintenance costs refer to the amount of money paid per kilometre
constructed or maintained. A road construction activity comprises upgrading gravel roads to
tarmac, rehabilitation and reconstruction. Road maintenance activities comprise mechanised
routine and periodic maintenance.
National Roads Construction/ Maintenance Cost
This indicator assesses the per km costs of the different road development and maintenance
interventions undertaken on the National Road network. These interventions have been
categorised as follows: -
i) Upgrading gravel roads to bitumen standards (tarmac).
ii) Reconstruction of paved roads that have outlived their design life. Works involve
removal or re-use of base layers, new vertical alignment, earthworks, and compaction
and new surface bitumen layers.
iii) Rehabilitation of paved roads that are in poor condition. Works involve removal or
re-use of base layers, re-compaction and new surface bitumen layers .
iv) Road maintenance activities comprise of routine (recurrent) and periodic
maintenance for both paved and unpaved roads.
Under periodic maintenance for paved roads, the network is re-resealed or overlay introduced
to prolong the lifespan of the road. There are no major improvements of the base layers.
Mechanised routine maintenance involves pothole filling and edge repairs using mechanized
compaction.
For unpaved roads, periodic maintenance consists of road re-grading and re-gravelling
covering a lifecycle of 2-3 years. Mechanised routine maintenance on the other hand involves
spot re-gravelling and grading of the bad sections/spots.
The unit cost of each intervention was computed by adding the contract sums of all ongoing
road projects with similar intervention (e.g. reconstruction, rehabilitation etc) in similar
terrain (rolling or mountainous terrain) divided by the total number of kilometres of those
projects (unit cost x intervention = total of contract sums of all ongoing projects in similar
terrain divided by the total kilometres of those projects)
27 Annual Sector Performance Report FY 2016/2017
The cost per km for upgrading from gravel to tarmac remained USD 1,800,000-2,000,000 in
FY 2016/17. The cost for rehabilitation of paved road was USD 1m-1.5m in FY 2016/17.
Details are shown in Table 4.5.
Table 4.3: Road Construction/Maintenance Cost per Kilometer (USD)
2011/12 2012/2013 2013/2014 2014/15 2015/16 2016/17
Paved Roads (USD/KM)
National roads - upgrading from
gravel to tarmac
653,440 -
949,251
720,500-
949,251
650,000 -
850,000
650,000 -
1,100,000
650,000 –
1,100,000
1,000,000
–
2,000,000
National Roads – reconstruction 895,966 -
984,329
895,966 -
984,329
895,966 -
984,329
895,966 -
984,329
896,000 –
984,000
1,000,000
–
2,000,000
National roads – rehabilitation 175,857 -
616,274
175,857 -
616,274
400,000 –
500,000
400,000 –
791,000
400,000 –
791,000 280,000 -497,500
National roads - periodic
maintenance
105,000 -
300,000
- 100,00 –
300,000
100,00 –
300,000
8,400 –
17,500
8,400 –
17,500
National roads -mechanized
routine maintenance
8,393 -
17,546
8,393 -
17,546
8,400 –
17,500
8,400 –
17,500
8,400 –
17,500
8,400 –
17,500
Unpaved roads (USD/KM)
National roads - periodic
maintenance
13,351 -
15,000
13,351 -
15,000
13,400 –
15,000
13,400 –
15,000
13,400 –
15,000
13,400 –
15,000
National roads - mechanized
routine maintenance
3,535 –
5,453
3,535 –
5,453
3,500 –
5,500
3,500 –
5,500
3,500 –
5,500
3,500 –
5,500
Source: UNRA records
Road Maintenance Costs
The costs were derived from aggregation and averaging of unit costs from annual work plans
of DUCAR agencies. The work plans conformed to the prevailing policy on use of force
account on road maintenance works in local government agencies. The data of maintenance
costs on national roads is measured and reported directly by UNRA and was therefore not
taken into account. Table 4.4 shows the data for district and urban roads for the period FY
2015/16 and FY 2016/17.
Table 4.4: Road Maintenance Unit Costs in the period FY 2015/16 – FY 2016/17
Indicator FY 2015/16 FY 2016/17
Notes 1,000 USD/km
1.1 District Roads – Periodic Maintenance 4.7 4.9
1.2 District Roads – Routine Maintenance 0.4 - 1.3 0.5 – 1.4 1
1.3 Urban Roads – Periodic Maintenance, paved 12.9 13.1
1.41 Urban Roads – Routine Manual Maintenance, Paved 1.5 – 2.0 1.6 – 2.1
2
1.5 Urban Roads – Routine Mechanised Maintenance, Paved 3.5 – 4.6 3.6 – 4.6 3
1.6 Urban Roads – Periodic Maintenance, Unpaved 6.4 – 13.1 6.6 – 13.3 4
1.7 Urban Roads – Routine Maintenance, Unpaved 0.5 – 1.8 0.5 – 2.0 5
Notes
1. Lower end of range for manual works; higher end for mechanized
2. Lower end of range for town councils; higher end for municipal councils
3. Lower end of range for low traffic; higher end for high traffic urban roads (KCCA and Mukono MC).
4. Lower end of range for town councils; higher end for municipal councils
5. Lower end of range for manual works; higher end for mechanized
28 Annual Sector Performance Report FY 2016/2017
It can be observed from Table 4.4 that there was a general increase in the unit cost of road
maintenance in FY 2016/17 compared to FY 2015/16. This is attributed to general
inflationary pressures that pushed up the cost of construction inputs like fuel, gravel,
equipment repairs and maintenance, equipment hire, and labour rates.
Golden Indicator #6 – Rural Accessibility
Rural accessibility values come from the Household Survey carried out by UBOS. A new
national Household Survey was conducted in 2012/13, but it did not report on the issue of
rural accessibility. Therefore, the 2009/10 Household Survey figures are the most up to date
and the figures utilised in this report. The proportion of communities with access to all-
season feeder roads was 83% in 2009/10 compared with 66% in 2005/6. 38% of communities
had access to a taxi/matatu stop in 2009/10, an increase from 34% in 2005/6.
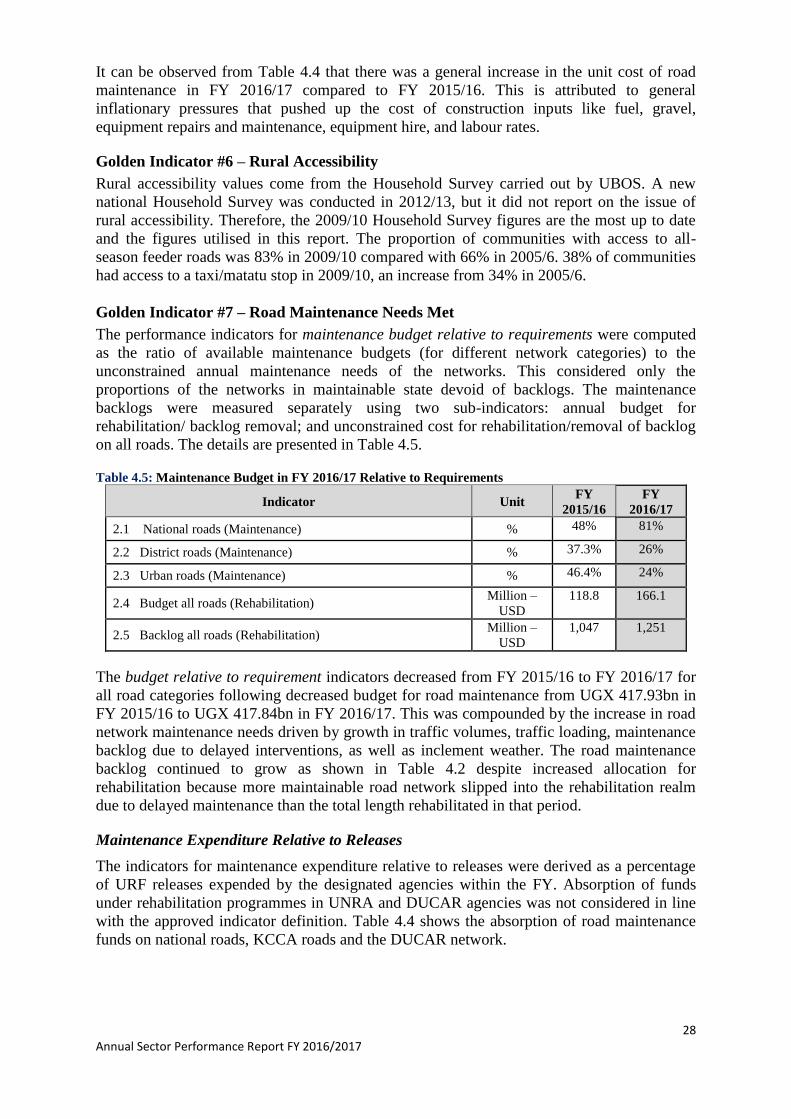
Golden Indicator #7 – Road Maintenance Needs Met
The performance indicators for maintenance budget relative to requirements were computed
as the ratio of available maintenance budgets (for different network categories) to the
unconstrained annual maintenance needs of the networks. This considered only the
proportions of the networks in maintainable state devoid of backlogs. The maintenance
backlogs were measured separately using two sub-indicators: annual budget for
rehabilitation/ backlog removal; and unconstrained cost for rehabilitation/removal of backlog
on all roads. The details are presented in Table 4.5.
Table 4.5: Maintenance Budget in FY 2016/17 Relative to Requirements
Indicator Unit FY
2015/16
FY
2016/17
2.1 National roads (Maintenance) % 48% 81%
2.2 District roads (Maintenance) % 37.3% 26%
2.3 Urban roads (Maintenance) % 46.4% 24%
2.4 Budget all roads (Rehabilitation) Million –
USD
118.8 166.1
2.5 Backlog all roads (Rehabilitation) Million –
USD
1,047 1,251
The budget relative to requirement indicators decreased from FY 2015/16 to FY 2016/17 for
all road categories following decreased budget for road maintenance from UGX 417.93bn in
FY 2015/16 to UGX 417.84bn in FY 2016/17. This was compounded by the increase in road
network maintenance needs driven by growth in traffic volumes, traffic loading, maintenance
backlog due to delayed interventions, as well as inclement weather. The road maintenance
backlog continued to grow as shown in Table 4.2 despite increased allocation for
rehabilitation because more maintainable road network slipped into the rehabilitation realm
due to delayed maintenance than the total length rehabilitated in that period.
Maintenance Expenditure Relative to Releases
The indicators for maintenance expenditure relative to releases were derived as a percentage
of URF releases expended by the designated agencies within the FY. Absorption of funds
under rehabilitation programmes in UNRA and DUCAR agencies was not considered in line
with the approved indicator definition. Table 4.4 shows the absorption of road maintenance
funds on national roads, KCCA roads and the DUCAR network.
29 Annual Sector Performance Report FY 2016/2017
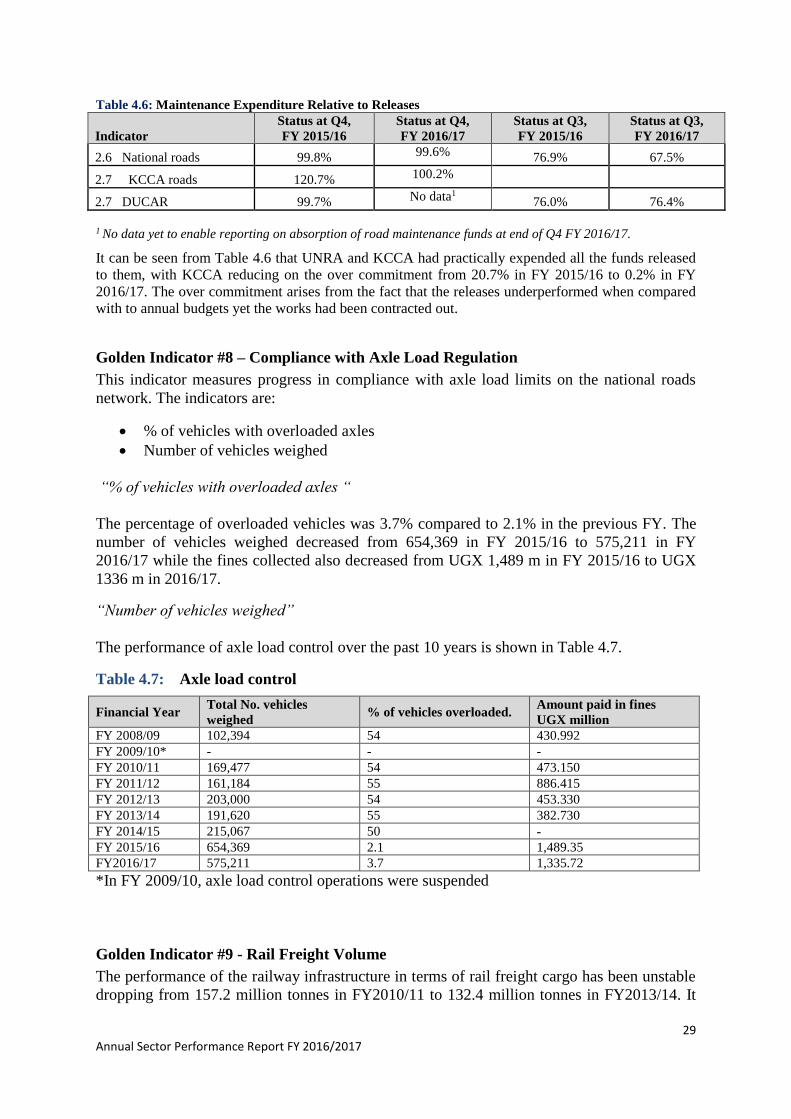
Table 4.6: Maintenance Expenditure Relative to Releases
Indicator
Status at Q4,
FY 2015/16
Status at Q4,
FY 2016/17
Status at Q3,
FY 2015/16
Status at Q3,
FY 2016/17
2.6 National roads 99.8% 99.6% 76.9% 67.5%
2.7 KCCA roads 120.7% 100.2%
2.7 DUCAR 99.7% No data1
76.0% 76.4%
1 No data yet to enable reporting on absorption of road maintenance funds at end of Q4 FY 2016/17.
It can be seen from Table 4.6 that UNRA and KCCA had practically expended all the funds released
to them, with KCCA reducing on the over commitment from 20.7% in FY 2015/16 to 0.2% in FY
2016/17. The over commitment arises from the fact that the releases underperformed when compared
with to annual budgets yet the works had been contracted out.
Golden Indicator #8 – Compliance with Axle Load Regulation
This indicator measures progress in compliance with axle load limits on the national roads
network. The indicators are:
% of vehicles with overloaded axles
Number of vehicles weighed
“% of vehicles with overloaded axles “
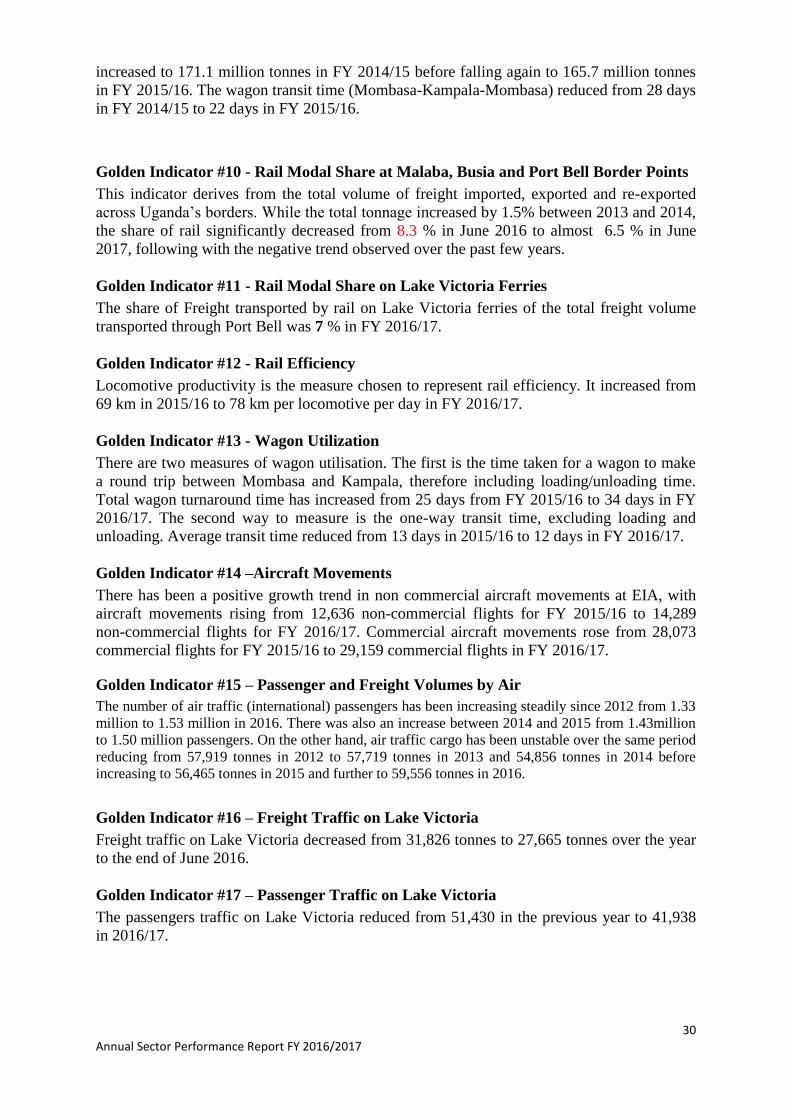
The percentage of overloaded vehicles was 3.7% compared to 2.1% in the previous FY. The
number of vehicles weighed decreased from 654,369 in FY 2015/16 to 575,211 in FY
2016/17 while the fines collected also decreased from UGX 1,489 m in FY 2015/16 to UGX
1336 m in 2016/17.
“Number of vehicles weighed”
The performance of axle load control over the past 10 years is shown in Table 4.7.
Table 4.7: Axle load control
Financial Year Total No. vehicles
weighed % of vehicles overloaded.
Amount paid in fines
UGX million
FY 2008/09 102,394 54 430.992
FY 2009/10* - - -
FY 2010/11 169,477 54 473.150
FY 2011/12 161,184 55 886.415
FY 2012/13 203,000 54 453.330
FY 2013/14 191,620 55 382.730
FY 2014/15 215,067 50 -
FY 2015/16 654,369 2.1 1,489.35
FY2016/17 575,211 3.7 1,335.72
*In FY 2009/10, axle load control operations were suspended
Golden Indicator #9 - Rail Freight Volume
The performance of the railway infrastructure in terms of rail freight cargo has been unstable
dropping from 157.2 million tonnes in FY2010/11 to 132.4 million tonnes in FY2013/14. It
30 Annual Sector Performance Report FY 2016/2017
increased to 171.1 million tonnes in FY 2014/15 before falling again to 165.7 million tonnes
in FY 2015/16. The wagon transit time (Mombasa-Kampala-Mombasa) reduced from 28 days
in FY 2014/15 to 22 days in FY 2015/16.
Golden Indicator #10 - Rail Modal Share at Malaba, Busia and Port Bell Border Points
This indicator derives from the total volume of freight imported, exported and re-exported
across Uganda’s borders. While the total tonnage increased by 1.5% between 2013 and 2014,
the share of rail significantly decreased from 8.3 % in June 2016 to almost 6.5 % in June
2017, following with the negative trend observed over the past few years.
Golden Indicator #11 - Rail Modal Share on Lake Victoria Ferries
The share of Freight transported by rail on Lake Victoria ferries of the total freight volume
transported through Port Bell was 7 % in FY 2016/17.
Golden Indicator #12 - Rail Efficiency
Locomotive productivity is the measure chosen to represent rail efficiency. It increased from
69 km in 2015/16 to 78 km per locomotive per day in FY 2016/17.
Golden Indicator #13 - Wagon Utilization
There are two measures of wagon utilisation. The first is the time taken for a wagon to make
a round trip between Mombasa and Kampala, therefore including loading/unloading time.
Total wagon turnaround time has increased from 25 days from FY 2015/16 to 34 days in FY
2016/17. The second way to measure is the one-way transit time, excluding loading and
unloading. Average transit time reduced from 13 days in 2015/16 to 12 days in FY 2016/17.
Golden Indicator #14 –Aircraft Movements
There has been a positive growth trend in non commercial aircraft movements at EIA, with
aircraft movements rising from 12,636 non-commercial flights for FY 2015/16 to 14,289
non-commercial flights for FY 2016/17. Commercial aircraft movements rose from 28,073
commercial flights for FY 2015/16 to 29,159 commercial flights in FY 2016/17.
Golden Indicator #15 – Passenger and Freight Volumes by Air
The number of air traffic (international) passengers has been increasing steadily since 2012 from 1.33
million to 1.53 million in 2016. There was also an increase between 2014 and 2015 from 1.43million
to 1.50 million passengers. On the other hand, air traffic cargo has been unstable over the same period
reducing from 57,919 tonnes in 2012 to 57,719 tonnes in 2013 and 54,856 tonnes in 2014 before
increasing to 56,465 tonnes in 2015 and further to 59,556 tonnes in 2016.
Golden Indicator #16 – Freight Traffic on Lake Victoria
Freight traffic on Lake Victoria decreased from 31,826 tonnes to 27,665 tonnes over the year
to the end of June 2016.
Golden Indicator #17 – Passenger Traffic on Lake Victoria
The passengers traffic on Lake Victoria reduced from 51,430 in the previous year to 41,938
in 2016/17.
31 Annual Sector Performance Report FY 2016/2017
Golden Indicator #18 – Cross Cutting Issues
The aim of this indicator is to measure cross cutting issues, across all the agencies and
departments in the transport and works sector. The focus areas are: environment, gender,
HIV/AIDS, and accident prevention.
Environment
Values for the first indicator (18.1 a), particulate emissions (ppm for CO2, CO, SO2 and
NO2), have not yet been measured as the necessary equipment is not available. As regards
Indicator 18.1 c relating to EIAs submitted to NEMA, the overall percentage for UNRA, MoWT,
URC, CAA, URF of the EIAs accepted was 95% in 2015/16 and 2016/17.
Gender
There were 6 sector institutions with gender focal persons in place in FY 2016/17,compared
to 5 institutions registered in FY2015/16.
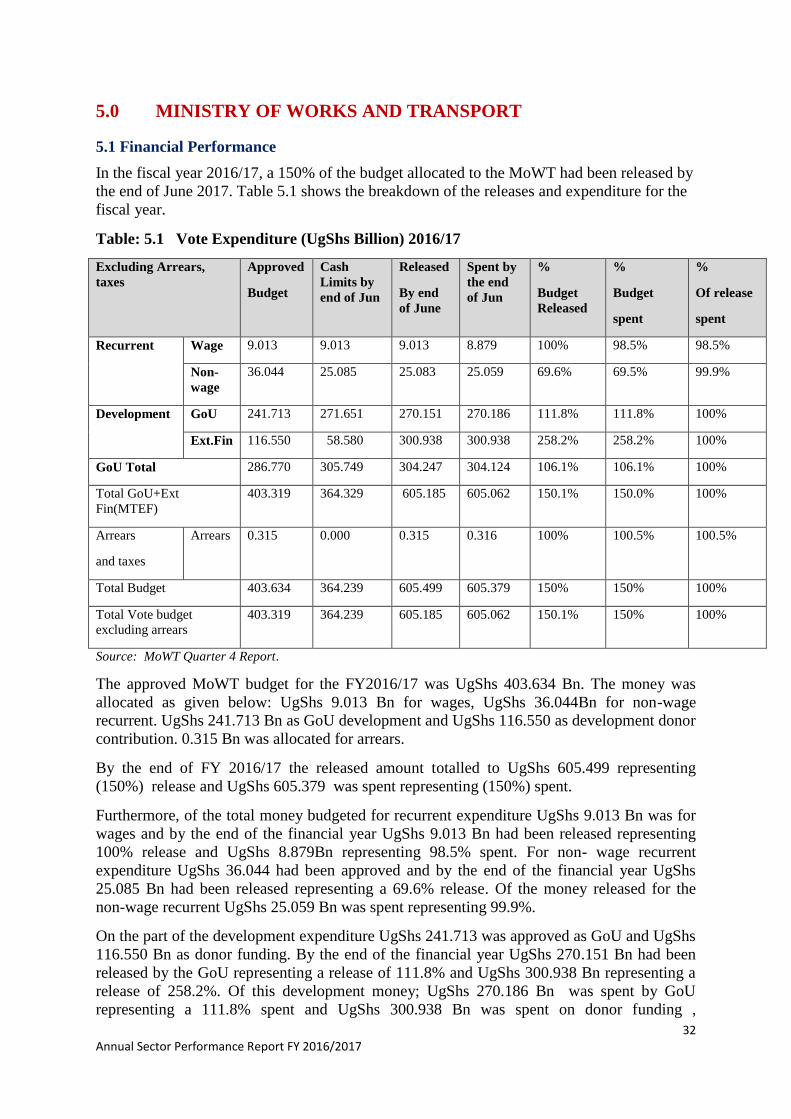
32 Annual Sector Performance Report FY 2016/2017
5.0 MINISTRY OF WORKS AND TRANSPORT
5.1 Financial Performance
In the fiscal year 2016/17, a 150% of the budget allocated to the MoWT had been released by
the end of June 2017. Table 5.1 shows the breakdown of the releases and expenditure for the
fiscal year.
Table: 5.1 Vote Expenditure (UgShs Billion) 2016/17
Excluding Arrears,
taxes
Approved
Budget
Cash
Limits by
end of Jun
Released
By end
of June
Spent by
the end
of Jun
%
Budget
Released
%
Budget
spent
%
Of release
spent
Recurrent Wage 9.013 9.013 9.013 8.879 100% 98.5% 98.5%
Non-
wage
36.044 25.085 25.083 25.059 69.6% 69.5% 99.9%
Development GoU 241.713 271.651 270.151 270.186 111.8% 111.8% 100%
Ext.Fin 116.550 58.580 300.938 300.938 258.2% 258.2% 100%
GoU Total 286.770 305.749 304.247 304.124 106.1% 106.1% 100%
Total GoU+Ext
Fin(MTEF)
403.319 364.329 605.185 605.062 150.1% 150.0% 100%
Arrears
and taxes
Arrears 0.315 0.000 0.315 0.316 100% 100.5% 100.5%
Total Budget 403.634 364.239 605.499 605.379 150% 150% 100%
Total Vote budget
excluding arrears
403.319 364.239 605.185 605.062 150.1% 150% 100%
Source: MoWT Quarter 4 Report.
The approved MoWT budget for the FY2016/17 was UgShs 403.634 Bn. The money was
allocated as given below: UgShs 9.013 Bn for wages, UgShs 36.044Bn for non-wage
recurrent. UgShs 241.713 Bn as GoU development and UgShs 116.550 as development donor
contribution. 0.315 Bn was allocated for arrears.
By the end of FY 2016/17 the released amount totalled to UgShs 605.499 representing
(150%) release and UgShs 605.379 was spent representing (150%) spent.
Furthermore, of the total money budgeted for recurrent expenditure UgShs 9.013 Bn was for
wages and by the end of the financial year UgShs 9.013 Bn had been released representing
100% release and UgShs 8.879Bn representing 98.5% spent. For non- wage recurrent
expenditure UgShs 36.044 had been approved and by the end of the financial year UgShs
25.085 Bn had been released representing a 69.6% release. Of the money released for the
non-wage recurrent UgShs 25.059 Bn was spent representing 99.9%.
On the part of the development expenditure UgShs 241.713 was approved as GoU and UgShs
116.550 Bn as donor funding. By the end of the financial year UgShs 270.151 Bn had been
released by the GoU representing a release of 111.8% and UgShs 300.938 Bn representing a
release of 258.2%. Of this development money; UgShs 270.186 Bn was spent by GoU
representing a 111.8% spent and UgShs 300.938 Bn was spent on donor funding ,
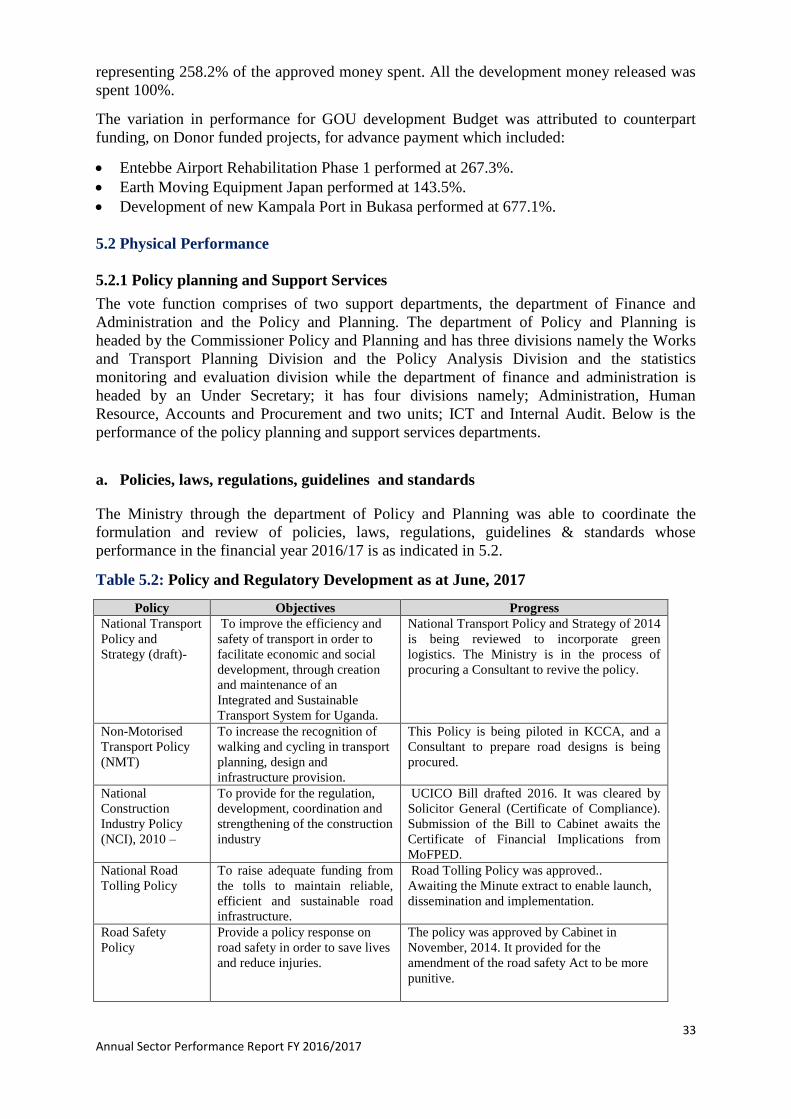
33 Annual Sector Performance Report FY 2016/2017
representing 258.2% of the approved money spent. All the development money released was
spent 100%.
The variation in performance for GOU development Budget was attributed to counterpart
funding, on Donor funded projects, for advance payment which included:
Entebbe Airport Rehabilitation Phase 1 performed at 267.3%.
Earth Moving Equipment Japan performed at 143.5%.
Development of new Kampala Port in Bukasa performed at 677.1%.
5.2 Physical Performance
5.2.1 Policy planning and Support Services
The vote function comprises of two support departments, the department of Finance and
Administration and the Policy and Planning. The department of Policy and Planning is
headed by the Commissioner Policy and Planning and has three divisions namely the Works
and Transport Planning Division and the Policy Analysis Division and the statistics
monitoring and evaluation division while the department of finance and administration is
headed by an Under Secretary; it has four divisions namely; Administration, Human
Resource, Accounts and Procurement and two units; ICT and Internal Audit. Below is the
performance of the policy planning and support services departments.
a. Policies, laws, regulations, guidelines and standards
The Ministry through the department of Policy and Planning was able to coordinate the
formulation and review of policies, laws, regulations, guidelines & standards whose
performance in the financial year 2016/17 is as indicated in 5.2.
Table 5.2: Policy and Regulatory Development as at June, 2017
Policy Objectives Progress
National Transport
Policy and
Strategy (draft)-
To improve the efficiency and
safety of transport in order to
facilitate economic and social
development, through creation
and maintenance of an
Integrated and Sustainable
Transport System for Uganda.
National Transport Policy and Strategy of 2014
is being reviewed to incorporate green
logistics. The Ministry is in the process of
procuring a Consultant to revive the policy.
Non-Motorised
Transport Policy
(NMT)
To increase the recognition of
walking and cycling in transport
planning, design and
infrastructure provision.
This Policy is being piloted in KCCA, and a
Consultant to prepare road designs is being
procured.
National
Construction
Industry Policy
(NCI), 2010 –
To provide for the regulation,
development, coordination and
strengthening of the construction
industry
UCICO Bill drafted 2016. It was cleared by
Solicitor General (Certificate of Compliance).
Submission of the Bill to Cabinet awaits the
Certificate of Financial Implications from
MoFPED.
National Road
Tolling Policy
To raise adequate funding from
the tolls to maintain reliable,
efficient and sustainable road
infrastructure.
Road Tolling Policy was approved..
Awaiting the Minute extract to enable launch,
dissemination and implementation.
Road Safety
Policy
Provide a policy response on
road safety in order to save lives
and reduce injuries.
The policy was approved by Cabinet in
November, 2014. It provided for the
amendment of the road safety Act to be more
punitive.
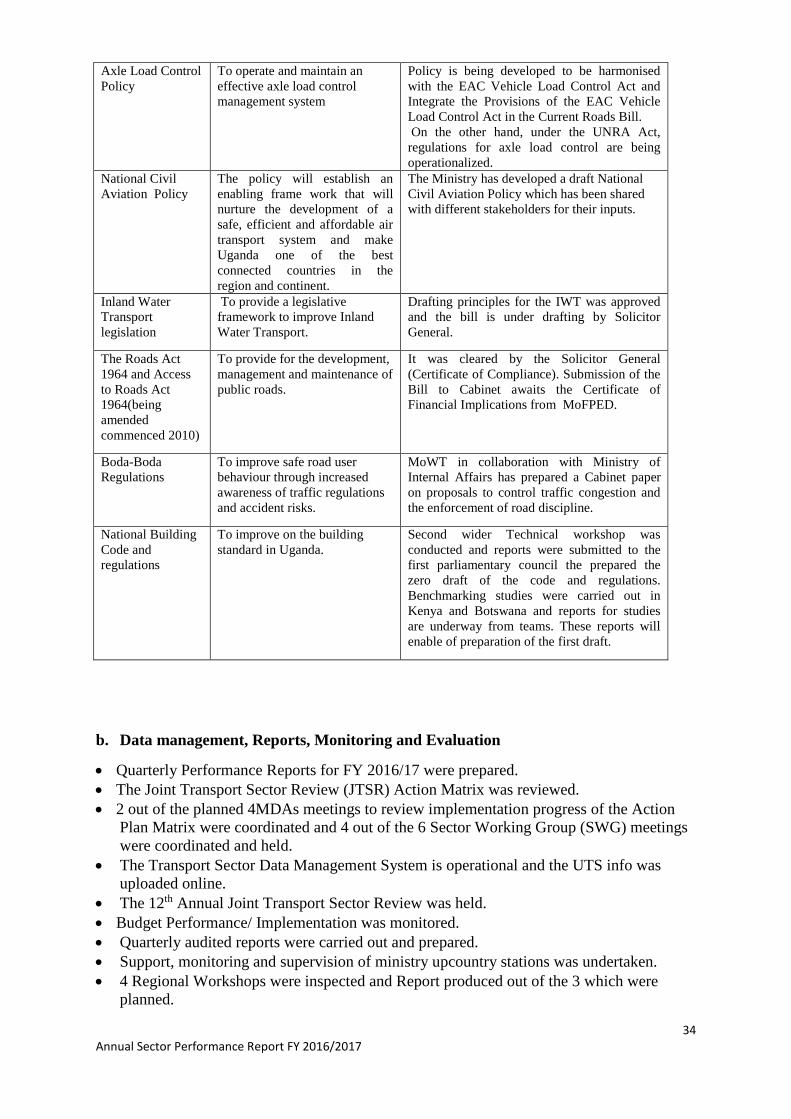
34 Annual Sector Performance Report FY 2016/2017
b. Data management, Reports, Monitoring and Evaluation
Quarterly Performance Reports for FY 2016/17 were prepared.
The Joint Transport Sector Review (JTSR) Action Matrix was reviewed.
2 out of the planned 4MDAs meetings to review implementation progress of the Action
Plan Matrix were coordinated and 4 out of the 6 Sector Working Group (SWG) meetings
were coordinated and held.
The Transport Sector Data Management System is operational and the UTS info was
uploaded online.
The 12th Annual Joint Transport Sector Review was held.
Budget Performance/ Implementation was monitored.
Quarterly audited reports were carried out and prepared.
Support, monitoring and supervision of ministry upcountry stations was undertaken.
4 Regional Workshops were inspected and Report produced out of the 3 which were
planned.
Axle Load Control
Policy
To operate and maintain an
effective axle load control
management system
Policy is being developed to be harmonised
with the EAC Vehicle Load Control Act and
Integrate the Provisions of the EAC Vehicle
Load Control Act in the Current Roads Bill.
On the other hand, under the UNRA Act,
regulations for axle load control are being
operationalized.
National Civil
Aviation Policy
The policy will establish an
enabling frame work that will
nurture the development of a
safe, efficient and affordable air
transport system and make
Uganda one of the best
connected countries in the
region and continent.
The Ministry has developed a draft National
Civil Aviation Policy which has been shared
with different stakeholders for their inputs.
Inland Water
Transport
legislation
To provide a legislative
framework to improve Inland
Water Transport.
Drafting principles for the IWT was approved
and the bill is under drafting by Solicitor
General.
The Roads Act
1964 and Access
to Roads Act
1964(being
amended
commenced 2010)
To provide for the development,
management and maintenance of
public roads.
It was cleared by the Solicitor General
(Certificate of Compliance). Submission of the
Bill to Cabinet awaits the Certificate of
Financial Implications from MoFPED.
Boda-Boda
Regulations
To improve safe road user
behaviour through increased
awareness of traffic regulations
and accident risks.
MoWT in collaboration with Ministry of
Internal Affairs has prepared a Cabinet paper
on proposals to control traffic congestion and
the enforcement of road discipline.
National Building
Code and
regulations
To improve on the building
standard in Uganda.
Second wider Technical workshop was
conducted and reports were submitted to the
first parliamentary council the prepared the
zero draft of the code and regulations.
Benchmarking studies were carried out in
Kenya and Botswana and reports for studies
are underway from teams. These reports will
enable of preparation of the first draft.
35 Annual Sector Performance Report FY 2016/2017
c. Capacity building
The Ministry recruited and deployed 52 officers, 15 of the existing staff were confirmed
and36 officers promoted and deployed.
ICT equipment were serviced and well maintained.
14 Staff were trained in short term Courses against the 8 planned for and one (1) refresher
in-house training activity on the online declaration of Assets and Liabilities was
coordinated. One (1) induction training programme was coordinated.
Ministry Payroll reviewed and Payroll Report was produced; salaries, pension and
gratuity were paid and staff welfare programs were coordinated and managed.
5.2.2 Directorate of Transport
The directorate of transport has three departments namely, Transport services and
infrastructure, transport regulations and the maritime administration.
The following subsections present the performance of the directorate of transport in the FY
2016/17.
a) Policies, laws and regulations, guidelines and standards
Draft maritime transport policy and the Draft Civil Aviation Policy developed
Drafting Principles for the amendment and review of the Traffic and Road Safety Act
were submitted to Cabinet Secretariat.
The Ministry obtained legal clearance for SIRBs, STCW and SOLAS from Solicitor
General and were submitted to MoFPED for financial clearance.
Inland Water Transport Bill being drafted by first parliamentary council.
Nine (9) ICAO conventions and protocols were ratified by cabinet.
Final draft amendment bill 2017 of Civil Aviation Authority Cap 354 was drafted and is
before parliament.
Draft civil Aviation Policy has been developed and has been shared with the different
stakeholders for their inputs.
Bilateral Air Services Agreement (BASA) with Mauritius was negotiated and ready for
signature.
BASA between Uganda and Tanzania was reviewed and signed.
Diplomatic Notes for review of two (2) BASAs were exchanged.
Cabinet Memo for Ratification of Traffic and Road Signage was drafted.
Draft Regulation for Donation and Gifts to NRSC was approved by the Council.
Finalized the Draft Civil Aviation Appeals Tribunal Regulations.
b) Inspection and Licensing of Public Service Vehicles & Inland water Transport
vessels
25,410 PSVs were inspected and licensed out of the 12,000 PSVs planned for. This high
number of PSVs licenced was due to automation of the licensing system and increased
enforcement.
Of the planned 1,000 bus operator licenses, 875 bus operator licenses processed. The
failure to achieve the target was due to the ongoing automation of the bus operator licence
module.
Of the planned 100 non-conventional Inland Water Transport vessels to be inspected and
licensed, 78 Inland water transport vessels were inspected, licensed and issued with
36 Annual Sector Performance Report FY 2016/2017
inspection certificates for compliance. All the two (2) Conventional Vessels were
inspected.
The Directorate in it’s mandate to ensure inspection of vehicles for road worthiness,
planned to inspect 200,000 vehicles. However, 31,664 Vehicleswere inspected by SGS
for road worthiness. The failure to meet the target was due to delays in prompting
enforcement to inspection and the postponement of compulsory inspection by parliament.
c) Coordination and Monitoring
Coordination (National, Regional and International)
The Annual National Road Safety Week was coordinated and held, and One (1)
Consultative workshop on road safety with stakeholders was conducted.
Of the planned 4 awareness campaigns, three (3) Road Safety Awareness Campaigns
were conducted due to limited funding. Two (2) Road Safety programmes by the private
sector were also coordinated.
The directorate made initial assessment on the Road Safety Performance Review in
collaboration with the Office of the UN Special Envoy on Road Safety.
One (1) stakeholders’ sensitization meeting on railways legal framework held.
The directorate participated in the East African Consultative Meetings on Facilitation of
Air Transport which was held in Kigali-Rwanda, a stakeholder’s workshop on reduction
of the cost for air fares was organized by the Northern Corridor and One National Air
transport facilitation meeting for all stakeholders was convened.
Three (3) National, Regional and International Programmes (ISCOS, CCTFA & AAM)
on IWT coordinated and Two (2) public sensitization campaigns on water transport safety
were conducted (VGM).
On the development of the inland water transport, the directorate planned to have
dissemination of the investment plan for improving connectivity of Islands on Lake
Victoria to all stakeholders and this was achieved as planned.
Monitoring
40 fatal accidentswere investigated, reports produced and submitted to NRSC.Black spots
along Kampala – Masakaroad were also identified and reports produced.
Of the 80 driving schools planned to be inspected and monitored, 79 driving schools were
inspected and monitored.75% of the bus routes were monitored.
Four Air Craft Accident investigations in Kajjansi, Soroti, Juba and Mutungo- Kampala
were conducted and 7 of the 14 upcountry aerodromes were inspected.
Flag state control was conducted on 10 vessels and 3 maritime accidents (one on Lake
Albert and two on Lake Victoria) were investigated and reports produced.
The directorate planned to have Regional Transport Sector Projects and Programmes
Coordinated and this was achieved by coordinating the Northern Corridor and Central
corridor projects and programs and reports were produced.
The directorate also planned to monitor the Performance of URC, CAA and EACAA-
Soroti and this was done by reviewing the quarterly reports of URC, CAA and EACAA-
Soroti and the reports were also produced.
In order to improve development of the inland water transport, the directorate planned to
conduct two (2) Surveys for passenger services of ferries across lakes. This was achieved
and reports were produced and it was also planned to conduct a socio-economic impact
assessment of investment in ferries in improving water transport, this was done and a
report was produced.
Design studies for Gaba, Butebo and Bule landing sites were planned to becompleted
however only feasibility studies for Gaba, Butebo and Bule landing sites were completed.
37 Annual Sector Performance Report FY 2016/2017
The ministry planned to have activities for Bukasa Port development monitored and this
was done as planned by reviewing the Inception master plan, the Inception report for the
Resettlement Action Plan, Interim Master Plan, Design criteria, monthly progress reports
and comments were made and submitted to the consultant.
d) Institutional Capacity Building
Bench-marking on harmonization of the railways legal framework was conducted.
Computerized Licensing equipment procured and installedand the Vessels' registry
created.
Six (6) Officers were trained in short-term courses related to Maritime Administration
and One (1) capacity building training on flag state control implementation was
conducted.
Training of Project Implementation Team members in Port management and operations
was completed as had been planned.
In terms of training for maintenance and building of air crafts; it had been planned to have
Training for 15 cadet pilots, 7 Course 26 Students in aircraft engineering and Training for
14 flight operations student completed. Training for 9 cadet pilots, 7 Course 26 Students
in aircraft engineering and Training for 14 flight operations student was completed. The
achievement was due to Training now starting 7am and closing at 6pm daily including
weekends
e) Capital development
The directorate planned to carryout maintenance and operations of runways, apron and
taxiways at thirteen (13) aerodromes (Arua, Pakuba, Masindi, Kidepo, Moroto, Lira,
Tororo, Jinja, Mbarara, Kisoro, Kasese, Soroti and Gulu). Maintenance and operations
of runways, aprons and taxiways was done at all aerodromeswith the exception of
Masindi.
Due to procurement delays,7.2 km of Perimeter fence at Arua Aerodrome which had
been planned to be constructed in the FY 2016/17 were not constructed. However, bids
for the construction of theperimeter fence at the aerodrome are still under evaluation.
On the development of the Inland Container Depot (ICD) at Gulu; northing was
achieved due to lack of funds. However, contract for the development of the Inland
Container Depot (ICD) was prepared and is awaiting signing if funds become
available.
It had been planned to have a consultant of the remodelling of Portbell and Jinja Piers
and replacement of MV Kabalega supervised and monitored. The consultant was
supervised and monitored and as a result the Design and tender documents for
remodelling Portbell and Jinja Piers and replacement of MV Kabalega were completed
and Procurement of the contractor to remodel Portbell and Jinja Piers and replacement
of MV Kabalega initiated. However, the Ministry could not proceed further than that
due to limited funds.
It had been planned to have Land survey of Bukasa port area completed; however,
Land survey at Bukasa area and Procurement of specialized equipment, services and
works (start-up infrastructure, dredging, piling and swamp surcharging) were
commenced but could not continue due to insecurity caused by the residents. The Final
Report for Social Environmental Impact Assessment (SEIA) was prepared and
submitted to NEMA for approval as had been planned in the FY2016/17.
It was planned to prepare a Draft Resettlement Action Plan (RAP) Bukasa port.
However, only the inception report of the Resettlement Action Plan (RAP) was
completed due to insecurity caused by the residents.
38 Annual Sector Performance Report FY 2016/2017
It had been planned to have the Master Plan for the development of Bukasa Port
prepared. However, only the Inception and interim reports for the master plan of the
development of Bukasa port were completed.
Draft Preliminary Engineering Designs for Bukasa Port produced had been planned to
be produced in the FY2016/17. However, only the inception and Design criteria report
completed due to insecurity caused by the residents.
On the development of the formulation of Master Plan on Logistics in Northern
Economic Corridor project, the Draft Final Master Plan with regional strategy was
reviewed and approved as had been planned, the Final Logistics Master Plan with
regional Development strategy was planned to be developed and approved however,
the plan was developed but not approved because it awaits approval by cabinet.
f) Water Transport Regulation
There were no projects in the division. The main activities were to review and
harmonize maritime legislation, prepare a maritime transport policy, create a maritime
administration (regulatory body) and accede to key IMO conventions to be able to
regulate and manage water transport.
Physical performance for the division of Water Transport was as follows:
02 No. of public sensitization campaigns on water transport safety out of 4
planned, were carried out (VGM);
03No. maritime accident one on L. Albert and two on L. Victoria Investigated
and reports produced;
International program coordinated (participated at the 97th MSC committee
meeting of the IMO);
25 No. non-conventional water vessels inspected for safety, security and
human elements for safe shipping and issued certificates;
Flag state control conducted on 05No. of conventional water vessels to
promote safe, secure and environmentally sound and sustainable shipping
(MV Masindi, MV Kyoga 2, MV Albert Nile 1 and MV MVKiyindi);
01No. regional program coordinated (CCTFA).
Challenges and Proposed Mitigation Measures
There was no regulatory institution set up to efficiently and safely regulate the subsector;
Lack of an elaborate Maritime Transport Policy to supplement the National Transport
Policy;
Old and fragmented laws and regulations;
Minimal participation in regional and international meetings hinders development and
best practices;
Not acceded to IMO conventions hindered implementation of water transport regulations;
Lack of modern harmonized legal maritime framework has attracted ad hoc investors in
the water transport sector making it hard to regulate and manage
Flag and Port State Control activities hard to achieve due to lack of sound vehicles to
transport officers for requisite fieldworks;
Lack of Search and Rescue (SAR) facilities hampering rescue services on water bodies
Not acceding to IMO conventions makes the water bodies not safe, secure and
environmentally friendly
Lack of boat building standards and trained personnel to handle the operations of vessels
on water transport
39 Annual Sector Performance Report FY 2016/2017
Lack of maritime training institutes to build capacity in operations of the water sector
Mitigation Measures
Review and update the old maritime legislation;
Creation of a Maritime Administration;
Provision of field work vehicles to the Administration for purposes of covering field
works;
Acceding and domesticating selected IMO conventions;
Programing and budgeting sufficiently to attend regional and international meeting
related to improvement of water transport for best practices;
Carry out Flag and Port State Control activities;
Develop SAR policy and facilities;
To promote public awareness of the benefits of inland water transport, thereby
encouraging a modal shift to inland water transport where appropriate;
To enhance cooperation between agencies responsible for inland water transport and
water resources management for navigation purposes through coordinated national
planning and the development and implementation of policies;
To increase the public sector resources allocated to inland water transport to reflect
the relative priority of such transport and to encourage partnerships between the
public and private sectors to improve the development, management and operation of
inland water transport;
To develop statistical information systems to support policy, management and
operational decision-making;
To establish or strengthen appropriate centres and institutional capacity to undertake
studies and research to identify physical and institutional bottlenecks that are
hindering the efficient development and operation of inland water transport, and to
promote human resources development to address those deficiencies;
Implementation of the Lake Victoria Transport Act (2007) and related regulations in
order to bring Uganda’s laws into conformity with EAC legislation on Lake Victoria;
Training and Capacity building.
g) Project Implementation under the directorate
(A). Support to Computerized Driving Permits Project
Objective
i) To reduce forged driving permits amongst road users by 90% by the year 2020.
ii) To optimize the performance of the Uganda Computerized Driving Permits systems
software
iii) To ensure seamless and un-interrupted services delivery for the production and issuance
of Computerized Driving Permits (CDPs) at the 7No. Computerized driving permits
production facilities at Kampala, Mbarara, Gulu, Arua, Mbale, Jinja and Fortportal.
iv) To ensure compatibility of the Uganda Computerized Driving Permits systems software
with third party software applications of other government agencies (NIRA, POLICE,
URA, etc).
v) To reduce road traffic accidents caused by incompetent drivers of Public Service Vehicles
by 90% by the year 2020
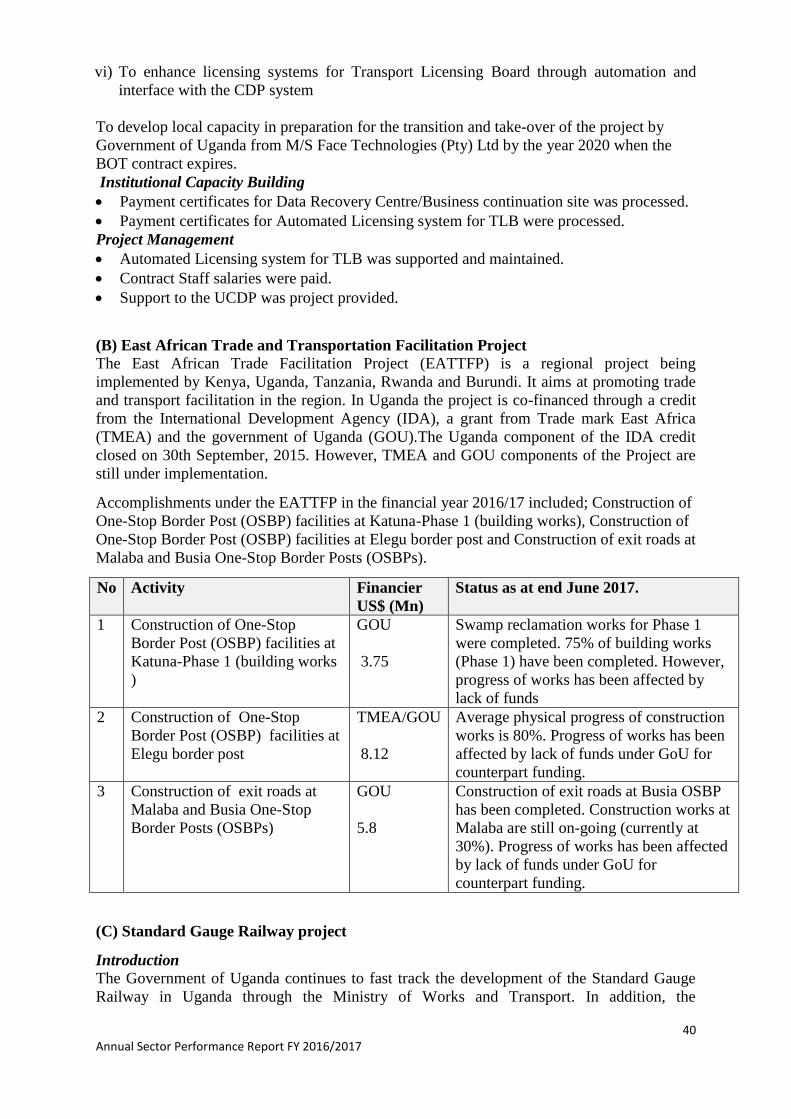
40 Annual Sector Performance Report FY 2016/2017
vi) To enhance licensing systems for Transport Licensing Board through automation and
interface with the CDP system
To develop local capacity in preparation for the transition and take-over of the project by
Government of Uganda from M/S Face Technologies (Pty) Ltd by the year 2020 when the
BOT contract expires.
Institutional Capacity Building
Payment certificates for Data Recovery Centre/Business continuation site was processed.
Payment certificates for Automated Licensing system for TLB were processed.
Project Management
Automated Licensing system for TLB was supported and maintained.
Contract Staff salaries were paid.
Support to the UCDP was project provided.
(B) East African Trade and Transportation Facilitation Project
The East African Trade Facilitation Project (EATTFP) is a regional project being
implemented by Kenya, Uganda, Tanzania, Rwanda and Burundi. It aims at promoting trade
and transport facilitation in the region. In Uganda the project is co-financed through a credit
from the International Development Agency (IDA), a grant from Trade mark East Africa
(TMEA) and the government of Uganda (GOU).The Uganda component of the IDA credit
closed on 30th September, 2015. However, TMEA and GOU components of the Project are
still under implementation.
Accomplishments under the EATTFP in the financial year 2016/17 included; Construction of
One-Stop Border Post (OSBP) facilities at Katuna-Phase 1 (building works), Construction of
One-Stop Border Post (OSBP) facilities at Elegu border post and Construction of exit roads at
Malaba and Busia One-Stop Border Posts (OSBPs).
No Activity Financier
US$ (Mn)
Status as at end June 2017.
1 Construction of One-Stop
Border Post (OSBP) facilities at
Katuna-Phase 1 (building works
)
GOU
3.75
Swamp reclamation works for Phase 1
were completed. 75% of building works
(Phase 1) have been completed. However,
progress of works has been affected by
lack of funds
2 Construction of One-Stop
Border Post (OSBP) facilities at
Elegu border post
TMEA/GOU
8.12
Average physical progress of construction
works is 80%. Progress of works has been
affected by lack of funds under GoU for
counterpart funding.
3 Construction of exit roads at
Malaba and Busia One-Stop
Border Posts (OSBPs)
GOU
5.8
Construction of exit roads at Busia OSBP
has been completed. Construction works at
Malaba are still on-going (currently at
30%). Progress of works has been affected
by lack of funds under GoU for
counterpart funding.
(C) Standard Gauge Railway project
Introduction
The Government of Uganda continues to fast track the development of the Standard Gauge
Railway in Uganda through the Ministry of Works and Transport. In addition, the
41 Annual Sector Performance Report FY 2016/2017
government is undertaking the development of the Greater Kampala Metropolitan Area
(GKMA) Light Rail Mass Transit (LRT) system. A total of 1,724Km of SGR and 240Km of
LRT will be developed but in a phased manner.
The Main SGR project is being implemented as a regional project with Uganda’s partner
states of Kenya, Rwanda and South Sudan. The SGR network will stretch from Mombasa
through Nairobi to Kampala, Kigali and Juba. The SGR-GKMA/LRT will be implemented
for the Greater Kampala Metropolitan Area conforming to international standards.
The SGR will catapult the Ugandan economy to higher realms due to its enormous economic
benefits. The SGR is intended to assist the country to become more competitive middle
income economy by lowering the cost of doing business, attracting FDI in the industrial
sector and promoting regional integration and trade. It will help in integrating Uganda into
world trade by having cheap and reliable access to the sea and to the main maritime routes.
Financial Performance
For the Financial Year 2016/17, the SGR Project was allocated a total of UGX 113.5bn. Of
the allocated funds, a total of UGX 46.8bn (41.2%) was released to the Project Management
Unit. About 66% of the funds were used for land compensation and the rest was used on
other project activities.
Summary Progress of the SGR Project During the FY 2016/17
a) Land acquisition: Land acquisition continues and the following have been achieved in
FY 2016/17;
i. Sensitization and mobilization of all Project Affected Persons (PAPs) and the
general public continues to ensure that there is adequate information
dissemination about the project. This has been done using electronic and social
media, public meetings and door to door engagements.
ii. Valuation Reports for the districts of Butaleja, Namutumba, Luuka, Iganga,
Mayuge, and Jinja corridor were submitted to the Chief Government Valuer
(CGV) for approval.
iii. The CGV approved valuation reports for Butaleja, Namutumba, Iganga, Mayuge
and Luuka districts.
iv. Demarcation of the acquired Right of Way (ROW) is ongoing in areas where
PAPs have been fully paid up; so far 60km in Tororo and Butaleja districts have
been demarcated.
v. Subdivision of the acquired customary land is ongoing for Tororo, Luuka and
Namutumba districts; the team is compiling Job Record Jackets (JRJs) which are
schedules of subdivision of land for submission to Department of Survey and
Mapping (MoLHUD). One land title in Namutumba has so far been returned to
a PAP whereas the JRJ for Butaleja district (Customary land) has been
submitted.
b) Financing: Negotiations with China EXIM bank for the Eastern Route are ongoing.
Three rounds of negotiations have been held during the Financial Year. All comments
raised by the Bank have been addressed except finalization of the loan repayment plan
and harmonization of construction timelines for Naivasha-Kisumu-Malaba and Malaba-
Kampala with Kenya. A position has been agreed upon between Uganda and a Kenya
and will be submitted to the financier this month.
c) Policy Legal and Institutional Framework: Development of a common policy, legal
and institutional framework (spearheaded by Kenya) is under way to ensure that there is
seamless operations within the region. The report will be ready in July 2017. In addition,
the Ministry of Works and Transport is developing a National Railway Policy that will
be in tandem with the NCIP summit directive.
42 Annual Sector Performance Report FY 2016/2017
d) Construction of the Eastern Route: Review of the construction plan is substantially
completed and the Final plan will be produced after the Contractor (CHEC) has made
input. In addition, the Consultancy services for Seismic studies were completed.
e) Compliance with the agreed Chinese standards: The Project has set up a Quality
management desk which has prepared a Quality Assurance plan. The plan was approved
by the SGR Board.
f) Competent Operations and Management framework: Plans, Operation and
Management are under way. Specifically, Government has signed an MOU with the
Contractor for them to undertake operation of the section, in the interim, as the Uganda
Partner States build their local capacities. This was also done in Kenya.
g) Well-staffed and skilled Project Staff: A draft Capacity Building Plan has been
developed. The major objective is to build a globally competent human resource for
developing, sustaining, operating and maintaining a modern and efficient railway
transport system.
h) Seamless and Joint railway operation between Uganda and Kenya: Harmonisation
between the two countries is key for smooth development, operations and management
of the SGR. A bilateral agreement and two communiques have been signed to this effect.
Key issues that have been agreed upon include, harmonised construction plan,
electrification, joint and seamless operations, construction of the bridge at Malaba,
Construction of a Railway One Stop Border Post and customs and trade.
i) Regional coordination of the SGR: The Project hosted the NCIP SGR- Cluster meeting
of June 2017. It also participated in several other regional activities, assignments and
meetings.
j) Technology and skills transfer to Ugandan Nationals: A skills audit has been
undertaken to identify the gaps and an internal Capacity Building Plan prepared.
Engagements are also ongoing both with the Contractor and Uganda’s private sector.
k) Substantial Local Content of up to 40% of Civil works: Local content mainstreaming
is a key component in the development of SGR in Uganda and the following has been
considered:
i. Project Local Content Strategy and Implementation Plan has been developed.
ii. A plan made for USD 700m to be spent locally during the construction of the
Malaba-Kampala SGR.
iii. All the cement will be locally sourced.
iv. Discussions with three major manufacturers of steel are ongoing and they have
undertaken to improve their sources of materials, upgrade their manufacturing
processes and improve packaging to meet the required railway standards.
v. Earthen materials like gravel, sand, aggregate and ballast will be sourced
locally.
vi. 90% of the workers during construction will be Uganda nationals and 10%
foreign.
vii. The plan is to ensure that the contractor advertises all the opportunities locally
before sourcing from other markets.
viii. Discussions with other MDAs and private sector players are ongoing.
l) Transit Oriented Development and Cargo Oriented Development: Plans for
development of Industrial Parks, Inland Container Depots and Silos along the Malaba-
Kampala Route are under way. This is meant, not only to increase traffic on the railway,
but it is also a major plan for the export oriented strategy as enshrined in the Vision
2040.
m) Consideration of Key Social Safeguards: The SGR Project is mainstreaming Social
issues in its implementation. The following were achieved in FY 2016/17:
43 Annual Sector Performance Report FY 2016/2017
i) Social Safeguards Policy; HIV/AIDS work place Policy; Social Safeguards
Strategy and Guide have been finalized and approved by the Board. Preparation
of Hand manuals is ongoing.
ii) Draft Social Economic base line reports of 04 No; districts have been prepared
whereas data entry for 02 No. districts in ongoing.
iii) Post compensation monitoring was commenced in 03 No. districts.
iv) Awareness trainings have also been conducted.
n) Environmental friendliness of the SGR: The Project continues to ensure
Environmental protection in carrying out its activities. The project Environmental
Safeguards Policy and Environmental Safeguards Strategy have been developed and
approved by the board. Boundary coordinates for all wetlands were obtained and
environmental assessment done for 15 No affected factories.
o) Progress on Greater Kampala Metropolitan Area Light Rail System (GKMA
LRT): Plans for development of the GKMA LRT are underway. Preparation of
Preliminary Engineering and Bankable Feasibility Study is substantially completed by
CCECC. The project is being considered for PPP framework mode of delivery by
MoFPED.
p) Progress on The Northern Route: Preliminary Engineering Designs and
Environmental Impact Assessment undertaken CPCS from Canada have been completed.
Additionally, Bankable Feasibility Studies by CHEC have been completed.
q) Progress on The Western and South Western Routes: Preliminary Engineering
Designs and Environmental Impact Assessment by Gauff from Germany have been
completed. In addition, Bankable Feasibility Studies by CCECC have been completed.
r) Harmonization of the SGR project with other Infrastructure Projects:
Harmonization continues. This is being done together with other MDAs like UNRA,
KCCA, UETCL, NWSC, LGs. Key projects that have been considered include: Kampala
Fly over, KJE, UETCL high voltage lines, NWSC water pipelines and sewerage
pipelines among others.
Challenges
Financing: The cost of compensation for the Right of Way is estimated at about UGX 600bn.
The budget for the Next Financial Year 2017/2018 is UGX 72bn. Therefore, the shortfall is
about UGX490 (some compensation has taken place). It is important to note that the cost of
compensation is high west of Jinja.
Physical Planning: Due to lack of integrated physical planning, the SGR alignment affects
major installations including 33 schools and 11 factories. The alignment also passes through
Kakira and Lugazi sugar plantations and Kasaku tea estates. The alignment also affects
American Embassy Stores, former Tuskys super market in Bugolobi and other major private
facilities and buildings.
Lack of detailed integrated infrastructure plans especially roads, railways, electricity
transmission lines and drainage channels has led to review of some already finalized designs
of infrastructures like expressways and structures. This leads to delay of projects and
increases in costs.
Land Acquisition Challenges: Illegal settlements in wetlands, and forest reserves. The land
acquisition process is being hampered by encroachers on wetlands and forest reserves. An
example is Namanve forest reserve (Wakiso district) where there are several illegal
developments. These encroachers have been hostile to the project and have subsequently run
to court and obtained several interim orders which have put a halt on the land acquisition
process in the area. The interim orders not only set a bad precedent for future infrastructure
44 Annual Sector Performance Report FY 2016/2017
projects but will significantly delay implementation of the SGR Project, Bukasa Port Project
and the Kampala Jinja Express Way.
5.2.3 Directorate of Engineering Works
The directorate of engineering works has four departments namely, Roads and Bridges,
Mechanical Engineering Services, Public Structures, and Construction Standards and Quality
Assurance. During the FY 2016/17, the directorate implemented six (6) projects namely
Interconnectivity Project, 14 selected Small bridges,Urban Roads Re-sealing project,
Rehabilitation of Districts Roads project,U - Growth Support to MELTC project and U-
Growth Support to DUCAR. The following subsections present the performance of the
directorate of engineering works in the FY 2016/17.
a) Development of Policies, laws, guidelines, plans and strategies
Guidelines and manuals for the development and maintenance of roads, bridges and
drainage structures were prepared as planned.
Solicitation documents to undertake review of General Specifications for roads and
bridges were prepared.
On the operationalization of the Building Control Act, 2013 ; this was not achieved since
the Act awaits formulation of the board. However, the vetting of the Nominees for
appointments to National Building Review Board was completed.
Solicitation documents to develop guidelines for implementation on non-motorised
transport policy were prepared
Requests for certificate of financial implication for establishment of UCICO, Engineers
Registration Act and Road Act were submitted to MoFPED.
General specifications and manual for Low Volume Sealed Roads were prepared and
reviewed
Giudelines for use, care and management of Road Equipment were prepared and issued to
MDAs and Local Governments.
b) Monitoring Compliance of Construction Standards and undertaking Research
UNRA compliance with maintenance and construction work plans for national roads was
monitored as had been planned.
Compliance of district local governments, urban and any other authorities on maintenance
and construction of district, urban and community access roads monitored.
Gender mainstreaming and compliance audits of 6 MDAs were undertaken.
Monitoring of compliance to set engineering standards and Environmental audits in 30
MDAs were undertaken.
Quality control on construction materials was conducted
Technical advice on construction standards was rendered to 25 MDAs
c) Monitoring and Capacity Building Support
Monitoring the installation and distribution of culverts was undertaken.
250 equipment operators from district local governments were trained under Luwero
cluster.
45 Annual Sector Performance Report FY 2016/2017
The Second Benchmarking Study on Building Code was undertaken in Gaborone,
Botswana and draft reports for 2 benchmarking studies were prepared.
Environmental and social impact assessment reports on 3 construction sites; Kaguta
Bridge and Kidere quarry and Gulu ICD were carried out.
TRASCO members were trained in Gender and HIV/AIDS mainstreaming,
environmental, climate change mitigation and adaptation principles and social impact
assessment.
Under the U - Growth Support to MELTC project, the following capacity building
interventions were achieved;
TNA was carried out in 65 DLGs in Western and Central Uganda to identify trainees to
attend LBT, LCS & Road Maintenance courses;
298 Road Gang Leaders (15 of whom are women) from Bukedea, Kumi, Ngora, Serere,
Soroti, Amuruia, Katakwi, and Kaberamaido Districts Local Governments trained in
Force account Routine Road maintenance management;
7 technicians (SoW) from seven districts of Kisoro, Sheema, Bulambuli, Kyankwanzi,
Manafwa, Kiryandongo, &Bukwo trained in use of LBT in construction of district
roads;
17 DLGs technicians from 17 districts trained in the use of RAMPS software package
for preparation of Annual district roads work plans;
8 Community based Services officers (from the divisions of Community development,
Environment, Health education, Labour and Gender) from urban councils of Arua,
Kaabong, Kabala, Lorengecora, Njeru, &Bukwo trained in mainstreaming of road
sector related Environment and Social safe guards issues in Local Governments;
20 MELTC training staff trained (ToT) in implementation of Environment Impact
Assessment and Social safe guards in the road sector;
12 MELTC training staff attended training of trainers (ToT) short course in the design
and construction of appropriate suspended and suspension steel bridge structures for
Community Access at MELTC. and;
Outreach support to evaluate the performance of trained road Gang leaders in routine
road maintenance conducted in 18 districts of eastern Uganda.
Forty (40) apprentices were trained
6 building construction sites were monitored out the 6 planned for in the FY 2016/17.
They were; construction of Lukaya market, rehabilitation of the Late Gen Tito Okello
house, remodeling of the regional workshops, remodeling of the central mechanical
workshop and Kyabazinga place.
5 out of the 4 planned structural integrity tests were carried out. The over performance
was due to the fact that the activity is demand driven.
6 CPD / workshops / seminars /symposium or Annual general meetings for professional
bodies (architects, and surveyors) were attended by staff. Membership and subscription
of Architects and Quantity Surveyors to international Professional Organizations was
paid for as planned.
d) Mechanical Technical Advisory Services (Government vehicles and
machinery) The services provided in this subsection are mainly demand driven.Below are the
achievements in the Mechanical Technical Advisory Services.
Eighteen (18) persons out of the planned twenty (20) were tested for driving
competence.
Of the planned 1,000 MDA vehicles, 960 Vehicles were assessed for pre-repair
inspection. All the 500 vehicles from MDAs were assessed for post-repair inspection.
All the 50 vehicles and plant for the general public were inspected and valued.
46 Annual Sector Performance Report FY 2016/2017
120 vehicles from MDAs were boarded off out of the planned 150.
Of the total 394 vehicles of Ministry of Works and Transport 335 vehicles
representing 85% of the fleet inspected.
Ministry of Health fleet at headquarters (representing 30% of entire MoH fleet) were
inspected.
23 vehicles/ plant/ machinery were registered out of the planned 250.
Three (3) pre-shipment inspections of road equipment from Japan were conducted and
377 units of equipment were received in the country, inspected and registered.
e) Operations and maintenance of Government vehicles and ships
Coordinated Transport requirements for four(4) national functions
The planned 90% availability of MV Kalangala was attained. The 10% was reserved for
mandatory maintenance of the vessel for a period of two weeks.
Average availability of the Government Protocol fleet kept at 45% against the target of
50% because the procurement for the repair of some vehicles was ongoing while other
protocol fleet vehicles were undergoing repair.
Average availability of District Local Government and Zonal road equipment kept at 50%
because there were inadequate funds released to effect the necessary repairs on the
equipment.
f) Capital developments
Under the Interconnectivity Project, 29km were planned to be rehabilitated and 94.8 Km
of roads in the specified districts (Kyankwanzi, Buvuma, Rakai, Soroti, Ibanda,
Ntungamo, Moroto, Bugiri, Kumi, Kanungu, Rukungiri and Luwero districts) were
rehabilitated.The reason for over performance was not provided.
The procurement for a contractor for construction of access road to Busoga College
Mwiri was finalized however the contract is due to be signed in FY 2017/18.
On the 14 selected Small bridges, the performance was as ; Lot 2 : Nyawa& Kochi 2
bridges were completed, Lot 3:Abalang, Olyanai, Alipa, Akol, Airogo,Rushaya(Mitoma
district) bridgesand Binyuga swamp crossing (Mbarara) were completed, Saaka swamp
Phase II - 91% complete, Okokor bridge (Kumi) 60% complete, Orom bridge (Kitgum)
99% complete, Kaguta bridge (Lira) 98% Complete and Agwa bridge (Lira) 90%
complete.
For the Urban Roads Re-sealing project, the performance was: 0.8 km (Moird) tarmacked
in Kapchorwa TC, 1.0 km (New Quarter Guard road) tarmacked at NALI Kyankwanzi,
1550m2 of stone pitched drainage channels constructed along NALI estate roads in
Kyankwanzi anddrainage construction works is still in progress along Bwanda Convent
road.
Under the rehabilitation of Districts Roads project; 279 lines of culverts installation under
force account were installed; 1.8km of river corridor filled and 0.9km of river channel
excavated in Namanve industrial park; 1.39km of the boundary service corridor filled
with gravel in Namanve to improve drainage and realignment of the river; the DUCAR
Database was also maintained and
managed; and roads were gravelled, opened and shaped as elaborated in the table below;
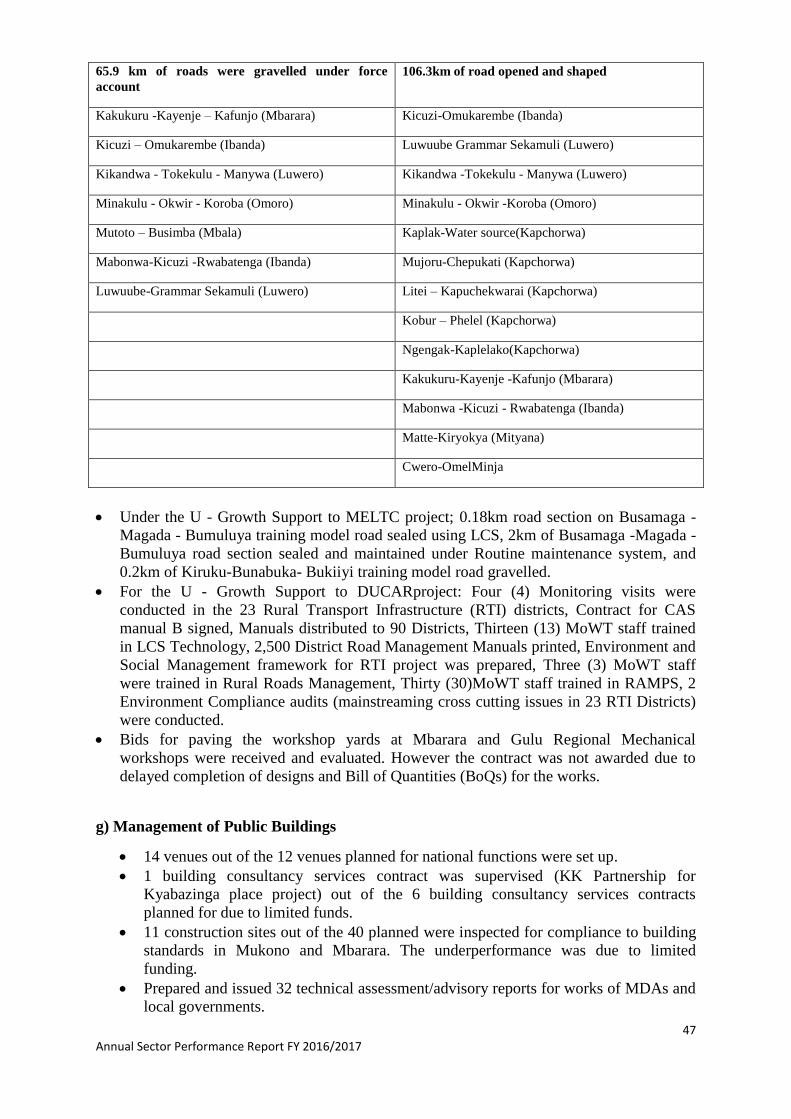
47 Annual Sector Performance Report FY 2016/2017
65.9 km of roads were gravelled under force
account
106.3km of road opened and shaped
Kakukuru -Kayenje – Kafunjo (Mbarara) Kicuzi-Omukarembe (Ibanda)
Kicuzi – Omukarembe (Ibanda) Luwuube Grammar Sekamuli (Luwero)
Kikandwa - Tokekulu - Manywa (Luwero) Kikandwa -Tokekulu - Manywa (Luwero)
Minakulu - Okwir - Koroba (Omoro) Minakulu - Okwir -Koroba (Omoro)
Mutoto – Busimba (Mbala) Kaplak-Water source(Kapchorwa)
Mabonwa-Kicuzi -Rwabatenga (Ibanda) Mujoru-Chepukati (Kapchorwa)
Luwuube-Grammar Sekamuli (Luwero) Litei – Kapuchekwarai (Kapchorwa)
Kobur – Phelel (Kapchorwa)
Ngengak-Kaplelako(Kapchorwa)
Kakukuru-Kayenje -Kafunjo (Mbarara)
Mabonwa -Kicuzi - Rwabatenga (Ibanda)
Matte-Kiryokya (Mityana)
Cwero-OmelMinja
Under the U - Growth Support to MELTC project; 0.18km road section on Busamaga -
Magada - Bumuluya training model road sealed using LCS, 2km of Busamaga -Magada -
Bumuluya road section sealed and maintained under Routine maintenance system, and
0.2km of Kiruku-Bunabuka- Bukiiyi training model road gravelled.
For the U - Growth Support to DUCARproject: Four (4) Monitoring visits were
conducted in the 23 Rural Transport Infrastructure (RTI) districts, Contract for CAS
manual B signed, Manuals distributed to 90 Districts, Thirteen (13) MoWT staff trained
in LCS Technology, 2,500 District Road Management Manuals printed, Environment and
Social Management framework for RTI project was prepared, Three (3) MoWT staff
were trained in Rural Roads Management, Thirty (30)MoWT staff trained in RAMPS, 2
Environment Compliance audits (mainstreaming cross cutting issues in 23 RTI Districts)
were conducted.
Bids for paving the workshop yards at Mbarara and Gulu Regional Mechanical
workshops were received and evaluated. However the contract was not awarded due to
delayed completion of designs and Bill of Quantities (BoQs) for the works.
g) Management of Public Buildings
14 venues out of the 12 venues planned for national functions were set up.
1 building consultancy services contract was supervised (KK Partnership for
Kyabazinga place project) out of the 6 building consultancy services contracts
planned for due to limited funds.
11 construction sites out of the 40 planned were inspected for compliance to building
standards in Mukono and Mbarara. The underperformance was due to limited
funding.
Prepared and issued 32 technical assessment/advisory reports for works of MDAs and
local governments.
48 Annual Sector Performance Report FY 2016/2017
4 construction and fire related accidents were investigated and reports produced.
The Ministry planned to have Phase 1 and 2 works at Lukaya market executed to
completion but achieved only 48% completion level due to funding gap.
The remodelling of the Central Mechenical Workshop was completed and the defect
liability period ended. Penultimate certificate was paid.
The General Tito Okello’s House 66.4% by the end of the FY. The contract was long
overdue and the contractor must vacate the project.
h)Coordination
The Transport Sector Coordination Committee (TRASCO) on cross cutting issues
were strengthened
ERB, NEMA and UIPE Secretariats were Supported
Wider stakeholders’ workshops for Building Code formulation were not held due to
lack of funds.
i)Material Testing
250 tests on construction materials were conducted and reports produced.
8 geo-technical investigation reports were prepared.
j)Project Implementation
Earth Moving Equipment Japan project
In June 2012, The Government of Uganda (GoU) made a policy shift from contracting the
road maintenance works in Local Governments (LGs) to Force Account. This was
subsequently followed with the acquisition of a fleet of 1,425 pieces of new equipment
through a USD100 million loan from China which was distributed to local governments.
However, Local Governments have not been able to successfully carryout road maintenance
activities by the force account, due to the following: The Chinese equipment given to the LGs
in 2012 was meant for light works. However, the LGs cannot disaggregate light works from
heavy works. Therefore, the equipment is operated beyond its capacity as most roads require
heavy intervention leading to frequent breakdowns. Additionally, a complete set of road
equipment would require at least: a motor grader, two (2) dump trucks (tippers), a wheel
loader, a backhoe excavator, a compactor (roller) and a water bowser. However, LGs lack at
least two of this basic equipment which makes it difficult for them to achieve the expected
productivity. In view of the above The Cabinet, under Cabinet Memorandum CT (2015) No.
27 by the Hon. Minister of Finance, Planning and Economic Development, approved a
proposal to borrow up to JPY 15.13bn (US$ 131.75m) from Japan Bank for International
Cooperation (JBIC) to purchase earth moving equipment for all District Urban Authorities in
order to effectively execute all the basic road maintenance activities. Some of the equipment
would be allocated to Uganda National Roads Authority, Ministry of Defense and Ministry of
Works & Transport to improve the road network in the country.
Objectives
i. To equip all local governments with a complete road unit.
ii. To ensure LGs are able to carry out both light and heavy mechanized road maintenance
work.
iii. To adequately train road equipment operators, mechanics, and technicians.
49 Annual Sector Performance Report FY 2016/2017
Physical Performance
Three (3) pre-shipment inspections of road equipment from Japan were conducted and
377 units of equipment were received in the country, inspected and registered.
Ninety five (95) units of equipment (54 motor grader and 41 wheel loader) were
received, inspected and distributed to 67 district local governments.
A total of 48 (1 motor grader, 5 wheel loaders, 23 bull dozers, and 19 excavators)
units were received, inspected and distributed to zonal centers and MoWT force
account units.
A total of 17 units were received, inspected and distributed to UNRA (15.) and KCCA
(2).
250 equipment operators from district local governments were trained under Luwero
cluster.
5.2.4 Local Governments
5.2.4.1 Mandate
To ensure that Districts and Urban council roads are rehabilitated to a fair condition and
routinely maintained in order to increase agricultural production and household income in
rural areas and facilitate trade and industrial production in urban areas.
5.2.4.2 Projects and their performance.
Rural Transport Infrastructure Projects
The Danida supported U-Growth programme is a 4-year programme aimed at facilitating
agriculture as a vehicle for economic development and poverty reduction, focusing on pro-
poor growth generating income and employment in rural areas. The U-growth programme
comprises three components:
Public sector Agriculture support.
Rural Transport Infrastructure support for agriculture development
Agribusiness Development Initiative.
The Rural Transport Infrastructure (RTI) component is implemented through the MoWT and
is a continuation of 12 years of Danish support to Uganda road sector in Road sector
programme support (RSPS) I&II and Rural Roads Programme (RRP).
Project Objective
The objective of the component is to develop and maintain district and community access
roads to promote cheaper, efficient and reliable transport services to facilitate access to
markets and improve access to extension services, agricultural inputs and social service.
Location
The component is focused on the north and northeastern districts where civil war lasted for
two decades. These districts include; Apac, Oyam, Gulu, Amuru, Katakwi, Amuria,Kitgum,
Kumi, Bukedea, Amolator,Pader,Soroti, Kaberamaido, Agago, Lira,Dokolo, Alebtong, Kole,
Lamwo, Ngora, Nwoya, Otuke and Serere.
5.2.4.3 Financial performance in FY 2016/17
The Approved Budget was Ug Shs 10.901 Billion and Ug Shs 10.901 Billion was released
and 97% was utilized.
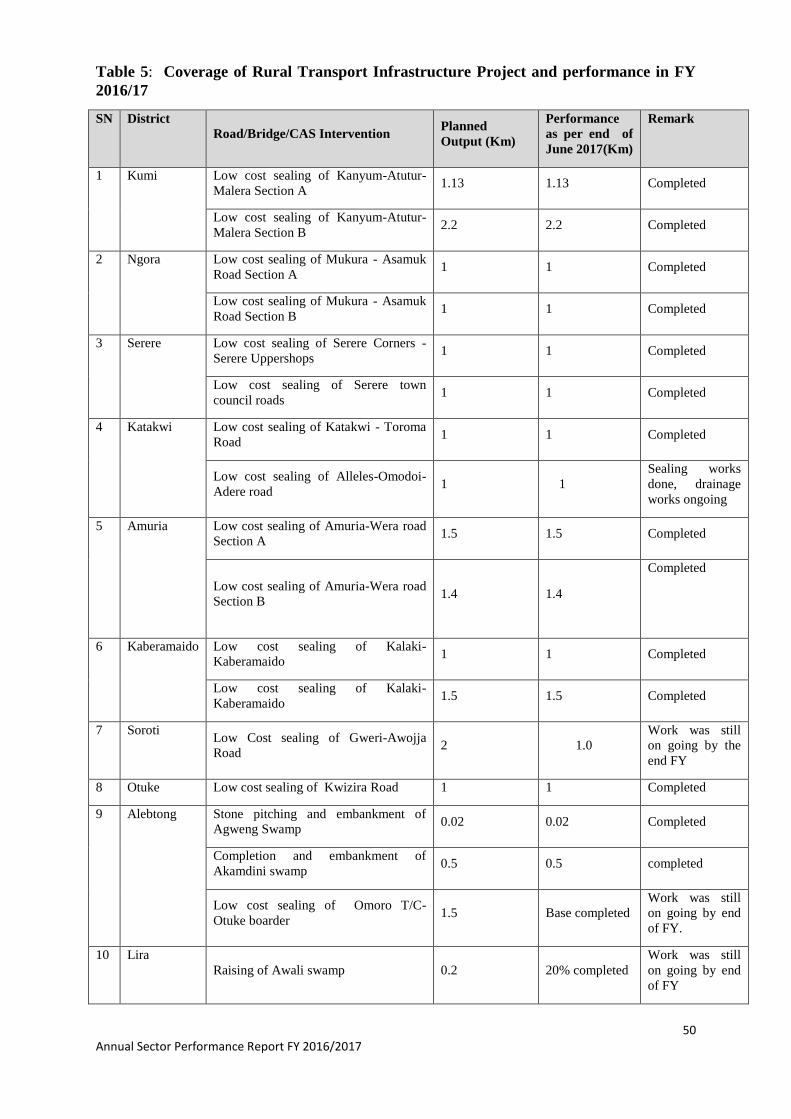
50 Annual Sector Performance Report FY 2016/2017
Table 5: Coverage of Rural Transport Infrastructure Project and performance in FY
2016/17
SN District
Road/Bridge/CAS Intervention Planned
Output (Km)
Performance
as per end of
June 2017(Km)
Remark
1 Kumi Low cost sealing of Kanyum-Atutur-
Malera Section A 1.13 1.13 Completed
Low cost sealing of Kanyum-Atutur-
Malera Section B 2.2 2.2 Completed
2 Ngora Low cost sealing of Mukura - Asamuk
Road Section A 1 1 Completed
Low cost sealing of Mukura - Asamuk
Road Section B 1 1 Completed
3 Serere Low cost sealing of Serere Corners -
Serere Uppershops 1 1 Completed
Low cost sealing of Serere town
council roads 1 1 Completed
4 Katakwi Low cost sealing of Katakwi - Toroma
Road 1 1 Completed
Low cost sealing of Alleles-Omodoi-
Adere road 1 1
Sealing works
done, drainage
works ongoing
5 Amuria Low cost sealing of Amuria-Wera road
Section A 1.5 1.5 Completed
Low cost sealing of Amuria-Wera road
Section B 1.4 1.4
Completed
6 Kaberamaido Low cost sealing of Kalaki-
Kaberamaido 1 1 Completed
Low cost sealing of Kalaki-
Kaberamaido 1.5 1.5 Completed
7 Soroti Low Cost sealing of Gweri-Awojja
Road 2 1.0
Work was still
on going by the
end FY
8 Otuke Low cost sealing of Kwizira Road 1 1 Completed
9 Alebtong Stone pitching and embankment of
Agweng Swamp 0.02 0.02 Completed
Completion and embankment of
Akamdini swamp 0.5 0.5 completed
Low cost sealing of Omoro T/C-
Otuke boarder 1.5 Base completed
Work was still
on going by end
of FY.
10 Lira
Raising of Awali swamp 0.2 20% completed
Work was still
on going by end
of FY
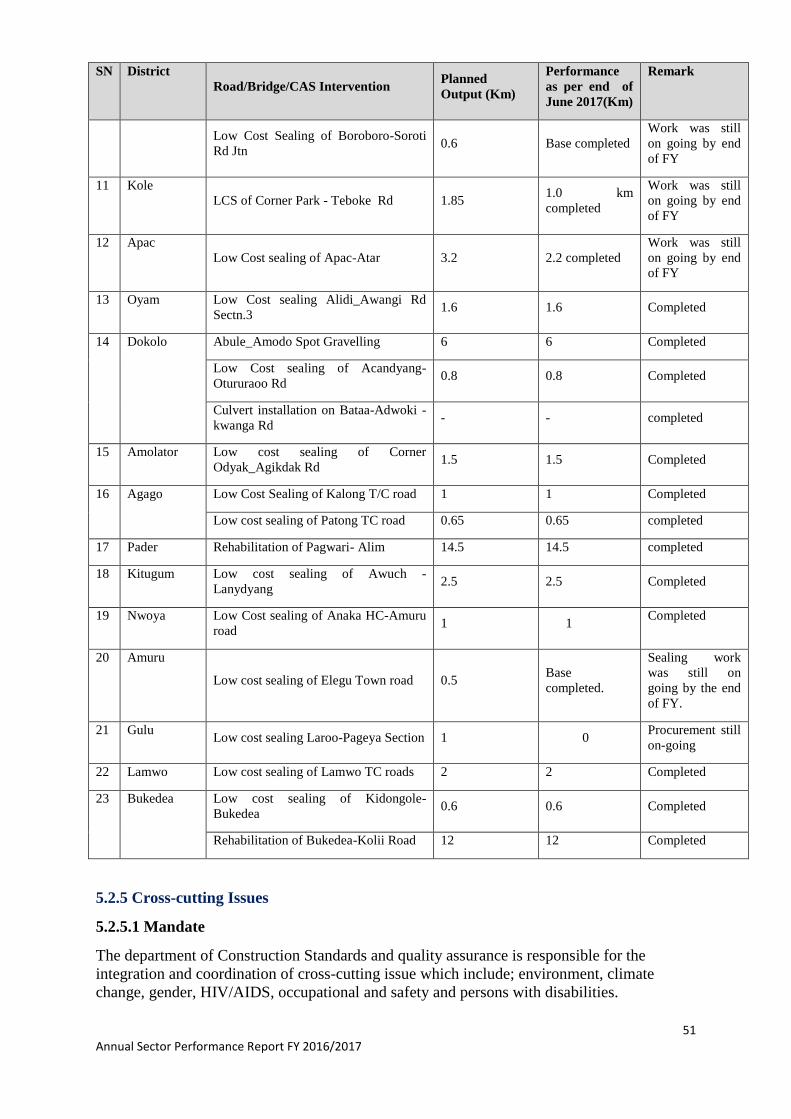
51 Annual Sector Performance Report FY 2016/2017
SN District
Road/Bridge/CAS Intervention Planned
Output (Km)
Performance
as per end of
June 2017(Km)
Remark
Low Cost Sealing of Boroboro-Soroti
Rd Jtn 0.6 Base completed
Work was still
on going by end
of FY
11 Kole
LCS of Corner Park - Teboke Rd 1.85 1.0 km
completed
Work was still
on going by end
of FY
12 Apac
Low Cost sealing of Apac-Atar 3.2 2.2 completed
Work was still
on going by end
of FY
13 Oyam Low Cost sealing Alidi_Awangi Rd
Sectn.3 1.6 1.6 Completed
14 Dokolo Abule_Amodo Spot Gravelling 6 6 Completed
Low Cost sealing of Acandyang-
Otururaoo Rd 0.8 0.8 Completed
Culvert installation on Bataa-Adwoki -
kwanga Rd - - completed
15 Amolator Low cost sealing of Corner
Odyak_Agikdak Rd 1.5 1.5 Completed
16 Agago Low Cost Sealing of Kalong T/C road 1 1 Completed
Low cost sealing of Patong TC road 0.65 0.65 completed
17 Pader Rehabilitation of Pagwari- Alim 14.5 14.5 completed
18 Kitugum Low cost sealing of Awuch -
Lanydyang 2.5 2.5 Completed
19 Nwoya Low Cost sealing of Anaka HC-Amuru
road 1 1
Completed
20 Amuru
Low cost sealing of Elegu Town road 0.5 Base
completed.
Sealing work
was still on
going by the end
of FY.
21 Gulu Low cost sealing Laroo-Pageya Section 1 0
Procurement still
on-going
22 Lamwo Low cost sealing of Lamwo TC roads 2 2 Completed
23 Bukedea Low cost sealing of Kidongole-
Bukedea 0.6 0.6 Completed
Rehabilitation of Bukedea-Kolii Road 12 12 Completed
5.2.5 Cross-cutting Issues
5.2.5.1 Mandate
The department of Construction Standards and quality assurance is responsible for the
integration and coordination of cross-cutting issue which include; environment, climate
change, gender, HIV/AIDS, occupational and safety and persons with disabilities.
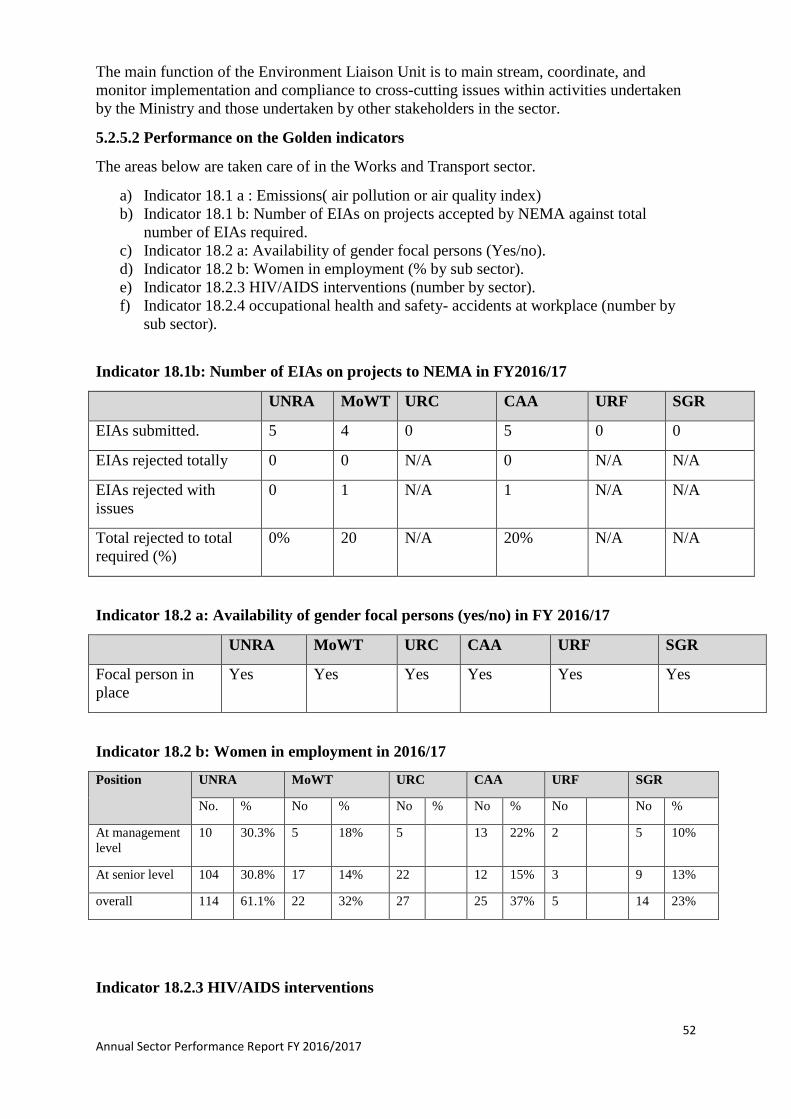
52 Annual Sector Performance Report FY 2016/2017
The main function of the Environment Liaison Unit is to main stream, coordinate, and
monitor implementation and compliance to cross-cutting issues within activities undertaken
by the Ministry and those undertaken by other stakeholders in the sector.
5.2.5.2 Performance on the Golden indicators
The areas below are taken care of in the Works and Transport sector.
a) Indicator 18.1 a : Emissions( air pollution or air quality index)
b) Indicator 18.1 b: Number of EIAs on projects accepted by NEMA against total
number of EIAs required.
c) Indicator 18.2 a: Availability of gender focal persons (Yes/no).
d) Indicator 18.2 b: Women in employment (% by sub sector).
e) Indicator 18.2.3 HIV/AIDS interventions (number by sector).
f) Indicator 18.2.4 occupational health and safety- accidents at workplace (number by
sub sector).
Indicator 18.1b: Number of EIAs on projects to NEMA in FY2016/17
UNRA MoWT URC CAA URF SGR
EIAs submitted. 5 4 0 5 0 0
EIAs rejected totally 0 0 N/A 0 N/A N/A
EIAs rejected with
issues
0 1 N/A 1 N/A N/A
Total rejected to total
required (%)
0% 20 N/A 20% N/A N/A
Indicator 18.2 a: Availability of gender focal persons (yes/no) in FY 2016/17
UNRA MoWT URC CAA URF SGR
Focal person in
place
Yes Yes Yes Yes Yes Yes
Indicator 18.2 b: Women in employment in 2016/17
Position UNRA MoWT URC CAA URF SGR
No. % No % No % No % No No %
At management
level
10 30.3% 5 18% 5 13 22% 2 5 10%
At senior level 104 30.8% 17 14% 22 12 15% 3 9 13%
overall 114 61.1% 22 32% 27 25 37% 5 14 23%
Indicator 18.2.3 HIV/AIDS interventions
53 Annual Sector Performance Report FY 2016/2017
UNRA MoWT URC CAA URF SGR
Awareness programmes 23 5 4 48 0 24
Condom issue( packs) 4,700,000 30000 1,444 41122 1,444 4,280
Counseling programmes 0 4 4 12 0 N/A
Support treat programmes 0 4 4 0 0 N/A
Indicator 18.2 .4 occupational health and safety- accidents at work place
UNRA MoWT URC CAA URF SGR
Fatalities 52 0 0 0 0 0
Serious injuries 95 0 0 0 0 0
Minor Injuries 147 0 0 99 0 0
Total accidents 292 0 0 99 0 0
5.2.5.3 Achievements on cross cutting issues
Social issues
Most of the agencies have developed good Legal policies for mainstreaming social issues.
UNRA for example have developed Environment and Social Safeguards Policy, and prepared
procedures and guidelines for implementation and Management of Social risks and has been
approved by the Board.
Ministry of Works and Transport with support from IOM finalized its HIV prevention
Strategic plan 2016/2017 to 2019/2010. This was done in a participatory manner with all the
other sector agencies and aligned with the National HIV Strategic Plan.
Regular supply of condoms from partners especially Uganda cares. The Condoms are
received by MoWT and distributed to MoWT Regional centers, MELTC and other active
sites. Other agencies like URF, URC and CAA also have condoms provided by their service
providers under their insurance scheme.
Monitoring of implementation of cross cutting issues has increased in most of the sectors for
instance URF and UNRA. URF carries out Quarterly Monitoring of District projects and
social issues are one of the key areas of interest. UNRA on top of having a supervising
consultant, their staffs equally do regularly supervision on projects to ensure due diligence.
All the sectors have Gender focal persons unlike last year when URF didn’t have one in
place. The focal point persons have been very instrumental in bringing on board Top
Management to appreciate importance of mainstreaming social issues in all infrastructure
projects.
HIV/AIDs interventions have been key in both the MoWT and all its agencies both at work
place level and project sites. For instance, at workplace level, there are always HIV/AIDs
awareness creations in Breakfast meetings, quarterly meetings, Senior Management meetings
among others and staffs who have disclosed the HIV status have continued to receive
quarterly allowances for care and treatment. At the project sites, there are always adequate
IEC in camp sites and project sites, community and laborers sensitizations and other
HIV/AIDs Health services are provided.
54 Annual Sector Performance Report FY 2016/2017
There is always community participation in all the projects right from planning phase,
implementation phase and operation phase. This has encouraged community ownership of
projects and its sustainability.MELTC was able to train 540 participants both Engineering
staffs and non-Engineering staffs on the need to mainstream Cross cutting issues on
infrastructure projects. Out of this 117 were female. The participants come from Local
Government, Urban Authorities and the Private Sector.
Environment issues
The MoWT and all its agencies have continued to mainstream Environment issues in their
Program, Policy and Projects. For instance, the Sector Strategic Plan, Monitoring and
Evaluation framework and Lake Victoria Transport Program all have Environment issues
mainstreamed. All the projects in the sector which require Environment Impact Assessment
have certificates of approval from NEMA while other smaller projects have their
Environment and Social Management Plans developed regular monitoring done to ensure
implementation of mitigation measures and other conditions of approval.
5.2.5.4 Challenges
Social challenges
Workers on infrastructure projects are reluctant to put on Personal Protective Equipment as
much as Project Managers emphasis the need to use them. Issues of Land acquisition and
Resettlement action planning have affected some projects in the sector like Bukasa inland
Port and some UNRA Projects. There is also inadequate funds/release to implement the
planned activities regarding all cross cutting issues in the MDAs.
Environment issues
Limited funds to do adequate Monitoring and Evaluation on all the projects across the sector.
5.2.5.5 Proposed Mitigations
Continued community involvement in projects at all phases of implementation shall
ensure useful implementation of cross cutting issues in the sector projects.
The sector should make a deliberate effort to release funds to carry out activities
related to cross cutting issues.
The sector is to lobby for funding from potential implementing partners both national
and international.
The sector is to consider to a greater level private public partnership on issues of main
streaming cross cutting issues in the project.
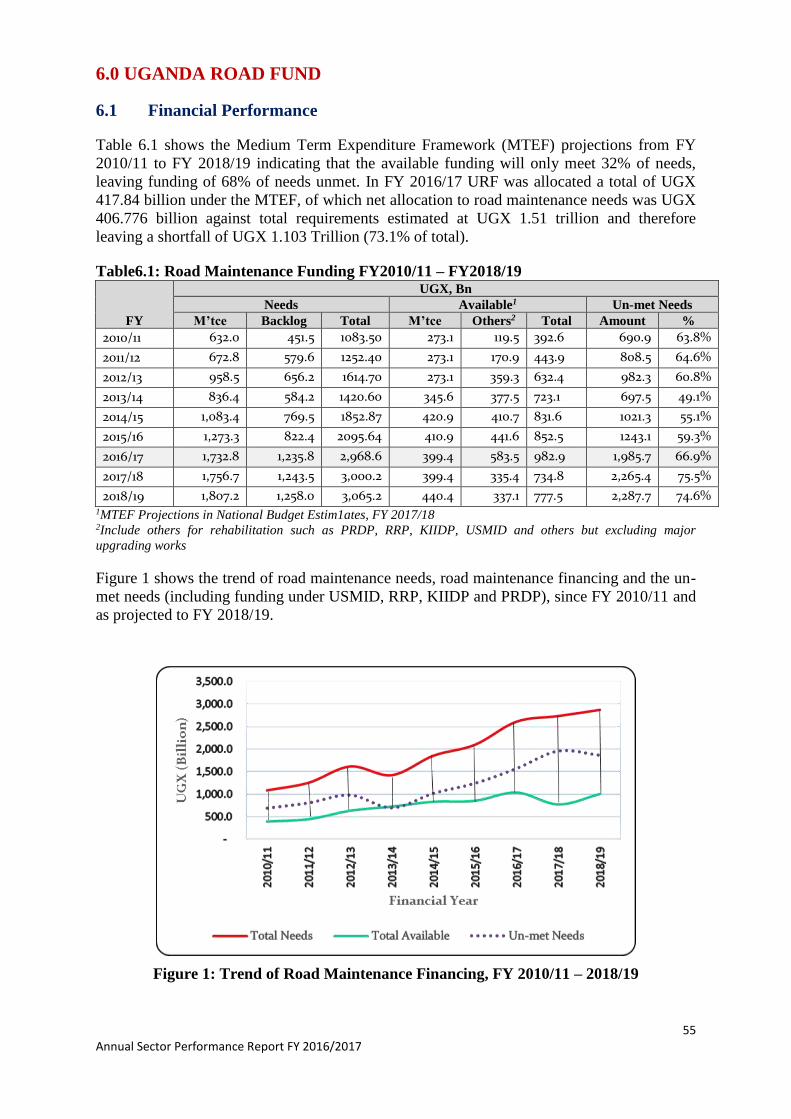
55 Annual Sector Performance Report FY 2016/2017
6.0 UGANDA ROAD FUND
6.1 Financial Performance
Table 6.1 shows the Medium Term Expenditure Framework (MTEF) projections from FY
2010/11 to FY 2018/19 indicating that the available funding will only meet 32% of needs,
leaving funding of 68% of needs unmet. In FY 2016/17 URF was allocated a total of UGX
417.84 billion under the MTEF, of which net allocation to road maintenance needs was UGX
406.776 billion against total requirements estimated at UGX 1.51 trillion and therefore
leaving a shortfall of UGX 1.103 Trillion (73.1% of total).
Table6.1: Road Maintenance Funding FY2010/11 – FY2018/19
FY
UGX, Bn
Needs Available1 Un-met Needs
M’tce Backlog Total M’tce Others2 Total Amount %
2010/11 632.0 451.5 1083.50 273.1 119.5 392.6 690.9 63.8%
2011/12 672.8 579.6 1252.40 273.1 170.9 443.9 808.5 64.6%
2012/13 958.5 656.2 1614.70 273.1 359.3 632.4 982.3 60.8%
2013/14 836.4 584.2 1420.60 345.6 377.5 723.1 697.5 49.1%
2014/15 1,083.4 769.5 1852.87 420.9 410.7 831.6 1021.3 55.1%
2015/16 1,273.3 822.4 2095.64 410.9 441.6 852.5 1243.1 59.3%
2016/17 1,732.8 1,235.8 2,968.6 399.4 583.5 982.9 1,985.7 66.9%
2017/18 1,756.7 1,243.5 3,000.2 399.4 335.4 734.8 2,265.4 75.5%
2018/19 1,807.2 1,258.0 3,065.2 440.4 337.1 777.5 2,287.7 74.6% 1MTEF Projections in National Budget Estim1ates, FY 2017/18 2Include others for rehabilitation such as PRDP, RRP, KIIDP, USMID and others but excluding major
upgrading works
Figure 1 shows the trend of road maintenance needs, road maintenance financing and the un-
met needs (including funding under USMID, RRP, KIIDP and PRDP), since FY 2010/11 and
as projected to FY 2018/19.
Figure 1: Trend of Road Maintenance Financing, FY 2010/11 – 2018/19
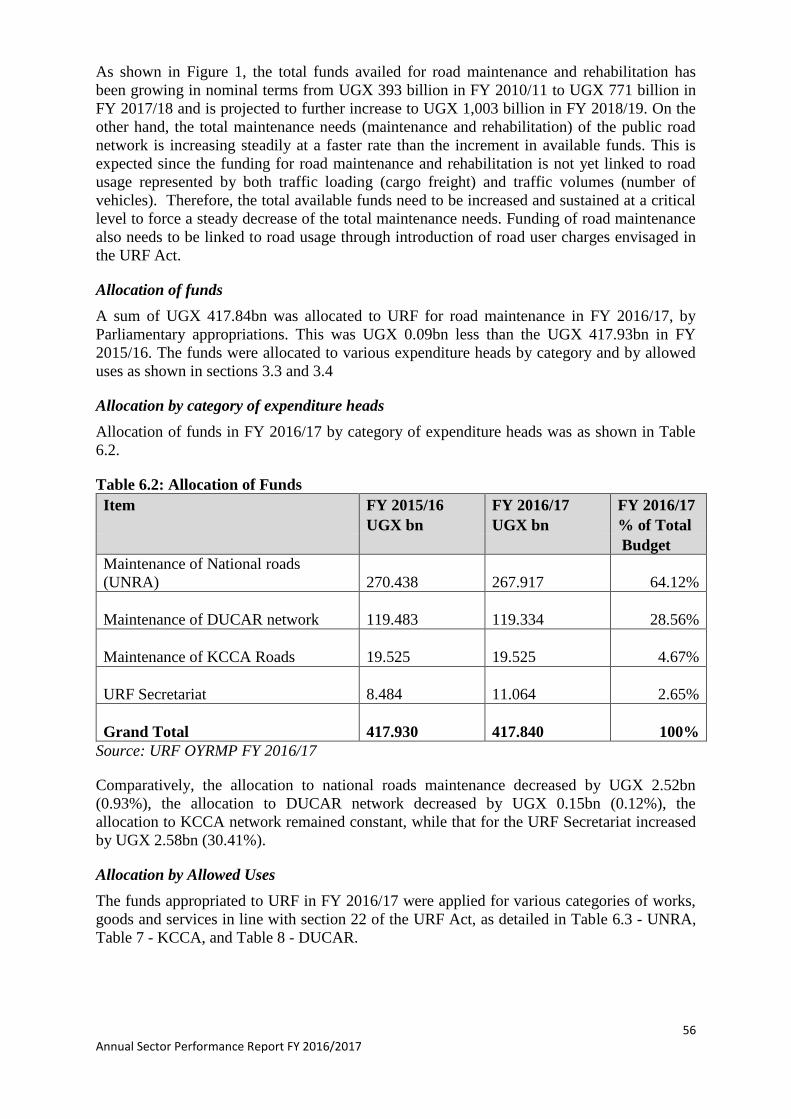
56 Annual Sector Performance Report FY 2016/2017
As shown in Figure 1, the total funds availed for road maintenance and rehabilitation has
been growing in nominal terms from UGX 393 billion in FY 2010/11 to UGX 771 billion in
FY 2017/18 and is projected to further increase to UGX 1,003 billion in FY 2018/19. On the
other hand, the total maintenance needs (maintenance and rehabilitation) of the public road
network is increasing steadily at a faster rate than the increment in available funds. This is
expected since the funding for road maintenance and rehabilitation is not yet linked to road
usage represented by both traffic loading (cargo freight) and traffic volumes (number of
vehicles). Therefore, the total available funds need to be increased and sustained at a critical
level to force a steady decrease of the total maintenance needs. Funding of road maintenance
also needs to be linked to road usage through introduction of road user charges envisaged in
the URF Act.
Allocation of funds
A sum of UGX 417.84bn was allocated to URF for road maintenance in FY 2016/17, by
Parliamentary appropriations. This was UGX 0.09bn less than the UGX 417.93bn in FY
2015/16. The funds were allocated to various expenditure heads by category and by allowed
uses as shown in sections 3.3 and 3.4
Allocation by category of expenditure heads
Allocation of funds in FY 2016/17 by category of expenditure heads was as shown in Table
6.2.
Table 6.2: Allocation of Funds
Item FY 2015/16 FY 2016/17 FY 2016/17
UGX bn UGX bn % of Total
Budget
Maintenance of National roads
(UNRA)
270.438
267.917 64.12%
Maintenance of DUCAR network
119.483
119.334 28.56%
Maintenance of KCCA Roads
19.525
19.525 4.67%
URF Secretariat
8.484
11.064 2.65%
Grand Total
417.930
417.840 100%
Source: URF OYRMP FY 2016/17
Comparatively, the allocation to national roads maintenance decreased by UGX 2.52bn
(0.93%), the allocation to DUCAR network decreased by UGX 0.15bn (0.12%), the
allocation to KCCA network remained constant, while that for the URF Secretariat increased
by UGX 2.58bn (30.41%).
Allocation by Allowed Uses
The funds appropriated to URF in FY 2016/17 were applied for various categories of works,
goods and services in line with section 22 of the URF Act, as detailed in Table 6.3 - UNRA,
Table 7 - KCCA, and Table 8 - DUCAR.
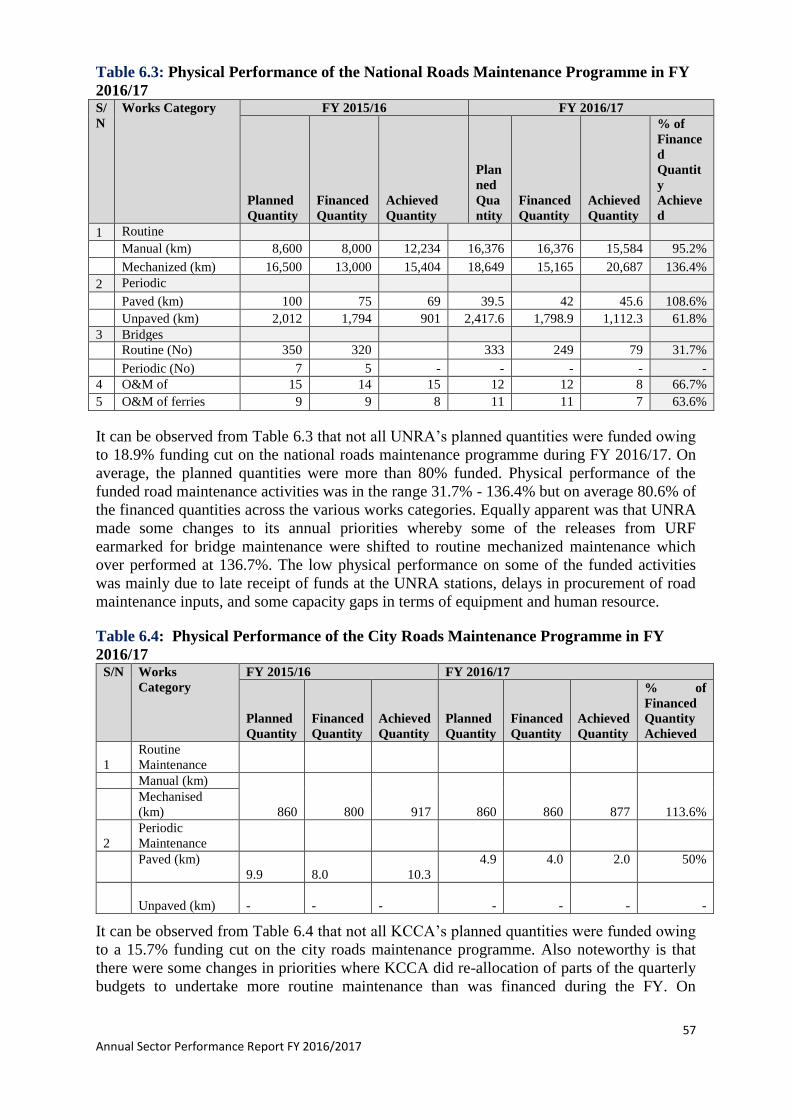
57 Annual Sector Performance Report FY 2016/2017
Table 6.3: Physical Performance of the National Roads Maintenance Programme in FY
2016/17 S/
N
Works Category FY 2015/16 FY 2016/17
Planned
Quantity
Financed
Quantity
Achieved
Quantity
Plan
ned
Qua
ntity
Financed
Quantity
Achieved
Quantity
% of
Finance
d
Quantit
y
Achieve
d
1 Routine
Maintenance
Manual (km) 8,600 8,000 12,234 16,376 16,376 15,584 95.2%
Mechanized (km) 16,500 13,000 15,404 18,649 15,165 20,687 136.4%
2 Periodic
Maintenance
Paved (km) 100 75 69 39.5 42 45.6 108.6%
Unpaved (km) 2,012 1,794 901 2,417.6 1,798.9 1,112.3 61.8%
3 Bridges
Routine (No) 350 320
215
333 249 79 31.7%
Periodic (No) 7 5 - - - - -
4 O&M of
weighbridges
15 14 15 12 12 8 66.7%
5 O&M of ferries 9 9 8 11 11 7 63.6%
It can be observed from Table 6.3 that not all UNRA’s planned quantities were funded owing
to 18.9% funding cut on the national roads maintenance programme during FY 2016/17. On
average, the planned quantities were more than 80% funded. Physical performance of the
funded road maintenance activities was in the range 31.7% - 136.4% but on average 80.6% of
the financed quantities across the various works categories. Equally apparent was that UNRA
made some changes to its annual priorities whereby some of the releases from URF
earmarked for bridge maintenance were shifted to routine mechanized maintenance which
over performed at 136.7%. The low physical performance on some of the funded activities
was mainly due to late receipt of funds at the UNRA stations, delays in procurement of road
maintenance inputs, and some capacity gaps in terms of equipment and human resource.
Table 6.4: Physical Performance of the City Roads Maintenance Programme in FY
2016/17 S/N Works
Category
FY 2015/16 FY 2016/17
Planned
Quantity
Financed
Quantity
Achieved
Quantity
Planned
Quantity
Financed
Quantity
Achieved
Quantity
% of
Financed
Quantity
Achieved
1
Routine
Maintenance
Manual (km)
860
800 917 860 860 877 113.6%
Mechanised
(km)
2
Periodic
Maintenance
Paved (km)
9.9
8.0
10.3
4.9 4.0 2.0 50%
Unpaved (km)
-
-
- - - - -
It can be observed from Table 6.4 that not all KCCA’s planned quantities were funded owing
to a 15.7% funding cut on the city roads maintenance programme. Also noteworthy is that
there were some changes in priorities where KCCA did re-allocation of parts of the quarterly
budgets to undertake more routine maintenance than was financed during the FY. On
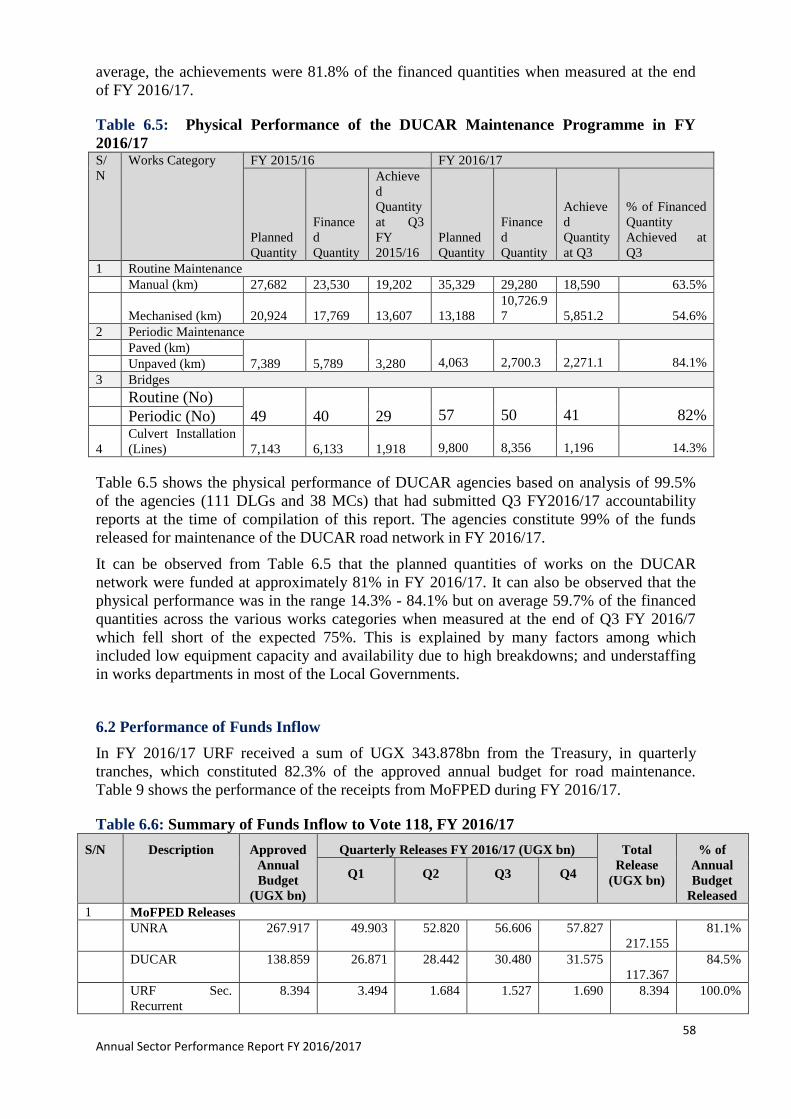
58 Annual Sector Performance Report FY 2016/2017
average, the achievements were 81.8% of the financed quantities when measured at the end
of FY 2016/17.
Table 6.5: Physical Performance of the DUCAR Maintenance Programme in FY
2016/17 S/
N
Works Category FY 2015/16 FY 2016/17
Planned
Quantity
Finance
d
Quantity
Achieve
d
Quantity
at Q3
FY
2015/16
Planned
Quantity
Finance
d
Quantity
Achieve
d
Quantity
at Q3
% of Financed
Quantity
Achieved at
Q3
1 Routine Maintenance
Manual (km) 27,682 23,530 19,202 35,329 29,280 18,590 63.5%
Mechanised (km) 20,924 17,769 13,607 13,188
10,726.9
7 5,851.2 54.6%
2 Periodic Maintenance
Paved (km)
7,389
5,789
3,280 4,063 2,700.3 2,271.1 84.1% Unpaved (km)
3 Bridges
Routine (No)
49
40
29 57 50 41 82% Periodic (No)
4
Culvert Installation
(Lines)
7,143
6,133
1,918 9,800 8,356 1,196 14.3%
Table 6.5 shows the physical performance of DUCAR agencies based on analysis of 99.5%
of the agencies (111 DLGs and 38 MCs) that had submitted Q3 FY2016/17 accountability
reports at the time of compilation of this report. The agencies constitute 99% of the funds
released for maintenance of the DUCAR road network in FY 2016/17.
It can be observed from Table 6.5 that the planned quantities of works on the DUCAR
network were funded at approximately 81% in FY 2016/17. It can also be observed that the
physical performance was in the range 14.3% - 84.1% but on average 59.7% of the financed
quantities across the various works categories when measured at the end of Q3 FY 2016/7
which fell short of the expected 75%. This is explained by many factors among which
included low equipment capacity and availability due to high breakdowns; and understaffing
in works departments in most of the Local Governments.
6.2 Performance of Funds Inflow
In FY 2016/17 URF received a sum of UGX 343.878bn from the Treasury, in quarterly
tranches, which constituted 82.3% of the approved annual budget for road maintenance.
Table 9 shows the performance of the receipts from MoFPED during FY 2016/17.
Table 6.6: Summary of Funds Inflow to Vote 118, FY 2016/17
S/N Description Approved
Annual
Budget
(UGX bn)
Quarterly Releases FY 2016/17 (UGX bn) Total
Release
(UGX bn)
% of
Annual
Budget
Released
Q1 Q2 Q3 Q4
1 MoFPED Releases
UNRA 267.917 49.903 52.820 56.606 57.827
217.155
81.1%
DUCAR 138.859 26.871 28.442 30.480 31.575
117.367
84.5%
URF Sec.
Recurrent
8.394 3.494 1.684 1.527 1.690 8.394 100.0%
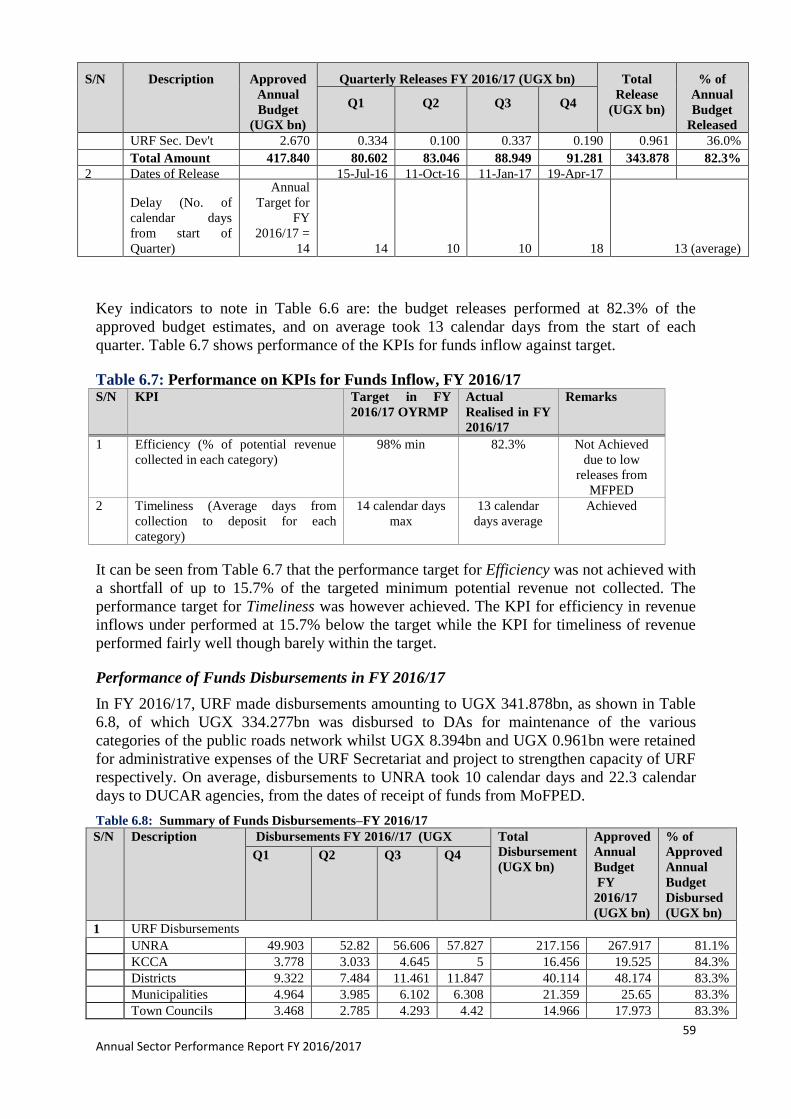
59 Annual Sector Performance Report FY 2016/2017
S/N Description Approved
Annual
Budget
(UGX bn)
Quarterly Releases FY 2016/17 (UGX bn) Total
Release
(UGX bn)
% of
Annual
Budget
Released
Q1 Q2 Q3 Q4
URF Sec. Dev't 2.670 0.334 0.100 0.337 0.190 0.961 36.0%
Total Amount 417.840 80.602 83.046 88.949 91.281 343.878 82.3%
2 Dates of Release 15-Jul-16 11-Oct-16 11-Jan-17 19-Apr-17
Delay (No. of
calendar days
from start of
Quarter)
Annual
Target for
FY
2016/17 =
14 14 10 10 18
13 (average)
Key indicators to note in Table 6.6 are: the budget releases performed at 82.3% of the
approved budget estimates, and on average took 13 calendar days from the start of each
quarter. Table 6.7 shows performance of the KPIs for funds inflow against target.
Table 6.7: Performance on KPIs for Funds Inflow, FY 2016/17 S/N KPI Target in FY
2016/17 OYRMP
Actual
Realised in FY
2016/17
Remarks
1 Efficiency (% of potential revenue
collected in each category)
98% min 82.3% Not Achieved
due to low
releases from
MFPED
2 Timeliness (Average days from
collection to deposit for each
category)
14 calendar days
max
13 calendar
days average
Achieved
It can be seen from Table 6.7 that the performance target for Efficiency was not achieved with
a shortfall of up to 15.7% of the targeted minimum potential revenue not collected. The
performance target for Timeliness was however achieved. The KPI for efficiency in revenue
inflows under performed at 15.7% below the target while the KPI for timeliness of revenue
performed fairly well though barely within the target.
Performance of Funds Disbursements in FY 2016/17
In FY 2016/17, URF made disbursements amounting to UGX 341.878bn, as shown in Table
6.8, of which UGX 334.277bn was disbursed to DAs for maintenance of the various
categories of the public roads network whilst UGX 8.394bn and UGX 0.961bn were retained
for administrative expenses of the URF Secretariat and project to strengthen capacity of URF
respectively. On average, disbursements to UNRA took 10 calendar days and 22.3 calendar
days to DUCAR agencies, from the dates of receipt of funds from MoFPED.
Table 6.8: Summary of Funds Disbursements–FY 2016/17
S/N Description Disbursements FY 2016//17 (UGX Total
Disbursement
(UGX bn)
Approved
Annual
Budget
FY
2016/17
(UGX bn)
% of
Approved
Annual
Budget
Disbursed
(UGX bn)
Q1 Q2 Q3 Q4
1 URF Disbursements
UNRA 49.903 52.82 56.606 57.827 217.156 267.917 81.1%
KCCA 3.778 3.033 4.645 5 16.456 19.525 84.3%
Districts 9.322 7.484 11.461 11.847 40.114 48.174 83.3%
Municipalities 4.964 3.985 6.102 6.308 21.359 25.65 83.3%
Town Councils 3.468 2.785 4.293 4.42 14.966 17.973 83.3%
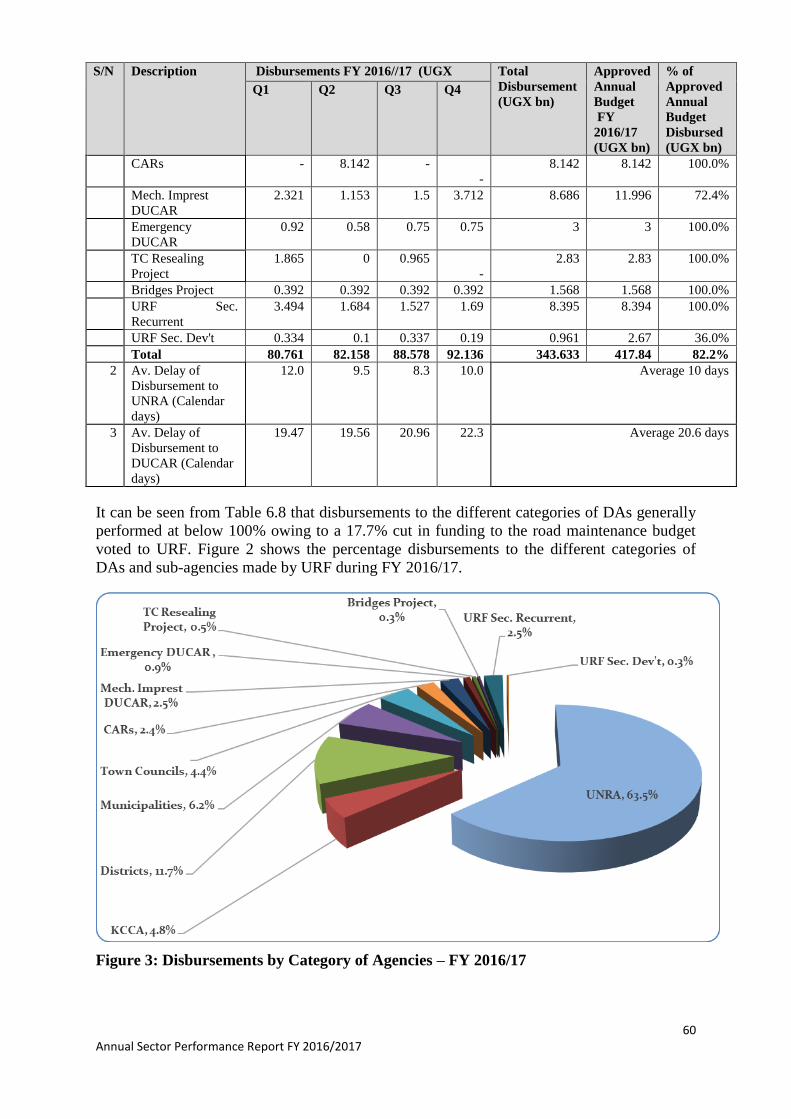
60 Annual Sector Performance Report FY 2016/2017
S/N Description Disbursements FY 2016//17 (UGX Total
Disbursement
(UGX bn)
Approved
Annual
Budget
FY
2016/17
(UGX bn)
% of
Approved
Annual
Budget
Disbursed
(UGX bn)
Q1 Q2 Q3 Q4
CARs - 8.142 -
-
8.142 8.142 100.0%
Mech. Imprest
DUCAR
2.321 1.153 1.5 3.712 8.686 11.996 72.4%
Emergency
DUCAR
0.92 0.58 0.75 0.75 3 3 100.0%
TC Resealing
Project
1.865 0 0.965
-
2.83 2.83 100.0%
Bridges Project 0.392 0.392 0.392 0.392 1.568 1.568 100.0%
URF Sec.
Recurrent
3.494 1.684 1.527 1.69 8.395 8.394 100.0%
URF Sec. Dev't 0.334 0.1 0.337 0.19 0.961 2.67 36.0%
Total 80.761 82.158 88.578 92.136 343.633 417.84 82.2%
2 Av. Delay of
Disbursement to
UNRA (Calendar
days)
12.0 9.5 8.3 10.0 Average 10 days
3 Av. Delay of
Disbursement to
DUCAR (Calendar
days)
19.47 19.56 20.96 22.3 Average 20.6 days
It can be seen from Table 6.8 that disbursements to the different categories of DAs generally
performed at below 100% owing to a 17.7% cut in funding to the road maintenance budget
voted to URF. Figure 2 shows the percentage disbursements to the different categories of
DAs and sub-agencies made by URF during FY 2016/17.
Figure 3: Disbursements by Category of Agencies – FY 2016/17
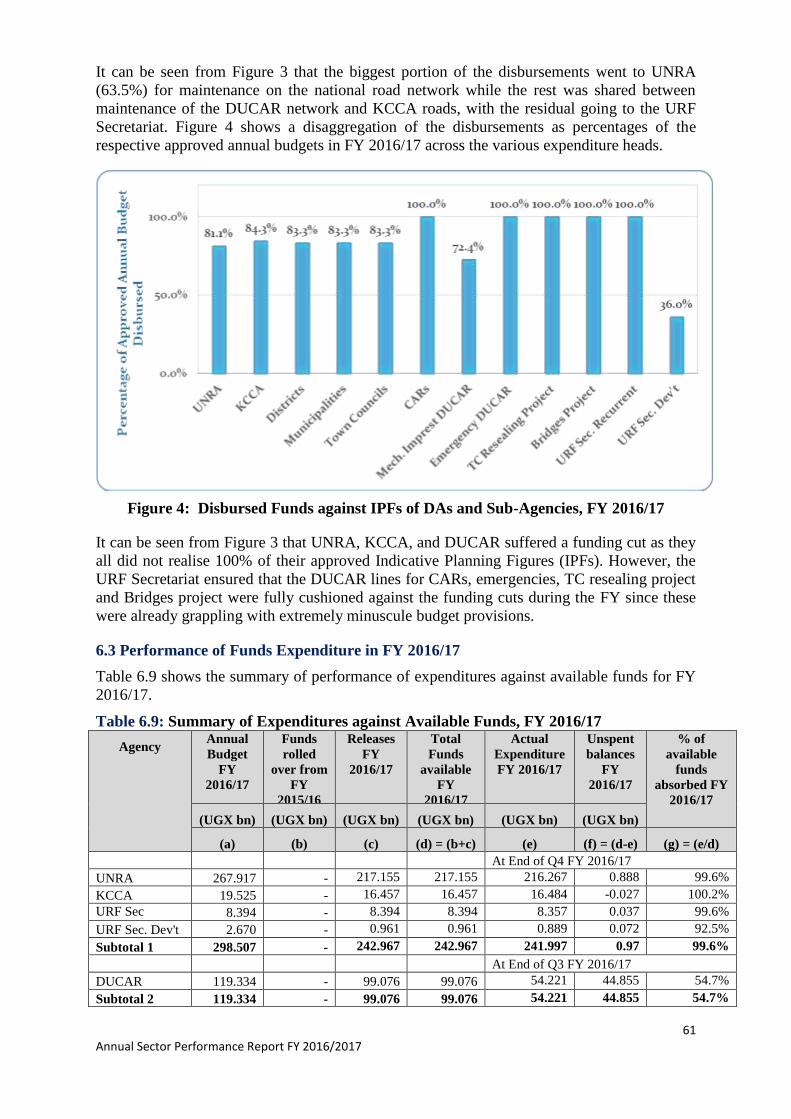
61 Annual Sector Performance Report FY 2016/2017
It can be seen from Figure 3 that the biggest portion of the disbursements went to UNRA
(63.5%) for maintenance on the national road network while the rest was shared between
maintenance of the DUCAR network and KCCA roads, with the residual going to the URF
Secretariat. Figure 4 shows a disaggregation of the disbursements as percentages of the
respective approved annual budgets in FY 2016/17 across the various expenditure heads.
Figure 4: Disbursed Funds against IPFs of DAs and Sub-Agencies, FY 2016/17
It can be seen from Figure 3 that UNRA, KCCA, and DUCAR suffered a funding cut as they
all did not realise 100% of their approved Indicative Planning Figures (IPFs). However, the
URF Secretariat ensured that the DUCAR lines for CARs, emergencies, TC resealing project
and Bridges project were fully cushioned against the funding cuts during the FY since these
were already grappling with extremely minuscule budget provisions.
6.3 Performance of Funds Expenditure in FY 2016/17
Table 6.9 shows the summary of performance of expenditures against available funds for FY
2016/17.
Table 6.9: Summary of Expenditures against Available Funds, FY 2016/17
Agency
Annual
Budget
FY
2016/17
Funds
rolled
over from
FY
2015/16
Releases
FY
2016/17
Total
Funds
available
FY
2016/17
Actual
Expenditure
FY 2016/17
Unspent
balances
FY
2016/17
% of
available
funds
absorbed FY
2016/17
(UGX bn) (UGX bn) (UGX bn) (UGX bn) (UGX bn) (UGX bn)
(a) (b) (c) (d) = (b+c) (e) (f) = (d-e) (g) = (e/d)
At End of Q4 FY 2016/17
UNRA 267.917 - 217.155 217.155 216.267 0.888 99.6%
KCCA 19.525 - 16.457 16.457 16.484 -0.027 100.2%
URF Sec
Recurrent 8.394 - 8.394 8.394 8.357 0.037 99.6%
URF Sec. Dev't 2.670 - 0.961 0.961 0.889 0.072 92.5%
Subtotal 1 298.507 - 242.967 242.967 241.997 0.97 99.6%
At End of Q3 FY 2016/17
DUCAR 119.334 - 99.076 99.076 54.221 44.855 54.7%
Subtotal 2 119.334 - 99.076 99.076 54.221 44.855 54.7%
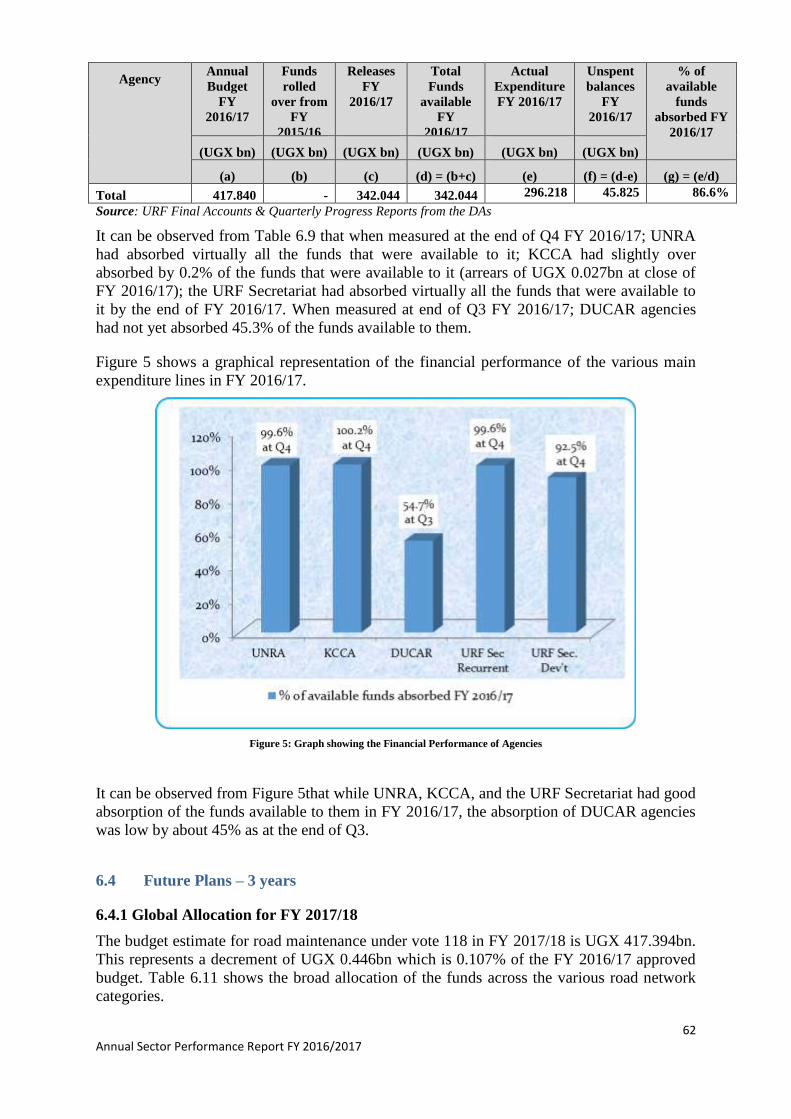
62 Annual Sector Performance Report FY 2016/2017
Agency
Annual
Budget
FY
2016/17
Funds
rolled
over from
FY
2015/16
Releases
FY
2016/17
Total
Funds
available
FY
2016/17
Actual
Expenditure
FY 2016/17
Unspent
balances
FY
2016/17
% of
available
funds
absorbed FY
2016/17
(UGX bn) (UGX bn) (UGX bn) (UGX bn) (UGX bn) (UGX bn)
(a) (b) (c) (d) = (b+c) (e) (f) = (d-e) (g) = (e/d)
Total 417.840 - 342.044 342.044 296.218 45.825 86.6%
Source: URF Final Accounts & Quarterly Progress Reports from the DAs
It can be observed from Table 6.9 that when measured at the end of Q4 FY 2016/17; UNRA
had absorbed virtually all the funds that were available to it; KCCA had slightly over
absorbed by 0.2% of the funds that were available to it (arrears of UGX 0.027bn at close of
FY 2016/17); the URF Secretariat had absorbed virtually all the funds that were available to
it by the end of FY 2016/17. When measured at end of Q3 FY 2016/17; DUCAR agencies
had not yet absorbed 45.3% of the funds available to them.
Figure 5 shows a graphical representation of the financial performance of the various main
expenditure lines in FY 2016/17.
Figure 5: Graph showing the Financial Performance of Agencies
It can be observed from Figure 5that while UNRA, KCCA, and the URF Secretariat had good
absorption of the funds available to them in FY 2016/17, the absorption of DUCAR agencies
was low by about 45% as at the end of Q3.
6.4 Future Plans – 3 years
6.4.1 Global Allocation for FY 2017/18
The budget estimate for road maintenance under vote 118 in FY 2017/18 is UGX 417.394bn.
This represents a decrement of UGX 0.446bn which is 0.107% of the FY 2016/17 approved
budget. Table 6.11 shows the broad allocation of the funds across the various road network
categories.
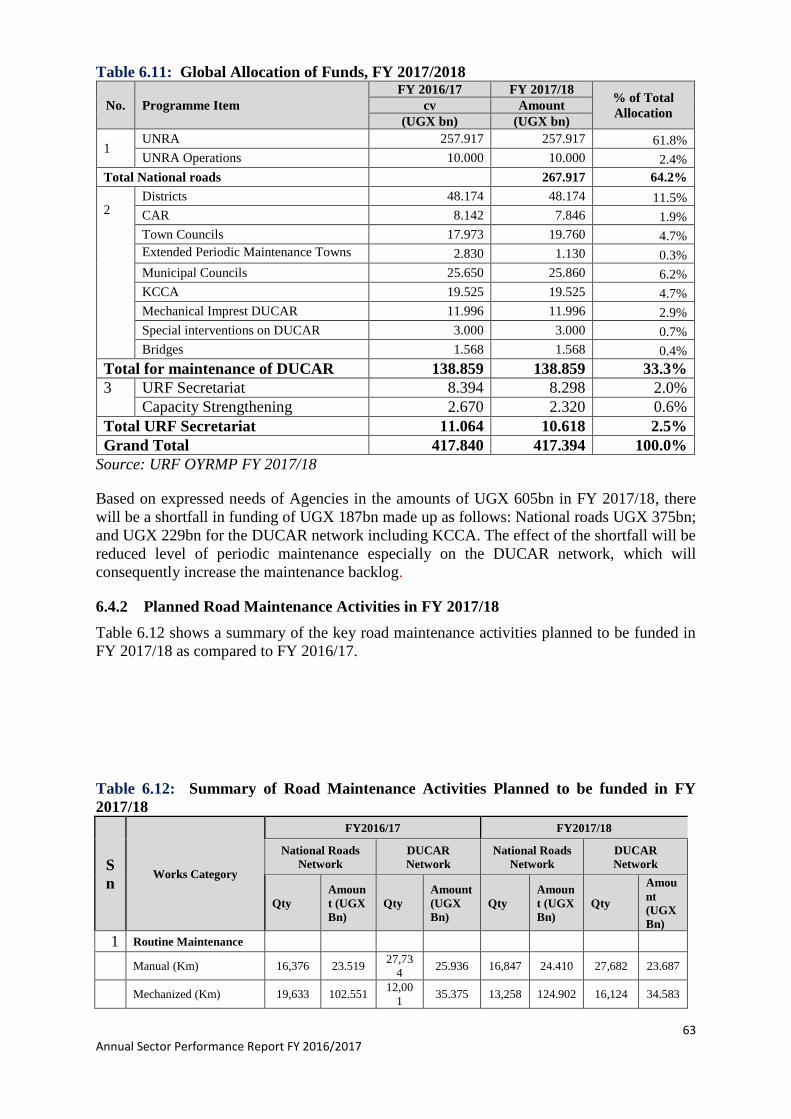
63 Annual Sector Performance Report FY 2016/2017
Table 6.11: Global Allocation of Funds, FY 2017/2018
No. Programme Item
FY 2016/17 FY 2017/18 % of Total
Allocation cv Amount
(UGX bn) (UGX bn)
1 UNRA 257.917 257.917 61.8%
UNRA Operations 10.000 10.000 2.4%
Total National roads
267.917 267.917 64.2%
2 Districts 48.174 48.174 11.5%
CAR 8.142 7.846 1.9%
Town Councils 17.973 19.760 4.7%
Extended Periodic Maintenance Towns
Councils 2.830 1.130 0.3%
Municipal Councils 25.650 25.860 6.2%
KCCA 19.525 19.525 4.7%
Mechanical Imprest DUCAR 11.996 11.996 2.9%
Special interventions on DUCAR 3.000 3.000 0.7%
Bridges 1.568 1.568 0.4%
Total for maintenance of DUCAR
network
138.859 138.859 33.3%
3 URF Secretariat 8.394 8.298 2.0%
Capacity Strengthening 2.670 2.320 0.6%
Total URF Secretariat 11.064 10.618 2.5%
Grand Total 417.840 417.394 100.0%
Source: URF OYRMP FY 2017/18
Based on expressed needs of Agencies in the amounts of UGX 605bn in FY 2017/18, there
will be a shortfall in funding of UGX 187bn made up as follows: National roads UGX 375bn;
and UGX 229bn for the DUCAR network including KCCA. The effect of the shortfall will be
reduced level of periodic maintenance especially on the DUCAR network, which will
consequently increase the maintenance backlog.
6.4.2 Planned Road Maintenance Activities in FY 2017/18
Table 6.12 shows a summary of the key road maintenance activities planned to be funded in
FY 2017/18 as compared to FY 2016/17.
Table 6.12: Summary of Road Maintenance Activities Planned to be funded in FY
2017/18
S
n Works Category
FY2016/17 FY2017/18
National Roads
Network
DUCAR
Network
National Roads
Network
DUCAR
Network
Qty
Amoun
t (UGX
Bn)
Qty
Amount
(UGX
Bn)
Qty
Amoun
t (UGX
Bn)
Qty
Amou
nt
(UGX
Bn)
1 Routine Maintenance
Manual (Km) 16,376 23.519 27,73
4 25.936 16,847 24.410 27,682 23.687
Mechanized (Km) 19,633 102.551 12,00
1 35.375 13,258 124.902 16,124 34.583
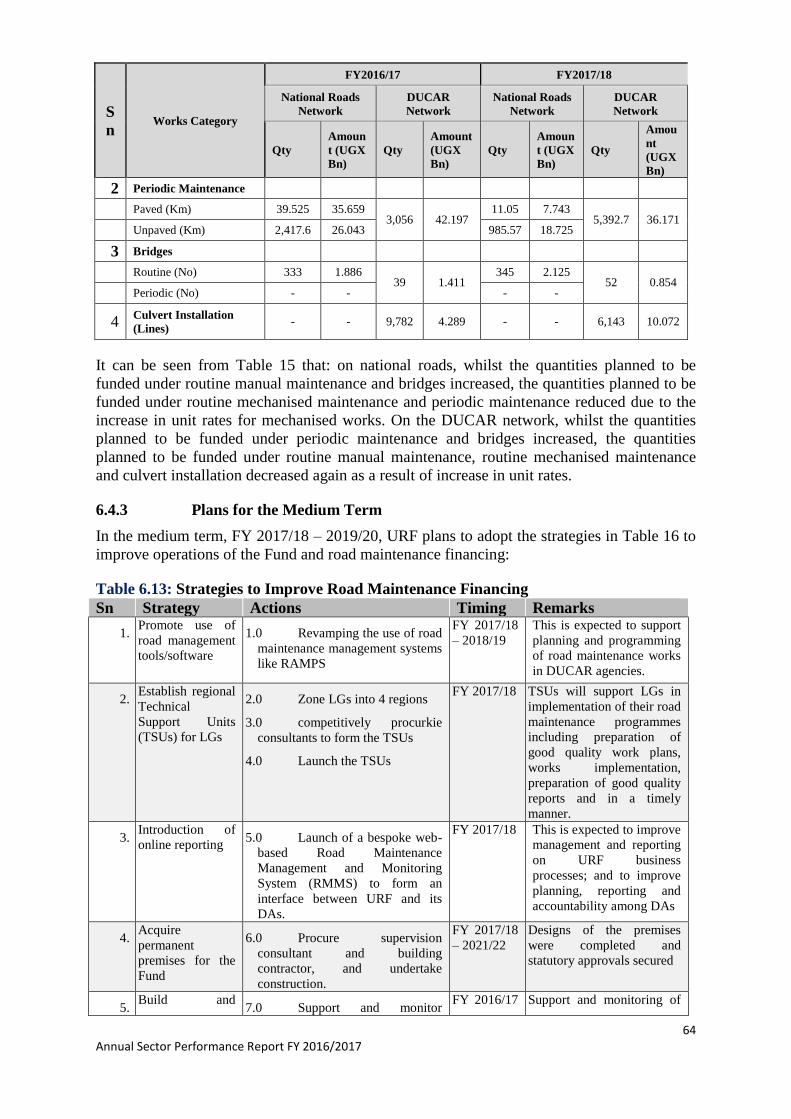
64 Annual Sector Performance Report FY 2016/2017
S
n Works Category
FY2016/17 FY2017/18
National Roads
Network
DUCAR
Network
National Roads
Network
DUCAR
Network
Qty
Amoun
t (UGX
Bn)
Qty
Amount
(UGX
Bn)
Qty
Amoun
t (UGX
Bn)
Qty
Amou
nt
(UGX
Bn)
2 Periodic Maintenance
Paved (Km) 39.525 35.659 3,056 42.197
11.05 7.743 5,392.7 36.171
Unpaved (Km) 2,417.6 26.043 985.57 18.725
3 Bridges
Routine (No) 333 1.886 39 1.411
345 2.125 52 0.854
Periodic (No) - - - -
4 Culvert Installation
(Lines) - - 9,782 4.289 - - 6,143 10.072
It can be seen from Table 15 that: on national roads, whilst the quantities planned to be
funded under routine manual maintenance and bridges increased, the quantities planned to be
funded under routine mechanised maintenance and periodic maintenance reduced due to the
increase in unit rates for mechanised works. On the DUCAR network, whilst the quantities
planned to be funded under periodic maintenance and bridges increased, the quantities
planned to be funded under routine manual maintenance, routine mechanised maintenance
and culvert installation decreased again as a result of increase in unit rates.
6.4.3 Plans for the Medium Term
In the medium term, FY 2017/18 – 2019/20, URF plans to adopt the strategies in Table 16 to
improve operations of the Fund and road maintenance financing:
Table 6.13: Strategies to Improve Road Maintenance Financing
Sn Strategy Actions Timing Remarks
1. Promote use of
road management
tools/software
1.0 Revamping the use of road
maintenance management systems
like RAMPS
FY 2017/18
– 2018/19
This is expected to support
planning and programming
of road maintenance works
in DUCAR agencies.
2. Establish regional
Technical
Support Units
(TSUs) for LGs
2.0 Zone LGs into 4 regions
3.0 competitively procurkie
consultants to form the TSUs
4.0 Launch the TSUs
FY 2017/18 TSUs will support LGs in
implementation of their road
maintenance programmes
including preparation of
good quality work plans,
works implementation,
preparation of good quality
reports and in a timely
manner.
3. Introduction of
online reporting 5.0 Launch of a bespoke web-
based Road Maintenance
Management and Monitoring
System (RMMS) to form an
interface between URF and its
DAs.
FY 2017/18 This is expected to improve
management and reporting
on URF business
processes; and to improve
planning, reporting and
accountability among DAs
4. Acquire
permanent
premises for the
Fund
6.0 Procure supervision
consultant and building
contractor, and undertake
construction.
FY 2017/18
– 2021/22
Designs of the premises
were completed and
statutory approvals secured
5. Build and
7.0 Support and monitor FY 2016/17 Support and monitoring of
65 Annual Sector Performance Report FY 2016/2017
Sn Strategy Actions Timing Remarks enhance
partnerships to
strengthen
oversight in the
utilisation of road
maintenance
funds
functionality of DRCs
8.0 Establish partnerships with
various categories of stakeholders
9.0 Build synergies with
oversight functions resident in
DAs/ other government
institutions
– 2019/20 functionality of DRCs was
rolled out starting with
districts that were deemed
most critical
6. Establish a road
users forum and
undertake
periodic road user
satisfaction
surveys
10.0 Coordinate with key sector
institutions to establish the road
users forum
11.0 Commission periodic road
user satisfaction surveys and track
improvements, perceptions and
draw lessons
FY 2017/18
– 2021/22
First Road User
Satisfaction Survey (RUSS)
V undertaken by URF in
2016, Report was launched
on 14th July 2017. Briefly,
the survey found that:
Majority of road users
(62.7%) were
dissatisfied with their
experience on Uganda
roads in 2016.
% of satisfied road
users declined from
53.2% in 2015 to
37.3% in 2016.
6.5 Challenges and proposed mitigation measures
The key challenges experienced during the period include:
1) Escalating road maintenance backlog as the approved budget of UGX 417.840 in FY
2016/17 could only meet 69% of the expressed needs of agencies, comprised of normal
maintenance and backlog removal. Inadequate spending on public roads over many years
has now resulted in maintenance backlog of up to 51,735 km on public roads, estimated
to cost UGX 600 billion.
In mitigation, URF will continue pursuance of increased parliamentary
appropriations towards road maintenance in order to check backlog build up. Side by
side, the quest for empowering URF to a truly second generation (2G) Fund will
continue.
2) Failure to commercialise roads management to entrench market principles all through the
management cycle to save and protect asset value and ensure significant gains for road
users. This is occasioned by parliamentary appropriations based on normal budgetary
allocations which are not related to road usage and condition as envisaged in the URF
founding Act.
In mitigation, URF continues to engage stakeholders to advocate for completion of
sector reforms and growing of the domestic contractors among others.
3) Unpredictable funding cuts which have characterised Treasury releases. This jeopardises
performance agreements as URF is unable to guarantee funding to the designated
agencies. In FY 2016/17, the funding cut was UGX 73.962bn (17.7% of annual approved
budget). This resulted in rollover of debts especially in UNRA which rolled over a debt of
UGX 40bn at close of FY 2016/17.
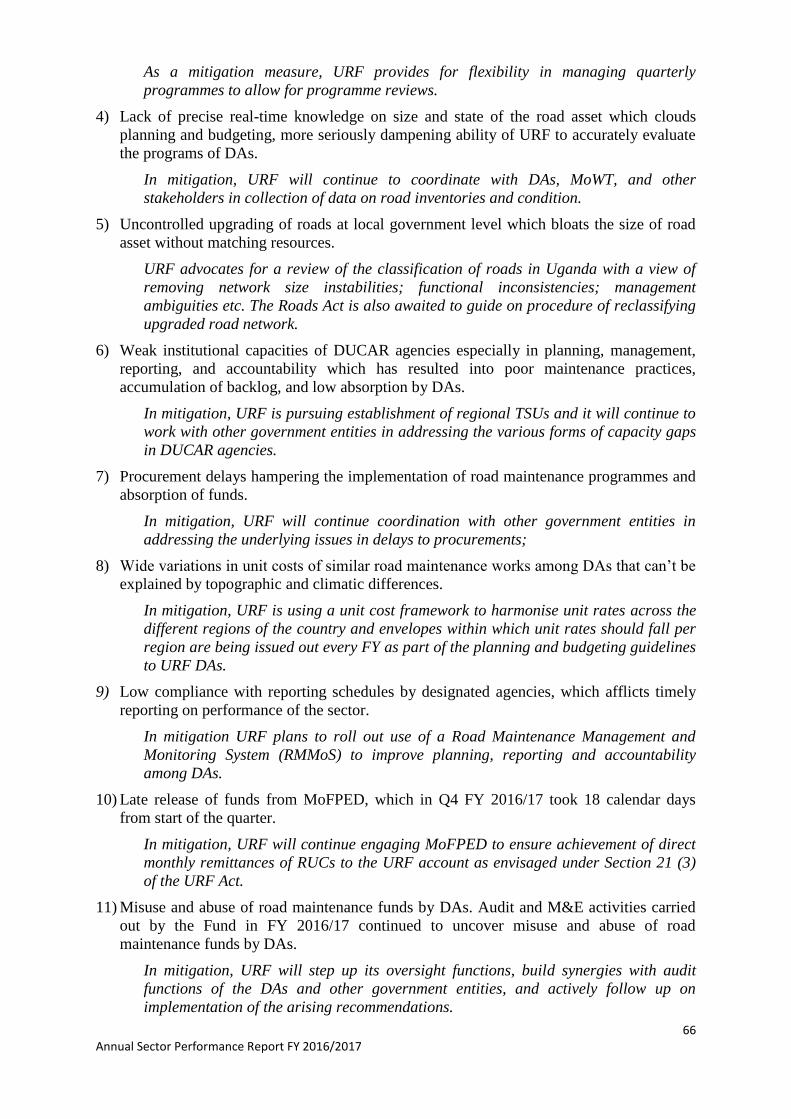
66 Annual Sector Performance Report FY 2016/2017
As a mitigation measure, URF provides for flexibility in managing quarterly
programmes to allow for programme reviews.
4) Lack of precise real-time knowledge on size and state of the road asset which clouds
planning and budgeting, more seriously dampening ability of URF to accurately evaluate
the programs of DAs.
In mitigation, URF will continue to coordinate with DAs, MoWT, and other
stakeholders in collection of data on road inventories and condition.
5) Uncontrolled upgrading of roads at local government level which bloats the size of road
asset without matching resources.
URF advocates for a review of the classification of roads in Uganda with a view of
removing network size instabilities; functional inconsistencies; management
ambiguities etc. The Roads Act is also awaited to guide on procedure of reclassifying
upgraded road network.
6) Weak institutional capacities of DUCAR agencies especially in planning, management,
reporting, and accountability which has resulted into poor maintenance practices,
accumulation of backlog, and low absorption by DAs.
In mitigation, URF is pursuing establishment of regional TSUs and it will continue to
work with other government entities in addressing the various forms of capacity gaps
in DUCAR agencies.
7) Procurement delays hampering the implementation of road maintenance programmes and
absorption of funds.
In mitigation, URF will continue coordination with other government entities in
addressing the underlying issues in delays to procurements;
8) Wide variations in unit costs of similar road maintenance works among DAs that can’t be
explained by topographic and climatic differences.
In mitigation, URF is using a unit cost framework to harmonise unit rates across the
different regions of the country and envelopes within which unit rates should fall per
region are being issued out every FY as part of the planning and budgeting guidelines
to URF DAs.
9) Low compliance with reporting schedules by designated agencies, which afflicts timely
reporting on performance of the sector.
In mitigation URF plans to roll out use of a Road Maintenance Management and
Monitoring System (RMMoS) to improve planning, reporting and accountability
among DAs.
10) Late release of funds from MoFPED, which in Q4 FY 2016/17 took 18 calendar days
from start of the quarter.
In mitigation, URF will continue engaging MoFPED to ensure achievement of direct
monthly remittances of RUCs to the URF account as envisaged under Section 21 (3)
of the URF Act.
11) Misuse and abuse of road maintenance funds by DAs. Audit and M&E activities carried
out by the Fund in FY 2016/17 continued to uncover misuse and abuse of road
maintenance funds by DAs.
In mitigation, URF will step up its oversight functions, build synergies with audit
functions of the DAs and other government entities, and actively follow up on
implementation of the arising recommendations.
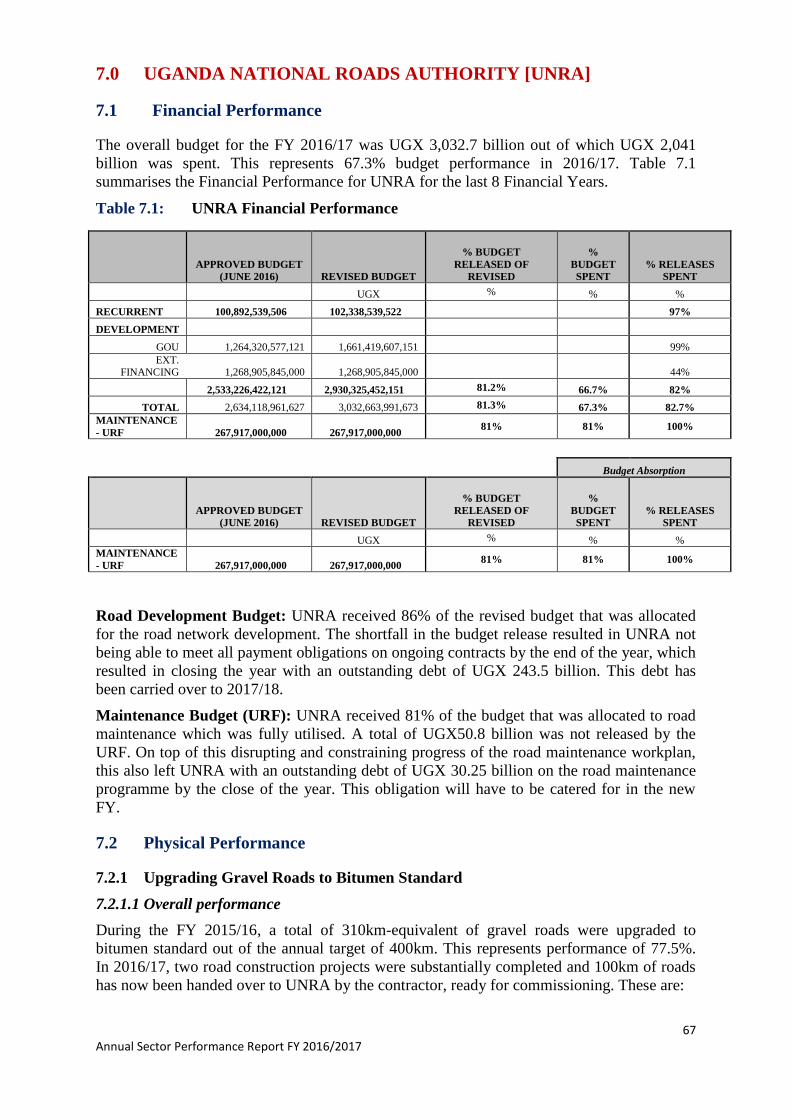
67 Annual Sector Performance Report FY 2016/2017
7.0 UGANDA NATIONAL ROADS AUTHORITY [UNRA]
7.1 Financial Performance
The overall budget for the FY 2016/17 was UGX 3,032.7 billion out of which UGX 2,041
billion was spent. This represents 67.3% budget performance in 2016/17. Table 7.1
summarises the Financial Performance for UNRA for the last 8 Financial Years.
Table 7.1: UNRA Financial Performance
APPROVED BUDGET
(JUNE 2016) REVISED BUDGET
% BUDGET
RELEASED OF
REVISED
%
BUDGET
SPENT
% RELEASES
SPENT
UGX % % %
RECURRENT 100,892,539,506 102,338,539,522 97%
DEVELOPMENT
GOU 1,264,320,577,121 1,661,419,607,151 99%
EXT. FINANCING 1,268,905,845,000 1,268,905,845,000
44%
2,533,226,422,121 2,930,325,452,151 81.2% 66.7% 82%
TOTAL 2,634,118,961,627 3,032,663,991,673 81.3% 67.3% 82.7%
MAINTENANCE
- URF 267,917,000,000 267,917,000,000 81% 81% 100%
Budget Absorption
APPROVED BUDGET
(JUNE 2016) REVISED BUDGET
% BUDGET
RELEASED OF
REVISED
%
BUDGET
SPENT
% RELEASES
SPENT
UGX % % %
MAINTENANCE
- URF 267,917,000,000 267,917,000,000 81% 81% 100%
Road Development Budget: UNRA received 86% of the revised budget that was allocated
for the road network development. The shortfall in the budget release resulted in UNRA not
being able to meet all payment obligations on ongoing contracts by the end of the year, which
resulted in closing the year with an outstanding debt of UGX 243.5 billion. This debt has
been carried over to 2017/18.
Maintenance Budget (URF): UNRA received 81% of the budget that was allocated to road
maintenance which was fully utilised. A total of UGX50.8 billion was not released by the
URF. On top of this disrupting and constraining progress of the road maintenance workplan,
this also left UNRA with an outstanding debt of UGX 30.25 billion on the road maintenance
programme by the close of the year. This obligation will have to be catered for in the new
FY.
7.2 Physical Performance
7.2.1 Upgrading Gravel Roads to Bitumen Standard
7.2.1.1 Overall performance
During the FY 2015/16, a total of 310km-equivalent of gravel roads were upgraded to
bitumen standard out of the annual target of 400km. This represents performance of 77.5%.
In 2016/17, two road construction projects were substantially completed and 100km of roads
has now been handed over to UNRA by the contractor, ready for commissioning. These are:
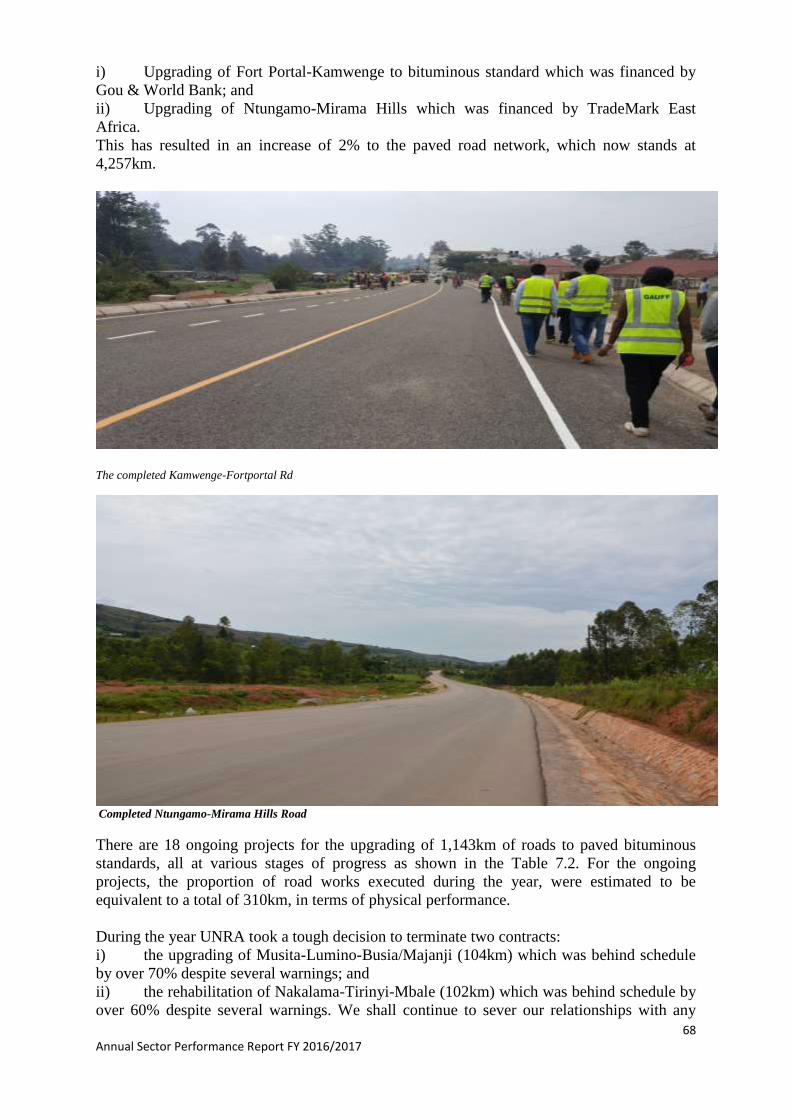
68 Annual Sector Performance Report FY 2016/2017
i) Upgrading of Fort Portal-Kamwenge to bituminous standard which was financed by
Gou & World Bank; and
ii) Upgrading of Ntungamo-Mirama Hills which was financed by TradeMark East
Africa.
This has resulted in an increase of 2% to the paved road network, which now stands at
4,257km.
The completed Kamwenge-Fortportal Rd
Completed Ntungamo-Mirama Hills Road
There are 18 ongoing projects for the upgrading of 1,143km of roads to paved bituminous
standards, all at various stages of progress as shown in the Table 7.2. For the ongoing
projects, the proportion of road works executed during the year, were estimated to be
equivalent to a total of 310km, in terms of physical performance.
During the year UNRA took a tough decision to terminate two contracts:
i) the upgrading of Musita-Lumino-Busia/Majanji (104km) which was behind schedule
by over 70% despite several warnings; and
ii) the rehabilitation of Nakalama-Tirinyi-Mbale (102km) which was behind schedule by
over 60% despite several warnings. We shall continue to sever our relationships with any
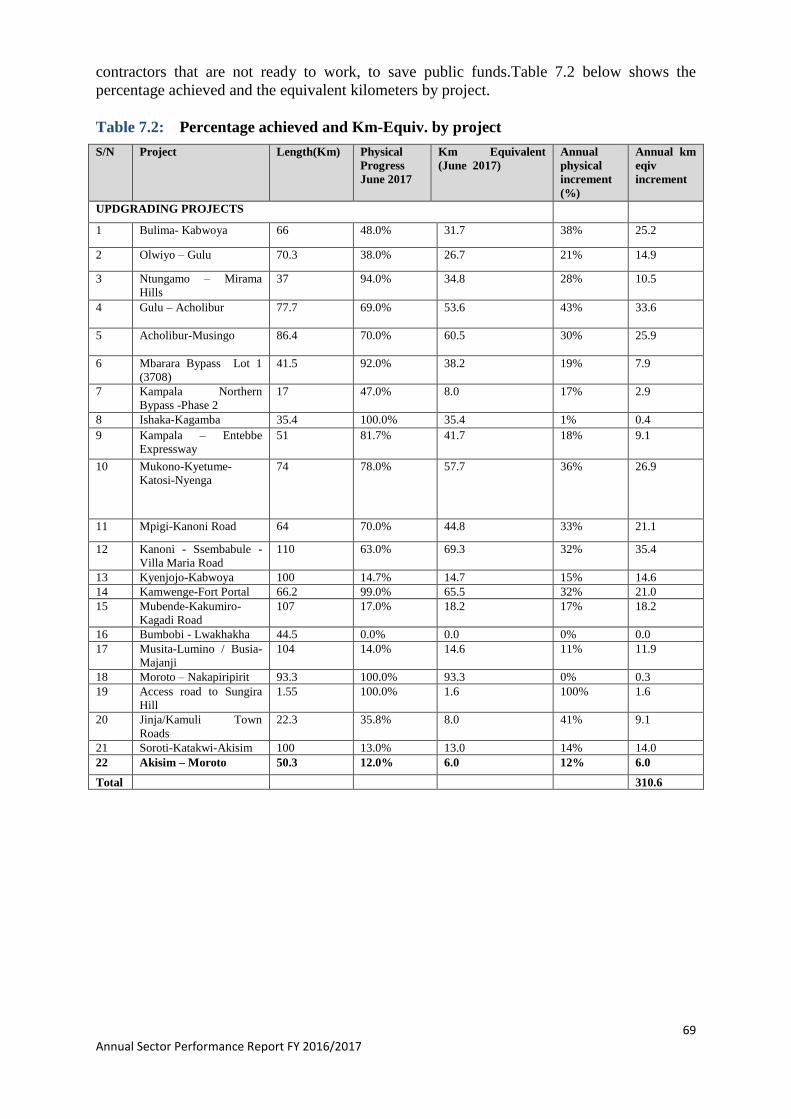
69 Annual Sector Performance Report FY 2016/2017
contractors that are not ready to work, to save public funds.Table 7.2 below shows the
percentage achieved and the equivalent kilometers by project.
Table 7.2: Percentage achieved and Km-Equiv. by project
S/N Project Length(Km) Physical
Progress
June 2017
Km Equivalent
(June 2017)
Annual
physical
increment
(%)
Annual km
eqiv
increment
UPDGRADING PROJECTS
1 Bulima- Kabwoya 66 48.0% 31.7 38% 25.2
2 Olwiyo – Gulu 70.3 38.0% 26.7 21% 14.9
3 Ntungamo – Mirama
Hills
37 94.0% 34.8 28% 10.5
4 Gulu – Acholibur 77.7 69.0% 53.6 43% 33.6
5 Acholibur-Musingo 86.4 70.0% 60.5 30% 25.9
6 Mbarara Bypass Lot 1
(3708)
41.5 92.0% 38.2 19% 7.9
7 Kampala Northern
Bypass -Phase 2
17 47.0% 8.0 17% 2.9
8 Ishaka-Kagamba 35.4 100.0% 35.4 1% 0.4
9 Kampala – Entebbe
Expressway
51 81.7% 41.7 18% 9.1
10 Mukono-Kyetume-
Katosi-Nyenga
74 78.0% 57.7 36% 26.9
11 Mpigi-Kanoni Road 64 70.0% 44.8 33% 21.1
12 Kanoni - Ssembabule -
Villa Maria Road
110 63.0% 69.3 32% 35.4
13 Kyenjojo-Kabwoya 100 14.7% 14.7 15% 14.6
14 Kamwenge-Fort Portal 66.2 99.0% 65.5 32% 21.0
15 Mubende-Kakumiro-
Kagadi Road
107 17.0% 18.2 17% 18.2
16 Bumbobi - Lwakhakha 44.5 0.0% 0.0 0% 0.0
17 Musita-Lumino / Busia-
Majanji
104 14.0% 14.6 11% 11.9
18 Moroto – Nakapiripirit 93.3 100.0% 93.3 0% 0.3
19 Access road to Sungira
Hill
1.55 100.0% 1.6 100% 1.6
20 Jinja/Kamuli Town
Roads
22.3 35.8% 8.0 41% 9.1
21 Soroti-Katakwi-Akisim 100 13.0% 13.0 14% 14.0
22 Akisim – Moroto 50.3 12.0% 6.0 12% 6.0
Total 310.6
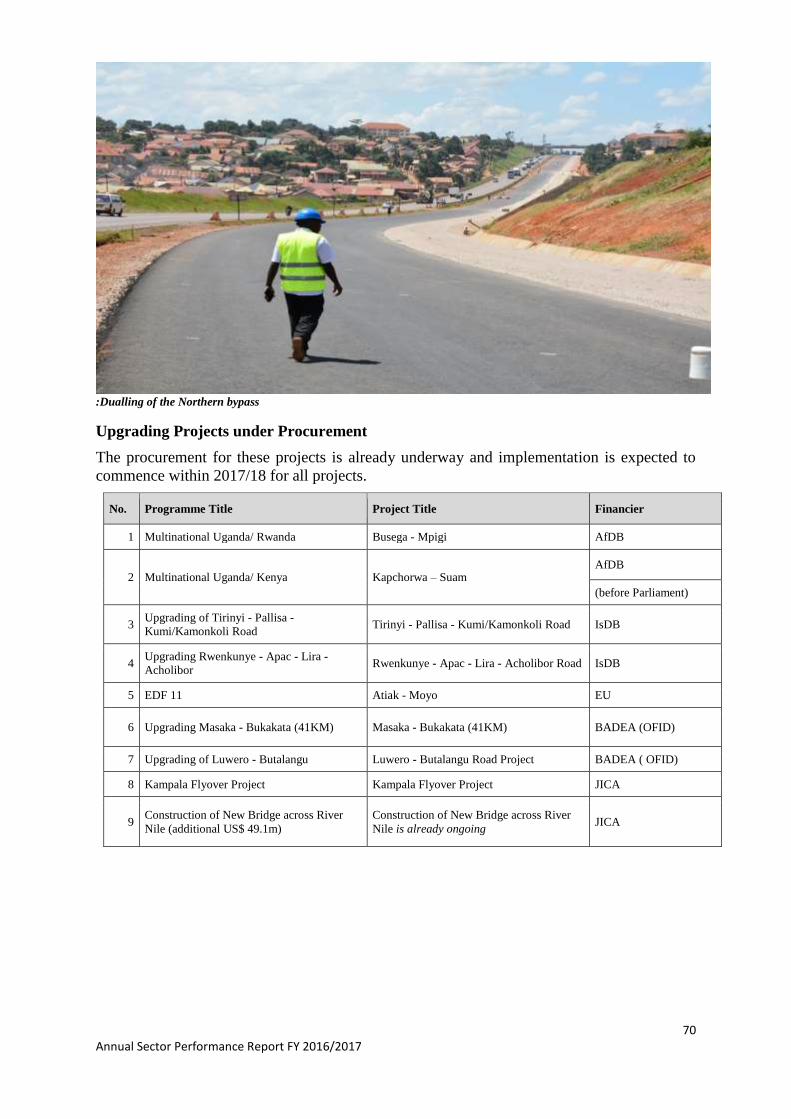
70 Annual Sector Performance Report FY 2016/2017
:Dualling of the Northern bypass
Upgrading Projects under Procurement
The procurement for these projects is already underway and implementation is expected to
commence within 2017/18 for all projects.
No. Programme Title Project Title Financier
1 Multinational Uganda/ Rwanda Busega - Mpigi AfDB
2 Multinational Uganda/ Kenya Kapchorwa – Suam AfDB
(before Parliament)
3 Upgrading of Tirinyi - Pallisa -
Kumi/Kamonkoli Road Tirinyi - Pallisa - Kumi/Kamonkoli Road IsDB
4 Upgrading Rwenkunye - Apac - Lira -
Acholibor Rwenkunye - Apac - Lira - Acholibor Road IsDB
5 EDF 11 Atiak - Moyo EU
6 Upgrading Masaka - Bukakata (41KM) Masaka - Bukakata (41KM) BADEA (OFID)
7 Upgrading of Luwero - Butalangu Luwero - Butalangu Road Project BADEA ( OFID)
8 Kampala Flyover Project Kampala Flyover Project JICA
9 Construction of New Bridge across River
Nile (additional US$ 49.1m)
Construction of New Bridge across River
Nile is already ongoing JICA
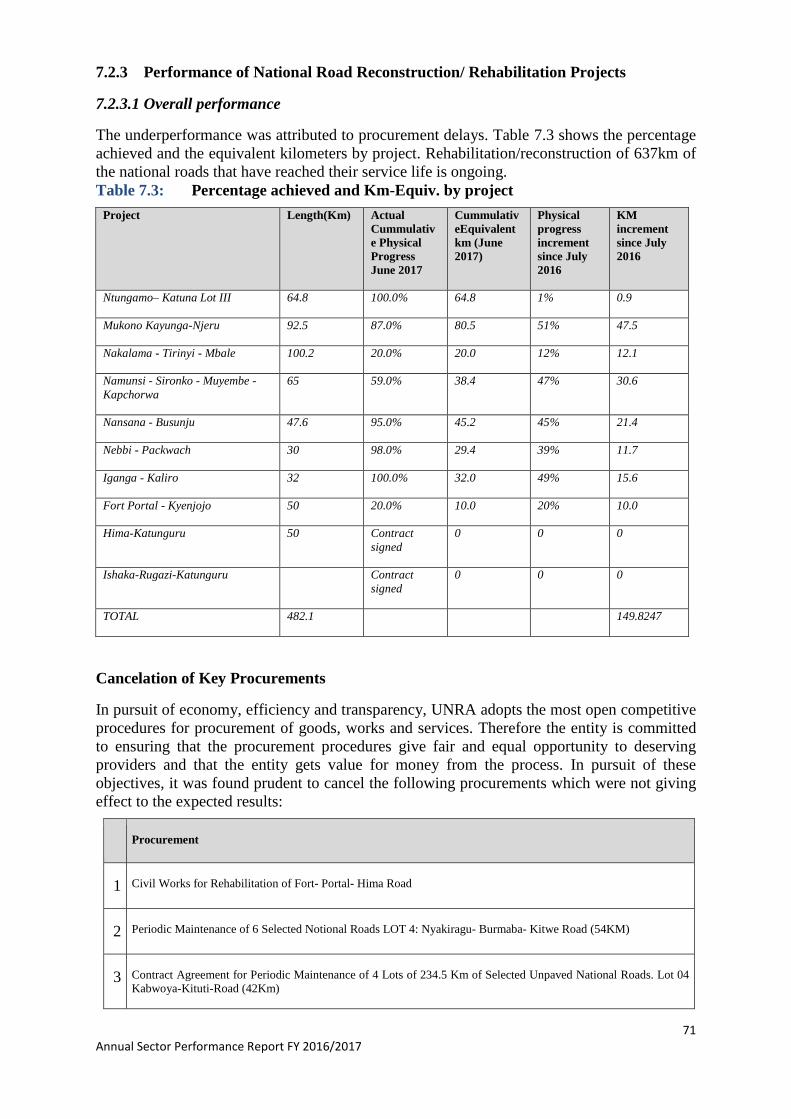
71 Annual Sector Performance Report FY 2016/2017
7.2.3 Performance of National Road Reconstruction/ Rehabilitation Projects
7.2.3.1 Overall performance
The underperformance was attributed to procurement delays. Table 7.3 shows the percentage
achieved and the equivalent kilometers by project. Rehabilitation/reconstruction of 637km of
the national roads that have reached their service life is ongoing.
Table 7.3: Percentage achieved and Km-Equiv. by project
Project Length(Km) Actual
Cummulativ
e Physical
Progress
June 2017
Cummulativ
eEquivalent
km (June
2017)
Physical
progress
increment
since July
2016
KM
increment
since July
2016
Ntungamo– Katuna Lot III 64.8 100.0% 64.8 1% 0.9
Mukono Kayunga-Njeru 92.5 87.0% 80.5 51% 47.5
Nakalama - Tirinyi - Mbale 100.2 20.0% 20.0 12% 12.1
Namunsi - Sironko - Muyembe -
Kapchorwa
65 59.0% 38.4 47% 30.6
Nansana - Busunju 47.6 95.0% 45.2 45% 21.4
Nebbi - Packwach 30 98.0% 29.4 39% 11.7
Iganga - Kaliro 32 100.0% 32.0 49% 15.6
Fort Portal - Kyenjojo 50 20.0% 10.0 20% 10.0
Hima-Katunguru 50 Contract
signed
0 0 0
Ishaka-Rugazi-Katunguru Contract
signed
0 0 0
TOTAL 482.1 149.8247
Cancelation of Key Procurements
In pursuit of economy, efficiency and transparency, UNRA adopts the most open competitive
procedures for procurement of goods, works and services. Therefore the entity is committed
to ensuring that the procurement procedures give fair and equal opportunity to deserving
providers and that the entity gets value for money from the process. In pursuit of these
objectives, it was found prudent to cancel the following procurements which were not giving
effect to the expected results:
Procurement
1 Civil Works for Rehabilitation of Fort- Portal- Hima Road
2 Periodic Maintenance of 6 Selected Notional Roads LOT 4: Nyakiragu- Burmaba- Kitwe Road (54KM)
3 Contract Agreement for Periodic Maintenance of 4 Lots of 234.5 Km of Selected Unpaved National Roads. Lot 04
Kabwoya-Kituti-Road (42Km)
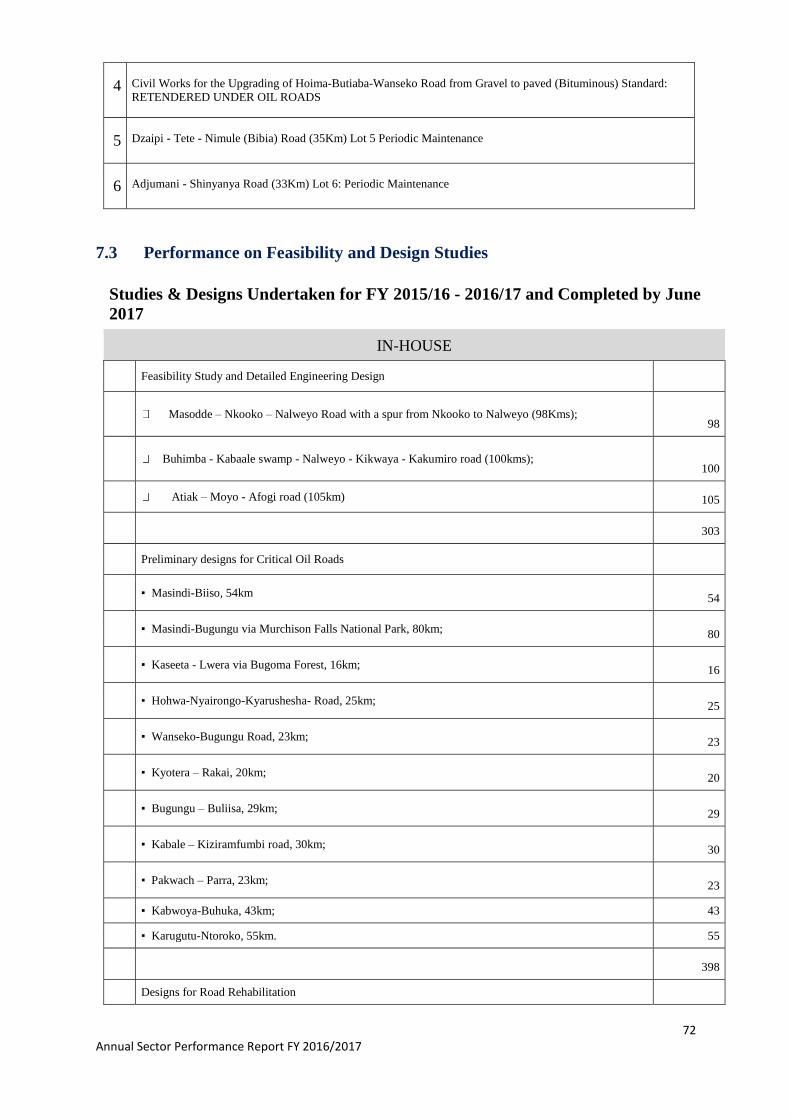
72 Annual Sector Performance Report FY 2016/2017
4 Civil Works for the Upgrading of Hoima-Butiaba-Wanseko Road from Gravel to paved (Bituminous) Standard:
RETENDERED UNDER OIL ROADS
5 Dzaipi - Tete - Nimule (Bibia) Road (35Km) Lot 5 Periodic Maintenance
6 Adjumani - Shinyanya Road (33Km) Lot 6: Periodic Maintenance
7.3 Performance on Feasibility and Design Studies
Studies & Designs Undertaken for FY 2015/16 - 2016/17 and Completed by June
2017
IN-HOUSE
Feasibility Study and Detailed Engineering Design
Masodde – Nkooko – Nalweyo Road with a spur from Nkooko to Nalweyo (98Kms);
98
Buhimba - Kabaale swamp - Nalweyo - Kikwaya - Kakumiro road (100kms);
100
Atiak – Moyo - Afogi road (105km) 105
303
Preliminary designs for Critical Oil Roads
▪ Masindi-Biiso, 54km 54
▪ Masindi-Bugungu via Murchison Falls National Park, 80km; 80
▪ Kaseeta - Lwera via Bugoma Forest, 16km; 16
▪ Hohwa-Nyairongo-Kyarushesha- Road, 25km; 25
▪ Wanseko-Bugungu Road, 23km; 23
▪ Kyotera – Rakai, 20km; 20
▪ Bugungu – Buliisa, 29km; 29
▪ Kabale – Kiziramfumbi road, 30km; 30
▪ Pakwach – Parra, 23km; 23
▪ Kabwoya-Buhuka, 43km; 43
▪ Karugutu-Ntoroko, 55km. 55
398
Designs for Road Rehabilitation
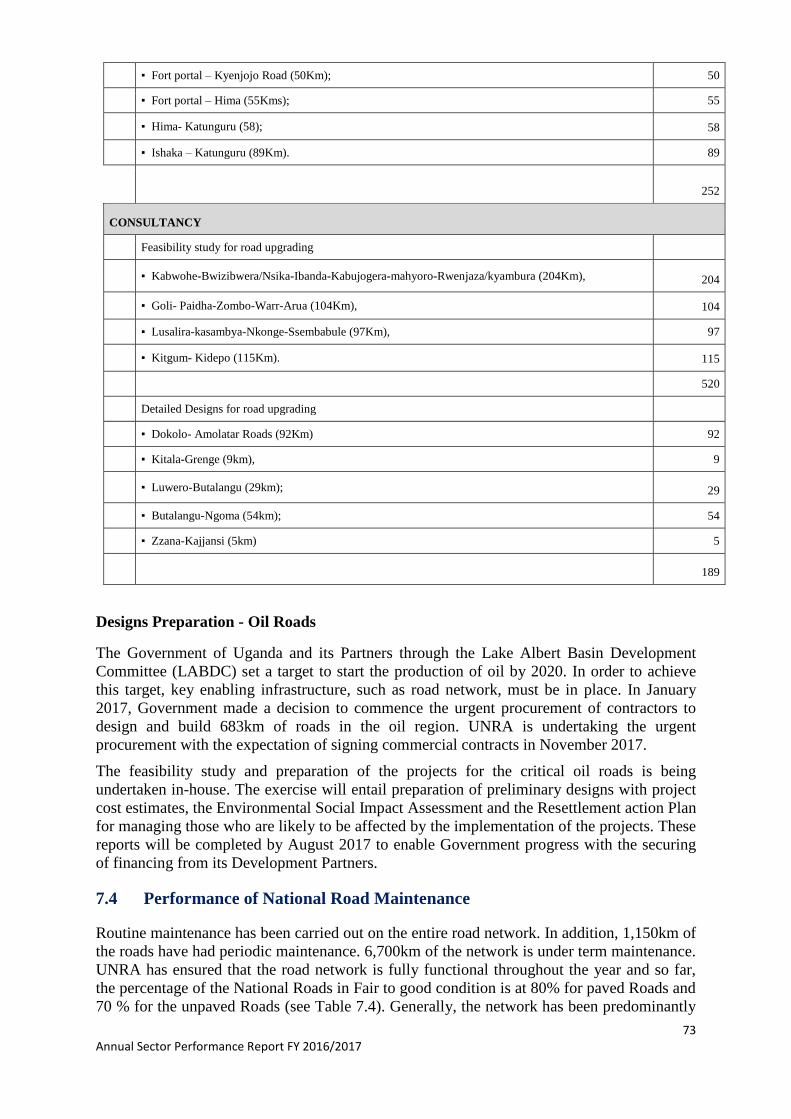
73 Annual Sector Performance Report FY 2016/2017
▪ Fort portal – Kyenjojo Road (50Km); 50
▪ Fort portal – Hima (55Kms); 55
▪ Hima- Katunguru (58); 58
▪ Ishaka – Katunguru (89Km). 89
252
CONSULTANCY
Feasibility study for road upgrading
▪ Kabwohe-Bwizibwera/Nsika-Ibanda-Kabujogera-mahyoro-Rwenjaza/kyambura (204Km), 204
▪ Goli- Paidha-Zombo-Warr-Arua (104Km), 104
▪ Lusalira-kasambya-Nkonge-Ssembabule (97Km), 97
▪ Kitgum- Kidepo (115Km). 115
520
Detailed Designs for road upgrading
▪ Dokolo- Amolatar Roads (92Km) 92
▪ Kitala-Grenge (9km), 9
▪ Luwero-Butalangu (29km); 29
▪ Butalangu-Ngoma (54km); 54
▪ Zzana-Kajjansi (5km) 5
189
Designs Preparation - Oil Roads
The Government of Uganda and its Partners through the Lake Albert Basin Development
Committee (LABDC) set a target to start the production of oil by 2020. In order to achieve
this target, key enabling infrastructure, such as road network, must be in place. In January
2017, Government made a decision to commence the urgent procurement of contractors to
design and build 683km of roads in the oil region. UNRA is undertaking the urgent
procurement with the expectation of signing commercial contracts in November 2017.
The feasibility study and preparation of the projects for the critical oil roads is being
undertaken in-house. The exercise will entail preparation of preliminary designs with project
cost estimates, the Environmental Social Impact Assessment and the Resettlement action Plan
for managing those who are likely to be affected by the implementation of the projects. These
reports will be completed by August 2017 to enable Government progress with the securing
of financing from its Development Partners.
7.4 Performance of National Road Maintenance
Routine maintenance has been carried out on the entire road network. In addition, 1,150km of
the roads have had periodic maintenance. 6,700km of the network is under term maintenance.
UNRA has ensured that the road network is fully functional throughout the year and so far,
the percentage of the National Roads in Fair to good condition is at 80% for paved Roads and
70 % for the unpaved Roads (see Table 7.4). Generally, the network has been predominantly
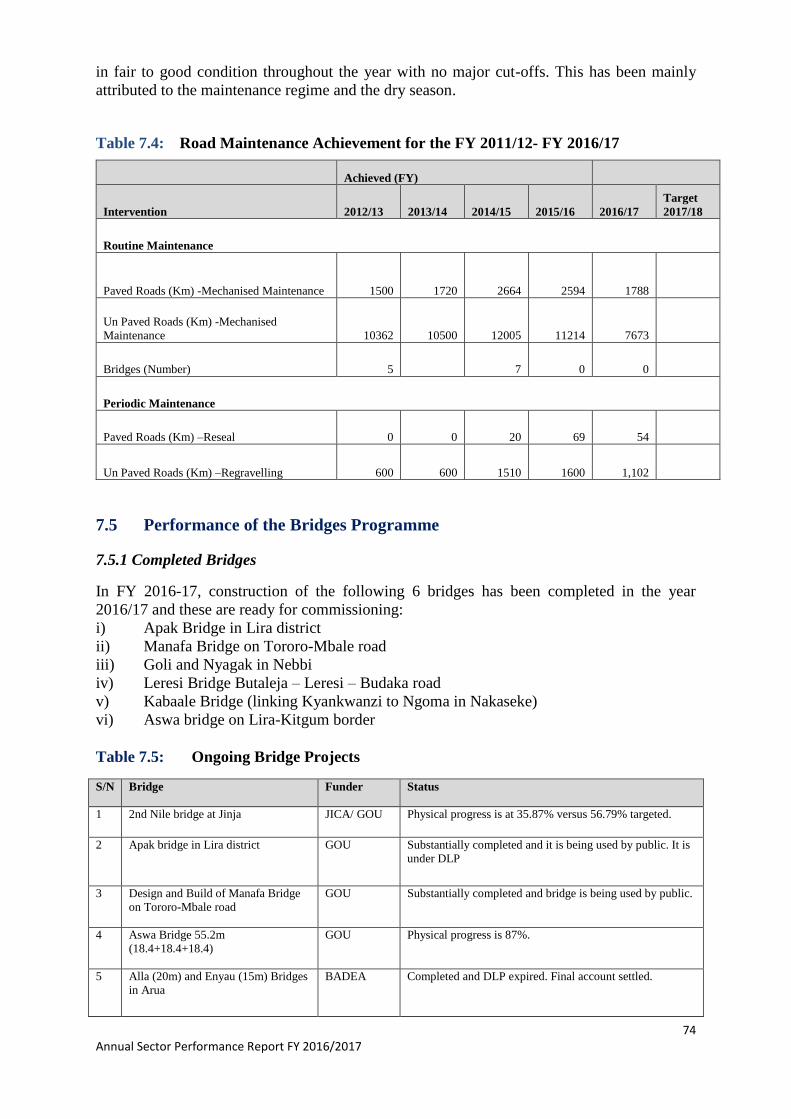
74 Annual Sector Performance Report FY 2016/2017
in fair to good condition throughout the year with no major cut-offs. This has been mainly
attributed to the maintenance regime and the dry season.
Table 7.4: Road Maintenance Achievement for the FY 2011/12- FY 2016/17
Achieved (FY)
Intervention 2012/13 2013/14 2014/15 2015/16 2016/17
Target
2017/18
Routine Maintenance
Paved Roads (Km) -Mechanised Maintenance 1500 1720 2664 2594 1788
Un Paved Roads (Km) -Mechanised
Maintenance 10362 10500 12005 11214 7673
Bridges (Number) 5 7 0 0
Periodic Maintenance
Paved Roads (Km) –Reseal 0 0 20 69 54
Un Paved Roads (Km) –Regravelling 600 600 1510 1600 1,102
7.5 Performance of the Bridges Programme
7.5.1 Completed Bridges
In FY 2016-17, construction of the following 6 bridges has been completed in the year
2016/17 and these are ready for commissioning:
i) Apak Bridge in Lira district
ii) Manafa Bridge on Tororo-Mbale road
iii) Goli and Nyagak in Nebbi
iv) Leresi Bridge Butaleja – Leresi – Budaka road
v) Kabaale Bridge (linking Kyankwanzi to Ngoma in Nakaseke)
vi) Aswa bridge on Lira-Kitgum border
Table 7.5: Ongoing Bridge Projects
S/N Bridge Funder Status
1 2nd Nile bridge at Jinja JICA/ GOU Physical progress is at 35.87% versus 56.79% targeted.
2 Apak bridge in Lira district GOU Substantially completed and it is being used by public. It is
under DLP
3 Design and Build of Manafa Bridge
on Tororo-Mbale road
GOU Substantially completed and bridge is being used by public.
4 Aswa Bridge 55.2m
(18.4+18.4+18.4)
GOU Physical progress is 87%.
5 Alla (20m) and Enyau (15m) Bridges
in Arua
BADEA Completed and DLP expired. Final account settled.
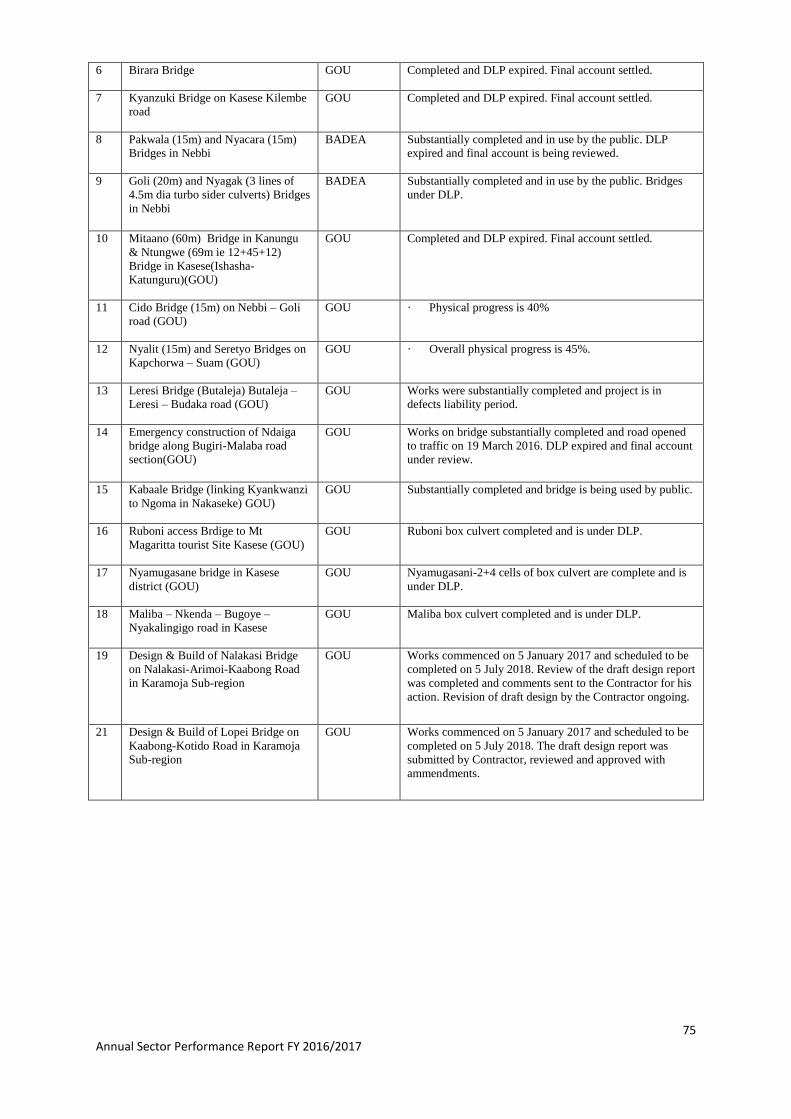
75 Annual Sector Performance Report FY 2016/2017
6 Birara Bridge GOU Completed and DLP expired. Final account settled.
7 Kyanzuki Bridge on Kasese Kilembe
road
GOU Completed and DLP expired. Final account settled.
8 Pakwala (15m) and Nyacara (15m)
Bridges in Nebbi
BADEA Substantially completed and in use by the public. DLP
expired and final account is being reviewed.
9 Goli (20m) and Nyagak (3 lines of
4.5m dia turbo sider culverts) Bridges
in Nebbi
BADEA Substantially completed and in use by the public. Bridges
under DLP.
10 Mitaano (60m) Bridge in Kanungu
& Ntungwe (69m ie 12+45+12)
Bridge in Kasese(Ishasha-
Katunguru)(GOU)
GOU Completed and DLP expired. Final account settled.
11 Cido Bridge (15m) on Nebbi – Goli
road (GOU)
GOU · Physical progress is 40%
12 Nyalit (15m) and Seretyo Bridges on
Kapchorwa – Suam (GOU)
GOU · Overall physical progress is 45%.
13 Leresi Bridge (Butaleja) Butaleja –
Leresi – Budaka road (GOU)
GOU Works were substantially completed and project is in
defects liability period.
14 Emergency construction of Ndaiga
bridge along Bugiri-Malaba road
section(GOU)
GOU Works on bridge substantially completed and road opened
to traffic on 19 March 2016. DLP expired and final account
under review.
15 Kabaale Bridge (linking Kyankwanzi
to Ngoma in Nakaseke) GOU)
GOU Substantially completed and bridge is being used by public.
16 Ruboni access Brdige to Mt
Magaritta tourist Site Kasese (GOU)
GOU Ruboni box culvert completed and is under DLP.
17 Nyamugasane bridge in Kasese
district (GOU)
GOU Nyamugasani-2+4 cells of box culvert are complete and is
under DLP.
18 Maliba – Nkenda – Bugoye –
Nyakalingigo road in Kasese
GOU Maliba box culvert completed and is under DLP.
19 Design & Build of Nalakasi Bridge
on Nalakasi-Arimoi-Kaabong Road
in Karamoja Sub-region
GOU Works commenced on 5 January 2017 and scheduled to be
completed on 5 July 2018. Review of the draft design report
was completed and comments sent to the Contractor for his
action. Revision of draft design by the Contractor ongoing.
21 Design & Build of Lopei Bridge on
Kaabong-Kotido Road in Karamoja
Sub-region
GOU Works commenced on 5 January 2017 and scheduled to be
completed on 5 July 2018. The draft design report was
submitted by Contractor, reviewed and approved with
ammendments.
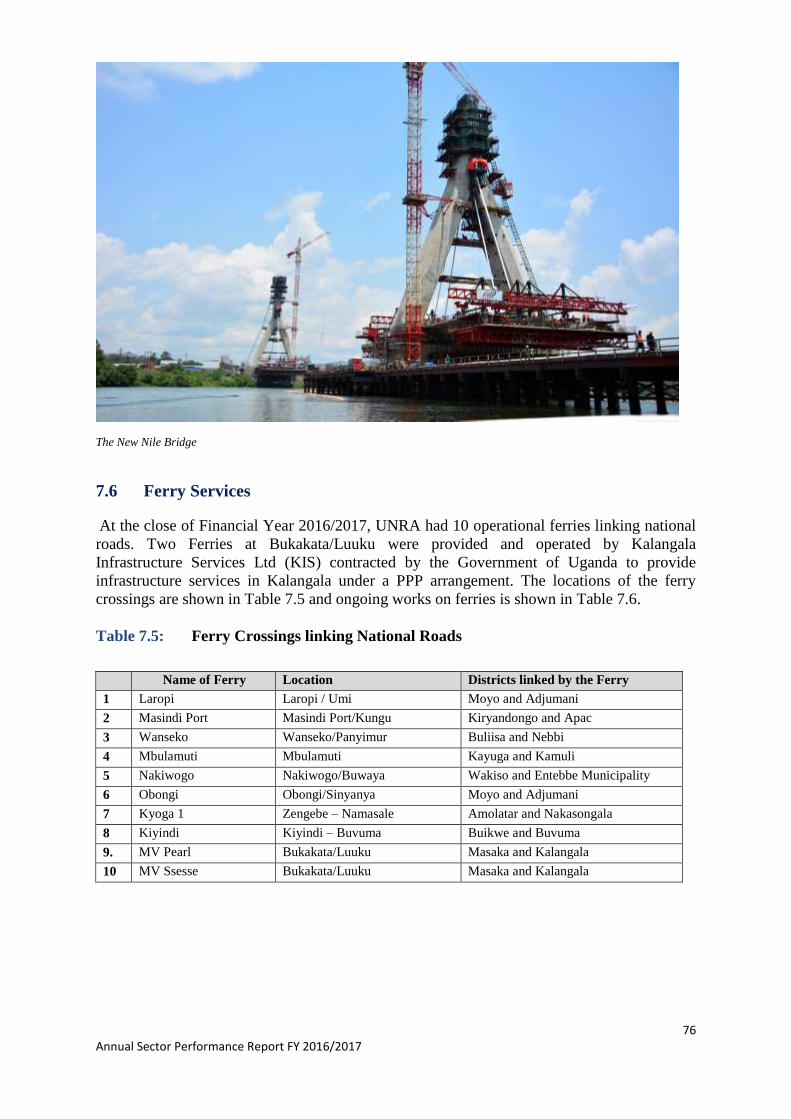
76 Annual Sector Performance Report FY 2016/2017
The New Nile Bridge
7.6 Ferry Services
At the close of Financial Year 2016/2017, UNRA had 10 operational ferries linking national
roads. Two Ferries at Bukakata/Luuku were provided and operated by Kalangala
Infrastructure Services Ltd (KIS) contracted by the Government of Uganda to provide
infrastructure services in Kalangala under a PPP arrangement. The locations of the ferry
crossings are shown in Table 7.5 and ongoing works on ferries is shown in Table 7.6.
Table 7.5: Ferry Crossings linking National Roads
Name of Ferry Location Districts linked by the Ferry
1 Laropi Laropi / Umi Moyo and Adjumani
2 Masindi Port Masindi Port/Kungu Kiryandongo and Apac
3 Wanseko Wanseko/Panyimur Buliisa and Nebbi
4 Mbulamuti Mbulamuti Kayuga and Kamuli
5 Nakiwogo Nakiwogo/Buwaya Wakiso and Entebbe Municipality
6 Obongi Obongi/Sinyanya Moyo and Adjumani
7 Kyoga 1 Zengebe – Namasale Amolatar and Nakasongala
8 Kiyindi Kiyindi – Buvuma Buikwe and Buvuma
9. MV Pearl Bukakata/Luuku Masaka and Kalangala
10 MV Ssesse Bukakata/Luuku Masaka and Kalangala
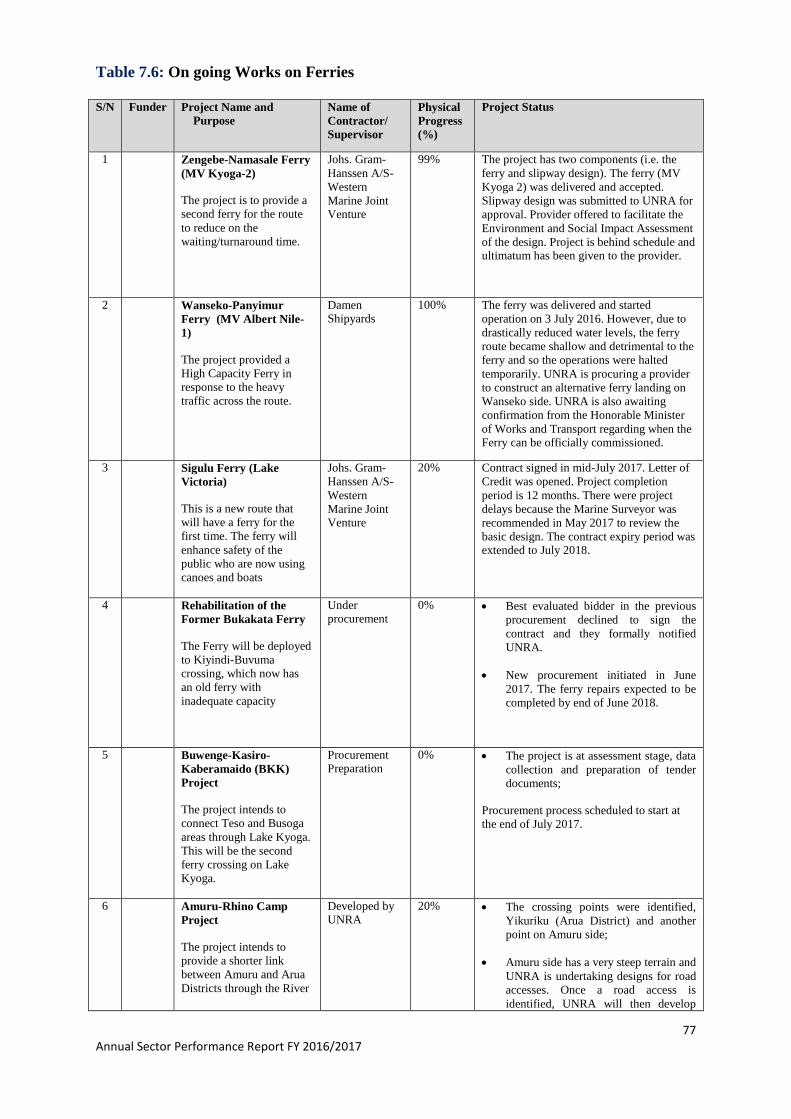
77 Annual Sector Performance Report FY 2016/2017
Table 7.6: On going Works on Ferries
S/N Funder Project Name and
Purpose
Name of
Contractor/
Supervisor
Physical
Progress
(%)
Project Status
1 Zengebe-Namasale Ferry
(MV Kyoga-2)
The project is to provide a
second ferry for the route
to reduce on the
waiting/turnaround time.
Johs. Gram-
Hanssen A/S-
Western
Marine Joint Venture
99% The project has two components (i.e. the
ferry and slipway design). The ferry (MV
Kyoga 2) was delivered and accepted.
Slipway design was submitted to UNRA for
approval. Provider offered to facilitate the
Environment and Social Impact Assessment
of the design. Project is behind schedule and ultimatum has been given to the provider.
2 Wanseko-Panyimur
Ferry (MV Albert Nile-
1)
The project provided a
High Capacity Ferry in
response to the heavy
traffic across the route.
Damen Shipyards
100% The ferry was delivered and started
operation on 3 July 2016. However, due to
drastically reduced water levels, the ferry
route became shallow and detrimental to the
ferry and so the operations were halted
temporarily. UNRA is procuring a provider
to construct an alternative ferry landing on
Wanseko side. UNRA is also awaiting
confirmation from the Honorable Minister
of Works and Transport regarding when the Ferry can be officially commissioned.
3 Sigulu Ferry (Lake
Victoria)
This is a new route that
will have a ferry for the
first time. The ferry will
enhance safety of the
public who are now using
canoes and boats
Johs. Gram-
Hanssen A/S-
Western
Marine Joint Venture
20% Contract signed in mid-July 2017. Letter of
Credit was opened. Project completion
period is 12 months. There were project
delays because the Marine Surveyor was
recommended in May 2017 to review the
basic design. The contract expiry period was extended to July 2018.
4 Rehabilitation of the
Former Bukakata Ferry
The Ferry will be deployed
to Kiyindi-Buvuma
crossing, which now has
an old ferry with
inadequate capacity
Under procurement
0% Best evaluated bidder in the previous
procurement declined to sign the
contract and they formally notified
UNRA.
New procurement initiated in June
2017. The ferry repairs expected to be
completed by end of June 2018.
5 Buwenge-Kasiro-
Kaberamaido (BKK)
Project
The project intends to
connect Teso and Busoga
areas through Lake Kyoga.
This will be the second
ferry crossing on Lake
Kyoga.
Procurement Preparation
0% The project is at assessment stage, data
collection and preparation of tender
documents;
Procurement process scheduled to start at
the end of July 2017.
6 Amuru-Rhino Camp
Project
The project intends to
provide a shorter link
between Amuru and Arua
Districts through the River
Developed by UNRA
20% The crossing points were identified,
Yikuriku (Arua District) and another
point on Amuru side;
Amuru side has a very steep terrain and
UNRA is undertaking designs for road
accesses. Once a road access is
identified, UNRA will then develop
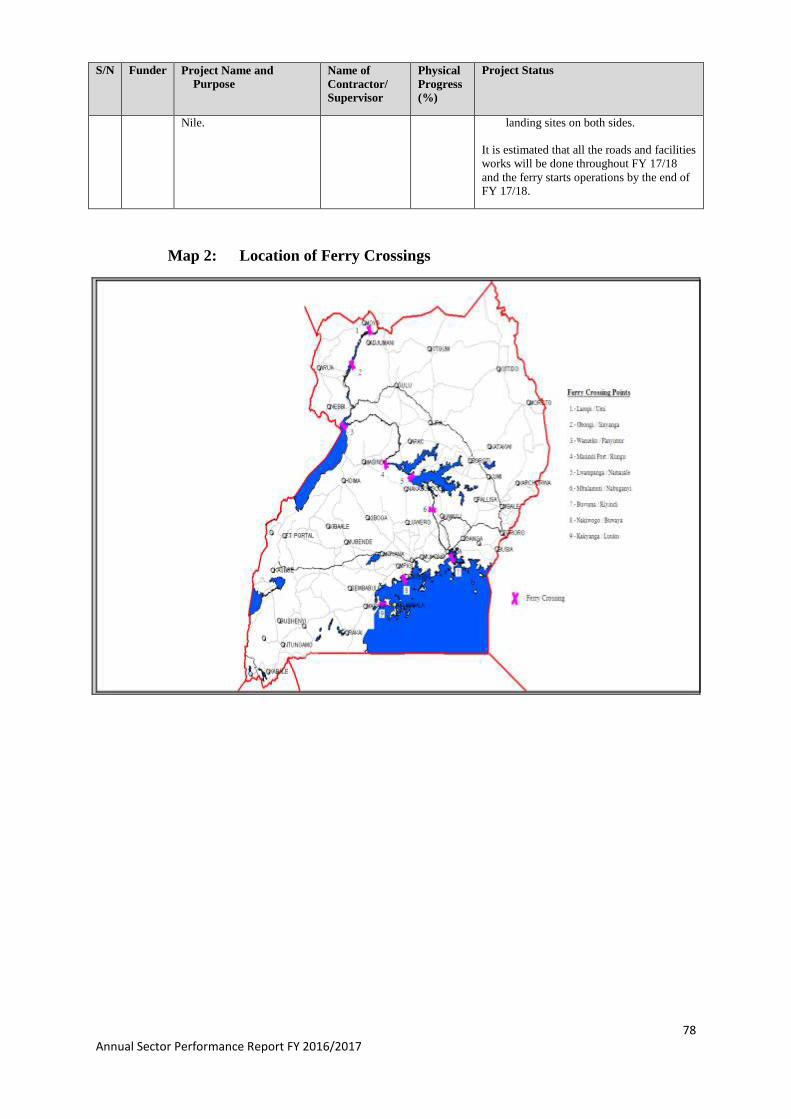
78 Annual Sector Performance Report FY 2016/2017
S/N Funder Project Name and
Purpose
Name of
Contractor/
Supervisor
Physical
Progress
(%)
Project Status
Nile. landing sites on both sides.
It is estimated that all the roads and facilities
works will be done throughout FY 17/18
and the ferry starts operations by the end of FY 17/18.
Map 2: Location of Ferry Crossings
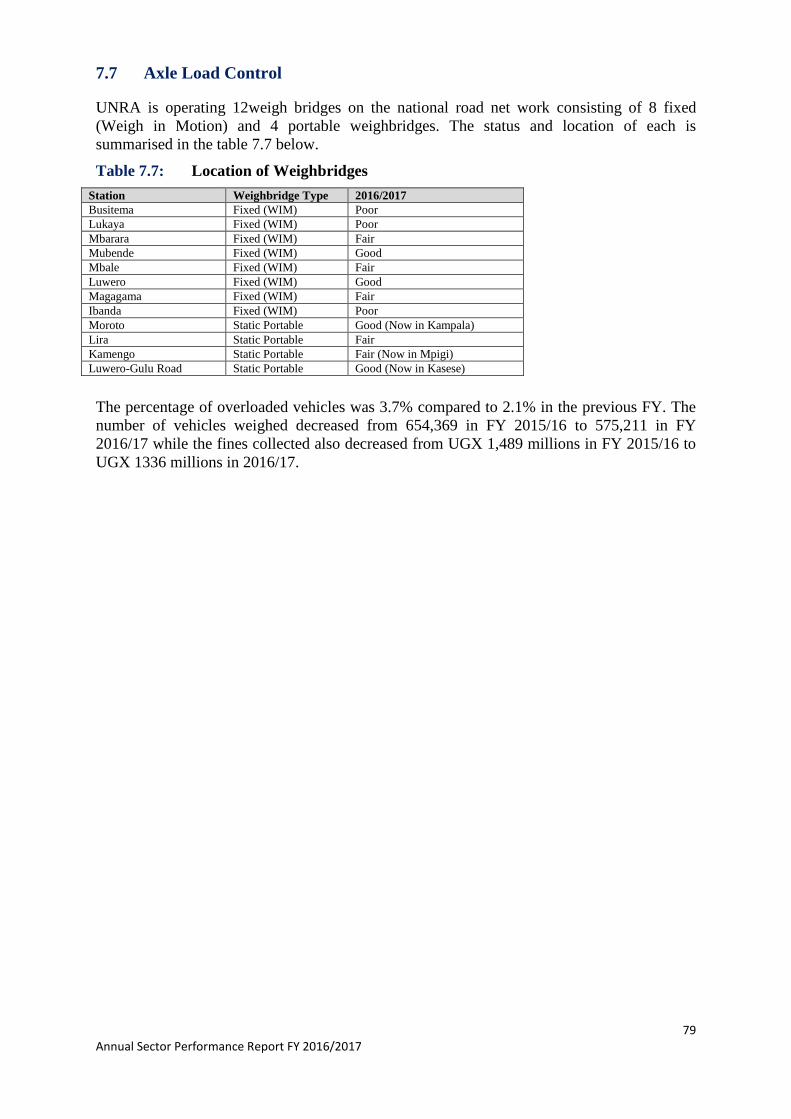
79 Annual Sector Performance Report FY 2016/2017
7.7 Axle Load Control
UNRA is operating 12weigh bridges on the national road net work consisting of 8 fixed
(Weigh in Motion) and 4 portable weighbridges. The status and location of each is
summarised in the table 7.7 below.
Table 7.7: Location of Weighbridges
Station Weighbridge Type 2016/2017
Busitema Fixed (WIM) Poor
Lukaya Fixed (WIM) Poor
Mbarara Fixed (WIM) Fair
Mubende Fixed (WIM) Good
Mbale Fixed (WIM) Fair
Luwero Fixed (WIM) Good
Magagama Fixed (WIM) Fair
Ibanda Fixed (WIM) Poor
Moroto Static Portable Good (Now in Kampala)
Lira Static Portable Fair
Kamengo Static Portable Fair (Now in Mpigi)
Luwero-Gulu Road Static Portable Good (Now in Kasese)
The percentage of overloaded vehicles was 3.7% compared to 2.1% in the previous FY. The
number of vehicles weighed decreased from 654,369 in FY 2015/16 to 575,211 in FY
2016/17 while the fines collected also decreased from UGX 1,489 millions in FY 2015/16 to
UGX 1336 millions in 2016/17.
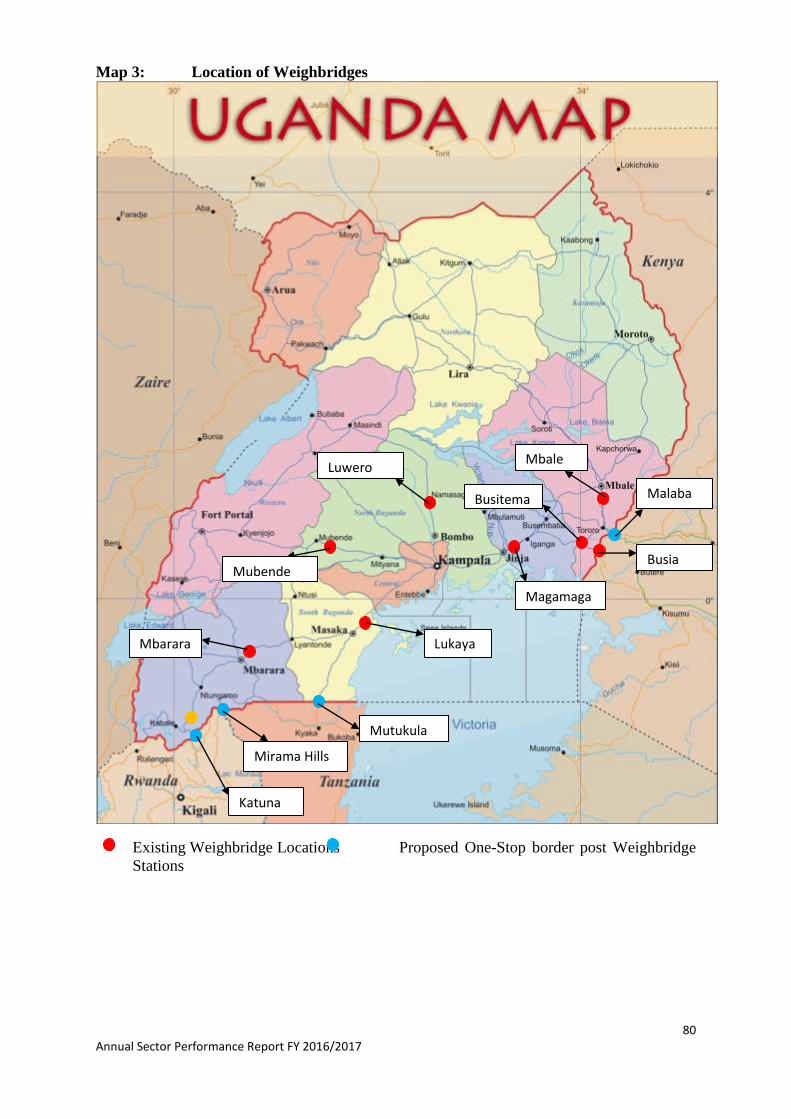
80 Annual Sector Performance Report FY 2016/2017
Map 3: Location of Weighbridges
- Existing Weighbridge Locations Proposed One-Stop border post Weighbridge
Stations
Lukaya
Mubende
Luwero
Magamaga
Mbale
Malaba
Busia
Mutukula
Mirama Hills
Mbarara
Katuna
Busitema
81 Annual Sector Performance Report FY 2016/2017
7.8 Challenges
i) Inadequate funding for road maintenance which continues to downgrade the level of
service for our road network;
ii) The unreleased budget (UGX 289 billion) affects our ability to meet our obligation to
pay service providers as well as inability to complete our workplans for both development
and maintenance activities perennially. This, not only compromises the quality of our service
delivery, but also results in many businesses of the private sector severely suffering from the
consequences of the delayed payment;
iii) The suspension of financing by the World Bank meant that UNRA had to scale down
on the GoU financed road development commitments to enable the Kyenjojo-Kabwoya road
project to proceed. The continued suspension also affected our budget absorption on
externally financed programmes;
iv) Despite the budget constraints and the over-commitment, the requests and pressure to
commence construction of new roads continues without funding remains a challenge. At the
moment we have over 2,000km that are on the unfunded priority list without the
commensurate increase in the budget.
v) Procurement process has mainly suffered from administrative reviews. For example the
procurement for the upgrading of the Rukungiri-Kihihi-Ishaha/Kanungu project, which had
over-delayed and was cancelled. The decision to cancel the procurement was made to curtail
the excessive disruptions caused by undue administrative reviews and the possible
interference in the procurement process which was observed.
Interference in the Procurement process by outside lobbyists continues to be a serious
problem. This is disruptive and affects the timely completion and the quality of the outcomes
of our procurements.
vi) The continued encroachment on the road reserve and the increasing illegal roadside
activities continues to undermine the functionality of the road network, and hence reduce the
safety and level of service of the roads;
vii) Contract implementation continues to suffer from poor contract performance. Many
of our contracts have suffered slow progress. Ongoing development and maintenance
contracts were terminated in the year.
viii) Although UNRA has made significant strides in improving the Management of Social
Safeguards, we have continued to register some cases of poor treatment of workers on site
and child abuse. UNRA continues to work tirelessly to ensure that implementation of projects
leaves as little as possible negative effect on the communities
ix) Corruption is still a challenge especially at the weighbridges. In collaboration with the
UNRA Investigations and Compliance Team, all corruption cases are investigated thoroughly
and the involved staff are dealt with accordingly.
x) Maintenance Stations are operating old equipment which is at more than 50% below
the desired capacity. This inhibits teams’ ability to manage cut-offs during emergencies.
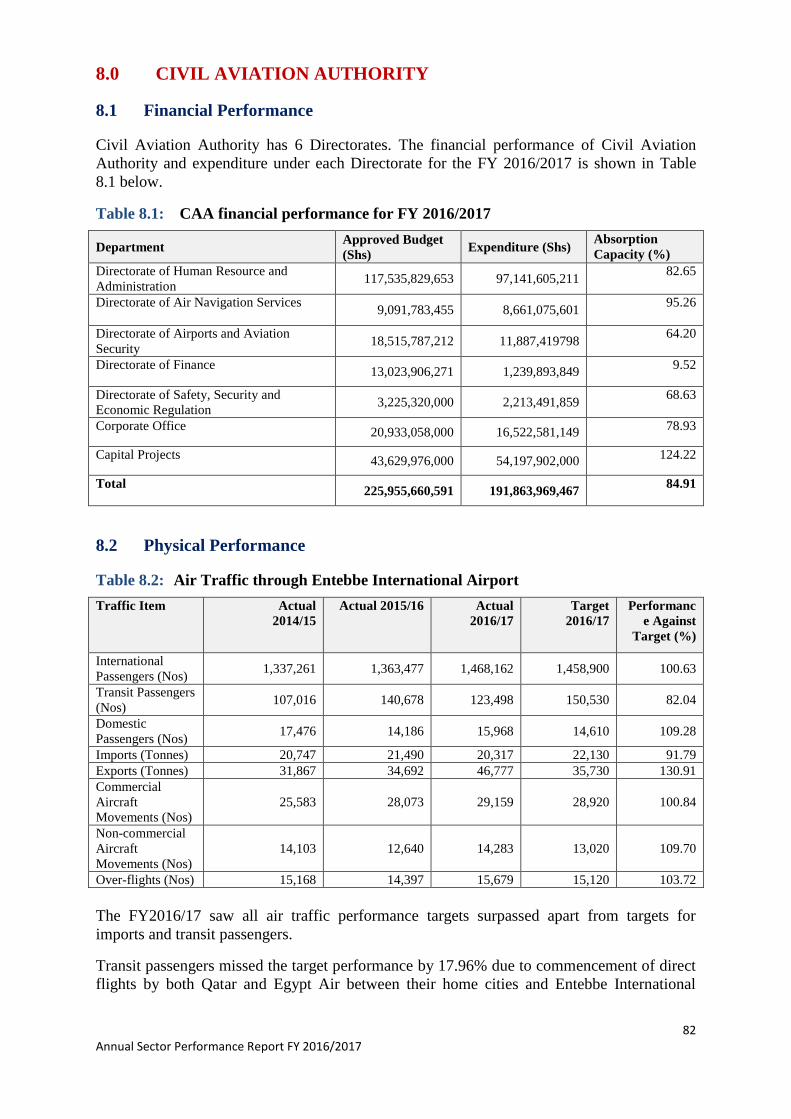
82 Annual Sector Performance Report FY 2016/2017
8.0 CIVIL AVIATION AUTHORITY
8.1 Financial Performance
Civil Aviation Authority has 6 Directorates. The financial performance of Civil Aviation
Authority and expenditure under each Directorate for the FY 2016/2017 is shown in Table
8.1 below.
Table 8.1: CAA financial performance for FY 2016/2017
Department Approved Budget
(Shs) Expenditure (Shs)
Absorption
Capacity (%)
Directorate of Human Resource and
Administration 117,535,829,653 97,141,605,211
82.65
Directorate of Air Navigation Services 9,091,783,455 8,661,075,601
95.26
Directorate of Airports and Aviation
Security 18,515,787,212 11,887,419798
64.20
Directorate of Finance 13,023,906,271 1,239,893,849
9.52
Directorate of Safety, Security and
Economic Regulation 3,225,320,000 2,213,491,859
68.63
Corporate Office 20,933,058,000 16,522,581,149
78.93
Capital Projects 43,629,976,000 54,197,902,000
124.22
Total 225,955,660,591 191,863,969,467
84.91
8.2 Physical Performance
Table 8.2: Air Traffic through Entebbe International Airport
Traffic Item Actual
2014/15
Actual 2015/16 Actual
2016/17
Target
2016/17
Performanc
e Against
Target (%)
International
Passengers (Nos) 1,337,261 1,363,477 1,468,162 1,458,900 100.63
Transit Passengers
(Nos) 107,016 140,678 123,498 150,530 82.04
Domestic
Passengers (Nos) 17,476 14,186 15,968 14,610 109.28
Imports (Tonnes) 20,747 21,490 20,317 22,130 91.79
Exports (Tonnes) 31,867 34,692 46,777 35,730 130.91
Commercial
Aircraft
Movements (Nos)
25,583 28,073 29,159 28,920 100.84
Non-commercial
Aircraft
Movements (Nos)
14,103 12,640 14,283 13,020 109.70
Over-flights (Nos) 15,168 14,397 15,679 15,120 103.72
The FY2016/17 saw all air traffic performance targets surpassed apart from targets for
imports and transit passengers.
Transit passengers missed the target performance by 17.96% due to commencement of direct
flights by both Qatar and Egypt Air between their home cities and Entebbe International
83 Annual Sector Performance Report FY 2016/2017
Airport (Previously Qatar and Egypt Air were transiting through Entebbe to Kigali and
Nairobi respectively).
Imports by air performed below target by 8.21% due to unfavourable exchange rates for the
major foreign currencies, especially the United States Dollar.
On the other hand exports performed well above the target by 30.91% due to the increase in
relief supplies to Juba (South Sudan) by the UN.
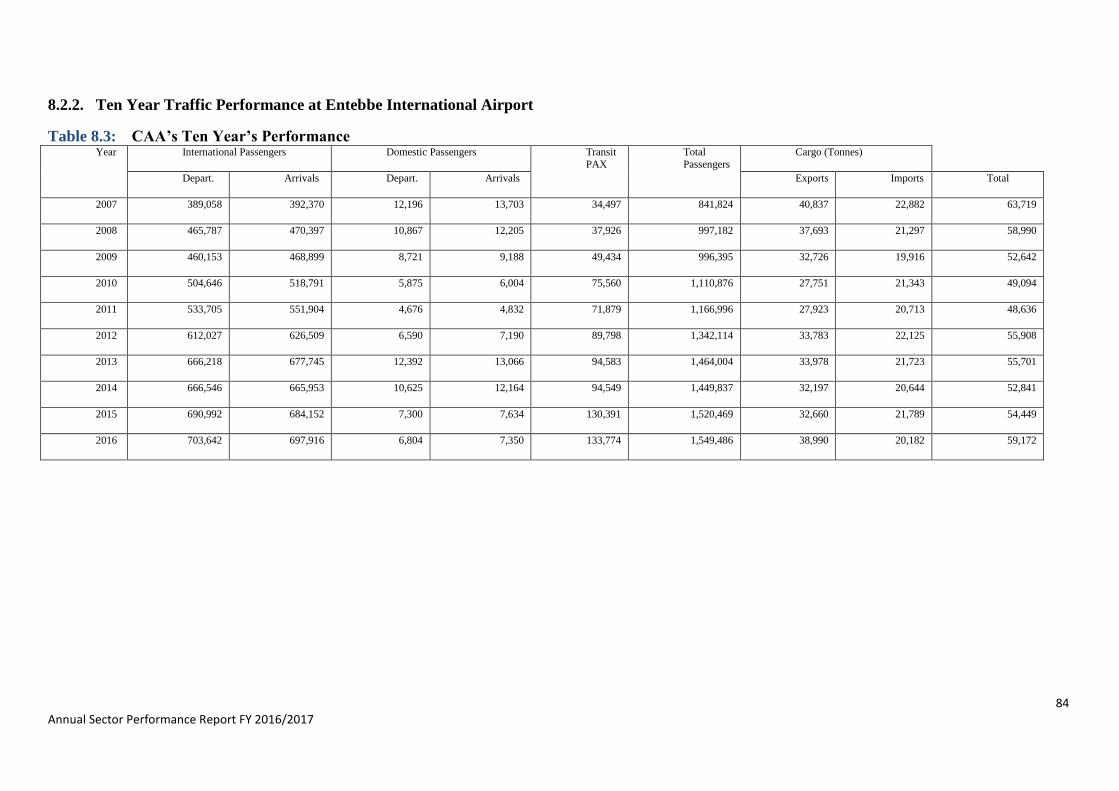
84 Annual Sector Performance Report FY 2016/2017
8.2.2. Ten Year Traffic Performance at Entebbe International Airport
Table 8.3: CAA’s Ten Year’s Performance Year International Passengers Domestic Passengers Transit
PAX
Total
Passengers
Cargo (Tonnes)
Depart. Arrivals Depart. Arrivals Exports Imports Total
2007 389,058 392,370 12,196 13,703 34,497 841,824 40,837 22,882 63,719
2008 465,787 470,397 10,867 12,205 37,926 997,182 37,693 21,297 58,990
2009 460,153 468,899 8,721 9,188 49,434 996,395 32,726 19,916 52,642
2010 504,646 518,791 5,875 6,004 75,560 1,110,876 27,751 21,343 49,094
2011 533,705 551,904 4,676 4,832 71,879 1,166,996 27,923 20,713 48,636
2012 612,027 626,509 6,590 7,190 89,798 1,342,114 33,783 22,125 55,908
2013 666,218 677,745 12,392 13,066 94,583 1,464,004 33,978 21,723 55,701
2014 666,546 665,953 10,625 12,164 94,549 1,449,837 32,197 20,644 52,841
2015 690,992 684,152 7,300 7,634 130,391 1,520,469 32,660 21,789 54,449
2016 703,642 697,916 6,804 7,350 133,774 1,549,486 38,990 20,182 59,172
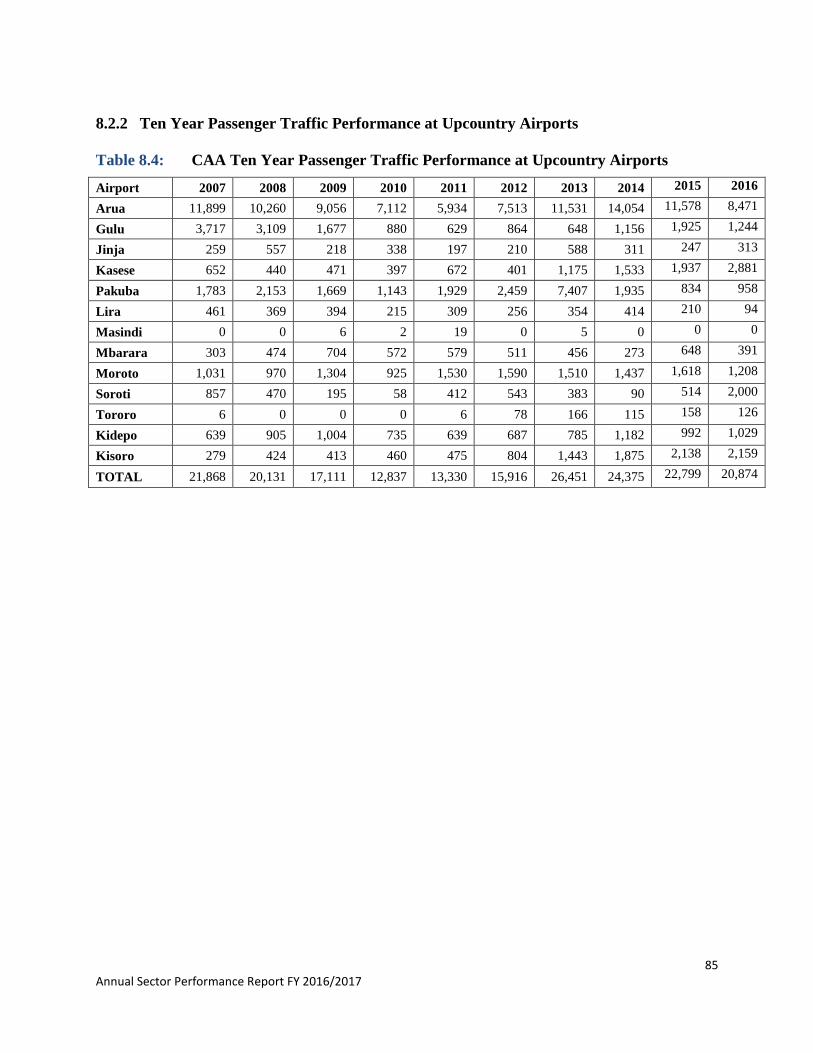
85 Annual Sector Performance Report FY 2016/2017
8.2.2 Ten Year Passenger Traffic Performance at Upcountry Airports
Table 8.4: CAA Ten Year Passenger Traffic Performance at Upcountry Airports
Airport 2007 2008 2009 2010 2011 2012 2013 2014 2015 2016
Arua 11,899 10,260 9,056 7,112 5,934 7,513 11,531 14,054 11,578 8,471
Gulu 3,717 3,109 1,677 880 629 864 648 1,156 1,925 1,244
Jinja 259 557 218 338 197 210 588 311 247 313
Kasese 652 440 471 397 672 401 1,175 1,533 1,937 2,881
Pakuba 1,783 2,153 1,669 1,143 1,929 2,459 7,407 1,935 834 958
Lira 461 369 394 215 309 256 354 414 210 94
Masindi 0 0 6 2 19 0 5 0 0 0
Mbarara 303 474 704 572 579 511 456 273 648 391
Moroto 1,031 970 1,304 925 1,530 1,590 1,510 1,437 1,618 1,208
Soroti 857 470 195 58 412 543 383 90 514 2,000
Tororo 6 0 0 0 6 78 166 115 158 126
Kidepo 639 905 1,004 735 639 687 785 1,182 992 1,029
Kisoro 279 424 413 460 475 804 1,443 1,875 2,138 2,159
TOTAL 21,868 20,131 17,111 12,837 13,330 15,916 26,451 24,375 22,799 20,874
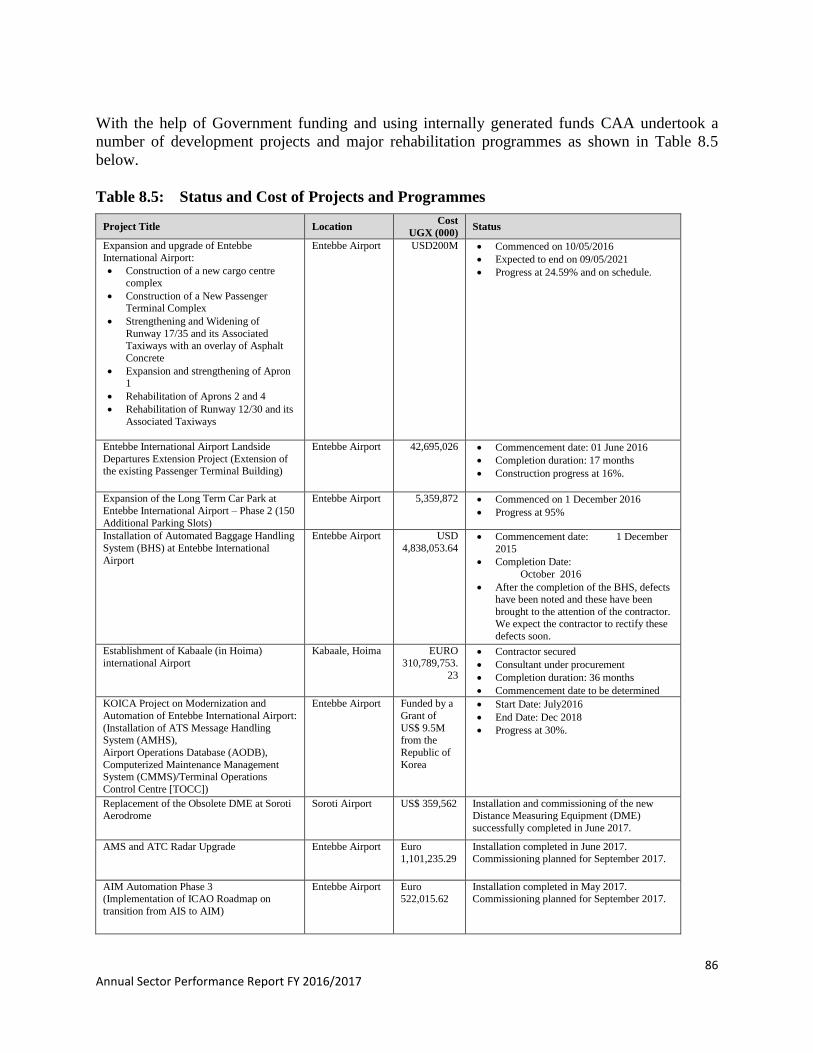
86 Annual Sector Performance Report FY 2016/2017
With the help of Government funding and using internally generated funds CAA undertook a
number of development projects and major rehabilitation programmes as shown in Table 8.5
below.
Table 8.5: Status and Cost of Projects and Programmes
Project Title Location Cost
UGX (000) Status
Expansion and upgrade of Entebbe International Airport:
Construction of a new cargo centre complex
Construction of a New Passenger Terminal Complex
Strengthening and Widening of
Runway 17/35 and its Associated
Taxiways with an overlay of Asphalt
Concrete
Expansion and strengthening of Apron 1
Rehabilitation of Aprons 2 and 4
Rehabilitation of Runway 12/30 and its
Associated Taxiways
Entebbe Airport USD200M Commenced on 10/05/2016
Expected to end on 09/05/2021
Progress at 24.59% and on schedule.
Entebbe International Airport Landside
Departures Extension Project (Extension of the existing Passenger Terminal Building)
Entebbe Airport 42,695,026 Commencement date: 01 June 2016
Completion duration: 17 months
Construction progress at 16%.
Expansion of the Long Term Car Park at
Entebbe International Airport – Phase 2 (150
Additional Parking Slots)
Entebbe Airport 5,359,872 Commenced on 1 December 2016
Progress at 95%
Installation of Automated Baggage Handling
System (BHS) at Entebbe International
Airport
Entebbe Airport USD
4,838,053.64 Commencement date: 1 December
2015
Completion Date:
October 2016
After the completion of the BHS, defects have been noted and these have been
brought to the attention of the contractor. We expect the contractor to rectify these
defects soon.
Establishment of Kabaale (in Hoima)
international Airport
Kabaale, Hoima EURO
310,789,753.
23
Contractor secured
Consultant under procurement
Completion duration: 36 months
Commencement date to be determined
KOICA Project on Modernization and
Automation of Entebbe International Airport:
(Installation of ATS Message Handling System (AMHS),
Airport Operations Database (AODB),
Computerized Maintenance Management System (CMMS)/Terminal Operations
Control Centre [TOCC])
Entebbe Airport Funded by a
Grant of
US$ 9.5M from the
Republic of
Korea
Start Date: July2016
End Date: Dec 2018
Progress at 30%.
Replacement of the Obsolete DME at Soroti Aerodrome
Soroti Airport US$ 359,562 Installation and commissioning of the new Distance Measuring Equipment (DME)
successfully completed in June 2017.
AMS and ATC Radar Upgrade Entebbe Airport Euro 1,101,235.29
Installation completed in June 2017. Commissioning planned for September 2017.
AIM Automation Phase 3 (Implementation of ICAO Roadmap on
transition from AIS to AIM)
Entebbe Airport Euro 522,015.62
Installation completed in May 2017. Commissioning planned for September 2017.
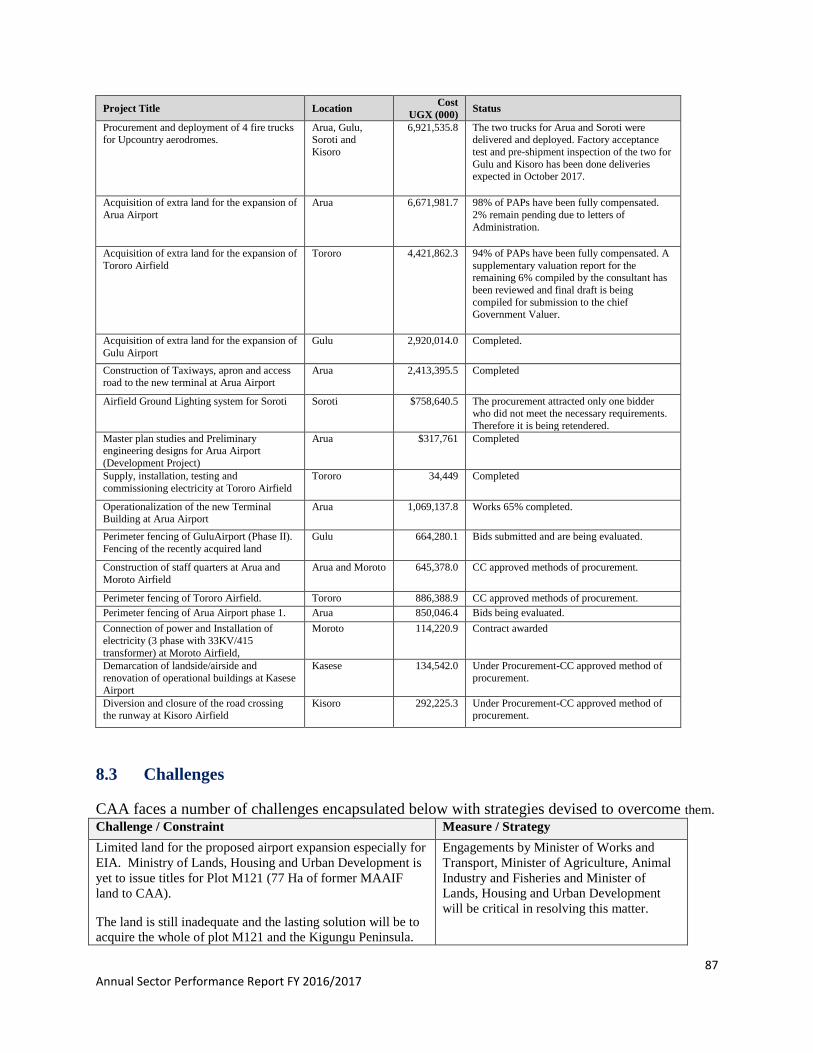
87 Annual Sector Performance Report FY 2016/2017
Project Title Location Cost
UGX (000) Status
Procurement and deployment of 4 fire trucks for Upcountry aerodromes.
Arua, Gulu, Soroti and
Kisoro
6,921,535.8 The two trucks for Arua and Soroti were delivered and deployed. Factory acceptance
test and pre-shipment inspection of the two for
Gulu and Kisoro has been done deliveries expected in October 2017.
Acquisition of extra land for the expansion of
Arua Airport
Arua 6,671,981.7 98% of PAPs have been fully compensated.
2% remain pending due to letters of
Administration.
Acquisition of extra land for the expansion of
Tororo Airfield
Tororo 4,421,862.3 94% of PAPs have been fully compensated. A
supplementary valuation report for the remaining 6% compiled by the consultant has
been reviewed and final draft is being
compiled for submission to the chief Government Valuer.
Acquisition of extra land for the expansion of
Gulu Airport
Gulu 2,920,014.0 Completed.
Construction of Taxiways, apron and access road to the new terminal at Arua Airport
Arua 2,413,395.5 Completed
Airfield Ground Lighting system for Soroti Soroti $758,640.5 The procurement attracted only one bidder who did not meet the necessary requirements.
Therefore it is being retendered.
Master plan studies and Preliminary engineering designs for Arua Airport
(Development Project)
Arua $317,761 Completed
Supply, installation, testing and
commissioning electricity at Tororo Airfield
Tororo 34,449 Completed
Operationalization of the new Terminal Building at Arua Airport
Arua 1,069,137.8 Works 65% completed.
Perimeter fencing of GuluAirport (Phase II).
Fencing of the recently acquired land
Gulu 664,280.1 Bids submitted and are being evaluated.
Construction of staff quarters at Arua and
Moroto Airfield
Arua and Moroto 645,378.0 CC approved methods of procurement.
Perimeter fencing of Tororo Airfield. Tororo 886,388.9 CC approved methods of procurement.
Perimeter fencing of Arua Airport phase 1. Arua 850,046.4 Bids being evaluated.
Connection of power and Installation of
electricity (3 phase with 33KV/415
transformer) at Moroto Airfield,
Moroto 114,220.9 Contract awarded
Demarcation of landside/airside and
renovation of operational buildings at Kasese
Airport
Kasese 134,542.0 Under Procurement-CC approved method of
procurement.
Diversion and closure of the road crossing the runway at Kisoro Airfield
Kisoro 292,225.3 Under Procurement-CC approved method of procurement.
8.3 Challenges
CAA faces a number of challenges encapsulated below with strategies devised to overcome them.
Challenge / Constraint Measure / Strategy
Limited land for the proposed airport expansion especially for
EIA. Ministry of Lands, Housing and Urban Development is
yet to issue titles for Plot M121 (77 Ha of former MAAIF
land to CAA).
The land is still inadequate and the lasting solution will be to
acquire the whole of plot M121 and the Kigungu Peninsula.
Engagements by Minister of Works and
Transport, Minister of Agriculture, Animal
Industry and Fisheries and Minister of
Lands, Housing and Urban Development
will be critical in resolving this matter.
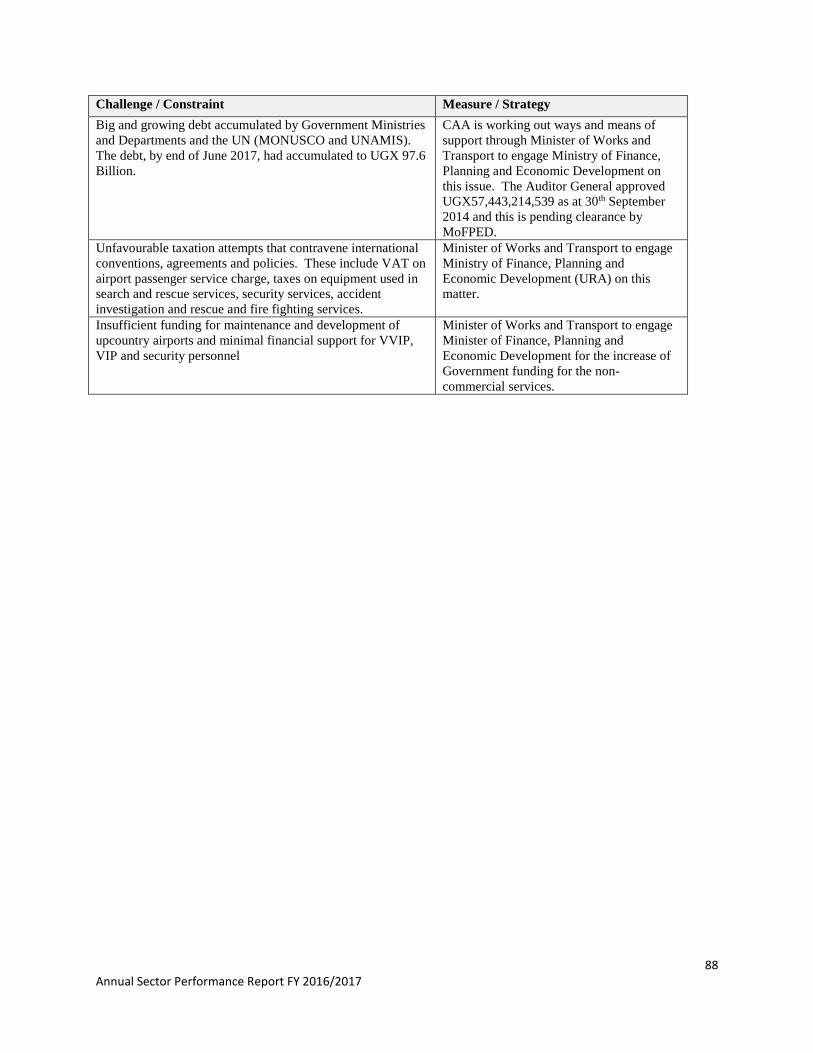
88 Annual Sector Performance Report FY 2016/2017
Challenge / Constraint Measure / Strategy
Big and growing debt accumulated by Government Ministries
and Departments and the UN (MONUSCO and UNAMIS).
The debt, by end of June 2017, had accumulated to UGX 97.6
Billion.
CAA is working out ways and means of
support through Minister of Works and
Transport to engage Ministry of Finance,
Planning and Economic Development on
this issue. The Auditor General approved
UGX57,443,214,539 as at 30th September
2014 and this is pending clearance by
MoFPED.
Unfavourable taxation attempts that contravene international
conventions, agreements and policies. These include VAT on
airport passenger service charge, taxes on equipment used in
search and rescue services, security services, accident
investigation and rescue and fire fighting services.
Minister of Works and Transport to engage
Ministry of Finance, Planning and
Economic Development (URA) on this
matter.
Insufficient funding for maintenance and development of
upcountry airports and minimal financial support for VVIP,
VIP and security personnel
Minister of Works and Transport to engage
Minister of Finance, Planning and
Economic Development for the increase of
Government funding for the non-
commercial services.
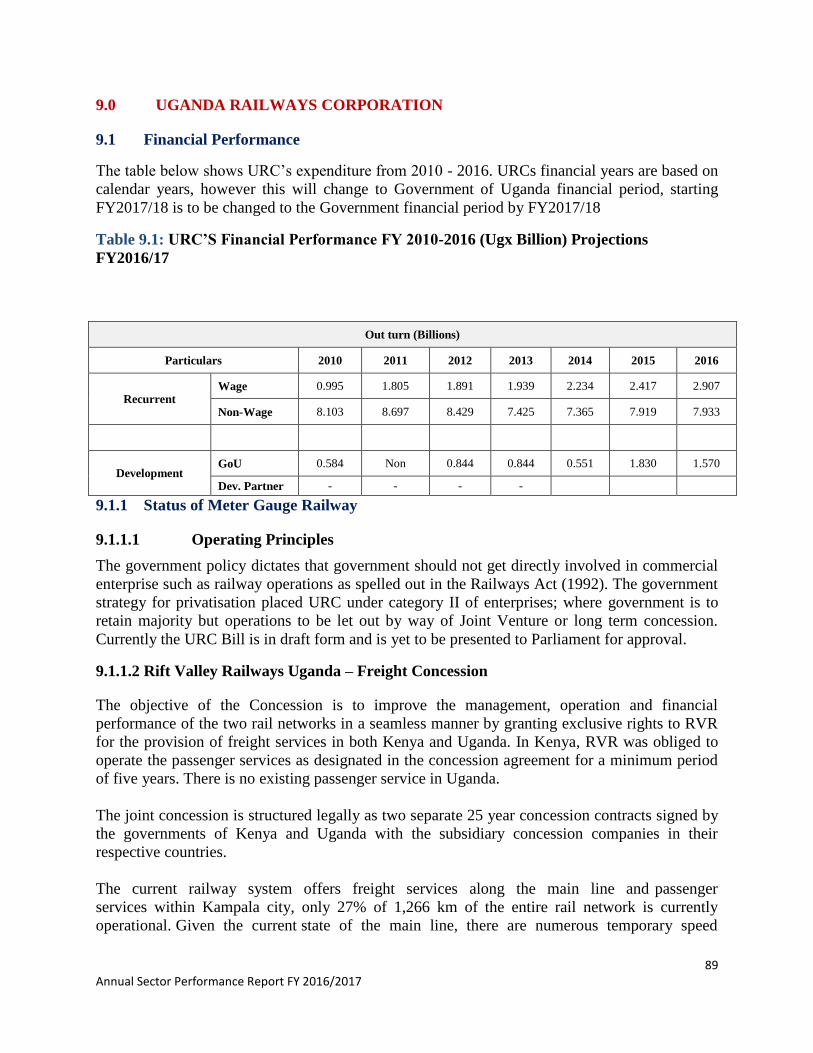
89 Annual Sector Performance Report FY 2016/2017
9.0 UGANDA RAILWAYS CORPORATION
9.1 Financial Performance
The table below shows URC’s expenditure from 2010 - 2016. URCs financial years are based on
calendar years, however this will change to Government of Uganda financial period, starting
FY2017/18 is to be changed to the Government financial period by FY2017/18
Table 9.1: URC’S Financial Performance FY 2010-2016 (Ugx Billion) Projections
FY2016/17
9.1.1 Status of Meter Gauge Railway
9.1.1.1 Operating Principles
The government policy dictates that government should not get directly involved in commercial
enterprise such as railway operations as spelled out in the Railways Act (1992). The government
strategy for privatisation placed URC under category II of enterprises; where government is to
retain majority but operations to be let out by way of Joint Venture or long term concession.
Currently the URC Bill is in draft form and is yet to be presented to Parliament for approval.
9.1.1.2 Rift Valley Railways Uganda – Freight Concession
The objective of the Concession is to improve the management, operation and financial
performance of the two rail networks in a seamless manner by granting exclusive rights to RVR
for the provision of freight services in both Kenya and Uganda. In Kenya, RVR was obliged to
operate the passenger services as designated in the concession agreement for a minimum period
of five years. There is no existing passenger service in Uganda.
The joint concession is structured legally as two separate 25 year concession contracts signed by
the governments of Kenya and Uganda with the subsidiary concession companies in their
respective countries.
The current railway system offers freight services along the main line and passenger
services within Kampala city, only 27% of 1,266 km of the entire rail network is currently
operational. Given the current state of the main line, there are numerous temporary speed
Out turn (Billions)
Particulars 2010 2011 2012 2013 2014 2015 2016
Recurrent Wage 0.995 1.805 1.891 1.939 2.234 2.417 2.907
Non-Wage 8.103 8.697 8.429 7.425 7.365 7.919 7.933
Development GoU 0.584 Non 0.844 0.844 0.551 1.830 1.570
Dev. Partner - - - -
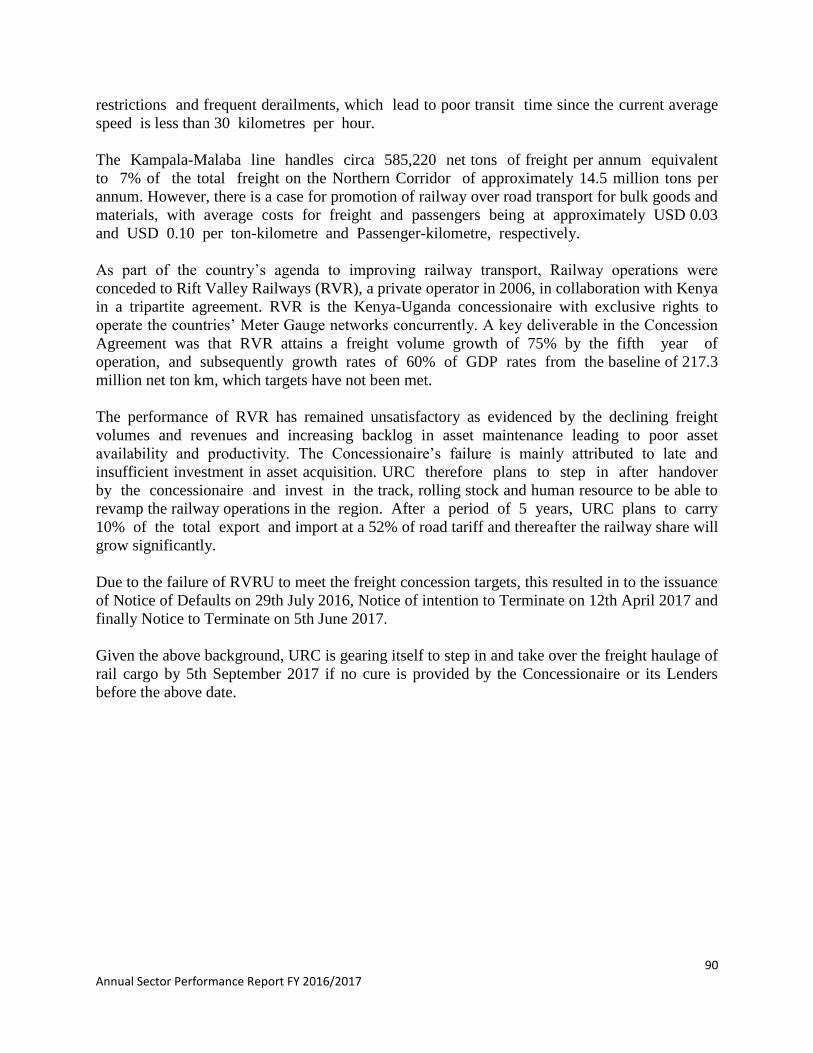
90 Annual Sector Performance Report FY 2016/2017
restrictions and frequent derailments, which lead to poor transit time since the current average
speed is less than 30 kilometres per hour.
The Kampala-Malaba line handles circa 585,220 net tons of freight per annum equivalent
to 7% of the total freight on the Northern Corridor of approximately 14.5 million tons per
annum. However, there is a case for promotion of railway over road transport for bulk goods and
materials, with average costs for freight and passengers being at approximately USD 0.03
and USD 0.10 per ton-kilometre and Passenger-kilometre, respectively.
As part of the country’s agenda to improving railway transport, Railway operations were
conceded to Rift Valley Railways (RVR), a private operator in 2006, in collaboration with Kenya
in a tripartite agreement. RVR is the Kenya-Uganda concessionaire with exclusive rights to
operate the countries’ Meter Gauge networks concurrently. A key deliverable in the Concession
Agreement was that RVR attains a freight volume growth of 75% by the fifth year of
operation, and subsequently growth rates of 60% of GDP rates from the baseline of 217.3
million net ton km, which targets have not been met.
The performance of RVR has remained unsatisfactory as evidenced by the declining freight
volumes and revenues and increasing backlog in asset maintenance leading to poor asset
availability and productivity. The Concessionaire’s failure is mainly attributed to late and
insufficient investment in asset acquisition. URC therefore plans to step in after handover
by the concessionaire and invest in the track, rolling stock and human resource to be able to
revamp the railway operations in the region. After a period of 5 years, URC plans to carry
10% of the total export and import at a 52% of road tariff and thereafter the railway share will
grow significantly.
Due to the failure of RVRU to meet the freight concession targets, this resulted in to the issuance
of Notice of Defaults on 29th July 2016, Notice of intention to Terminate on 12th April 2017 and
finally Notice to Terminate on 5th June 2017.
Given the above background, URC is gearing itself to step in and take over the freight haulage of
rail cargo by 5th September 2017 if no cure is provided by the Concessionaire or its Lenders
before the above date.
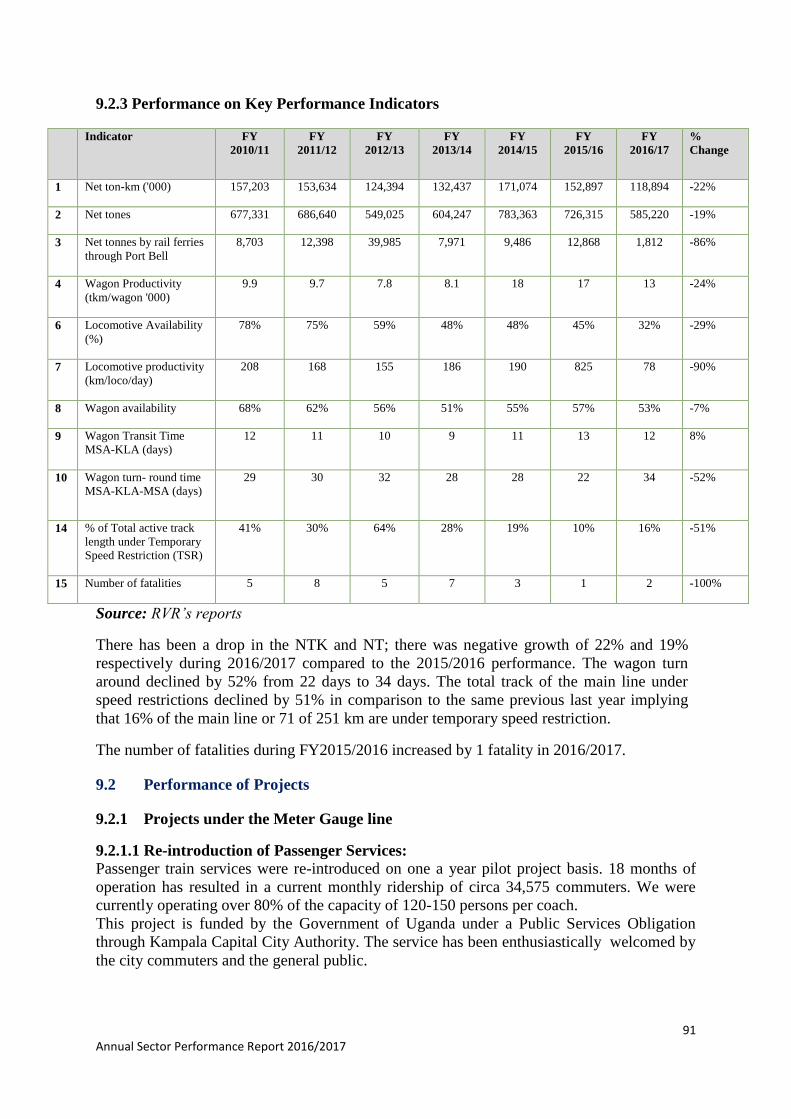
91 Annual Sector Performance Report 2016/2017
9.2.3 Performance on Key Performance Indicators
Indicator FY
2010/11
FY
2011/12
FY
2012/13
FY
2013/14
FY
2014/15
FY
2015/16
FY
2016/17
%
Change
1 Net ton-km ('000) 157,203 153,634 124,394 132,437 171,074 152,897 118,894 -22%
2 Net tones 677,331 686,640 549,025 604,247 783,363 726,315 585,220 -19%
3 Net tonnes by rail ferries
through Port Bell
8,703 12,398 39,985 7,971 9,486 12,868 1,812 -86%
4 Wagon Productivity
(tkm/wagon '000)
9.9 9.7 7.8 8.1 18 17 13 -24%
6 Locomotive Availability
(%)
78% 75% 59% 48% 48% 45% 32% -29%
7 Locomotive productivity
(km/loco/day)
208 168 155 186 190 825 78 -90%
8 Wagon availability 68% 62% 56% 51% 55% 57% 53% -7%
9 Wagon Transit Time
MSA-KLA (days)
12 11 10 9 11 13 12 8%
10 Wagon turn- round time
MSA-KLA-MSA (days)
29 30 32 28 28 22 34 -52%
14 % of Total active track
length under Temporary
Speed Restriction (TSR)
41% 30% 64% 28% 19% 10% 16% -51%
15 Number of fatalities 5 8 5 7 3 1 2 -100%
Source: RVR’s reports
There has been a drop in the NTK and NT; there was negative growth of 22% and 19%
respectively during 2016/2017 compared to the 2015/2016 performance. The wagon turn
around declined by 52% from 22 days to 34 days. The total track of the main line under
speed restrictions declined by 51% in comparison to the same previous last year implying
that 16% of the main line or 71 of 251 km are under temporary speed restriction.
The number of fatalities during FY2015/2016 increased by 1 fatality in 2016/2017.
9.2 Performance of Projects
9.2.1 Projects under the Meter Gauge line
9.2.1.1 Re-introduction of Passenger Services: Passenger train services were re-introduced on one a year pilot project basis. 18 months of
operation has resulted in a current monthly ridership of circa 34,575 commuters. We were
currently operating over 80% of the capacity of 120-150 persons per coach.
This project is funded by the Government of Uganda under a Public Services Obligation
through Kampala Capital City Authority. The service has been enthusiastically welcomed by
the city commuters and the general public.
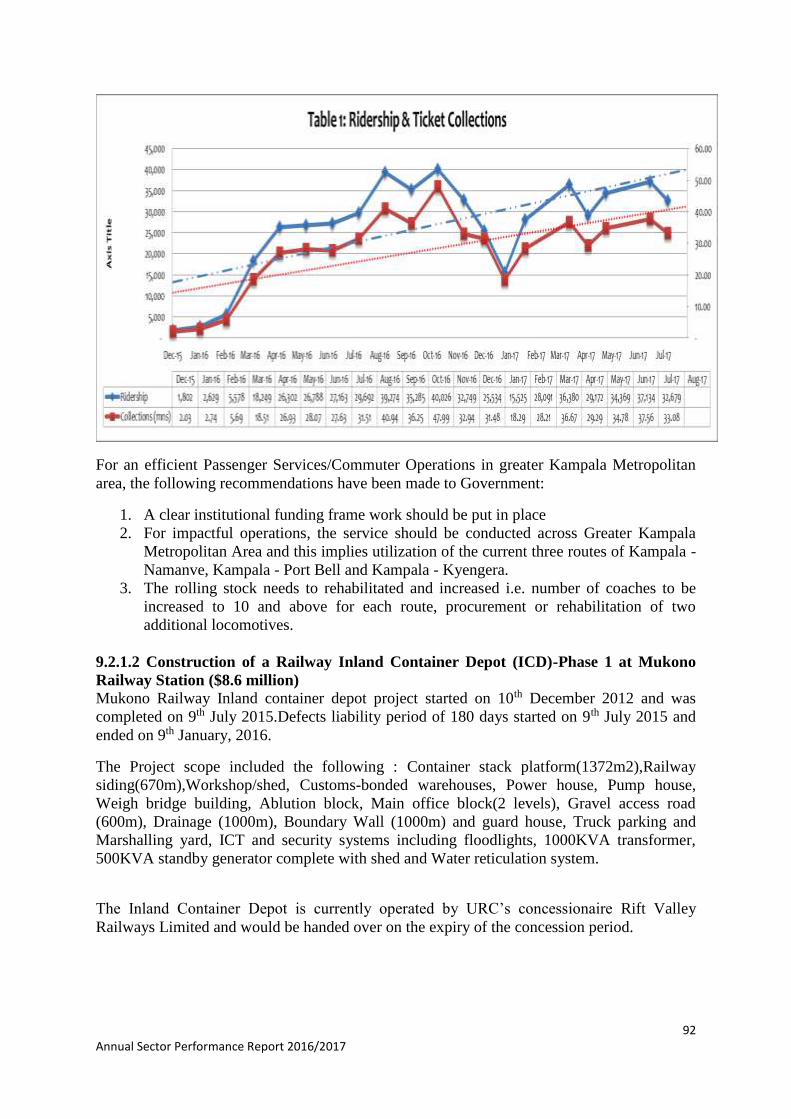
92 Annual Sector Performance Report 2016/2017
For an efficient Passenger Services/Commuter Operations in greater Kampala Metropolitan
area, the following recommendations have been made to Government:
1. A clear institutional funding frame work should be put in place
2. For impactful operations, the service should be conducted across Greater Kampala
Metropolitan Area and this implies utilization of the current three routes of Kampala -
Namanve, Kampala - Port Bell and Kampala - Kyengera.
3. The rolling stock needs to rehabilitated and increased i.e. number of coaches to be
increased to 10 and above for each route, procurement or rehabilitation of two
additional locomotives.
9.2.1.2 Construction of a Railway Inland Container Depot (ICD)-Phase 1 at Mukono
Railway Station ($8.6 million)
Mukono Railway Inland container depot project started on 10th December 2012 and was
completed on 9th July 2015.Defects liability period of 180 days started on 9th July 2015 and
ended on 9th January, 2016.
The Project scope included the following : Container stack platform(1372m2),Railway
siding(670m),Workshop/shed, Customs-bonded warehouses, Power house, Pump house,
Weigh bridge building, Ablution block, Main office block(2 levels), Gravel access road
(600m), Drainage (1000m), Boundary Wall (1000m) and guard house, Truck parking and
Marshalling yard, ICT and security systems including floodlights, 1000KVA transformer,
500KVA standby generator complete with shed and Water reticulation system.
The Inland Container Depot is currently operated by URC’s concessionaire Rift Valley
Railways Limited and would be handed over on the expiry of the concession period.
93 Annual Sector Performance Report 2016/2017
9.2.1.3 Construction of Logistics hub facility at Gulu Railway station
Trade Mark East Africa Ltd (TMEA) has conceived the development of a logistics hub in the
Gulu area and is willing to finance a substantial part of the required infrastructure works.
Gulu railway station has been chosen as a possible site for the facility.
Boundary opening and topographic survey for the proposed Gulu Logistics hub was
completed by a joint team from URC and Ministry of Works and Transport.
TMEA commissioned a consultant, the Africa Economic and Social Development Consultant
(AESDC) to carry out a pre-feasibility study for the project. A draft report was submitted on
11th July 2016.
TMEA procured a design and supervision consultant for the development of Gulu logistics
hub. Technical and financial evaluation was done from 3rd-7th April 2017 at Sheraton Hotel.
Currently the project Management team composed of URC, Ministry of Works and TMEA is
analysing the due diligence report about the best bidder so that design and supervision of the
project is initiated.
Based on the five-year projection of cargo the consultant estimated the cargo that can be
allocated to the logistics hub as equal to 30,619 TEU per annum in five years (by 2021), and
that the facility required would cost USD 18,284,015.
The project sponsors have indicated that they have secured an initial budget of USD 3
million to invest in this project. The consultant proposed that this budget be used to setup the
initial critical infrastructure that is limited to:
Container Yard
Container Freight Station
Vehicle-holding area and traffic flows
Administration building
Perimeter wall
Upgrade of Access Roads
Security gate and guardhouse
Upgrade of utilities i.e. electricity, drainage, water treatment and sewerage
The above infrastructure will constitute the first step in the establishment of a freight centre
that will include an Inland Container Depot (ICD) and a Warehousing Complex. The
government will build the ICD complex with the support of TMEA at a cost of 3 million
USD. Part of the land set aside for the development of the logistics hub shall be dedicated for
setting up of a Warehousing Complex where private sector shall be invited to build
warehouses. Together, the ICD, the Warehousing Complex will form the nucleus for an
agglomeration economy derived from concentration of logistics in Gulu.
9.2.1.4 Rehabilitation of the Tororo – Pakwach route:
The EU earmarked €20mn for the rehabilitation of the Tororo–Gulu railway line. The
Government of Uganda will meet the cost of compensating and relocating PAPs and
upgrading of level crossings of €1mn.This project (rehabilitation of Tororo–Gulu railway
line) is complementary to the construction of the Gulu Logistic Hub; for which the EU has
secured €5mn (USD5.7mn) and Trade Mark East Africa USD3mn.
94 Annual Sector Performance Report 2016/2017
Consultancy services for Detailed Engineering Design by M/S PLANET S.A commenced on
January 9, 2017 and are in progress expected to be completed by 30th September 2017.
M/S. Planet S.A retained the services of M/S. JBN Consults and Planners Ltd a local firm to
conduct a review and update of RAP component of the Feasibility Study. The RAP study will
guide the process of compensation and relocation of project affected persons (PAPs) within a
corridor of 30m. The field exercise commenced in June 2017 and final report to CGV is
expected end of August 2017.
9.2.1.5 Opening of the Southern Route - Port railway line, Port Bell warehouses and
Jinja pier line
Tanzania Ports Authority (TPA) & Tanzania Railways Limited (TRL) with Uganda Railways
Corporation agreed on a plan to open the southern route to Tanzania through Port-bell and
Jinja pier. TPA and TRL visited Uganda on 14th July 2017 to finalise on the requirements to
open up the southern route to Tanzania.
9.2.1.5.1 Port Bell
The following sections were considered for urgent repair in a meeting held at Port Bell
between URC, TPA and TRL.
Renovation of warehouses and other structures
Construction of container stack platform
Construction of Verification shed
Repair of the existing Port Bell railway line (9Km) including the link span
9.3.1.5.2 Jinja pier
The following was considered for urgent repair - construction of 1.7km railway line linking
to the pier. The railway line which existed was vandalised. The construction will be done on
an existing formation.
The URC Civil department provided the required bills of quantities for repair of the lines to
TRL and costs for renovation of Port Bell warehouses to Tanzania Ports Authority. The costs
also included labour and supervision estimates.
9.2.1.6 Marking of railway reserve boundary markers Phase II
This project was conceived to mitigate the increasing encroachment and illegal appropriation
of railway land because one of the major (reported) causes and/or excuses of the problem was
“not knowing” the exact extent of the railway reserves.
The contract for boundary markers phase II was signed on 19th April 2017.The
contractor(Broadway Engineering Services Limited) submitted the required documentations
to the client which included; performance security, advance guarantee, material test
certificates, laboratory results and samples of concrete beacons
Casting of concrete beacons is almost done, at 74% progress and the contractor has finished
installation of beacons along Bujuuko section which is about 10km.Boundary opening of the
remaining 54km is still in progress in preparation for beacon installation.
9.2.1.7 Rehabilitation of level crossing along Gulu-Olwiyo road
Plans to rehabilitate the two level crossings along Gulu-Olwiyo road are underway. Designs
drawings for the two level crossings were provided to UNRA.
95 Annual Sector Performance Report 2016/2017
The department was requested by UNRA to provide a list of three pre-qualified sub-
contractors with experience of railway works.
The seconded URC prequalified subcontractors handed in the filled bids to UNRA’s main
contractor in the presence of supervision consultant. Evaluation process was done, pending
approval from UNRA before an official communication is made to URC.
The road works on other section of the project are in progress except along the two railway
level crossing.
9.3 Challenges and Proposed Mitigation Measures
9.3.2 Management of Railway Freight haulage after the departure of RVRV
As URC gears itself to manage the freight haulage and given the limited time to expiry of the
concession, URC has developed a post concession business plan that has been approved by
the Board of Directors and presented to the Ministry of Works and Transport for approval.
The Business Plan requires Government financing of Ugx. 21 Billion for the FY2017/18 so
as to maintain freight operations and correct the deferred maintenance suffered under the
Concessionaire’s 11 years of operations of the conceded Assets especially the permanent
way, locomotives and rolling stock.
The business plan defines post concession operations, mechanisms to secure and operate
railway assets and financial resources required to implement the plan. In particular, URC has
constituted a Transition committee that includes all departments and standalone sections to
manage and monitor the transition process.
9.3.3 Repossesion of Conceded Assets
There is need to first of all secure the conceded assets that are in RVRU’s possession and
then secondly, verify the status of the conceded assets. The concession agreement stipulates
that RVRU will provide such assistance as is reasonably required to URC (including making
available for transfer any employees) in handing back the Conceded Assets to URC including
without limitation all updated data, files and software to a third party at the direction of URC
on the Termination Date. The challenge at hand is RVRU’s continued instance that there
were no concessionaire’s defaults. Since the Ugandan Concession is still within the
Concessionaire cure period, the date of termination is yet to be defined but in the meantime,
URC is complying the appropriate evidence of RVRU’s failures to meet the concession’s
targets and also has engaged the Solicitor General to advise on this process.
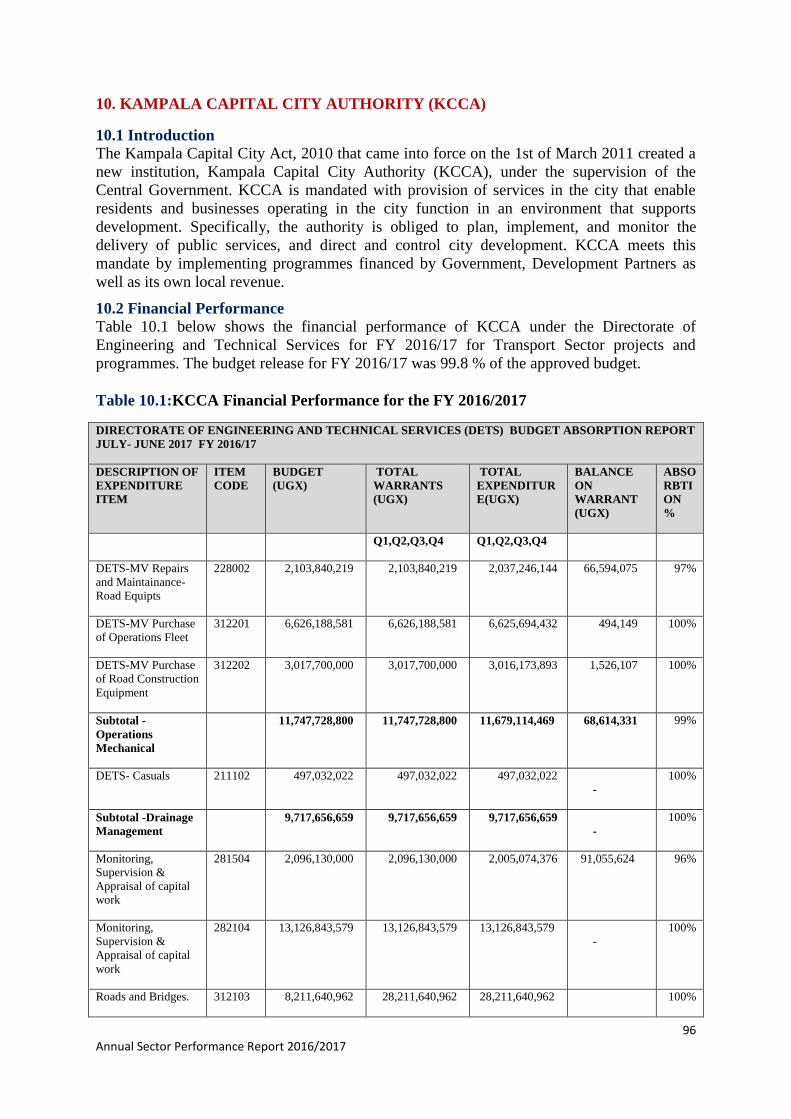
96 Annual Sector Performance Report 2016/2017
10. KAMPALA CAPITAL CITY AUTHORITY (KCCA)
10.1 Introduction The Kampala Capital City Act, 2010 that came into force on the 1st of March 2011 created a
new institution, Kampala Capital City Authority (KCCA), under the supervision of the
Central Government. KCCA is mandated with provision of services in the city that enable
residents and businesses operating in the city function in an environment that supports
development. Specifically, the authority is obliged to plan, implement, and monitor the
delivery of public services, and direct and control city development. KCCA meets this
mandate by implementing programmes financed by Government, Development Partners as
well as its own local revenue.
10.2 Financial Performance Table 10.1 below shows the financial performance of KCCA under the Directorate of
Engineering and Technical Services for FY 2016/17 for Transport Sector projects and
programmes. The budget release for FY 2016/17 was 99.8 % of the approved budget.
Table 10.1:KCCA Financial Performance for the FY 2016/2017
DIRECTORATE OF ENGINEERING AND TECHNICAL SERVICES (DETS) BUDGET ABSORPTION REPORT
JULY- JUNE 2017 FY 2016/17
DESCRIPTION OF
EXPENDITURE
ITEM
ITEM
CODE
BUDGET
(UGX)
TOTAL
WARRANTS
(UGX)
TOTAL
EXPENDITUR
E(UGX)
BALANCE
ON
WARRANT
(UGX)
ABSO
RBTI
ON
%
Q1,Q2,Q3,Q4 Q1,Q2,Q3,Q4
DETS-MV Repairs
and Maintainance-
Road Equipts
228002 2,103,840,219 2,103,840,219 2,037,246,144 66,594,075 97%
DETS-MV Purchase
of Operations Fleet
312201 6,626,188,581 6,626,188,581 6,625,694,432 494,149 100%
DETS-MV Purchase
of Road Construction
Equipment
312202 3,017,700,000 3,017,700,000 3,016,173,893 1,526,107 100%
Subtotal -
Operations
Mechanical
11,747,728,800 11,747,728,800 11,679,114,469 68,614,331 99%
DETS- Casuals 211102 497,032,022 497,032,022 497,032,022
-
100%
Subtotal -Drainage
Management
9,717,656,659 9,717,656,659 9,717,656,659
-
100%
Monitoring,
Supervision &
Appraisal of capital
work
281504 2,096,130,000 2,096,130,000 2,005,074,376 91,055,624 96%
Monitoring,
Supervision &
Appraisal of capital
work
282104 13,126,843,579 13,126,843,579 13,126,843,579
-
100%
Roads and Bridges. 312103 8,211,640,962 28,211,640,962 28,211,640,962 100%
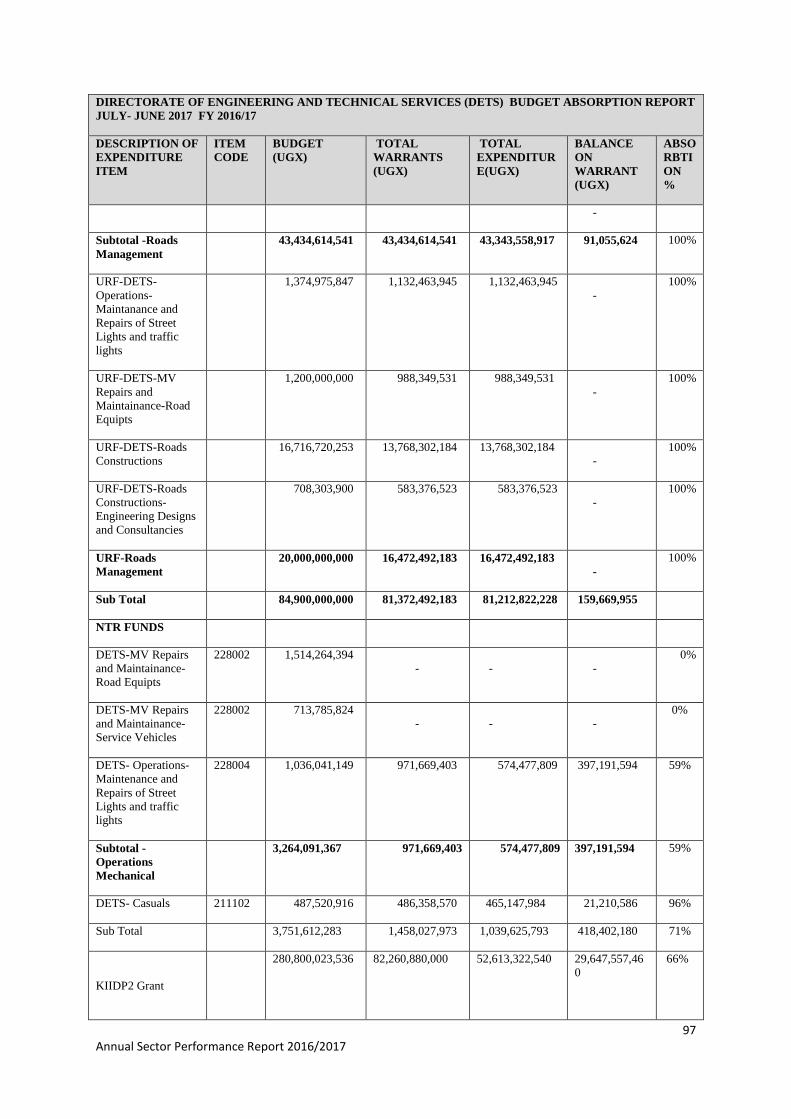
97 Annual Sector Performance Report 2016/2017
DIRECTORATE OF ENGINEERING AND TECHNICAL SERVICES (DETS) BUDGET ABSORPTION REPORT
JULY- JUNE 2017 FY 2016/17
DESCRIPTION OF
EXPENDITURE
ITEM
ITEM
CODE
BUDGET
(UGX)
TOTAL
WARRANTS
(UGX)
TOTAL
EXPENDITUR
E(UGX)
BALANCE
ON
WARRANT
(UGX)
ABSO
RBTI
ON
%
-
Subtotal -Roads
Management
43,434,614,541 43,434,614,541 43,343,558,917 91,055,624 100%
URF-DETS-
Operations-
Maintanance and
Repairs of Street
Lights and traffic
lights
1,374,975,847 1,132,463,945 1,132,463,945
-
100%
URF-DETS-MV
Repairs and
Maintainance-Road
Equipts
1,200,000,000 988,349,531 988,349,531
-
100%
URF-DETS-Roads
Constructions
16,716,720,253 13,768,302,184 13,768,302,184
-
100%
URF-DETS-Roads
Constructions-
Engineering Designs
and Consultancies
708,303,900 583,376,523 583,376,523
-
100%
URF-Roads
Management
20,000,000,000 16,472,492,183 16,472,492,183
-
100%
Sub Total 84,900,000,000 81,372,492,183 81,212,822,228 159,669,955
NTR FUNDS
DETS-MV Repairs
and Maintainance-
Road Equipts
228002 1,514,264,394
-
-
-
0%
DETS-MV Repairs
and Maintainance-
Service Vehicles
228002 713,785,824
-
-
-
0%
DETS- Operations-
Maintenance and
Repairs of Street
Lights and traffic
lights
228004 1,036,041,149 971,669,403 574,477,809 397,191,594
59%
Subtotal -
Operations
Mechanical
3,264,091,367 971,669,403 574,477,809 397,191,594 59%
DETS- Casuals 211102 487,520,916 486,358,570 465,147,984 21,210,586 96%
Sub Total 3,751,612,283 1,458,027,973 1,039,625,793 418,402,180 71%
KIIDP2 Grant
280,800,023,536 82,260,880,000
52,613,322,540
29,647,557,46
0
66%
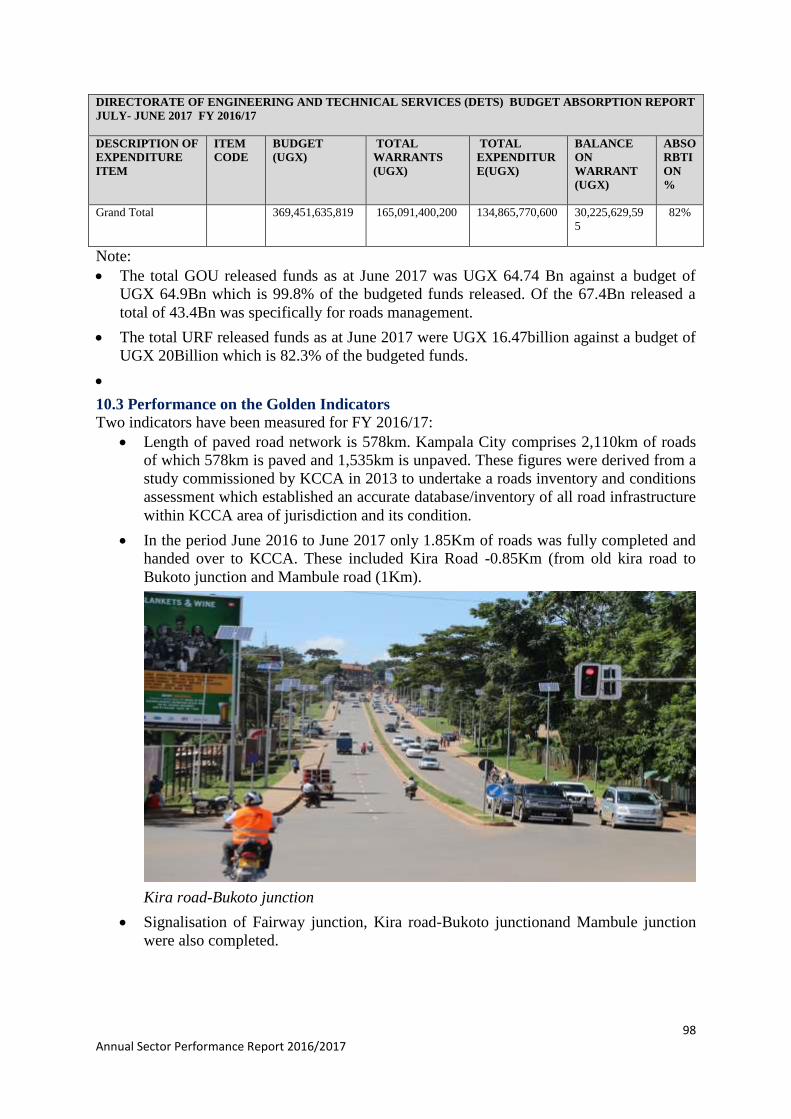
98 Annual Sector Performance Report 2016/2017
DIRECTORATE OF ENGINEERING AND TECHNICAL SERVICES (DETS) BUDGET ABSORPTION REPORT
JULY- JUNE 2017 FY 2016/17
DESCRIPTION OF
EXPENDITURE
ITEM
ITEM
CODE
BUDGET
(UGX)
TOTAL
WARRANTS
(UGX)
TOTAL
EXPENDITUR
E(UGX)
BALANCE
ON
WARRANT
(UGX)
ABSO
RBTI
ON
%
Grand Total 369,451,635,819 165,091,400,200 134,865,770,600 30,225,629,59
5
82%
Note:
The total GOU released funds as at June 2017 was UGX 64.74 Bn against a budget of
UGX 64.9Bn which is 99.8% of the budgeted funds released. Of the 67.4Bn released a
total of 43.4Bn was specifically for roads management.
The total URF released funds as at June 2017 were UGX 16.47billion against a budget of
UGX 20Billion which is 82.3% of the budgeted funds.
10.3 Performance on the Golden Indicators Two indicators have been measured for FY 2016/17:
Length of paved road network is 578km. Kampala City comprises 2,110km of roads
of which 578km is paved and 1,535km is unpaved. These figures were derived from a
study commissioned by KCCA in 2013 to undertake a roads inventory and conditions
assessment which established an accurate database/inventory of all road infrastructure
within KCCA area of jurisdiction and its condition.
In the period June 2016 to June 2017 only 1.85Km of roads was fully completed and
handed over to KCCA. These included Kira Road -0.85Km (from old kira road to
Bukoto junction and Mambule road (1Km).
Kira road-Bukoto junction
Signalisation of Fairway junction, Kira road-Bukoto junctionand Mambule junction
were also completed.
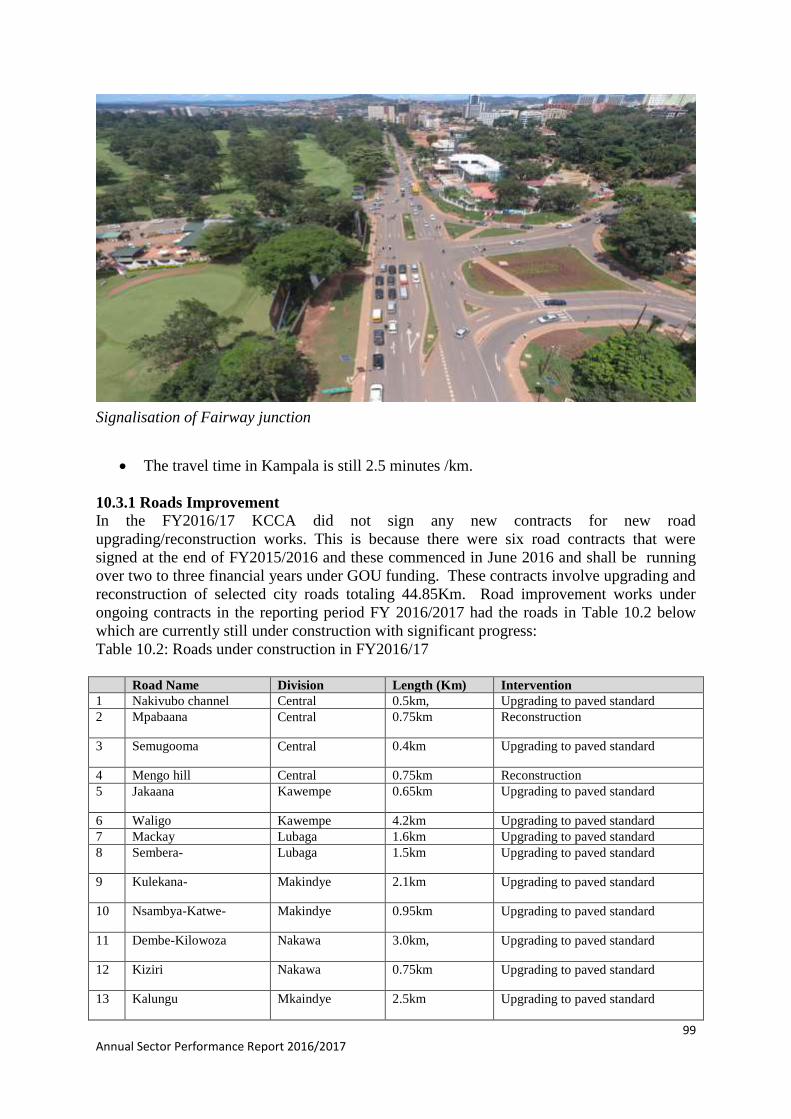
99 Annual Sector Performance Report 2016/2017
Signalisation of Fairway junction
The travel time in Kampala is still 2.5 minutes /km.
10.3.1 Roads Improvement In the FY2016/17 KCCA did not sign any new contracts for new road
upgrading/reconstruction works. This is because there were six road contracts that were
signed at the end of FY2015/2016 and these commenced in June 2016 and shall be running
over two to three financial years under GOU funding. These contracts involve upgrading and
reconstruction of selected city roads totaling 44.85Km. Road improvement works under
ongoing contracts in the reporting period FY 2016/2017 had the roads in Table 10.2 below
which are currently still under construction with significant progress:
Table 10.2: Roads under construction in FY2016/17
Road Name Division Length (Km) Intervention
1 Nakivubo channel Central 0.5km, Upgrading to paved standard
2 Mpabaana Central 0.75km Reconstruction
3 Semugooma Central 0.4km Upgrading to paved standard
4 Mengo hill Central 0.75km Reconstruction
5 Jakaana Kawempe 0.65km Upgrading to paved standard
6 Waligo Kawempe 4.2km Upgrading to paved standard
7 Mackay Lubaga 1.6km Upgrading to paved standard
8 Sembera- Lubaga 1.5km Upgrading to paved standard
9 Kulekana- Makindye 2.1km Upgrading to paved standard
10 Nsambya-Katwe- Makindye 0.95km Upgrading to paved standard
11 Dembe-Kilowoza Nakawa 3.0km, Upgrading to paved standard
12 Kiziri Nakawa 0.75km Upgrading to paved standard
13 Kalungu Mkaindye 2.5km Upgrading to paved standard
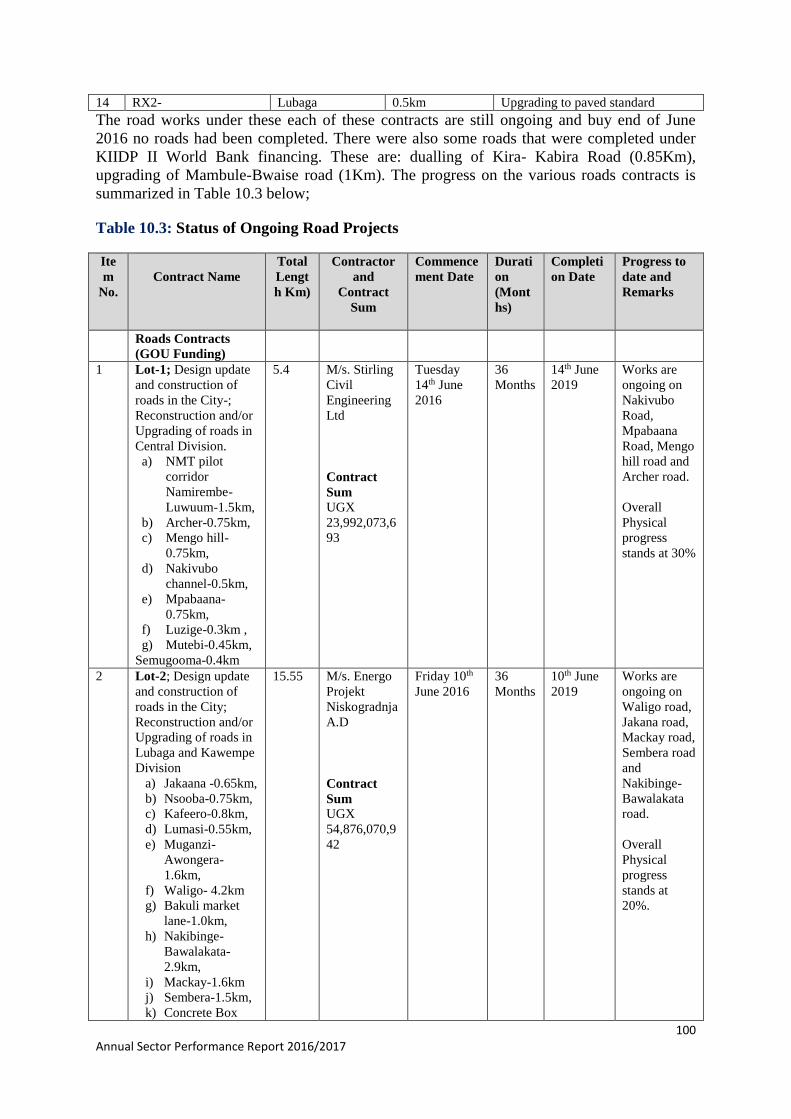
100 Annual Sector Performance Report 2016/2017
14 RX2- Lubaga 0.5km Upgrading to paved standard
The road works under these each of these contracts are still ongoing and buy end of June
2016 no roads had been completed. There were also some roads that were completed under
KIIDP II World Bank financing. These are: dualling of Kira- Kabira Road (0.85Km),
upgrading of Mambule-Bwaise road (1Km). The progress on the various roads contracts is
summarized in Table 10.3 below;
Table 10.3: Status of Ongoing Road Projects
Ite
m
No.
Contract Name
Total
Lengt
h Km)
Contractor
and
Contract
Sum
Commence
ment Date
Durati
on
(Mont
hs)
Completi
on Date
Progress to
date and
Remarks
Roads Contracts
(GOU Funding)
1 Lot-1; Design update
and construction of
roads in the City-;
Reconstruction and/or
Upgrading of roads in
Central Division.
a) NMT pilot
corridor
Namirembe-
Luwuum-1.5km,
b) Archer-0.75km,
c) Mengo hill-
0.75km,
d) Nakivubo
channel-0.5km,
e) Mpabaana-
0.75km,
f) Luzige-0.3km ,
g) Mutebi-0.45km,
Semugooma-0.4km
5.4 M/s. Stirling
Civil
Engineering
Ltd
Contract
Sum
UGX
23,992,073,6
93
Tuesday
14th June
2016
36
Months
14th June
2019
Works are
ongoing on
Nakivubo
Road,
Mpabaana
Road, Mengo
hill road and
Archer road.
Overall
Physical
progress
stands at 30%
2 Lot-2; Design update
and construction of
roads in the City;
Reconstruction and/or
Upgrading of roads in
Lubaga and Kawempe
Division
a) Jakaana -0.65km,
b) Nsooba-0.75km,
c) Kafeero-0.8km,
d) Lumasi-0.55km,
e) Muganzi-
Awongera-
1.6km,
f) Waligo- 4.2km
g) Bakuli market
lane-1.0km,
h) Nakibinge-
Bawalakata-
2.9km,
i) Mackay-1.6km
j) Sembera-1.5km,
k) Concrete Box
15.55 M/s. Energo
Projekt
Niskogradnja
A.D
Contract
Sum
UGX
54,876,070,9
42
Friday 10th
June 2016
36
Months
10th June
2019
Works are
ongoing on
Waligo road,
Jakana road,
Mackay road,
Sembera road
and
Nakibinge-
Bawalakata
road.
Overall
Physical
progress
stands at
20%.
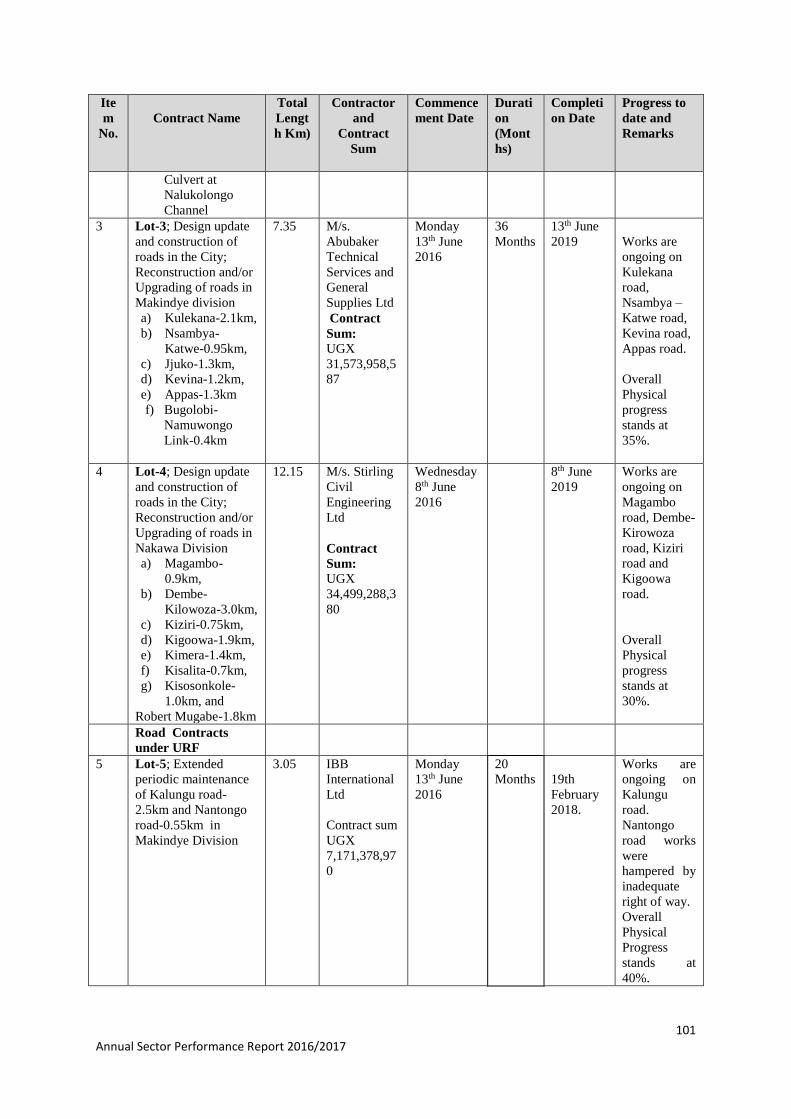
101 Annual Sector Performance Report 2016/2017
Ite
m
No.
Contract Name
Total
Lengt
h Km)
Contractor
and
Contract
Sum
Commence
ment Date
Durati
on
(Mont
hs)
Completi
on Date
Progress to
date and
Remarks
Culvert at
Nalukolongo
Channel
3 Lot-3; Design update
and construction of
roads in the City;
Reconstruction and/or
Upgrading of roads in
Makindye division
a) Kulekana-2.1km,
b) Nsambya-
Katwe-0.95km,
c) Jjuko-1.3km,
d) Kevina-1.2km,
e) Appas-1.3km
f) Bugolobi-
Namuwongo
Link-0.4km
7.35 M/s.
Abubaker
Technical
Services and
General
Supplies Ltd
Contract
Sum:
UGX
31,573,958,5
87
Monday
13th June
2016
36
Months
13th June
2019
Works are
ongoing on
Kulekana
road,
Nsambya –
Katwe road,
Kevina road,
Appas road.
Overall
Physical
progress
stands at
35%.
4 Lot-4; Design update
and construction of
roads in the City;
Reconstruction and/or
Upgrading of roads in
Nakawa Division
a) Magambo-
0.9km,
b) Dembe-
Kilowoza-3.0km,
c) Kiziri-0.75km,
d) Kigoowa-1.9km,
e) Kimera-1.4km,
f) Kisalita-0.7km,
g) Kisosonkole-
1.0km, and
Robert Mugabe-1.8km
12.15 M/s. Stirling
Civil
Engineering
Ltd
Contract
Sum:
UGX
34,499,288,3
80
Wednesday
8th June
2016
8th June
2019
Works are
ongoing on
Magambo
road, Dembe-
Kirowoza
road, Kiziri
road and
Kigoowa
road.
Overall
Physical
progress
stands at
30%.
Road Contracts
under URF
5 Lot-5; Extended
periodic maintenance
of Kalungu road-
2.5km and Nantongo
road-0.55km in
Makindye Division
3.05 IBB
International
Ltd
Contract sum
UGX
7,171,378,97
0
Monday
13th June
2016
20
Months
19th
February
2018.
Works are
ongoing on
Kalungu
road.
Nantongo
road works
were
hampered by
inadequate
right of way.
Overall
Physical
Progress
stands at
40%.
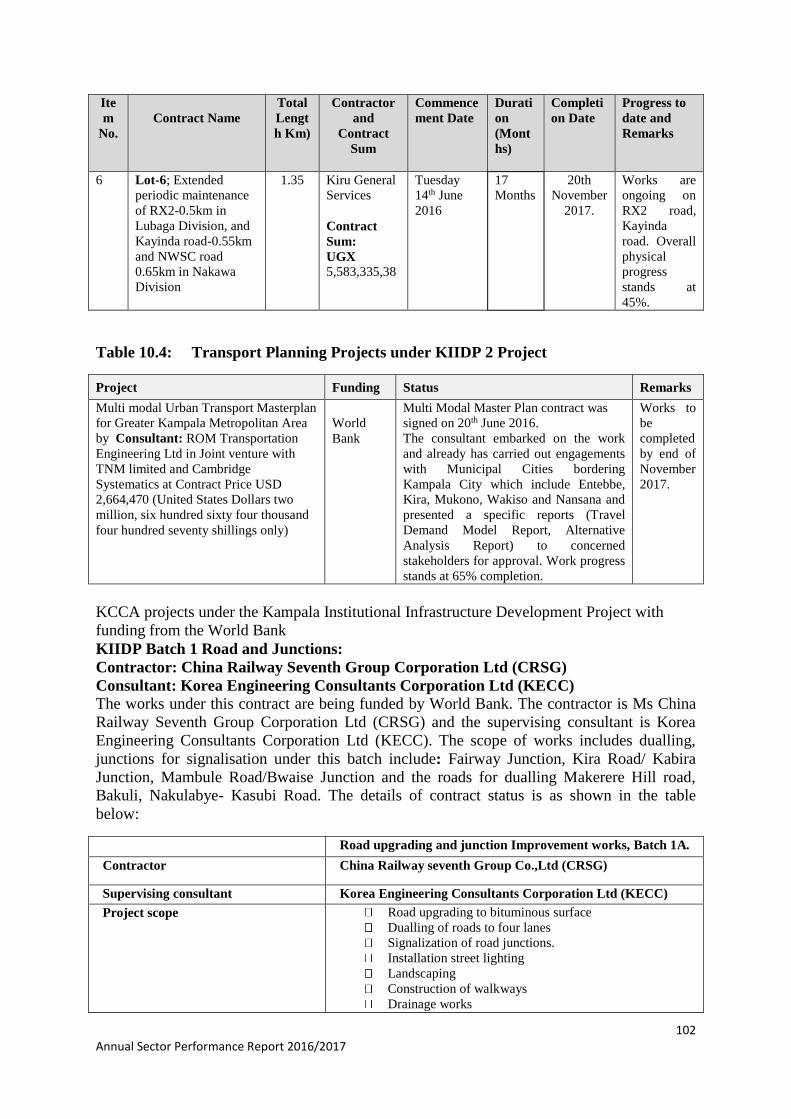
102 Annual Sector Performance Report 2016/2017
Ite
m
No.
Contract Name
Total
Lengt
h Km)
Contractor
and
Contract
Sum
Commence
ment Date
Durati
on
(Mont
hs)
Completi
on Date
Progress to
date and
Remarks
6 Lot-6; Extended
periodic maintenance
of RX2-0.5km in
Lubaga Division, and
Kayinda road-0.55km
and NWSC road
0.65km in Nakawa
Division
1.35 Kiru General
Services
Contract
Sum:
UGX 5,583,335,38
Tuesday
14th June
2016
17
Months
20th
November
2017.
Works are
ongoing on
RX2 road,
Kayinda
road. Overall
physical
progress
stands at
45%.
Table 10.4: Transport Planning Projects under KIIDP 2 Project
Project Funding Status Remarks
Multi modal Urban Transport Masterplan
for Greater Kampala Metropolitan Area
by Consultant: ROM Transportation
Engineering Ltd in Joint venture with
TNM limited and Cambridge
Systematics at Contract Price USD
2,664,470 (United States Dollars two
million, six hundred sixty four thousand
four hundred seventy shillings only)
World
Bank
Multi Modal Master Plan contract was
signed on 20th June 2016.
The consultant embarked on the work
and already has carried out engagements
with Municipal Cities bordering
Kampala City which include Entebbe,
Kira, Mukono, Wakiso and Nansana and
presented a specific reports (Travel
Demand Model Report, Alternative
Analysis Report) to concerned
stakeholders for approval. Work progress
stands at 65% completion.
Works to
be
completed
by end of
November
2017.
KCCA projects under the Kampala Institutional Infrastructure Development Project with
funding from the World Bank
KIIDP Batch 1 Road and Junctions:
Contractor: China Railway Seventh Group Corporation Ltd (CRSG)
Consultant: Korea Engineering Consultants Corporation Ltd (KECC) The works under this contract are being funded by World Bank. The contractor is Ms China
Railway Seventh Group Corporation Ltd (CRSG) and the supervising consultant is Korea
Engineering Consultants Corporation Ltd (KECC). The scope of works includes dualling,
junctions for signalisation under this batch include: Fairway Junction, Kira Road/ Kabira
Junction, Mambule Road/Bwaise Junction and the roads for dualling Makerere Hill road,
Bakuli, Nakulabye- Kasubi Road. The details of contract status is as shown in the table
below:
Project Name
Road upgrading and junction Improvement works, Batch 1A.
Contractor China Railway seventh Group Co.,Ltd (CRSG)
Supervising consultant Korea Engineering Consultants Corporation Ltd (KECC)
Project scope Road upgrading to bituminous surface
Dualling of roads to four lanes
Signalization of road junctions.
Installation street lighting
Landscaping
Construction of walkways
Drainage works
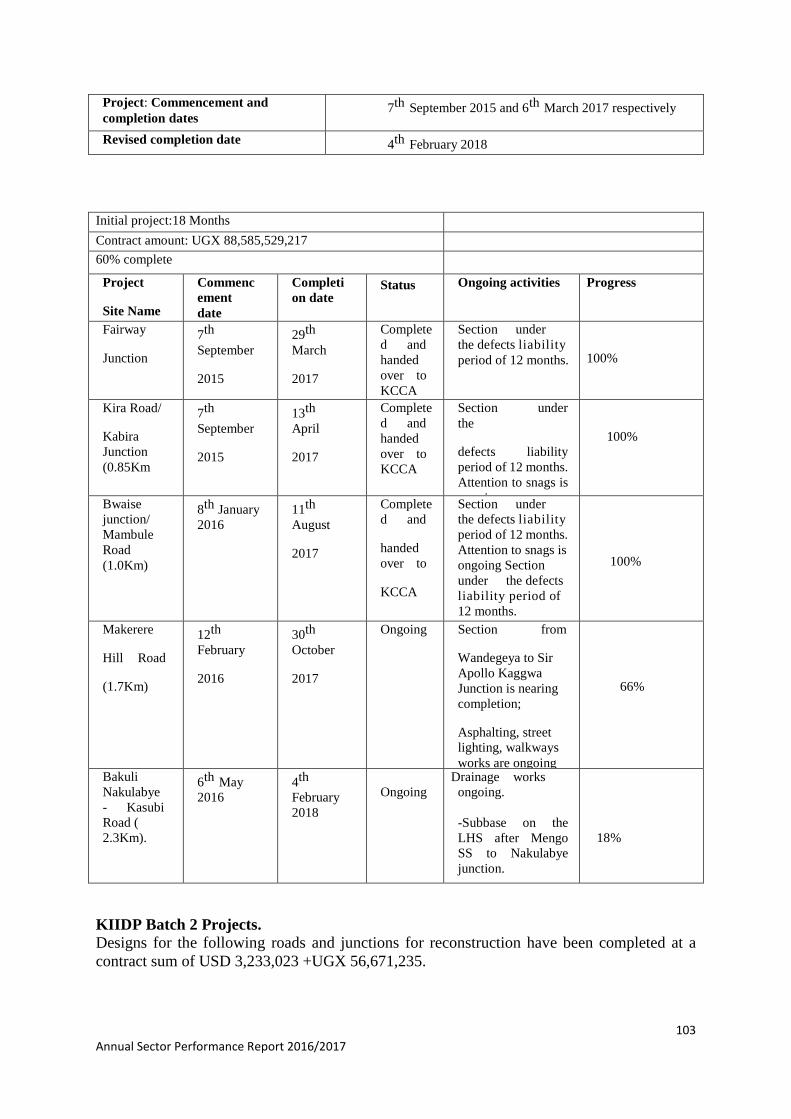
103 Annual Sector Performance Report 2016/2017
Project: Commencement and
completion dates 7th September 2015 and 6th March 2017 respectively
Revised completion date 4th February 2018
Initial project:18 Months
Contract amount: UGX 88,585,529,217
60% complete
Project
Site Name
Commenc
ement
date
Completi
on date Status Ongoing activities Progress
Fairway
Junction
7th
September
2015
29th
March
2017
Complete
d and
handed
over to
KCCA
Section under
the defects liability
period of 12 months.
100%
Kira Road/
Kabira
Junction
(0.85Km
7th
September
2015
13th
April
2017
Complete
d and
handed
over to
KCCA
Section under
the
defects liability
period of 12 months.
Attention to snags is
ongoing
100%
Bwaise
junction/
Mambule
Road
(1.0Km)
8th January
2016
11th
August
2017
Complete
d and
handed
over to
KCCA
Section under
the defects liability
period of 12 months.
Attention to snags is
ongoing Section
under the defects
liability period of
12 months.
100%
Makerere
Hill Road
(1.7Km)
12th
February
2016
30th
October
2017
Ongoing Section from
Wandegeya to Sir
Apollo Kaggwa
Junction is nearing
completion;
Asphalting, street
lighting, walkways
works are ongoing
66%
Bakuli
Nakulabye
- Kasubi
Road (
2.3Km).
6th May
2016
4th
February
2018
Ongoing
- Drainage works
ongoing.
-Subbase on the
LHS after Mengo
SS to Nakulabye
junction.
18%
KIIDP Batch 2 Projects. Designs for the following roads and junctions for reconstruction have been completed at a
contract sum of USD 3,233,023 +UGX 56,671,235.
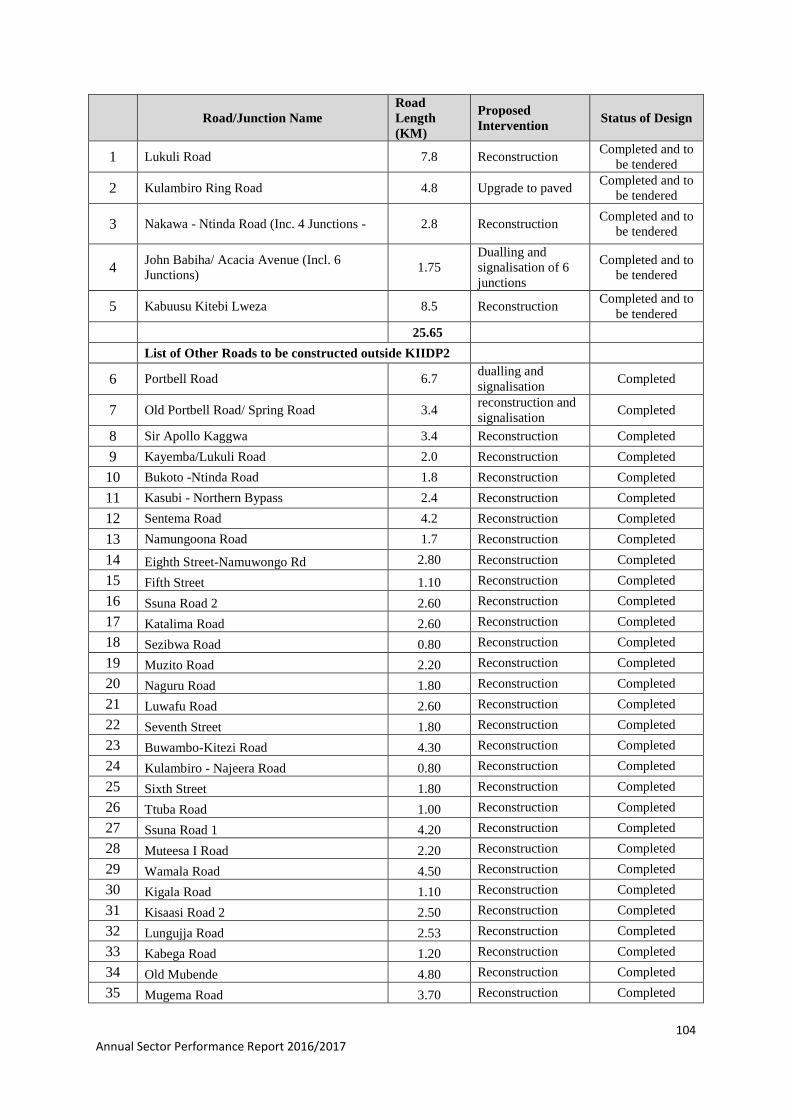
104 Annual Sector Performance Report 2016/2017
Road/Junction Name
Road
Length
(KM)
Proposed
Intervention Status of Design
1 Lukuli Road 7.8 Reconstruction Completed and to
be tendered
2 Kulambiro Ring Road 4.8 Upgrade to paved Completed and to
be tendered
3 Nakawa - Ntinda Road (Inc. 4 Junctions - 2.8 Reconstruction Completed and to
be tendered
4 John Babiha/ Acacia Avenue (Incl. 6
Junctions) 1.75
Dualling and
signalisation of 6
junctions
Completed and to
be tendered
5 Kabuusu Kitebi Lweza 8.5 Reconstruction Completed and to
be tendered
25.65
List of Other Roads to be constructed outside KIIDP2
6 Portbell Road 6.7 dualling and
signalisation Completed
7 Old Portbell Road/ Spring Road 3.4 reconstruction and
signalisation Completed
8 Sir Apollo Kaggwa 3.4 Reconstruction Completed
9 Kayemba/Lukuli Road 2.0 Reconstruction Completed
10 Bukoto -Ntinda Road 1.8 Reconstruction Completed
11 Kasubi - Northern Bypass 2.4 Reconstruction Completed
12 Sentema Road 4.2 Reconstruction Completed
13 Namungoona Road 1.7 Reconstruction Completed
14 Eighth Street-Namuwongo Rd 2.80 Reconstruction Completed
15 Fifth Street 1.10 Reconstruction Completed
16 Ssuna Road 2 2.60 Reconstruction Completed
17 Katalima Road 2.60 Reconstruction Completed
18 Sezibwa Road 0.80 Reconstruction Completed
19 Muzito Road 2.20 Reconstruction Completed
20 Naguru Road 1.80 Reconstruction Completed
21 Luwafu Road 2.60 Reconstruction Completed
22 Seventh Street 1.80 Reconstruction Completed
23 Buwambo-Kitezi Road 4.30 Reconstruction Completed
24 Kulambiro - Najeera Road 0.80 Reconstruction Completed
25 Sixth Street 1.80 Reconstruction Completed
26 Ttuba Road 1.00 Reconstruction Completed
27 Ssuna Road 1 4.20 Reconstruction Completed
28 Muteesa I Road 2.20 Reconstruction Completed
29 Wamala Road 4.50 Reconstruction Completed
30 Kigala Road 1.10 Reconstruction Completed
31 Kisaasi Road 2 2.50 Reconstruction Completed
32 Lungujja Road 2.53 Reconstruction Completed
33 Kabega Road 1.20 Reconstruction Completed
34 Old Mubende 4.80 Reconstruction Completed
35 Mugema Road 3.70 Reconstruction Completed
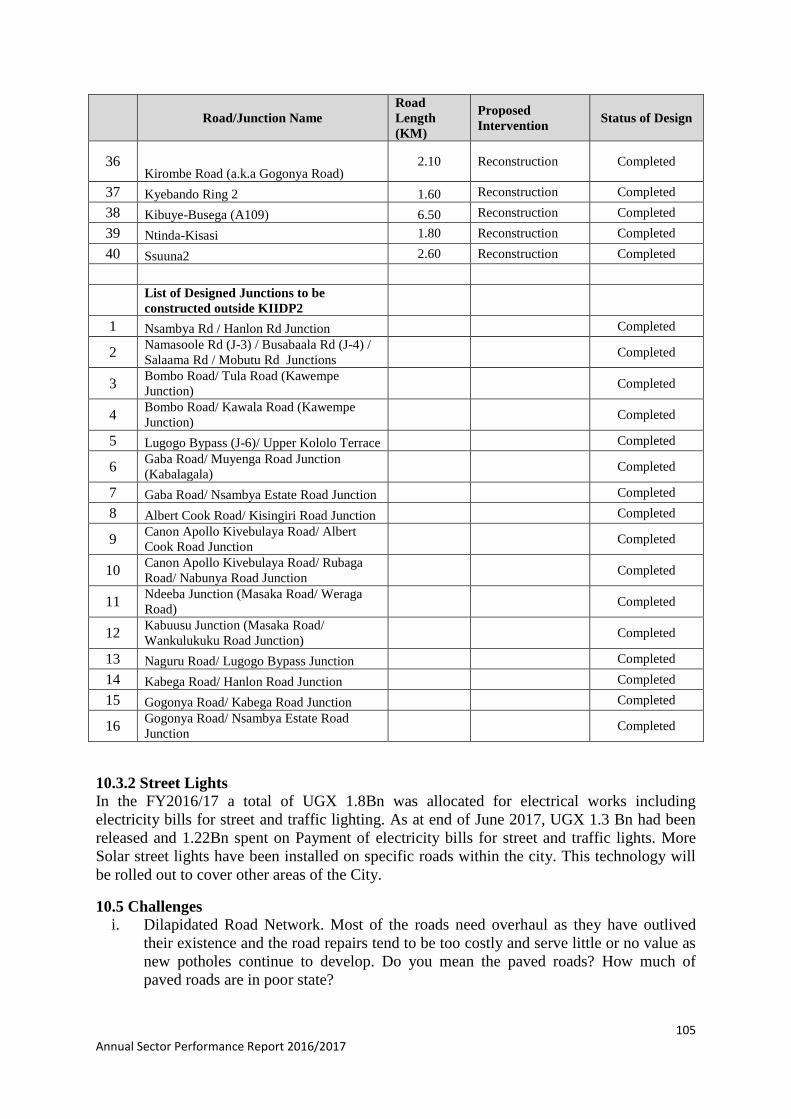
105 Annual Sector Performance Report 2016/2017
Road/Junction Name
Road
Length
(KM)
Proposed
Intervention Status of Design
36 Kirombe Road (a.k.a Gogonya Road)
2.10 Reconstruction Completed
37 Kyebando Ring 2 1.60 Reconstruction Completed
38 Kibuye-Busega (A109) 6.50 Reconstruction Completed
39 Ntinda-Kisasi 1.80 Reconstruction Completed
40 Ssuuna2 2.60 Reconstruction Completed
List of Designed Junctions to be
constructed outside KIIDP2
1 Nsambya Rd / Hanlon Rd Junction Completed
2 Namasoole Rd (J-3) / Busabaala Rd (J-4) /
Salaama Rd / Mobutu Rd Junctions Completed
3 Bombo Road/ Tula Road (Kawempe
Junction) Completed
4 Bombo Road/ Kawala Road (Kawempe
Junction) Completed
5 Lugogo Bypass (J-6)/ Upper Kololo Terrace Completed
6 Gaba Road/ Muyenga Road Junction
(Kabalagala) Completed
7 Gaba Road/ Nsambya Estate Road Junction Completed
8 Albert Cook Road/ Kisingiri Road Junction Completed
9 Canon Apollo Kivebulaya Road/ Albert
Cook Road Junction Completed
10 Canon Apollo Kivebulaya Road/ Rubaga
Road/ Nabunya Road Junction Completed
11 Ndeeba Junction (Masaka Road/ Weraga
Road) Completed
12 Kabuusu Junction (Masaka Road/
Wankulukuku Road Junction) Completed
13 Naguru Road/ Lugogo Bypass Junction Completed
14 Kabega Road/ Hanlon Road Junction Completed
15 Gogonya Road/ Kabega Road Junction Completed
16 Gogonya Road/ Nsambya Estate Road
Junction Completed
10.3.2 Street Lights In the FY2016/17 a total of UGX 1.8Bn was allocated for electrical works including
electricity bills for street and traffic lighting. As at end of June 2017, UGX 1.3 Bn had been
released and 1.22Bn spent on Payment of electricity bills for street and traffic lights. More
Solar street lights have been installed on specific roads within the city. This technology will
be rolled out to cover other areas of the City.
10.5 Challenges i. Dilapidated Road Network. Most of the roads need overhaul as they have outlived
their existence and the road repairs tend to be too costly and serve little or no value as
new potholes continue to develop. Do you mean the paved roads? How much of
paved roads are in poor state?
106 Annual Sector Performance Report 2016/2017
ii. Inadequate Road Network: The road network in Kampala has limited capacity and
was not built for the high volume traffic of recent years that has contributed to severe
congestion.
iii. Lack of adequate road reserves: Most roads are unplanned and lack adequate rights of
way for improvement. This makes road improvements very costly as the required
geometrical designs cannot be achieved without significant resettlement and
acquisition of rights of way.
iv. Lack of safe NMT facilities: Although most trips are pedestrian, there is a lack of
pedestrian facilities on most roads. In many cases pedestrians are forced to share
carriageways with vehicles exposing themselves to accidents. Provision of walkways
and cycle paths is hampered by lack or right of way and limited funding. You should
mention walkway construction in different parts of the city.
v. Lack of an integrated and affordable public transport system: The public transport
system is fragmented and dominated by low capacity minibuses and boda bodas. A
mass transit system is needed to serve as the back bone of the transport system in
Kampala.
vi. Under Funding: The combined funds available to road construction from Government
allocations and KCCA’s own resources are insufficient to finance needed
infrastructure improvements that address the continuous growth of traffic in Kampala,
notwithstanding the current traffic problems in the city.
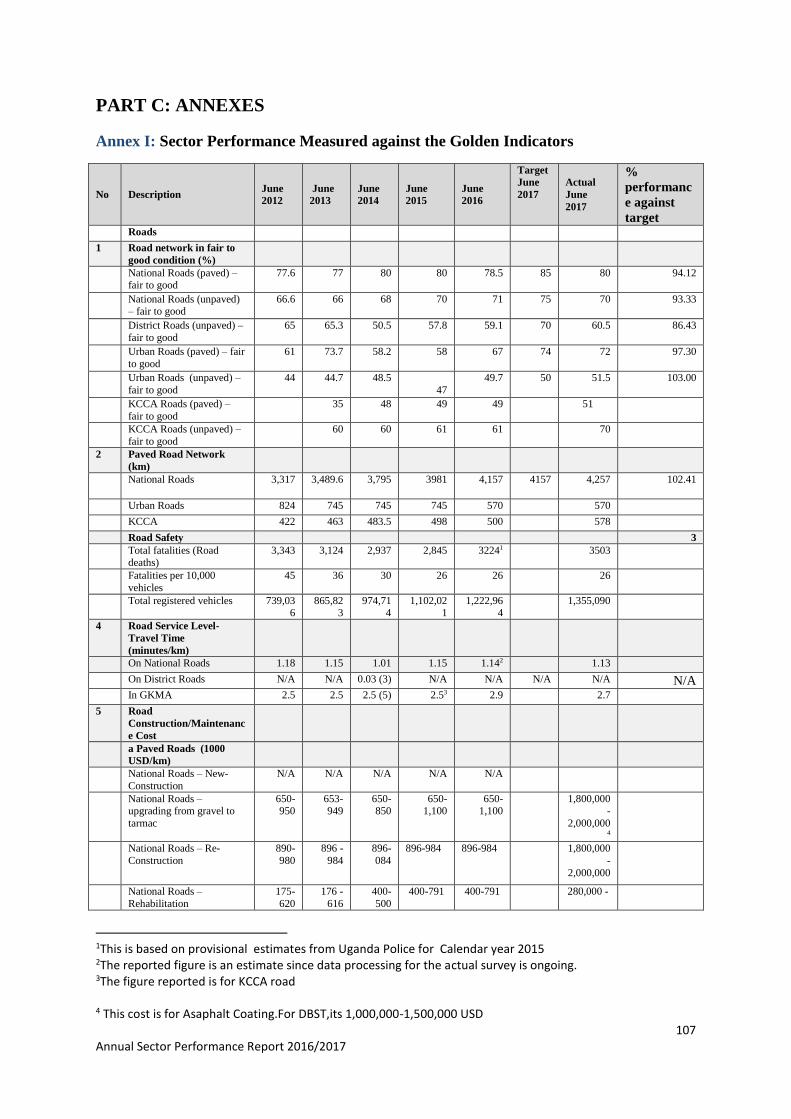
107 Annual Sector Performance Report 2016/2017
PART C: ANNEXES
Annex I: Sector Performance Measured against the Golden Indicators
No Description June
2012
June
2013
June
2014
June
2015
June
2016
Target
June
2017
Actual
June
2017
%
performanc
e against
target Roads 1 Road network in fair to
good condition (%)
National Roads (paved) – fair to good
77.6 77 80 80 78.5 85 80 94.12
National Roads (unpaved) – fair to good
66.6 66 68 70 71
75 70 93.33
District Roads (unpaved) –
fair to good
65 65.3 50.5 57.8 59.1 70 60.5 86.43
Urban Roads (paved) – fair
to good
61 73.7 58.2 58 67 74 72 97.30
Urban Roads (unpaved) –
fair to good
44 44.7 48.5
47
49.7 50 51.5 103.00
KCCA Roads (paved) –
fair to good
35 48 49 49 51
KCCA Roads (unpaved) –
fair to good
60 60 61 61 70
2 Paved Road Network
(km)
National Roads 3,317 3,489.6 3,795 3981 4,157 4157 4,257 102.41
Urban Roads 824 745 745 745 570 570 KCCA 422 463 483.5 498 500 578 Road Safety 3 Total fatalities (Road
deaths) 3,343 3,124 2,937 2,845 32241 3503
Fatalities per 10,000
vehicles
45 36 30 26 26 26
Total registered vehicles 739,036
865,823
974,714
1,102,021
1,222,964
1,355,090
4 Road Service Level-
Travel Time
(minutes/km)
On National Roads 1.18 1.15 1.01 1.15 1.142 1.13 On District Roads N/A N/A 0.03 (3) N/A N/A N/A N/A N/A In GKMA 2.5 2.5 2.5 (5) 2.53 2.9 2.7 5 Road
Construction/Maintenanc
e Cost
a Paved Roads (1000
USD/km)
National Roads – New-
Construction
N/A N/A N/A N/A N/A
National Roads – upgrading from gravel to
tarmac
650-950
653- 949
650-850
650-1,100
650-1,100
1,800,000-
2,000,0004
National Roads – Re-
Construction
890-
980
896 -
984
896-
084
896-984
896-984
1,800,000
-
2,000,000
National Roads –
Rehabilitation
175-
620
176 -
616
400-
500
400-791 400-791 280,000 -
1This is based on provisional estimates from Uganda Police for Calendar year 2015 2The reported figure is an estimate since data processing for the actual survey is ongoing. 3The figure reported is for KCCA road 4 This cost is for Asaphalt Coating.For DBST,its 1,000,000-1,500,000 USD
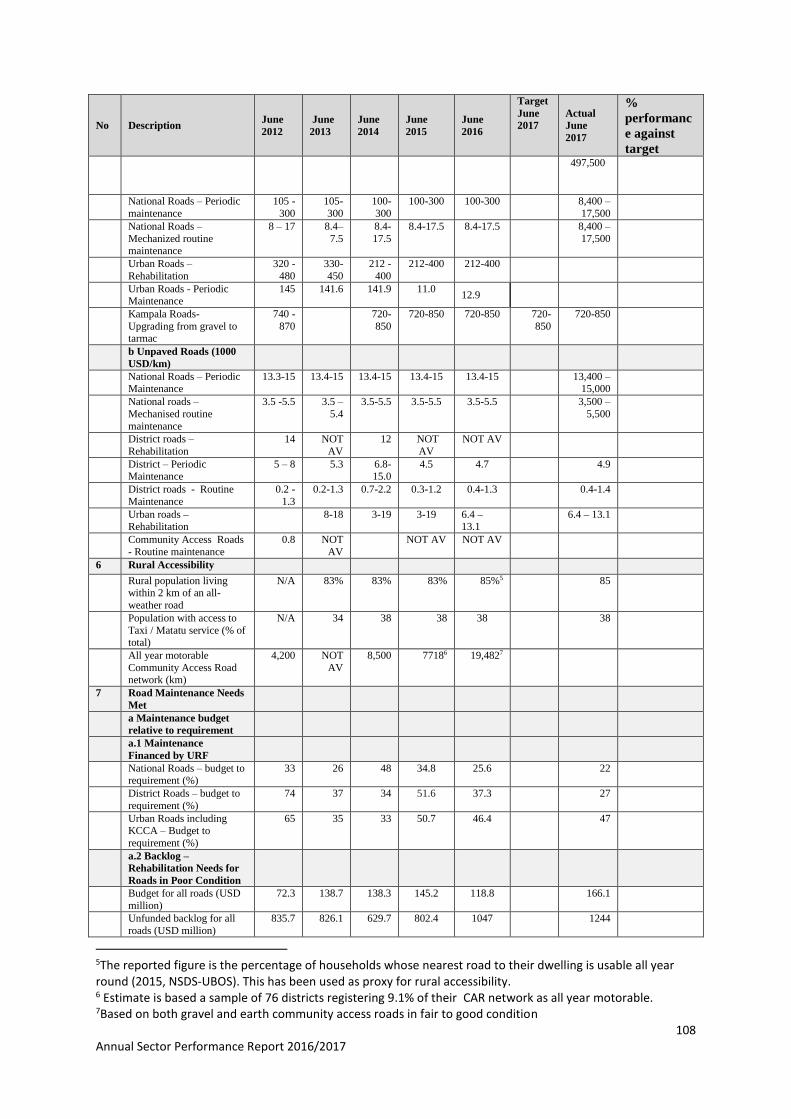
108 Annual Sector Performance Report 2016/2017
No Description June
2012
June
2013
June
2014
June
2015
June
2016
Target
June
2017
Actual
June
2017
%
performanc
e against
target 497,500
National Roads – Periodic
maintenance
105 -
300
105-
300
100-
300
100-300 100-300 8,400 –
17,500
National Roads –
Mechanized routine maintenance
8 – 17 8.4–
7.5
8.4-
17.5
8.4-17.5 8.4-17.5 8,400 –
17,500
Urban Roads –
Rehabilitation
320 -
480
330-
450
212 -
400
212-400 212-400
Urban Roads - Periodic Maintenance
145 141.6 141.9 11.0 12.9
Kampala Roads-
Upgrading from gravel to tarmac
740 -
870
720-
850
720-850 720-850 720-
850
720-850
b Unpaved Roads (1000
USD/km)
National Roads – Periodic Maintenance
13.3-15 13.4-15 13.4-15 13.4-15 13.4-15 13,400 – 15,000
National roads –
Mechanised routine
maintenance
3.5 -5.5 3.5 –
5.4
3.5-5.5 3.5-5.5 3.5-5.5 3,500 –
5,500
District roads –
Rehabilitation
14 NOT
AV
12 NOT
AV
NOT AV
District – Periodic Maintenance
5 – 8 5.3 6.8-15.0
4.5 4.7 4.9
District roads - Routine
Maintenance
0.2 -
1.3
0.2-1.3 0.7-2.2 0.3-1.2 0.4-1.3 0.4-1.4
Urban roads – Rehabilitation
8-18 3-19 3-19 6.4 – 13.1
6.4 – 13.1
Community Access Roads
- Routine maintenance
0.8 NOT
AV
NOT AV NOT AV
6 Rural Accessibility Rural population living
within 2 km of an all-
weather road
N/A 83% 83% 83% 85%5 85
Population with access to
Taxi / Matatu service (% of total)
N/A 34 38 38 38 38
All year motorable
Community Access Road network (km)
4,200 NOT
AV
8,500 77186 19,4827
7 Road Maintenance Needs
Met
a Maintenance budget
relative to requirement
a.1 Maintenance
Financed by URF
National Roads – budget to requirement (%)
33 26 48 34.8
25.6 22
District Roads – budget to
requirement (%)
74 37 34 51.6 37.3 27
Urban Roads including KCCA – Budget to
requirement (%)
65 35 33 50.7 46.4 47
a.2 Backlog –
Rehabilitation Needs for
Roads in Poor Condition
Budget for all roads (USD
million)
72.3 138.7 138.3 145.2 118.8 166.1
Unfunded backlog for all
roads (USD million)
835.7 826.1 629.7 802.4 1047 1244
5The reported figure is the percentage of households whose nearest road to their dwelling is usable all year round (2015, NSDS-UBOS). This has been used as proxy for rural accessibility. 6 Estimate is based a sample of 76 districts registering 9.1% of their CAR network as all year motorable. 7Based on both gravel and earth community access roads in fair to good condition
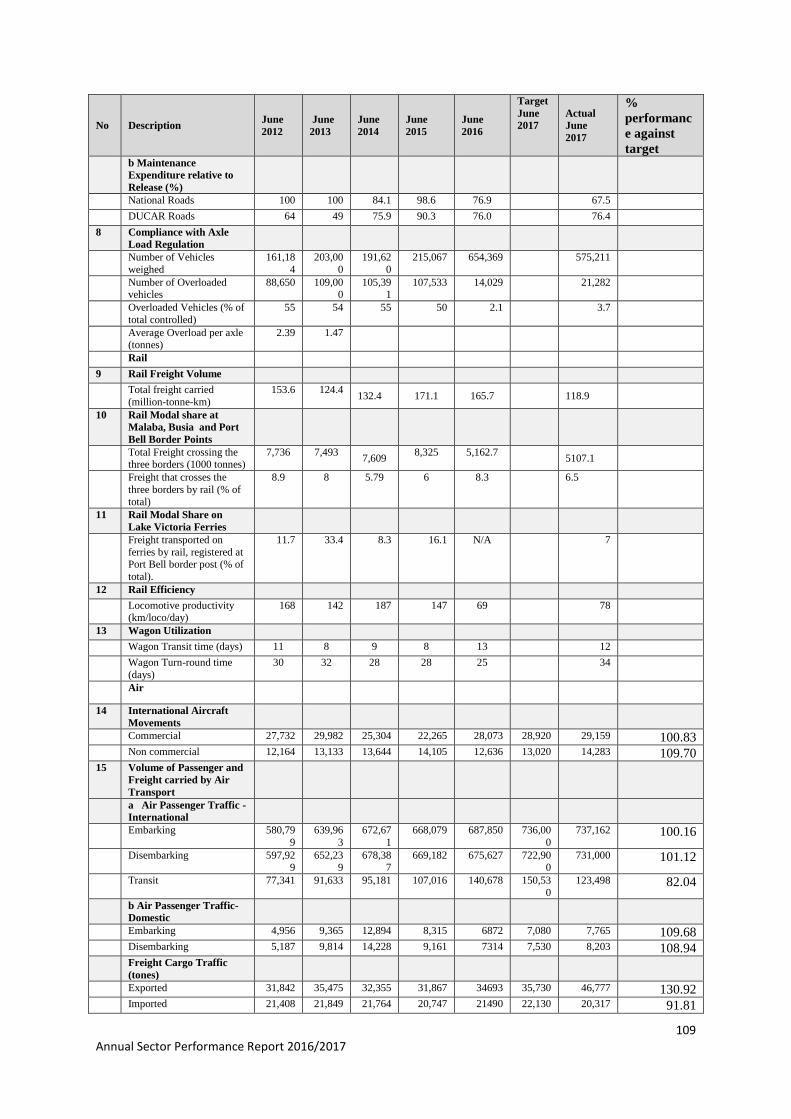
109 Annual Sector Performance Report 2016/2017
No Description June
2012
June
2013
June
2014
June
2015
June
2016
Target
June
2017
Actual
June
2017
%
performanc
e against
target b Maintenance
Expenditure relative to
Release (%)
National Roads 100 100 84.1 98.6 76.9 67.5 DUCAR Roads 64 49 75.9 90.3 76.0 76.4 8 Compliance with Axle
Load Regulation
Number of Vehicles
weighed
161,18
4
203,00
0
191,62
0
215,067 654,369 575,211
Number of Overloaded vehicles
88,650 109,000
105,391
107,533 14,029 21,282
Overloaded Vehicles (% of
total controlled)
55 54 55 50 2.1 3.7
Average Overload per axle (tonnes)
2.39 1.47
Rail 9 Rail Freight Volume Total freight carried
(million-tonne-km)
153.6 124.4 132.4 171.1 165.7
118.9
10 Rail Modal share at
Malaba, Busia and Port
Bell Border Points
Total Freight crossing the three borders (1000 tonnes)
7,736 7,493 7,609
8,325 5,162.7
5107.1
Freight that crosses the
three borders by rail (% of
total)
8.9 8 5.79 6 8.3 6.5
11 Rail Modal Share on
Lake Victoria Ferries
Freight transported on
ferries by rail, registered at Port Bell border post (% of
total).
11.7 33.4 8.3 16.1 N/A 7
12 Rail Efficiency Locomotive productivity
(km/loco/day) 168 142 187 147 69 78
13 Wagon Utilization Wagon Transit time (days) 11 8 9 8 13 12 Wagon Turn-round time
(days)
30 32 28 28 25 34
Air
14 International Aircraft
Movements
Commercial 27,732 29,982 25,304 22,265 28,073 28,920 29,159 100.83 Non commercial 12,164 13,133 13,644 14,105 12,636 13,020 14,283 109.70 15 Volume of Passenger and
Freight carried by Air
Transport
a Air Passenger Traffic -
International
Embarking 580,79
9
639,96
3
672,67
1
668,079 687,850 736,00
0
737,162 100.16
Disembarking 597,929
652,239
678,387
669,182 675,627 722,900
731,000 101.12
Transit 77,341 91,633 95,181 107,016 140,678 150,53
0
123,498 82.04
b Air Passenger Traffic-
Domestic
Embarking 4,956 9,365 12,894 8,315 6872 7,080 7,765 109.68 Disembarking 5,187 9,814 14,228 9,161 7314 7,530 8,203 108.94 Freight Cargo Traffic
(tones)
Exported 31,842 35,475 32,355 31,867 34693 35,730 46,777 130.92 Imported 21,408 21,849 21,764 20,747 21490 22,130 20,317 91.81
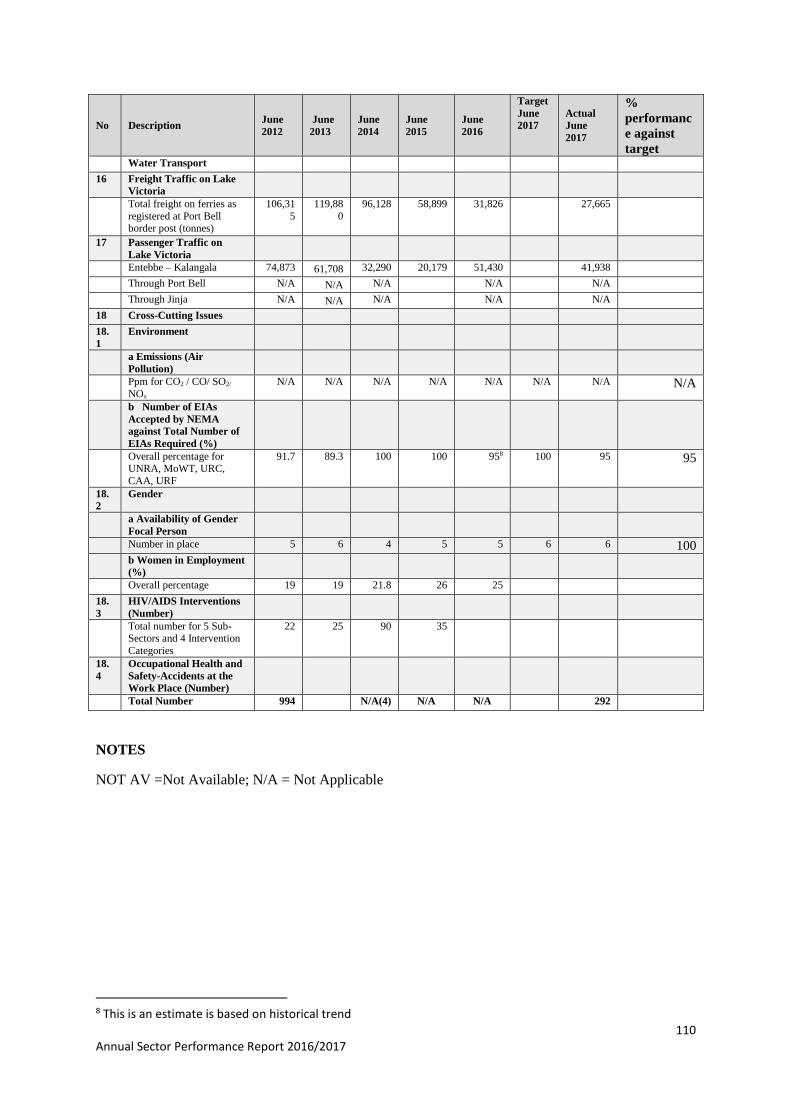
110 Annual Sector Performance Report 2016/2017
No Description June
2012
June
2013
June
2014
June
2015
June
2016
Target
June
2017
Actual
June
2017
%
performanc
e against
target Water Transport 16 Freight Traffic on Lake
Victoria
Total freight on ferries as
registered at Port Bell border post (tonnes)
106,31
5
119,88
0
96,128 58,899 31,826
27,665
17 Passenger Traffic on
Lake Victoria
Entebbe – Kalangala 74,873 61,708 32,290 20,179 51,430 41,938 Through Port Bell N/A N/A N/A N/A N/A Through Jinja N/A N/A N/A N/A N/A 18 Cross-Cutting Issues 18.
1
Environment
a Emissions (Air
Pollution)
Ppm for CO2 / CO/ SO2/
NOx
N/A N/A N/A N/A N/A N/A N/A N/A
b Number of EIAs
Accepted by NEMA
against Total Number of
EIAs Required (%)
Overall percentage for UNRA, MoWT, URC,
CAA, URF
91.7 89.3 100 100 958 100 95 95
18.
2
Gender
a Availability of Gender
Focal Person
Number in place 5 6 4 5 5 6 6 100 b Women in Employment
(%)
Overall percentage 19 19 21.8 26 25 18.
3
HIV/AIDS Interventions
(Number)
Total number for 5 Sub-Sectors and 4 Intervention
Categories
22 25 90 35
18.
4
Occupational Health and
Safety-Accidents at the
Work Place (Number)
Total Number 994 N/A(4) N/A N/A 292
NOTES
NOT AV =Not Available; N/A = Not Applicable
8 This is an estimate is based on historical trend
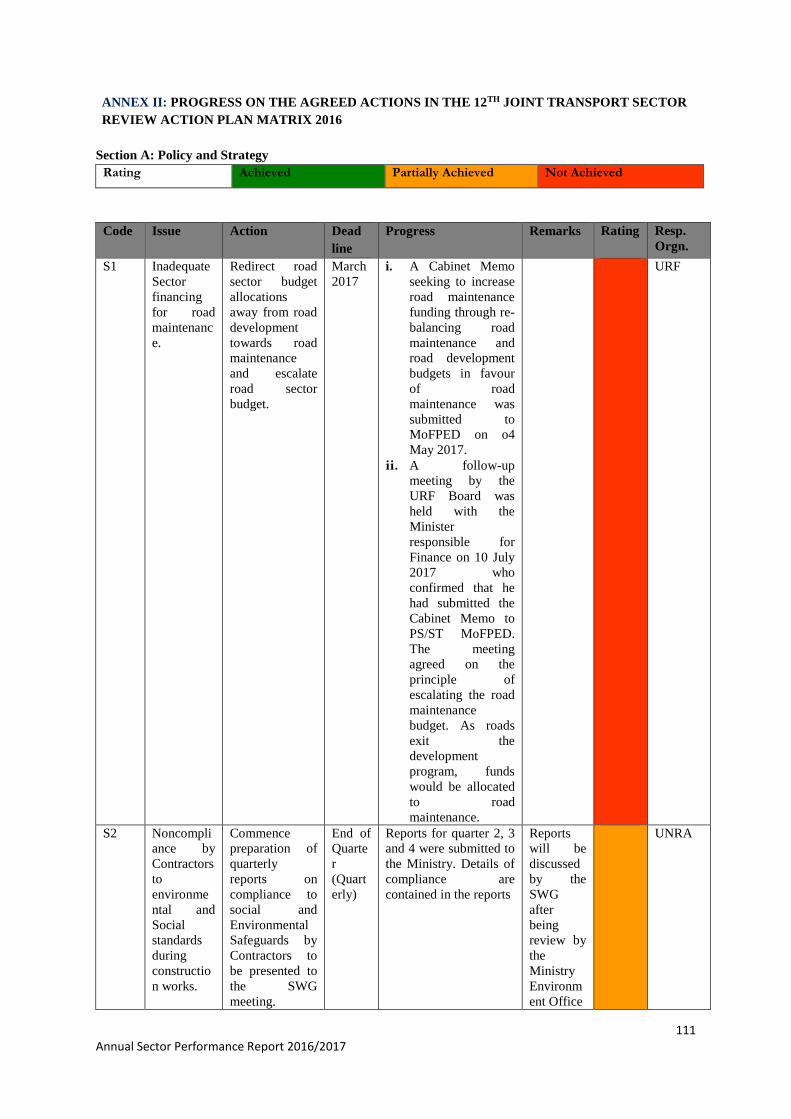
111 Annual Sector Performance Report 2016/2017
ANNEX II: PROGRESS ON THE AGREED ACTIONS IN THE 12TH JOINT TRANSPORT SECTOR
REVIEW ACTION PLAN MATRIX 2016
Section A: Policy and Strategy
Rating Achieved Partially Achieved Not Achieved
Code Issue Action Dead
line
Progress Remarks Rating Resp.
Orgn.
S1 Inadequate
Sector
financing
for road
maintenanc
e.
Redirect road
sector budget
allocations
away from road
development
towards road
maintenance
and escalate
road sector
budget.
March
2017
i. A Cabinet Memo
seeking to increase
road maintenance
funding through re-
balancing road
maintenance and
road development
budgets in favour
of road
maintenance was
submitted to
MoFPED on o4
May 2017.
ii. A follow-up
meeting by the
URF Board was
held with the
Minister
responsible for
Finance on 10 July
2017 who
confirmed that he
had submitted the
Cabinet Memo to
PS/ST MoFPED.
The meeting
agreed on the
principle of
escalating the road
maintenance
budget. As roads
exit the
development
program, funds
would be allocated
to road
maintenance.
URF
S2 Noncompli
ance by
Contractors
to
environme
ntal and
Social
standards
during
constructio
n works.
Commence
preparation of
quarterly
reports on
compliance to
social and
Environmental
Safeguards by
Contractors to
be presented to
the SWG
meeting.
End of
Quarte
r
(Quart
erly)
Reports for quarter 2, 3
and 4 were submitted to
the Ministry. Details of
compliance are
contained in the reports
Reports
will be
discussed
by the
SWG
after
being
review by
the
Ministry
Environm
ent Office
UNRA
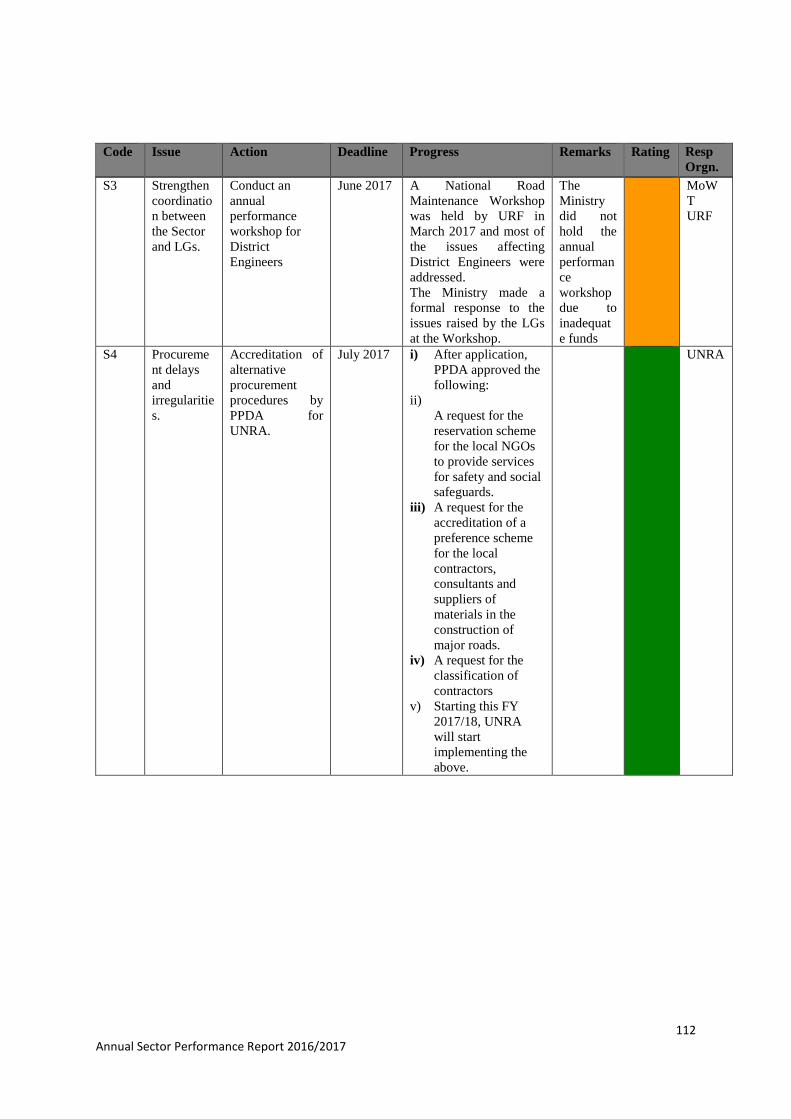
112 Annual Sector Performance Report 2016/2017
Code Issue Action Deadline Progress Remarks Rating Resp
Orgn.
S3 Strengthen
coordinatio
n between
the Sector
and LGs.
Conduct an
annual
performance
workshop for
District
Engineers
June 2017 A National Road
Maintenance Workshop
was held by URF in
March 2017 and most of
the issues affecting
District Engineers were
addressed.
The Ministry made a
formal response to the
issues raised by the LGs
at the Workshop.
The
Ministry
did not
hold the
annual
performan
ce
workshop
due to
inadequat
e funds
MoW
T
URF
S4 Procureme
nt delays
and
irregularitie
s.
Accreditation of
alternative
procurement
procedures by
PPDA for
UNRA.
July 2017 i) After application,
PPDA approved the
following:
ii)
A request for the
reservation scheme
for the local NGOs
to provide services
for safety and social
safeguards.
iii) A request for the
accreditation of a
preference scheme
for the local
contractors,
consultants and
suppliers of
materials in the
construction of
major roads.
iv) A request for the
classification of
contractors
v) Starting this FY
2017/18, UNRA
will start
implementing the
above.
UNRA
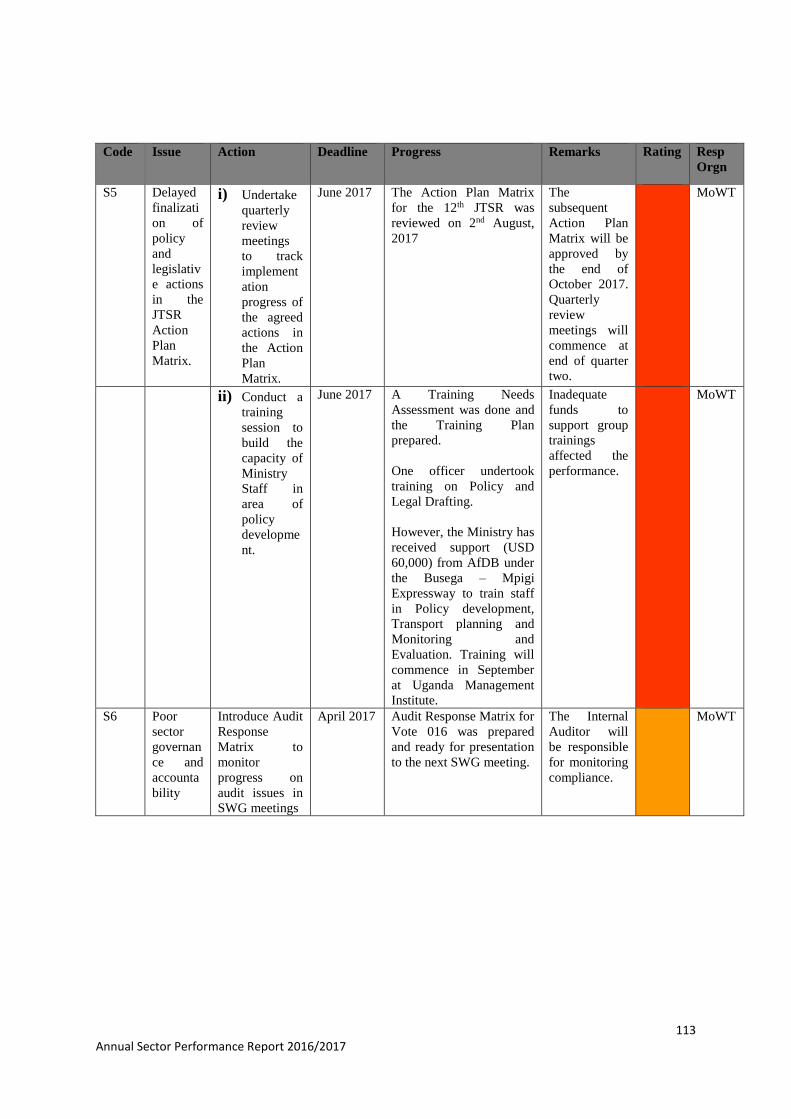
113 Annual Sector Performance Report 2016/2017
Code Issue Action Deadline Progress Remarks Rating Resp
Orgn
S5 Delayed
finalizati
on of
policy
and
legislativ
e actions
in the
JTSR
Action
Plan
Matrix.
i) Undertake
quarterly
review
meetings
to track
implement
ation
progress of
the agreed
actions in
the Action
Plan
Matrix.
June 2017 The Action Plan Matrix
for the 12th JTSR was
reviewed on 2nd August,
2017
The
subsequent
Action Plan
Matrix will be
approved by
the end of
October 2017.
Quarterly
review
meetings will
commence at
end of quarter
two.
MoWT
ii) Conduct a
training
session to
build the
capacity of
Ministry
Staff in
area of
policy
developme
nt.
June 2017 A Training Needs
Assessment was done and
the Training Plan
prepared.
One officer undertook
training on Policy and
Legal Drafting.
However, the Ministry has
received support (USD
60,000) from AfDB under
the Busega – Mpigi
Expressway to train staff
in Policy development,
Transport planning and
Monitoring and
Evaluation. Training will
commence in September
at Uganda Management
Institute.
Inadequate
funds to
support group
trainings
affected the
performance.
MoWT
S6 Poor
sector
governan
ce and
accounta
bility
Introduce Audit
Response
Matrix to
monitor
progress on
audit issues in
SWG meetings
April 2017 Audit Response Matrix for
Vote 016 was prepared
and ready for presentation
to the next SWG meeting.
The Internal
Auditor will
be responsible
for monitoring
compliance.
MoWT
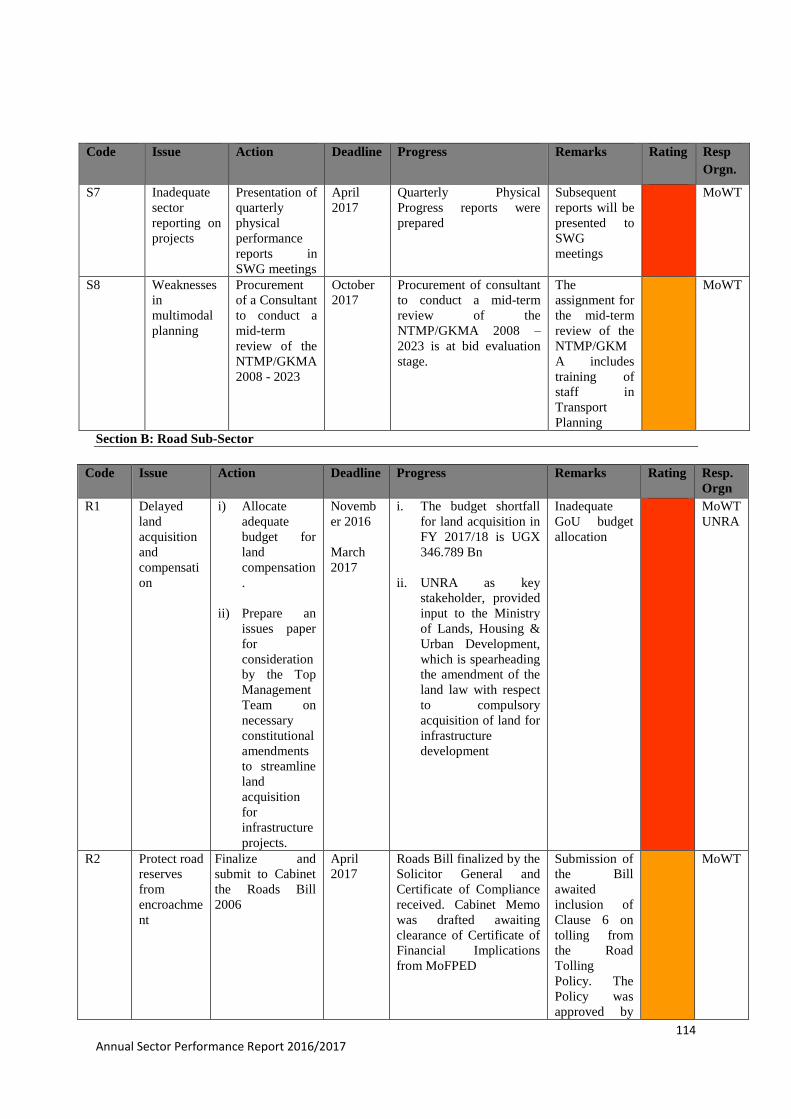
114 Annual Sector Performance Report 2016/2017
Section B: Road Sub-Sector
Code Issue Action Deadline Progress Remarks Rating Resp.
Orgn
R1 Delayed
land
acquisition
and
compensati
on
i) Allocate
adequate
budget for
land
compensation
.
ii) Prepare an
issues paper
for
consideration
by the Top
Management
Team on
necessary
constitutional
amendments
to streamline
land
acquisition
for
infrastructure
projects.
Novemb
er 2016
March
2017
i. The budget shortfall
for land acquisition in
FY 2017/18 is UGX
346.789 Bn
ii. UNRA as key
stakeholder, provided
input to the Ministry
of Lands, Housing &
Urban Development,
which is spearheading
the amendment of the
land law with respect
to compulsory
acquisition of land for
infrastructure
development
Inadequate
GoU budget
allocation
MoWT
UNRA
R2 Protect road
reserves
from
encroachme
nt
Finalize and
submit to Cabinet
the Roads Bill
2006
April
2017
Roads Bill finalized by the
Solicitor General and
Certificate of Compliance
received. Cabinet Memo
was drafted awaiting
clearance of Certificate of
Financial Implications
from MoFPED
Submission of
the Bill
awaited
inclusion of
Clause 6 on
tolling from
the Road
Tolling
Policy. The
Policy was
approved by
MoWT
Code Issue Action Deadline Progress Remarks Rating Resp
Orgn.
S7 Inadequate
sector
reporting on
projects
Presentation of
quarterly
physical
performance
reports in
SWG meetings
April
2017
Quarterly Physical
Progress reports were
prepared
Subsequent
reports will be
presented to
SWG
meetings
MoWT
S8 Weaknesses
in
multimodal
planning
Procurement
of a Consultant
to conduct a
mid-term
review of the
NTMP/GKMA
2008 - 2023
October
2017
Procurement of consultant
to conduct a mid-term
review of the
NTMP/GKMA 2008 –
2023 is at bid evaluation
stage.
The
assignment for
the mid-term
review of the
NTMP/GKM
A includes
training of
staff in
Transport
Planning
MoWT
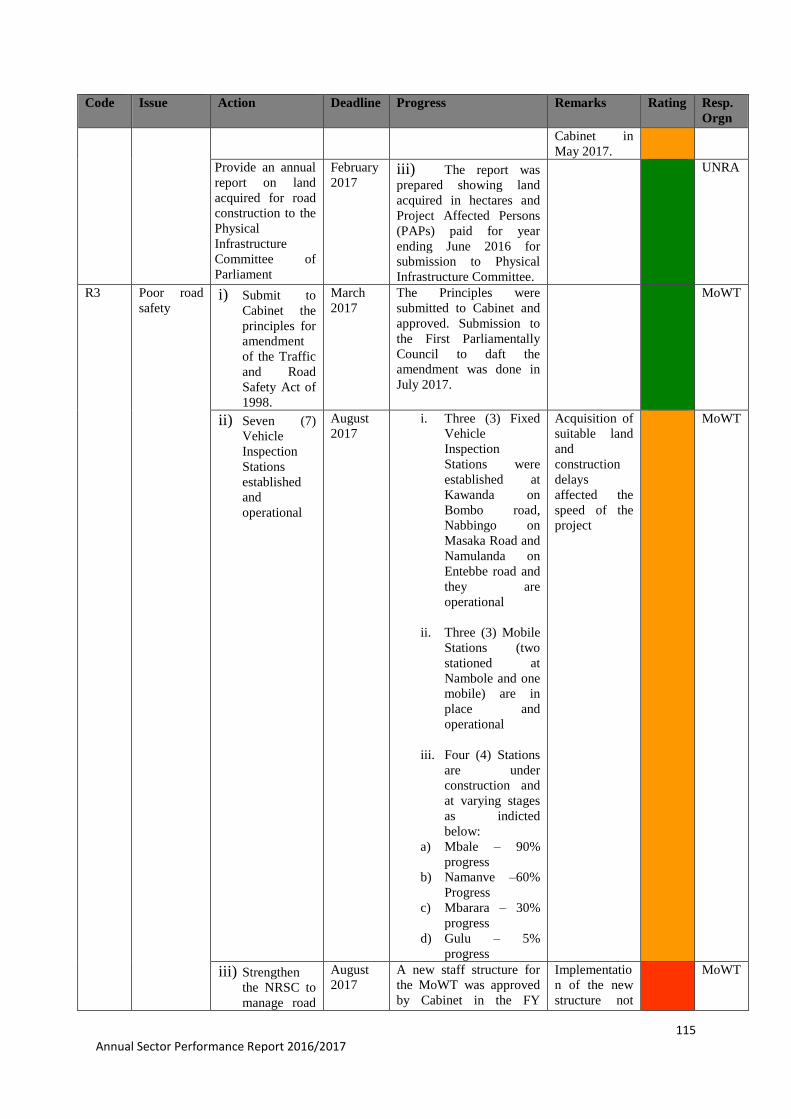
115 Annual Sector Performance Report 2016/2017
Code Issue Action Deadline Progress Remarks Rating Resp.
Orgn
Cabinet in
May 2017.
Provide an annual
report on land
acquired for road
construction to the
Physical
Infrastructure
Committee of
Parliament
February
2017 iii) The report was
prepared showing land
acquired in hectares and
Project Affected Persons
(PAPs) paid for year
ending June 2016 for
submission to Physical
Infrastructure Committee.
UNRA
R3 Poor road
safety i) Submit to
Cabinet the
principles for
amendment
of the Traffic
and Road
Safety Act of
1998.
March
2017
The Principles were
submitted to Cabinet and
approved. Submission to
the First Parliamentally
Council to daft the
amendment was done in
July 2017.
MoWT
ii) Seven (7)
Vehicle
Inspection
Stations
established
and
operational
August
2017
i. Three (3) Fixed
Vehicle
Inspection
Stations were
established at
Kawanda on
Bombo road,
Nabbingo on
Masaka Road and
Namulanda on
Entebbe road and
they are
operational
ii. Three (3) Mobile
Stations (two
stationed at
Nambole and one
mobile) are in
place and
operational
iii. Four (4) Stations
are under
construction and
at varying stages
as indicted
below:
a) Mbale – 90%
progress
b) Namanve –60%
Progress
c) Mbarara – 30%
progress
d) Gulu – 5%
progress
Acquisition of
suitable land
and
construction
delays
affected the
speed of the
project
MoWT
iii) Strengthen
the NRSC to
manage road
August
2017
A new staff structure for
the MoWT was approved
by Cabinet in the FY
Implementatio
n of the new
structure not
MoWT
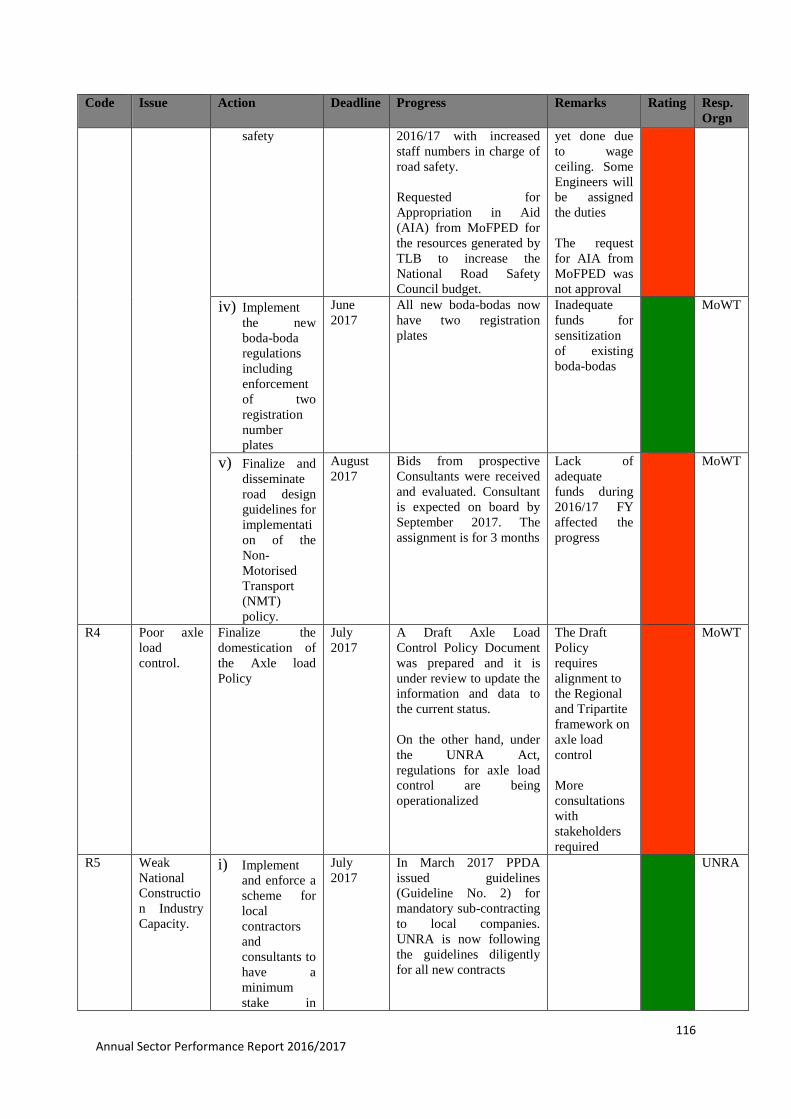
116 Annual Sector Performance Report 2016/2017
Code Issue Action Deadline Progress Remarks Rating Resp.
Orgn
safety 2016/17 with increased
staff numbers in charge of
road safety.
Requested for
Appropriation in Aid
(AIA) from MoFPED for
the resources generated by
TLB to increase the
National Road Safety
Council budget.
yet done due
to wage
ceiling. Some
Engineers will
be assigned
the duties
The request
for AIA from
MoFPED was
not approval
iv) Implement
the new
boda-boda
regulations
including
enforcement
of two
registration
number
plates
June
2017
All new boda-bodas now
have two registration
plates
Inadequate
funds for
sensitization
of existing
boda-bodas
MoWT
v) Finalize and
disseminate
road design
guidelines for
implementati
on of the
Non-
Motorised
Transport
(NMT)
policy.
August
2017
Bids from prospective
Consultants were received
and evaluated. Consultant
is expected on board by
September 2017. The
assignment is for 3 months
Lack of
adequate
funds during
2016/17 FY
affected the
progress
MoWT
R4 Poor axle
load
control.
Finalize the
domestication of
the Axle load
Policy
July
2017
A Draft Axle Load
Control Policy Document
was prepared and it is
under review to update the
information and data to
the current status.
On the other hand, under
the UNRA Act,
regulations for axle load
control are being
operationalized
The Draft
Policy
requires
alignment to
the Regional
and Tripartite
framework on
axle load
control
More
consultations
with
stakeholders
required
MoWT
R5 Weak
National
Constructio
n Industry
Capacity.
i) Implement
and enforce a
scheme for
local
contractors
and
consultants to
have a
minimum
stake in
July
2017
In March 2017 PPDA
issued guidelines
(Guideline No. 2) for
mandatory sub-contracting
to local companies.
UNRA is now following
the guidelines diligently
for all new contracts
UNRA
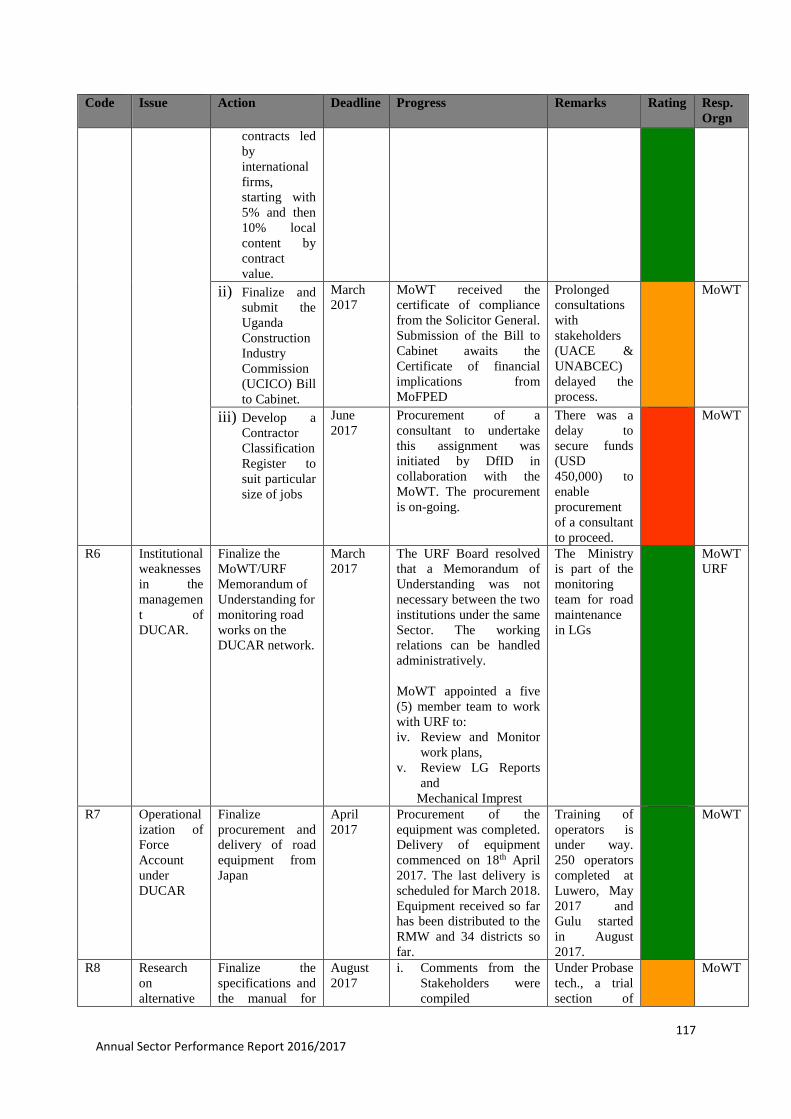
117 Annual Sector Performance Report 2016/2017
Code Issue Action Deadline Progress Remarks Rating Resp.
Orgn
contracts led
by
international
firms,
starting with
5% and then
10% local
content by
contract
value.
ii) Finalize and
submit the
Uganda
Construction
Industry
Commission
(UCICO) Bill
to Cabinet.
March
2017
MoWT received the
certificate of compliance
from the Solicitor General.
Submission of the Bill to
Cabinet awaits the
Certificate of financial
implications from
MoFPED
Prolonged
consultations
with
stakeholders
(UACE &
UNABCEC)
delayed the
process.
MoWT
iii) Develop a
Contractor
Classification
Register to
suit particular
size of jobs
June
2017
Procurement of a
consultant to undertake
this assignment was
initiated by DfID in
collaboration with the
MoWT. The procurement
is on-going.
There was a
delay to
secure funds
(USD
450,000) to
enable
procurement
of a consultant
to proceed.
MoWT
R6 Institutional
weaknesses
in the
managemen
t of
DUCAR.
Finalize the
MoWT/URF
Memorandum of
Understanding for
monitoring road
works on the
DUCAR network.
March
2017
The URF Board resolved
that a Memorandum of
Understanding was not
necessary between the two
institutions under the same
Sector. The working
relations can be handled
administratively.
MoWT appointed a five
(5) member team to work
with URF to:
iv. Review and Monitor
work plans,
v. Review LG Reports
and
Mechanical Imprest
The Ministry
is part of the
monitoring
team for road
maintenance
in LGs
MoWT
URF
R7 Operational
ization of
Force
Account
under
DUCAR
Finalize
procurement and
delivery of road
equipment from
Japan
April
2017
Procurement of the
equipment was completed.
Delivery of equipment
commenced on 18th April
2017. The last delivery is
scheduled for March 2018.
Equipment received so far
has been distributed to the
RMW and 34 districts so
far.
Training of
operators is
under way.
250 operators
completed at
Luwero, May
2017 and
Gulu started
in August
2017.
MoWT
R8 Research
on
alternative
Finalize the
specifications and
the manual for
August
2017
i. Comments from the
Stakeholders were
compiled
Under Probase
tech., a trial
section of
MoWT
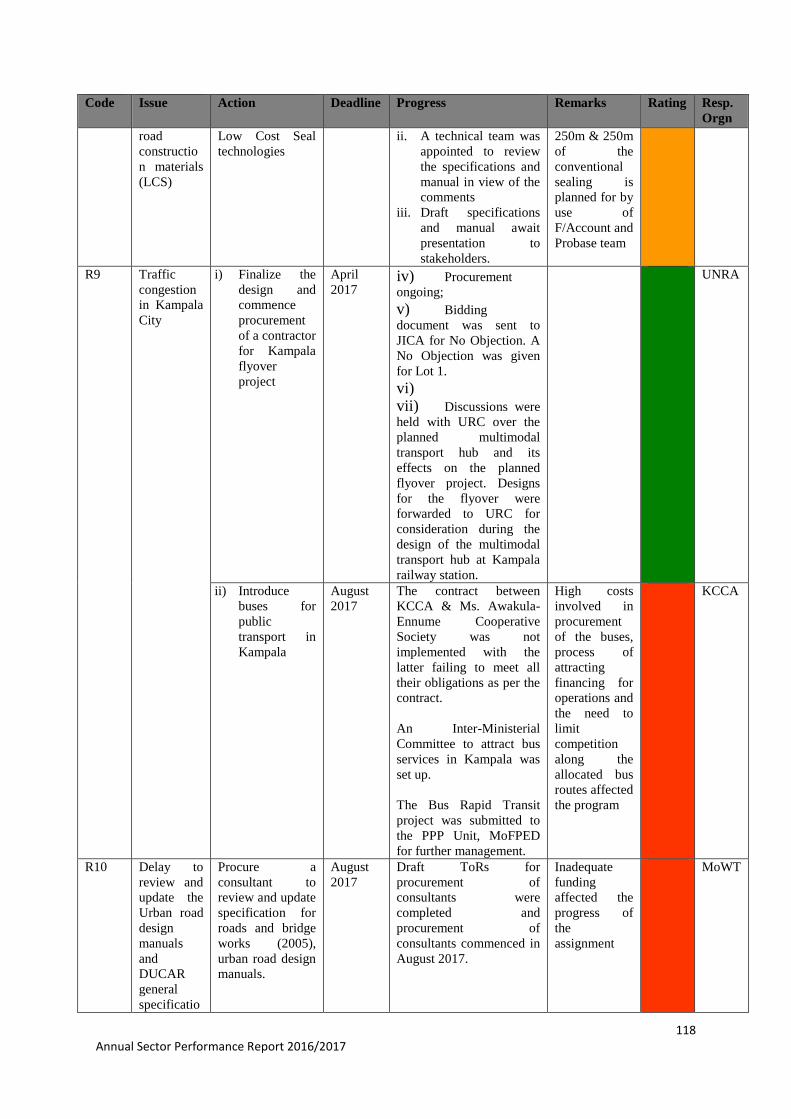
118 Annual Sector Performance Report 2016/2017
Code Issue Action Deadline Progress Remarks Rating Resp.
Orgn
road
constructio
n materials
(LCS)
Low Cost Seal
technologies
ii. A technical team was
appointed to review
the specifications and
manual in view of the
comments
iii. Draft specifications
and manual await
presentation to
stakeholders.
250m & 250m
of the
conventional
sealing is
planned for by
use of
F/Account and
Probase team
R9 Traffic
congestion
in Kampala
City
i) Finalize the
design and
commence
procurement
of a contractor
for Kampala
flyover
project
April
2017 iv) Procurement
ongoing;
v) Bidding
document was sent to
JICA for No Objection. A
No Objection was given
for Lot 1.
vi)
vii) Discussions were
held with URC over the
planned multimodal
transport hub and its
effects on the planned
flyover project. Designs
for the flyover were
forwarded to URC for
consideration during the
design of the multimodal
transport hub at Kampala
railway station.
UNRA
ii) Introduce
buses for
public
transport in
Kampala
August
2017
The contract between
KCCA & Ms. Awakula-
Ennume Cooperative
Society was not
implemented with the
latter failing to meet all
their obligations as per the
contract.
An Inter-Ministerial
Committee to attract bus
services in Kampala was
set up.
The Bus Rapid Transit
project was submitted to
the PPP Unit, MoFPED
for further management.
High costs
involved in
procurement
of the buses,
process of
attracting
financing for
operations and
the need to
limit
competition
along the
allocated bus
routes affected
the program
KCCA
R10 Delay to
review and
update the
Urban road
design
manuals
and
DUCAR
general
specificatio
Procure a
consultant to
review and update
specification for
roads and bridge
works (2005),
urban road design
manuals.
August
2017
Draft ToRs for
procurement of
consultants were
completed and
procurement of
consultants commenced in
August 2017.
Inadequate
funding
affected the
progress of
the
assignment
MoWT
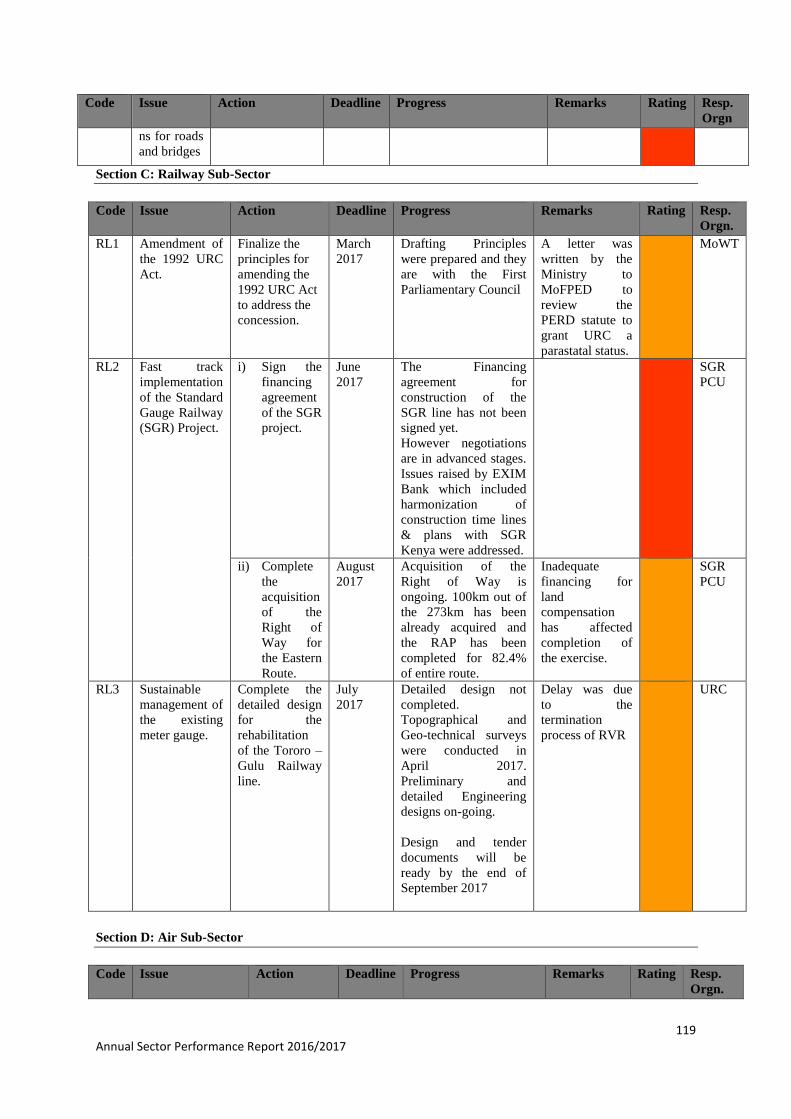
119 Annual Sector Performance Report 2016/2017
Code Issue Action Deadline Progress Remarks Rating Resp.
Orgn
ns for roads
and bridges
Section C: Railway Sub-Sector
Code Issue Action Deadline Progress Remarks Rating Resp.
Orgn.
RL1 Amendment of
the 1992 URC
Act.
Finalize the
principles for
amending the
1992 URC Act
to address the
concession.
March
2017
Drafting Principles
were prepared and they
are with the First
Parliamentary Council
A letter was
written by the
Ministry to
MoFPED to
review the
PERD statute to
grant URC a
parastatal status.
MoWT
RL2 Fast track
implementation
of the Standard
Gauge Railway
(SGR) Project.
i) Sign the
financing
agreement
of the SGR
project.
June
2017
The Financing
agreement for
construction of the
SGR line has not been
signed yet.
However negotiations
are in advanced stages.
Issues raised by EXIM
Bank which included
harmonization of
construction time lines
& plans with SGR
Kenya were addressed.
SGR
PCU
ii) Complete
the
acquisition
of the
Right of
Way for
the Eastern
Route.
August
2017
Acquisition of the
Right of Way is
ongoing. 100km out of
the 273km has been
already acquired and
the RAP has been
completed for 82.4%
of entire route.
Inadequate
financing for
land
compensation
has affected
completion of
the exercise.
SGR
PCU
RL3 Sustainable
management of
the existing
meter gauge.
Complete the
detailed design
for the
rehabilitation
of the Tororo –
Gulu Railway
line.
July
2017
Detailed design not
completed.
Topographical and
Geo-technical surveys
were conducted in
April 2017.
Preliminary and
detailed Engineering
designs on-going.
Design and tender
documents will be
ready by the end of
September 2017
Delay was due
to the
termination
process of RVR
URC
Section D: Air Sub-Sector
Code Issue Action Deadline Progress Remarks Rating Resp.
Orgn.
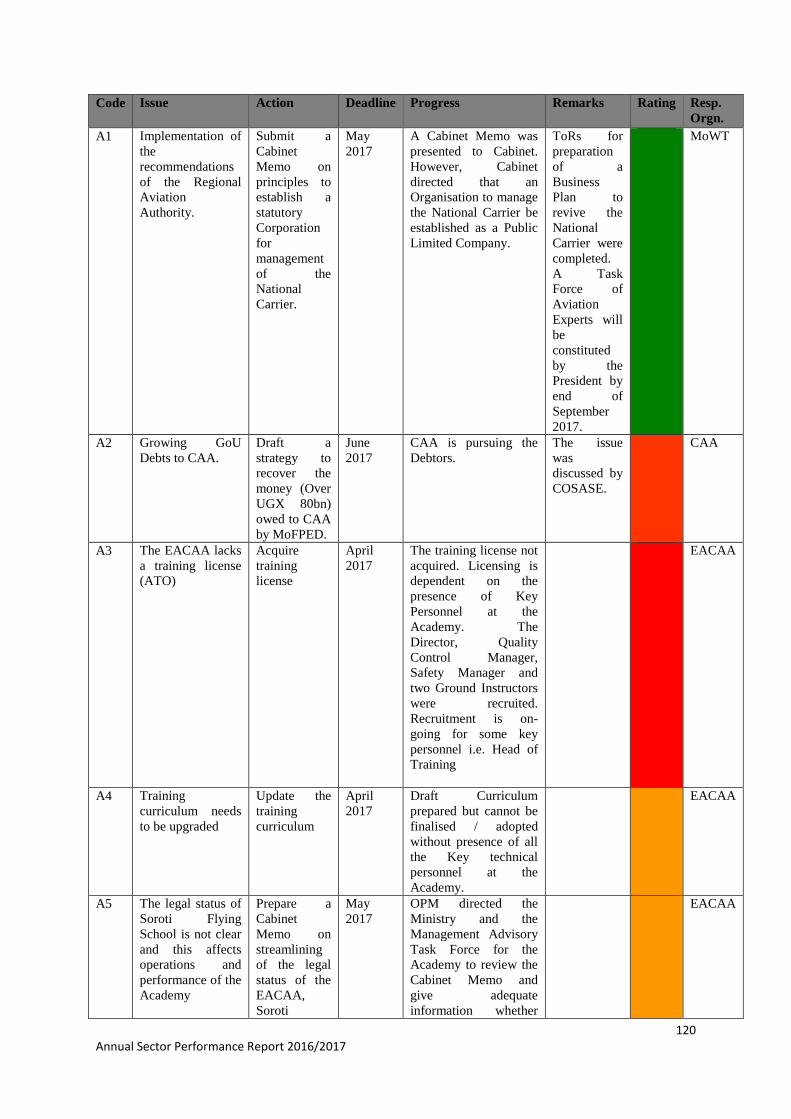
120 Annual Sector Performance Report 2016/2017
Code Issue Action Deadline Progress Remarks Rating Resp.
Orgn.
A1 Implementation of
the
recommendations
of the Regional
Aviation
Authority.
Submit a
Cabinet
Memo on
principles to
establish a
statutory
Corporation
for
management
of the
National
Carrier.
May
2017
A Cabinet Memo was
presented to Cabinet.
However, Cabinet
directed that an
Organisation to manage
the National Carrier be
established as a Public
Limited Company.
ToRs for
preparation
of a
Business
Plan to
revive the
National
Carrier were
completed.
A Task
Force of
Aviation
Experts will
be
constituted
by the
President by
end of
September
2017.
MoWT
A2 Growing GoU
Debts to CAA.
Draft a
strategy to
recover the
money (Over
UGX 80bn)
owed to CAA
by MoFPED.
June
2017
CAA is pursuing the
Debtors.
The issue
was
discussed by
COSASE.
CAA
A3 The EACAA lacks
a training license
(ATO)
Acquire
training
license
April
2017
The training license not
acquired. Licensing is
dependent on the
presence of Key
Personnel at the
Academy. The
Director, Quality
Control Manager,
Safety Manager and
two Ground Instructors
were recruited.
Recruitment is on-
going for some key
personnel i.e. Head of
Training
EACAA
A4 Training
curriculum needs
to be upgraded
Update the
training
curriculum
April
2017
Draft Curriculum
prepared but cannot be
finalised / adopted
without presence of all
the Key technical
personnel at the
Academy.
EACAA
A5 The legal status of
Soroti Flying
School is not clear
and this affects
operations and
performance of the
Academy
Prepare a
Cabinet
Memo on
streamlining
of the legal
status of the
EACAA,
Soroti
May
2017
OPM directed the
Ministry and the
Management Advisory
Task Force for the
Academy to review the
Cabinet Memo and
give adequate
information whether
EACAA
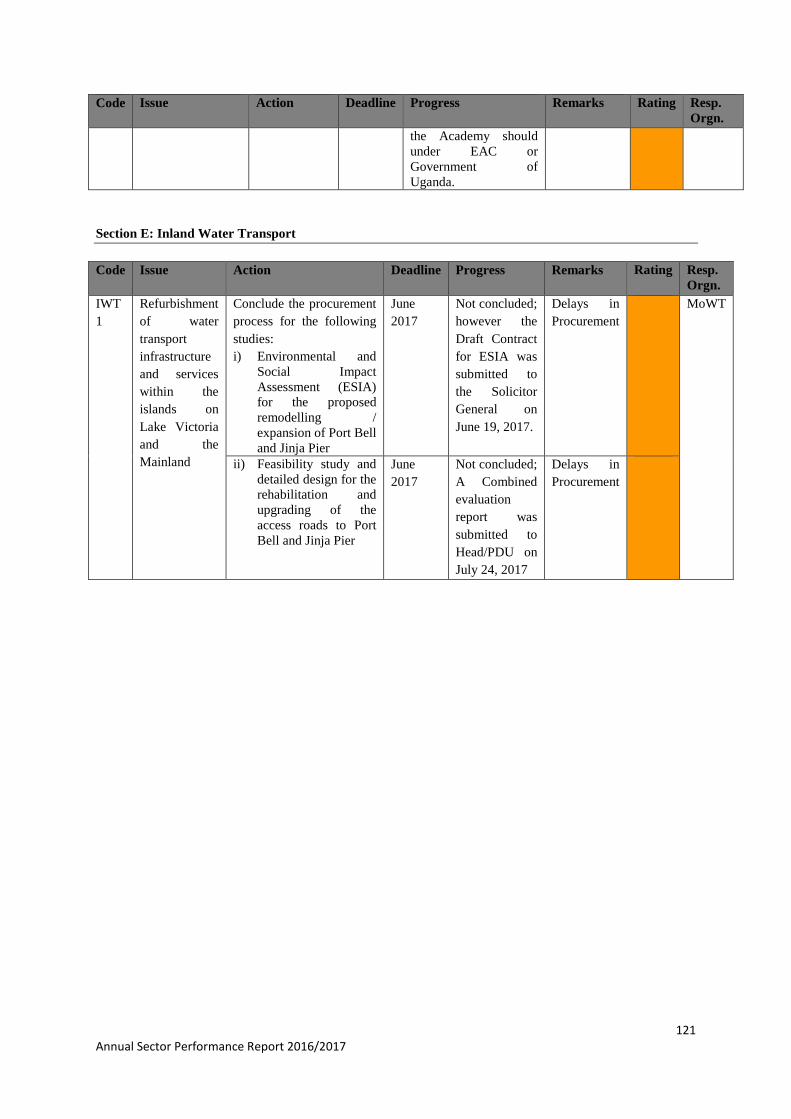
121 Annual Sector Performance Report 2016/2017
Code Issue Action Deadline Progress Remarks Rating Resp.
Orgn.
the Academy should
under EAC or
Government of
Uganda.
Section E: Inland Water Transport
Code Issue Action Deadline Progress Remarks Rating Resp.
Orgn.
IWT
1
Refurbishment
of water
transport
infrastructure
and services
within the
islands on
Lake Victoria
and the
Mainland
Conclude the procurement
process for the following
studies:
i) Environmental and
Social Impact
Assessment (ESIA)
for the proposed
remodelling /
expansion of Port Bell
and Jinja Pier
June
2017
Not concluded;
however the
Draft Contract
for ESIA was
submitted to
the Solicitor
General on
June 19, 2017.
Delays in
Procurement
MoWT
ii) Feasibility study and
detailed design for the
rehabilitation and
upgrading of the
access roads to Port
Bell and Jinja Pier
June
2017
Not concluded;
A Combined
evaluation
report was
submitted to
Head/PDU on
July 24, 2017
Delays in
Procurement
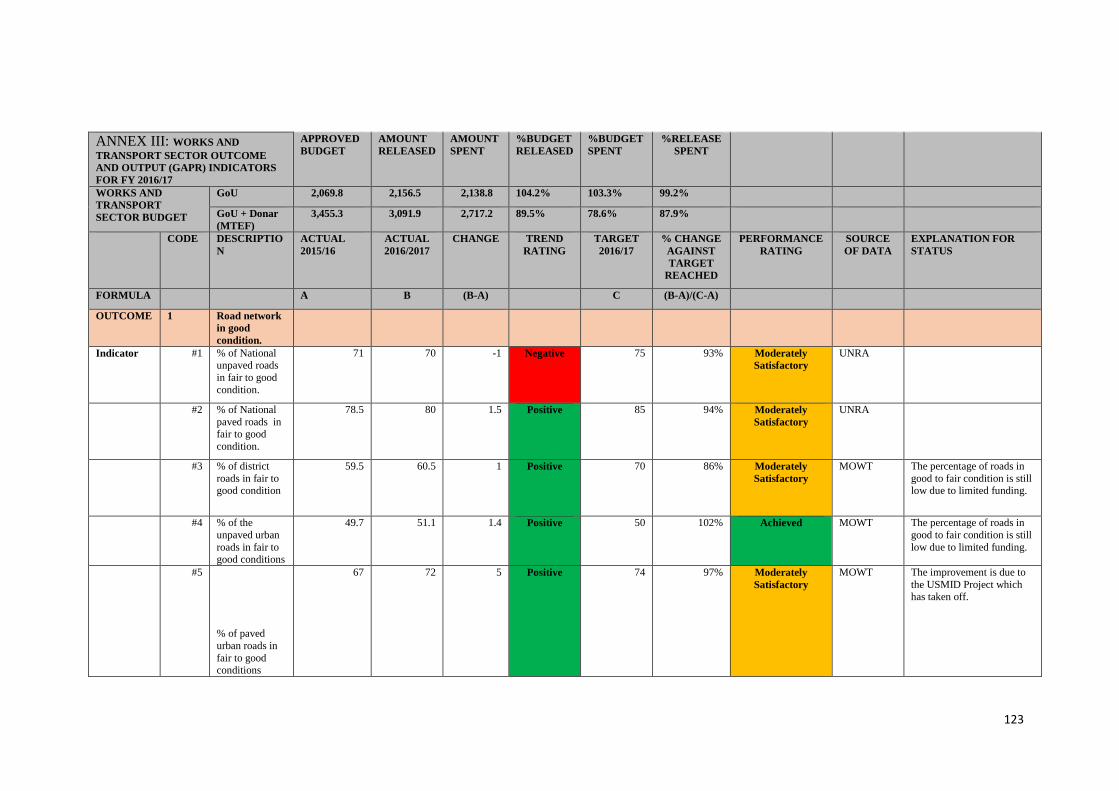
123
ANNEX III: WORKS AND
TRANSPORT SECTOR OUTCOME
AND OUTPUT (GAPR) INDICATORS
FOR FY 2016/17
APPROVED
BUDGET
AMOUNT
RELEASED
AMOUNT
SPENT
%BUDGET
RELEASED
%BUDGET
SPENT
%RELEASE
SPENT
WORKS AND
TRANSPORT
SECTOR BUDGET
GoU 2,069.8 2,156.5 2,138.8 104.2% 103.3% 99.2%
GoU + Donar
(MTEF)
3,455.3 3,091.9 2,717.2 89.5% 78.6% 87.9%
CODE DESCRIPTIO
N
ACTUAL
2015/16
ACTUAL
2016/2017
CHANGE TREND
RATING
TARGET
2016/17
% CHANGE
AGAINST
TARGET
REACHED
PERFORMANCE
RATING
SOURCE
OF DATA
EXPLANATION FOR
STATUS
FORMULA A B (B-A) C (B-A)/(C-A)
OUTCOME 1 Road network
in good
condition.
Indicator #1 % of National unpaved roads
in fair to good
condition.
71 70 -1 Negative 75 93% Moderately
Satisfactory
UNRA
#2 % of National
paved roads in fair to good
condition.
78.5 80 1.5 Positive 85 94% Moderately
Satisfactory
UNRA
#3 % of district
roads in fair to good condition
59.5 60.5 1 Positive 70 86% Moderately
Satisfactory
MOWT The percentage of roads in
good to fair condition is still low due to limited funding.
#4 % of the
unpaved urban
roads in fair to good conditions
49.7 51.1 1.4 Positive 50 102% Achieved MOWT The percentage of roads in
good to fair condition is still
low due to limited funding.
#5
% of paved
urban roads in
fair to good conditions
67 72 5 Positive 74 97% Moderately
Satisfactory
MOWT The improvement is due to
the USMID Project which
has taken off.
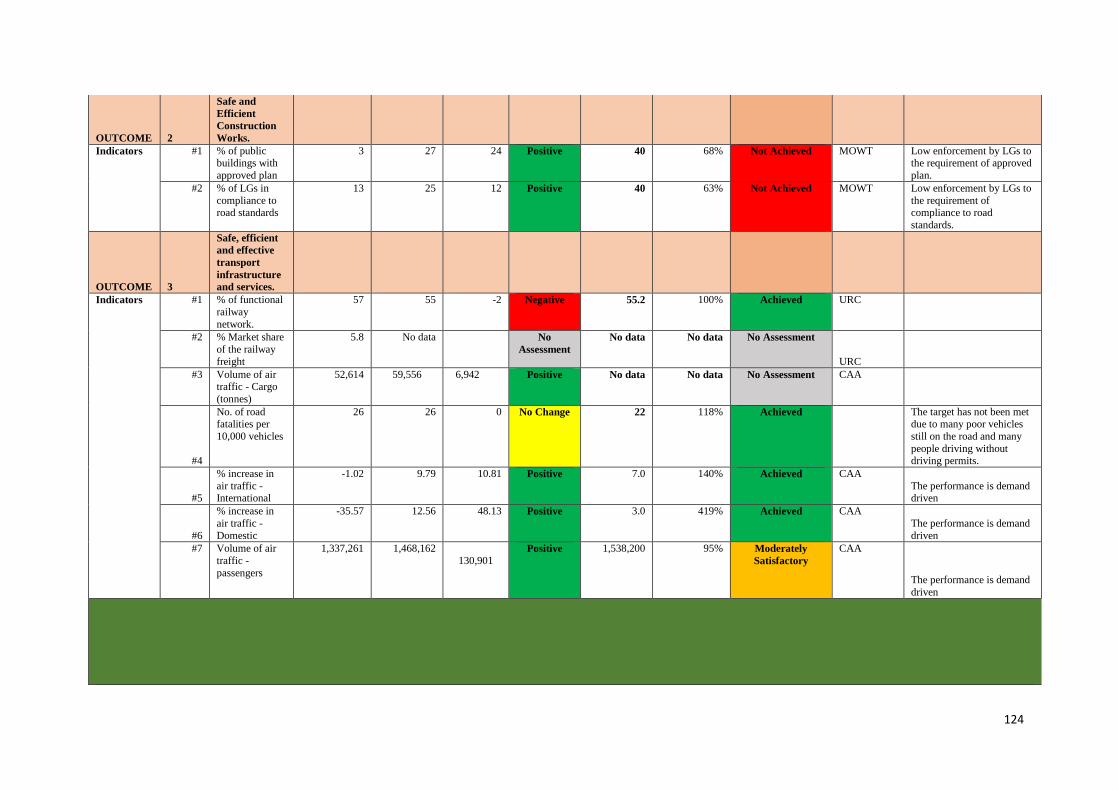
124
OUTCOME 2
Safe and
Efficient
Construction
Works.
Indicators #1 % of public buildings with
approved plan
3 27 24 Positive 40 68% Not Achieved MOWT Low enforcement by LGs to the requirement of approved
plan.
#2 % of LGs in
compliance to road standards
13 25 12 Positive 40 63% Not Achieved MOWT Low enforcement by LGs to
the requirement of compliance to road
standards.
OUTCOME 3
Safe, efficient
and effective
transport
infrastructure
and services.
Indicators #1 % of functional
railway
network.
57 55 -2 Negative 55.2 100% Achieved URC
#2 % Market share
of the railway
freight
5.8 No data No
Assessment
No data No data No Assessment
URC
#3 Volume of air traffic - Cargo
(tonnes)
52,614 59,556 6,942 Positive No data No data No Assessment CAA
#4
No. of road
fatalities per
10,000 vehicles
26 26 0 No Change 22 118% Achieved The target has not been met
due to many poor vehicles
still on the road and many
people driving without driving permits.
#5
% increase in
air traffic - International
-1.02 9.79 10.81 Positive 7.0 140% Achieved CAA
The performance is demand driven
#6
% increase in
air traffic -
Domestic
-35.57 12.56 48.13 Positive 3.0 419% Achieved CAA
The performance is demand
driven
#7 Volume of air
traffic -
passengers
1,337,261 1,468,162
130,901 Positive 1,538,200 95% Moderately
Satisfactory
CAA
The performance is demand
driven
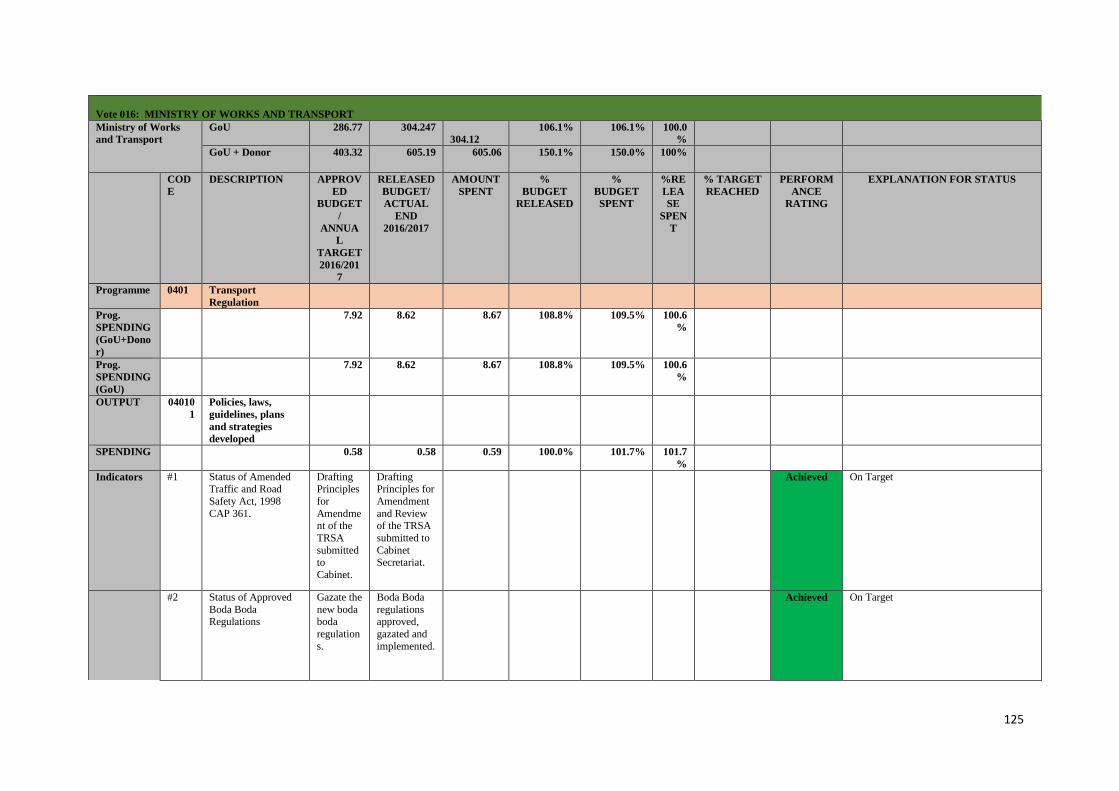
125
Vote 016: MINISTRY OF WORKS AND TRANSPORT
Ministry of Works
and Transport
GoU 286.77 304.247
304.12
106.1% 106.1% 100.0
%
GoU + Donor 403.32 605.19 605.06 150.1% 150.0% 100%
COD
E
DESCRIPTION APPROV
ED
BUDGET
/
ANNUA
L
TARGET
2016/201
7
RELEASED
BUDGET/
ACTUAL
END
2016/2017
AMOUNT
SPENT
%
BUDGET
RELEASED
%
BUDGET
SPENT
%RE
LEA
SE
SPEN
T
% TARGET
REACHED
PERFORM
ANCE
RATING
EXPLANATION FOR STATUS
Programme 0401 Transport
Regulation
Prog.
SPENDING
(GoU+Dono
r)
7.92 8.62 8.67 108.8% 109.5% 100.6
%
Prog.
SPENDING
(GoU)
7.92 8.62 8.67 108.8% 109.5% 100.6
%
OUTPUT 04010
1
Policies, laws,
guidelines, plans
and strategies
developed
SPENDING 0.58 0.58 0.59 100.0% 101.7% 101.7
%
Indicators #1 Status of Amended Traffic and Road
Safety Act, 1998
CAP 361.
Drafting Principles
for
Amendment of the
TRSA
submitted to
Cabinet.
Drafting Principles for
Amendment
and Review of the TRSA
submitted to
Cabinet Secretariat.
Achieved On Target
#2 Status of Approved
Boda Boda Regulations
Gazate the
new boda boda
regulation
s.
Boda Boda
regulations approved,
gazated and
implemented.
Achieved On Target
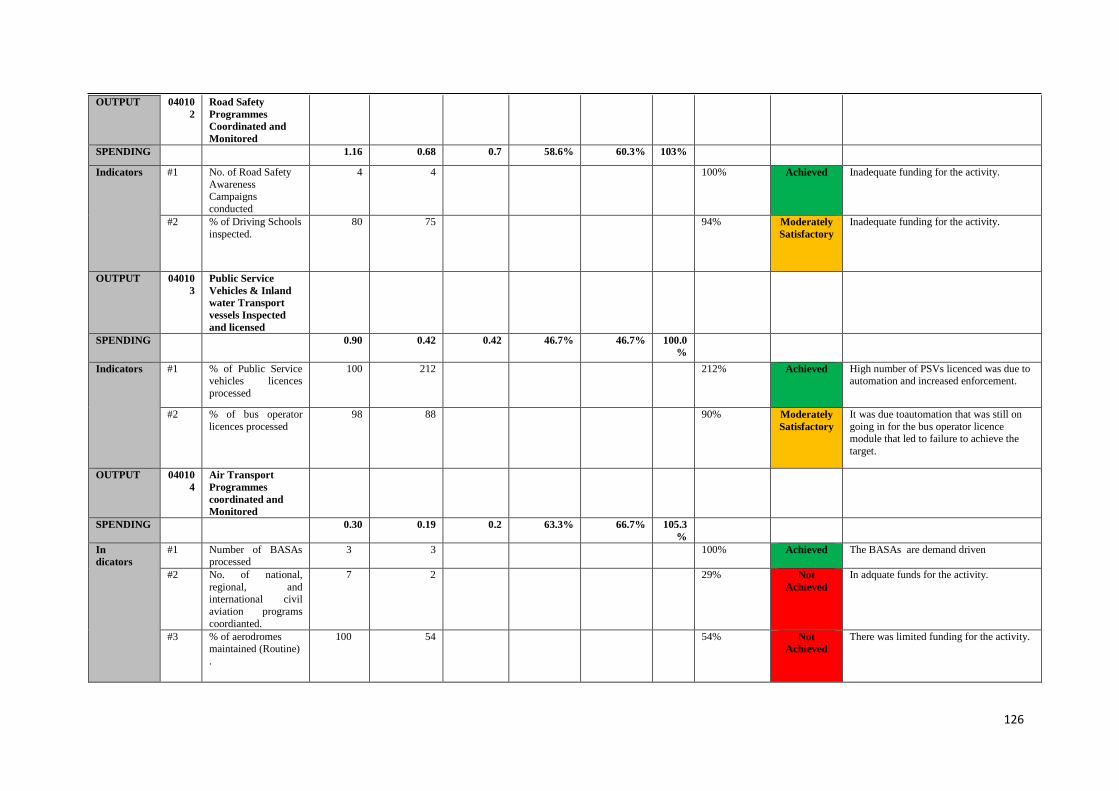
126
OUTPUT 04010
2
Road Safety
Programmes
Coordinated and
Monitored
SPENDING 1.16 0.68 0.7 58.6% 60.3% 103%
Indicators #1 No. of Road Safety
Awareness Campaigns
conducted
4 4 100% Achieved Inadequate funding for the activity.
#2 % of Driving Schools
inspected.
80 75 94% Moderately
Satisfactory
Inadequate funding for the activity.
OUTPUT 04010
3
Public Service
Vehicles & Inland
water Transport
vessels Inspected
and licensed
SPENDING 0.90 0.42 0.42 46.7% 46.7% 100.0
%
Indicators #1 % of Public Service vehicles licences
processed
100 212 212% Achieved High number of PSVs licenced was due to automation and increased enforcement.
#2 % of bus operator
licences processed
98 88 90% Moderately
Satisfactory
It was due toautomation that was still on
going in for the bus operator licence module that led to failure to achieve the
target.
OUTPUT 04010
4
Air Transport
Programmes
coordinated and
Monitored
SPENDING 0.30 0.19 0.2 63.3% 66.7% 105.3
%
In
dicators
#1 Number of BASAs processed
3 3 100% Achieved The BASAs are demand driven
#2 No. of national,
regional, and international civil
aviation programs
coordianted.
7 2 29% Not
Achieved
In adquate funds for the activity.
#3 % of aerodromes maintained (Routine)
.
100 54 54% Not
Achieved
There was limited funding for the activity.
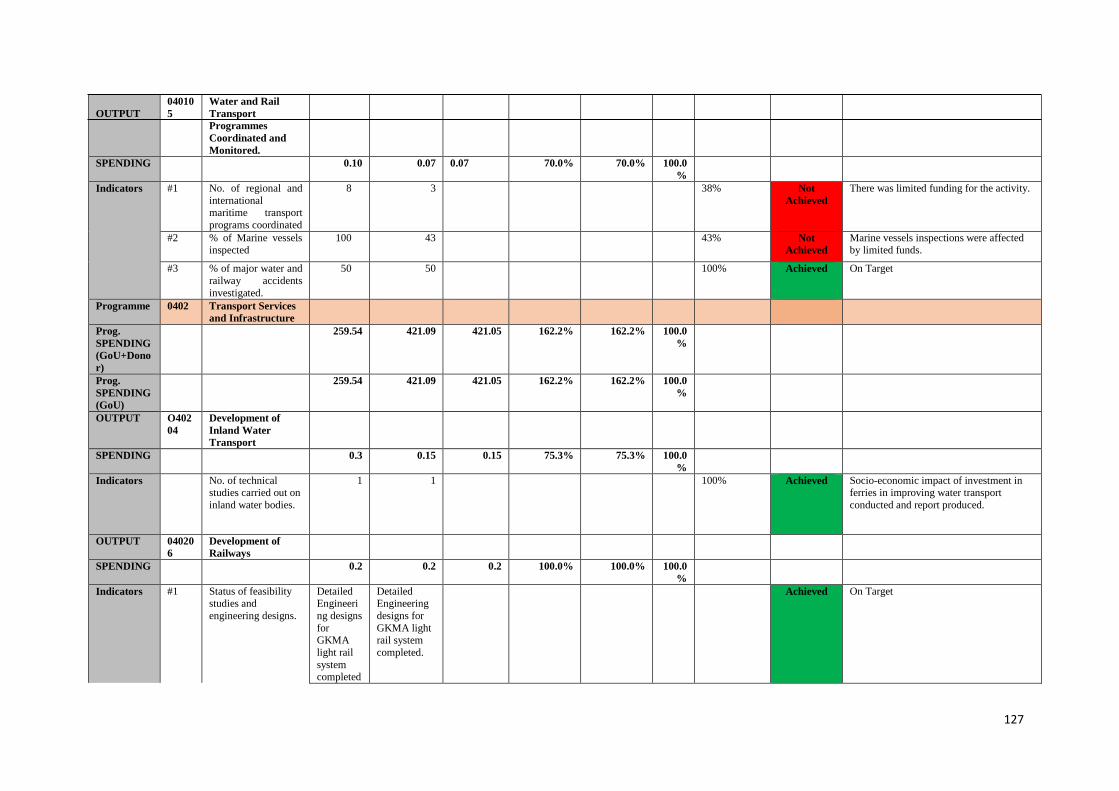
127
OUTPUT
04010
5
Water and Rail
Transport
Programmes
Coordinated and
Monitored.
SPENDING 0.10 0.07 0.07 70.0% 70.0% 100.0
%
Indicators #1 No. of regional and
international maritime transport
programs coordinated
8 3 38% Not
Achieved
There was limited funding for the activity.
#2 % of Marine vessels
inspected
100 43 43% Not
Achieved
Marine vessels inspections were affected
by limited funds.
#3 % of major water and
railway accidents
investigated.
50 50 100% Achieved On Target
Programme 0402 Transport Services
and Infrastructure
Prog.
SPENDING
(GoU+Dono
r)
259.54 421.09 421.05 162.2% 162.2% 100.0
%
Prog.
SPENDING
(GoU)
259.54 421.09 421.05 162.2% 162.2% 100.0
%
OUTPUT O402
04
Development of
Inland Water
Transport
SPENDING 0.3 0.15 0.15 75.3% 75.3% 100.0
%
Indicators No. of technical studies carried out on
inland water bodies.
1 1 100% Achieved Socio-economic impact of investment in ferries in improving water transport
conducted and report produced.
OUTPUT 04020
6
Development of
Railways
SPENDING 0.2 0.2 0.2 100.0% 100.0% 100.0
%
Indicators #1 Status of feasibility studies and
engineering designs.
Detailed Engineeri
ng designs
for GKMA
light rail
system completed
Detailed Engineering
designs for
GKMA light rail system
completed.
Achieved On Target
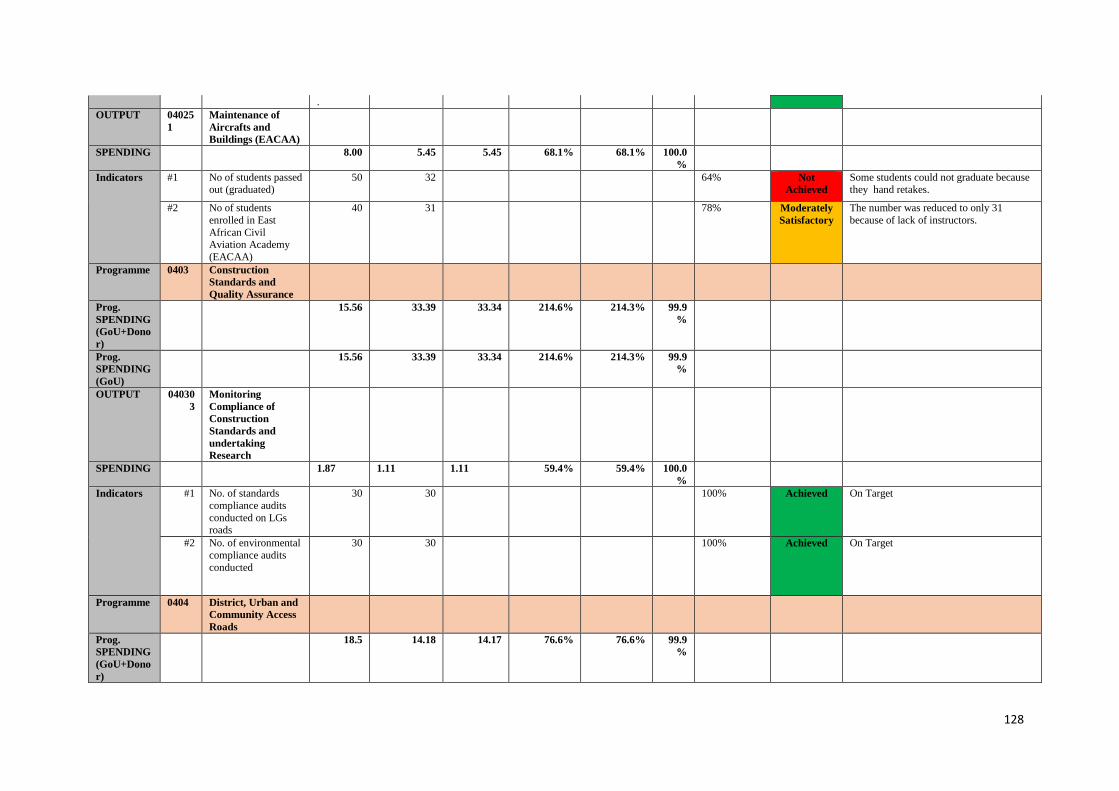
128
.
OUTPUT 04025
1
Maintenance of
Aircrafts and
Buildings (EACAA)
SPENDING 8.00 5.45 5.45 68.1% 68.1% 100.0
%
Indicators #1 No of students passed out (graduated)
50 32 64% Not
Achieved
Some students could not graduate because they hand retakes.
#2 No of students
enrolled in East
African Civil Aviation Academy
(EACAA)
40 31 78% Moderately
Satisfactory
The number was reduced to only 31
because of lack of instructors.
Programme 0403 Construction
Standards and
Quality Assurance
Prog.
SPENDING
(GoU+Dono
r)
15.56 33.39 33.34 214.6% 214.3% 99.9
%
Prog.
SPENDING
(GoU)
15.56 33.39 33.34 214.6% 214.3% 99.9
%
OUTPUT 04030
3
Monitoring
Compliance of
Construction
Standards and
undertaking
Research
SPENDING 1.87 1.11 1.11 59.4% 59.4% 100.0
%
Indicators #1 No. of standards
compliance audits
conducted on LGs roads
30 30 100% Achieved On Target
#2 No. of environmental
compliance audits
conducted
30 30 100% Achieved On Target
Programme 0404 District, Urban and
Community Access
Roads
Prog.
SPENDING
(GoU+Dono
r)
18.5 14.18 14.17 76.6% 76.6% 99.9
%
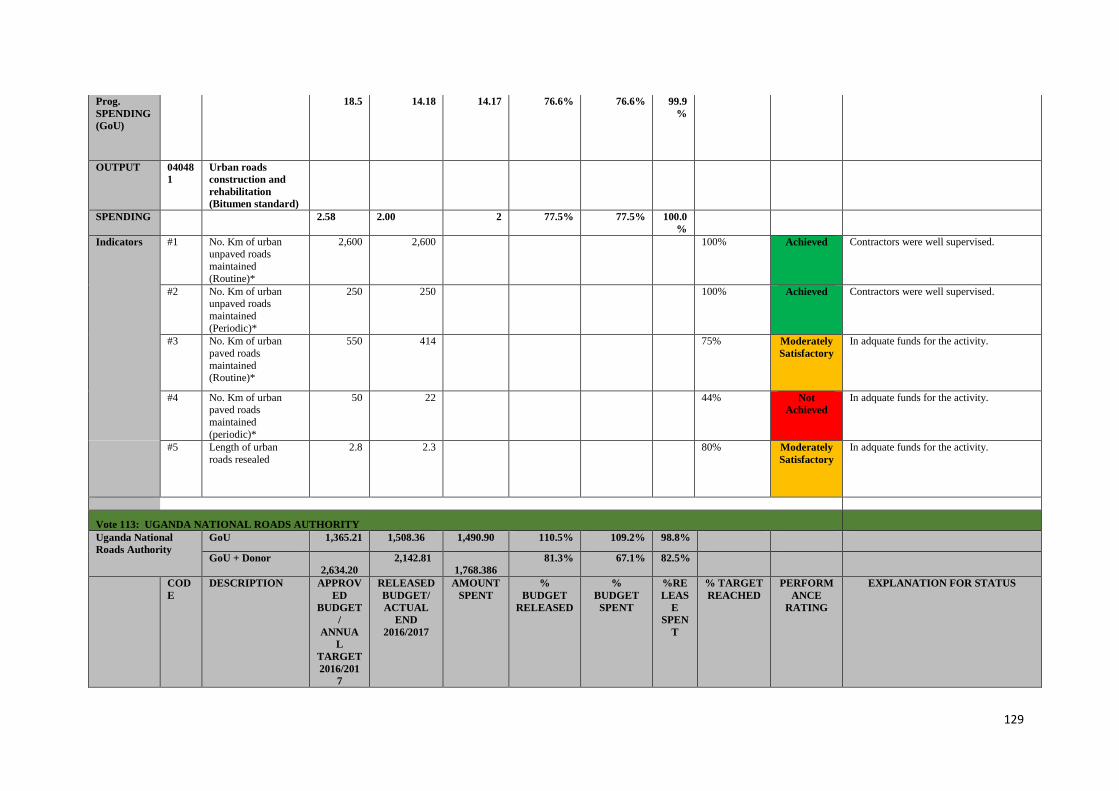
129
Prog.
SPENDING
(GoU)
18.5 14.18 14.17 76.6% 76.6% 99.9
%
OUTPUT 04048
1
Urban roads
construction and
rehabilitation
(Bitumen standard)
SPENDING 2.58 2.00 2 77.5% 77.5% 100.0
%
Indicators #1 No. Km of urban
unpaved roads
maintained
(Routine)*
2,600 2,600 100% Achieved Contractors were well supervised.
#2 No. Km of urban unpaved roads
maintained
(Periodic)*
250 250 100% Achieved Contractors were well supervised.
#3 No. Km of urban
paved roads
maintained (Routine)*
550 414 75% Moderately
Satisfactory
In adquate funds for the activity.
#4 No. Km of urban paved roads
maintained
(periodic)*
50 22 44% Not
Achieved
In adquate funds for the activity.
#5 Length of urban
roads resealed
2.8 2.3 80% Moderately
Satisfactory
In adquate funds for the activity.
Vote 113: UGANDA NATIONAL ROADS AUTHORITY
Uganda National
Roads Authority
GoU 1,365.21 1,508.36 1,490.90 110.5% 109.2% 98.8%
GoU + Donor
2,634.20
2,142.81
1,768.386
81.3% 67.1% 82.5%
COD
E
DESCRIPTION APPROV
ED
BUDGET
/
ANNUA
L
TARGET
2016/201
7
RELEASED
BUDGET/
ACTUAL
END
2016/2017
AMOUNT
SPENT
%
BUDGET
RELEASED
%
BUDGET
SPENT
%RE
LEAS
E
SPEN
T
% TARGET
REACHED
PERFORM
ANCE
RATING
EXPLANATION FOR STATUS
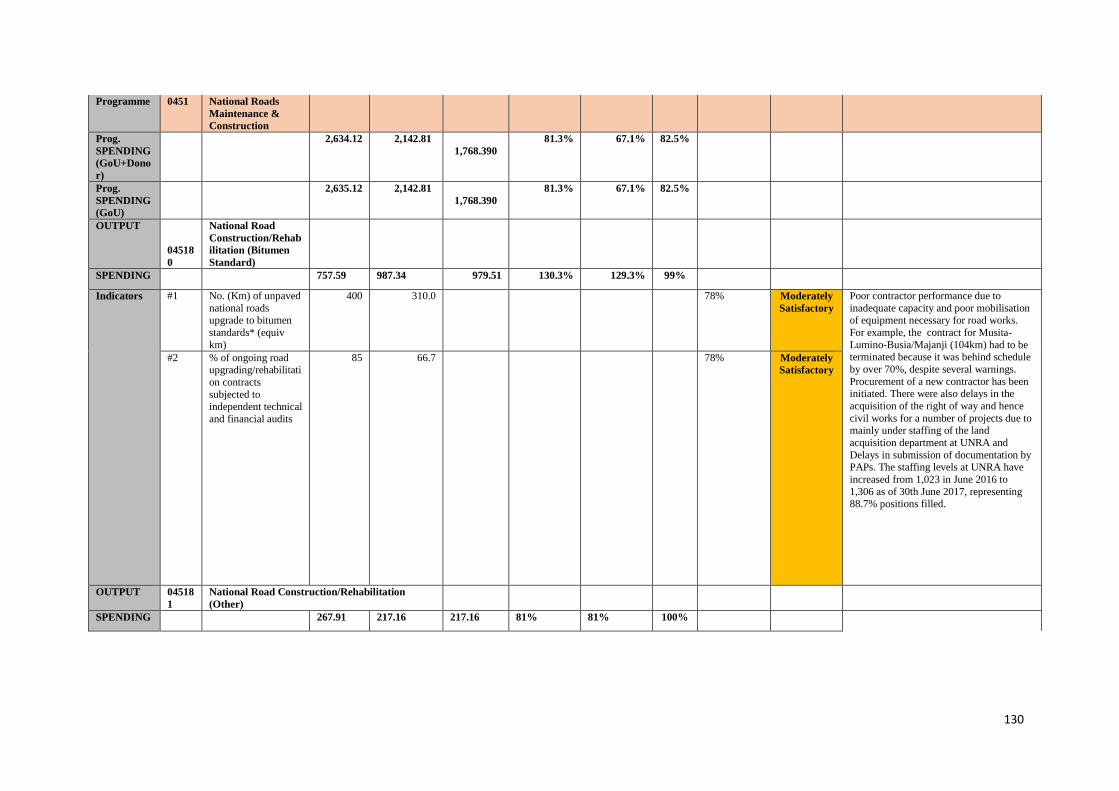
130
Programme 0451 National Roads
Maintenance &
Construction
Prog.
SPENDING
(GoU+Dono
r)
2,634.12 2,142.81
1,768.390
81.3% 67.1% 82.5%
Prog.
SPENDING
(GoU)
2,635.12 2,142.81
1,768.390
81.3% 67.1% 82.5%
OUTPUT
04518
0
National Road
Construction/Rehab
ilitation (Bitumen
Standard)
SPENDING 757.59 987.34 979.51 130.3% 129.3% 99%
Indicators #1 No. (Km) of unpaved
national roads upgrade to bitumen
standards* (equiv
km)
400 310.0 78% Moderately
Satisfactory
Poor contractor performance due to
inadequate capacity and poor mobilisation of equipment necessary for road works.
For example, the contract for Musita-
Lumino-Busia/Majanji (104km) had to be terminated because it was behind schedule
by over 70%, despite several warnings.
Procurement of a new contractor has been initiated. There were also delays in the
acquisition of the right of way and hence
civil works for a number of projects due to mainly under staffing of the land
acquisition department at UNRA and
Delays in submission of documentation by PAPs. The staffing levels at UNRA have
increased from 1,023 in June 2016 to
1,306 as of 30th June 2017, representing 88.7% positions filled.
#2 % of ongoing road upgrading/rehabilitati
on contracts
subjected to independent technical
and financial audits
85 66.7 78% Moderately
Satisfactory
OUTPUT 04518
1
National Road Construction/Rehabilitation
(Other)
SPENDING 267.91 217.16 217.16 81% 81% 100%
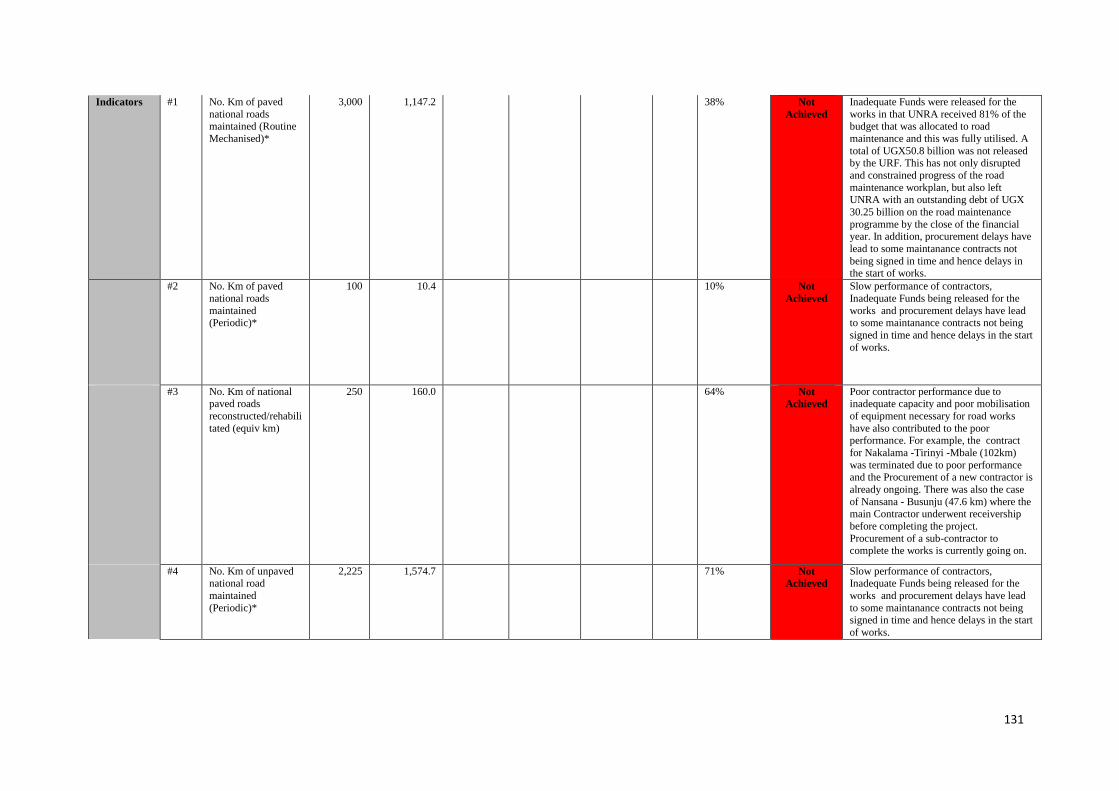
131
Indicators #1 No. Km of paved
national roads maintained (Routine
Mechanised)*
3,000 1,147.2 38% Not
Achieved
Inadequate Funds were released for the
works in that UNRA received 81% of the budget that was allocated to road
maintenance and this was fully utilised. A
total of UGX50.8 billion was not released by the URF. This has not only disrupted
and constrained progress of the road
maintenance workplan, but also left UNRA with an outstanding debt of UGX
30.25 billion on the road maintenance
programme by the close of the financial year. In addition, procurement delays have
lead to some maintanance contracts not
being signed in time and hence delays in the start of works.
#2 No. Km of paved
national roads
maintained (Periodic)*
100 10.4 10% Not
Achieved
Slow performance of contractors,
Inadequate Funds being released for the
works and procurement delays have lead to some maintanance contracts not being
signed in time and hence delays in the start
of works.
#3 No. Km of national paved roads
reconstructed/rehabili
tated (equiv km)
250 160.0 64% Not
Achieved
Poor contractor performance due to inadequate capacity and poor mobilisation
of equipment necessary for road works
have also contributed to the poor performance. For example, the contract
for Nakalama -Tirinyi -Mbale (102km)
was terminated due to poor performance and the Procurement of a new contractor is
already ongoing. There was also the case
of Nansana - Busunju (47.6 km) where the main Contractor underwent receivership
before completing the project.
Procurement of a sub-contractor to complete the works is currently going on.
#4 No. Km of unpaved national road
maintained
(Periodic)*
2,225 1,574.7 71% Not
Achieved
Slow performance of contractors, Inadequate Funds being released for the
works and procurement delays have lead
to some maintanance contracts not being signed in time and hence delays in the start
of works.
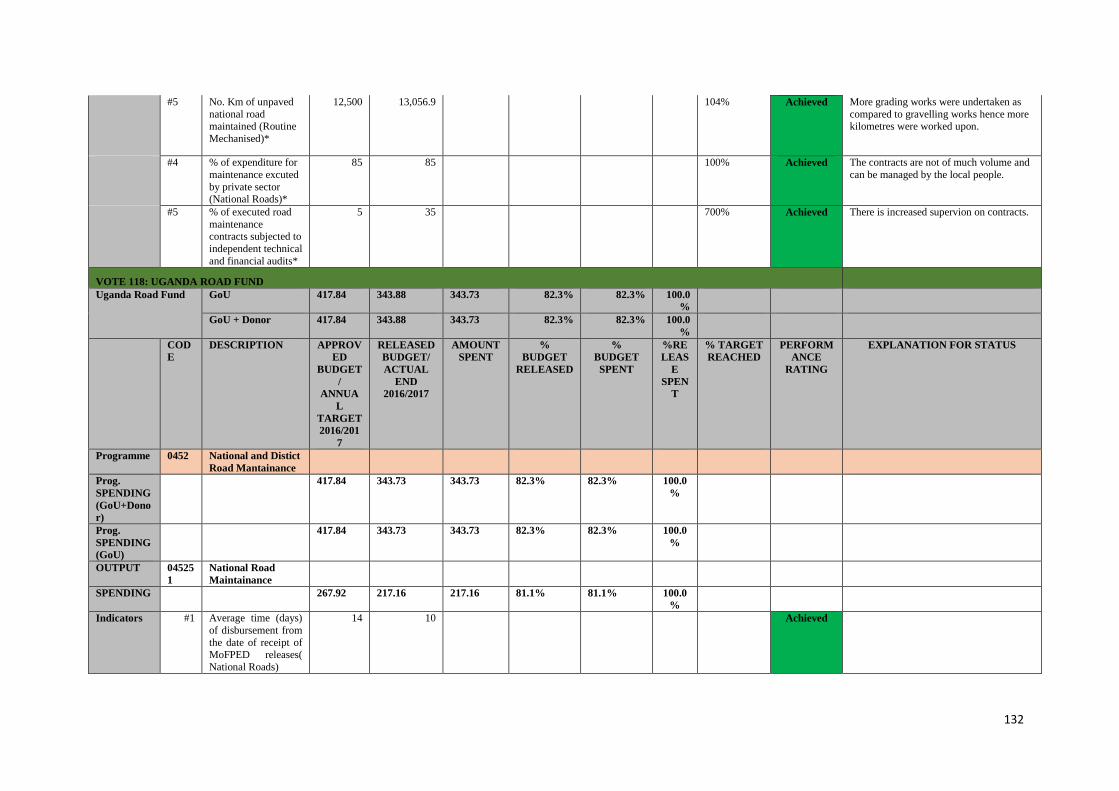
132
#5 No. Km of unpaved
national road maintained (Routine
Mechanised)*
12,500 13,056.9
104% Achieved More grading works were undertaken as
compared to gravelling works hence more kilometres were worked upon.
#4 % of expenditure for
maintenance excuted
by private sector (National Roads)*
85 85 100% Achieved The contracts are not of much volume and
can be managed by the local people.
#5 % of executed road
maintenance contracts subjected to
independent technical
and financial audits*
5 35 700% Achieved There is increased supervion on contracts.
VOTE 118: UGANDA ROAD FUND
Uganda Road Fund GoU 417.84 343.88 343.73 82.3% 82.3% 100.0
%
GoU + Donor 417.84 343.88 343.73 82.3% 82.3% 100.0
%
COD
E
DESCRIPTION APPROV
ED
BUDGET
/
ANNUA
L
TARGET
2016/201
7
RELEASED
BUDGET/
ACTUAL
END
2016/2017
AMOUNT
SPENT
%
BUDGET
RELEASED
%
BUDGET
SPENT
%RE
LEAS
E
SPEN
T
% TARGET
REACHED
PERFORM
ANCE
RATING
EXPLANATION FOR STATUS
Programme 0452 National and Distict
Road Mantainance
Prog.
SPENDING
(GoU+Dono
r)
417.84 343.73 343.73 82.3% 82.3% 100.0
%
Prog.
SPENDING
(GoU)
417.84 343.73 343.73 82.3% 82.3% 100.0
%
OUTPUT 04525
1
National Road
Maintainance
SPENDING 267.92 217.16 217.16 81.1% 81.1% 100.0
%
Indicators #1 Average time (days)
of disbursement from
the date of receipt of MoFPED releases(
National Roads)
14 10 Achieved
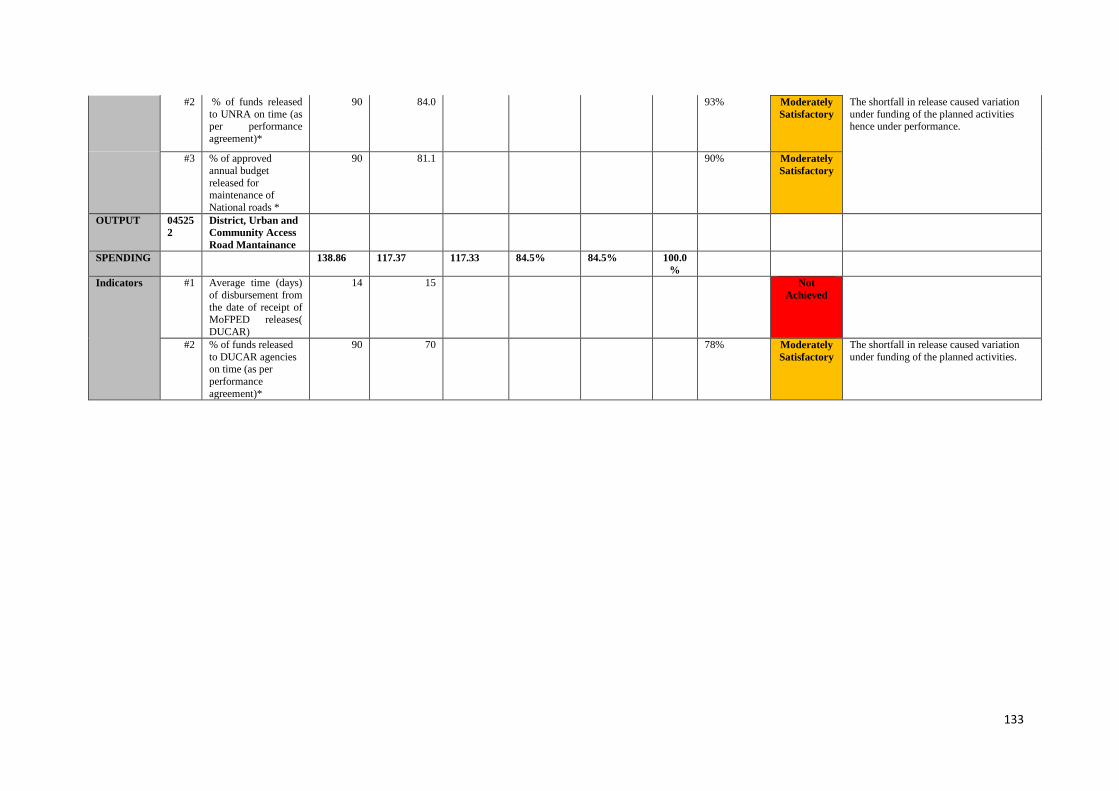
133
#2 % of funds released
to UNRA on time (as per performance
agreement)*
90 84.0 93% Moderately
Satisfactory
The shortfall in release caused variation
under funding of the planned activities hence under performance.
#3 % of approved
annual budget
released for maintenance of
National roads *
90 81.1 90% Moderately
Satisfactory
OUTPUT 04525
2
District, Urban and
Community Access
Road Mantainance
SPENDING 138.86 117.37 117.33 84.5% 84.5% 100.0
%
Indicators #1 Average time (days)
of disbursement from
the date of receipt of MoFPED releases(
DUCAR)
14 15 Not
Achieved
#2 % of funds released
to DUCAR agencies on time (as per
performance
agreement)*
90 70 78% Moderately
Satisfactory
The shortfall in release caused variation
under funding of the planned activities.
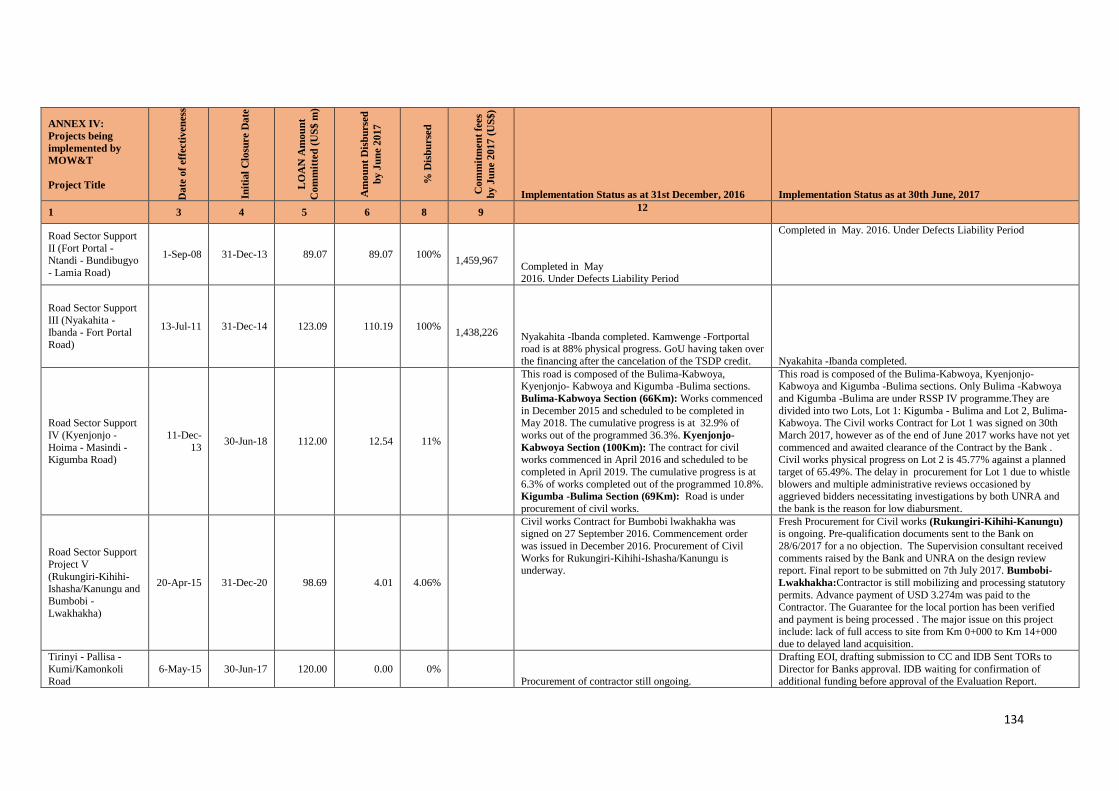
134
ANNEX IV:
Projects being
implemented by
MOW&T
Project Title D
ate
of
eff
ecti
ven
ess
Init
ial
Clo
sure D
ate
LO
AN
Am
ou
nt
Co
mm
itte
d (
US
$ m
)
Am
ou
nt
Dis
bu
rse
d
by
Ju
ne 2
017
% D
isb
urse
d
Co
mm
itm
en
t fe
es
by
Ju
ne 2
017
(U
S$
)
Implementation Status as at 31st December, 2016 Implementation Status as at 30th June, 2017
1 3 4 5 6 8 9 12
Road Sector Support
II (Fort Portal -
Ntandi - Bundibugyo
- Lamia Road)
1-Sep-08 31-Dec-13 89.07 89.07 100%
1,459,967 Completed in May 2016. Under Defects Liability Period
Completed in May. 2016. Under Defects Liability Period
Road Sector Support
III (Nyakahita - Ibanda - Fort Portal
Road)
13-Jul-11 31-Dec-14 123.09 110.19 100% 1,438,226 Nyakahita -Ibanda completed. Kamwenge -Fortportal
road is at 88% physical progress. GoU having taken over
the financing after the cancelation of the TSDP credit. Nyakahita -Ibanda completed.
Road Sector Support
IV (Kyenjonjo -
Hoima - Masindi - Kigumba Road)
11-Dec-
13 30-Jun-18 112.00 12.54 11%
This road is composed of the Bulima-Kabwoya, Kyenjonjo- Kabwoya and Kigumba -Bulima sections.
Bulima-Kabwoya Section (66Km): Works commenced
in December 2015 and scheduled to be completed in
May 2018. The cumulative progress is at 32.9% of
works out of the programmed 36.3%. Kyenjonjo-
Kabwoya Section (100Km): The contract for civil works commenced in April 2016 and scheduled to be
completed in April 2019. The cumulative progress is at
6.3% of works completed out of the programmed 10.8%. Kigumba -Bulima Section (69Km): Road is under
procurement of civil works.
This road is composed of the Bulima-Kabwoya, Kyenjonjo- Kabwoya and Kigumba -Bulima sections. Only Bulima -Kabwoya
and Kigumba -Bulima are under RSSP IV programme.They are
divided into two Lots, Lot 1: Kigumba - Bulima and Lot 2, Bulima-
Kabwoya. The Civil works Contract for Lot 1 was signed on 30th
March 2017, however as of the end of June 2017 works have not yet
commenced and awaited clearance of the Contract by the Bank . Civil works physical progress on Lot 2 is 45.77% against a planned
target of 65.49%. The delay in procurement for Lot 1 due to whistle
blowers and multiple administrative reviews occasioned by aggrieved bidders necessitating investigations by both UNRA and
the bank is the reason for low diabursment.
Road Sector Support
Project V
(Rukungiri-Kihihi-
Ishasha/Kanungu and
Bumbobi -
Lwakhakha)
20-Apr-15 31-Dec-20 98.69 4.01 4.06%
Civil works Contract for Bumbobi lwakhakha was signed on 27 September 2016. Commencement order
was issued in December 2016. Procurement of Civil
Works for Rukungiri-Kihihi-Ishasha/Kanungu is underway.
Fresh Procurement for Civil works (Rukungiri-Kihihi-Kanungu) is ongoing. Pre-qualification documents sent to the Bank on
28/6/2017 for a no objection. The Supervision consultant received
comments raised by the Bank and UNRA on the design review report. Final report to be submitted on 7th July 2017. Bumbobi-
Lwakhakha:Contractor is still mobilizing and processing statutory
permits. Advance payment of USD 3.274m was paid to the Contractor. The Guarantee for the local portion has been verified
and payment is being processed . The major issue on this project
include: lack of full access to site from Km 0+000 to Km 14+000 due to delayed land acquisition.
Tirinyi - Pallisa -
Kumi/Kamonkoli
Road
6-May-15 30-Jun-17 120.00 0.00 0%
Procurement of contractor still ongoing.
Drafting EOI, drafting submission to CC and IDB Sent TORs to
Director for Banks approval. IDB waiting for confirmation of
additional funding before approval of the Evaluation Report.
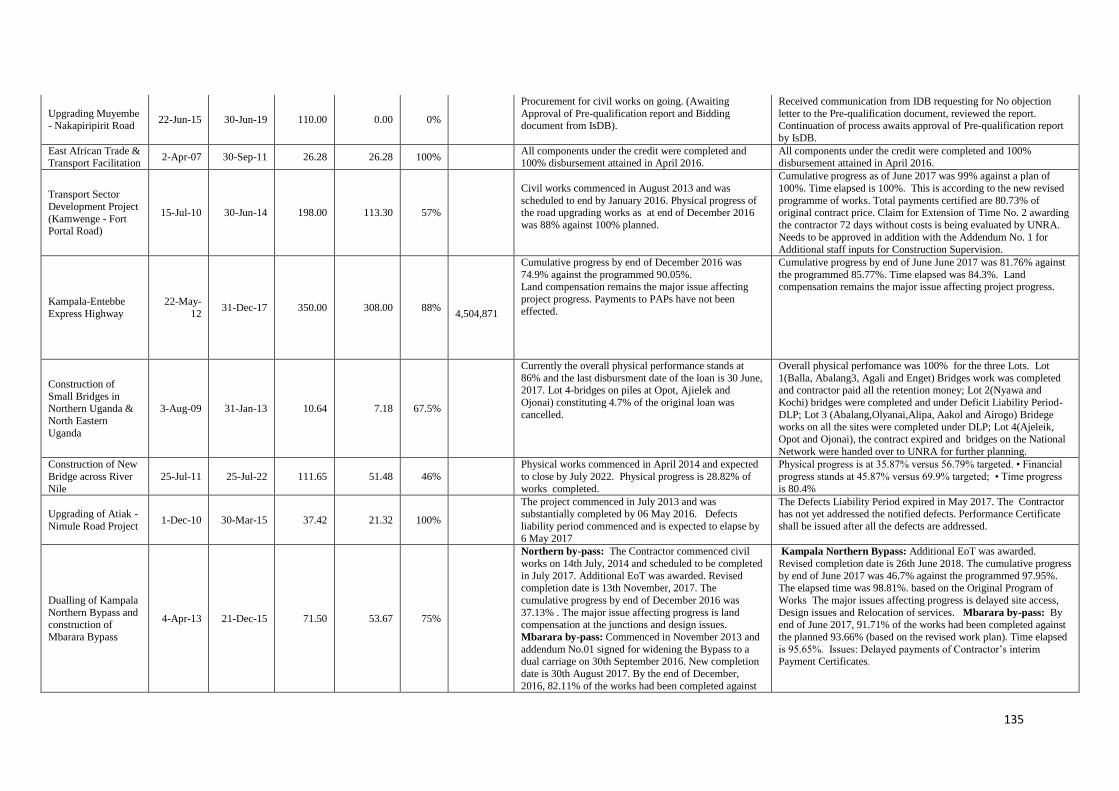
135
Upgrading Muyembe - Nakapiripirit Road
22-Jun-15 30-Jun-19 110.00 0.00 0%
Procurement for civil works on going. (Awaiting
Approval of Pre-qualification report and Bidding document from IsDB).
Received communication from IDB requesting for No objection
letter to the Pre-qualification document, reviewed the report. Continuation of process awaits approval of Pre-qualification report
by IsDB.
East African Trade & Transport Facilitation
2-Apr-07 30-Sep-11 26.28 26.28 100% All components under the credit were completed and 100% disbursement attained in April 2016.
All components under the credit were completed and 100% disbursement attained in April 2016.
Transport Sector
Development Project
(Kamwenge - Fort Portal Road)
15-Jul-10 30-Jun-14 198.00 113.30 57%
Civil works commenced in August 2013 and was
scheduled to end by January 2016. Physical progress of the road upgrading works as at end of December 2016
was 88% against 100% planned.
Cumulative progress as of June 2017 was 99% against a plan of
100%. Time elapsed is 100%. This is according to the new revised
programme of works. Total payments certified are 80.73% of original contract price. Claim for Extension of Time No. 2 awarding
the contractor 72 days without costs is being evaluated by UNRA.
Needs to be approved in addition with the Addendum No. 1 for
Additional staff inputs for Construction Supervision.
Kampala-Entebbe
Express Highway
22-May-
12 31-Dec-17 350.00 308.00 88%
4,504,871
Cumulative progress by end of December 2016 was
74.9% against the programmed 90.05%. Land compensation remains the major issue affecting
project progress. Payments to PAPs have not been
effected.
Cumulative progress by end of June June 2017 was 81.76% against
the programmed 85.77%. Time elapsed was 84.3%. Land compensation remains the major issue affecting project progress.
Construction of
Small Bridges in Northern Uganda &
North Eastern
Uganda
3-Aug-09 31-Jan-13 10.64 7.18 67.5%
Currently the overall physical performance stands at
86% and the last disbursment date of the loan is 30 June, 2017. Lot 4-bridges on piles at Opot, Ajielek and
Ojonai) constituting 4.7% of the original loan was
cancelled.
Overall physical perfomance was 100% for the three Lots. Lot
1(Balla, Abalang3, Agali and Enget) Bridges work was completed and contractor paid all the retention money; Lot 2(Nyawa and
Kochi) bridges were completed and under Deficit Liability Period-
DLP; Lot 3 (Abalang,Olyanai,Alipa, Aakol and Airogo) Bridege
works on all the sites were completed under DLP; Lot 4(Ajeleik,
Opot and Ojonai), the contract expired and bridges on the National
Network were handed over to UNRA for further planning.
Construction of New
Bridge across River
Nile
25-Jul-11 25-Jul-22 111.65 51.48 46%
Physical works commenced in April 2014 and expected
to close by July 2022. Physical progress is 28.82% of
works completed.
Physical progress is at 35.87% versus 56.79% targeted. • Financial
progress stands at 45.87% versus 69.9% targeted; • Time progress
is 80.4%
Upgrading of Atiak -
Nimule Road Project 1-Dec-10 30-Mar-15 37.42 21.32 100%
The project commenced in July 2013 and was substantially completed by 06 May 2016. Defects
liability period commenced and is expected to elapse by
6 May 2017
The Defects Liability Period expired in May 2017. The Contractor has not yet addressed the notified defects. Performance Certificate
shall be issued after all the defects are addressed.
Dualling of Kampala
Northern Bypass and construction of
Mbarara Bypass
4-Apr-13 21-Dec-15 71.50 53.67 75%
Northern by-pass: The Contractor commenced civil
works on 14th July, 2014 and scheduled to be completed
in July 2017. Additional EoT was awarded. Revised
completion date is 13th November, 2017. The
cumulative progress by end of December 2016 was
37.13% . The major issue affecting progress is land compensation at the junctions and design issues.
Mbarara by-pass: Commenced in November 2013 and
addendum No.01 signed for widening the Bypass to a dual carriage on 30th September 2016. New completion
date is 30th August 2017. By the end of December,
2016, 82.11% of the works had been completed against
Kampala Northern Bypass: Additional EoT was awarded.
Revised completion date is 26th June 2018. The cumulative progress
by end of June 2017 was 46.7% against the programmed 97.95%.
The elapsed time was 98.81%. based on the Original Program of
Works The major issues affecting progress is delayed site access,
Design issues and Relocation of services. Mbarara by-pass: By end of June 2017, 91.71% of the works had been completed against
the planned 93.66% (based on the revised work plan). Time elapsed
is 95.65%. Issues: Delayed payments of Contractor’s interim Payment Certificates.
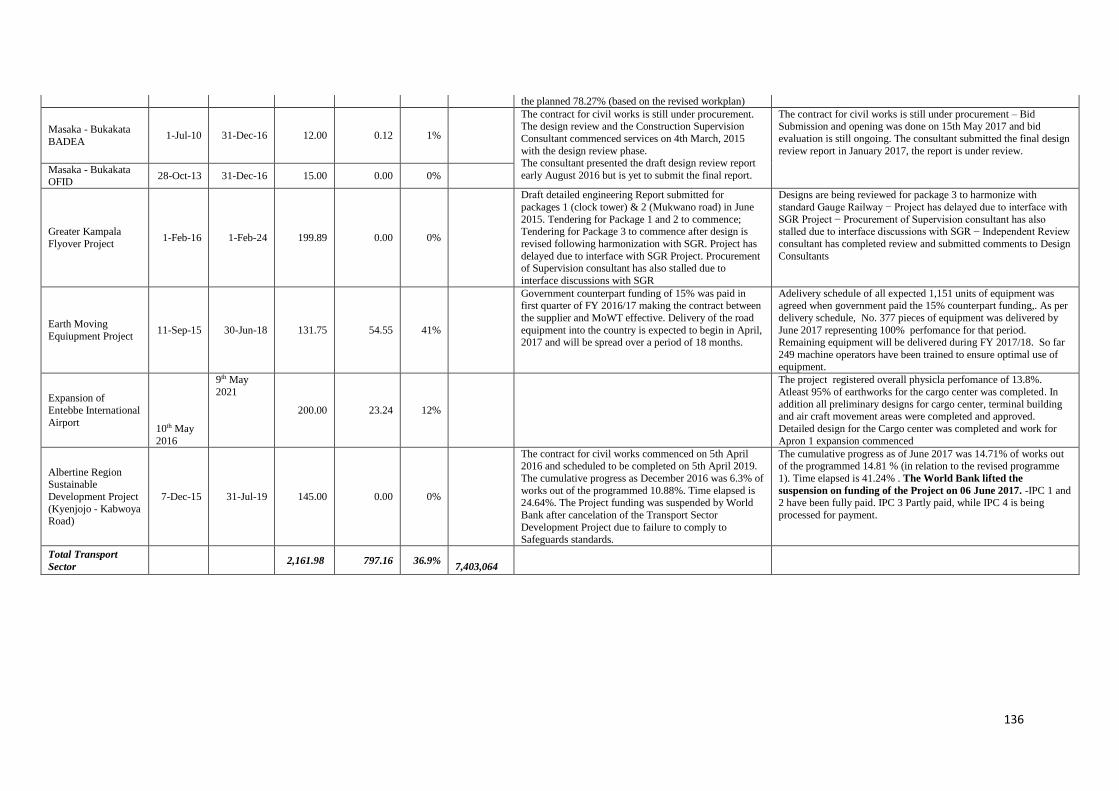
136
the planned 78.27% (based on the revised workplan)
Masaka - Bukakata
BADEA 1-Jul-10 31-Dec-16 12.00 0.12 1%
The contract for civil works is still under procurement. The design review and the Construction Supervision
Consultant commenced services on 4th March, 2015
with the design review phase. The consultant presented the draft design review report
early August 2016 but is yet to submit the final report.
The contract for civil works is still under procurement – Bid Submission and opening was done on 15th May 2017 and bid
evaluation is still ongoing. The consultant submitted the final design
review report in January 2017, the report is under review.
Masaka - Bukakata OFID
28-Oct-13 31-Dec-16 15.00 0.00 0%
Greater Kampala
Flyover Project 1-Feb-16 1-Feb-24 199.89 0.00 0%
Draft detailed engineering Report submitted for
packages 1 (clock tower) & 2 (Mukwano road) in June
2015. Tendering for Package 1 and 2 to commence; Tendering for Package 3 to commence after design is
revised following harmonization with SGR. Project has
delayed due to interface with SGR Project. Procurement of Supervision consultant has also stalled due to
interface discussions with SGR
Designs are being reviewed for package 3 to harmonize with
standard Gauge Railway − Project has delayed due to interface with
SGR Project − Procurement of Supervision consultant has also stalled due to interface discussions with SGR − Independent Review
consultant has completed review and submitted comments to Design
Consultants
Earth Moving
Equiupment Project 11-Sep-15 30-Jun-18 131.75 54.55 41%
Government counterpart funding of 15% was paid in first quarter of FY 2016/17 making the contract between
the supplier and MoWT effective. Delivery of the road
equipment into the country is expected to begin in April, 2017 and will be spread over a period of 18 months.
Adelivery schedule of all expected 1,151 units of equipment was agreed when government paid the 15% counterpart funding,. As per
delivery schedule, No. 377 pieces of equipment was delivered by
June 2017 representing 100% perfomance for that period. Remaining equipment will be delivered during FY 2017/18. So far
249 machine operators have been trained to ensure optimal use of
equipment.
Expansion of
Entebbe International
Airport 10th May
2016
9th May
2021
200.00 23.24 12%
The project registered overall physicla perfomance of 13.8%.
Atleast 95% of earthworks for the cargo center was completed. In
addition all preliminary designs for cargo center, terminal building and air craft movement areas were completed and approved.
Detailed design for the Cargo center was completed and work for
Apron 1 expansion commenced
Albertine Region Sustainable
Development Project
(Kyenjojo - Kabwoya Road)
7-Dec-15 31-Jul-19 145.00 0.00 0%
The contract for civil works commenced on 5th April 2016 and scheduled to be completed on 5th April 2019.
The cumulative progress as December 2016 was 6.3% of
works out of the programmed 10.88%. Time elapsed is 24.64%. The Project funding was suspended by World
Bank after cancelation of the Transport Sector
Development Project due to failure to comply to Safeguards standards.
The cumulative progress as of June 2017 was 14.71% of works out of the programmed 14.81 % (in relation to the revised programme
1). Time elapsed is 41.24% . The World Bank lifted the
suspension on funding of the Project on 06 June 2017. -IPC 1 and 2 have been fully paid. IPC 3 Partly paid, while IPC 4 is being
processed for payment.
Total Transport
Sector 2,161.98 797.16 36.9%
7,403,064