Embed Size (px)
Citation preview

Uganda Coffee Development Authority
ANNUAL REPORTVOLUME 21
OCTOBER 01, 2011 – SEPTEMBER 30, 2012
UCD
AA
NN
UA
L REPORT
VOLU
ME 21
OCTO
BER 01, 2011 – SEPTEMBER 30, 2012
Coffee House, Plot 35 Jinja Road P.O. Box 7267, Kampala - UgandaTel: +256 414 256 940/233 073
+256 312 260 470/1Fax: +256 414 256 994
E-mail: [email protected]: www.ugandacoffee.org
Ministry of Agriculture, Animal Industries and Fisheries
Uganda Coffee Development Authority
iUCDA Annual Report 2011/12
Making Uganda a Dinstinguished Producer of High Value Coffee
Making Uganda a Distinguished Producer of High Value Coffee i
Uganda Coffee Development Authority ANNUAL REPORT 2010 - 2011
Uganda Coffee Development Authority
ANNUAL REPORT
VOLUME 20
OCTOBER 01, 2010 – SEPTEMBER 30, 2011OCTOBER 01, 2011 – SEPTEMBER 30, 2012
ANNUAL REPORT
VOLUME 21
ii UCDA Annual Report 2011/12
Making Uganda a Dinstinguished Producer of High Value Coffee
Making Uganda a Distinguished Producer of High Value Coffee
Uganda Coffee Development Authority ANNUAL REPORT 2010 - 2011
ii Making Uganda a Distinguished Producer of High Value Coffee
Uganda Coffee Development Authority ANNUAL REPORT 2010 – 2011
ii
Hon. Tress BucyanayandiMinister of Agriculture, Animal Industry & Fisheries
Hon. Dr Zerubabbel NyiiraMinister of State for Agriculture
Making Uganda a Distinguished Producer of High Value Coffee
Uganda Coffee Development Authority ANNUAL REPORT 2010 – 2011
iii
UCDA Board of Directors
Eng. Fabian TebeitaChairman
Hon. Gerald SsendaulaRepresentative of Coffee
Farmers
Hajji Ayub K. KaluleRepresentative of Processors
Mr. Silver OjakolCommissioner, External Trade,
Representative of MTIC
Mr. Hannington KaruhangaRepresentative of Coffee
Exporters
Mr. Robert Wagwa NsibirwaRepresentative of Coffee
Exporters
Mr. Valentine Okot OtanuRepresentative of Coffee
Farmers
Mr. Kenneth MugambeCommissioner: Budget, Policy
& Evaluation, Ministry of Finance
Mr. Henry NgabiranoManaging Director,
UCDA
Dr. Emily K. TwinamatsikoDirector General NARO
Representative of MAAIF
Dr. Hussein A. ShireRepresentative of
Processors
Mr. Fred LuzindaBoard Sec./Head of Finance
& Administration, UCDA
iiiUCDA Annual Report 2011/12
Making Uganda a Dinstinguished Producer of High Value Coffee
Making Uganda a Distinguished Producer of High Value Coffee iii
Uganda Coffee Development Authority ANNUAL REPORT 2010 - 2011
Making Uganda a Distinguished Producer of High Value Coffee
Uganda Coffee Development Authority ANNUAL REPORT 2010 – 2011
ii
Hon. Tress BucyanayandiMinister of Agriculture, Animal Industry & Fisheries
Hon. Dr Zerubabbel NyiiraMinister of State for Agriculture
Making Uganda a Distinguished Producer of High Value Coffee
Uganda Coffee Development Authority ANNUAL REPORT 2010 – 2011
iii
UCDA Board of Directors
Eng. Fabian TebeitaChairman
Hon. Gerald SsendaulaRepresentative of Coffee
Farmers
Hajji Ayub K. KaluleRepresentative of Processors
Mr. Silver OjakolCommissioner, External Trade,
Representative of MTIC
Mr. Hannington KaruhangaRepresentative of Coffee
Exporters
Mr. Robert Wagwa NsibirwaRepresentative of Coffee
Exporters
Mr. Valentine Okot OtanuRepresentative of Coffee
Farmers
Mr. Kenneth MugambeCommissioner: Budget, Policy
& Evaluation, Ministry of Finance
Mr. Henry NgabiranoManaging Director,
UCDA
Dr. Emily K. TwinamatsikoDirector General NARO
Representative of MAAIF
Dr. Hussein A. ShireRepresentative of
Processors
Mr. Fred LuzindaBoard Sec./Head of Finance
& Administration, UCDA

iv UCDA Annual Report 2011/12
Making Uganda a Dinstinguished Producer of High Value Coffee
Table of Contents FOREWORD ............................................................................................................................................. vii ACRONYMS / ABBREVIATIONS .......................................................................................................... ix EXECUTIVE SUMMARY ........................................................................................................................ xi Chapter 1: COFFEE MARKET PERFORMANCE ................................................................................ 1 1.0 Introduction ............................................................................................................................1
1.1 Coffee Procurement ...............................................................................................................1
1.2 Internal Marketing .................................................................................................................3
1.2.1 Registered industry players at post-harvest .....................................................................3
1.2.2 Local price trends ..............................................................................................................3
1.3 Closing Stocks ........................................................................................................................4
1.3.1 Domestic stocks ................................................................................................................4
1.4 External market ........................................................................................................................4
1.4.1 Coffee export performance ..............................................................................................4
1.4.2 Coffee exports by type and grade ....................................................................................6
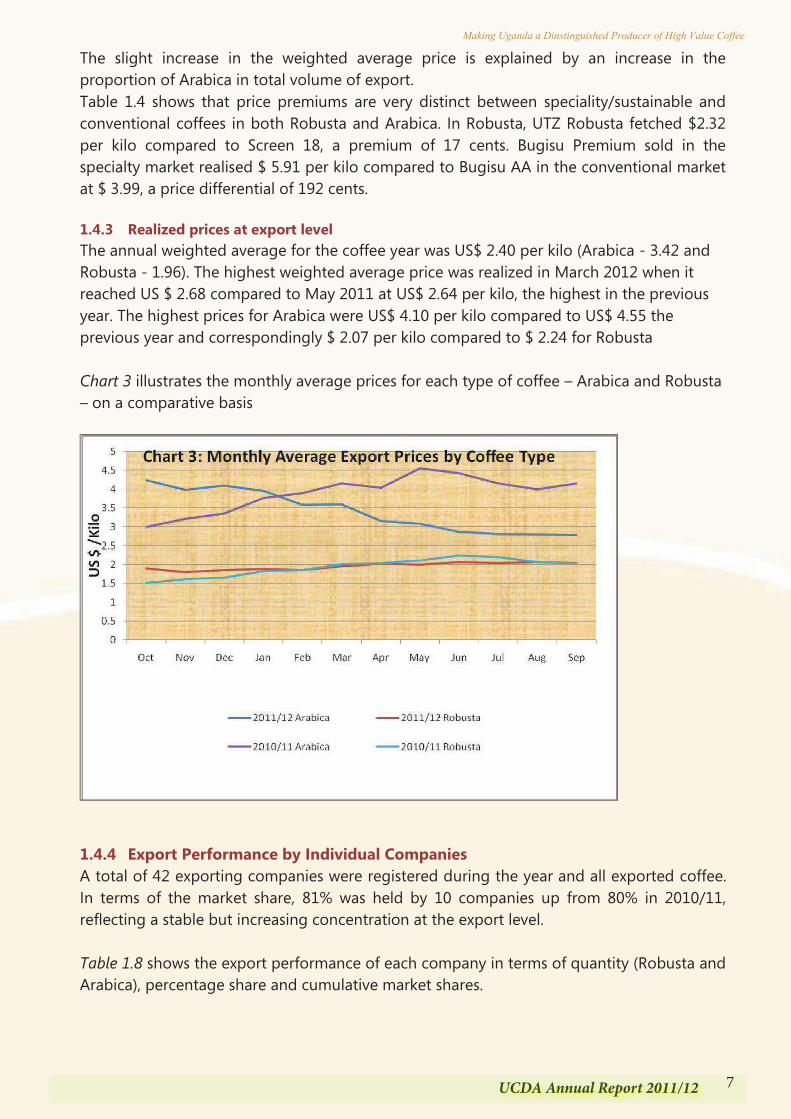
1.4.3 Realized prices at export level .........................................................................................7
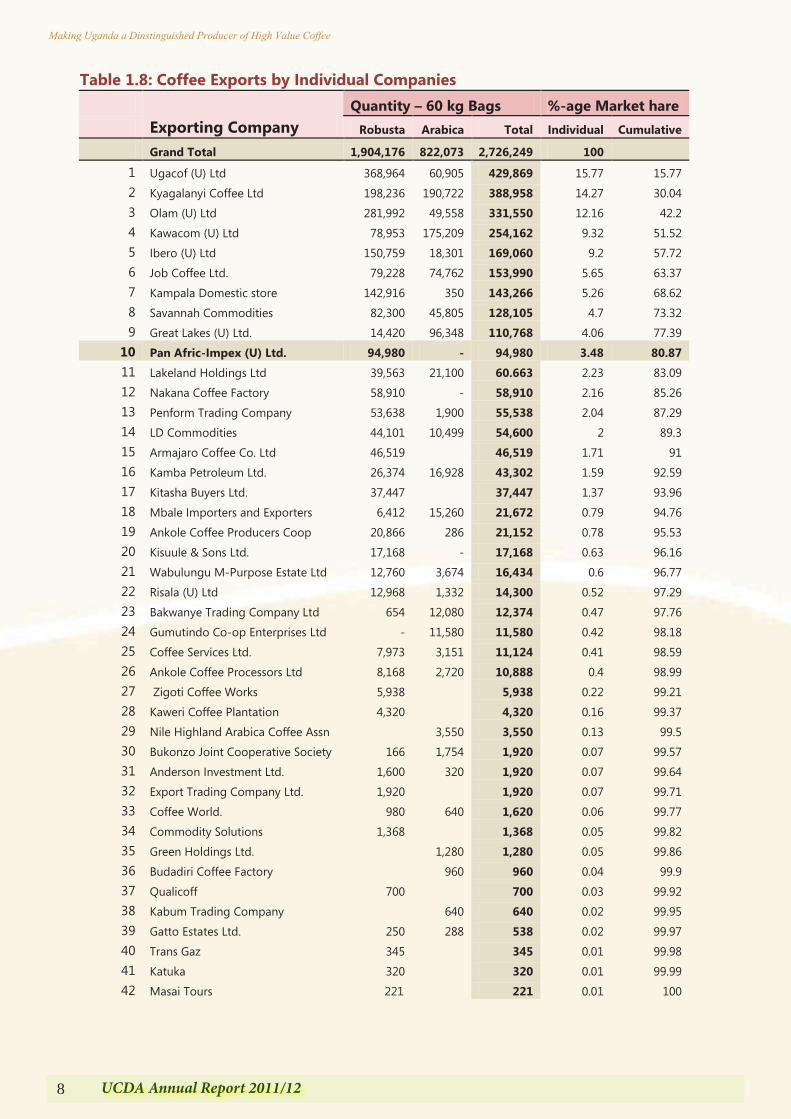
1.4.4 Export performances by individual ..................................................................................7
1.4.5 Individual coffee buyers’ performance ............................................................................9
1.4.6 Coffee exports by destination ..........................................................................................9
1.4.7 Global Outlook...............................................................................................................11
Chapter 2: QUALITY AND REGULATORY SERVICES ................................................................... 13 2.0 Introduction .............................................................................................................................13
2.1 Quality Improvement ...............................................................................................................13
2.2 Quality assurance ....................................................................................................................14
2.3 Coffee referred for reprocessing .............................................................................................15
2.4 Training programmes………………………………………………………………………..16
2.5 Generic promotion, Value addition and Promotion of Domestic coffee consumption...........17
2.5.1 Promotion of Domestic coffee consumption ..................................................................17
2.5.2 Participation in the International Trade Fairs and Exhibitions .......................................17
2.5.3 Joint Ventures .................................................................................................................17
2.5.4 Development of protocols for the fine Robusta coffees for the specialty market ..........18
Chapter 3: COFFEE PRODUCTION PROGRAMMES ...................................................................... 19 3.0 Introduction .............................................................................................................................19
3.1 Promotion of planting material production ..............................................................................20
3.2 Management of Pests and diseases .........................................................................................21
3.3 Promotion of Coffee replanting ..............................................................................................22
vUCDA Annual Report 2011/12
Making Uganda a Dinstinguished Producer of High Value Coffee
3.4 Coffee rehabilitation ................................................................................................................22
3.5 Support to Coffee development in Northern Uganda .............................................................22
3.6 Promotion of sustainable coffee initiatives ..............................................................................23
3.7 Farmer training And extension liaison .....................................................................................24
3.8 Provision of Technical extension services and Quality enhancement ....................................24
Chapter 4: COFFEE RESEARCH .......................................................................................................... 27 3.0 Introduction ..........................................................................................................................27
4.1 Robusta Coffee research ......................................................................................................27
4.1.1 Multiplication of 7 elite CWD resistant Robusta coffee varieties by tissue culture .....27
4.1.2 Multiplication of the 7 CWD resistant Robusta coffee varieties by rooted cuttings ....28
4.1.3 Dissemination of planting materials of the CWD resistant Robusta coffee varieties ...29
4.1.4 On-farm validation of CWD resistant elite varieties ....................................................30
4.1.5 Up scaling of elite CWD resistant Robusta Coffee varieties ........................................30
4.1.6 Generation and evaluation of progenies of CWD-R x CWD-S parents for yield,
disease resistance, quality ..............................................................................................30
4.1.7 Harnessing biotechnology tools for scientific improvement .......................................33
4.1.8 Characterization, conservation and utilization of Robusta coffee germplasm .............33
4.1.9 Developing tools for quick diagnostic of CWD ..........................................................34
4.1.10 Surveillance of Black Coffee Twig Borer .................................................................34
4.1.11 Specific identification of BCTB, and characterization of BCTB and ambrosia
fungus associated ........................................................................................................36
4.1.12 Evaluating effect of Ambrosia fungus on survival of Black Coffee Twig Borer ......37
4.1.13 Phytotoxicity and pathogenicty of Fusarium solani isolated from the BCTB and
its associated galleries in coffee twigs to coffee plantlets .........................................38
4.1.14 Search for BCTB alternate hosts.................................................................................39
4.1.15 Evaluation of community based phyto-sanitary interventions for management
of the coffee twig borer .............................................................................................40
4.1.16 Screening pesticides for BCTB control ...................................................................41
4.1.17 Developing trapping options for management of BCTB and CBB
(Coffee berry borer) ..................................................................................................42
4.1.18 Developing IPM support systems for coffee agro-forestry systems in Uganda .......43
4.1.19 Developing IPM support systems for organic and other specialty coffee
systems in Uganda ...................................................................................................44
4.1.20 Developing programmes for bio-control of the coffee twig borer and coffee
berry borer) ...............................................................................................................44
4.1.21 BCTB field diagnostic studies ..................................................................................45
Table of Contents FOREWORD ............................................................................................................................................. vii ACRONYMS / ABBREVIATIONS .......................................................................................................... ix EXECUTIVE SUMMARY ........................................................................................................................ xi Chapter 1: COFFEE MARKET PERFORMANCE ................................................................................ 1 1.0 Introduction ............................................................................................................................1
1.1 Coffee Procurement ...............................................................................................................1
1.2 Internal Marketing .................................................................................................................3
1.2.1 Registered industry players at post-harvest .....................................................................3
1.2.2 Local price trends ..............................................................................................................3
1.3 Closing Stocks ........................................................................................................................4
1.3.1 Domestic stocks ................................................................................................................4
1.4 External market ........................................................................................................................4
1.4.1 Coffee export performance ..............................................................................................4
1.4.2 Coffee exports by type and grade ....................................................................................6
1.4.3 Realized prices at export level .........................................................................................7
1.4.4 Export performances by individual ..................................................................................7
1.4.5 Individual coffee buyers’ performance ............................................................................9
1.4.6 Coffee exports by destination ..........................................................................................9
1.4.7 Global Outlook...............................................................................................................11
Chapter 2: QUALITY AND REGULATORY SERVICES ................................................................... 13 2.0 Introduction .............................................................................................................................13
2.1 Quality Improvement ...............................................................................................................13
2.2 Quality assurance ....................................................................................................................14
2.3 Coffee referred for reprocessing .............................................................................................15
2.4 Training programmes………………………………………………………………………..16
2.5 Generic promotion, Value addition and Promotion of Domestic coffee consumption...........17
2.5.1 Promotion of Domestic coffee consumption ..................................................................17
2.5.2 Participation in the International Trade Fairs and Exhibitions .......................................17
2.5.3 Joint Ventures .................................................................................................................17
2.5.4 Development of protocols for the fine Robusta coffees for the specialty market ..........18
Chapter 3: COFFEE PRODUCTION PROGRAMMES ...................................................................... 19 3.0 Introduction .............................................................................................................................19
3.1 Promotion of planting material production ..............................................................................20
3.2 Management of Pests and diseases .........................................................................................21
3.3 Promotion of Coffee replanting ..............................................................................................22
vi UCDA Annual Report 2011/12
Making Uganda a Dinstinguished Producer of High Value Coffee
4.1.22 Evaluating effect of shade on insect pests, yield, quality and soil fertility ..............45
4.2 Arabica Coffee research .....................................................................................................52
4.2.1 Evaluating new introductions of Arabica coffee for yield, quality and
Resistance against leaf rust, berry disease and other diseases ....................................52
4.2.2 Evaluation of other Arabica coffee introductions for yield, quality and
resistance against leaf rust, berry disease and other diseases ......................................53
4.2.3 Generation and evaluation of Arabica coffee hybrids for resistance against
diseases, yield and quality ............................................................................................54
4.2.4 Arabica coffee germplasm characterisation, conservation and utilization .................54
4.2.5 Screening fungicides for CLR control .........................................................................54
4.2.6 Developing IPM packages for key Arabica coffee insect pests in the
Mt. Elgon area ..............................................................................................................55
Chapter 5: FINANCE AND ADMINISTRATION ................................................................................ 57 5.1 Organisational Structure And Staff Matters .......................................................................57
5.2 Staff Training & Workshops ...............................................................................................57
5.3 UCDA Team Code of Honor ..............................................................................................58
5.4 Staff Recognition And Award ...........................................................................................58
5.5 Board Of Directors .............................................................................................................58
5.6 International Meetings/Conferences ...................................................................................59
5.7 Management Of Assets .......................................................................................................59
5.8 Shared Corporate Value Memberships And Subscriptions ................................................59
5.9 Monitoring And Evaluation ................................................................................................60
STATISTICAL APPENDICES................................................................................................................ 61 Appendix I: Monthly Coffee Exports by Individual Companies in 60 – Kilo Bags in CY2011/12……………………………………………………………………………………..62 Appendix II: 24-Year Coffee Export Performance Series by type and Unit price - $/Kilo ……..65 Appendix III: Coffee Export by Volume and Value 2007/08-2011/12 ………………………….66 Appendix IV: Monthly Coffee Procurement Figures in 60Kilo bags ……………………………67 Appendix V: Coffee Export by Destination in CY 2011/12-60Kilo bags………………………..68 Appendix VI: Coffee Exports by Destination in CY 2011/12 – 6Kilo bags …………………….69 REPORT OF THE AUDITOR GENERAL ON FINANCIAL STATEMENTS ................................. 70 FINANCIAL STATEMENTS ................................................................................................................. 76 Consolidated Statement of Financial Position for period ending 30 September 2011 …………..78 Consolidated Statement of Financial performances for period ending 30 September 2011……..79 Consolidated Statement of Cash flow for period Ending 30 September 2011……………………80 Notes to Statement of Financial Performances for the Period Ending 30 September 2011……...81
viiUCDA Annual Report 2011/12
Making Uganda a Dinstinguished Producer of High Value Coffee
Foreword
The Agriculture Sector Development Strategy and Investment Plan (DSIP) 2010/11 – 2014 remained the overriding guide in setting priorities for UCDA Work plans and activities of the Coffee Year 2011/12. In accordance with its mandate, UCDA developed a National Coffee Strategy to operationalize the National Coffee Policy that will guide the development of the subsector. In doing so, all effort was made to synchronize the strategic objectives with other existing National development frameworks including the National Development Plan, Prosperity for All and NRM Manifesto 2011-16.
This report presents the strategic interventions made by UCDA to promote increased investment in the coffee subsector. As the sector is private sector driven, we continue to realize increased interest and attraction to invest in coffee production. The dominance of smallholder farmers means that they are central to any strategy aimed at increasing production, productivity, quality and value addition. UCDA continued to provide logistical support to Coffee organizations including Uganda Coffee Federation, NUCAFE and Uganda Coffee Farmers Alliance which embrace farmer organization approach which enhances outreach, collaboration and coordination in achieving the objectives of the subsector. These organizations have been instrumental in mobilizing farmers for trainings and advisory services that have visibly translated into better agricultural practices in coffee production and post-harvest management. During the year, UCDA continued to promote coffee replanting and rehabilitation through mass production of Coffee Wilt Disease Resistant planting material using tissue culture as well as nodal cuttings. This is aimed at increasing coffee production and productivity. It is anticipated that by planting 20 million high yielding seedlings per year for three years, Uganda will be able to export at least 4.5 million 60kg bags of coffee in 2018 from the current average of 3 million bags. Global Coffee production for the coming year is estimated to increase to 144.1 million bags, an increase of 7.2% compared to 134.4 million bags in 2011/12. Global Coffee Consumption is increasing steadily at 2.4%. There is a growing demand for sustainable coffees in consuming countries an opportunity we need to exploit. Value addition is being promoted through wet processing in both Arabica and Robusta coffees which has improved coffee quality and incomes of farmers.
Making Uganda a Distinguished Producer of High Value Coffee vii
Uganda Coffee Development Authority ANNUAL REPORT 2010 - 2011
Making Uganda a Distinguished Producer of High Value Coffee
Uganda Coffee Development Authority ANNUAL REPORT 2010 – 2011
vi
STATISTICAL ABSTRACT .............................................................................................................39APPENDIX I: COFFEE PROCUREMENT FIGURES IN 60-KILOGRAMME BAGS................................................................ 40
APPENDIX II: MONTHLY COFFEE EXPORTS BY INDIVIDUAL COMPANIES IN 60-KILO BAGS IN 2010/11 .......... 41
APPENDIX III: COFFEE EXPORTS BY VOLUME AND VALUE 2006/07-2010/11 ................................................................ 42
APPENDIX IV: WEIGHTED AVERAGE UNIT PRICE BY TYPE BY GRADE BY MONTH IN COFFEE YEAR 2010_11
IN US$ PER KILO ........................................................................................................................................................ 43
APPENDIX V: 24-YEAR EXPORT PERFORMANCE SERIES BY TYPE & UNIT PRICE - $/KILO ...................................... 44
APPENDIX VI: UGANDA’S COFFEE EXPORTS BY DESTINATION BY MONTH IN 60 KILO-BAGS ................................ 45
APPENDIX VII: COFFEE PRODUCTION DATA – 2011 .................................................................................................................. 46
REPORT OF THE AUDITOR GENERAL ........................................................................................49
FINANCIAL STATEMENTS ...........................................................................................................55
CONSOLIDATED STATEMENT OF FINANCIAL POSITION FOR THE PERIOD ENDING 30 SEPTEMBER 2011 ................ 57
CONSOLIDATED STATEMENT OF FINANCIAL PERFORMANCE FOR PERIOD ENDING 30 SEPTEMBER 2011.............. 58
CONSOLIDATED STATEMENT OF CASHFLOWS FOR PERIOD ENDING 30 SEPTEMBER 2011 ........................................... 59
CONSOLIDATED STATEMENT OF CHANGES IN EQUITY FOR THE YEAR ENDED 30 SEPTEMBER 2011 ....................... 60
NOTES TO THE FINAL ACCOUNTS FOR PERIOD ENDED 30 SEPTEMBER 2011 ...................................................................... 61
NOTES TO THE FINANCIAL STATEMENTS FOR THE PERIOD ENDING 30 SEPTEMBER 2011 ........................................... 62
NOTES TO THE STATEMENT OF FINANCIAL PERFORMANCE FOR THE PERIOD ENDING 30 SEPTEMBER 2011 ....... 63
NOTES TO THE STATEMENT OF FINANCIAL PERFORMANCE FOR THE PERIOD ENDING 30 SEPTEMBER 2011 ....... 65
Making Uganda a Distinguished Producer of High Value Coffee
Uganda Coffee Development Authority ANNUAL REPORT 2010 – 2011
vii
FOREWORDIn all aspects, the coffee year 2010/11 ended with very good performance as Coffee exports stood at 3,149,423 bags fetching a value of US$ 448.89 million (the highest recorded revenue since 1977), a rise of 18% and 68% in quantity and value over the last coffee year. This resulted into an increase in incomes of the players along the coffee value chain and realization of additional resources for the subsector programmes especially for coffee development and research.
The tremendous gains are attributed to the protracted coffee production campaign, good agricultural practices being adopted by the farmers, increasing world demand, favourable weather and
farmgate prices during the year. The industry is gradually recovering from the hard hitting Coffee Wilt Disease which gravely affected production. In a bid to ensure sustainability recovery, more attention was accorded to the multiplication of CWDr materials using tissue culture technologies and nodal cuttings method. Coffee research has continued to screen for more CWDr lines as well as preserving the existing germplasm
Improvement in quality has been registered at farm level that has translated into increase in farm gate prices and household incomes. Value addition at farm level continues to gain pace, an opportunity that should be harnessed for more earnings more from the coffee volumes particularly in certi ed coffees.
Domestic Coffee Consumption has also continued to increase partly as a result of capacity building and support to coffee roasters and brewers and also through promotional activities. This is positively re ected by an increase in cafés, restaurants and hotels serving coffee as well as the range of brands in various supermarkets and retail outlets throughout the country. The quality served at some of these outlets is outstanding.
The rising global demand for specialty and sustainable coffees has attracted attention to ensure that Uganda strategically positions itself in these niche markets. Robusta coffee protocols for specialty markets have been developed and presented to the International Coffee Council for adoption and certi cation.
UCDA continued to coordinate the review of the subsector policies and development of the National Coffee Policy which will focus on guiding and streamlining activities of the subsector with particular emphasis on farmer empowerment. I appeal to all stakeholders to rise to the challenge of the need for combined efforts in implementation of the policy so that maximum bene ts accrue to all players.
Finally, I thank my fellow Board members, UCDA Management and Staff and the entire coffee industry for the support rendered to the coffee subsector. I, therefore, present this report that demonstrates unreserved commitment to the development and socio-economic transformation of the coffee subsector and the national economy.
I do urge you to read this report in order to keep abreast with the developments of the coffee subsector. I also invite you to regularly visit the UCDA website: www.ugandacoffee.org
Eng. Fabian. R. TibeitaChairman - UCDA Board of Directors
4.1.22 Evaluating effect of shade on insect pests, yield, quality and soil fertility ..............45
4.2 Arabica Coffee research .....................................................................................................52
4.2.1 Evaluating new introductions of Arabica coffee for yield, quality and
Resistance against leaf rust, berry disease and other diseases ....................................52
4.2.2 Evaluation of other Arabica coffee introductions for yield, quality and
resistance against leaf rust, berry disease and other diseases ......................................53
4.2.3 Generation and evaluation of Arabica coffee hybrids for resistance against
diseases, yield and quality ............................................................................................54
4.2.4 Arabica coffee germplasm characterisation, conservation and utilization .................54
4.2.5 Screening fungicides for CLR control .........................................................................54
4.2.6 Developing IPM packages for key Arabica coffee insect pests in the
Mt. Elgon area ..............................................................................................................55
Chapter 5: FINANCE AND ADMINISTRATION ................................................................................ 57 5.1 Organisational Structure And Staff Matters .......................................................................57
5.2 Staff Training & Workshops ...............................................................................................57
5.3 UCDA Team Code of Honor ..............................................................................................58
5.4 Staff Recognition And Award ...........................................................................................58
5.5 Board Of Directors .............................................................................................................58
5.6 International Meetings/Conferences ...................................................................................59
5.7 Management Of Assets .......................................................................................................59
5.8 Shared Corporate Value Memberships And Subscriptions ................................................59
5.9 Monitoring And Evaluation ................................................................................................60
STATISTICAL APPENDICES................................................................................................................ 61 Appendix I: Monthly Coffee Exports by Individual Companies in 60 – Kilo Bags in CY2011/12……………………………………………………………………………………..62 Appendix II: 24-Year Coffee Export Performance Series by type and Unit price - $/Kilo ……..65 Appendix III: Coffee Export by Volume and Value 2007/08-2011/12 ………………………….66 Appendix IV: Monthly Coffee Procurement Figures in 60Kilo bags ……………………………67 Appendix V: Coffee Export by Destination in CY 2011/12-60Kilo bags………………………..68 Appendix VI: Coffee Exports by Destination in CY 2011/12 – 6Kilo bags …………………….69 REPORT OF THE AUDITOR GENERAL ON FINANCIAL STATEMENTS ................................. 70 FINANCIAL STATEMENTS ................................................................................................................. 76 Consolidated Statement of Financial Position for period ending 30 September 2011 …………..78 Consolidated Statement of Financial performances for period ending 30 September 2011……..79 Consolidated Statement of Cash flow for period Ending 30 September 2011……………………80 Notes to Statement of Financial Performances for the Period Ending 30 September 2011……...81
viii UCDA Annual Report 2011/12
Making Uganda a Dinstinguished Producer of High Value Coffee
The steady growth in domestic coffee consumption is evidenced by increase in the number of cafes. The quality of service in these cafes is being enhanced by capacity building of the Ugandan Baristas who have been exposed to training programmes and competitions. UCDA will continue to ensure that quality standards are adhered to through enforcement of Coffee Regulations. In an effort to enforce Coffee Regulations and maintain high quality Ugandan Coffee, UCDA has allied with all stakeholders including Coffee Associations, Civil Society Organizations, Police and Local Government Authorities. Finally, I thank my fellow Board members, UCDA, Management and Staff and the entire coffee industry for the support rendered to the coffee sub sector. This gives me courage that much will be attained towards improving household incomes, quality improvement and meeting customer needs. Coffee stakeholders are encouraged to read this report and make comments for future improvement of the coffee industry. Eng. Fabian R. Tibeita Chairman-UCDA Board of Directors
Making Uganda a Distinguished Producer of High Value Coffee vii
Uganda Coffee Development Authority ANNUAL REPORT 2010 - 2011
Making Uganda a Distinguished Producer of High Value Coffee
Uganda Coffee Development Authority ANNUAL REPORT 2010 – 2011
vi
STATISTICAL ABSTRACT .............................................................................................................39APPENDIX I: COFFEE PROCUREMENT FIGURES IN 60-KILOGRAMME BAGS................................................................ 40
APPENDIX II: MONTHLY COFFEE EXPORTS BY INDIVIDUAL COMPANIES IN 60-KILO BAGS IN 2010/11 .......... 41
APPENDIX III: COFFEE EXPORTS BY VOLUME AND VALUE 2006/07-2010/11 ................................................................ 42
APPENDIX IV: WEIGHTED AVERAGE UNIT PRICE BY TYPE BY GRADE BY MONTH IN COFFEE YEAR 2010_11
IN US$ PER KILO ........................................................................................................................................................ 43
APPENDIX V: 24-YEAR EXPORT PERFORMANCE SERIES BY TYPE & UNIT PRICE - $/KILO ...................................... 44
APPENDIX VI: UGANDA’S COFFEE EXPORTS BY DESTINATION BY MONTH IN 60 KILO-BAGS ................................ 45
APPENDIX VII: COFFEE PRODUCTION DATA – 2011 .................................................................................................................. 46
REPORT OF THE AUDITOR GENERAL ........................................................................................49
FINANCIAL STATEMENTS ...........................................................................................................55
CONSOLIDATED STATEMENT OF FINANCIAL POSITION FOR THE PERIOD ENDING 30 SEPTEMBER 2011 ................ 57
CONSOLIDATED STATEMENT OF FINANCIAL PERFORMANCE FOR PERIOD ENDING 30 SEPTEMBER 2011.............. 58
CONSOLIDATED STATEMENT OF CASHFLOWS FOR PERIOD ENDING 30 SEPTEMBER 2011 ........................................... 59
CONSOLIDATED STATEMENT OF CHANGES IN EQUITY FOR THE YEAR ENDED 30 SEPTEMBER 2011 ....................... 60
NOTES TO THE FINAL ACCOUNTS FOR PERIOD ENDED 30 SEPTEMBER 2011 ...................................................................... 61
NOTES TO THE FINANCIAL STATEMENTS FOR THE PERIOD ENDING 30 SEPTEMBER 2011 ........................................... 62
NOTES TO THE STATEMENT OF FINANCIAL PERFORMANCE FOR THE PERIOD ENDING 30 SEPTEMBER 2011 ....... 63
NOTES TO THE STATEMENT OF FINANCIAL PERFORMANCE FOR THE PERIOD ENDING 30 SEPTEMBER 2011 ....... 65
Making Uganda a Distinguished Producer of High Value Coffee
Uganda Coffee Development Authority ANNUAL REPORT 2010 – 2011
vii
FOREWORDIn all aspects, the coffee year 2010/11 ended with very good performance as Coffee exports stood at 3,149,423 bags fetching a value of US$ 448.89 million (the highest recorded revenue since 1977), a rise of 18% and 68% in quantity and value over the last coffee year. This resulted into an increase in incomes of the players along the coffee value chain and realization of additional resources for the subsector programmes especially for coffee development and research.
The tremendous gains are attributed to the protracted coffee production campaign, good agricultural practices being adopted by the farmers, increasing world demand, favourable weather and
farmgate prices during the year. The industry is gradually recovering from the hard hitting Coffee Wilt Disease which gravely affected production. In a bid to ensure sustainability recovery, more attention was accorded to the multiplication of CWDr materials using tissue culture technologies and nodal cuttings method. Coffee research has continued to screen for more CWDr lines as well as preserving the existing germplasm
Improvement in quality has been registered at farm level that has translated into increase in farm gate prices and household incomes. Value addition at farm level continues to gain pace, an opportunity that should be harnessed for more earnings more from the coffee volumes particularly in certi ed coffees.
Domestic Coffee Consumption has also continued to increase partly as a result of capacity building and support to coffee roasters and brewers and also through promotional activities. This is positively re ected by an increase in cafés, restaurants and hotels serving coffee as well as the range of brands in various supermarkets and retail outlets throughout the country. The quality served at some of these outlets is outstanding.
The rising global demand for specialty and sustainable coffees has attracted attention to ensure that Uganda strategically positions itself in these niche markets. Robusta coffee protocols for specialty markets have been developed and presented to the International Coffee Council for adoption and certi cation.
UCDA continued to coordinate the review of the subsector policies and development of the National Coffee Policy which will focus on guiding and streamlining activities of the subsector with particular emphasis on farmer empowerment. I appeal to all stakeholders to rise to the challenge of the need for combined efforts in implementation of the policy so that maximum bene ts accrue to all players.
Finally, I thank my fellow Board members, UCDA Management and Staff and the entire coffee industry for the support rendered to the coffee subsector. I, therefore, present this report that demonstrates unreserved commitment to the development and socio-economic transformation of the coffee subsector and the national economy.
I do urge you to read this report in order to keep abreast with the developments of the coffee subsector. I also invite you to regularly visit the UCDA website: www.ugandacoffee.org
Eng. Fabian. R. TibeitaChairman - UCDA Board of Directors
ixUCDA Annual Report 2011/12
Making Uganda a Dinstinguished Producer of High Value Coffee
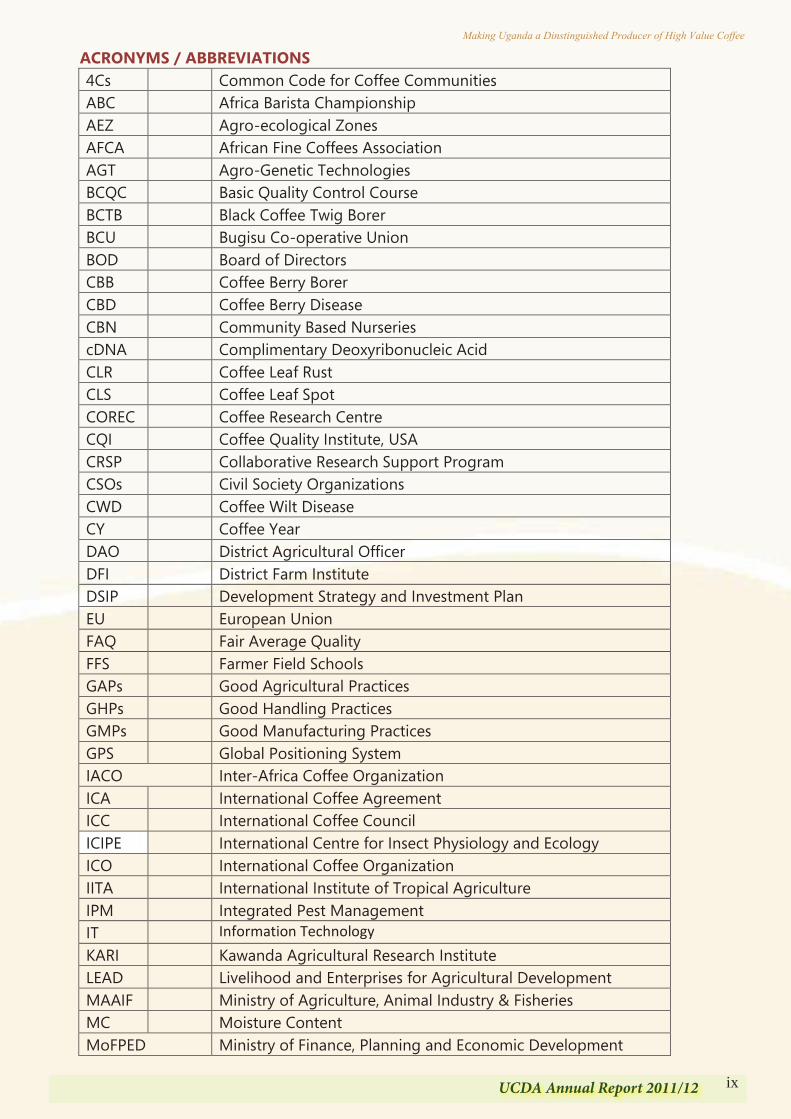
ACRONYMS / ABBREVIATIONS 4Cs Common Code for Coffee Communities ABC Africa Barista Championship AEZ Agro-ecological Zones AFCA African Fine Coffees Association AGT Agro-Genetic Technologies BCQC Basic Quality Control Course BCTB Black Coffee Twig Borer BCU Bugisu Co-operative Union BOD Board of Directors CBB Coffee Berry Borer CBD Coffee Berry Disease CBN Community Based Nurseries cDNA Complimentary Deoxyribonucleic Acid CLR Coffee Leaf Rust CLS Coffee Leaf Spot COREC Coffee Research Centre CQI Coffee Quality Institute, USA CRSP Collaborative Research Support Program CSOs Civil Society Organizations CWD Coffee Wilt Disease CY Coffee Year DAO District Agricultural Officer DFI District Farm Institute DSIP Development Strategy and Investment Plan EU European Union FAQ Fair Average Quality FFS Farmer Field Schools GAPs Good Agricultural Practices GHPs Good Handling Practices GMPs Good Manufacturing Practices GPS Global Positioning System IACO Inter-Africa Coffee Organization ICA International Coffee Agreement ICC International Coffee Council ICIPE International Centre for Insect Physiology and Ecology ICO International Coffee Organization IITA International Institute of Tropical Agriculture IPM Integrated Pest Management IT Information Technology KARI Kawanda Agricultural Research Institute LEAD Livelihood and Enterprises for Agricultural Development MAAIF Ministry of Agriculture, Animal Industry & Fisheries MC Moisture Content MoFPED Ministry of Finance, Planning and Economic Development
The steady growth in domestic coffee consumption is evidenced by increase in the number of cafes. The quality of service in these cafes is being enhanced by capacity building of the Ugandan Baristas who have been exposed to training programmes and competitions. UCDA will continue to ensure that quality standards are adhered to through enforcement of Coffee Regulations. In an effort to enforce Coffee Regulations and maintain high quality Ugandan Coffee, UCDA has allied with all stakeholders including Coffee Associations, Civil Society Organizations, Police and Local Government Authorities. Finally, I thank my fellow Board members, UCDA, Management and Staff and the entire coffee industry for the support rendered to the coffee sub sector. This gives me courage that much will be attained towards improving household incomes, quality improvement and meeting customer needs. Coffee stakeholders are encouraged to read this report and make comments for future improvement of the coffee industry. Eng. Fabian R. Tibeita Chairman-UCDA Board of Directors
x UCDA Annual Report 2011/12
Making Uganda a Dinstinguished Producer of High Value Coffee
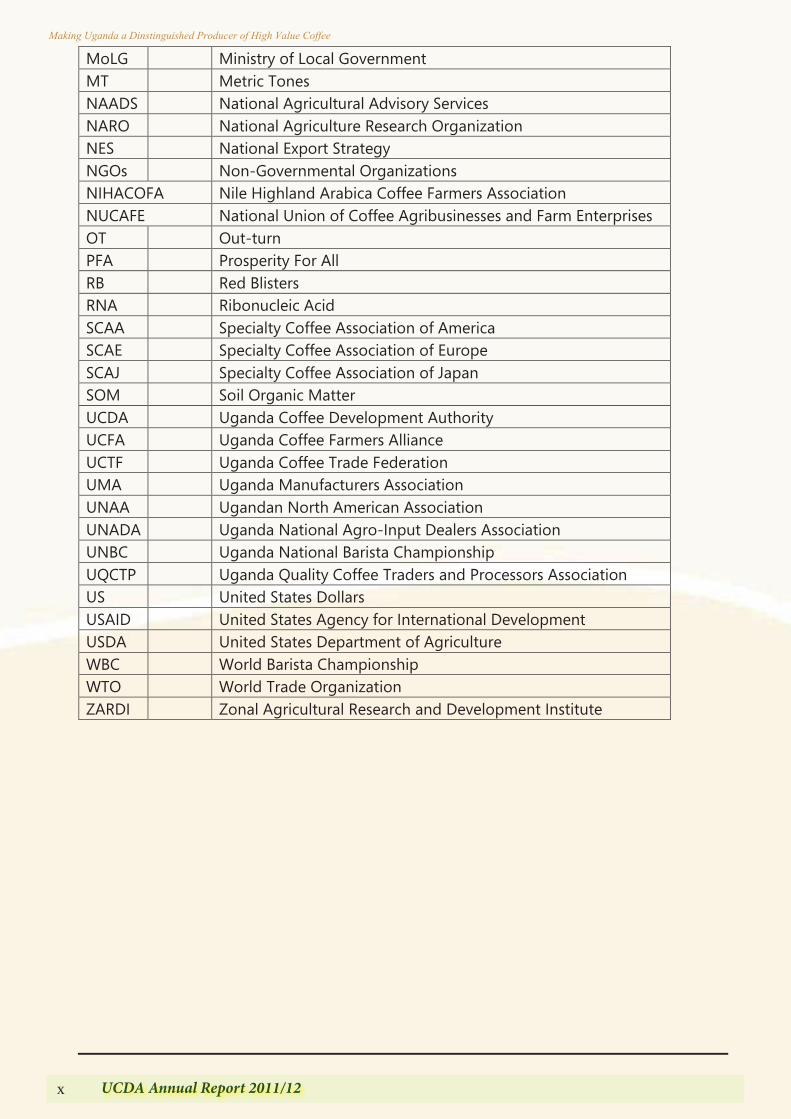
MoLG Ministry of Local Government MT Metric Tones NAADS National Agricultural Advisory Services NARO National Agriculture Research Organization NES National Export Strategy NGOs Non-Governmental Organizations NIHACOFA Nile Highland Arabica Coffee Farmers Association NUCAFE National Union of Coffee Agribusinesses and Farm Enterprises OT Out-turn PFA Prosperity For All RB Red Blisters RNA Ribonucleic Acid SCAA Specialty Coffee Association of America SCAE Specialty Coffee Association of Europe SCAJ Specialty Coffee Association of Japan SOM Soil Organic Matter UCDA Uganda Coffee Development Authority UCFA Uganda Coffee Farmers Alliance UCTF Uganda Coffee Trade Federation UMA Uganda Manufacturers Association UNAA Ugandan North American Association UNADA Uganda National Agro-Input Dealers Association UNBC Uganda National Barista Championship UQCTP Uganda Quality Coffee Traders and Processors Association US United States Dollars USAID United States Agency for International Development USDA United States Department of Agriculture WBC World Barista Championship WTO World Trade Organization ZARDI Zonal Agricultural Research and Development Institute
xiUCDA Annual Report 2011/12
Making Uganda a Dinstinguished Producer of High Value Coffee
EXECUTIVE SUMMARY Overview:
In line with the statutory mandate to promote and oversee the development of the entire coffee industry through research, quality assurance, improved marketing, information dissemination and providing for other matters connected therewith; and the Vision of making Uganda a distinguished producer of high value coffee, Uganda Coffee Development Authority (UCDA) during the year focused on promoting production and marketing of coffee; supporting the management of pests and diseases; ensuring quality improvement of coffee along the value chain; promoting value addition and domestic coffee consumption as well as harmonizing activities of the coffee subsector associations in line with industry goals and policies.
Strategic Objectives:
In line with government policy framework stipulated in the National Development Plan (NDP) and Development Strategy and Investment Plan (DSIP), UCDA‟s emphasis for the Coffee Year 2011/12 was placed on the following:
1. Production of planting material; particularly the 7 Coffee Wilt Disease (CWD) resistant lines using tissue culture and nodal cuttings.
2. Supporting Coffee Research and development. 3. Promotion of Domestic Coffee Consumption. 4. Promotion of coffee replanting and rehabilitation. 5. Supporting coffee development in Northern Uganda. 6. Quality improvement through Technical Extension services and collaboration with
stakeholders. 7. Quality assurance and Value addition. 8. Development of the National Coffee Strategy to operationalize the National Coffee
Policy. 9. Efficient utilization of assets and resources.
During the year UCDA programmes and work plans were rolled out aimed at increasing coffee productivity, ensuring quality improvement, promotion of domestic consumption and generic promotion. Achievements:
1) A total of 2,726,249 60-kilo bags of coffee valued at US $ 392,698,138 were exported during the year, while 3,114,363 60-kilo bags were procured at the exporter level. The weighted average price at export level was at $ 2.40 per kilo showing an increase of 2 US cents from the previous year which was US $ 2.38 per kilo.
2) The Ugandan coffee exports to the Arab world increased to 480,057 bags accounting for a market share of 17.61% of total exports. The coffee also continued to penetrate new markets directly with exports to China, Russia and Far East reaching 51,426 bags. This performance is a result of sustained promotions carried out in these new markets.
MoLG Ministry of Local Government MT Metric Tones NAADS National Agricultural Advisory Services NARO National Agriculture Research Organization NES National Export Strategy NGOs Non-Governmental Organizations NIHACOFA Nile Highland Arabica Coffee Farmers Association NUCAFE National Union of Coffee Agribusinesses and Farm Enterprises OT Out-turn PFA Prosperity For All RB Red Blisters RNA Ribonucleic Acid SCAA Specialty Coffee Association of America SCAE Specialty Coffee Association of Europe SCAJ Specialty Coffee Association of Japan SOM Soil Organic Matter UCDA Uganda Coffee Development Authority UCFA Uganda Coffee Farmers Alliance UCTF Uganda Coffee Trade Federation UMA Uganda Manufacturers Association UNAA Ugandan North American Association UNADA Uganda National Agro-Input Dealers Association UNBC Uganda National Barista Championship UQCTP Uganda Quality Coffee Traders and Processors Association US United States Dollars USAID United States Agency for International Development USDA United States Department of Agriculture WBC World Barista Championship WTO World Trade Organization ZARDI Zonal Agricultural Research and Development Institute
xii UCDA Annual Report 2011/12
Making Uganda a Dinstinguished Producer of High Value Coffee
3) Programs of quality assurance and improvement were implemented through trainings in
Good Handling, Manufacturing and Hygiene practices. With support from United States Agency for International Development (USAID)- Livelihood and Enterprises for Agricultural Development (LEAD) project, UCDA continued with the work of reviewing fine Robusta coffee protocols. Trainings were conducted in Basic Quality Control with 35 participants, Barista with 53 participants, Coffee roasting and brewing with 30 participants, and training of trainers in Robusta-R and Arabica-Q graders with 30 participants.
4) Promotion of coffee both at local and international exhibitions was done. UCDA participated in Uganda Manufacturers‟ Association, World Food day, Agricultural Trade Fairs and the District Coffee Shows. At the International level, UCDA showcased Ugandan coffee at a conference and exhibition organized by African Fine Coffees Association (AFCA), Specialty Coffee Association of Europe (SCAE), Specialty Coffee Association of America (SCAA), Specialty Coffee Association of Japan (SCAJ), Ugandan North American Association (UNAA) and promotional centers in China and Egypt. In all cases, the quality of Ugandan coffee was appreciated.
5) Coffee production campaign activities were carried out in all coffee producing districts and over 17 million seedlings were planted during the year out of 30 million seedlings generated benefitting 82,275 households. The distribution of seedlings was done through UCDA, Community Based Nurseries, and partner organizations. 10 Coffee shows were held in 10 districts to showcase better practices along the coffee value chain and create interaction between the farmers and other stakeholders. In order to tap the ever increasing niche markets, production of sustainable coffee continued to be promoted.
6) Promotion of Coffee production in new areas especially Northern Uganda by integration of commercial coffee and banana production into the farming system undertaken. Through this initiative, 1.56 million Coffee seedlings were planted out of the 2 million seedlings raised. Also, 4000 banana suckers were planted to provide shade, food security and income.
7) Coffee rehabilitation was emphasized as a way of improving yield of the old coffee trees and support such as pruning kits were given to farmers. Technical extension services and enforcement of the coffee regulations were intensified in order to improve on quality at post-harvest level. This initiative has resulted into an increase in yield (kilogramme/hectare) by 67% for Parchment in Mt. Elgon Region; 350% for Fair Average Quality (FAQ) by farmers in Mityana (Uganda Coffee Farmers‟ Alliance), and 400% for FAQ by farmers in Masaka.
8) In Research, emphasis was on dissemination of technologies for sustainable control of pests and diseases. There was continued propagation of 7 CWD resistant Robusta varieties by tissue culture and nodal cuttings where 29 Nursery operators were allocated plantlets to establish mother gardens for subsequent generation of clones. This brings the cumulative number of nursery operators to 45, with a total of 15,750 mother bushes established which will generate at least 472,500 trees in the first season.
9) Coffee Research Centre (COREC) in collaboration with the International Institute of Tropical Agriculture (IITA) and UCDA carried out an extensive survey to determine the
xiiiUCDA Annual Report 2011/12
Making Uganda a Dinstinguished Producer of High Value Coffee
soil fertility and intensity of the damage caused by coffee pests. The results of the survey will form a basis for the development of a comprehensive research agenda that will lead to the realization of an effective, sustainable and environmentally sound Integrated Pest Management (IPM) package.
10) UCDA conducted targeted staff trainings and workshops in an effort to equip staff with necessary skills to improve performance. 2 staff trained in standards development; 1 in Basic Quality Control; 4 in certification and verification; 2 Executive Assistants in personal career development; 2 Heads of Department undertook a working visit to Vietnam to benchmark best practices in coffee value chain; 54 staff in team building and orientation, and change management; 1 staff attended a workshop on government accounting; and 1 staff in an e-learning course on the impact of the global financial and economic crisis. A team code of honor was also developed to guide internal behavior and culture.
Challenges: The most critical challenges of the coffee subsector during the period include;
1. Long biological process of the propagation of the 7 CWD resistant lines and procurement of seedlings.
2. Insufficient funds for containment of pests and disease outbreaks. 3. Limited capacity for rehabilitation of the aged trees 4. Limited adaptation to climatic changes. 5. Weak enforcement of Coffee regulations. 6. High cost of investment in value addition especially the soluble plant.
Area of focus for the coming year will include:
1. Generation of clean planting materials through Elite seed and Vegetative propagation of the CWD resistant lines.
2. Management of diseases and pests – Black coffee twig borer, Coffee leaf rust, Coffee Berry disease, Antestia bugs and lace bugs, Stem borers.
3. Supporting research in the development of varieties for adaptation to climatic change.
4. Improving productivity through Rehabilitation. 5. Support coffee Replanting and sustainable coffee Production programmes. 6. Continue to support adoption of coffee growing in Northern Uganda. 7. Provide both technical and general extension to coffee stakeholders- farmers and
processors. 8. Quality improvement and market access. 9. Quality assurance, Value addition for domestic consumption and Generic promotion. 10. Mainstreaming participation of Women and Youth in the Coffee value chain.
3) Programs of quality assurance and improvement were implemented through trainings in
Good Handling, Manufacturing and Hygiene practices. With support from United States Agency for International Development (USAID)- Livelihood and Enterprises for Agricultural Development (LEAD) project, UCDA continued with the work of reviewing fine Robusta coffee protocols. Trainings were conducted in Basic Quality Control with 35 participants, Barista with 53 participants, Coffee roasting and brewing with 30 participants, and training of trainers in Robusta-R and Arabica-Q graders with 30 participants.
4) Promotion of coffee both at local and international exhibitions was done. UCDA participated in Uganda Manufacturers‟ Association, World Food day, Agricultural Trade Fairs and the District Coffee Shows. At the International level, UCDA showcased Ugandan coffee at a conference and exhibition organized by African Fine Coffees Association (AFCA), Specialty Coffee Association of Europe (SCAE), Specialty Coffee Association of America (SCAA), Specialty Coffee Association of Japan (SCAJ), Ugandan North American Association (UNAA) and promotional centers in China and Egypt. In all cases, the quality of Ugandan coffee was appreciated.
5) Coffee production campaign activities were carried out in all coffee producing districts and over 17 million seedlings were planted during the year out of 30 million seedlings generated benefitting 82,275 households. The distribution of seedlings was done through UCDA, Community Based Nurseries, and partner organizations. 10 Coffee shows were held in 10 districts to showcase better practices along the coffee value chain and create interaction between the farmers and other stakeholders. In order to tap the ever increasing niche markets, production of sustainable coffee continued to be promoted.
6) Promotion of Coffee production in new areas especially Northern Uganda by integration of commercial coffee and banana production into the farming system undertaken. Through this initiative, 1.56 million Coffee seedlings were planted out of the 2 million seedlings raised. Also, 4000 banana suckers were planted to provide shade, food security and income.
7) Coffee rehabilitation was emphasized as a way of improving yield of the old coffee trees and support such as pruning kits were given to farmers. Technical extension services and enforcement of the coffee regulations were intensified in order to improve on quality at post-harvest level. This initiative has resulted into an increase in yield (kilogramme/hectare) by 67% for Parchment in Mt. Elgon Region; 350% for Fair Average Quality (FAQ) by farmers in Mityana (Uganda Coffee Farmers‟ Alliance), and 400% for FAQ by farmers in Masaka.
8) In Research, emphasis was on dissemination of technologies for sustainable control of pests and diseases. There was continued propagation of 7 CWD resistant Robusta varieties by tissue culture and nodal cuttings where 29 Nursery operators were allocated plantlets to establish mother gardens for subsequent generation of clones. This brings the cumulative number of nursery operators to 45, with a total of 15,750 mother bushes established which will generate at least 472,500 trees in the first season.
9) Coffee Research Centre (COREC) in collaboration with the International Institute of Tropical Agriculture (IITA) and UCDA carried out an extensive survey to determine the

xiv UCDA Annual Report 2011/12
Making Uganda a Dinstinguished Producer of High Value Coffee
1UCDA Annual Report 2011/12
Making Uganda a Dinstinguished Producer of High Value Coffee
Chapter One
COFFEE MARKET PERFORMANCE
1.0 Introduction
For the coffee year 2011/12, a total of 2.73 million 60-Kilogramme bags (163,560 tonnes) worth US $ 392.70 million were shipped to various destinations, down from 3.15 million bags (188,965 tonnes) of coffee worth US $ 448.89 million recorded in the previous year. This comprised 1.904 m bags (114,251 tonnes) of Robusta valued at $ 223.98 m and 0.822 million bags (49,324 tonnes) of Arabica worth $ 168.72 m.
The weighted average price at export level stood at $ 2.40 per kilo compared to $ 2.38 in 2010/11 and $1.67 in 2009/10, depicting a positive trend. The slight increase in the weighted average price between 2011/12 and 2010/11 years, despite lower realized prices for the different types of coffee, is explained by a relatively smaller drop in the average price for Robusta over last year; and a rise in the proportion of Arabica in total exports. The weighted average price for Arabica stood at $3.42 per kilo down from $ 3.86 in the previous year whilst that for Robusta was $1.96 per kilo compared to $1.98. Generally, these were in tandem with global supply-demand dynamics that reflected a negative trend in Arabica prices throughout the year. European Union (EU) countries remain the main destinations of Uganda coffee holding a market share of 71% in terms of quantity, a drop from 75% registered last year. Sudan ranked second with a market share of 16%, up from 14% last year. 1.1 Coffee Procurement
Coffee procurement fell by 4.7% from 3.27 m bags (173,632 tonnes) in 2010/11 to 3.1 m bags (195,994 tonnes). There was a 15.2% drop in Robusta marketed production, attributed to prolonged drought and prevalence of black coffee twig borer mainly in the Central and Eastern regions. On the contrary, there was a 38.2% increase in Arabica. This is explained by the newly planted Arabica trees coming into production, a reduction in the incidence of pests and diseases (Coffee Leaf Rust and Coffee Berry Disease) and the biennial cycle characteristic of Arabica coffee.
Table 1.1 represents marketed coffee production (FAQ and Arabica parchment) to the export grading factories.

2 UCDA Annual Report 2011/12
Making Uganda a Dinstinguished Producer of High Value Coffee
Table 1.1 Coffee Procurement by type: 2007/08 – 2011/12 - in 60-kg bags
Coffee Year Coffee Type
Total %-Age Change
Robusta Arabica Over Previous yr.
Average 2,503,019 701,903 3,204,921 -
2011/12 2,224,302 890,061 3,114,363 -4.66
2010/11 2,622,380 644,185 3,266,565 12.88
2009/10 2,076,557 817,319 2,893,876 -11.22
2008/09 2,609,518 650,029 3,259,547 -6.61
2007/08 2,982,339 507,917 3,490,256 20.13
Table 1.2 shows monthly coffee receipts at the export grading factories in the coffee year 2011/12 as compared to 2010/11. Coffee procurement was highest during the last quarter (July-September), the main harvesting and marketing season for Masaka and the South-western regions. Table 1.2 Comparative Procurement Figures - 60-Kg Bags
MONTH 2011/12 2010/11 Robusta Arabica Total Robusta Arabica Total
TOTAL 2,224,302 890,061 3,114,363 2,622,380 644,185 3,266,565 OCT. 155,167 50,123 205,290 120,412 68,529 188,941 NOV. 160,012 65,012 225,024 212,477 69,323 281,800 DEC. 170,235 69,015 239,250 230,428 45,311 275,739 QTR – 1 485,414 184,150 669,564 563,317 183,163 746,480 JAN. 160,012 68,510 228,522 165,114 52,300 217,414 FEB. 165,009 90,018 255,027 160,006 53,107 213,113 MAR 106,105 85,658 191,763 155,001 52,176 207,177 QTR – 2 431,126 244,186 975,312 480,121 157,583 637,704 APR. 75,013 72,009 147,022 165,002 45,089 210,091 MAY 190,215 95,145 285,360 200,444 49,150 249,594 JUN. 252,148 80,146 382,294 321,793 53,087 367,100 QTR – 3 517,376 247,300 814,676 687,239 147,326 826,785 JUL 320,125 79,164 399,289 360,901 54,104 407,225 AUG. 270,125 70,103 340,228 286,903 52,009 332,132 SEPT 200,136 65,158 265,294 243,899 50,000 287,772 QTR – 4 790,386 214,425 1,004,811 891,703 156,113 1,027,129
Relatively high farm gate prices for Robusta from July onwards prompted farmers to sell more which explains high procurement during this period.
3UCDA Annual Report 2011/12
Making Uganda a Dinstinguished Producer of High Value Coffee
Table 1.1 Coffee Procurement by type: 2007/08 – 2011/12 - in 60-kg bags
Coffee Year Coffee Type
Total %-Age Change
Robusta Arabica Over Previous yr.
Average 2,503,019 701,903 3,204,921 -
2011/12 2,224,302 890,061 3,114,363 -4.66
2010/11 2,622,380 644,185 3,266,565 12.88
2009/10 2,076,557 817,319 2,893,876 -11.22
2008/09 2,609,518 650,029 3,259,547 -6.61
2007/08 2,982,339 507,917 3,490,256 20.13
Table 1.2 shows monthly coffee receipts at the export grading factories in the coffee year 2011/12 as compared to 2010/11. Coffee procurement was highest during the last quarter (July-September), the main harvesting and marketing season for Masaka and the South-western regions. Table 1.2 Comparative Procurement Figures - 60-Kg Bags
MONTH 2011/12 2010/11 Robusta Arabica Total Robusta Arabica Total
TOTAL 2,224,302 890,061 3,114,363 2,622,380 644,185 3,266,565 OCT. 155,167 50,123 205,290 120,412 68,529 188,941 NOV. 160,012 65,012 225,024 212,477 69,323 281,800 DEC. 170,235 69,015 239,250 230,428 45,311 275,739 QTR – 1 485,414 184,150 669,564 563,317 183,163 746,480 JAN. 160,012 68,510 228,522 165,114 52,300 217,414 FEB. 165,009 90,018 255,027 160,006 53,107 213,113 MAR 106,105 85,658 191,763 155,001 52,176 207,177 QTR – 2 431,126 244,186 975,312 480,121 157,583 637,704 APR. 75,013 72,009 147,022 165,002 45,089 210,091 MAY 190,215 95,145 285,360 200,444 49,150 249,594 JUN. 252,148 80,146 382,294 321,793 53,087 367,100 QTR – 3 517,376 247,300 814,676 687,239 147,326 826,785 JUL 320,125 79,164 399,289 360,901 54,104 407,225 AUG. 270,125 70,103 340,228 286,903 52,009 332,132 SEPT 200,136 65,158 265,294 243,899 50,000 287,772 QTR – 4 790,386 214,425 1,004,811 891,703 156,113 1,027,129
Relatively high farm gate prices for Robusta from July onwards prompted farmers to sell more which explains high procurement during this period.
1.2 Internal Marketing
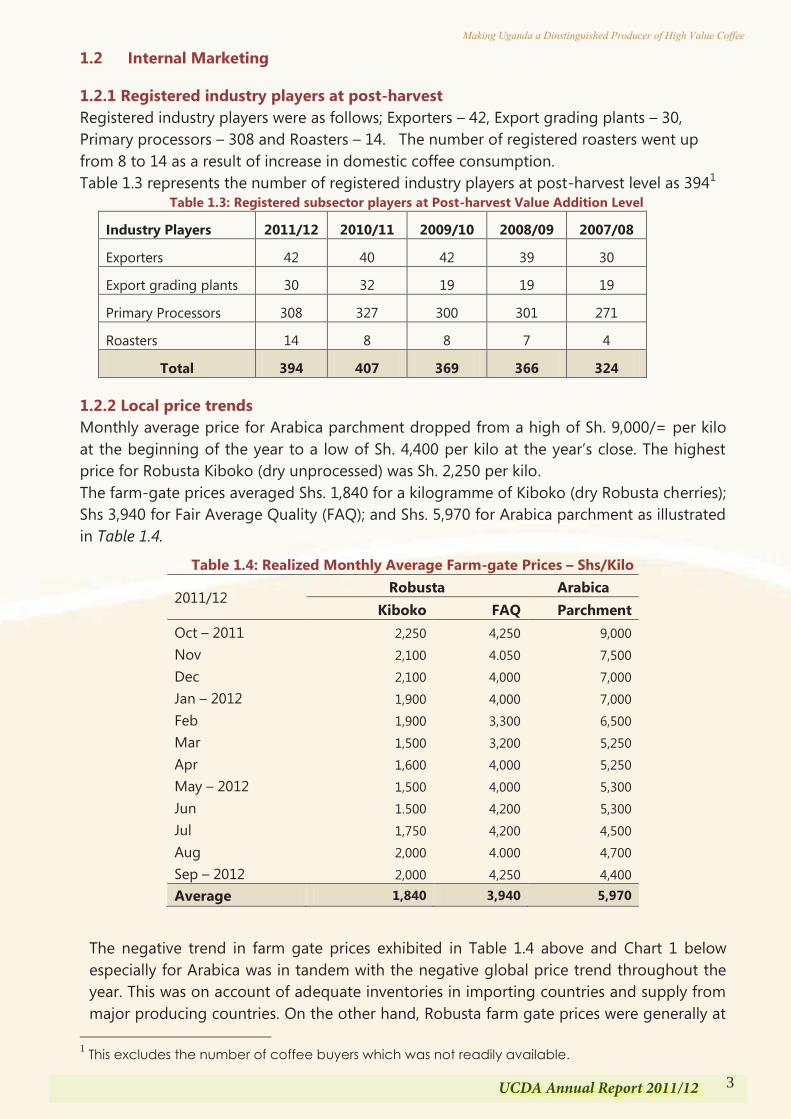
1.2.1 Registered industry players at post-harvest Registered industry players were as follows; Exporters – 42, Export grading plants – 30, Primary processors – 308 and Roasters – 14. The number of registered roasters went up from 8 to 14 as a result of increase in domestic coffee consumption. Table 1.3 represents the number of registered industry players at post-harvest level as 3941
Table 1.3: Registered subsector players at Post-harvest Value Addition Level
Industry Players 2011/12 2010/11 2009/10 2008/09 2007/08
Exporters 42 40 42 39 30
Export grading plants 30 32 19 19 19
Primary Processors 308 327 300 301 271
Roasters 14 8 8 7 4
Total 394 407 369 366 324
1.2.2 Local price trends Monthly average price for Arabica parchment dropped from a high of Sh. 9,000/= per kilo at the beginning of the year to a low of Sh. 4,400 per kilo at the year‟s close. The highest price for Robusta Kiboko (dry unprocessed) was Sh. 2,250 per kilo. The farm-gate prices averaged Shs. 1,840 for a kilogramme of Kiboko (dry Robusta cherries); Shs 3,940 for Fair Average Quality (FAQ); and Shs. 5,970 for Arabica parchment as illustrated in Table 1.4.
Table 1.4: Realized Monthly Average Farm-gate Prices – Shs/Kilo
2011/12 Robusta Arabica
Kiboko FAQ Parchment Oct – 2011 2,250 4,250 9,000 Nov 2,100 4.050 7,500 Dec 2,100 4,000 7,000 Jan – 2012 1,900 4,000 7,000 Feb 1,900 3,300 6,500 Mar 1,500 3,200 5,250 Apr 1,600 4,000 5,250 May – 2012 1,500 4,000 5,300 Jun 1.500 4,200 5,300 Jul 1,750 4,200 4,500 Aug 2,000 4.000 4,700 Sep – 2012 2,000 4,250 4,400 Average 1,840 3,940 5,970
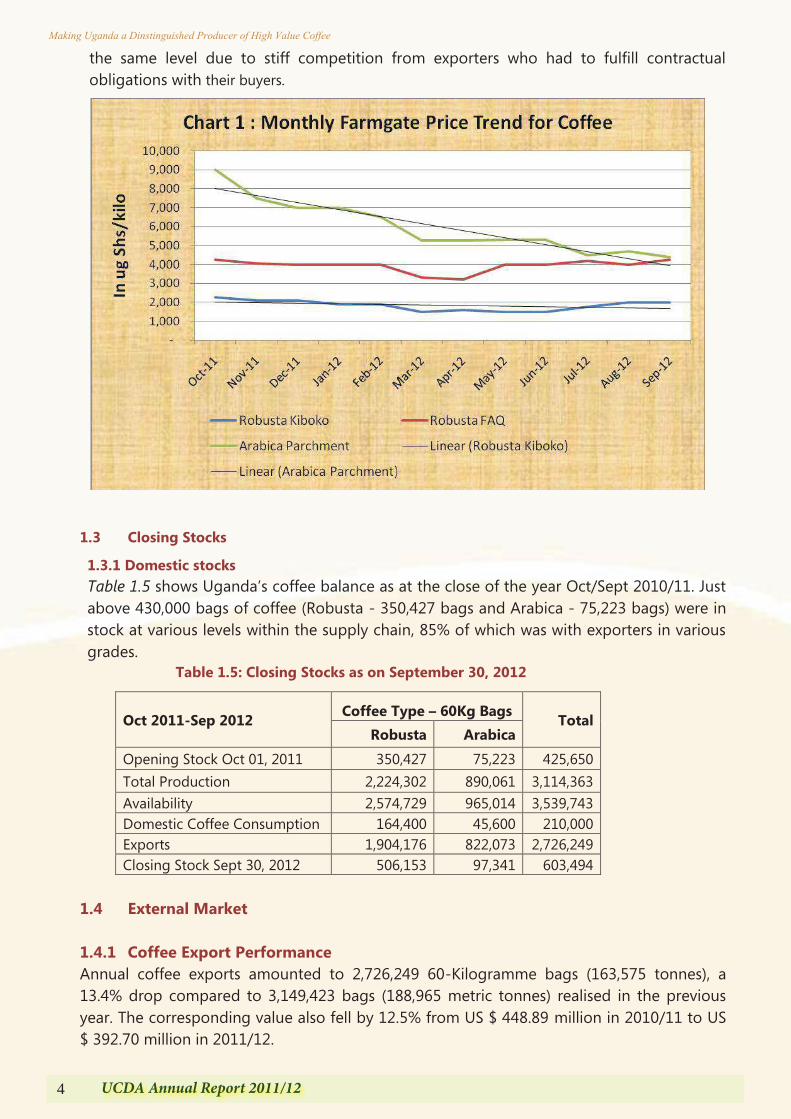
The negative trend in farm gate prices exhibited in Table 1.4 above and Chart 1 below especially for Arabica was in tandem with the negative global price trend throughout the year. This was on account of adequate inventories in importing countries and supply from major producing countries. On the other hand, Robusta farm gate prices were generally at
1 This excludes the number of coffee buyers which was not readily available.
4 UCDA Annual Report 2011/12
Making Uganda a Dinstinguished Producer of High Value Coffee
the same level due to stiff competition from exporters who had to fulfill contractual obligations with their buyers.
1.3 Closing Stocks
1.3.1 Domestic stocks Table 1.5 shows Uganda‟s coffee balance as at the close of the year Oct/Sept 2010/11. Just above 430,000 bags of coffee (Robusta - 350,427 bags and Arabica - 75,223 bags) were in stock at various levels within the supply chain, 85% of which was with exporters in various grades.
Table 1.5: Closing Stocks as on September 30, 2012
Oct 2011-Sep 2012 Coffee Type – 60Kg Bags Total Robusta Arabica
Opening Stock Oct 01, 2011 350,427 75,223 425,650 Total Production 2,224,302 890,061 3,114,363 Availability 2,574,729 965,014 3,539,743 Domestic Coffee Consumption 164,400 45,600 210,000 Exports 1,904,176 822,073 2,726,249 Closing Stock Sept 30, 2012 506,153 97,341 603,494
1.4 External Market 1.4.1 Coffee Export Performance Annual coffee exports amounted to 2,726,249 60-Kilogramme bags (163,575 tonnes), a 13.4% drop compared to 3,149,423 bags (188,965 metric tonnes) realised in the previous year. The corresponding value also fell by 12.5% from US $ 448.89 million in 2010/11 to US $ 392.70 million in 2011/12.
5UCDA Annual Report 2011/12
Making Uganda a Dinstinguished Producer of High Value Coffee
the same level due to stiff competition from exporters who had to fulfill contractual obligations with their buyers.
1.3 Closing Stocks
1.3.1 Domestic stocks Table 1.5 shows Uganda‟s coffee balance as at the close of the year Oct/Sept 2010/11. Just above 430,000 bags of coffee (Robusta - 350,427 bags and Arabica - 75,223 bags) were in stock at various levels within the supply chain, 85% of which was with exporters in various grades.
Table 1.5: Closing Stocks as on September 30, 2012
Oct 2011-Sep 2012 Coffee Type – 60Kg Bags Total Robusta Arabica
Opening Stock Oct 01, 2011 350,427 75,223 425,650 Total Production 2,224,302 890,061 3,114,363 Availability 2,574,729 965,014 3,539,743 Domestic Coffee Consumption 164,400 45,600 210,000 Exports 1,904,176 822,073 2,726,249 Closing Stock Sept 30, 2012 506,153 97,341 603,494
1.4 External Market 1.4.1 Coffee Export Performance Annual coffee exports amounted to 2,726,249 60-Kilogramme bags (163,575 tonnes), a 13.4% drop compared to 3,149,423 bags (188,965 metric tonnes) realised in the previous year. The corresponding value also fell by 12.5% from US $ 448.89 million in 2010/11 to US $ 392.70 million in 2011/12.
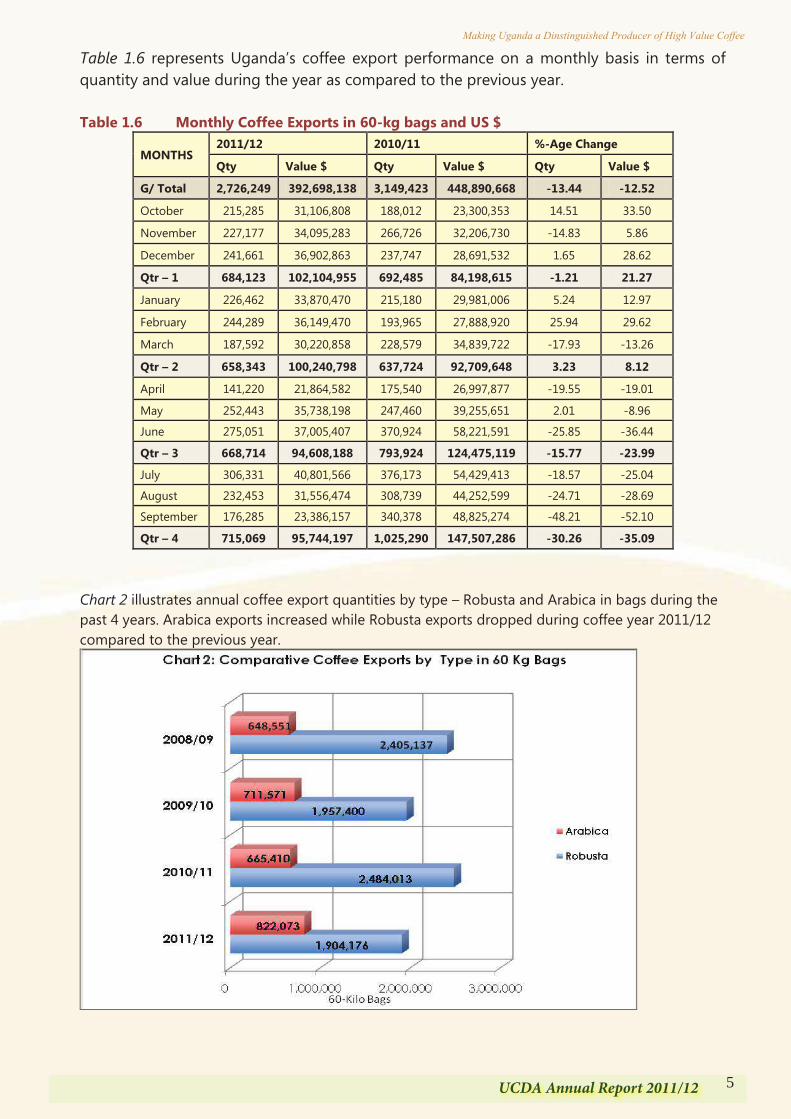
Table 1.6 represents Uganda‟s coffee export performance on a monthly basis in terms of quantity and value during the year as compared to the previous year. Table 1.6 Monthly Coffee Exports in 60-kg bags and US $
MONTHS 2011/12 2010/11 %-Age Change
Qty Value $ Qty Value $ Qty Value $
G/ Total 2,726,249 392,698,138 3,149,423 448,890,668 -13.44 -12.52
October 215,285 31,106,808 188,012 23,300,353 14.51 33.50
November 227,177 34,095,283 266,726 32,206,730 -14.83 5.86
December 241,661 36,902,863 237,747 28,691,532 1.65 28.62
Qtr – 1 684,123 102,104,955 692,485 84,198,615 -1.21 21.27
January 226,462 33,870,470 215,180 29,981,006 5.24 12.97
February 244,289 36,149,470 193,965 27,888,920 25.94 29.62
March 187,592 30,220,858 228,579 34,839,722 -17.93 -13.26
Qtr – 2 658,343 100,240,798 637,724 92,709,648 3.23 8.12
April 141,220 21,864,582 175,540 26,997,877 -19.55 -19.01
May 252,443 35,738,198 247,460 39,255,651 2.01 -8.96
June 275,051 37,005,407 370,924 58,221,591 -25.85 -36.44
Qtr – 3 668,714 94,608,188 793,924 124,475,119 -15.77 -23.99
July 306,331 40,801,566 376,173 54,429,413 -18.57 -25.04
August 232,453 31,556,474 308,739 44,252,599 -24.71 -28.69
September 176,285 23,386,157 340,378 48,825,274 -48.21 -52.10
Qtr – 4 715,069 95,744,197 1,025,290 147,507,286 -30.26 -35.09
Chart 2 illustrates annual coffee export quantities by type – Robusta and Arabica in bags during the past 4 years. Arabica exports increased while Robusta exports dropped during coffee year 2011/12 compared to the previous year.
6 UCDA Annual Report 2011/12
Making Uganda a Dinstinguished Producer of High Value Coffee
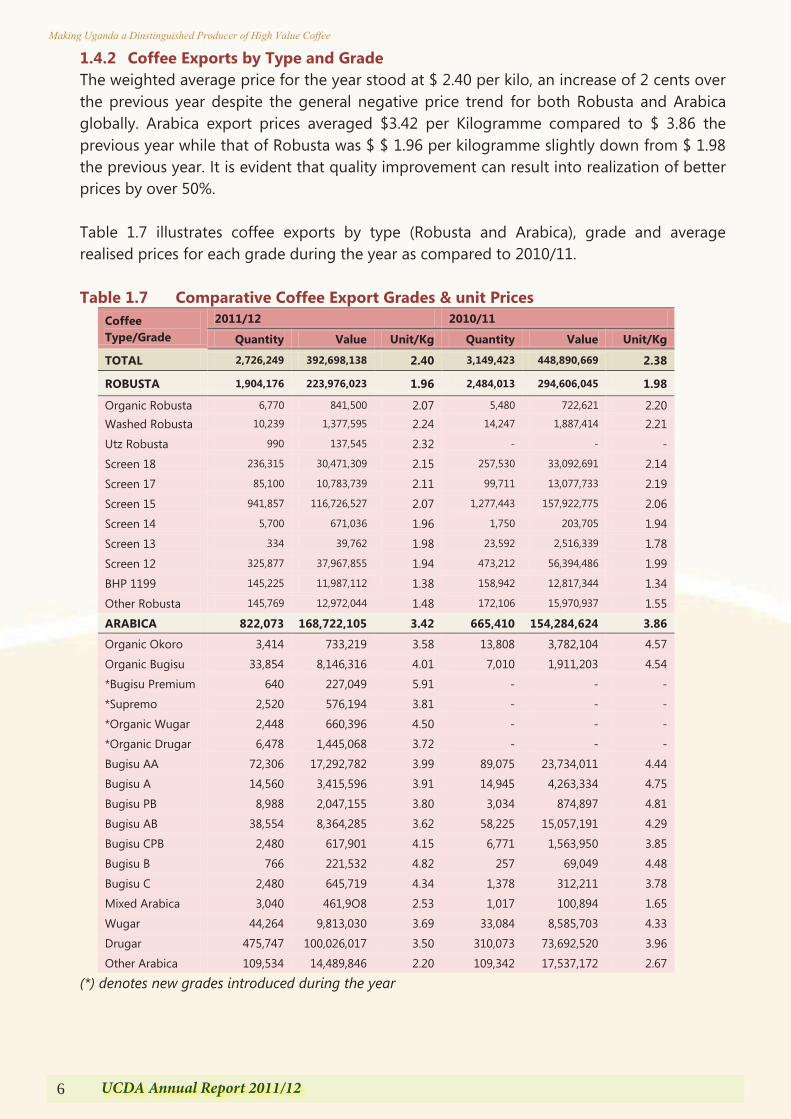
1.4.2 Coffee Exports by Type and Grade The weighted average price for the year stood at $ 2.40 per kilo, an increase of 2 cents over the previous year despite the general negative price trend for both Robusta and Arabica globally. Arabica export prices averaged $3.42 per Kilogramme compared to $ 3.86 the previous year while that of Robusta was $ $ 1.96 per kilogramme slightly down from $ 1.98 the previous year. It is evident that quality improvement can result into realization of better prices by over 50%. Table 1.7 illustrates coffee exports by type (Robusta and Arabica), grade and average realised prices for each grade during the year as compared to 2010/11. Table 1.7 Comparative Coffee Export Grades & unit Prices
Coffee Type/Grade
2011/12 2010/11
Quantity Value Unit/Kg Quantity Value Unit/Kg
TOTAL 2,726,249 392,698,138 2.40 3,149,423 448,890,669 2.38
ROBUSTA 1,904,176 223,976,023 1.96 2,484,013 294,606,045 1.98
Organic Robusta 6,770 841,500 2.07 5,480 722,621 2.20 Washed Robusta 10,239 1,377,595 2.24 14,247 1,887,414 2.21
Utz Robusta 990 137,545 2.32 - - -
Screen 18 236,315 30,471,309 2.15 257,530 33,092,691 2.14
Screen 17 85,100 10,783,739 2.11 99,711 13,077,733 2.19
Screen 15 941,857 116,726,527 2.07 1,277,443 157,922,775 2.06
Screen 14 5,700 671,036 1.96 1,750 203,705 1.94
Screen 13 334 39,762 1.98 23,592 2,516,339 1.78
Screen 12 325,877 37,967,855 1.94 473,212 56,394,486 1.99
BHP 1199 145,225 11,987,112 1.38 158,942 12,817,344 1.34
Other Robusta 145,769 12,972,044 1.48 172,106 15,970,937 1.55
ARABICA 822,073 168,722,105 3.42 665,410 154,284,624 3.86
Organic Okoro 3,414 733,219 3.58 13,808 3,782,104 4.57
Organic Bugisu 33,854 8,146,316 4.01 7,010 1,911,203 4.54
*Bugisu Premium 640 227,049 5.91 - - -
*Supremo 2,520 576,194 3.81 - - -
*Organic Wugar 2,448 660,396 4.50 - - -
*Organic Drugar 6,478 1,445,068 3.72 - - -
Bugisu AA 72,306 17,292,782 3.99 89,075 23,734,011 4.44
Bugisu A 14,560 3,415,596 3.91 14,945 4,263,334 4.75
Bugisu PB 8,988 2,047,155 3.80 3,034 874,897 4.81
Bugisu AB 38,554 8,364,285 3.62 58,225 15,057,191 4.29
Bugisu CPB 2,480 617,901 4.15 6,771 1,563,950 3.85
Bugisu B 766 221,532 4.82 257 69,049 4.48
Bugisu C 2,480 645,719 4.34 1,378 312,211 3.78
Mixed Arabica 3,040 461,9O8 2.53 1,017 100,894 1.65
Wugar 44,264 9,813,030 3.69 33,084 8,585,703 4.33
Drugar 475,747 100,026,017 3.50 310,073 73,692,520 3.96
Other Arabica 109,534 14,489,846 2.20 109,342 17,537,172 2.67
(*) denotes new grades introduced during the year
7UCDA Annual Report 2011/12
Making Uganda a Dinstinguished Producer of High Value Coffee
1.4.2 Coffee Exports by Type and Grade The weighted average price for the year stood at $ 2.40 per kilo, an increase of 2 cents over the previous year despite the general negative price trend for both Robusta and Arabica globally. Arabica export prices averaged $3.42 per Kilogramme compared to $ 3.86 the previous year while that of Robusta was $ $ 1.96 per kilogramme slightly down from $ 1.98 the previous year. It is evident that quality improvement can result into realization of better prices by over 50%. Table 1.7 illustrates coffee exports by type (Robusta and Arabica), grade and average realised prices for each grade during the year as compared to 2010/11. Table 1.7 Comparative Coffee Export Grades & unit Prices
Coffee Type/Grade
2011/12 2010/11
Quantity Value Unit/Kg Quantity Value Unit/Kg
TOTAL 2,726,249 392,698,138 2.40 3,149,423 448,890,669 2.38
ROBUSTA 1,904,176 223,976,023 1.96 2,484,013 294,606,045 1.98
Organic Robusta 6,770 841,500 2.07 5,480 722,621 2.20 Washed Robusta 10,239 1,377,595 2.24 14,247 1,887,414 2.21
Utz Robusta 990 137,545 2.32 - - -
Screen 18 236,315 30,471,309 2.15 257,530 33,092,691 2.14
Screen 17 85,100 10,783,739 2.11 99,711 13,077,733 2.19
Screen 15 941,857 116,726,527 2.07 1,277,443 157,922,775 2.06
Screen 14 5,700 671,036 1.96 1,750 203,705 1.94
Screen 13 334 39,762 1.98 23,592 2,516,339 1.78
Screen 12 325,877 37,967,855 1.94 473,212 56,394,486 1.99
BHP 1199 145,225 11,987,112 1.38 158,942 12,817,344 1.34
Other Robusta 145,769 12,972,044 1.48 172,106 15,970,937 1.55
ARABICA 822,073 168,722,105 3.42 665,410 154,284,624 3.86
Organic Okoro 3,414 733,219 3.58 13,808 3,782,104 4.57
Organic Bugisu 33,854 8,146,316 4.01 7,010 1,911,203 4.54
*Bugisu Premium 640 227,049 5.91 - - -
*Supremo 2,520 576,194 3.81 - - -
*Organic Wugar 2,448 660,396 4.50 - - -
*Organic Drugar 6,478 1,445,068 3.72 - - -
Bugisu AA 72,306 17,292,782 3.99 89,075 23,734,011 4.44
Bugisu A 14,560 3,415,596 3.91 14,945 4,263,334 4.75
Bugisu PB 8,988 2,047,155 3.80 3,034 874,897 4.81
Bugisu AB 38,554 8,364,285 3.62 58,225 15,057,191 4.29
Bugisu CPB 2,480 617,901 4.15 6,771 1,563,950 3.85
Bugisu B 766 221,532 4.82 257 69,049 4.48
Bugisu C 2,480 645,719 4.34 1,378 312,211 3.78
Mixed Arabica 3,040 461,9O8 2.53 1,017 100,894 1.65
Wugar 44,264 9,813,030 3.69 33,084 8,585,703 4.33
Drugar 475,747 100,026,017 3.50 310,073 73,692,520 3.96
Other Arabica 109,534 14,489,846 2.20 109,342 17,537,172 2.67
(*) denotes new grades introduced during the year
The slight increase in the weighted average price is explained by an increase in the proportion of Arabica in total volume of export. Table 1.4 shows that price premiums are very distinct between speciality/sustainable and conventional coffees in both Robusta and Arabica. In Robusta, UTZ Robusta fetched $2.32 per kilo compared to Screen 18, a premium of 17 cents. Bugisu Premium sold in the specialty market realised $ 5.91 per kilo compared to Bugisu AA in the conventional market at $ 3.99, a price differential of 192 cents. 1.4.3 Realized prices at export level The annual weighted average for the coffee year was US$ 2.40 per kilo (Arabica - 3.42 and Robusta - 1.96). The highest weighted average price was realized in March 2012 when it reached US $ 2.68 compared to May 2011 at US$ 2.64 per kilo, the highest in the previous year. The highest prices for Arabica were US$ 4.10 per kilo compared to US$ 4.55 the previous year and correspondingly $ 2.07 per kilo compared to $ 2.24 for Robusta Chart 3 illustrates the monthly average prices for each type of coffee – Arabica and Robusta – on a comparative basis
1.4.4 Export Performance by Individual Companies A total of 42 exporting companies were registered during the year and all exported coffee. In terms of the market share, 81% was held by 10 companies up from 80% in 2010/11, reflecting a stable but increasing concentration at the export level. Table 1.8 shows the export performance of each company in terms of quantity (Robusta and Arabica), percentage share and cumulative market shares.
8 UCDA Annual Report 2011/12
Making Uganda a Dinstinguished Producer of High Value Coffee
Table 1.8: Coffee Exports by Individual Companies
Exporting Company Quantity – 60 kg Bags %-age Market hare
Robusta Arabica Total Individual Cumulative
Grand Total 1,904,176 822,073 2,726,249 100
1 Ugacof (U) Ltd 368,964 60,905 429,869 15.77 15.77 2 Kyagalanyi Coffee Ltd 198,236 190,722 388,958 14.27 30.04 3 Olam (U) Ltd 281,992 49,558 331,550 12.16 42.2 4 Kawacom (U) Ltd 78,953 175,209 254,162 9.32 51.52 5 Ibero (U) Ltd 150,759 18,301 169,060 9.2 57.72 6 Job Coffee Ltd. 79,228 74,762 153,990 5.65 63.37 7 Kampala Domestic store 142,916 350 143,266 5.26 68.62 8 Savannah Commodities 82,300 45,805 128,105 4.7 73.32 9 Great Lakes (U) Ltd. 14,420 96,348 110,768 4.06 77.39
10 Pan Afric-Impex (U) Ltd. 94,980 - 94,980 3.48 80.87 11 Lakeland Holdings Ltd 39,563 21,100 60.663 2.23 83.09 12 Nakana Coffee Factory 58,910 - 58,910 2.16 85.26 13 Penform Trading Company 53,638 1,900 55,538 2.04 87.29 14 LD Commodities 44,101 10,499 54,600 2 89.3 15 Armajaro Coffee Co. Ltd 46,519
46,519 1.71 91
16 Kamba Petroleum Ltd. 26,374 16,928 43,302 1.59 92.59 17 Kitasha Buyers Ltd. 37,447
37,447 1.37 93.96
18 Mbale Importers and Exporters 6,412 15,260 21,672 0.79 94.76 19 Ankole Coffee Producers Coop 20,866 286 21,152 0.78 95.53 20 Kisuule & Sons Ltd. 17,168 - 17,168 0.63 96.16 21 Wabulungu M-Purpose Estate Ltd 12,760 3,674 16,434 0.6 96.77 22 Risala (U) Ltd 12,968 1,332 14,300 0.52 97.29 23 Bakwanye Trading Company Ltd 654 12,080 12,374 0.47 97.76 24 Gumutindo Co-op Enterprises Ltd - 11,580 11,580 0.42 98.18 25 Coffee Services Ltd. 7,973 3,151 11,124 0.41 98.59 26 Ankole Coffee Processors Ltd 8,168 2,720 10,888 0.4 98.99 27 Zigoti Coffee Works 5,938
5,938 0.22 99.21
28 Kaweri Coffee Plantation 4,320
4,320 0.16 99.37 29 Nile Highland Arabica Coffee Assn
3,550 3,550 0.13 99.5
30 Bukonzo Joint Cooperative Society 166 1,754 1,920 0.07 99.57 31 Anderson Investment Ltd. 1,600 320 1,920 0.07 99.64 32 Export Trading Company Ltd. 1,920
1,920 0.07 99.71
33 Coffee World. 980 640 1,620 0.06 99.77 34 Commodity Solutions 1,368
1,368 0.05 99.82
35 Green Holdings Ltd.
1,280 1,280 0.05 99.86 36 Budadiri Coffee Factory
960 960 0.04 99.9
37 Qualicoff 700
700 0.03 99.92 38 Kabum Trading Company
640 640 0.02 99.95
39 Gatto Estates Ltd. 250 288 538 0.02 99.97 40 Trans Gaz 345
345 0.01 99.98
41 Katuka 320
320 0.01 99.99 42 Masai Tours 221
221 0.01 100
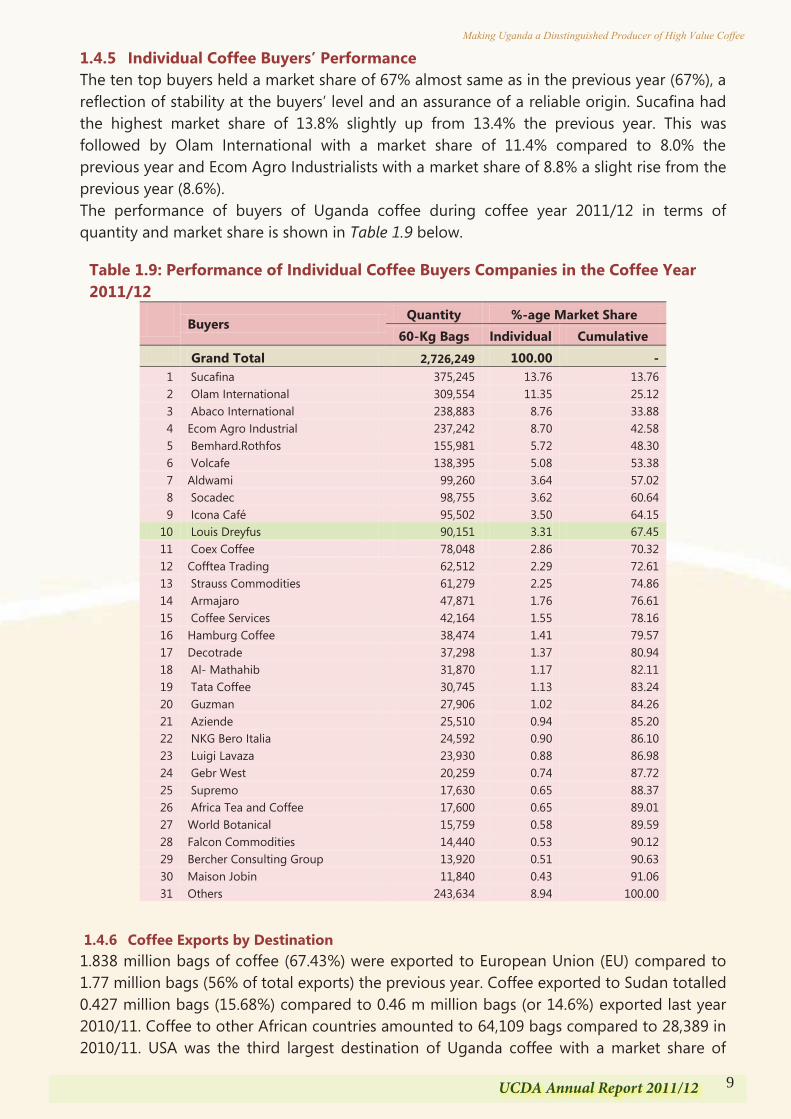
9UCDA Annual Report 2011/12
Making Uganda a Dinstinguished Producer of High Value Coffee
Table 1.8: Coffee Exports by Individual Companies
Exporting Company Quantity – 60 kg Bags %-age Market hare
Robusta Arabica Total Individual Cumulative
Grand Total 1,904,176 822,073 2,726,249 100
1 Ugacof (U) Ltd 368,964 60,905 429,869 15.77 15.77 2 Kyagalanyi Coffee Ltd 198,236 190,722 388,958 14.27 30.04 3 Olam (U) Ltd 281,992 49,558 331,550 12.16 42.2 4 Kawacom (U) Ltd 78,953 175,209 254,162 9.32 51.52 5 Ibero (U) Ltd 150,759 18,301 169,060 9.2 57.72 6 Job Coffee Ltd. 79,228 74,762 153,990 5.65 63.37 7 Kampala Domestic store 142,916 350 143,266 5.26 68.62 8 Savannah Commodities 82,300 45,805 128,105 4.7 73.32 9 Great Lakes (U) Ltd. 14,420 96,348 110,768 4.06 77.39
10 Pan Afric-Impex (U) Ltd. 94,980 - 94,980 3.48 80.87 11 Lakeland Holdings Ltd 39,563 21,100 60.663 2.23 83.09 12 Nakana Coffee Factory 58,910 - 58,910 2.16 85.26 13 Penform Trading Company 53,638 1,900 55,538 2.04 87.29 14 LD Commodities 44,101 10,499 54,600 2 89.3 15 Armajaro Coffee Co. Ltd 46,519
46,519 1.71 91
16 Kamba Petroleum Ltd. 26,374 16,928 43,302 1.59 92.59 17 Kitasha Buyers Ltd. 37,447
37,447 1.37 93.96
18 Mbale Importers and Exporters 6,412 15,260 21,672 0.79 94.76 19 Ankole Coffee Producers Coop 20,866 286 21,152 0.78 95.53 20 Kisuule & Sons Ltd. 17,168 - 17,168 0.63 96.16 21 Wabulungu M-Purpose Estate Ltd 12,760 3,674 16,434 0.6 96.77 22 Risala (U) Ltd 12,968 1,332 14,300 0.52 97.29 23 Bakwanye Trading Company Ltd 654 12,080 12,374 0.47 97.76 24 Gumutindo Co-op Enterprises Ltd - 11,580 11,580 0.42 98.18 25 Coffee Services Ltd. 7,973 3,151 11,124 0.41 98.59 26 Ankole Coffee Processors Ltd 8,168 2,720 10,888 0.4 98.99 27 Zigoti Coffee Works 5,938
5,938 0.22 99.21
28 Kaweri Coffee Plantation 4,320
4,320 0.16 99.37 29 Nile Highland Arabica Coffee Assn
3,550 3,550 0.13 99.5
30 Bukonzo Joint Cooperative Society 166 1,754 1,920 0.07 99.57 31 Anderson Investment Ltd. 1,600 320 1,920 0.07 99.64 32 Export Trading Company Ltd. 1,920
1,920 0.07 99.71
33 Coffee World. 980 640 1,620 0.06 99.77 34 Commodity Solutions 1,368
1,368 0.05 99.82
35 Green Holdings Ltd.
1,280 1,280 0.05 99.86 36 Budadiri Coffee Factory
960 960 0.04 99.9
37 Qualicoff 700
700 0.03 99.92 38 Kabum Trading Company
640 640 0.02 99.95
39 Gatto Estates Ltd. 250 288 538 0.02 99.97 40 Trans Gaz 345
345 0.01 99.98
41 Katuka 320
320 0.01 99.99 42 Masai Tours 221
221 0.01 100
1.4.5 Individual Coffee Buyers’ Performance The ten top buyers held a market share of 67% almost same as in the previous year (67%), a reflection of stability at the buyers‟ level and an assurance of a reliable origin. Sucafina had the highest market share of 13.8% slightly up from 13.4% the previous year. This was followed by Olam International with a market share of 11.4% compared to 8.0% the previous year and Ecom Agro Industrialists with a market share of 8.8% a slight rise from the previous year (8.6%). The performance of buyers of Uganda coffee during coffee year 2011/12 in terms of quantity and market share is shown in Table 1.9 below.
Table 1.9: Performance of Individual Coffee Buyers Companies in the Coffee Year 2011/12
Buyers Quantity %-age Market Share
60-Kg Bags Individual Cumulative Grand Total 2,726,249 100.00 -
1 Sucafina 375,245 13.76 13.76 2 Olam International 309,554 11.35 25.12 3 Abaco International 238,883 8.76 33.88 4 Ecom Agro Industrial 237,242 8.70 42.58 5 Bemhard.Rothfos 155,981 5.72 48.30 6 Volcafe 138,395 5.08 53.38 7 Aldwami 99,260 3.64 57.02 8 Socadec 98,755 3.62 60.64 9 Icona Café 95,502 3.50 64.15
10 Louis Dreyfus 90,151 3.31 67.45 11 Coex Coffee 78,048 2.86 70.32 12 Cofftea Trading 62,512 2.29 72.61 13 Strauss Commodities 61,279 2.25 74.86 14 Armajaro 47,871 1.76 76.61 15 Coffee Services 42,164 1.55 78.16 16 Hamburg Coffee 38,474 1.41 79.57 17 Decotrade 37,298 1.37 80.94 18 Al- Mathahib 31,870 1.17 82.11 19 Tata Coffee 30,745 1.13 83.24 20 Guzman 27,906 1.02 84.26 21 Aziende 25,510 0.94 85.20 22 NKG Bero Italia 24,592 0.90 86.10 23 Luigi Lavaza 23,930 0.88 86.98 24 Gebr West 20,259 0.74 87.72 25 Supremo 17,630 0.65 88.37 26 Africa Tea and Coffee 17,600 0.65 89.01 27 World Botanical 15,759 0.58 89.59 28 Falcon Commodities 14,440 0.53 90.12 29 Bercher Consulting Group 13,920 0.51 90.63 30 Maison Jobin 11,840 0.43 91.06 31 Others 243,634 8.94 100.00
1.4.6 Coffee Exports by Destination 1.838 million bags of coffee (67.43%) were exported to European Union (EU) compared to 1.77 million bags (56% of total exports) the previous year. Coffee exported to Sudan totalled 0.427 million bags (15.68%) compared to 0.46 m million bags (or 14.6%) exported last year 2010/11. Coffee to other African countries amounted to 64,109 bags compared to 28,389 in 2010/11. USA was the third largest destination of Uganda coffee with a market share of
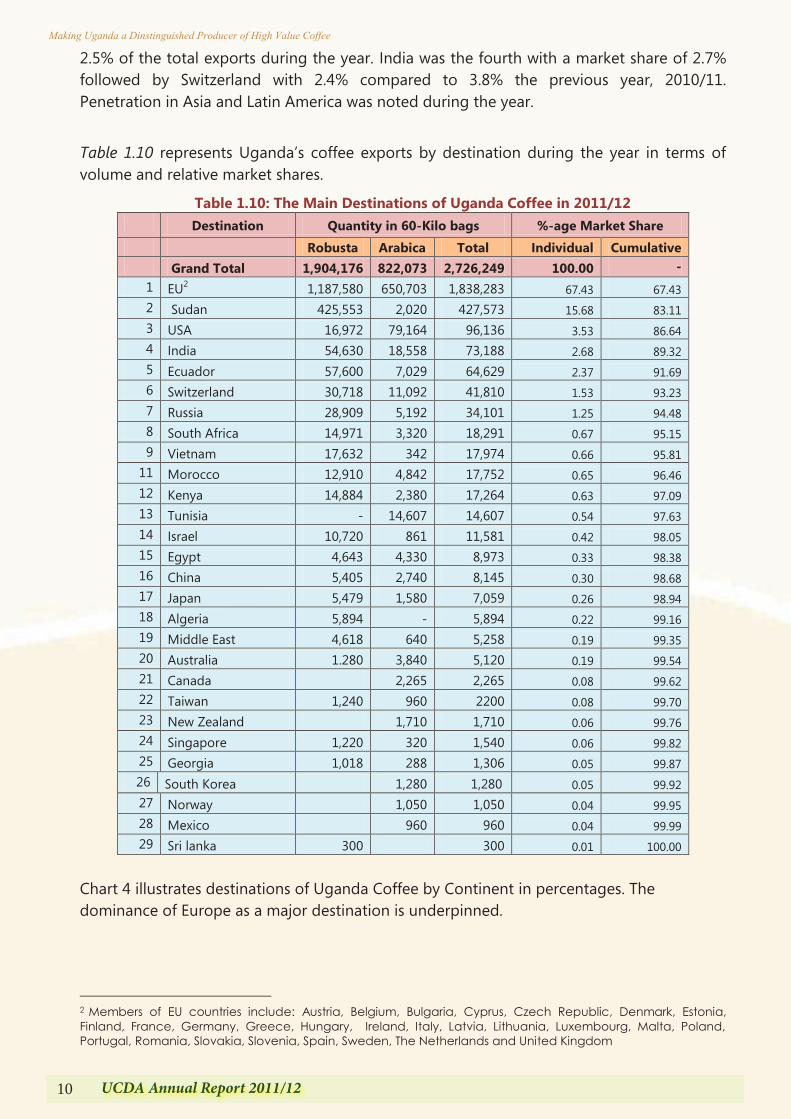
10 UCDA Annual Report 2011/12
Making Uganda a Dinstinguished Producer of High Value Coffee
2.5% of the total exports during the year. India was the fourth with a market share of 2.7% followed by Switzerland with 2.4% compared to 3.8% the previous year, 2010/11. Penetration in Asia and Latin America was noted during the year.
Table 1.10 represents Uganda‟s coffee exports by destination during the year in terms of volume and relative market shares.
Table 1.10: The Main Destinations of Uganda Coffee in 2011/12 Destination Quantity in 60-Kilo bags %-age Market Share Robusta Arabica Total Individual Cumulative Grand Total 1,904,176 822,073 2,726,249 100.00 -
1 EU2 1,187,580 650,703 1,838,283 67.43 67.43 2 Sudan 425,553 2,020 427,573 15.68 83.11 3 USA 16,972 79,164 96,136 3.53 86.64 4 India 54,630 18,558 73,188 2.68 89.32 5 Ecuador 57,600 7,029 64,629 2.37 91.69 6 Switzerland 30,718 11,092 41,810 1.53 93.23 7 Russia 28,909 5,192 34,101 1.25 94.48 8 South Africa 14,971 3,320 18,291 0.67 95.15 9 Vietnam 17,632 342 17,974 0.66 95.81
11 Morocco 12,910 4,842 17,752 0.65 96.46 12 Kenya 14,884 2,380 17,264 0.63 97.09 13 Tunisia - 14,607 14,607 0.54 97.63 14 Israel 10,720 861 11,581 0.42 98.05 15 Egypt 4,643 4,330 8,973 0.33 98.38 16 China 5,405 2,740 8,145 0.30 98.68 17 Japan 5,479 1,580 7,059 0.26 98.94 18 Algeria 5,894 - 5,894 0.22 99.16 19 Middle East 4,618 640 5,258 0.19 99.35 20 Australia 1.280 3,840 5,120 0.19 99.54 21 Canada 2,265 2,265 0.08 99.62 22 Taiwan 1,240 960 2200 0.08 99.70 23 New Zealand 1,710 1,710 0.06 99.76 24 Singapore 1,220 320 1,540 0.06 99.82 25 Georgia 1,018 288 1,306 0.05 99.87 26 South Korea 1,280 1,280 0.05 99.92 27 Norway 1,050 1,050 0.04 99.95 28 Mexico 960 960 0.04 99.99 29 Sri lanka 300 300 0.01 100.00
Chart 4 illustrates destinations of Uganda Coffee by Continent in percentages. The dominance of Europe as a major destination is underpinned.
2 Members of EU countries include: Austria, Belgium, Bulgaria, Cyprus, Czech Republic, Denmark, Estonia, Finland, France, Germany, Greece, Hungary, Ireland, Italy, Latvia, Lithuania, Luxembourg, Malta, Poland, Portugal, Romania, Slovakia, Slovenia, Spain, Sweden, The Netherlands and United Kingdom
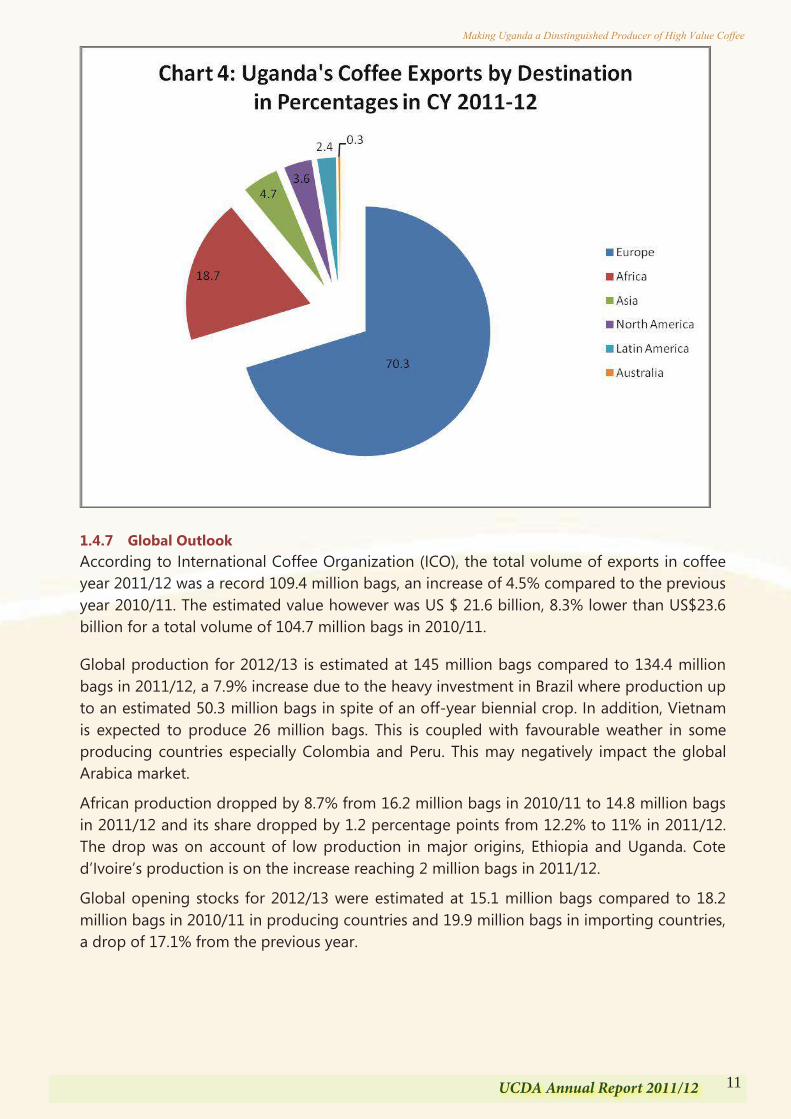
11UCDA Annual Report 2011/12
Making Uganda a Dinstinguished Producer of High Value Coffee
2.5% of the total exports during the year. India was the fourth with a market share of 2.7% followed by Switzerland with 2.4% compared to 3.8% the previous year, 2010/11. Penetration in Asia and Latin America was noted during the year.
Table 1.10 represents Uganda‟s coffee exports by destination during the year in terms of volume and relative market shares.
Table 1.10: The Main Destinations of Uganda Coffee in 2011/12 Destination Quantity in 60-Kilo bags %-age Market Share Robusta Arabica Total Individual Cumulative Grand Total 1,904,176 822,073 2,726,249 100.00 -
1 EU2 1,187,580 650,703 1,838,283 67.43 67.43 2 Sudan 425,553 2,020 427,573 15.68 83.11 3 USA 16,972 79,164 96,136 3.53 86.64 4 India 54,630 18,558 73,188 2.68 89.32 5 Ecuador 57,600 7,029 64,629 2.37 91.69 6 Switzerland 30,718 11,092 41,810 1.53 93.23 7 Russia 28,909 5,192 34,101 1.25 94.48 8 South Africa 14,971 3,320 18,291 0.67 95.15 9 Vietnam 17,632 342 17,974 0.66 95.81
11 Morocco 12,910 4,842 17,752 0.65 96.46 12 Kenya 14,884 2,380 17,264 0.63 97.09 13 Tunisia - 14,607 14,607 0.54 97.63 14 Israel 10,720 861 11,581 0.42 98.05 15 Egypt 4,643 4,330 8,973 0.33 98.38 16 China 5,405 2,740 8,145 0.30 98.68 17 Japan 5,479 1,580 7,059 0.26 98.94 18 Algeria 5,894 - 5,894 0.22 99.16 19 Middle East 4,618 640 5,258 0.19 99.35 20 Australia 1.280 3,840 5,120 0.19 99.54 21 Canada 2,265 2,265 0.08 99.62 22 Taiwan 1,240 960 2200 0.08 99.70 23 New Zealand 1,710 1,710 0.06 99.76 24 Singapore 1,220 320 1,540 0.06 99.82 25 Georgia 1,018 288 1,306 0.05 99.87 26 South Korea 1,280 1,280 0.05 99.92 27 Norway 1,050 1,050 0.04 99.95 28 Mexico 960 960 0.04 99.99 29 Sri lanka 300 300 0.01 100.00
Chart 4 illustrates destinations of Uganda Coffee by Continent in percentages. The dominance of Europe as a major destination is underpinned.
2 Members of EU countries include: Austria, Belgium, Bulgaria, Cyprus, Czech Republic, Denmark, Estonia, Finland, France, Germany, Greece, Hungary, Ireland, Italy, Latvia, Lithuania, Luxembourg, Malta, Poland, Portugal, Romania, Slovakia, Slovenia, Spain, Sweden, The Netherlands and United Kingdom
1.4.7 Global Outlook According to International Coffee Organization (ICO), the total volume of exports in coffee year 2011/12 was a record 109.4 million bags, an increase of 4.5% compared to the previous year 2010/11. The estimated value however was US $ 21.6 billion, 8.3% lower than US$23.6 billion for a total volume of 104.7 million bags in 2010/11.
Global production for 2012/13 is estimated at 145 million bags compared to 134.4 million bags in 2011/12, a 7.9% increase due to the heavy investment in Brazil where production up to an estimated 50.3 million bags in spite of an off-year biennial crop. In addition, Vietnam is expected to produce 26 million bags. This is coupled with favourable weather in some producing countries especially Colombia and Peru. This may negatively impact the global Arabica market.
African production dropped by 8.7% from 16.2 million bags in 2010/11 to 14.8 million bags in 2011/12 and its share dropped by 1.2 percentage points from 12.2% to 11% in 2011/12. The drop was on account of low production in major origins, Ethiopia and Uganda. Cote d‟Ivoire‟s production is on the increase reaching 2 million bags in 2011/12.
Global opening stocks for 2012/13 were estimated at 15.1 million bags compared to 18.2 million bags in 2010/11 in producing countries and 19.9 million bags in importing countries, a drop of 17.1% from the previous year.

12 UCDA Annual Report 2011/12
Making Uganda a Dinstinguished Producer of High Value Coffee
13UCDA Annual Report 2011/12
Making Uganda a Dinstinguished Producer of High Value Coffee
Chapter Two
QUALITY AND REGULATORY SERVICES
2.0 Introduction
In execution of its mandate, UCDA implemented programs of quality improvement and assurance, training and skills development, generic promotion, promotion of domestic coffee consumption and value addition.
In quality improvement program, industrial players at post harvest level were trained on best handling and manufacturing practices, machine maintenance and best hygiene practices. Evaluation of the coffees in the field reflected good out-turn for both Arabica and Robusta though the moisture content was generally above the 14% reflecting further need to intensify sensitization on proper drying techniques.
In quality assurance, a slight drop in clean cups was registered reflecting a decline in handling practices along the value chain. All Organic coffee recorded the best cup largely attributed to establishment and strict observance of the certification process prescribing ethical, health and environmental standards. UCDA reviewed Robusta coffee protocols/standards in a bid to differentiate and sell Uganda coffee in the specialty/fine markets.
Training programs were undertaken in: Basic Quality Control, Barista training, training of coffee roasters and brewers, training of trainers in Robusta-R and Arabica–Q graders, farmers` training in GHPs, and certification of Robusta and Arabica graders. UCDA participated in local trade fairs and exhibitions to showcase Uganda coffee, and supported formation of university coffee clubs to promote coffee consumption among the youth. Uganda Coffee was promoted on the global market through participation in international trade fairs, exhibitions and through support to promotional centres in China and Egypt.
2.1 Quality Improvement
2.1.1 Sensitization programmes of farmers, store operators and primary processors on Best Handling Practices (BHPs) were conducted. 398 farmers, factory operators and local leaders were trained on basic quality control techniques.
2.1.2 300 dry mill operators compared to 102 in 2010/11 were given technical support on machine maintenance, waste disposal, setting of hulleries and catadors. Best practices in hygiene were emphasized and improved disposal of husks was observed.
2.1.3 The moisture content (MC) and out-turn (OT) ranged from 13.2-15.2% and 40-60% respectively for Robusta. This was a slight improvement compared to 2010-11 which had OT ranging from 45-56%. Field samples for Washed Arabica had MC and OT
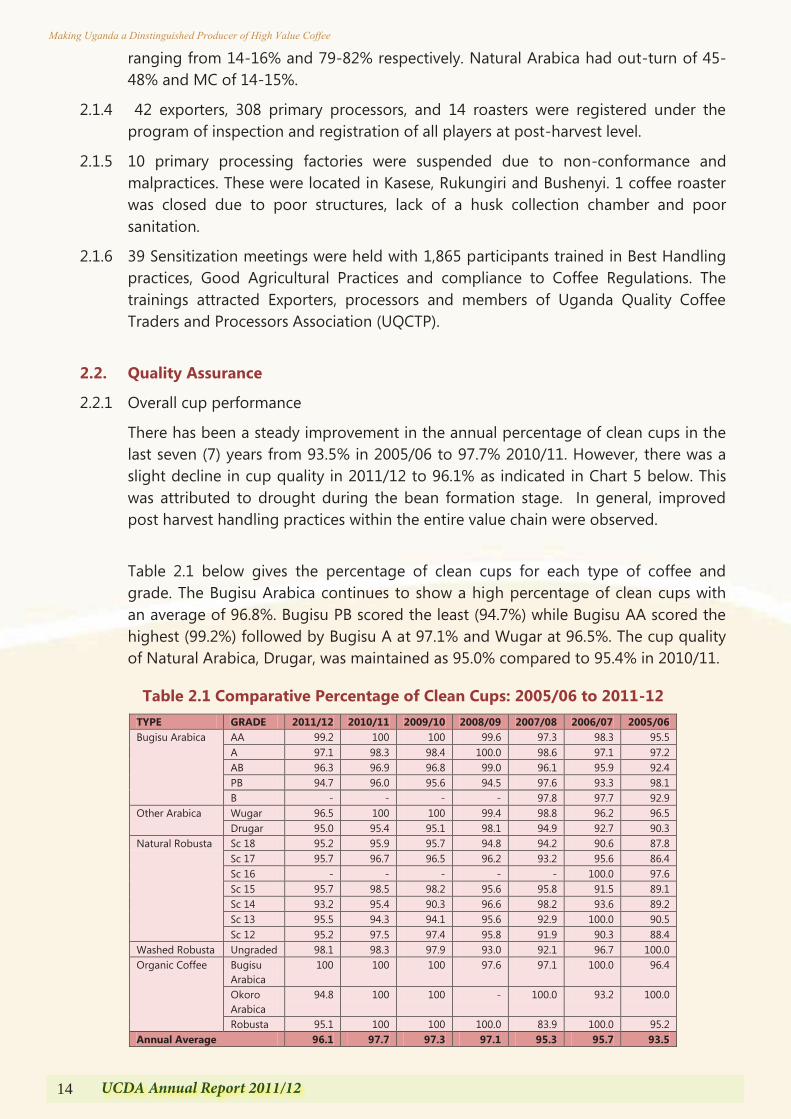
14 UCDA Annual Report 2011/12
Making Uganda a Dinstinguished Producer of High Value Coffee
ranging from 14-16% and 79-82% respectively. Natural Arabica had out-turn of 45-48% and MC of 14-15%.
2.1.4 42 exporters, 308 primary processors, and 14 roasters were registered under the program of inspection and registration of all players at post-harvest level.
2.1.5 10 primary processing factories were suspended due to non-conformance and malpractices. These were located in Kasese, Rukungiri and Bushenyi. 1 coffee roaster was closed due to poor structures, lack of a husk collection chamber and poor sanitation.
2.1.6 39 Sensitization meetings were held with 1,865 participants trained in Best Handling practices, Good Agricultural Practices and compliance to Coffee Regulations. The trainings attracted Exporters, processors and members of Uganda Quality Coffee Traders and Processors Association (UQCTP).
2.2. Quality Assurance
2.2.1 Overall cup performance
There has been a steady improvement in the annual percentage of clean cups in the last seven (7) years from 93.5% in 2005/06 to 97.7% 2010/11. However, there was a slight decline in cup quality in 2011/12 to 96.1% as indicated in Chart 5 below. This was attributed to drought during the bean formation stage. In general, improved post harvest handling practices within the entire value chain were observed.
Table 2.1 below gives the percentage of clean cups for each type of coffee and grade. The Bugisu Arabica continues to show a high percentage of clean cups with an average of 96.8%. Bugisu PB scored the least (94.7%) while Bugisu AA scored the highest (99.2%) followed by Bugisu A at 97.1% and Wugar at 96.5%. The cup quality of Natural Arabica, Drugar, was maintained as 95.0% compared to 95.4% in 2010/11.
Table 2.1 Comparative Percentage of Clean Cups: 2005/06 to 2011-12 TYPE GRADE 2011/12 2010/11 2009/10 2008/09 2007/08 2006/07 2005/06 Bugisu Arabica AA 99.2 100 100 99.6 97.3 98.3 95.5
A 97.1 98.3 98.4 100.0 98.6 97.1 97.2 AB 96.3 96.9 96.8 99.0 96.1 95.9 92.4 PB 94.7 96.0 95.6 94.5 97.6 93.3 98.1 B - - - - 97.8 97.7 92.9
Other Arabica Wugar 96.5 100 100 99.4 98.8 96.2 96.5 Drugar 95.0 95.4 95.1 98.1 94.9 92.7 90.3
Natural Robusta Sc 18 95.2 95.9 95.7 94.8 94.2 90.6 87.8 Sc 17 95.7 96.7 96.5 96.2 93.2 95.6 86.4 Sc 16 - - - - - 100.0 97.6 Sc 15 95.7 98.5 98.2 95.6 95.8 91.5 89.1 Sc 14 93.2 95.4 90.3 96.6 98.2 93.6 89.2 Sc 13 95.5 94.3 94.1 95.6 92.9 100.0 90.5 Sc 12 95.2 97.5 97.4 95.8 91.9 90.3 88.4
Washed Robusta Ungraded 98.1 98.3 97.9 93.0 92.1 96.7 100.0 Organic Coffee Bugisu
Arabica 100 100 100 97.6 97.1 100.0 96.4
Okoro Arabica
94.8 100 100 - 100.0 93.2 100.0
Robusta 95.1 100 100 100.0 83.9 100.0 95.2 Annual Average 96.1 97.7 97.3 97.1 95.3 95.7 93.5
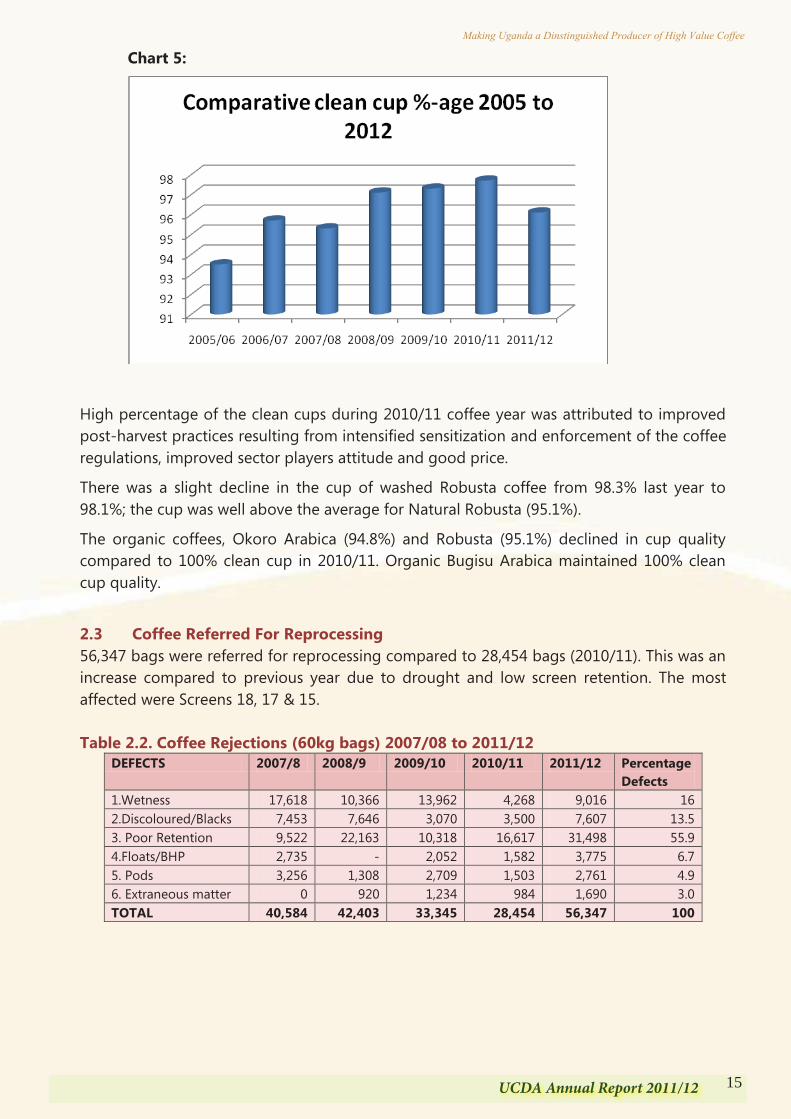
15UCDA Annual Report 2011/12
Making Uganda a Dinstinguished Producer of High Value Coffee
ranging from 14-16% and 79-82% respectively. Natural Arabica had out-turn of 45-48% and MC of 14-15%.
2.1.4 42 exporters, 308 primary processors, and 14 roasters were registered under the program of inspection and registration of all players at post-harvest level.
2.1.5 10 primary processing factories were suspended due to non-conformance and malpractices. These were located in Kasese, Rukungiri and Bushenyi. 1 coffee roaster was closed due to poor structures, lack of a husk collection chamber and poor sanitation.
2.1.6 39 Sensitization meetings were held with 1,865 participants trained in Best Handling practices, Good Agricultural Practices and compliance to Coffee Regulations. The trainings attracted Exporters, processors and members of Uganda Quality Coffee Traders and Processors Association (UQCTP).
2.2. Quality Assurance
2.2.1 Overall cup performance
There has been a steady improvement in the annual percentage of clean cups in the last seven (7) years from 93.5% in 2005/06 to 97.7% 2010/11. However, there was a slight decline in cup quality in 2011/12 to 96.1% as indicated in Chart 5 below. This was attributed to drought during the bean formation stage. In general, improved post harvest handling practices within the entire value chain were observed.
Table 2.1 below gives the percentage of clean cups for each type of coffee and grade. The Bugisu Arabica continues to show a high percentage of clean cups with an average of 96.8%. Bugisu PB scored the least (94.7%) while Bugisu AA scored the highest (99.2%) followed by Bugisu A at 97.1% and Wugar at 96.5%. The cup quality of Natural Arabica, Drugar, was maintained as 95.0% compared to 95.4% in 2010/11.
Table 2.1 Comparative Percentage of Clean Cups: 2005/06 to 2011-12 TYPE GRADE 2011/12 2010/11 2009/10 2008/09 2007/08 2006/07 2005/06 Bugisu Arabica AA 99.2 100 100 99.6 97.3 98.3 95.5
A 97.1 98.3 98.4 100.0 98.6 97.1 97.2 AB 96.3 96.9 96.8 99.0 96.1 95.9 92.4 PB 94.7 96.0 95.6 94.5 97.6 93.3 98.1 B - - - - 97.8 97.7 92.9
Other Arabica Wugar 96.5 100 100 99.4 98.8 96.2 96.5 Drugar 95.0 95.4 95.1 98.1 94.9 92.7 90.3
Natural Robusta Sc 18 95.2 95.9 95.7 94.8 94.2 90.6 87.8 Sc 17 95.7 96.7 96.5 96.2 93.2 95.6 86.4 Sc 16 - - - - - 100.0 97.6 Sc 15 95.7 98.5 98.2 95.6 95.8 91.5 89.1 Sc 14 93.2 95.4 90.3 96.6 98.2 93.6 89.2 Sc 13 95.5 94.3 94.1 95.6 92.9 100.0 90.5 Sc 12 95.2 97.5 97.4 95.8 91.9 90.3 88.4
Washed Robusta Ungraded 98.1 98.3 97.9 93.0 92.1 96.7 100.0 Organic Coffee Bugisu
Arabica 100 100 100 97.6 97.1 100.0 96.4
Okoro Arabica
94.8 100 100 - 100.0 93.2 100.0
Robusta 95.1 100 100 100.0 83.9 100.0 95.2 Annual Average 96.1 97.7 97.3 97.1 95.3 95.7 93.5
Chart 5:
High percentage of the clean cups during 2010/11 coffee year was attributed to improved post-harvest practices resulting from intensified sensitization and enforcement of the coffee regulations, improved sector players attitude and good price.
There was a slight decline in the cup of washed Robusta coffee from 98.3% last year to 98.1%; the cup was well above the average for Natural Robusta (95.1%).
The organic coffees, Okoro Arabica (94.8%) and Robusta (95.1%) declined in cup quality compared to 100% clean cup in 2010/11. Organic Bugisu Arabica maintained 100% clean cup quality.
2.3 Coffee Referred For Reprocessing 56,347 bags were referred for reprocessing compared to 28,454 bags (2010/11). This was an increase compared to previous year due to drought and low screen retention. The most affected were Screens 18, 17 & 15. Table 2.2. Coffee Rejections (60kg bags) 2007/08 to 2011/12
DEFECTS 2007/8 2008/9 2009/10 2010/11 2011/12 Percentage Defects
1.Wetness 17,618 10,366 13,962 4,268 9,016 16 2.Discoloured/Blacks 7,453 7,646 3,070 3,500 7,607 13.5 3. Poor Retention 9,522 22,163 10,318 16,617 31,498 55.9 4.Floats/BHP 2,735 - 2,052 1,582 3,775 6.7 5. Pods 3,256 1,308 2,709 1,503 2,761 4.9 6. Extraneous matter 0 920 1,234 984 1,690 3.0 TOTAL 40,584 42,403 33,345 28,454 56,347 100
16 UCDA Annual Report 2011/12
Making Uganda a Dinstinguished Producer of High Value Coffee
2.4 Training programmes
35 participants of the Basic Quality Control Course (BCQC) consisting of 20 from the coffee industry and 15 from tertiary institutions of learning were trained in Basic Quality Control that covered defects‟ identification, moisture determination, roasting profiles and techniques, flavor profiles, and liquoring.
A total of 53 Baristas were trained (20 University coffee club members, 23 new and 10 practicing Baristas) in preparation for the 5th Uganda National Barista Championship (UNBC). Inter University Barista championship was conducted at Kyambogo University with the 20 participants from four Universities (Uganda Christian University, Makerere University, Kyambogo University and Kampala International University). The top six were selected to participate in the 5th UNBC that was held at Imperial Royal Hotel, Kampala in November 2011. Mr. Jay Caragay an international trainer conducted the training and headed a team of 14 judges at the competition. The winner and the runners up were Mr. Roberts Mbabazi from Barista PRO and Mr. Ochen Simon of Igongo Cultural Centre respectively. The Uganda Barista champion also won the Africa Barista Championship in Addis Ababa, and emerged the 47th at the World Barista Championship. In an effort to promote coffee drinking culture among the youth, an essay competition under the theme “The Role of the youth in the Coffee Value Chain” was conducted attracting 16 participants from University Coffee Clubs. UCDA participated in two university bazaars at Makerere University (MUK) and Kyambogo University and inducted new coffee club members. UCDA was recognised as the National Barista body representing World Barista Championships (WBC). Among the judges at the WBC in Vienna, Austria and Africa Barista Championships in Addis Ababa, Ethiopia, was a Ugandan. The Q & R-Grading Certification trainings attracted 30 participants out of which, 10 were certified as Star cuppers. A Robusta assistant instructors‟ certification course was held and 10 participants were certified as R-Assistant Instructors. 30 roasters & brewers were trained in basics of roasting, cupping and blending with an aim of improving coffee quality on the market. An improved Nguvu coffee brand was introduced on the market. Two new brands namely: Nile Coffee and Star Gold were also introduced on the market. One Quality Controller was trained in Food Safety and Management Systems. Two officers attended a consultative workshop on the formation of standardization, metrology, conformity assessment and accreditation organized by Ministry of Trade Industry and Cooperatives.
17UCDA Annual Report 2011/12
Making Uganda a Dinstinguished Producer of High Value Coffee
2.4 Training programmes
35 participants of the Basic Quality Control Course (BCQC) consisting of 20 from the coffee industry and 15 from tertiary institutions of learning were trained in Basic Quality Control that covered defects‟ identification, moisture determination, roasting profiles and techniques, flavor profiles, and liquoring.
A total of 53 Baristas were trained (20 University coffee club members, 23 new and 10 practicing Baristas) in preparation for the 5th Uganda National Barista Championship (UNBC). Inter University Barista championship was conducted at Kyambogo University with the 20 participants from four Universities (Uganda Christian University, Makerere University, Kyambogo University and Kampala International University). The top six were selected to participate in the 5th UNBC that was held at Imperial Royal Hotel, Kampala in November 2011. Mr. Jay Caragay an international trainer conducted the training and headed a team of 14 judges at the competition. The winner and the runners up were Mr. Roberts Mbabazi from Barista PRO and Mr. Ochen Simon of Igongo Cultural Centre respectively. The Uganda Barista champion also won the Africa Barista Championship in Addis Ababa, and emerged the 47th at the World Barista Championship. In an effort to promote coffee drinking culture among the youth, an essay competition under the theme “The Role of the youth in the Coffee Value Chain” was conducted attracting 16 participants from University Coffee Clubs. UCDA participated in two university bazaars at Makerere University (MUK) and Kyambogo University and inducted new coffee club members. UCDA was recognised as the National Barista body representing World Barista Championships (WBC). Among the judges at the WBC in Vienna, Austria and Africa Barista Championships in Addis Ababa, Ethiopia, was a Ugandan. The Q & R-Grading Certification trainings attracted 30 participants out of which, 10 were certified as Star cuppers. A Robusta assistant instructors‟ certification course was held and 10 participants were certified as R-Assistant Instructors. 30 roasters & brewers were trained in basics of roasting, cupping and blending with an aim of improving coffee quality on the market. An improved Nguvu coffee brand was introduced on the market. Two new brands namely: Nile Coffee and Star Gold were also introduced on the market. One Quality Controller was trained in Food Safety and Management Systems. Two officers attended a consultative workshop on the formation of standardization, metrology, conformity assessment and accreditation organized by Ministry of Trade Industry and Cooperatives.
2.5. Generic promotion, Value addition and Promotion of Domestic coffee consumption
2.5.1. Promotion of Domestic Coffee Consumption Ugandan Coffee was showcased in local trade fairs at; World Food Day in Arua, monthly corporate league events, UMA international and regional exhibitions, Buganda Farmers‟ exhibition, Jinja Agricultural Trade show and regional coffee shows under the Coffee Production Campaign. In these local exhibitions, UCDA supported local roasters with exhibition space for display of their finished products.
11 cafes were opened; 10 in Kampala Metropolitan and 1 in Masaka town reflecting an increased investment in coffee consumption ventures.
Coffee was promoted through “Raise training program” which trained teachers around Kampala. Teachers were sensitized to carry the message of the benefits of coffee consumption to the youth.
Coffee was also promoted under the theme “Coffee on The Road“in Masaka, Mbarara, Fort Portal, Gulu, and Jinja. 2.5.2 Participation in International Trade Fairs & Exhibitions UCDA showcased Uganda coffee in international fairs at; the Specialty Coffee Association of America (SCAA) exposition in Oregon-USA, Specialty Coffee Association of Japan (SCAJ), Canton Import & Export Trade Fair, Guangzhou International Food Festival, Guangzhou Coffee Expo (China), Coffee Expo 2012 (Korea), International Food Le Café exhibition (Cairo, Egypt), UNAA in Philadelphia, and the African Fine Coffees Conference and Exhibition in Addis Ababa, Ethiopia. At the SCAA conference in Oregon, UCDA hosted Kabum Specialty Coffee and Crop to Cup, Ugandan coffee buyers in USA in a bid to promote Uganda Coffee. In 2011/12 Uganda exported 96,136 bags to USA compared to 95,168 bags exported in CY 2010/11. The exports to China, Russia and Far East were 51,426 bags. The exports to the Arab world were 480,057bags realizing a market share of 17.61% of total exports. These volumes of exports were a result of promotions carried out in these markets. 2.6.3 Joint Ventures The Joint Ventures in China and Egypt were supported in terms of technical assistance and promotional activities. China: UCDA participated in Xiamen Hong Kong coffee Expo and Canton Commodity Exhibition and conferences. A promotion centre was opened in Guangdong province.
18 UCDA Annual Report 2011/12
Making Uganda a Dinstinguished Producer of High Value Coffee
The joint venture launched a 3-in-1 Mountain Gorilla coffee brand in China and at the Coffee Expo in South Korea. The new brand is expected to increase the market share of Uganda coffee in China. Egypt: UCDA participated in the international Food and Le Café Exhibition in Cairo where 300 small packets of coffee and 3,281 brochures were given out. In an effort to increase awareness of Uganda coffee in Egypt, promotional visits were made to hypermarkets, Supermarkets, Coffee shops, hotels, cafes and coffee importers. 2.6.4 Development of protocols for the Fine Robusta Coffees for the specialty market UCDA partnered with USAID-LEAD Project (LEAD- Livelihood and Enterprises for Agricultural Development) and developed Robusta grading standards. R & Q standards were developed, 800 copies printed and disseminated to stakeholders.
19UCDA Annual Report 2011/12
Making Uganda a Dinstinguished Producer of High Value Coffee
The joint venture launched a 3-in-1 Mountain Gorilla coffee brand in China and at the Coffee Expo in South Korea. The new brand is expected to increase the market share of Uganda coffee in China. Egypt: UCDA participated in the international Food and Le Café Exhibition in Cairo where 300 small packets of coffee and 3,281 brochures were given out. In an effort to increase awareness of Uganda coffee in Egypt, promotional visits were made to hypermarkets, Supermarkets, Coffee shops, hotels, cafes and coffee importers. 2.6.4 Development of protocols for the Fine Robusta Coffees for the specialty market UCDA partnered with USAID-LEAD Project (LEAD- Livelihood and Enterprises for Agricultural Development) and developed Robusta grading standards. R & Q standards were developed, 800 copies printed and disseminated to stakeholders.
Chapter Three
COFFEE PRODUCTION PROGRAMMES
3.0 Introduction
The Coffee Production Campaign initiatives and successes so far attained continue to be consolidated in the UCDA programmes, and are tailored at achieving the production target of 4.5 million bags by 2018.
These programmes are aimed at improving productivity and production through;
Promoting generation and production of clean planting material through seed sourcing, tissue culture, and support to Clonal propagation of the Coffee Wilt Resistant lines for mass multiplication and distribution to farmers.
Promotion of coffee replanting by supporting community based and private commercial nurseries; and direct provision of seedlings to various farmer groups and special interest groups.
Coffee Rehabilitation by supporting specific lead farmers with demonstrations at various community locations to improve yield of the old coffee trees.
Support to Coffee production in new areas especially Northern Uganda by integration of commercial coffee and banana production into the farming system.
Promotion of Sustainable Coffee Production Initiatives such as Organic, Utz, 4Cs, Fair Trade and Rainforest Alliance so as to increase the unit value of coffee at farm - gate level.
Continued deliberate support and strengthening of Coffee Research by provision of financial, technical and material support.
Promotion of collaborative participatory coffee Extension with other stakeholders.
Promotion of technical extension services in an effort to improve quality at post- harvest and ensure enforcement of the coffee regulations.
Strengthening the functions and visibility of the Regional offices so as to provide better service to the coffee stakeholders.
Coordination and implementation of key activities under the coffee production campaign together with other stakeholders.
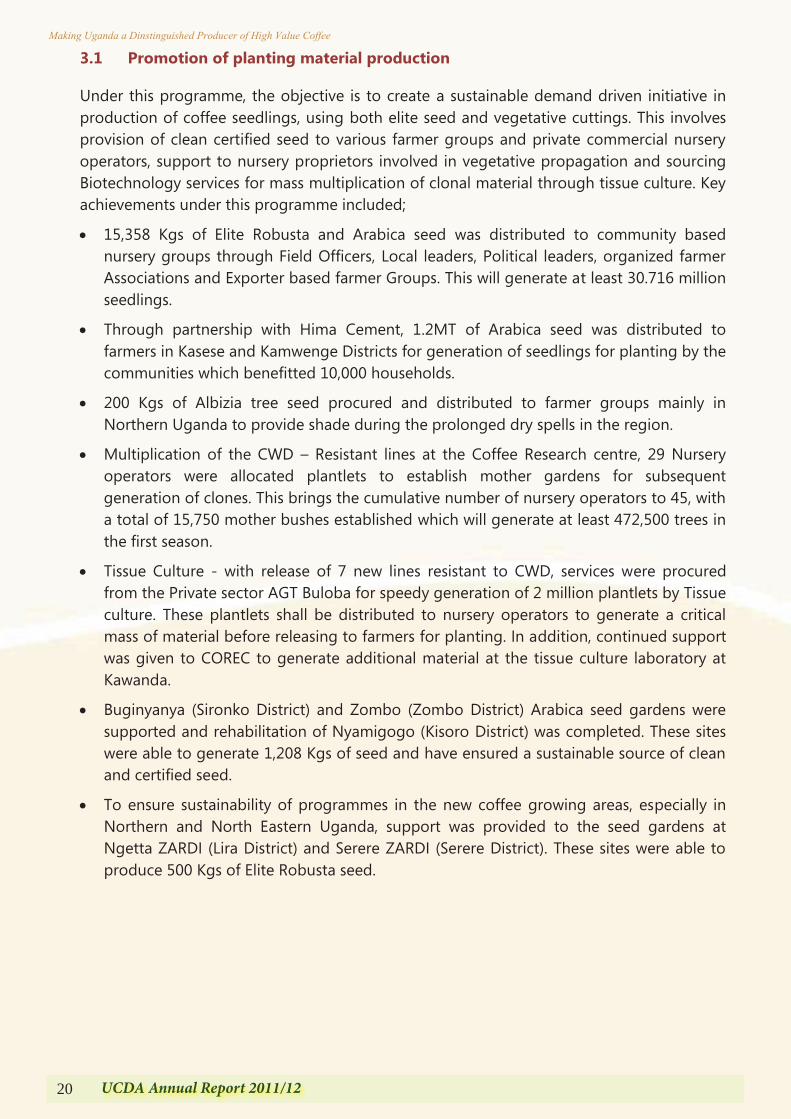
20 UCDA Annual Report 2011/12
Making Uganda a Dinstinguished Producer of High Value Coffee
3.1 Promotion of planting material production
Under this programme, the objective is to create a sustainable demand driven initiative in production of coffee seedlings, using both elite seed and vegetative cuttings. This involves provision of clean certified seed to various farmer groups and private commercial nursery operators, support to nursery proprietors involved in vegetative propagation and sourcing Biotechnology services for mass multiplication of clonal material through tissue culture. Key achievements under this programme included;
15,358 Kgs of Elite Robusta and Arabica seed was distributed to community based nursery groups through Field Officers, Local leaders, Political leaders, organized farmer Associations and Exporter based farmer Groups. This will generate at least 30.716 million seedlings.
Through partnership with Hima Cement, 1.2MT of Arabica seed was distributed to farmers in Kasese and Kamwenge Districts for generation of seedlings for planting by the communities which benefitted 10,000 households.
200 Kgs of Albizia tree seed procured and distributed to farmer groups mainly in Northern Uganda to provide shade during the prolonged dry spells in the region.
Multiplication of the CWD – Resistant lines at the Coffee Research centre, 29 Nursery operators were allocated plantlets to establish mother gardens for subsequent generation of clones. This brings the cumulative number of nursery operators to 45, with a total of 15,750 mother bushes established which will generate at least 472,500 trees in the first season.
Tissue Culture - with release of 7 new lines resistant to CWD, services were procured from the Private sector AGT Buloba for speedy generation of 2 million plantlets by Tissue culture. These plantlets shall be distributed to nursery operators to generate a critical mass of material before releasing to farmers for planting. In addition, continued support was given to COREC to generate additional material at the tissue culture laboratory at Kawanda.
Buginyanya (Sironko District) and Zombo (Zombo District) Arabica seed gardens were supported and rehabilitation of Nyamigogo (Kisoro District) was completed. These sites were able to generate 1,208 Kgs of seed and have ensured a sustainable source of clean and certified seed.
To ensure sustainability of programmes in the new coffee growing areas, especially in Northern and North Eastern Uganda, support was provided to the seed gardens at Ngetta ZARDI (Lira District) and Serere ZARDI (Serere District). These sites were able to produce 500 Kgs of Elite Robusta seed.
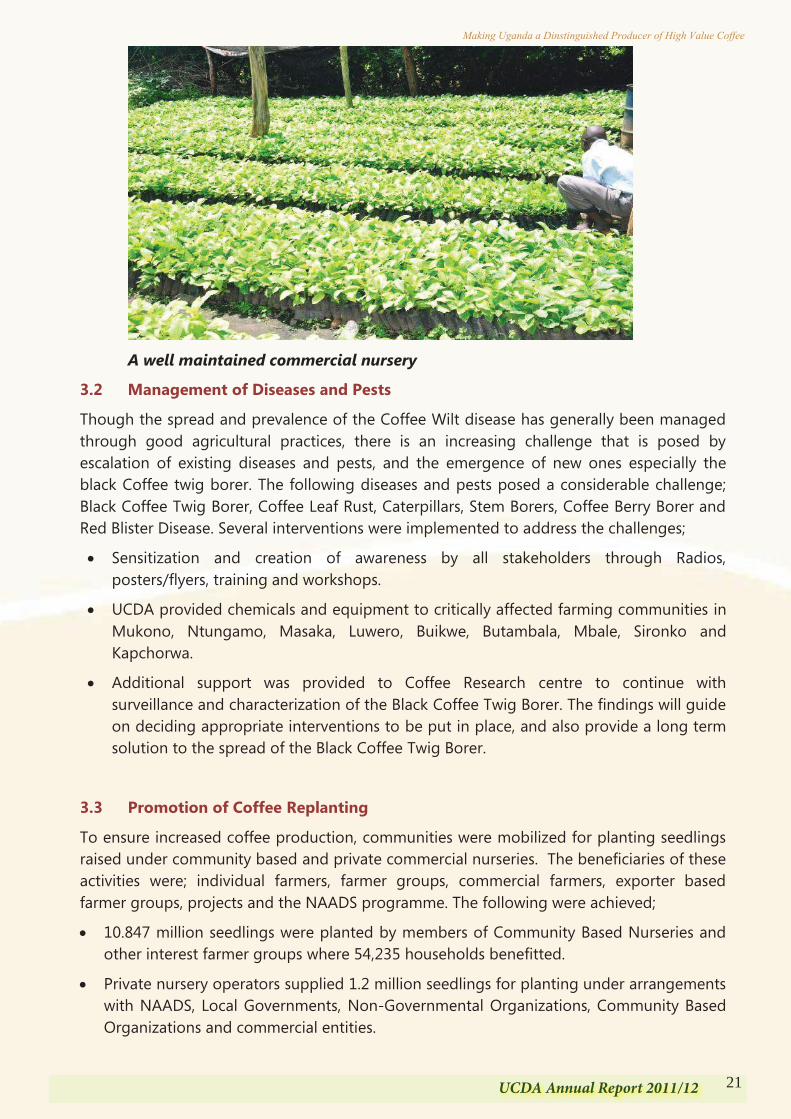
21UCDA Annual Report 2011/12
Making Uganda a Dinstinguished Producer of High Value Coffee
3.1 Promotion of planting material production
Under this programme, the objective is to create a sustainable demand driven initiative in production of coffee seedlings, using both elite seed and vegetative cuttings. This involves provision of clean certified seed to various farmer groups and private commercial nursery operators, support to nursery proprietors involved in vegetative propagation and sourcing Biotechnology services for mass multiplication of clonal material through tissue culture. Key achievements under this programme included;
15,358 Kgs of Elite Robusta and Arabica seed was distributed to community based nursery groups through Field Officers, Local leaders, Political leaders, organized farmer Associations and Exporter based farmer Groups. This will generate at least 30.716 million seedlings.
Through partnership with Hima Cement, 1.2MT of Arabica seed was distributed to farmers in Kasese and Kamwenge Districts for generation of seedlings for planting by the communities which benefitted 10,000 households.
200 Kgs of Albizia tree seed procured and distributed to farmer groups mainly in Northern Uganda to provide shade during the prolonged dry spells in the region.
Multiplication of the CWD – Resistant lines at the Coffee Research centre, 29 Nursery operators were allocated plantlets to establish mother gardens for subsequent generation of clones. This brings the cumulative number of nursery operators to 45, with a total of 15,750 mother bushes established which will generate at least 472,500 trees in the first season.
Tissue Culture - with release of 7 new lines resistant to CWD, services were procured from the Private sector AGT Buloba for speedy generation of 2 million plantlets by Tissue culture. These plantlets shall be distributed to nursery operators to generate a critical mass of material before releasing to farmers for planting. In addition, continued support was given to COREC to generate additional material at the tissue culture laboratory at Kawanda.
Buginyanya (Sironko District) and Zombo (Zombo District) Arabica seed gardens were supported and rehabilitation of Nyamigogo (Kisoro District) was completed. These sites were able to generate 1,208 Kgs of seed and have ensured a sustainable source of clean and certified seed.
To ensure sustainability of programmes in the new coffee growing areas, especially in Northern and North Eastern Uganda, support was provided to the seed gardens at Ngetta ZARDI (Lira District) and Serere ZARDI (Serere District). These sites were able to produce 500 Kgs of Elite Robusta seed.
A well maintained commercial nursery
3.2 Management of Diseases and Pests
Though the spread and prevalence of the Coffee Wilt disease has generally been managed through good agricultural practices, there is an increasing challenge that is posed by escalation of existing diseases and pests, and the emergence of new ones especially the black Coffee twig borer. The following diseases and pests posed a considerable challenge; Black Coffee Twig Borer, Coffee Leaf Rust, Caterpillars, Stem Borers, Coffee Berry Borer and Red Blister Disease. Several interventions were implemented to address the challenges;
Sensitization and creation of awareness by all stakeholders through Radios, posters/flyers, training and workshops.
UCDA provided chemicals and equipment to critically affected farming communities in Mukono, Ntungamo, Masaka, Luwero, Buikwe, Butambala, Mbale, Sironko and Kapchorwa.
Additional support was provided to Coffee Research centre to continue with surveillance and characterization of the Black Coffee Twig Borer. The findings will guide on deciding appropriate interventions to be put in place, and also provide a long term solution to the spread of the Black Coffee Twig Borer.
3.3 Promotion of Coffee Replanting
To ensure increased coffee production, communities were mobilized for planting seedlings raised under community based and private commercial nurseries. The beneficiaries of these activities were; individual farmers, farmer groups, commercial farmers, exporter based farmer groups, projects and the NAADS programme. The following were achieved;
10.847 million seedlings were planted by members of Community Based Nurseries and other interest farmer groups where 54,235 households benefitted.
Private nursery operators supplied 1.2 million seedlings for planting under arrangements with NAADS, Local Governments, Non-Governmental Organizations, Community Based Organizations and commercial entities.
22 UCDA Annual Report 2011/12
Making Uganda a Dinstinguished Producer of High Value Coffee
UCDA, in a special intervention, sourced plantlets for organized farmer groups, women groups and Youth. A total of 4.8 million seedlings were planted by 24,000 households.
Under the Public Private Partnership, 300,000 seedlings were distributed under the UCDA/HIMA/KASESE District Local Government initiative. Uganda Coffee Farmers Alliance was supported with 170,000 seedlings for member groups. In addition, the Neumann Stiftung project in Masaka was given 70,000 seedlings.
3.4 Coffee Rehabilitation
In a bid to improve the yield per tree from at least 0.5 kg to 1.0 kg of clean coffee, a number of initiatives were implemented.
19 sets of pruning kits were allocated for community pruning. Support was given in form of fuel and servicing of power saws. A total of 802 acres were stumped. Yield increases registered from 600 – 1000 Kilograms per acre of Parchment in Mt. Elgon Region; 400 – 1800 Kilograms per hectare of FAQ by farmers in Mityana (UCFA), and 300 – 1500 per hectare of FAQ by farmers in Masaka.
Farmer competitions were held in 25 districts involving 50 farmers per district. The Competitions were an initiative to speed up and encourage farmers to rehabilitate their coffee and were based on adoption and implementation of Good Agricultural practices. The best 10 performing farmers per district were rewarded with various items (hand pulpers, tarpaulins, drying trays, solar panels). These farmers were able to Register on average 50% increase in Yields.
70 farms were supported to act as demonstrations on sustainable soil management practices and establishment of tree nurseries to address the challenges posed by occurrence of landslides (Mt. Elgon, Rwenzori). Farmers use these sites as learning centers for adaptation to challenges related to climate.
3.5 Support to Coffee Development in Northern Uganda
A programme for promoting commercial coffee production in the nontraditional coffee areas was undertaken. These areas amongst others include; Mid-Northern Uganda districts of Apac, Kole, Gulu, Kitgum, Lira, Pader, Oyam, Amolatar, Dokolo, Nwoya, Alebtong, Lamwo and Amuru.
The major goal is to create wealth and improve the welfare of the people in the non-traditional coffee growing areas through sustainable income and to ensure food security. It is also envisaged that such an approach would provide a fallback position for coffee amidst Coffee Wilt disease attacks in traditional coffee areas.
The following were achieved;
3 sensitization workshops and seminars for local leadership and other stakeholders.
Two groups of farmers (29 and 32) were taken on field tour to other areas within Northern Uganda and West Nile. The objective was to create more effective awareness and knowledge in coffee value chain activities amongst their counter- parts within the same region.

23UCDA Annual Report 2011/12
Making Uganda a Dinstinguished Producer of High Value Coffee
UCDA, in a special intervention, sourced plantlets for organized farmer groups, women groups and Youth. A total of 4.8 million seedlings were planted by 24,000 households.
Under the Public Private Partnership, 300,000 seedlings were distributed under the UCDA/HIMA/KASESE District Local Government initiative. Uganda Coffee Farmers Alliance was supported with 170,000 seedlings for member groups. In addition, the Neumann Stiftung project in Masaka was given 70,000 seedlings.
3.4 Coffee Rehabilitation
In a bid to improve the yield per tree from at least 0.5 kg to 1.0 kg of clean coffee, a number of initiatives were implemented.
19 sets of pruning kits were allocated for community pruning. Support was given in form of fuel and servicing of power saws. A total of 802 acres were stumped. Yield increases registered from 600 – 1000 Kilograms per acre of Parchment in Mt. Elgon Region; 400 – 1800 Kilograms per hectare of FAQ by farmers in Mityana (UCFA), and 300 – 1500 per hectare of FAQ by farmers in Masaka.
Farmer competitions were held in 25 districts involving 50 farmers per district. The Competitions were an initiative to speed up and encourage farmers to rehabilitate their coffee and were based on adoption and implementation of Good Agricultural practices. The best 10 performing farmers per district were rewarded with various items (hand pulpers, tarpaulins, drying trays, solar panels). These farmers were able to Register on average 50% increase in Yields.
70 farms were supported to act as demonstrations on sustainable soil management practices and establishment of tree nurseries to address the challenges posed by occurrence of landslides (Mt. Elgon, Rwenzori). Farmers use these sites as learning centers for adaptation to challenges related to climate.
3.5 Support to Coffee Development in Northern Uganda
A programme for promoting commercial coffee production in the nontraditional coffee areas was undertaken. These areas amongst others include; Mid-Northern Uganda districts of Apac, Kole, Gulu, Kitgum, Lira, Pader, Oyam, Amolatar, Dokolo, Nwoya, Alebtong, Lamwo and Amuru.
The major goal is to create wealth and improve the welfare of the people in the non-traditional coffee growing areas through sustainable income and to ensure food security. It is also envisaged that such an approach would provide a fallback position for coffee amidst Coffee Wilt disease attacks in traditional coffee areas.
The following were achieved;
3 sensitization workshops and seminars for local leadership and other stakeholders.
Two groups of farmers (29 and 32) were taken on field tour to other areas within Northern Uganda and West Nile. The objective was to create more effective awareness and knowledge in coffee value chain activities amongst their counter- parts within the same region.
12 radio sessions of 30 minutes each were aired on radios in the region. The messages address all activities along the coffee value chain.
13 farmer groups and 1 association were formed. 6 – one day workshops were organized to improve farmer group knowledge in managing groups and associations.
150 community, based nurseries were formed with a capacity of 20,000 seedlings each. Out of these 56 nurseries have turned private. There has been an improvement of the seedlings‟ survival rates from 80% to 85%.
1.746 million seedlings were raised by the Community Based Nurseries out of which 1.27 million coffee seedlings and 0.302 million shade trees were planted benefitting 3,175 Households. In addition, 0.29 million coffee seedlings were directly procured and distributed to various farmer groups, benefitting 975 households. 17,600 seedlings were planted by Lututur Prison Farm and farmers neighboring the Farm.
44 Farmer Field School (FFS) sessions were facilitated attracting 636 participants.
1 seed garden (Ngetta ZARDI) was given financial support. In addition, 6 private seed suppliers were supported with seed processing equipment to create a sustainable source of elite seed for the region from within.
20 technology development sites were established to act as training and demonstration sites on new technologies. These sites are also used as multiplication fields for banana suckers distributed to farmers for intercropping with coffee. 8,019 banana suckers were distributed benefiting 154 households. This together with cover crops provides early incomes to coffee farmers besides catering for food security.
2 workshops were conducted on processing and market development. 16 coffee drying trays, 200 tarpaulins were distributed to 40 farmer groups as a drive to improve quality at post harvest.
118.61MT of Kiboko was sold by farmers (Acholi 35.1MT; Lango 83.514 MT at an average price of shs 2000/Kg.
1 characterization survey was carried out. Field Data on crop Morphology collected in collaboration with COREC. Preliminary findings revealed that average yields of coffee in Mid North stands at 0.9, 0.8, 1.5 and 1.6 kilograms per tree of FAQ for Gulu, Oyam, Lira and Apac districts respectively.
3.6 Promotion of Sustainable Coffee Initiatives (Organic, Utz, 4C, Fair Trade, Rainforest Alliance)
As part of the strategy to improve value addition at farm level and support penetration to niche and specialty markets, support is given to farmer groups and organizations that are promoting sustainable coffee.
The following was achieved under this initiative; Farmers practicing Rainforest Alliance were registered. 40 Rainforest Alliance farmer
fields were mapped out in Zombo and Kapchorwa. This was done in collaboration with stakeholders sponsoring the programme. To-date 45,032 farmers registered under various sustainable programmes. Under this initiative, 49,000 bags of Coffee were exported.

24 UCDA Annual Report 2011/12
Making Uganda a Dinstinguished Producer of High Value Coffee
15 Farmer groups trained as follows; Kasese (6), Kisoro (1), Nebbi/Zombo (5), Sironko (1), Kapchorwa (1) and Kween (1). The training covered all aspects in sustainable coffee production systems.
Translation of Brochures on Management of Pests and Disease under Organic Production system into local languages (Luganda, Runyakitara) was done and 2,000 Brochures printed.
The Memorandum of Understanding with the University of Florida was renewed for 5 years. This will allow further collaboration in soil analysis and other aspects on procedures under the National Organic Program of (USA) that allows export of organic coffee into the US market.
UCDA supported NIHACOFA (West Nile) for Fair Trade Certification and also provided a Wet mill in an effort to improve post-harvest quality.
3.7 Farmer Training and Extension Liaison
In collaboration with other stakeholders (NAADS, Local Governments, Projects, CSOs), farmer training was carried out to improve knowledge and skills.
5 inter regional field trips were undertaken by farmers to learn and appreciate the practices of their colleagues in other regions. This helps in knowledge sharing and transfer, as better practices are identified and adopted.
10 Coffee shows were held in 10 districts to showcase better practices along the Coffee value chain and to create interaction between farmers and other stakeholders, especially input suppliers. It was done in collaboration with other stakeholders under the coffee production campaign.
382 Seminars were carried out attracting 30,560 participants from coffee growing districts to address aspects of coffee production, quality improvement and enforcement of coffee regulations.
60 programmes were aired on Radios in 5 Regions. Farmers were sensitized on various issues along the Coffee value chain with respect to farm activities and any emerging issues such as disease and pest out- breaks.
Farmers and processors were sensitized on quality at post-harvest level through district coffee platforms. UCDA spearheaded all activities of the National Steering Committee of the coffee production campaign including the deliberations of the Annual stakeholders‟ Meeting.
As part of the effort to create operational efficiency and take services nearer to the farmers, support was provided to Officers in the Regional Offices to offer diligent services to all stakeholders, Government agencies and local governments in addressing interventions within the coffee value chain.
3.8 Provision of Technical Extension Services and Quality Enhancement
As part of the Quality improvement drive, programmes were put in place to ensure that quality aspects are upheld at post – harvest level, in addition to enforcement of the Coffee Regulations. The following were achieved;
596 Buying stores registered

25UCDA Annual Report 2011/12
Making Uganda a Dinstinguished Producer of High Value Coffee
15 Farmer groups trained as follows; Kasese (6), Kisoro (1), Nebbi/Zombo (5), Sironko (1), Kapchorwa (1) and Kween (1). The training covered all aspects in sustainable coffee production systems.
Translation of Brochures on Management of Pests and Disease under Organic Production system into local languages (Luganda, Runyakitara) was done and 2,000 Brochures printed.
The Memorandum of Understanding with the University of Florida was renewed for 5 years. This will allow further collaboration in soil analysis and other aspects on procedures under the National Organic Program of (USA) that allows export of organic coffee into the US market.
UCDA supported NIHACOFA (West Nile) for Fair Trade Certification and also provided a Wet mill in an effort to improve post-harvest quality.
3.7 Farmer Training and Extension Liaison
In collaboration with other stakeholders (NAADS, Local Governments, Projects, CSOs), farmer training was carried out to improve knowledge and skills.
5 inter regional field trips were undertaken by farmers to learn and appreciate the practices of their colleagues in other regions. This helps in knowledge sharing and transfer, as better practices are identified and adopted.
10 Coffee shows were held in 10 districts to showcase better practices along the Coffee value chain and to create interaction between farmers and other stakeholders, especially input suppliers. It was done in collaboration with other stakeholders under the coffee production campaign.
382 Seminars were carried out attracting 30,560 participants from coffee growing districts to address aspects of coffee production, quality improvement and enforcement of coffee regulations.
60 programmes were aired on Radios in 5 Regions. Farmers were sensitized on various issues along the Coffee value chain with respect to farm activities and any emerging issues such as disease and pest out- breaks.
Farmers and processors were sensitized on quality at post-harvest level through district coffee platforms. UCDA spearheaded all activities of the National Steering Committee of the coffee production campaign including the deliberations of the Annual stakeholders‟ Meeting.
As part of the effort to create operational efficiency and take services nearer to the farmers, support was provided to Officers in the Regional Offices to offer diligent services to all stakeholders, Government agencies and local governments in addressing interventions within the coffee value chain.
3.8 Provision of Technical Extension Services and Quality Enhancement
As part of the Quality improvement drive, programmes were put in place to ensure that quality aspects are upheld at post – harvest level, in addition to enforcement of the Coffee Regulations. The following were achieved;
596 Buying stores registered
308 Primary Processing factories were Licensed 30 Export Grading factories were registered 21 Workshops were held for traders, processors and buyers attracting 314
participants. Regional Task forces were formed for Central, Eastern, South – Western and Northern
Regions. The task forces carried out spot inspection of Stores and factories to ensure adherence to the Coffee Regulations.
3 multi-stakeholder task forces were instituted in Eastern, South – Western and Central Regions. These task forces enforced adherence to Coffee Regulations in addition to sensitization of industrial players.

26 UCDA Annual Report 2011/12
Making Uganda a Dinstinguished Producer of High Value Coffee
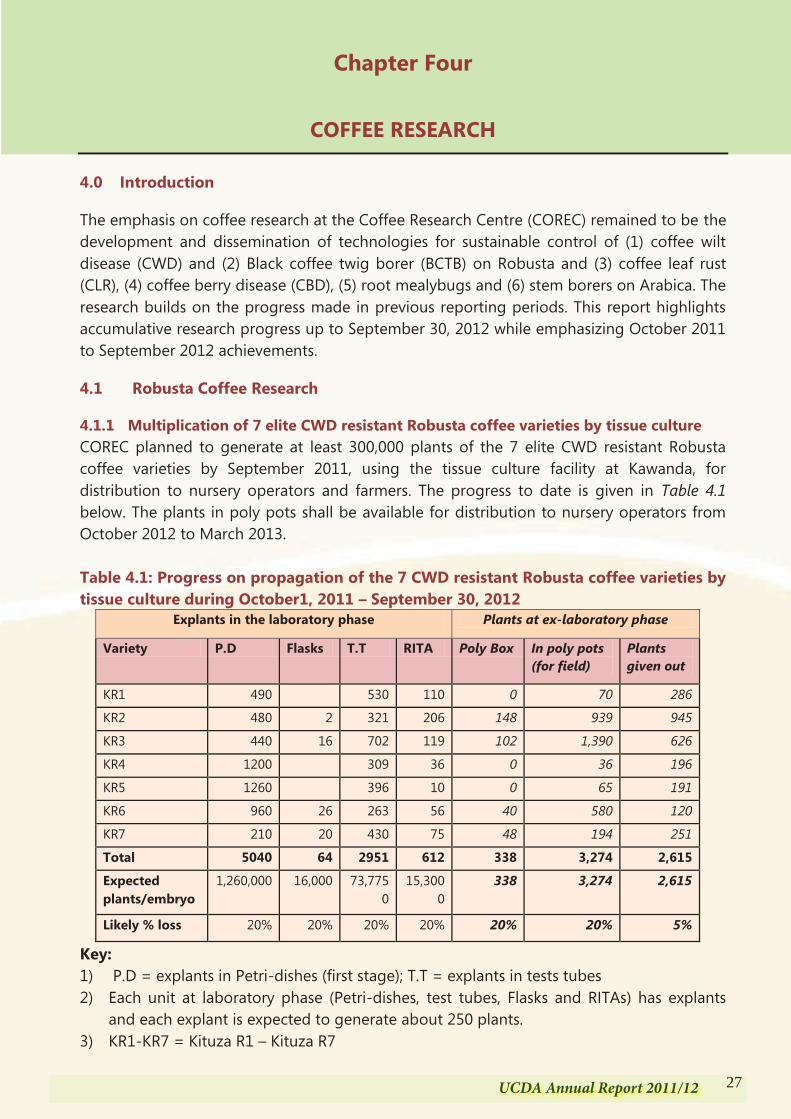
27UCDA Annual Report 2011/12
Making Uganda a Dinstinguished Producer of High Value Coffee
Chapter Four
COFFEE RESEARCH
4.0 Introduction
The emphasis on coffee research at the Coffee Research Centre (COREC) remained to be the development and dissemination of technologies for sustainable control of (1) coffee wilt disease (CWD) and (2) Black coffee twig borer (BCTB) on Robusta and (3) coffee leaf rust (CLR), (4) coffee berry disease (CBD), (5) root mealybugs and (6) stem borers on Arabica. The research builds on the progress made in previous reporting periods. This report highlights accumulative research progress up to September 30, 2012 while emphasizing October 2011 to September 2012 achievements.
4.1 Robusta Coffee Research
4.1.1 Multiplication of 7 elite CWD resistant Robusta coffee varieties by tissue culture COREC planned to generate at least 300,000 plants of the 7 elite CWD resistant Robusta coffee varieties by September 2011, using the tissue culture facility at Kawanda, for distribution to nursery operators and farmers. The progress to date is given in Table 4.1 below. The plants in poly pots shall be available for distribution to nursery operators from October 2012 to March 2013. Table 4.1: Progress on propagation of the 7 CWD resistant Robusta coffee varieties by tissue culture during October1, 2011 – September 30, 2012
Explants in the laboratory phase Plants at ex-laboratory phase
Variety P.D Flasks T.T RITA Poly Box In poly pots (for field)
Plants given out
KR1 490 530 110 0 70 286
KR2 480 2 321 206 148 939 945
KR3 440 16 702 119 102 1,390 626
KR4 1200 309 36 0 36 196
KR5 1260 396 10 0 65 191
KR6 960 26 263 56 40 580 120
KR7 210 20 430 75 48 194 251
Total 5040 64 2951 612 338 3,274 2,615
Expected plants/embryo
1,260,000 16,000 73,7750
15,3000
338 3,274 2,615
Likely % loss 20% 20% 20% 20% 20% 20% 5%
Key: 1) P.D = explants in Petri-dishes (first stage); T.T = explants in tests tubes 2) Each unit at laboratory phase (Petri-dishes, test tubes, Flasks and RITAs) has explants
and each explant is expected to generate about 250 plants. 3) KR1-KR7 = Kituza R1 – Kituza R7
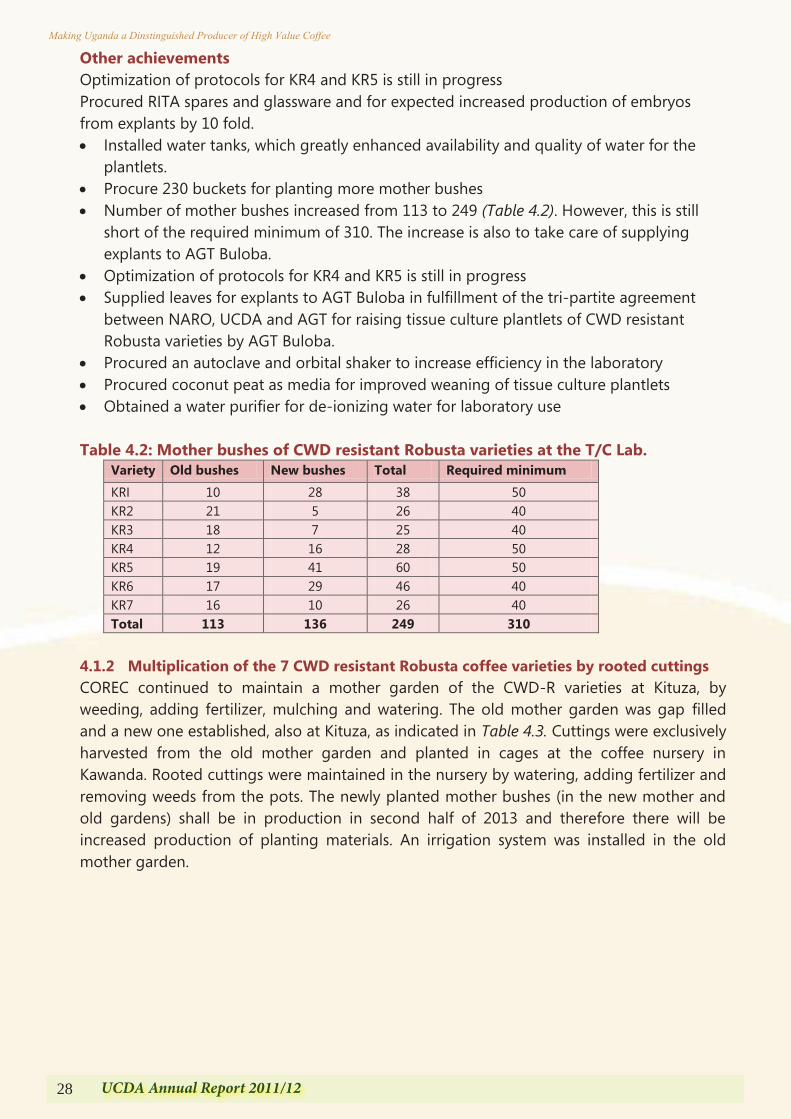
28 UCDA Annual Report 2011/12
Making Uganda a Dinstinguished Producer of High Value Coffee
Other achievements Optimization of protocols for KR4 and KR5 is still in progress Procured RITA spares and glassware and for expected increased production of embryos from explants by 10 fold. Installed water tanks, which greatly enhanced availability and quality of water for the
plantlets. Procure 230 buckets for planting more mother bushes Number of mother bushes increased from 113 to 249 (Table 4.2). However, this is still
short of the required minimum of 310. The increase is also to take care of supplying explants to AGT Buloba.
Optimization of protocols for KR4 and KR5 is still in progress Supplied leaves for explants to AGT Buloba in fulfillment of the tri-partite agreement
between NARO, UCDA and AGT for raising tissue culture plantlets of CWD resistant Robusta varieties by AGT Buloba.
Procured an autoclave and orbital shaker to increase efficiency in the laboratory Procured coconut peat as media for improved weaning of tissue culture plantlets Obtained a water purifier for de-ionizing water for laboratory use
Table 4.2: Mother bushes of CWD resistant Robusta varieties at the T/C Lab.
Variety Old bushes New bushes Total Required minimum KRI 10 28 38 50 KR2 21 5 26 40 KR3 18 7 25 40 KR4 12 16 28 50 KR5 19 41 60 50 KR6 17 29 46 40 KR7 16 10 26 40 Total 113 136 249 310
4.1.2 Multiplication of the 7 CWD resistant Robusta coffee varieties by rooted cuttings COREC continued to maintain a mother garden of the CWD-R varieties at Kituza, by weeding, adding fertilizer, mulching and watering. The old mother garden was gap filled and a new one established, also at Kituza, as indicated in Table 4.3. Cuttings were exclusively harvested from the old mother garden and planted in cages at the coffee nursery in Kawanda. Rooted cuttings were maintained in the nursery by watering, adding fertilizer and removing weeds from the pots. The newly planted mother bushes (in the new mother and old gardens) shall be in production in second half of 2013 and therefore there will be increased production of planting materials. An irrigation system was installed in the old mother garden.

29UCDA Annual Report 2011/12
Making Uganda a Dinstinguished Producer of High Value Coffee
Other achievements Optimization of protocols for KR4 and KR5 is still in progress Procured RITA spares and glassware and for expected increased production of embryos from explants by 10 fold. Installed water tanks, which greatly enhanced availability and quality of water for the
plantlets. Procure 230 buckets for planting more mother bushes Number of mother bushes increased from 113 to 249 (Table 4.2). However, this is still
short of the required minimum of 310. The increase is also to take care of supplying explants to AGT Buloba.
Optimization of protocols for KR4 and KR5 is still in progress Supplied leaves for explants to AGT Buloba in fulfillment of the tri-partite agreement
between NARO, UCDA and AGT for raising tissue culture plantlets of CWD resistant Robusta varieties by AGT Buloba.
Procured an autoclave and orbital shaker to increase efficiency in the laboratory Procured coconut peat as media for improved weaning of tissue culture plantlets Obtained a water purifier for de-ionizing water for laboratory use
Table 4.2: Mother bushes of CWD resistant Robusta varieties at the T/C Lab.
Variety Old bushes New bushes Total Required minimum KRI 10 28 38 50 KR2 21 5 26 40 KR3 18 7 25 40 KR4 12 16 28 50 KR5 19 41 60 50 KR6 17 29 46 40 KR7 16 10 26 40 Total 113 136 249 310
4.1.2 Multiplication of the 7 CWD resistant Robusta coffee varieties by rooted cuttings COREC continued to maintain a mother garden of the CWD-R varieties at Kituza, by weeding, adding fertilizer, mulching and watering. The old mother garden was gap filled and a new one established, also at Kituza, as indicated in Table 4.3. Cuttings were exclusively harvested from the old mother garden and planted in cages at the coffee nursery in Kawanda. Rooted cuttings were maintained in the nursery by watering, adding fertilizer and removing weeds from the pots. The newly planted mother bushes (in the new mother and old gardens) shall be in production in second half of 2013 and therefore there will be increased production of planting materials. An irrigation system was installed in the old mother garden.
Table 4.3: Progress on Propagation of CWD-resistant Robusta coffee varieties by rooted cuttings
Variety Old mother garden
Gap filing old mother garden
New mother garden
Cuttings under cages
Given Available Rooted cuttings
KR1 89 3 60 1,590 820 0 KR2 61 31 80 959 477 136 KR3 94 3 100 1,965 663 1,192 KR4 10 5 15 273 264 0 KR5 63 28 60 2,019 1,114 0 KR6 95 0 100 2,651 1,444 1,040 KR7 44 54 60 1,003 867 0 Total 456 124 475 10,460 5,649 2,368
Note The 2,368 available rooted cuttings will be distributed to nursery operators for planting
between October 2012 - May 2013 period. It is anticipated that about 7,000 rooted cuttings will be available from the plants under
cages for giving out to nursery operators within March-May 2013 Another set of cuttings will be planted under cages in November 2012 and plants from
this set will be ready for giving out in the September-November, 2013 period.
4.1.3 Dissemination of planting materials of the CWD resistant Robusta coffee varieties COREC in conjunction with UCDA, have been giving out planting materials of the 7 CWD resistant varieties to nursery operators with effect from 2009/10, for planting mother gardens in preparation for further propagation and dissemination of the varieties to farmers. In the period October 2011 to September 2012, 4,983 plants, comprising of 2,615 plants from tissue culture and 2,368 rooted cuttings, were given out to 24 coffee nursery operators to establish new coffee mother gardens/nurseries and also to 19 that had nurseries in the period ending September 2011 (Table 4.4) for gap filling. This is less than the 50 new nurseries we had projected for the period. However 4,992 plants (2624 of tissue culture and 2368 rooted cuttings) are available at COREC-Kawanda nursery for setting up more mother gardens, but majority (97%) of them are of 3 varieties (KRI 2, KR3 and KR6), which respond well to both propagation methods. It is still difficult to balance production of plants between the varieties but new permutation will be worked out, perhaps issuing plants in unequal numbers between varieties, to enable utilization of the remaining plants. Scientists from COREC and UCDA also made follow up visits to the nurseries to ascertain status of the planted mother gardens and bushes, assess needs at each of the nurseries and provide on spot advice for improving management of the mother gardens.

30 UCDA Annual Report 2011/12
Making Uganda a Dinstinguished Producer of High Value Coffee
4.1.4 On-farm validation of CWD resistant elite varieties In 2008, trials comprising of 25 promising Robusta coffee CWD resistant lines, among them the 7 varieties which were released for cultivation in 2009, were planted in 4 on-farm multi-location trials in Mityana, Mukono and Ibanda districts. The purpose of these trials was to determine the yield, quality and resistance to major coffee diseases of the test lines under different agro-ecologies of the Robusta coffee growing areas within Uganda. The study also aimed at comparing the on-farm performance with that of on-station at Kituza and involving farmers in choosing varieties, which would create a preamble for early and quick adoption of varieties that would be released. The results of these studies would then form a basis for full release of the best varieties to the farming communities. Scientists continued to collect pest, disease and other morphological data to build on data collected in previous periods, for characterizing all the 25 CWD lines. Some of the attributes assessed are plant height, plant diameter, tree girth, length of primary branches, length of internodes of primary branches, length of stem internodes, number of berries per node, shape and size of berries. Analysis of the data on these parameters is on-going. From the observations, CWD pathogen has not developed on any of the CWD resistant varieties planted in the trials. Still insignificant incidence of CLR disease was observed on other lines included in these trials but not on the 7 released varieties. Red blister disease has not been observed on any of the varieties at all sites. Trials of 10 newly selected lines were planted in Kayanga and Nakaseke districts, for multi-location evaluation. 4.1.5 Up scaling of elite CWD resistant Robusta Coffee varieties COREC continued to screen more of the 1,500 CWD resistant Robusta coffee genotypes/individuals which were identified at the time of artificial inoculations and planted in on-station trials at Kituza, for agronomic and commercial qualities upon which better lines/varieties would be selected. These would supplement the current 7 CWD-R commercial varieties selected during the first batch of assessments carried out on 200 genotypes. Another 10 lines were selected from this batch and they are being cloned for multi-location trials. Assessment of another batch of 351 CWD resistant genotypes continued in the on-station field trials at Kituza. The attributes considered in this evaluation are yields, incidence and severity of attack by major insect pests and diseases (to determine the variety resistance levels), tolerance to drought, cup and physical bean qualities. Analysis of the data collected is still in progress. Planting materials generated from the 10 lines that were selected in the previous period were maintained in the nursery and they will be planted in on-farm trials in the first rains of 2012. Another batch of planting materials from these lines are being raised under cages at Kituza. 4.1.6 Generation and evaluation of progenies of CWD-R x CWD-S parents for yield, disease resistance, quality. COREC maintained a trial at Kituza of 183 specific hybrid progenies using the good agricultural practices for Robusta coffee. Collected data on, diseases, yield and growth, which
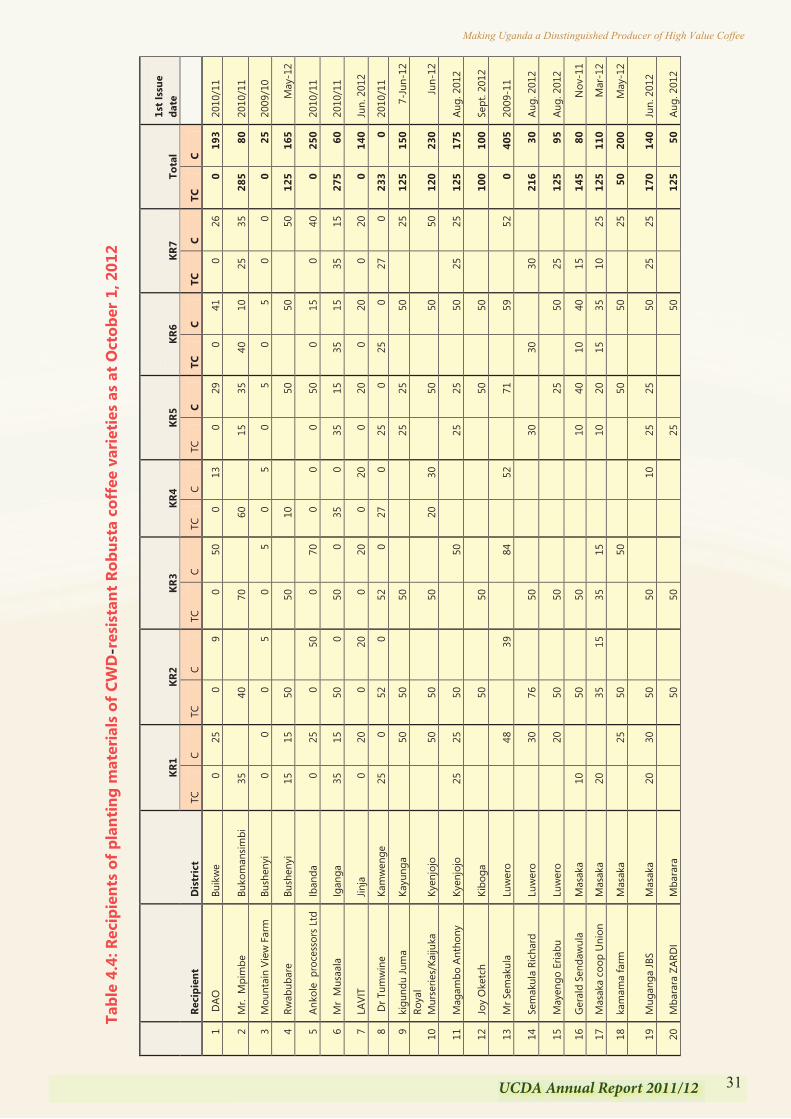
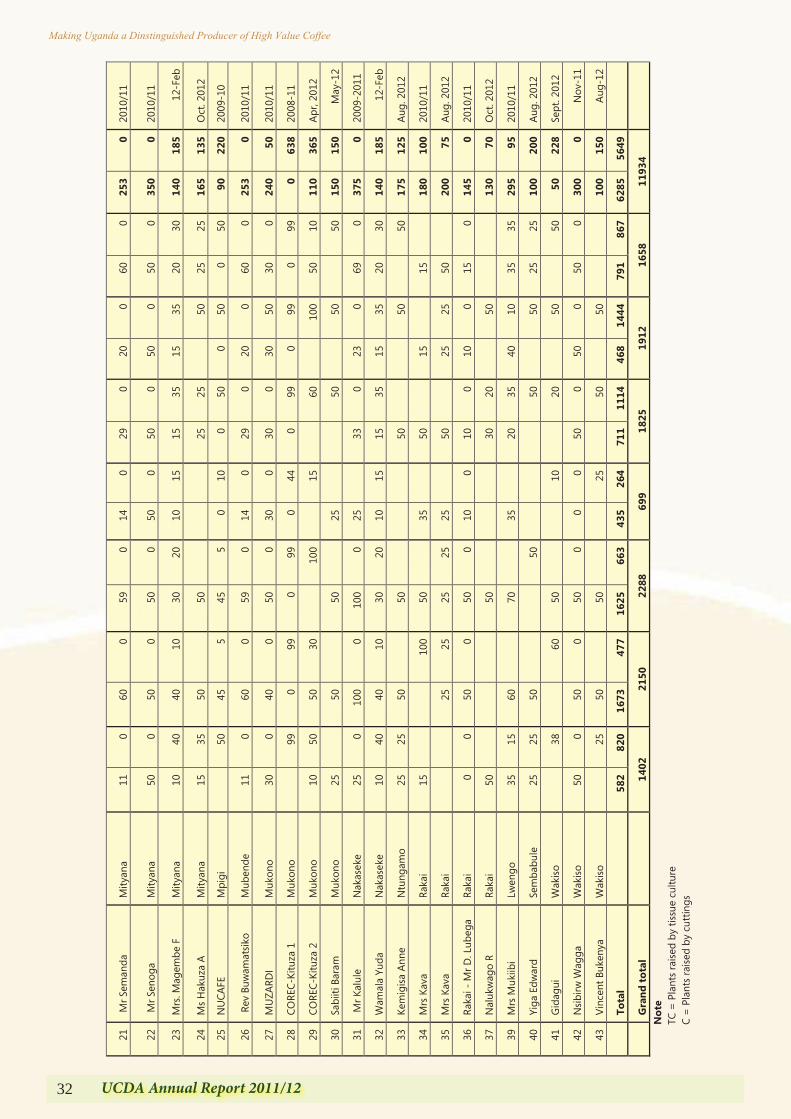
32 UCDA Annual Report 2011/12
Making Uganda a Dinstinguished Producer of High Value Coffee
21
Mr S
eman
da
Mity
ana
11
0 60
0
59
0 14
0
29
0 20
0
60
0 25
3 0
2010
/11
22
Mr S
enog
a M
ityan
a 50
0
50
0 50
0
50
0 50
0
50
0 50
0
350
0 20
10/1
1
23
Mrs
. Mag
embe
F
Mity
ana
10
40
40
10
30
20
10
15
15
35
15
35
20
30
140
185
12-F
eb
24
Ms
Hak
uza
A M
ityan
a 15
35
50
50
25
25
50
25
25
165
135
Oct
. 201
2
25
NU
CAFE
M
pigi
50
45
5 45
5
0 10
0
50
0 50
0
50
90
220
2009
-10
26
Rev
Buw
amat
siko
Mub
ende
11
0
60
0 59
0
14
0 29
0
20
0 60
0
253
0 20
10/1
1
27
MU
ZARD
I M
ukon
o 30
0
40
0 50
0
30
0 30
0
30
50
30
0 24
0 50
20
10/1
1
28
CORE
C-Ki
tuza
1
Muk
ono
99
0
99
0 99
0
44
0 99
0
99
0 99
0
638
2008
-11
29
CORE
C-Ki
tuza
2
Muk
ono
10
50
50
30
10
0
15
60
100
50
10
110
365
Apr,
2012
30
Sabi
iti B
aram
M
ukon
o 25
50
50
25
50
50
50
150
150
May
-12
31
Mr K
alul
e N
akas
eke
25
0 10
0 0
100
0 25
33
0 23
0
69
0 37
5 0
2009
-201
1
32
Wam
ala
Yuda
N
akas
eke
10
40
40
10
30
20
10
15
15
35
15
35
20
30
140
185
12-F
eb
33
Kem
igisa
Ann
e N
tung
amo
25
25
50
50
50
50
50
17
5 12
5 Au
g. 2
012
34
Mrs
Kav
a Ra
kai
15
100
50
35
50
15
15
18
0 10
0 20
10/1
1
35
Mrs
Kav
a Ra
kai
25
25
25
25
25
50
25
25
50
20
0 75
Au
g. 2
012
36
Raka
i - M
r D. L
ubeg
a Ra
kai
0 0
50
0 50
0
10
0 10
0
10
0 15
0
145
0 20
10/1
1
37
Nal
ukw
ago
R Ra
kai
50
50
30
20
50
13
0 70
O
ct. 2
012
39
Mrs
Muk
iibi
Lwen
go
35
15
60
70
35
20
35
40
10
35
35
29
5 95
20
10/1
1
40
Yiga
Edw
ard
Sem
babu
le
25
25
50
50
50
50
25
25
100
200
Aug.
201
2
41
Gid
agui
W
akiso
38
60
50
10
20
50
50
50
228
Sept
. 201
2
42
Nsib
irw W
agga
W
akiso
50
0
50
0 50
0
0 0
50
0 50
0
50
0 30
0 0
Nov
-11
43
Vinc
ent B
uken
ya
Wak
iso
25
50
50
25
50
50
100
150
Aug-
12
To
tal
58
2 82
0 16
73
477
1625
66
3 43
5 26
4 71
1 11
14
468
1444
79
1 86
7 62
85
5649
G
rand
tota
l
1402
21
50
2288
69
9 18
25
1912
16
58
1193
4
Not
e TC
= P
lant
s ra
ised
by ti
ssue
cul
ture
C
= P
lant
s ra
ised
by c
uttin
gs
33UCDA Annual Report 2011/12
Making Uganda a Dinstinguished Producer of High Value Coffee
are being processed for analysis. Green coffee bean samples were prepared from some genotypes and submitted to UCDA for cup quality analysis. 4.1.7 Harnessing biotechnology tools for scientific improvement It was anticipated that molecular and biotechnology laboratory would be established at Kituza however it was not possible due to budget limitation. It was anticipated that a Ph.D. student would be attached to characterize the CWD resistant and susceptible clones at Kituza, continue work on creating double haploid populations and identifying important molecular markers for coffee biotechnology work, but still this was not entirely covered due to a limited budget. Only a few haploids that were created in the previous reporting period were maintained in the green house at Kawanda and characterization is on-going for few genotypes (section 9 below). 4.1.8 Characterization, conservation and utilization of Robusta coffee germplasm. COREC intends to create a core collection of Robusta coffee germplasm at Kituza and a backup collection at Bulegeni, for safety by transferring germplasm from Kawanda to Kituza and Bulegeni, introducing more germplasm from the farms in different parts of the country and outside the country. The collections would be evaluated and characterized using morphological and molecular characters and the data would be used to develop a strategy for utilizing the germplasm either directly as new varieties or in breeding programmes by providing genes of complementary traits for improving other lines. During the reporting period, germplasm plots of 651 collections from farms within Uganda and 125 genotypes introduced from Ivory Coast, which were planted at Kituza in the previous reporting periods, were maintained. Data was collected from these trials on yield, response to diseases and growth parameters. Analysis of these data is on-going. Over 120 of the Kawanda collections were planted at Kituza and the plots maintained. DNA extraction for Molecular characterization of the 41 elite CWD resistant genotypes is on-going in the biotechnology laboratory at Kawanda. In Robusta, coffee exists in the wild forests of Kibale, Itwara, Zoka, Budongo and probably elsewhere. The Ugandan Robusta grows on plateaus at about 1,000m altitude while elsewhere it is commonly found in lowlands as low as sea level. Another important factor concerning Robusta coffee is that it is one of the parents of the Arabica whose origin is believed to be in Ethiopia. Uganda is then currently the closest region to the alleged center of origin of C. arabica. A mission of collecting wild Coffea canephora genotypes for molecular characterization and including in the on-station in situ collection was conducted by COREC scientists in collaboration with scientists from the Institut de Recherche pour le Développement (IRD) in France. The mission also aimed at collecting other species in the forests that would hold a clue towards evidence of natural hybridization of Robusta and Euginoides to create Arabica. COREC prospected Zoka forest in the North-North-West of the country ( 3° 57‟ N – 31° 39‟ E) and the Budongo Forest in the West (1°38/55‟ N – 31° 24/43‟ E). In both forests, there was continuous presence of Robusta either as isolated trees or in small groups of very few individuals, often seedlings were growing at the base of mature trees. Coffea euginoides, was

34 UCDA Annual Report 2011/12
Making Uganda a Dinstinguished Producer of High Value Coffee
also encountered. In total leaves from 85 genotypes of C. canephora were collected, 25 in Zoka forest and 60 in Budongo Forest. In addition 14 genotypes of the C. euginoides were also sampled, 1 in Zoka and 13 in Budongo. The leaf samples were submitted to IRD for molecular analysis. 100 seedlings, which were collected from the forest undergrowth, were planted at Kituza for inclusion in the germplasm plots in the near future. 4.1.9 Developing tools for quick diagnostic of CWD Construction of both serology and molecular diagnosis for CWD pathogen is in progress. For serology, two more proteins have been identified and being evaluated before eventual construction of ELISA test for lab based diagnosis and simple format for direct field use. For molecular diagnosis, it is more specific and reliable than serology method. RNA has been extracted and synthesized into cDNA,. The cDNA will be cloned and expressed in bacteria to enable the gene responsible for the diagnostic protein to be identified and used as a probe (Primer) for PCR based diagnosis of the pathogen. 4.1.10 Surveillance of Black Coffee Twig Borer. COREC Scientists in collaboration with various stakeholders including International Institute of Tropical Agriculture (IITA) and Uganda Coffee Development Authority (UCDA) have assessed the status of the black coffee twig borer in various districts throughout the country. An extensive survey was conducted in 25 districts in the 5 major coffee growing regions of Uganda (Figure 1.1). Preliminary results show that BCTB was present in all the 5 districts sampled in the central region including Mukono, Luwero, Mpigi, Mubende and Mityana. In addition, BCTB was observed in 50% of the districts sampled in the southwestern region including Bundibugyo, Kasese and Rubirizi (Table 4.5). However, the pest was yet to be observed in West Nile, northern and Mt. Elgon regions of the country. The prevalence, incidence and damage are shown in table 5 and fig. 1 below. In addition, BCTB has been reported and confirmed in Kayunga, Masaka, Rakai, Lwengo, Kalungu, Bukomansimbi, Sembabule, Buikwe, Nakaseke, Nakasongola, Kiboga and Wakiso districts (Central region), Kanungu, Bushenyi and Rukungiri districts (Southwestern region) and Jinja, Luuka, Kamuli and Buyende districts (Busoga region). However, a more comprehensive survey is planned for the month of November and December, 2012. This will lead to the completion of the BCTB national distribution and infestation intensity map. This will also provide necessary information to be used in demarcating the country into zones. The results of the survey shall provide the necessary ingredients that will form the development of a comprehensive research agenda that will lead to the realization of an effective, sustainable and environmentally sound Integrated Pest Management (IPM) package for long term management of BCTB in Uganda. In addition, these data sets generated from such a survey will be vital in developing and producing a countrywide distribution map. This map will divide the country into BCTB-infestation zones i.e. already infested (endemic), frontline and free/threatened (not yet infested) zones. The intervention strategies in the different zones definitely differ. In areas not yet infested, quarantine (prevention of movement of planting or fresh coffee materials from infested areas) measures may work best, in frontline zones, practices which may halt further advance of the pest will be the best and in already infested zones, Phytosanitary (pruning and
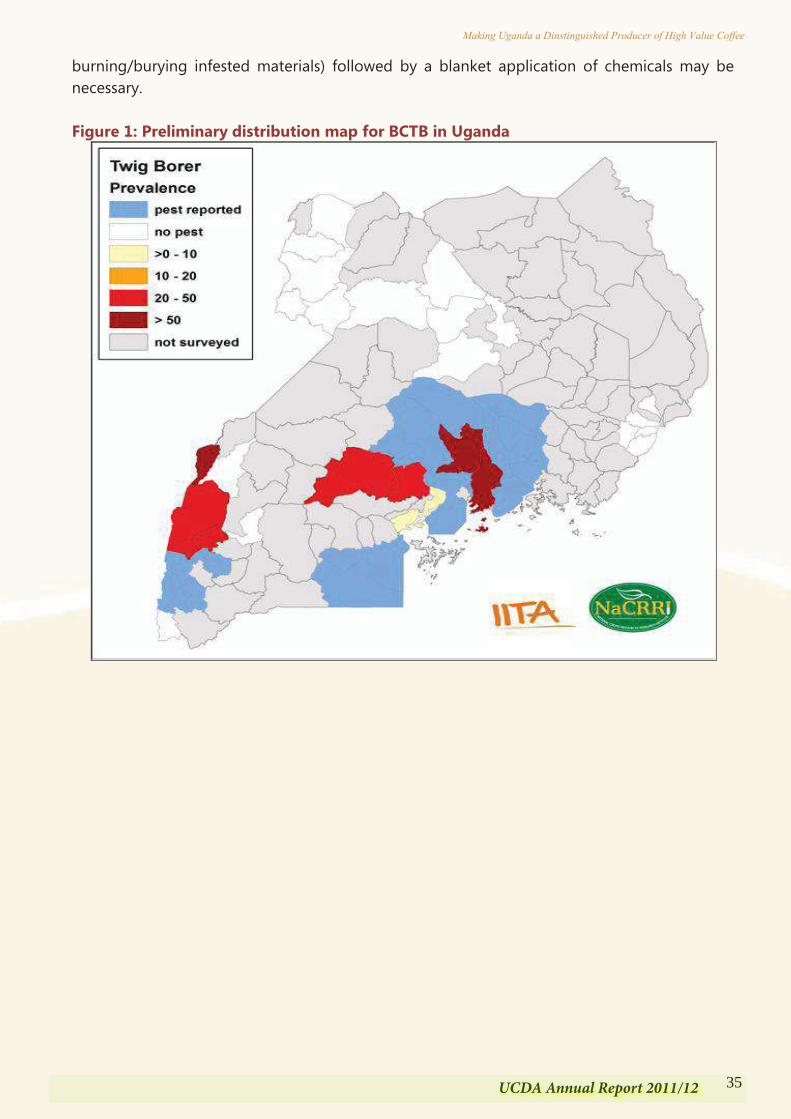
35UCDA Annual Report 2011/12
Making Uganda a Dinstinguished Producer of High Value Coffee
also encountered. In total leaves from 85 genotypes of C. canephora were collected, 25 in Zoka forest and 60 in Budongo Forest. In addition 14 genotypes of the C. euginoides were also sampled, 1 in Zoka and 13 in Budongo. The leaf samples were submitted to IRD for molecular analysis. 100 seedlings, which were collected from the forest undergrowth, were planted at Kituza for inclusion in the germplasm plots in the near future. 4.1.9 Developing tools for quick diagnostic of CWD Construction of both serology and molecular diagnosis for CWD pathogen is in progress. For serology, two more proteins have been identified and being evaluated before eventual construction of ELISA test for lab based diagnosis and simple format for direct field use. For molecular diagnosis, it is more specific and reliable than serology method. RNA has been extracted and synthesized into cDNA,. The cDNA will be cloned and expressed in bacteria to enable the gene responsible for the diagnostic protein to be identified and used as a probe (Primer) for PCR based diagnosis of the pathogen. 4.1.10 Surveillance of Black Coffee Twig Borer. COREC Scientists in collaboration with various stakeholders including International Institute of Tropical Agriculture (IITA) and Uganda Coffee Development Authority (UCDA) have assessed the status of the black coffee twig borer in various districts throughout the country. An extensive survey was conducted in 25 districts in the 5 major coffee growing regions of Uganda (Figure 1.1). Preliminary results show that BCTB was present in all the 5 districts sampled in the central region including Mukono, Luwero, Mpigi, Mubende and Mityana. In addition, BCTB was observed in 50% of the districts sampled in the southwestern region including Bundibugyo, Kasese and Rubirizi (Table 4.5). However, the pest was yet to be observed in West Nile, northern and Mt. Elgon regions of the country. The prevalence, incidence and damage are shown in table 5 and fig. 1 below. In addition, BCTB has been reported and confirmed in Kayunga, Masaka, Rakai, Lwengo, Kalungu, Bukomansimbi, Sembabule, Buikwe, Nakaseke, Nakasongola, Kiboga and Wakiso districts (Central region), Kanungu, Bushenyi and Rukungiri districts (Southwestern region) and Jinja, Luuka, Kamuli and Buyende districts (Busoga region). However, a more comprehensive survey is planned for the month of November and December, 2012. This will lead to the completion of the BCTB national distribution and infestation intensity map. This will also provide necessary information to be used in demarcating the country into zones. The results of the survey shall provide the necessary ingredients that will form the development of a comprehensive research agenda that will lead to the realization of an effective, sustainable and environmentally sound Integrated Pest Management (IPM) package for long term management of BCTB in Uganda. In addition, these data sets generated from such a survey will be vital in developing and producing a countrywide distribution map. This map will divide the country into BCTB-infestation zones i.e. already infested (endemic), frontline and free/threatened (not yet infested) zones. The intervention strategies in the different zones definitely differ. In areas not yet infested, quarantine (prevention of movement of planting or fresh coffee materials from infested areas) measures may work best, in frontline zones, practices which may halt further advance of the pest will be the best and in already infested zones, Phytosanitary (pruning and
burning/burying infested materials) followed by a blanket application of chemicals may be necessary. Figure 1: Preliminary distribution map for BCTB in Uganda
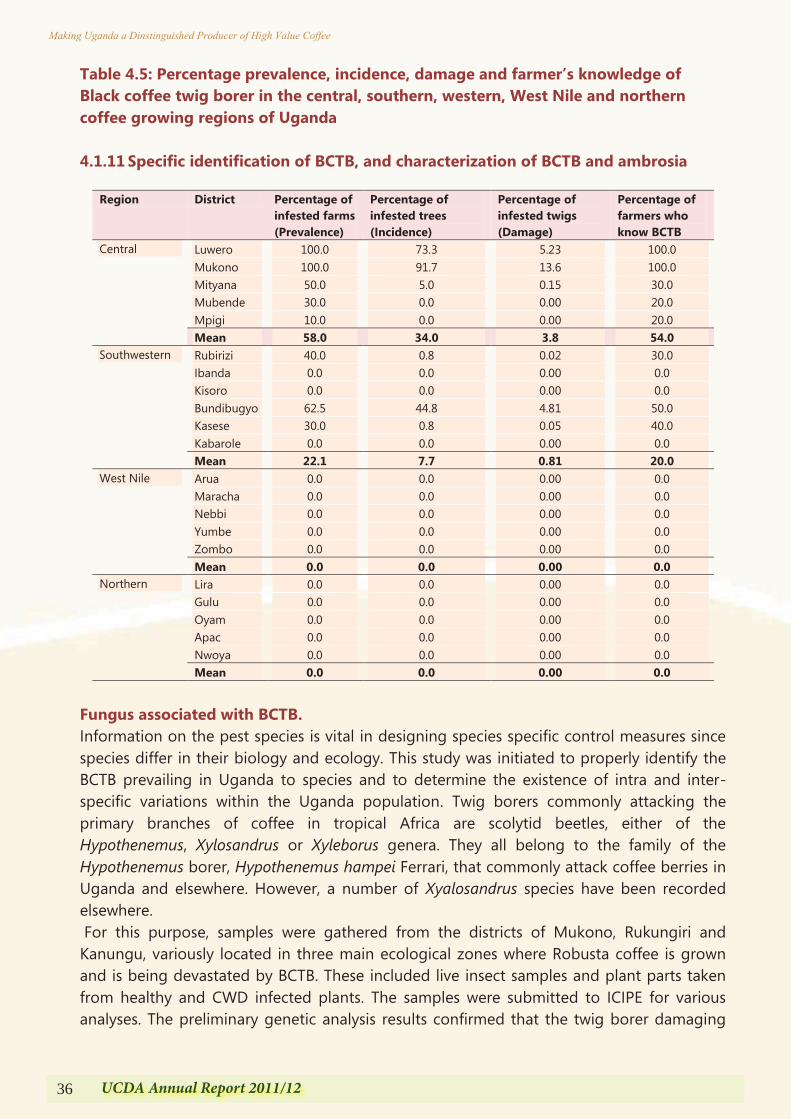
36 UCDA Annual Report 2011/12
Making Uganda a Dinstinguished Producer of High Value Coffee
Table 4.5: Percentage prevalence, incidence, damage and farmer’s knowledge of Black coffee twig borer in the central, southern, western, West Nile and northern coffee growing regions of Uganda 4.1.11 Specific identification of BCTB, and characterization of BCTB and ambrosia
Fungus associated with BCTB. Information on the pest species is vital in designing species specific control measures since species differ in their biology and ecology. This study was initiated to properly identify the BCTB prevailing in Uganda to species and to determine the existence of intra and inter-specific variations within the Uganda population. Twig borers commonly attacking the primary branches of coffee in tropical Africa are scolytid beetles, either of the Hypothenemus, Xylosandrus or Xyleborus genera. They all belong to the family of the Hypothenemus borer, Hypothenemus hampei Ferrari, that commonly attack coffee berries in Uganda and elsewhere. However, a number of Xyalosandrus species have been recorded elsewhere. For this purpose, samples were gathered from the districts of Mukono, Rukungiri and Kanungu, variously located in three main ecological zones where Robusta coffee is grown and is being devastated by BCTB. These included live insect samples and plant parts taken from healthy and CWD infected plants. The samples were submitted to ICIPE for various analyses. The preliminary genetic analysis results confirmed that the twig borer damaging
Region District Percentage of infested farms (Prevalence)
Percentage of infested trees (Incidence)
Percentage of infested twigs (Damage)
Percentage of farmers who know BCTB
Central Luwero 100.0 73.3 5.23 100.0 Mukono 100.0 91.7 13.6 100.0 Mityana 50.0 5.0 0.15 30.0 Mubende 30.0 0.0 0.00 20.0 Mpigi 10.0 0.0 0.00 20.0 Mean 58.0 34.0 3.8 54.0
Southwestern Rubirizi 40.0 0.8 0.02 30.0 Ibanda 0.0 0.0 0.00 0.0 Kisoro 0.0 0.0 0.00 0.0 Bundibugyo 62.5 44.8 4.81 50.0 Kasese 30.0 0.8 0.05 40.0 Kabarole 0.0 0.0 0.00 0.0 Mean 22.1 7.7 0.81 20.0
West Nile Arua 0.0 0.0 0.00 0.0 Maracha 0.0 0.0 0.00 0.0 Nebbi 0.0 0.0 0.00 0.0 Yumbe 0.0 0.0 0.00 0.0 Zombo 0.0 0.0 0.00 0.0 Mean 0.0 0.0 0.00 0.0
Northern Lira 0.0 0.0 0.00 0.0 Gulu 0.0 0.0 0.00 0.0 Oyam 0.0 0.0 0.00 0.0 Apac 0.0 0.0 0.00 0.0 Nwoya 0.0 0.0 0.00 0.0 Mean 0.0 0.0 0.00 0.0
37UCDA Annual Report 2011/12
Making Uganda a Dinstinguished Producer of High Value Coffee
Table 4.5: Percentage prevalence, incidence, damage and farmer’s knowledge of Black coffee twig borer in the central, southern, western, West Nile and northern coffee growing regions of Uganda 4.1.11 Specific identification of BCTB, and characterization of BCTB and ambrosia
Fungus associated with BCTB. Information on the pest species is vital in designing species specific control measures since species differ in their biology and ecology. This study was initiated to properly identify the BCTB prevailing in Uganda to species and to determine the existence of intra and inter-specific variations within the Uganda population. Twig borers commonly attacking the primary branches of coffee in tropical Africa are scolytid beetles, either of the Hypothenemus, Xylosandrus or Xyleborus genera. They all belong to the family of the Hypothenemus borer, Hypothenemus hampei Ferrari, that commonly attack coffee berries in Uganda and elsewhere. However, a number of Xyalosandrus species have been recorded elsewhere. For this purpose, samples were gathered from the districts of Mukono, Rukungiri and Kanungu, variously located in three main ecological zones where Robusta coffee is grown and is being devastated by BCTB. These included live insect samples and plant parts taken from healthy and CWD infected plants. The samples were submitted to ICIPE for various analyses. The preliminary genetic analysis results confirmed that the twig borer damaging
Region District Percentage of infested farms (Prevalence)
Percentage of infested trees (Incidence)
Percentage of infested twigs (Damage)
Percentage of farmers who know BCTB
Central Luwero 100.0 73.3 5.23 100.0 Mukono 100.0 91.7 13.6 100.0 Mityana 50.0 5.0 0.15 30.0 Mubende 30.0 0.0 0.00 20.0 Mpigi 10.0 0.0 0.00 20.0 Mean 58.0 34.0 3.8 54.0
Southwestern Rubirizi 40.0 0.8 0.02 30.0 Ibanda 0.0 0.0 0.00 0.0 Kisoro 0.0 0.0 0.00 0.0 Bundibugyo 62.5 44.8 4.81 50.0 Kasese 30.0 0.8 0.05 40.0 Kabarole 0.0 0.0 0.00 0.0 Mean 22.1 7.7 0.81 20.0
West Nile Arua 0.0 0.0 0.00 0.0 Maracha 0.0 0.0 0.00 0.0 Nebbi 0.0 0.0 0.00 0.0 Yumbe 0.0 0.0 0.00 0.0 Zombo 0.0 0.0 0.00 0.0 Mean 0.0 0.0 0.00 0.0
Northern Lira 0.0 0.0 0.00 0.0 Gulu 0.0 0.0 0.00 0.0 Oyam 0.0 0.0 0.00 0.0 Apac 0.0 0.0 0.00 0.0 Nwoya 0.0 0.0 0.00 0.0 Mean 0.0 0.0 0.00 0.0
Robusta coffee in Uganda is Xylosandrus compactus Eichhoff. The results also indicated the insect samples were homogenous (no intra specific variation). Likewise, COREC continued with studies to establish the inter and intra specific diversity of the ambrosia fungus, which is associated with BCTB in Uganda. Preliminary results of tests conducted at COREC show that the fungal material isolated from BCTB and its associated galleries from central Uganda (Kituza) is Fusarium solani (Martius) Saccardo. Preliminary homogeneity test for ambrosia conducted at Kituza on the ambrosia isolated from different locations in Uganda exhibited homogeneity suggesting that it is composed of a single fungal species. Secondly, other pathogenic fungi which might be associated with BCTB need also to be isolated and identified. 4.1.12 Evaluating effect of Ambrosia fungus on survival of Black Coffee Twig Borer The black coffee twig borer (BCTB) (Xylosandrus compactus) bores into the young branches of coffee (twigs), killing them in a few weeks. The entrance holes are about 0.8 mm diameter and are located predominantly on the basal part of branches. In its new habitat, the BCTB feeds on ambrosia fungus (and therefore belongs to the ambrosia group of beetles). Once inside the twigs, it does not feed on the host plant material but uses it as a medium for growing the fungus which acts as its food and for its larvae. Against this background, it was a decided to evaluate and determine the effect of ambrosia fungus on the survival of the BCTB. The information gathered could be included in the package for effective management of the pest. The activities involved are expanded below; In vitro screening and selection of systemic fungicides that effectively inhibit the growth
of ambrosia fungi which provides nutrition to the young brood of BCTB; Isolation and specific identification of the fungi that compose the ambrosia complex associated with BCTB in Uganda;
Field collection of ambrosia samples from Mukono, Nakaseke, Luwero Rukungiri, Bundibugyo and Kanungu districts and analysis of the samples at Kituza and ICIPE (Nairobi) Initiating a field trial at Kituza in order to compare the efficacy of a tank mixture of fungcide tebucozanole (Orius) and chloropyrifos (Dursban) against that of Dursban (Current recommended insecticide for BCTB control in Hawaii, USA) alone and the untreated control for BCTB control.
From each district, five coffee farms were identified and samples of coffee twigs damaged by BCTB were collected with help of sterile secateurs. The farm details and GPS location of the farms were also noted.
For laboratory isolation of Ambrosia fungi, samples were surface sterilized with 40% ethanol to eliminate other field contaminants and finally cleansed with distilled water. With help of a surgical blade, the bored twigs were longitudinally cleaved to expose the tunnel of the beetles. The beetles were collected in labeled sterile vials, while the wall of the tunnels from where the beetles used to inhabit were scrapped off and also collected in separate vials. The collected beetles were crushed in the vial so as to expose the propagules of the fungi concealed in their mycangia. This was diluted with distilled water
38 UCDA Annual Report 2011/12
Making Uganda a Dinstinguished Producer of High Value Coffee
to make a suspension which was cultured on petri dishes containing PDA. The cultures were incubated at room temperature.
Achievement
Field samples were collected from Mukono, Nakaseke, Luwero Rukungiri, and Kanungu districts and the collected samples analyzed at Kituza pathology laboratory and ICIPE (Nairobi). At ICIPE, eight isolates were obtained from the beetles, purified and were sent back to Kituza for specific identifications. The ambrosia isolates were found to consist of Fusarium solani. Pathogenicity tests of the collected isolates to understand fully the relationship between the ambrosia fungi and the coffee wilt disease was also carried out. None of the isolates had Fusarium xylarioides, the casual organism for coffee wilt disease.
Preliminary in-vitro tests indicated that the fungicide tebucozanole (Orius) is very effective for the inhibition of ambrosia growth in the laboratory. Ambrosia fungus provides the feed for BCTB broods; hence its elimination using Orius limits BCTB multiplication by denying the broods their essential food. The ambrosia fungus belongs to the same genus as Fusarium xylarioides Steyaert (Gibberella xylarioides Sacc and Heim), the causal organism of CWD. Incidentally, the initial reports of BCTB and CWD in Uganda came from the same district and at the same time prompting us to speculate a likely linkage in transmission and spread of CWD by the BCTB. Fungal isolations from BCTB collected from CWD-infected and non-infected coffee trees are being cultured in the laboratory at Kituza to detect the presence of the CWD casual organism. CWD pathogen is yet to be detected in the samples. These studies shall continue on BCTB collected from CWD-infected trees from the different locations (AEZ‟s) to further investigate and clarify the role of BCTB in CWD transmission. 4.1.13 Phytotoxicity and pathogenicty of Fusarium solani isolated from the BCTB and
its associated galleries in coffee twigs to coffee plantlets The BCTB attacked twig normally wilts and eventually dries within a few weeks. However, limited information on the actual cause of the wilting and eventual death of coffee twigs upon infestation by BCTB exists. It could probably be due to disruption of water and nutrient movement across the BCTB-infested galleries or due to phytotoxins produced by the ambrosia fungus. Several strains of Fusarium spp. have been reported to produce a number of phytotoxins such as: - fumonisins, moniliformin, fusaric acid, 2,5-anhydro-Dglucitol (AhG) and trichothecenes, T-2 toxins, HT-2, zearalenone, neosolaniol, naphthazarin among others. In fact, F. solani is known to be pathogenic to plants including coffee, causing cankers, root rots and wilts. Young coffee plants were inoculated with the fungus using wounding and drenching methods. However, preliminary results show that plantlets did not develop any infection symptoms after 105 days. This implies that the toxins produced by the ambrosia fungus associated with the BCTB collected from Kituza, central Uganda were not leathal to coffee plantlets, which is in contrast with field observations of affected plants reaction to BCTB attack. The studies on the phytotoxicity of the ambrosia fungus from the different agroecological zones (AEZ) of Uganda are continuing.
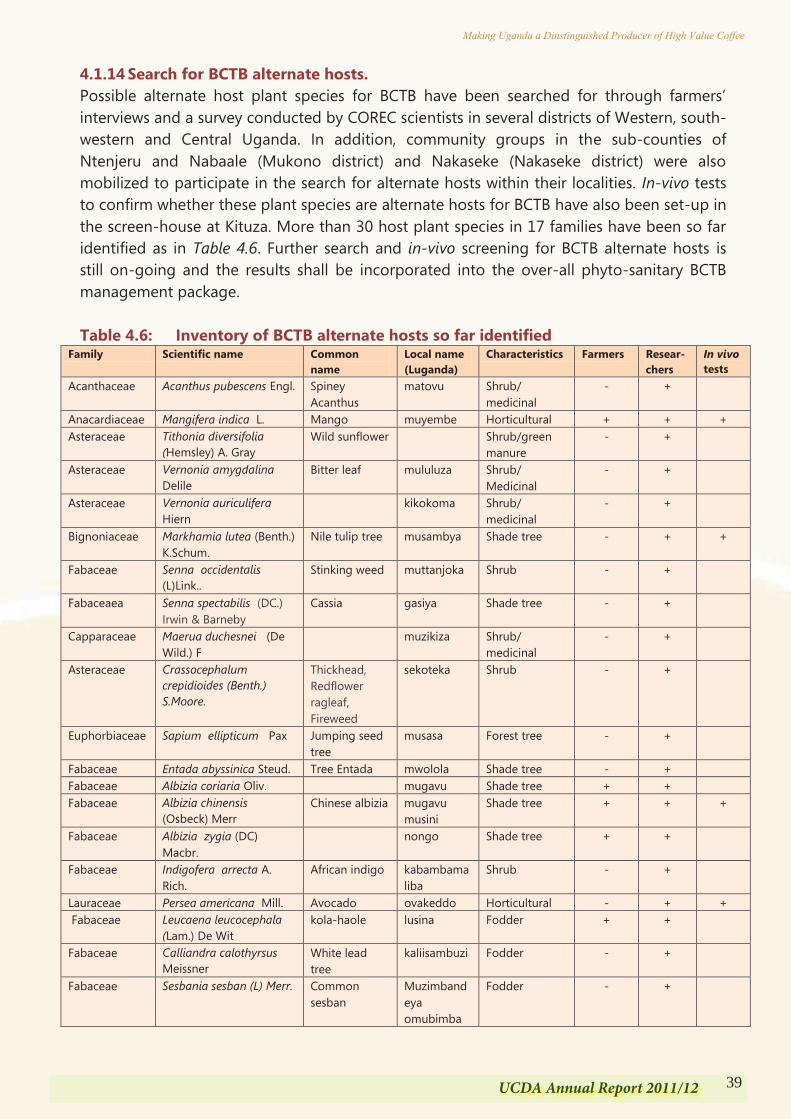
39UCDA Annual Report 2011/12
Making Uganda a Dinstinguished Producer of High Value Coffee
to make a suspension which was cultured on petri dishes containing PDA. The cultures were incubated at room temperature.
Achievement
Field samples were collected from Mukono, Nakaseke, Luwero Rukungiri, and Kanungu districts and the collected samples analyzed at Kituza pathology laboratory and ICIPE (Nairobi). At ICIPE, eight isolates were obtained from the beetles, purified and were sent back to Kituza for specific identifications. The ambrosia isolates were found to consist of Fusarium solani. Pathogenicity tests of the collected isolates to understand fully the relationship between the ambrosia fungi and the coffee wilt disease was also carried out. None of the isolates had Fusarium xylarioides, the casual organism for coffee wilt disease.
Preliminary in-vitro tests indicated that the fungicide tebucozanole (Orius) is very effective for the inhibition of ambrosia growth in the laboratory. Ambrosia fungus provides the feed for BCTB broods; hence its elimination using Orius limits BCTB multiplication by denying the broods their essential food. The ambrosia fungus belongs to the same genus as Fusarium xylarioides Steyaert (Gibberella xylarioides Sacc and Heim), the causal organism of CWD. Incidentally, the initial reports of BCTB and CWD in Uganda came from the same district and at the same time prompting us to speculate a likely linkage in transmission and spread of CWD by the BCTB. Fungal isolations from BCTB collected from CWD-infected and non-infected coffee trees are being cultured in the laboratory at Kituza to detect the presence of the CWD casual organism. CWD pathogen is yet to be detected in the samples. These studies shall continue on BCTB collected from CWD-infected trees from the different locations (AEZ‟s) to further investigate and clarify the role of BCTB in CWD transmission. 4.1.13 Phytotoxicity and pathogenicty of Fusarium solani isolated from the BCTB and
its associated galleries in coffee twigs to coffee plantlets The BCTB attacked twig normally wilts and eventually dries within a few weeks. However, limited information on the actual cause of the wilting and eventual death of coffee twigs upon infestation by BCTB exists. It could probably be due to disruption of water and nutrient movement across the BCTB-infested galleries or due to phytotoxins produced by the ambrosia fungus. Several strains of Fusarium spp. have been reported to produce a number of phytotoxins such as: - fumonisins, moniliformin, fusaric acid, 2,5-anhydro-Dglucitol (AhG) and trichothecenes, T-2 toxins, HT-2, zearalenone, neosolaniol, naphthazarin among others. In fact, F. solani is known to be pathogenic to plants including coffee, causing cankers, root rots and wilts. Young coffee plants were inoculated with the fungus using wounding and drenching methods. However, preliminary results show that plantlets did not develop any infection symptoms after 105 days. This implies that the toxins produced by the ambrosia fungus associated with the BCTB collected from Kituza, central Uganda were not leathal to coffee plantlets, which is in contrast with field observations of affected plants reaction to BCTB attack. The studies on the phytotoxicity of the ambrosia fungus from the different agroecological zones (AEZ) of Uganda are continuing.
4.1.14 Search for BCTB alternate hosts. Possible alternate host plant species for BCTB have been searched for through farmers‟ interviews and a survey conducted by COREC scientists in several districts of Western, south-western and Central Uganda. In addition, community groups in the sub-counties of Ntenjeru and Nabaale (Mukono district) and Nakaseke (Nakaseke district) were also mobilized to participate in the search for alternate hosts within their localities. In-vivo tests to confirm whether these plant species are alternate hosts for BCTB have also been set-up in the screen-house at Kituza. More than 30 host plant species in 17 families have been so far identified as in Table 4.6. Further search and in-vivo screening for BCTB alternate hosts is still on-going and the results shall be incorporated into the over-all phyto-sanitary BCTB management package. Table 4.6: Inventory of BCTB alternate hosts so far identified
Family Scientific name Common name
Local name (Luganda)
Characteristics Farmers Resear-chers
In vivo tests
Acanthaceae Acanthus pubescens Engl. Spiney Acanthus
matovu Shrub/ medicinal
- +
Anacardiaceae Mangifera indica L. Mango muyembe Horticultural + + + Asteraceae Tithonia diversifolia
(Hemsley) A. Gray Wild sunflower Shrub/green
manure - +
Asteraceae Vernonia amygdalina Delile
Bitter leaf mululuza Shrub/ Medicinal
- +
Asteraceae Vernonia auriculifera Hiern
kikokoma Shrub/ medicinal
- +
Bignoniaceae Markhamia lutea (Benth.) K.Schum.
Nile tulip tree musambya Shade tree - + +
Fabaceae
Senna occidentalis (L)Link..
Stinking weed muttanjoka Shrub - +
Fabaceaea
Senna spectabilis (DC.) Irwin & Barneby
Cassia gasiya Shade tree - +
Capparaceae Maerua duchesnei (De Wild.) F
muzikiza Shrub/ medicinal
- +
Asteraceae Crassocephalum crepidioides (Benth.) S.Moore.
Thickhead, Redflower ragleaf, Fireweed
sekoteka Shrub - +
Euphorbiaceae Sapium ellipticum Pax Jumping seed tree
musasa Forest tree - +
Fabaceae Entada abyssinica Steud. Tree Entada mwolola Shade tree - + Fabaceae Albizia coriaria Oliv. mugavu Shade tree + + Fabaceae Albizia chinensis
(Osbeck) Merr Chinese albizia mugavu
musini Shade tree + + +
Fabaceae Albizia zygia (DC) Macbr.
nongo Shade tree + +
Fabaceae Indigofera arrecta A. Rich.
African indigo kabambamaliba
Shrub - +
Lauraceae Persea americana Mill. Avocado ovakeddo Horticultural - + + Fabaceae Leucaena leucocephala
(Lam.) De Wit kola-haole lusina Fodder + +
Fabaceae
Calliandra calothyrsus Meissner
White lead tree
kaliisambuzi Fodder - +
Fabaceae Sesbania sesban (L) Merr. Common sesban
Muzimbandeya omubimba
Fodder - +
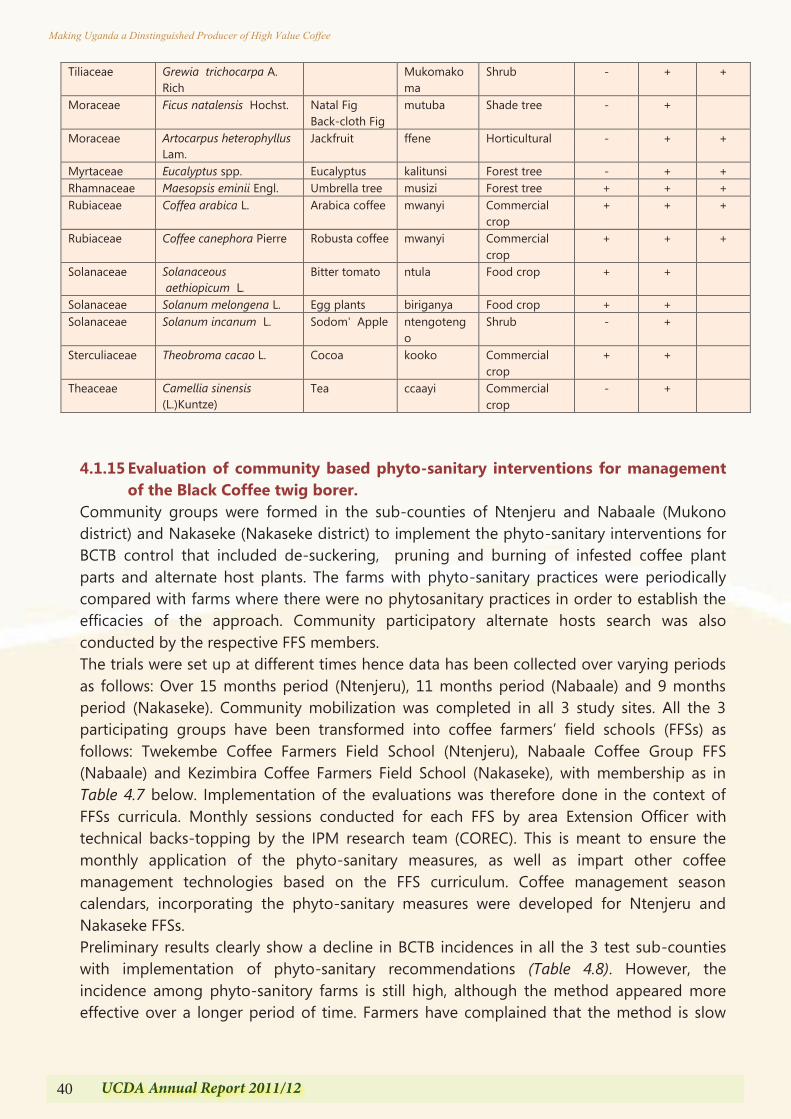
40 UCDA Annual Report 2011/12
Making Uganda a Dinstinguished Producer of High Value Coffee
Tiliaceae Grewia trichocarpa A. Rich
Mukomakoma
Shrub - + +
Moraceae Ficus natalensis Hochst. Natal Fig Back-cloth Fig
mutuba Shade tree - +
Moraceae Artocarpus heterophyllus Lam.
Jackfruit ffene Horticultural - + +
Myrtaceae Eucalyptus spp. Eucalyptus kalitunsi Forest tree - + + Rhamnaceae Maesopsis eminii Engl. Umbrella tree musizi Forest tree + + + Rubiaceae Coffea arabica L. Arabica coffee mwanyi Commercial
crop + + +
Rubiaceae Coffee canephora Pierre Robusta coffee mwanyi Commercial crop
+ + +
Solanaceae Solanaceous aethiopicum L.
Bitter tomato ntula Food crop + +
Solanaceae Solanum melongena L. Egg plants biriganya Food crop + + Solanaceae Solanum incanum L. Sodom' Apple ntengoteng
o Shrub - +
Sterculiaceae Theobroma cacao L. Cocoa kooko Commercial crop
+ +
Theaceae Camellia sinensis (L.)Kuntze)
Tea ccaayi Commercial crop
- +
4.1.15 Evaluation of community based phyto-sanitary interventions for management of the Black Coffee twig borer.
Community groups were formed in the sub-counties of Ntenjeru and Nabaale (Mukono district) and Nakaseke (Nakaseke district) to implement the phyto-sanitary interventions for BCTB control that included de-suckering, pruning and burning of infested coffee plant parts and alternate host plants. The farms with phyto-sanitary practices were periodically compared with farms where there were no phytosanitary practices in order to establish the efficacies of the approach. Community participatory alternate hosts search was also conducted by the respective FFS members. The trials were set up at different times hence data has been collected over varying periods as follows: Over 15 months period (Ntenjeru), 11 months period (Nabaale) and 9 months period (Nakaseke). Community mobilization was completed in all 3 study sites. All the 3 participating groups have been transformed into coffee farmers‟ field schools (FFSs) as follows: Twekembe Coffee Farmers Field School (Ntenjeru), Nabaale Coffee Group FFS (Nabaale) and Kezimbira Coffee Farmers Field School (Nakaseke), with membership as in Table 4.7 below. Implementation of the evaluations was therefore done in the context of FFSs curricula. Monthly sessions conducted for each FFS by area Extension Officer with technical backs-topping by the IPM research team (COREC). This is meant to ensure the monthly application of the phyto-sanitary measures, as well as impart other coffee management technologies based on the FFS curriculum. Coffee management season calendars, incorporating the phyto-sanitary measures were developed for Ntenjeru and Nakaseke FFSs. Preliminary results clearly show a decline in BCTB incidences in all the 3 test sub-counties with implementation of phyto-sanitary recommendations (Table 4.8). However, the incidence among phyto-sanitory farms is still high, although the method appeared more effective over a longer period of time. Farmers have complained that the method is slow
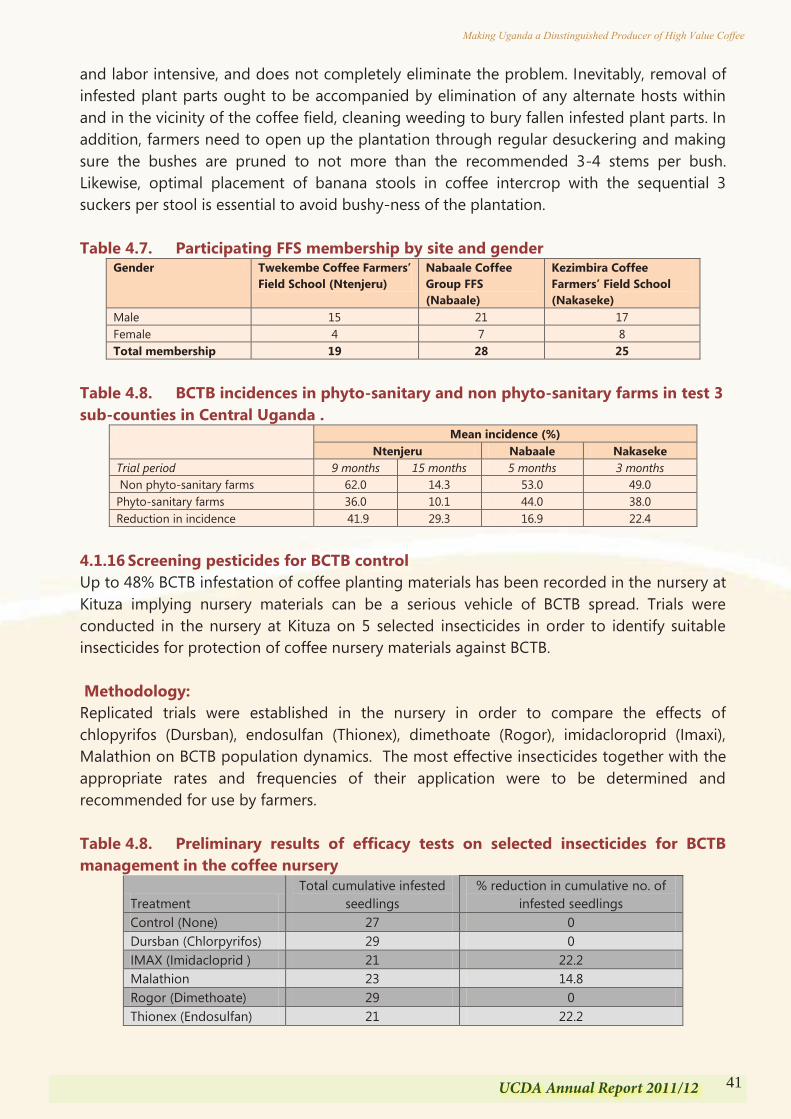
41UCDA Annual Report 2011/12
Making Uganda a Dinstinguished Producer of High Value Coffee
Tiliaceae Grewia trichocarpa A. Rich
Mukomakoma
Shrub - + +
Moraceae Ficus natalensis Hochst. Natal Fig Back-cloth Fig
mutuba Shade tree - +
Moraceae Artocarpus heterophyllus Lam.
Jackfruit ffene Horticultural - + +
Myrtaceae Eucalyptus spp. Eucalyptus kalitunsi Forest tree - + + Rhamnaceae Maesopsis eminii Engl. Umbrella tree musizi Forest tree + + + Rubiaceae Coffea arabica L. Arabica coffee mwanyi Commercial
crop + + +
Rubiaceae Coffee canephora Pierre Robusta coffee mwanyi Commercial crop
+ + +
Solanaceae Solanaceous aethiopicum L.
Bitter tomato ntula Food crop + +
Solanaceae Solanum melongena L. Egg plants biriganya Food crop + + Solanaceae Solanum incanum L. Sodom' Apple ntengoteng
o Shrub - +
Sterculiaceae Theobroma cacao L. Cocoa kooko Commercial crop
+ +
Theaceae Camellia sinensis (L.)Kuntze)
Tea ccaayi Commercial crop
- +
4.1.15 Evaluation of community based phyto-sanitary interventions for management of the Black Coffee twig borer.
Community groups were formed in the sub-counties of Ntenjeru and Nabaale (Mukono district) and Nakaseke (Nakaseke district) to implement the phyto-sanitary interventions for BCTB control that included de-suckering, pruning and burning of infested coffee plant parts and alternate host plants. The farms with phyto-sanitary practices were periodically compared with farms where there were no phytosanitary practices in order to establish the efficacies of the approach. Community participatory alternate hosts search was also conducted by the respective FFS members. The trials were set up at different times hence data has been collected over varying periods as follows: Over 15 months period (Ntenjeru), 11 months period (Nabaale) and 9 months period (Nakaseke). Community mobilization was completed in all 3 study sites. All the 3 participating groups have been transformed into coffee farmers‟ field schools (FFSs) as follows: Twekembe Coffee Farmers Field School (Ntenjeru), Nabaale Coffee Group FFS (Nabaale) and Kezimbira Coffee Farmers Field School (Nakaseke), with membership as in Table 4.7 below. Implementation of the evaluations was therefore done in the context of FFSs curricula. Monthly sessions conducted for each FFS by area Extension Officer with technical backs-topping by the IPM research team (COREC). This is meant to ensure the monthly application of the phyto-sanitary measures, as well as impart other coffee management technologies based on the FFS curriculum. Coffee management season calendars, incorporating the phyto-sanitary measures were developed for Ntenjeru and Nakaseke FFSs. Preliminary results clearly show a decline in BCTB incidences in all the 3 test sub-counties with implementation of phyto-sanitary recommendations (Table 4.8). However, the incidence among phyto-sanitory farms is still high, although the method appeared more effective over a longer period of time. Farmers have complained that the method is slow
and labor intensive, and does not completely eliminate the problem. Inevitably, removal of infested plant parts ought to be accompanied by elimination of any alternate hosts within and in the vicinity of the coffee field, cleaning weeding to bury fallen infested plant parts. In addition, farmers need to open up the plantation through regular desuckering and making sure the bushes are pruned to not more than the recommended 3-4 stems per bush. Likewise, optimal placement of banana stools in coffee intercrop with the sequential 3 suckers per stool is essential to avoid bushy-ness of the plantation. Table 4.7. Participating FFS membership by site and gender
Gender Twekembe Coffee Farmers’ Field School (Ntenjeru)
Nabaale Coffee Group FFS (Nabaale)
Kezimbira Coffee Farmers’ Field School (Nakaseke)
Male 15 21 17 Female 4 7 8 Total membership 19 28 25
Table 4.8. BCTB incidences in phyto-sanitary and non phyto-sanitary farms in test 3 sub-counties in Central Uganda .
Mean incidence (%) Ntenjeru Nabaale Nakaseke
Trial period 9 months 15 months 5 months 3 months Non phyto-sanitary farms 62.0 14.3 53.0 49.0 Phyto-sanitary farms 36.0 10.1 44.0 38.0 Reduction in incidence 41.9 29.3 16.9 22.4
4.1.16 Screening pesticides for BCTB control Up to 48% BCTB infestation of coffee planting materials has been recorded in the nursery at Kituza implying nursery materials can be a serious vehicle of BCTB spread. Trials were conducted in the nursery at Kituza on 5 selected insecticides in order to identify suitable insecticides for protection of coffee nursery materials against BCTB. Methodology: Replicated trials were established in the nursery in order to compare the effects of chlopyrifos (Dursban), endosulfan (Thionex), dimethoate (Rogor), imidacloroprid (Imaxi), Malathion on BCTB population dynamics. The most effective insecticides together with the appropriate rates and frequencies of their application were to be determined and recommended for use by farmers. Table 4.8. Preliminary results of efficacy tests on selected insecticides for BCTB management in the coffee nursery
Treatment Total cumulative infested
seedlings % reduction in cumulative no. of
infested seedlings Control (None) 27 0 Dursban (Chlorpyrifos) 29 0 IMAX (Imidacloprid ) 21 22.2 Malathion 23 14.8 Rogor (Dimethoate) 29 0 Thionex (Endosulfan) 21 22.2
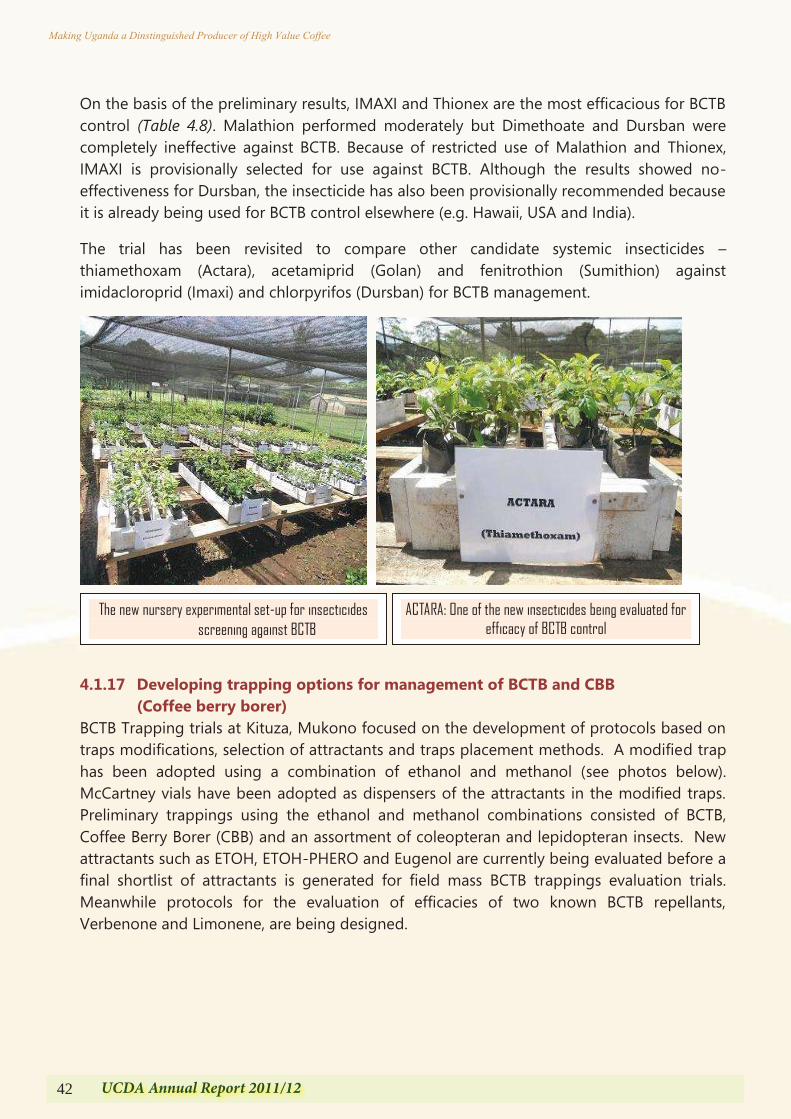
42 UCDA Annual Report 2011/12
Making Uganda a Dinstinguished Producer of High Value Coffee
On the basis of the preliminary results, IMAXI and Thionex are the most efficacious for BCTB control (Table 4.8). Malathion performed moderately but Dimethoate and Dursban were completely ineffective against BCTB. Because of restricted use of Malathion and Thionex, IMAXI is provisionally selected for use against BCTB. Although the results showed no-effectiveness for Dursban, the insecticide has also been provisionally recommended because it is already being used for BCTB control elsewhere (e.g. Hawaii, USA and India).
The trial has been revisited to compare other candidate systemic insecticides –thiamethoxam (Actara), acetamiprid (Golan) and fenitrothion (Sumithion) against imidacloroprid (Imaxi) and chlorpyrifos (Dursban) for BCTB management.
4.1.17 Developing trapping options for management of BCTB and CBB (Coffee berry borer)
BCTB Trapping trials at Kituza, Mukono focused on the development of protocols based on traps modifications, selection of attractants and traps placement methods. A modified trap has been adopted using a combination of ethanol and methanol (see photos below). McCartney vials have been adopted as dispensers of the attractants in the modified traps. Preliminary trappings using the ethanol and methanol combinations consisted of BCTB, Coffee Berry Borer (CBB) and an assortment of coleopteran and lepidopteran insects. New attractants such as ETOH, ETOH-PHERO and Eugenol are currently being evaluated before a final shortlist of attractants is generated for field mass BCTB trappings evaluation trials. Meanwhile protocols for the evaluation of efficacies of two known BCTB repellants, Verbenone and Limonene, are being designed.
The new nursery experimental set-up for insecticides screening against BCTB
ACTARA: One of the new insecticides being evaluated for efficacy of BCTB control
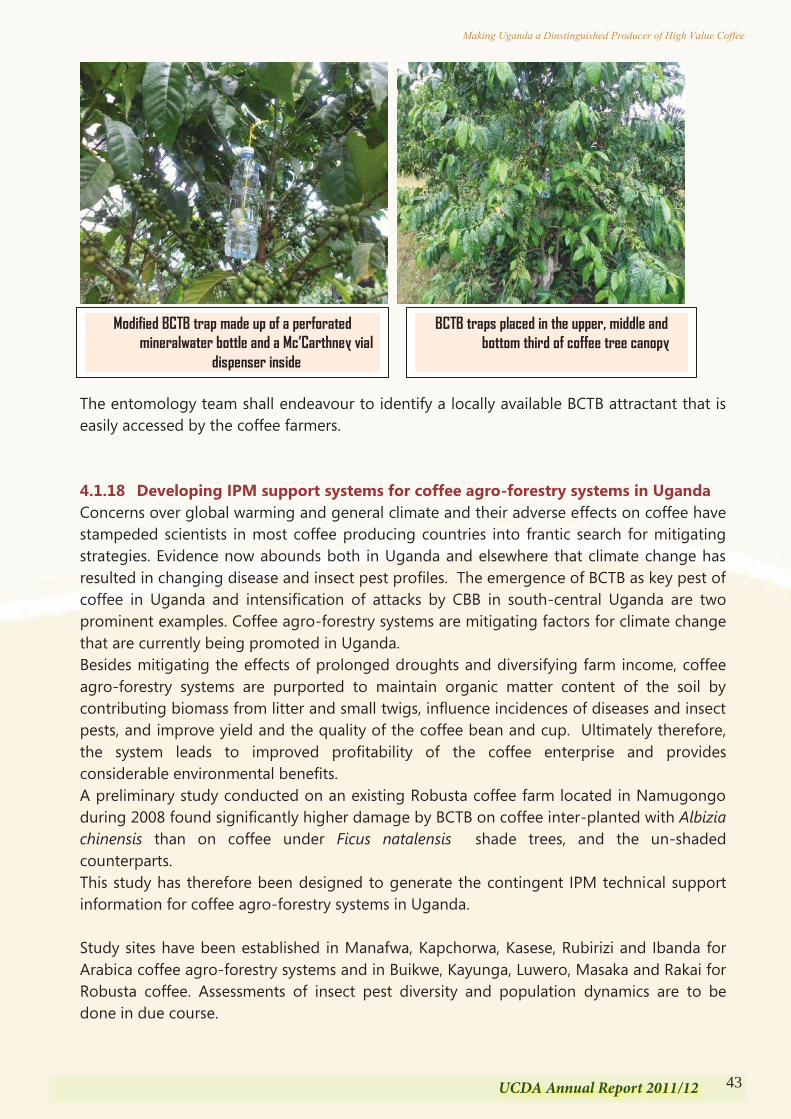
43UCDA Annual Report 2011/12
Making Uganda a Dinstinguished Producer of High Value Coffee
On the basis of the preliminary results, IMAXI and Thionex are the most efficacious for BCTB control (Table 4.8). Malathion performed moderately but Dimethoate and Dursban were completely ineffective against BCTB. Because of restricted use of Malathion and Thionex, IMAXI is provisionally selected for use against BCTB. Although the results showed no-effectiveness for Dursban, the insecticide has also been provisionally recommended because it is already being used for BCTB control elsewhere (e.g. Hawaii, USA and India).
The trial has been revisited to compare other candidate systemic insecticides –thiamethoxam (Actara), acetamiprid (Golan) and fenitrothion (Sumithion) against imidacloroprid (Imaxi) and chlorpyrifos (Dursban) for BCTB management.
4.1.17 Developing trapping options for management of BCTB and CBB (Coffee berry borer)
BCTB Trapping trials at Kituza, Mukono focused on the development of protocols based on traps modifications, selection of attractants and traps placement methods. A modified trap has been adopted using a combination of ethanol and methanol (see photos below). McCartney vials have been adopted as dispensers of the attractants in the modified traps. Preliminary trappings using the ethanol and methanol combinations consisted of BCTB, Coffee Berry Borer (CBB) and an assortment of coleopteran and lepidopteran insects. New attractants such as ETOH, ETOH-PHERO and Eugenol are currently being evaluated before a final shortlist of attractants is generated for field mass BCTB trappings evaluation trials. Meanwhile protocols for the evaluation of efficacies of two known BCTB repellants, Verbenone and Limonene, are being designed.
The new nursery experimental set-up for insecticides screening against BCTB
ACTARA: One of the new insecticides being evaluated for efficacy of BCTB control
The entomology team shall endeavour to identify a locally available BCTB attractant that is easily accessed by the coffee farmers. 4.1.18 Developing IPM support systems for coffee agro-forestry systems in Uganda Concerns over global warming and general climate and their adverse effects on coffee have stampeded scientists in most coffee producing countries into frantic search for mitigating strategies. Evidence now abounds both in Uganda and elsewhere that climate change has resulted in changing disease and insect pest profiles. The emergence of BCTB as key pest of coffee in Uganda and intensification of attacks by CBB in south-central Uganda are two prominent examples. Coffee agro-forestry systems are mitigating factors for climate change that are currently being promoted in Uganda. Besides mitigating the effects of prolonged droughts and diversifying farm income, coffee agro-forestry systems are purported to maintain organic matter content of the soil by contributing biomass from litter and small twigs, influence incidences of diseases and insect pests, and improve yield and the quality of the coffee bean and cup. Ultimately therefore, the system leads to improved profitability of the coffee enterprise and provides considerable environmental benefits. A preliminary study conducted on an existing Robusta coffee farm located in Namugongo during 2008 found significantly higher damage by BCTB on coffee inter-planted with Albizia chinensis than on coffee under Ficus natalensis shade trees, and the un-shaded counterparts. This study has therefore been designed to generate the contingent IPM technical support information for coffee agro-forestry systems in Uganda. Study sites have been established in Manafwa, Kapchorwa, Kasese, Rubirizi and Ibanda for Arabica coffee agro-forestry systems and in Buikwe, Kayunga, Luwero, Masaka and Rakai for Robusta coffee. Assessments of insect pest diversity and population dynamics are to be done in due course.
BCTB traps placed in the upper, middle and bottom third of coffee tree canopy
Modified BCTB trap made up of a perforated mineralwater bottle and a Mc’Carthney vial
dispenser inside
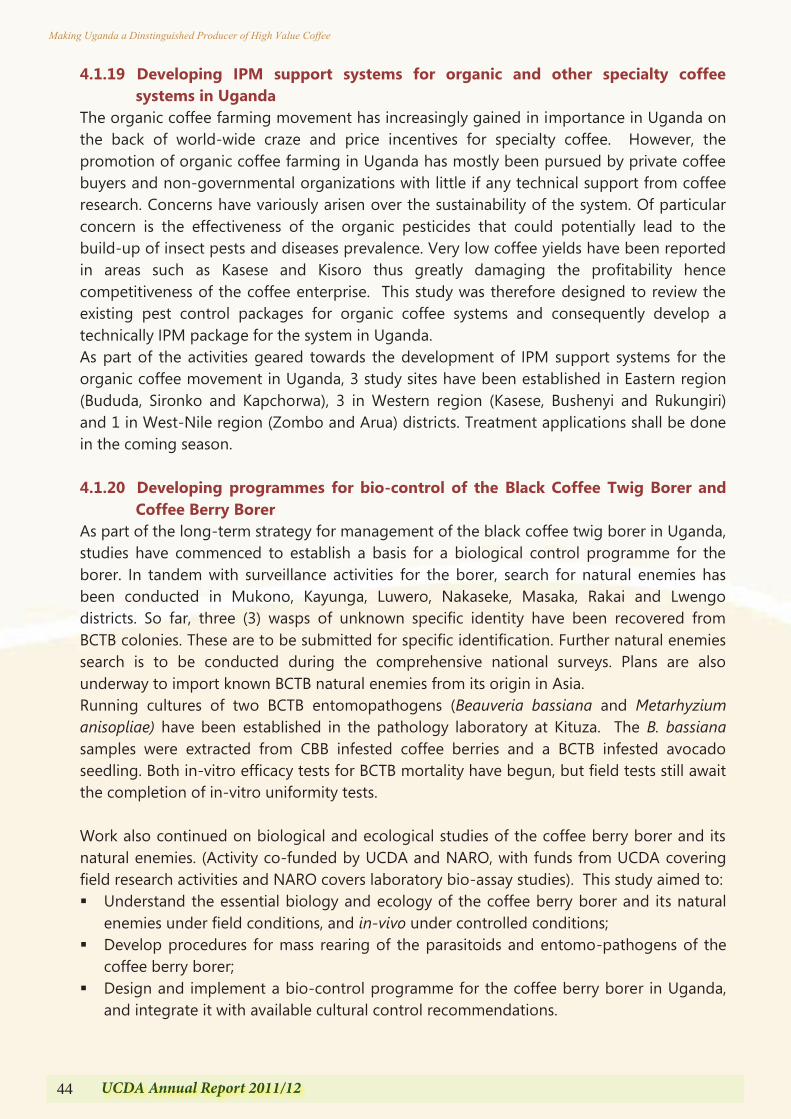
44 UCDA Annual Report 2011/12
Making Uganda a Dinstinguished Producer of High Value Coffee
4.1.19 Developing IPM support systems for organic and other specialty coffee systems in Uganda
The organic coffee farming movement has increasingly gained in importance in Uganda on the back of world-wide craze and price incentives for specialty coffee. However, the promotion of organic coffee farming in Uganda has mostly been pursued by private coffee buyers and non-governmental organizations with little if any technical support from coffee research. Concerns have variously arisen over the sustainability of the system. Of particular concern is the effectiveness of the organic pesticides that could potentially lead to the build-up of insect pests and diseases prevalence. Very low coffee yields have been reported in areas such as Kasese and Kisoro thus greatly damaging the profitability hence competitiveness of the coffee enterprise. This study was therefore designed to review the existing pest control packages for organic coffee systems and consequently develop a technically IPM package for the system in Uganda. As part of the activities geared towards the development of IPM support systems for the organic coffee movement in Uganda, 3 study sites have been established in Eastern region (Bududa, Sironko and Kapchorwa), 3 in Western region (Kasese, Bushenyi and Rukungiri) and 1 in West-Nile region (Zombo and Arua) districts. Treatment applications shall be done in the coming season. 4.1.20 Developing programmes for bio-control of the Black Coffee Twig Borer and
Coffee Berry Borer As part of the long-term strategy for management of the black coffee twig borer in Uganda, studies have commenced to establish a basis for a biological control programme for the borer. In tandem with surveillance activities for the borer, search for natural enemies has been conducted in Mukono, Kayunga, Luwero, Nakaseke, Masaka, Rakai and Lwengo districts. So far, three (3) wasps of unknown specific identity have been recovered from BCTB colonies. These are to be submitted for specific identification. Further natural enemies search is to be conducted during the comprehensive national surveys. Plans are also underway to import known BCTB natural enemies from its origin in Asia. Running cultures of two BCTB entomopathogens (Beauveria bassiana and Metarhyzium anisopliae) have been established in the pathology laboratory at Kituza. The B. bassiana samples were extracted from CBB infested coffee berries and a BCTB infested avocado seedling. Both in-vitro efficacy tests for BCTB mortality have begun, but field tests still await the completion of in-vitro uniformity tests. Work also continued on biological and ecological studies of the coffee berry borer and its natural enemies. (Activity co-funded by UCDA and NARO, with funds from UCDA covering field research activities and NARO covers laboratory bio-assay studies). This study aimed to: Understand the essential biology and ecology of the coffee berry borer and its natural
enemies under field conditions, and in-vivo under controlled conditions; Develop procedures for mass rearing of the parasitoids and entomo-pathogens of the
coffee berry borer; Design and implement a bio-control programme for the coffee berry borer in Uganda,
and integrate it with available cultural control recommendations.
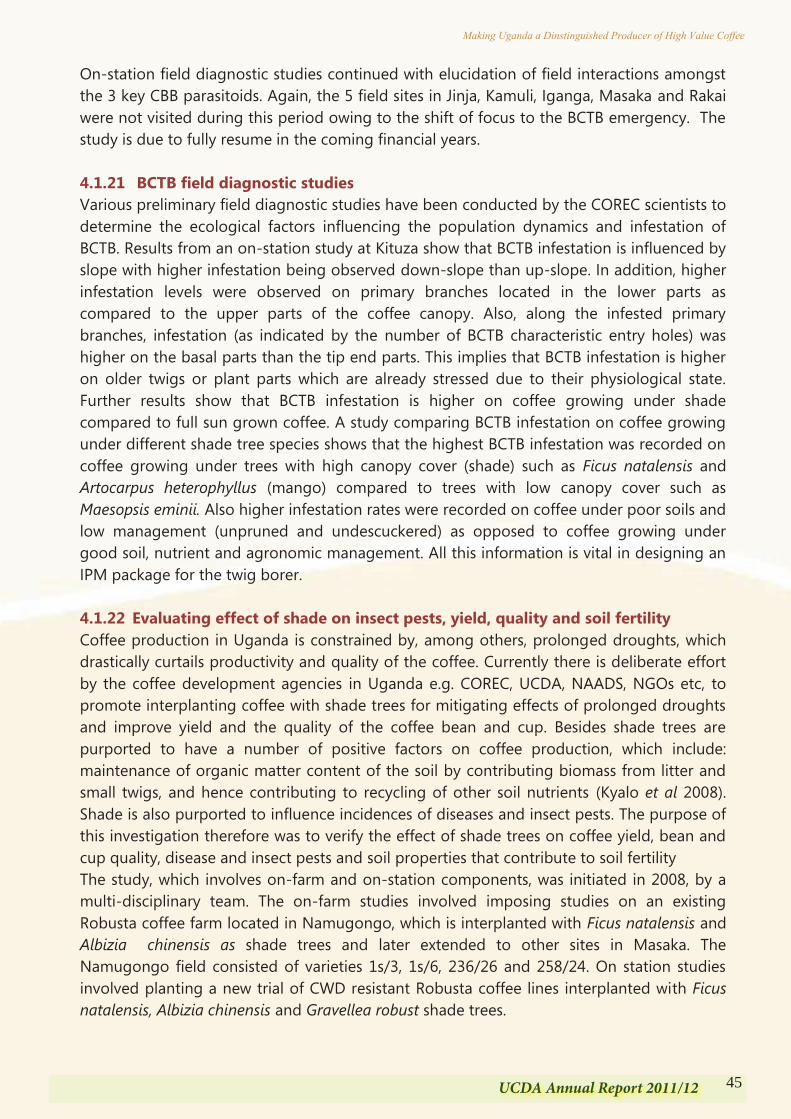
45UCDA Annual Report 2011/12
Making Uganda a Dinstinguished Producer of High Value Coffee
4.1.19 Developing IPM support systems for organic and other specialty coffee systems in Uganda
The organic coffee farming movement has increasingly gained in importance in Uganda on the back of world-wide craze and price incentives for specialty coffee. However, the promotion of organic coffee farming in Uganda has mostly been pursued by private coffee buyers and non-governmental organizations with little if any technical support from coffee research. Concerns have variously arisen over the sustainability of the system. Of particular concern is the effectiveness of the organic pesticides that could potentially lead to the build-up of insect pests and diseases prevalence. Very low coffee yields have been reported in areas such as Kasese and Kisoro thus greatly damaging the profitability hence competitiveness of the coffee enterprise. This study was therefore designed to review the existing pest control packages for organic coffee systems and consequently develop a technically IPM package for the system in Uganda. As part of the activities geared towards the development of IPM support systems for the organic coffee movement in Uganda, 3 study sites have been established in Eastern region (Bududa, Sironko and Kapchorwa), 3 in Western region (Kasese, Bushenyi and Rukungiri) and 1 in West-Nile region (Zombo and Arua) districts. Treatment applications shall be done in the coming season. 4.1.20 Developing programmes for bio-control of the Black Coffee Twig Borer and
Coffee Berry Borer As part of the long-term strategy for management of the black coffee twig borer in Uganda, studies have commenced to establish a basis for a biological control programme for the borer. In tandem with surveillance activities for the borer, search for natural enemies has been conducted in Mukono, Kayunga, Luwero, Nakaseke, Masaka, Rakai and Lwengo districts. So far, three (3) wasps of unknown specific identity have been recovered from BCTB colonies. These are to be submitted for specific identification. Further natural enemies search is to be conducted during the comprehensive national surveys. Plans are also underway to import known BCTB natural enemies from its origin in Asia. Running cultures of two BCTB entomopathogens (Beauveria bassiana and Metarhyzium anisopliae) have been established in the pathology laboratory at Kituza. The B. bassiana samples were extracted from CBB infested coffee berries and a BCTB infested avocado seedling. Both in-vitro efficacy tests for BCTB mortality have begun, but field tests still await the completion of in-vitro uniformity tests. Work also continued on biological and ecological studies of the coffee berry borer and its natural enemies. (Activity co-funded by UCDA and NARO, with funds from UCDA covering field research activities and NARO covers laboratory bio-assay studies). This study aimed to: Understand the essential biology and ecology of the coffee berry borer and its natural
enemies under field conditions, and in-vivo under controlled conditions; Develop procedures for mass rearing of the parasitoids and entomo-pathogens of the
coffee berry borer; Design and implement a bio-control programme for the coffee berry borer in Uganda,
and integrate it with available cultural control recommendations.
On-station field diagnostic studies continued with elucidation of field interactions amongst the 3 key CBB parasitoids. Again, the 5 field sites in Jinja, Kamuli, Iganga, Masaka and Rakai were not visited during this period owing to the shift of focus to the BCTB emergency. The study is due to fully resume in the coming financial years. 4.1.21 BCTB field diagnostic studies Various preliminary field diagnostic studies have been conducted by the COREC scientists to determine the ecological factors influencing the population dynamics and infestation of BCTB. Results from an on-station study at Kituza show that BCTB infestation is influenced by slope with higher infestation being observed down-slope than up-slope. In addition, higher infestation levels were observed on primary branches located in the lower parts as compared to the upper parts of the coffee canopy. Also, along the infested primary branches, infestation (as indicated by the number of BCTB characteristic entry holes) was higher on the basal parts than the tip end parts. This implies that BCTB infestation is higher on older twigs or plant parts which are already stressed due to their physiological state. Further results show that BCTB infestation is higher on coffee growing under shade compared to full sun grown coffee. A study comparing BCTB infestation on coffee growing under different shade tree species shows that the highest BCTB infestation was recorded on coffee growing under trees with high canopy cover (shade) such as Ficus natalensis and Artocarpus heterophyllus (mango) compared to trees with low canopy cover such as Maesopsis eminii. Also higher infestation rates were recorded on coffee under poor soils and low management (unpruned and undescuckered) as opposed to coffee growing under good soil, nutrient and agronomic management. All this information is vital in designing an IPM package for the twig borer. 4.1.22 Evaluating effect of shade on insect pests, yield, quality and soil fertility Coffee production in Uganda is constrained by, among others, prolonged droughts, which drastically curtails productivity and quality of the coffee. Currently there is deliberate effort by the coffee development agencies in Uganda e.g. COREC, UCDA, NAADS, NGOs etc, to promote interplanting coffee with shade trees for mitigating effects of prolonged droughts and improve yield and the quality of the coffee bean and cup. Besides shade trees are purported to have a number of positive factors on coffee production, which include: maintenance of organic matter content of the soil by contributing biomass from litter and small twigs, and hence contributing to recycling of other soil nutrients (Kyalo et al 2008). Shade is also purported to influence incidences of diseases and insect pests. The purpose of this investigation therefore was to verify the effect of shade trees on coffee yield, bean and cup quality, disease and insect pests and soil properties that contribute to soil fertility The study, which involves on-farm and on-station components, was initiated in 2008, by a multi-disciplinary team. The on-farm studies involved imposing studies on an existing Robusta coffee farm located in Namugongo, which is interplanted with Ficus natalensis and Albizia chinensis as shade trees and later extended to other sites in Masaka. The Namugongo field consisted of varieties 1s/3, 1s/6, 236/26 and 258/24. On station studies involved planting a new trial of CWD resistant Robusta coffee lines interplanted with Ficus natalensis, Albizia chinensis and Gravellea robust shade trees.
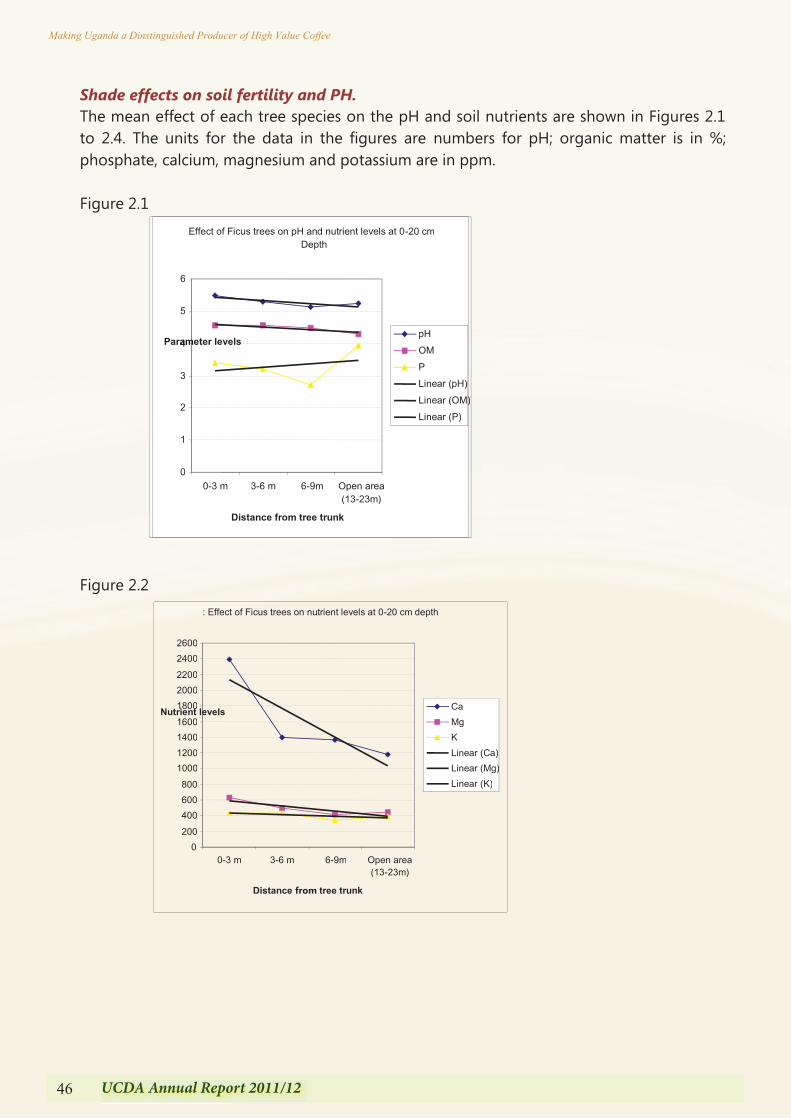
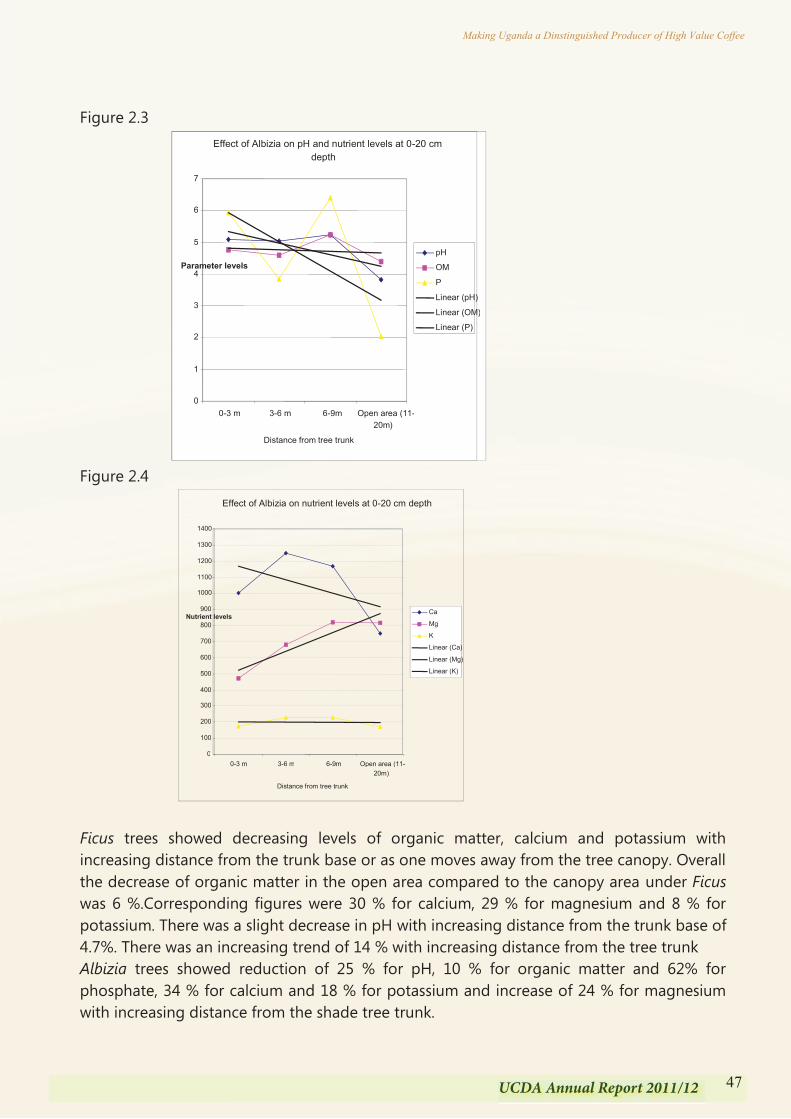
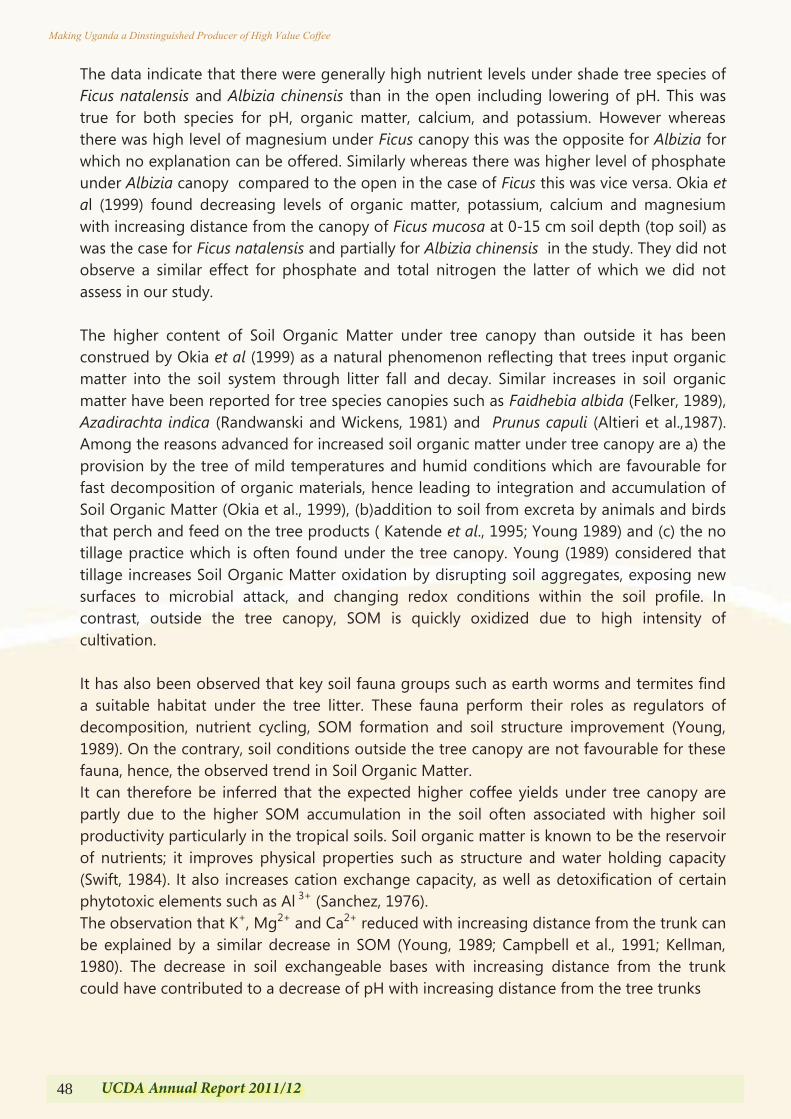
48 UCDA Annual Report 2011/12
Making Uganda a Dinstinguished Producer of High Value Coffee
The data indicate that there were generally high nutrient levels under shade tree species of Ficus natalensis and Albizia chinensis than in the open including lowering of pH. This was true for both species for pH, organic matter, calcium, and potassium. However whereas there was high level of magnesium under Ficus canopy this was the opposite for Albizia for which no explanation can be offered. Similarly whereas there was higher level of phosphate under Albizia canopy compared to the open in the case of Ficus this was vice versa. Okia et al (1999) found decreasing levels of organic matter, potassium, calcium and magnesium with increasing distance from the canopy of Ficus mucosa at 0-15 cm soil depth (top soil) as was the case for Ficus natalensis and partially for Albizia chinensis in the study. They did not observe a similar effect for phosphate and total nitrogen the latter of which we did not assess in our study. The higher content of Soil Organic Matter under tree canopy than outside it has been construed by Okia et al (1999) as a natural phenomenon reflecting that trees input organic matter into the soil system through litter fall and decay. Similar increases in soil organic matter have been reported for tree species canopies such as Faidhebia albida (Felker, 1989), Azadirachta indica (Randwanski and Wickens, 1981) and Prunus capuli (Altieri et al.,1987). Among the reasons advanced for increased soil organic matter under tree canopy are a) the provision by the tree of mild temperatures and humid conditions which are favourable for fast decomposition of organic materials, hence leading to integration and accumulation of Soil Organic Matter (Okia et al., 1999), (b)addition to soil from excreta by animals and birds that perch and feed on the tree products ( Katende et al., 1995; Young 1989) and (c) the no tillage practice which is often found under the tree canopy. Young (1989) considered that tillage increases Soil Organic Matter oxidation by disrupting soil aggregates, exposing new surfaces to microbial attack, and changing redox conditions within the soil profile. In contrast, outside the tree canopy, SOM is quickly oxidized due to high intensity of cultivation. It has also been observed that key soil fauna groups such as earth worms and termites find a suitable habitat under the tree litter. These fauna perform their roles as regulators of decomposition, nutrient cycling, SOM formation and soil structure improvement (Young, 1989). On the contrary, soil conditions outside the tree canopy are not favourable for these fauna, hence, the observed trend in Soil Organic Matter. It can therefore be inferred that the expected higher coffee yields under tree canopy are partly due to the higher SOM accumulation in the soil often associated with higher soil productivity particularly in the tropical soils. Soil organic matter is known to be the reservoir of nutrients; it improves physical properties such as structure and water holding capacity (Swift, 1984). It also increases cation exchange capacity, as well as detoxification of certain phytotoxic elements such as Al 3+ (Sanchez, 1976). The observation that K+, Mg2+ and Ca2+ reduced with increasing distance from the trunk can be explained by a similar decrease in SOM (Young, 1989; Campbell et al., 1991; Kellman, 1980). The decrease in soil exchangeable bases with increasing distance from the trunk could have contributed to a decrease of pH with increasing distance from the tree trunks
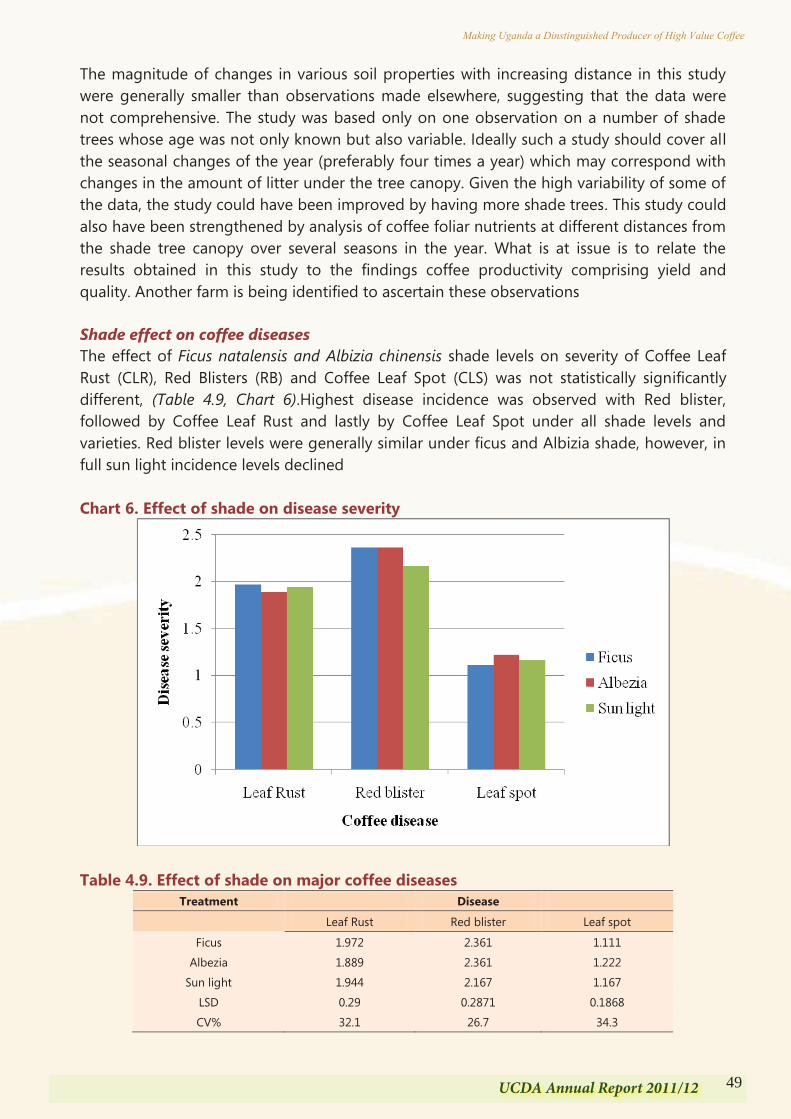
49UCDA Annual Report 2011/12
Making Uganda a Dinstinguished Producer of High Value Coffee
The data indicate that there were generally high nutrient levels under shade tree species of Ficus natalensis and Albizia chinensis than in the open including lowering of pH. This was true for both species for pH, organic matter, calcium, and potassium. However whereas there was high level of magnesium under Ficus canopy this was the opposite for Albizia for which no explanation can be offered. Similarly whereas there was higher level of phosphate under Albizia canopy compared to the open in the case of Ficus this was vice versa. Okia et al (1999) found decreasing levels of organic matter, potassium, calcium and magnesium with increasing distance from the canopy of Ficus mucosa at 0-15 cm soil depth (top soil) as was the case for Ficus natalensis and partially for Albizia chinensis in the study. They did not observe a similar effect for phosphate and total nitrogen the latter of which we did not assess in our study. The higher content of Soil Organic Matter under tree canopy than outside it has been construed by Okia et al (1999) as a natural phenomenon reflecting that trees input organic matter into the soil system through litter fall and decay. Similar increases in soil organic matter have been reported for tree species canopies such as Faidhebia albida (Felker, 1989), Azadirachta indica (Randwanski and Wickens, 1981) and Prunus capuli (Altieri et al.,1987). Among the reasons advanced for increased soil organic matter under tree canopy are a) the provision by the tree of mild temperatures and humid conditions which are favourable for fast decomposition of organic materials, hence leading to integration and accumulation of Soil Organic Matter (Okia et al., 1999), (b)addition to soil from excreta by animals and birds that perch and feed on the tree products ( Katende et al., 1995; Young 1989) and (c) the no tillage practice which is often found under the tree canopy. Young (1989) considered that tillage increases Soil Organic Matter oxidation by disrupting soil aggregates, exposing new surfaces to microbial attack, and changing redox conditions within the soil profile. In contrast, outside the tree canopy, SOM is quickly oxidized due to high intensity of cultivation. It has also been observed that key soil fauna groups such as earth worms and termites find a suitable habitat under the tree litter. These fauna perform their roles as regulators of decomposition, nutrient cycling, SOM formation and soil structure improvement (Young, 1989). On the contrary, soil conditions outside the tree canopy are not favourable for these fauna, hence, the observed trend in Soil Organic Matter. It can therefore be inferred that the expected higher coffee yields under tree canopy are partly due to the higher SOM accumulation in the soil often associated with higher soil productivity particularly in the tropical soils. Soil organic matter is known to be the reservoir of nutrients; it improves physical properties such as structure and water holding capacity (Swift, 1984). It also increases cation exchange capacity, as well as detoxification of certain phytotoxic elements such as Al 3+ (Sanchez, 1976). The observation that K+, Mg2+ and Ca2+ reduced with increasing distance from the trunk can be explained by a similar decrease in SOM (Young, 1989; Campbell et al., 1991; Kellman, 1980). The decrease in soil exchangeable bases with increasing distance from the trunk could have contributed to a decrease of pH with increasing distance from the tree trunks
The magnitude of changes in various soil properties with increasing distance in this study were generally smaller than observations made elsewhere, suggesting that the data were not comprehensive. The study was based only on one observation on a number of shade trees whose age was not only known but also variable. Ideally such a study should cover all the seasonal changes of the year (preferably four times a year) which may correspond with changes in the amount of litter under the tree canopy. Given the high variability of some of the data, the study could have been improved by having more shade trees. This study could also have been strengthened by analysis of coffee foliar nutrients at different distances from the shade tree canopy over several seasons in the year. What is at issue is to relate the results obtained in this study to the findings coffee productivity comprising yield and quality. Another farm is being identified to ascertain these observations Shade effect on coffee diseases The effect of Ficus natalensis and Albizia chinensis shade levels on severity of Coffee Leaf Rust (CLR), Red Blisters (RB) and Coffee Leaf Spot (CLS) was not statistically significantly different, (Table 4.9, Chart 6).Highest disease incidence was observed with Red blister, followed by Coffee Leaf Rust and lastly by Coffee Leaf Spot under all shade levels and varieties. Red blister levels were generally similar under ficus and Albizia shade, however, in full sun light incidence levels declined Chart 6. Effect of shade on disease severity
Table 4.9. Effect of shade on major coffee diseases
Treatment Disease
Leaf Rust Red blister Leaf spot
Ficus 1.972 2.361 1.111
Albezia 1.889 2.361 1.222
Sun light 1.944 2.167 1.167
LSD 0.29 0.2871 0.1868
CV% 32.1 26.7 34.3

50 UCDA Annual Report 2011/12
Making Uganda a Dinstinguished Producer of High Value Coffee
Coffee Leaf Rust was generally highest in coffee trees under ficus shade (1.972), followed by trees under full sunlight (1.944) and least under albezia shade (1.889) as indicated in table 4.9 Coffee Leaf Spot incidence was highest under full sun light (1.167), then followed by albizia shade (1.222) and lastly ficus shade (1.111) Effect of shade on coffee productivity and quality Productivity was determined by collecting yield data from experimental coffee trees located under shade and where there were no shade conditions. Ripe cherries were handpicked, dried to kiboko and hulled to obtain green coffee. Yield was measured gravimetrically. Green coffee was cleaned of all bean defects including; floaters, shells, insect damage, broken, dry cherry, stinkers, malformed, black and half black beans to standardize bean size for roasting (Uniform), brewing and liquoring. Bean size was determined using standard screen of sizes 20, 18, 17, 15, 14 and 12. Clean coffee beans were roasted, ground, brewed liquor tested by a panel of experts following Coffee Quality Institute (www.coffeeinstitute.org) protocols. The data on coffee productivity and quality was analyzed and compared using ANOVA (Gens tat data analytical package). Shade condition did not have any significant effect on yield (Table 4.10) and insect infestation was prominent in unshaded coffee (Sun) conditions and statistically significant at P<0.05. There was no significant specific effect of individual shade tree species on Robusta productivity and quality under the canopy.
Table 4.10: Influence of shade on coffee yield
Shade Yield Variables (g)
Cherry Kiboko Green Coffee Out Turn Insect Damage Bean Diameter Albizia 1408.9 551.25 291.44 52.331 23.482 6.985 Ficus 1313.4 530.72 282.22 53.273 25.738 6.989 No Shade 1176.4 483.9 253.63 52.226 31.273* 6.84 LSD 352.4 155.2 88.43 3.929 7.145 0.303 CV % 32.7 35.8 38.6 9 31.8 5.2
* Statistically significant at P<0.05
Influence of shade on quality: Shade condition and varietal differences did not have any significant contribution on coffee bean size/diameter. However, there was some shade influence on liquor, coffee under Ficus canopy generated some degree of superior cup, though both conditions fall in the same quality grade of 7 to 7.75 (Very Good). Table 4.11: Influence of shade on cup quality
Shade Quality Parameters Aroma Flavor A .T M .F B/S Bal. S S/A O.S Albizia 7.2 7.1 7.2 7 7.1 7.3 7.6 7 7.2 Ficus 7.3 7.2 7.1 7.3 7.1 7.3 8 6.9 7.3 Un-shaded 7.2 7.2 6.7 7.2 7.1 7.4 7.3 6.7 7.1
A.T = after taste; S = Softness; 6-6.75 = good; 8.8-9.75 = outstanding M.F = Mouth feel; S/A = Salt/Acid; 6-7-75= very good; B/S = Bitter/Sweet; O.S = Overall score 7.8-8.75 =excellent;
51UCDA Annual Report 2011/12
Making Uganda a Dinstinguished Producer of High Value Coffee
Coffee Leaf Rust was generally highest in coffee trees under ficus shade (1.972), followed by trees under full sunlight (1.944) and least under albezia shade (1.889) as indicated in table 4.9 Coffee Leaf Spot incidence was highest under full sun light (1.167), then followed by albizia shade (1.222) and lastly ficus shade (1.111) Effect of shade on coffee productivity and quality Productivity was determined by collecting yield data from experimental coffee trees located under shade and where there were no shade conditions. Ripe cherries were handpicked, dried to kiboko and hulled to obtain green coffee. Yield was measured gravimetrically. Green coffee was cleaned of all bean defects including; floaters, shells, insect damage, broken, dry cherry, stinkers, malformed, black and half black beans to standardize bean size for roasting (Uniform), brewing and liquoring. Bean size was determined using standard screen of sizes 20, 18, 17, 15, 14 and 12. Clean coffee beans were roasted, ground, brewed liquor tested by a panel of experts following Coffee Quality Institute (www.coffeeinstitute.org) protocols. The data on coffee productivity and quality was analyzed and compared using ANOVA (Gens tat data analytical package). Shade condition did not have any significant effect on yield (Table 4.10) and insect infestation was prominent in unshaded coffee (Sun) conditions and statistically significant at P<0.05. There was no significant specific effect of individual shade tree species on Robusta productivity and quality under the canopy.
Table 4.10: Influence of shade on coffee yield
Shade Yield Variables (g)
Cherry Kiboko Green Coffee Out Turn Insect Damage Bean Diameter Albizia 1408.9 551.25 291.44 52.331 23.482 6.985 Ficus 1313.4 530.72 282.22 53.273 25.738 6.989 No Shade 1176.4 483.9 253.63 52.226 31.273* 6.84 LSD 352.4 155.2 88.43 3.929 7.145 0.303 CV % 32.7 35.8 38.6 9 31.8 5.2
* Statistically significant at P<0.05
Influence of shade on quality: Shade condition and varietal differences did not have any significant contribution on coffee bean size/diameter. However, there was some shade influence on liquor, coffee under Ficus canopy generated some degree of superior cup, though both conditions fall in the same quality grade of 7 to 7.75 (Very Good). Table 4.11: Influence of shade on cup quality
Shade Quality Parameters Aroma Flavor A .T M .F B/S Bal. S S/A O.S Albizia 7.2 7.1 7.2 7 7.1 7.3 7.6 7 7.2 Ficus 7.3 7.2 7.1 7.3 7.1 7.3 8 6.9 7.3 Un-shaded 7.2 7.2 6.7 7.2 7.1 7.4 7.3 6.7 7.1
A.T = after taste; S = Softness; 6-6.75 = good; 8.8-9.75 = outstanding M.F = Mouth feel; S/A = Salt/Acid; 6-7-75= very good; B/S = Bitter/Sweet; O.S = Overall score 7.8-8.75 =excellent;
There was no significant variation in liquor under shade and no shade since they all ranged in the same quality scale (Table. 4,11). The effect of shade on yield and quality was not detected because the trial was carried out on only one already existing farm and old coffee. The studies could be tried in more sites to validate these findings. On-station studies on effect of shade on yield, quality, soil fertility, soil Ph, and incidence and severity of diseases and insect pests The aim of this trial, which is being conducted at Kituza, is to verify on-farm findings about the effect of different tree species on Robusta coffee yield, quality and disease and pest incidences and severity for different coffee varieties. Plant materials The trial was planted using six (6) none commissioned coffee wilt disease (CWD) resistant Robusta coffee lines, which are interplanted with four (4) shade tree species i.e. Granville Robusta, Ficus natelensis, Albizia chinensis and Albizia coriaria) in three replicates (Table 4.12). The six Robusta coffee lines were chosen because they are resistant to coffee wilt disease and therefore they are expected to live up to the time when the shade trees are mature enough to show their effects. CWD is a serious problem to non-resistance Robusta coffee materials. The coffee planting materials were raised as clones by rooting cuttings following the routine procedures. The shade tree species were chosen because they are the most commonly used by farmers and they are being recommended to farmers by the coffee development agencies. Open pollinated seedlings of the trees purchase from private nursery operators were used. Field layout The trial was planted at Kituza in April 2009, in a field void of other trees and coffee plants. The experimental field was divided into three replicates, with the replicates running along contours. Each replicate was divided into 5 plots. The shade tree species were randomly assigned to the plots. Each plot was planted with 36 coffee trees in a mixture of the six varieties in equal proportion (Chart 7;(6 trees per variety)). The coffee trees were planted at a spacing of 3 metres by 3 metres, which is the recommended spacing of Robusta coffee in Uganda. Within the gaps of the coffee trees in each plot, trees of the signed shade tree species were planted at a spacing of 6 meters by 6 metres. This shade tree density was designed to provide early shade and it is anticipated that some trees will be rouged out as the trees mature. Table 4.12: Field layout
Replicates Plot 1 Plot 1 Plot 3 Plot 4 Plot 5 Block 1 Gravillea robust Ficus
natenlensis Albizia chinensis
Albizia coriaria
No shad tree (control)
Block 2 Ficus natenlensis
Albizia coriaria
No shade tree (control)
Albizia chinensis
Gravillea robust
Block 3 Control Albizia chinensis
Gravillea robust
Albizia coriaria
Ficus natenlensis
Key: Shaded border areas are planted with two lines of coffee guard rows
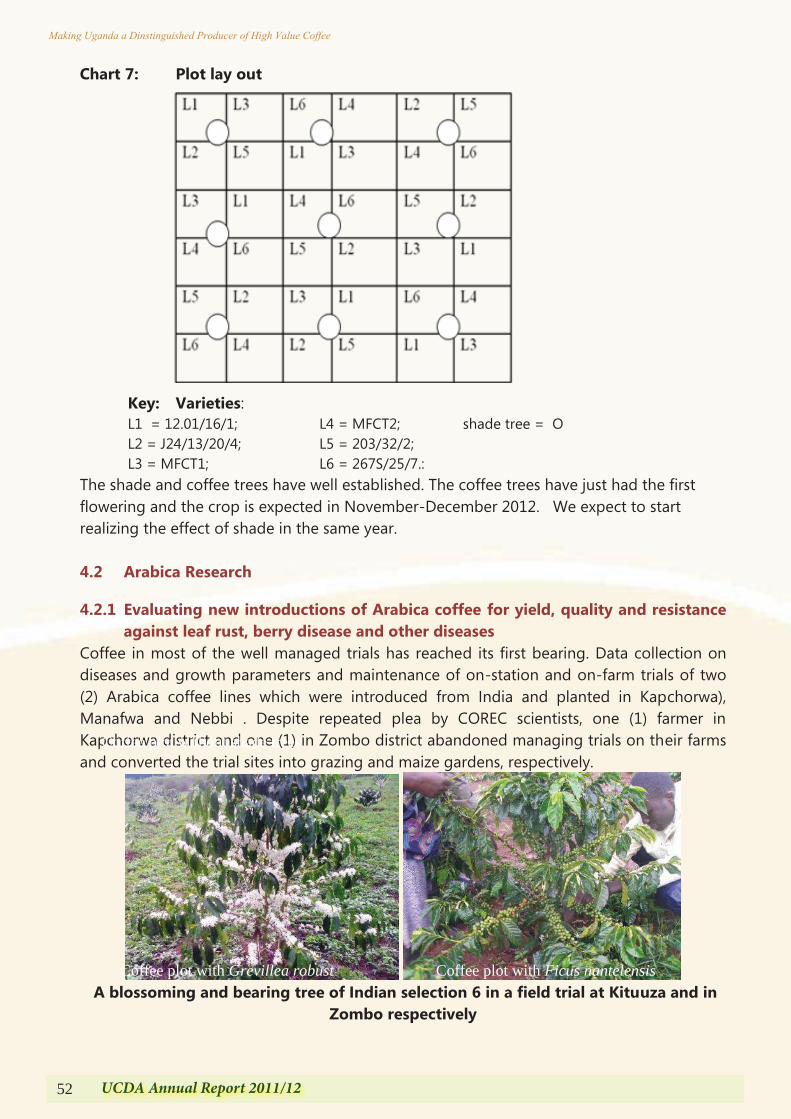
52 UCDA Annual Report 2011/12
Making Uganda a Dinstinguished Producer of High Value Coffee
Chart 7: Plot lay out
Key: Varieties: L1 = 12.01/16/1; L4 = MFCT2; shade tree = O L2 = J24/13/20/4; L5 = 203/32/2; L3 = MFCT1; L6 = 267S/25/7.:
The shade and coffee trees have well established. The coffee trees have just had the first flowering and the crop is expected in November-December 2012. We expect to start realizing the effect of shade in the same year. 4.2 Arabica Research
4.2.1 Evaluating new introductions of Arabica coffee for yield, quality and resistance against leaf rust, berry disease and other diseases
Coffee in most of the well managed trials has reached its first bearing. Data collection on diseases and growth parameters and maintenance of on-station and on-farm trials of two (2) Arabica coffee lines which were introduced from India and planted in Kapchorwa), Manafwa and Nebbi . Despite repeated plea by COREC scientists, one (1) farmer in Kapchorwa district and one (1) in Zombo district abandoned managing trials on their farms and converted the trial sites into grazing and maize gardens, respectively.
A blossoming and bearing tree of Indian selection 6 in a field trial at Kituuza and in
Zombo respectively
Coffee plot without shade trees
Coffee plot with Grevillea robust Coffee plot with Ficus nantelensis
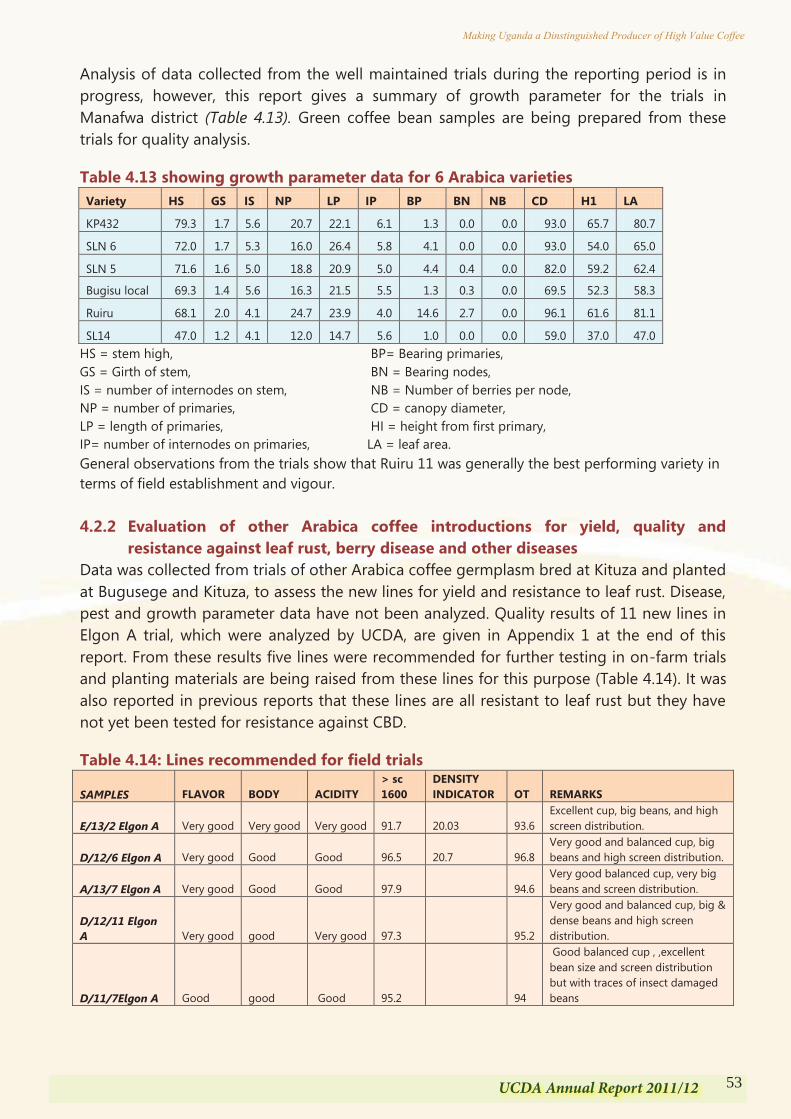
53UCDA Annual Report 2011/12
Making Uganda a Dinstinguished Producer of High Value Coffee
Chart 7: Plot lay out
Key: Varieties: L1 = 12.01/16/1; L4 = MFCT2; shade tree = O L2 = J24/13/20/4; L5 = 203/32/2; L3 = MFCT1; L6 = 267S/25/7.:
The shade and coffee trees have well established. The coffee trees have just had the first flowering and the crop is expected in November-December 2012. We expect to start realizing the effect of shade in the same year. 4.2 Arabica Research
4.2.1 Evaluating new introductions of Arabica coffee for yield, quality and resistance against leaf rust, berry disease and other diseases
Coffee in most of the well managed trials has reached its first bearing. Data collection on diseases and growth parameters and maintenance of on-station and on-farm trials of two (2) Arabica coffee lines which were introduced from India and planted in Kapchorwa), Manafwa and Nebbi . Despite repeated plea by COREC scientists, one (1) farmer in Kapchorwa district and one (1) in Zombo district abandoned managing trials on their farms and converted the trial sites into grazing and maize gardens, respectively.
A blossoming and bearing tree of Indian selection 6 in a field trial at Kituuza and in
Zombo respectively
Coffee plot without shade trees
Coffee plot with Grevillea robust Coffee plot with Ficus nantelensis
Analysis of data collected from the well maintained trials during the reporting period is in progress, however, this report gives a summary of growth parameter for the trials in Manafwa district (Table 4.13). Green coffee bean samples are being prepared from these trials for quality analysis.
Table 4.13 showing growth parameter data for 6 Arabica varieties Variety HS GS IS NP LP IP BP BN NB CD H1 LA
KP432 79.3 1.7 5.6 20.7 22.1 6.1 1.3 0.0 0.0 93.0 65.7 80.7
SLN 6 72.0 1.7 5.3 16.0 26.4 5.8 4.1 0.0 0.0 93.0 54.0 65.0
SLN 5 71.6 1.6 5.0 18.8 20.9 5.0 4.4 0.4 0.0 82.0 59.2 62.4
Bugisu local 69.3 1.4 5.6 16.3 21.5 5.5 1.3 0.3 0.0 69.5 52.3 58.3
Ruiru 68.1 2.0 4.1 24.7 23.9 4.0 14.6 2.7 0.0 96.1 61.6 81.1
SL14 47.0 1.2 4.1 12.0 14.7 5.6 1.0 0.0 0.0 59.0 37.0 47.0 HS = stem high, BP= Bearing primaries, GS = Girth of stem, BN = Bearing nodes, IS = number of internodes on stem, NB = Number of berries per node, NP = number of primaries, CD = canopy diameter, LP = length of primaries, HI = height from first primary, IP= number of internodes on primaries, LA = leaf area. General observations from the trials show that Ruiru 11 was generally the best performing variety in terms of field establishment and vigour. 4.2.2 Evaluation of other Arabica coffee introductions for yield, quality and
resistance against leaf rust, berry disease and other diseases Data was collected from trials of other Arabica coffee germplasm bred at Kituza and planted at Bugusege and Kituza, to assess the new lines for yield and resistance to leaf rust. Disease, pest and growth parameter data have not been analyzed. Quality results of 11 new lines in Elgon A trial, which were analyzed by UCDA, are given in Appendix 1 at the end of this report. From these results five lines were recommended for further testing in on-farm trials and planting materials are being raised from these lines for this purpose (Table 4.14). It was also reported in previous reports that these lines are all resistant to leaf rust but they have not yet been tested for resistance against CBD.
Table 4.14: Lines recommended for field trials
SAMPLES FLAVOR BODY ACIDITY > sc 1600
DENSITY INDICATOR OT REMARKS
E/13/2 Elgon A Very good Very good Very good 91.7 20.03 93.6 Excellent cup, big beans, and high screen distribution.
D/12/6 Elgon A Very good Good Good 96.5 20.7 96.8 Very good and balanced cup, big beans and high screen distribution.
A/13/7 Elgon A Very good Good Good 97.9 94.6 Very good balanced cup, very big beans and screen distribution.
D/12/11 Elgon A Very good good Very good 97.3 95.2
Very good and balanced cup, big & dense beans and high screen distribution.
D/11/7Elgon A Good good Good 95.2 94
Good balanced cup , ,excellent bean size and screen distribution but with traces of insect damaged beans
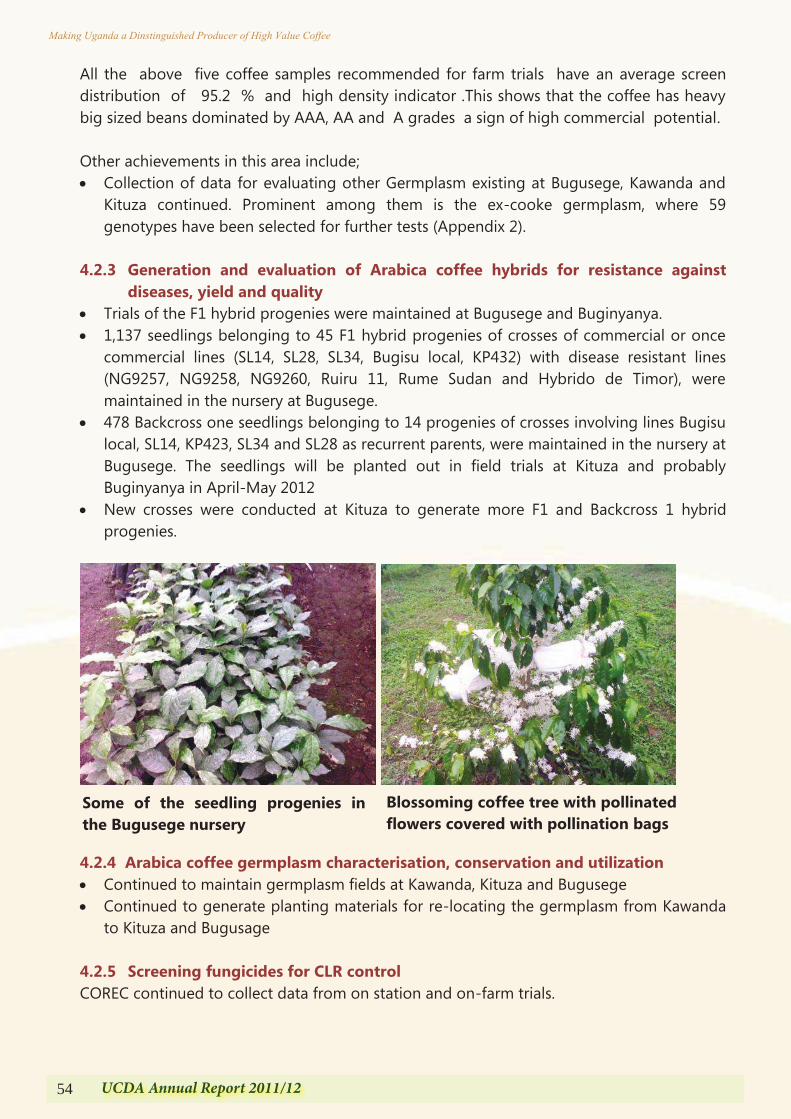
54 UCDA Annual Report 2011/12
Making Uganda a Dinstinguished Producer of High Value Coffee
All the above five coffee samples recommended for farm trials have an average screen distribution of 95.2 % and high density indicator .This shows that the coffee has heavy big sized beans dominated by AAA, AA and A grades a sign of high commercial potential. Other achievements in this area include; Collection of data for evaluating other Germplasm existing at Bugusege, Kawanda and
Kituza continued. Prominent among them is the ex-cooke germplasm, where 59 genotypes have been selected for further tests (Appendix 2).
4.2.3 Generation and evaluation of Arabica coffee hybrids for resistance against diseases, yield and quality
Trials of the F1 hybrid progenies were maintained at Bugusege and Buginyanya. 1,137 seedlings belonging to 45 F1 hybrid progenies of crosses of commercial or once
commercial lines (SL14, SL28, SL34, Bugisu local, KP432) with disease resistant lines (NG9257, NG9258, NG9260, Ruiru 11, Rume Sudan and Hybrido de Timor), were maintained in the nursery at Bugusege.
478 Backcross one seedlings belonging to 14 progenies of crosses involving lines Bugisu local, SL14, KP423, SL34 and SL28 as recurrent parents, were maintained in the nursery at Bugusege. The seedlings will be planted out in field trials at Kituza and probably Buginyanya in April-May 2012
New crosses were conducted at Kituza to generate more F1 and Backcross 1 hybrid progenies.
4.2.4 Arabica coffee germplasm characterisation, conservation and utilization Continued to maintain germplasm fields at Kawanda, Kituza and Bugusege Continued to generate planting materials for re-locating the germplasm from Kawanda
to Kituza and Bugusage
4.2.5 Screening fungicides for CLR control COREC continued to collect data from on station and on-farm trials.
Some of the seedling progenies in the Bugusege nursery
Blossoming coffee tree with pollinated flowers covered with pollination bags
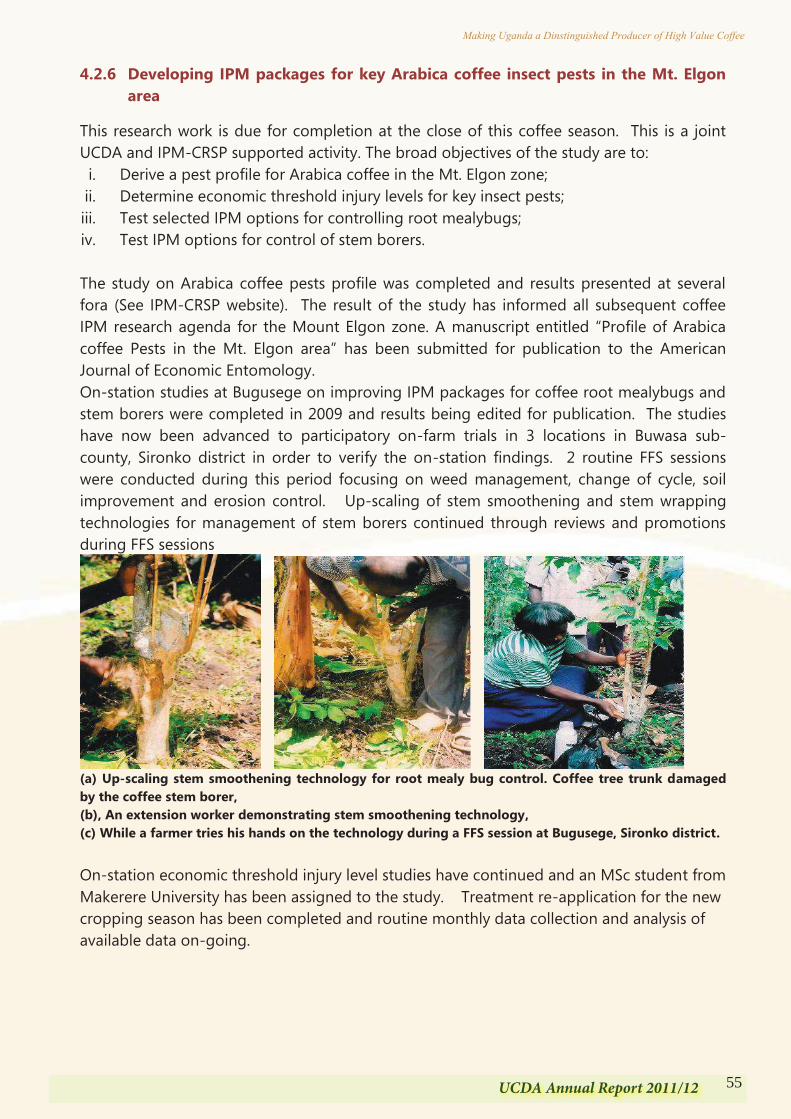
55UCDA Annual Report 2011/12
Making Uganda a Dinstinguished Producer of High Value Coffee
All the above five coffee samples recommended for farm trials have an average screen distribution of 95.2 % and high density indicator .This shows that the coffee has heavy big sized beans dominated by AAA, AA and A grades a sign of high commercial potential. Other achievements in this area include; Collection of data for evaluating other Germplasm existing at Bugusege, Kawanda and
Kituza continued. Prominent among them is the ex-cooke germplasm, where 59 genotypes have been selected for further tests (Appendix 2).
4.2.3 Generation and evaluation of Arabica coffee hybrids for resistance against diseases, yield and quality
Trials of the F1 hybrid progenies were maintained at Bugusege and Buginyanya. 1,137 seedlings belonging to 45 F1 hybrid progenies of crosses of commercial or once
commercial lines (SL14, SL28, SL34, Bugisu local, KP432) with disease resistant lines (NG9257, NG9258, NG9260, Ruiru 11, Rume Sudan and Hybrido de Timor), were maintained in the nursery at Bugusege.
478 Backcross one seedlings belonging to 14 progenies of crosses involving lines Bugisu local, SL14, KP423, SL34 and SL28 as recurrent parents, were maintained in the nursery at Bugusege. The seedlings will be planted out in field trials at Kituza and probably Buginyanya in April-May 2012
New crosses were conducted at Kituza to generate more F1 and Backcross 1 hybrid progenies.
4.2.4 Arabica coffee germplasm characterisation, conservation and utilization Continued to maintain germplasm fields at Kawanda, Kituza and Bugusege Continued to generate planting materials for re-locating the germplasm from Kawanda
to Kituza and Bugusage
4.2.5 Screening fungicides for CLR control COREC continued to collect data from on station and on-farm trials.
Some of the seedling progenies in the Bugusege nursery
Blossoming coffee tree with pollinated flowers covered with pollination bags
4.2.6 Developing IPM packages for key Arabica coffee insect pests in the Mt. Elgon area
This research work is due for completion at the close of this coffee season. This is a joint UCDA and IPM-CRSP supported activity. The broad objectives of the study are to: i. Derive a pest profile for Arabica coffee in the Mt. Elgon zone; ii. Determine economic threshold injury levels for key insect pests; iii. Test selected IPM options for controlling root mealybugs; iv. Test IPM options for control of stem borers. The study on Arabica coffee pests profile was completed and results presented at several fora (See IPM-CRSP website). The result of the study has informed all subsequent coffee IPM research agenda for the Mount Elgon zone. A manuscript entitled “Profile of Arabica coffee Pests in the Mt. Elgon area” has been submitted for publication to the American Journal of Economic Entomology. On-station studies at Bugusege on improving IPM packages for coffee root mealybugs and stem borers were completed in 2009 and results being edited for publication. The studies have now been advanced to participatory on-farm trials in 3 locations in Buwasa sub-county, Sironko district in order to verify the on-station findings. 2 routine FFS sessions were conducted during this period focusing on weed management, change of cycle, soil improvement and erosion control. Up-scaling of stem smoothening and stem wrapping technologies for management of stem borers continued through reviews and promotions during FFS sessions
(a) Up-scaling stem smoothening technology for root mealy bug control. Coffee tree trunk damaged by the coffee stem borer, (b), An extension worker demonstrating stem smoothening technology, (c) While a farmer tries his hands on the technology during a FFS session at Bugusege, Sironko district. On-station economic threshold injury level studies have continued and an MSc student from Makerere University has been assigned to the study. Treatment re-application for the new cropping season has been completed and routine monthly data collection and analysis of available data on-going.
56 UCDA Annual Report 2011/12
Making Uganda a Dinstinguished Producer of High Value Coffee
Biological and ecological studies of the coffee berry borer (Hypothenemus hampei Ferrari), and 3 of its natural enemies endemic to the Uganda coffee agro-ecologies (Prorops nasuta Waterston; Heterospilus coffeicola Schmied and Phymasticus coffeae La Salle) that aims to develop and apply a comprehensive bio-control programme for the pest in Uganda was suspended during this period due to the urgent need to attend to the BCTB out-break. The activities are however to resume soon. (Activity co-funded by UCDA and NARO, with funds from UCDA covering field research activities and NARO covers laboratory bio-assay studies)
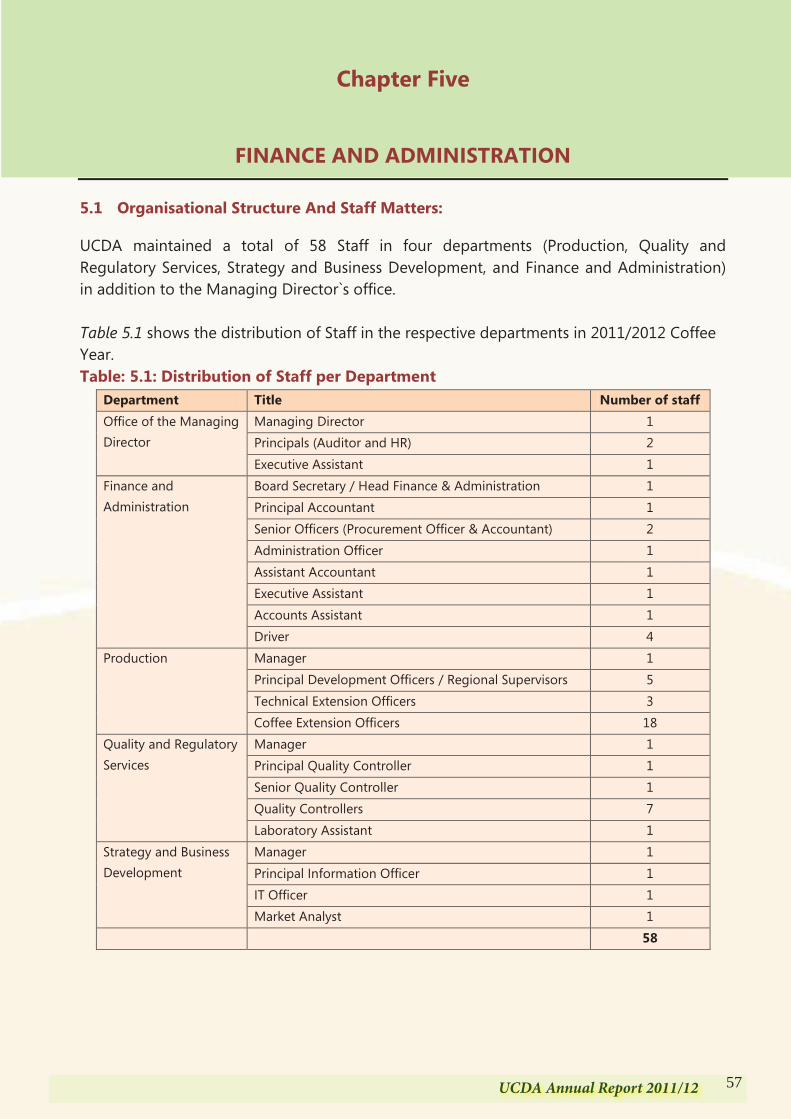
57UCDA Annual Report 2011/12
Making Uganda a Dinstinguished Producer of High Value Coffee
Biological and ecological studies of the coffee berry borer (Hypothenemus hampei Ferrari), and 3 of its natural enemies endemic to the Uganda coffee agro-ecologies (Prorops nasuta Waterston; Heterospilus coffeicola Schmied and Phymasticus coffeae La Salle) that aims to develop and apply a comprehensive bio-control programme for the pest in Uganda was suspended during this period due to the urgent need to attend to the BCTB out-break. The activities are however to resume soon. (Activity co-funded by UCDA and NARO, with funds from UCDA covering field research activities and NARO covers laboratory bio-assay studies)
Chapter Five
FINANCE AND ADMINISTRATION
5.1 Organisational Structure And Staff Matters:
UCDA maintained a total of 58 Staff in four departments (Production, Quality and Regulatory Services, Strategy and Business Development, and Finance and Administration) in addition to the Managing Director`s office. Table 5.1 shows the distribution of Staff in the respective departments in 2011/2012 Coffee Year. Table: 5.1: Distribution of Staff per Department
Department Title Number of staff Office of the Managing Director
Managing Director 1 Principals (Auditor and HR) 2 Executive Assistant 1
Finance and Administration
Board Secretary / Head Finance & Administration 1 Principal Accountant 1 Senior Officers (Procurement Officer & Accountant) 2 Administration Officer 1 Assistant Accountant 1 Executive Assistant 1 Accounts Assistant 1 Driver 4
Production Manager 1 Principal Development Officers / Regional Supervisors 5 Technical Extension Officers 3 Coffee Extension Officers 18
Quality and Regulatory Services
Manager 1 Principal Quality Controller 1 Senior Quality Controller 1 Quality Controllers 7 Laboratory Assistant 1
Strategy and Business Development
Manager 1 Principal Information Officer 1 IT Officer 1 Market Analyst 1
58
58 UCDA Annual Report 2011/12
Making Uganda a Dinstinguished Producer of High Value Coffee
5.2 Staff Training & Workshops The following members of staff were trained: One Quality Controller in standards development and 1 Coffee Extension Officer in Basic
Quality Control. 4 Coffee Extension Officers in certification and verification under the sustainable coffee
program. 2 Executive Assistants in personal career development. 2 Heads of Department (Production, and Strategy and Business Development)
undertook a working visit to Vietnam to benchmark practices in value addition and sustainability of the coffee sector.
54 staff in team building and orientation, and change management. A UCDA team code of honor was developed thereafter.
1 Finance staff attended a workshop on government accounting organized by MFPED. 1 Strategy and Business Development Strategy staff participated in a 2-months e-
learning course on the impact of the global financial and economic crisis and governments‟ response facilitated by the World Bank Institute.
5.3 UCDA Team Code Of Honor
In the continuous effort to satisfy the stakeholders, a team code of honor was developed by Staff to guide internal behavior and working culture, and to promote teamwork. The team resolved to commit to;
Being accountable, transparent, & honest at all times; Supporting, protecting and defending the UCDA team ideals, goals and vision; Meeting all set deadlines and targets; Respecting other people‟s opinions, appreciating and understanding them; Sharing & exchanging ideas in the team and being open to new ideas; Coming to meetings well prepared; Providing feedback to emails, letters, correspondences, missed calls and requests
within 24 hours; Showing interest in what is happening in UCDA.
5.4 Staff Recognition and Award
Staff were recognized and awarded for outstanding performance through the „Employee of the Year‟ initiative. The employee of the year was Mr. Chesang Francis Bhatia. Mr. Apollo Kamugisha and Mrs. Peruth Kasozi were the first and second runners up respectively.
5.5 Board of Directors
As part of its mandate, the Board; Appointed new Officers for the following positions; Regional Coffee Extension Officer
(Kasese and Iganga), Information Technology Officer, Regional Coffee Technical Officer, and Assistant Accountant.
59UCDA Annual Report 2011/12
Making Uganda a Dinstinguished Producer of High Value Coffee
5.2 Staff Training & Workshops The following members of staff were trained: One Quality Controller in standards development and 1 Coffee Extension Officer in Basic
Quality Control. 4 Coffee Extension Officers in certification and verification under the sustainable coffee
program. 2 Executive Assistants in personal career development. 2 Heads of Department (Production, and Strategy and Business Development)
undertook a working visit to Vietnam to benchmark practices in value addition and sustainability of the coffee sector.
54 staff in team building and orientation, and change management. A UCDA team code of honor was developed thereafter.
1 Finance staff attended a workshop on government accounting organized by MFPED. 1 Strategy and Business Development Strategy staff participated in a 2-months e-
learning course on the impact of the global financial and economic crisis and governments‟ response facilitated by the World Bank Institute.
5.3 UCDA Team Code Of Honor
In the continuous effort to satisfy the stakeholders, a team code of honor was developed by Staff to guide internal behavior and working culture, and to promote teamwork. The team resolved to commit to;
Being accountable, transparent, & honest at all times; Supporting, protecting and defending the UCDA team ideals, goals and vision; Meeting all set deadlines and targets; Respecting other people‟s opinions, appreciating and understanding them; Sharing & exchanging ideas in the team and being open to new ideas; Coming to meetings well prepared; Providing feedback to emails, letters, correspondences, missed calls and requests
within 24 hours; Showing interest in what is happening in UCDA.
5.4 Staff Recognition and Award
Staff were recognized and awarded for outstanding performance through the „Employee of the Year‟ initiative. The employee of the year was Mr. Chesang Francis Bhatia. Mr. Apollo Kamugisha and Mrs. Peruth Kasozi were the first and second runners up respectively.
5.5 Board of Directors
As part of its mandate, the Board; Appointed new Officers for the following positions; Regional Coffee Extension Officer
(Kasese and Iganga), Information Technology Officer, Regional Coffee Technical Officer, and Assistant Accountant.
Held 14 meetings where they considered the annual report for the CY 2010/11, the National Coffee Strategy, budget estimates and work plans for coffee year 2012/13, 2010/11 management letters and risk assessment report, Revised Financial Procedures and Accounting Manual, performance measurement instrument (BSC) for senior staff, and a board self-evaluation tool.
Approved a car loan insurance facility to ease facilitation of staff with transport. Renewed employment contracts for the Principal Development Officer (Northern
Region) and the Principal Accountant. The Board Committees were reviewed and restructured whereby the Technical Committee, and the Promotion and Value Addition Committee were merged into Technical Programmes Committee. The following committees were constituted;
Audit Committee Finance and Policy Committee Technical Programmes Committee
A retreat was held for the Directors to evaluate their performance, and to reflect on the sub-sector challenges. Specific recommendations were made to the line Ministry. 5.6 International Meetings/Conferences
Uganda participated in the international coffee arena and the Managing Director UCDA Mr. Henry Ngabirano was elected as the Chairperson of the International Coffee Council for the Coffee Year 2011/2012.
Uganda participated in the following meetings and conferences; 107th ICO Council session meetings. ICO General meeting. The 50th IACO Annual general meeting where Uganda fielded a candidate for the
position of IACO General Secretary. The UCDA Board, MAAIF and NARO Scientists attended the 1st Scientific conference on
Robusta Coffee in Brazil. At all these fora, Uganda was recognized as the Centre of Excellence for Robusta coffee.
5.7 Management Of Assets
A consultancy was initiated for the redevelopment and regeneration of selected UCDA properties.
Maintenance and repair of buildings and equipment was undertaken. The existing fleet of 7 vehicles and 19 motor cycles was regularly serviced and
maintained in good running condition. 6 motor cycles were procured to replace an ageing fleet. A new generator was purchased for Lugogo Laboratory.
60 UCDA Annual Report 2011/12
Making Uganda a Dinstinguished Producer of High Value Coffee
5.8 Shared Corporate Value, Memberships and Subscriptions
We continued to strengthen our commitment to corporate social responsibility by supporting institutions and the local communities through; Donation of primary school Geography textbooks with coffee tailored information to
primary schools in Nyakishenyi. Internship program that benefitted 17 students from Institutions of higher learning. Participation in corporate league activities. Subscription and membership to; Café Mundi, SCAA, SCAE, EAFCA, Institute of Corporate
Governance, UMA, Corporate league and Federation of Uganda Employers. Support was extended to the following: Kick-Polio campaign, donation to SEHTICAL for
improving sanitation and to projects of faith based organizations.
5.9 Monitoring And Evaluation
Monitoring and evaluation activities were carried out as follows; The Board made a visit to Northern Uganda to; evaluate the progress of coffee growing
in Northern Uganda, and assess farmers‟ adaptability to growing coffee as an alternative crop. The following districts were visited; Zombo, Gulu , Lira and Nwoya.
The Audit Committee of the Board travelled to China to review the performance of the Beijing – Chenao Coffee Company Limited (Joint Venture Company) and coffee market penetration efforts in the Far East.
Routine monitoring and evaluation exercises in the 5 coffee regions were done to assess implementation of programmes and identify gaps that need strategic interventions.
61UCDA Annual Report 2011/12
Making Uganda a Dinstinguished Producer of High Value Coffee
5.8 Shared Corporate Value, Memberships and Subscriptions
We continued to strengthen our commitment to corporate social responsibility by supporting institutions and the local communities through; Donation of primary school Geography textbooks with coffee tailored information to
primary schools in Nyakishenyi. Internship program that benefitted 17 students from Institutions of higher learning. Participation in corporate league activities. Subscription and membership to; Café Mundi, SCAA, SCAE, EAFCA, Institute of Corporate
Governance, UMA, Corporate league and Federation of Uganda Employers. Support was extended to the following: Kick-Polio campaign, donation to SEHTICAL for
improving sanitation and to projects of faith based organizations.
5.9 Monitoring And Evaluation
Monitoring and evaluation activities were carried out as follows; The Board made a visit to Northern Uganda to; evaluate the progress of coffee growing
in Northern Uganda, and assess farmers‟ adaptability to growing coffee as an alternative crop. The following districts were visited; Zombo, Gulu , Lira and Nwoya.
The Audit Committee of the Board travelled to China to review the performance of the Beijing – Chenao Coffee Company Limited (Joint Venture Company) and coffee market penetration efforts in the Far East.
Routine monitoring and evaluation exercises in the 5 coffee regions were done to assess implementation of programmes and identify gaps that need strategic interventions.
Making Uganda a Distinguished Producer of High Value Coffee 43
Uganda Coffee Development Authority ANNUAL REPORT 2010 - 2011
Making Uganda a Distinguished Producer of High Value Coffee
Uganda Coffee Development Authority ANNUAL REPORT 2010 – 2011
39
STATISTICAL APPENDICES
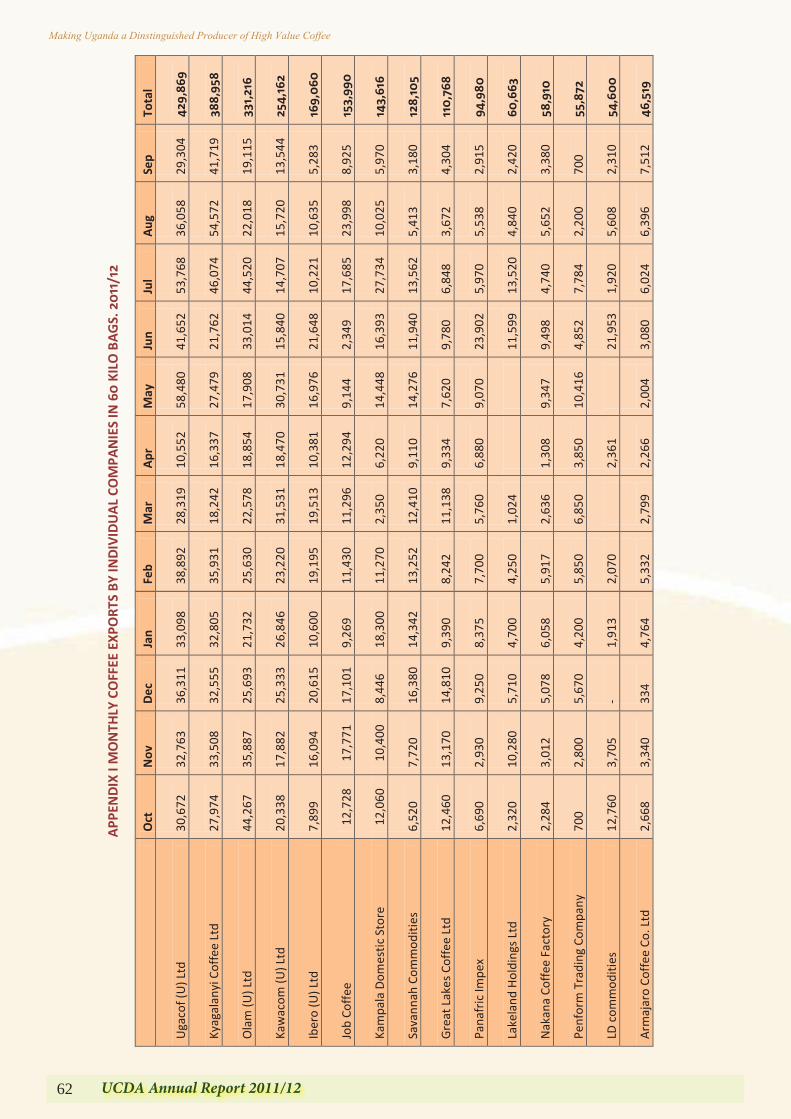
62 UCDA Annual Report 2011/12
Making Uganda a Dinstinguished Producer of High Value Coffee
APP
END
IX I
MO
NTH
LY C
OFF
EE E
XPO
RTS
BY IN
DIV
IDU
AL
COM
PAN
IES
IN 6
0 K
ILO
BA
GS.
20
11/1
2
O
ct
Nov
D
ec
Jan
Feb
Mar
A
pr
May
Ju
n Ju
l A
ug
Sep
Tota
l
Uga
cof (
U) L
td
30
,672
32,7
63
36,3
11
33
,098
38,8
92
28
,319
10,5
52
58,4
80
41,6
52
53
,768
36,0
58
29
,304
429,
869
Kyag
alan
yi C
offe
e Lt
d
27,9
74
33
,508
32
,555
32,8
05
35
,931
18,2
42
16
,337
27
,479
21
,762
46,0
74
54
,572
41,7
19
38
8,95
8
Ola
m (U
) Ltd
44,2
67
35
,887
25
,693
21,7
32
25
,630
22,5
78
18
,854
17
,908
33
,014
44,5
20
22
,018
19,1
15
331,
216
Kaw
acom
(U) L
td
20
,338
17,8
82
25,3
33
26
,846
23,2
20
31
,531
18,4
70
30,7
31
15,8
40
14
,707
15,7
20
13
,544
254,
162
Iber
o (U
) Ltd
7,
899
16,0
94
20,6
15
10
,600
19,1
95
19
,513
10,3
81
16,9
76
21,6
48
10
,221
10,6
35
5,28
3
16
9,0
60
Job
Coffe
e 12
,728
17
,771
17
,101
9,
269
11,4
30
11
,296
12,2
94
9,
144
2,34
9
17
,685
23,9
98
8,92
5
15
3,99
0
Kam
pala
Dom
estic
Sto
re
12,0
60
10,4
00
8,44
6
18,3
00
11,2
70
2,35
0
6,22
0
14
,448
16
,393
27
,734
10,0
25
5,97
0
14
3,61
6
Sava
nnah
Com
mod
ities
6,
520
7,72
0
16,3
80
14
,342
13,2
52
12
,410
9,
110
14
,276
11
,940
13,5
62
5,41
3
3,18
0
128,
105
Grea
t Lak
es C
offe
e Lt
d
12,4
60
13
,170
14
,810
9,
390
8,
242
11,1
38
9,33
4
7,
620
9,78
0
6,84
8
3,67
2
4,30
4
11
0,7
68
Pana
fric
Impe
x
6,
690
2,93
0
9,
250
8,
375
7,
700
5,
760
6,
880
9,07
0
23,9
02
5,97
0
5,53
8
2,91
5
94,9
80
Lake
land
Hol
ding
s Ltd
2,
320
10,2
80
5,
710
4,
700
4,
250
1,
024
11
,599
13,5
20
4,84
0
2,42
0
60,6
63
Nak
ana
Coffe
e Fa
ctor
y
2,
284
3,01
2
5,
078
6,
058
5,
917
2,
636
1,
308
9,34
7
9,
498
4,
740
5,
652
3,
380
58
,910
Penf
orm
Tra
ding
Com
pany
700
2,80
0
5,
670
4,
200
5,
850
6,
850
3,
850
10
,416
4,85
2
7,78
4
2,20
0
70
0
55,8
72
LD c
omm
oditi
es
12
,760
3,70
5
-
1,
913
2,
070
2,36
1
21
,953
1,
920
5,
608
2,
310
54
,60
0
Arm
ajar
o Co
ffee
Co. L
td
2,66
8
3,
340
33
4
4,76
4
5,33
2
2,79
9
2,26
6
2,
004
3,08
0
6,02
4
6,39
6
7,51
2
46,5
19
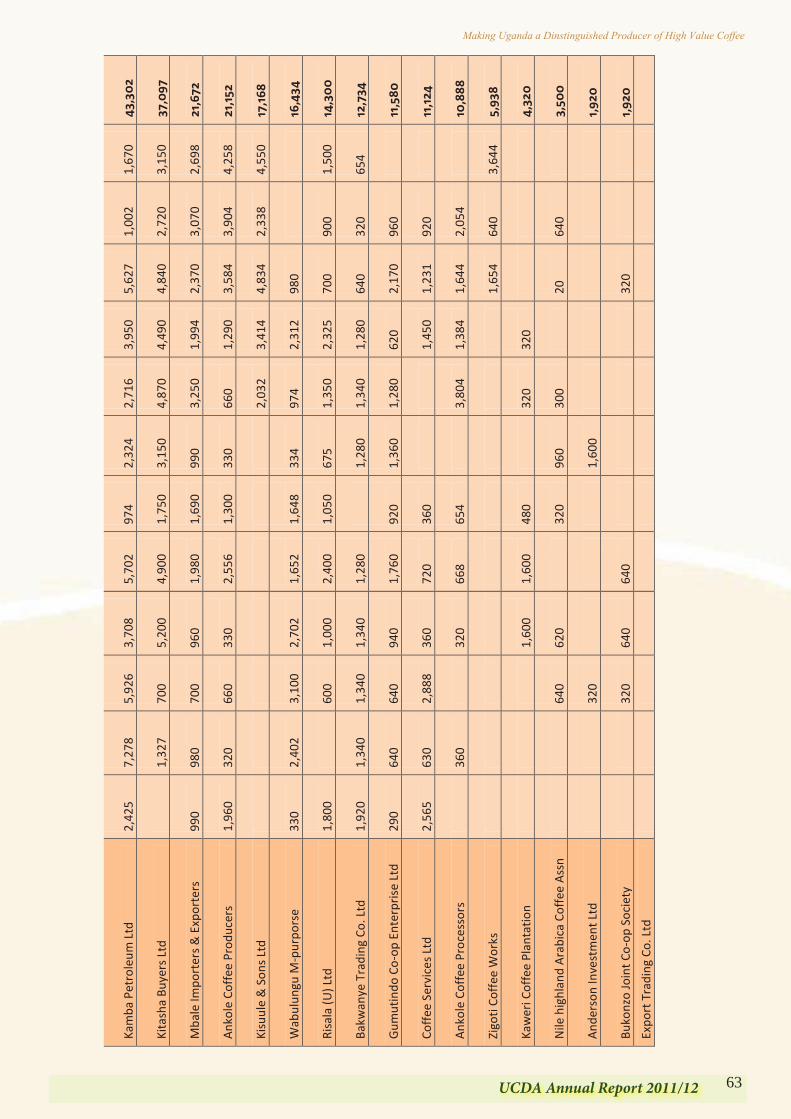
63UCDA Annual Report 2011/12
Making Uganda a Dinstinguished Producer of High Value Coffee
Kam
ba P
etro
leum
Ltd
2,
425
7,27
8
5,
926
3,
708
5,
702
974
2,
324
2,71
6
3,
950
5,
627
1,
002
1,
670
43
,30
2
Kita
sha
Buye
rs L
td
1,32
7
700
5,
200
4,
900
1,
750
3,
150
4,87
0
4,
490
4,
840
2,
720
3,
150
37
,097
Mba
le Im
port
ers &
Exp
orte
rs
99
0
98
0
700
960
1,
980
1,
690
990
3,25
0
1,
994
2,
370
3,
070
2,
698
21
,672
Anko
le C
offe
e Pr
oduc
ers
1,96
0
32
0
660
330
2,
556
1,
300
330
66
0
1,
290
3,
584
3,
904
4,
258
21,1
52
Kisu
ule
& S
ons L
td
2,03
2
3,
414
4,
834
2,
338
4,
550
17
,168
Wab
ulun
gu M
-pur
pors
e
33
0
2,
402
3,10
0
2,70
2
1,65
2
1,64
8
33
4
974
2,31
2
98
0
16,4
34
Risa
la (U
) Ltd
1,
800
600
1,
000
2,
400
1,
050
675
1,35
0
2,
325
700
900
1,
500
14
,30
0
Bakw
anye
Tra
ding
Co.
Ltd
1,
920
1,34
0
1,
340
1,
340
1,
280
1,28
0
1,
340
1,28
0
64
0
32
0
65
4
12,7
34
Gum
utin
do C
o-op
Ent
erpr
ise L
td
29
0
64
0
640
940
1,
760
920
1,
360
1,28
0
620
2,
170
960
11,5
80
Coffe
e Se
rvic
es L
td
2,56
5
63
0
2,
888
360
720
360
1,45
0
1,23
1
92
0
11,1
24
Anko
le C
offe
e Pr
oces
sors
36
0
320
668
654
3,
804
1,38
4
1,64
4
2,05
4
10
,888
Zigo
ti Co
ffee
Wor
ks
1,
654
640
3,
644
5,93
8
Kaw
eri C
offe
e Pl
anta
tion
1,
600
1,
600
480
320
32
0
4,32
0
Nile
hig
hlan
d Ar
abic
a Co
ffee
Assn
64
0
62
0
320
960
30
0
20
640
3,
500
Ande
rson
Inve
stm
ent L
td
320
1,60
0
1,92
0
Buko
nzo
Join
t Co-
op S
ocie
ty
320
640
640
320
1,92
0
Expo
rt T
radi
ng C
o. L
td
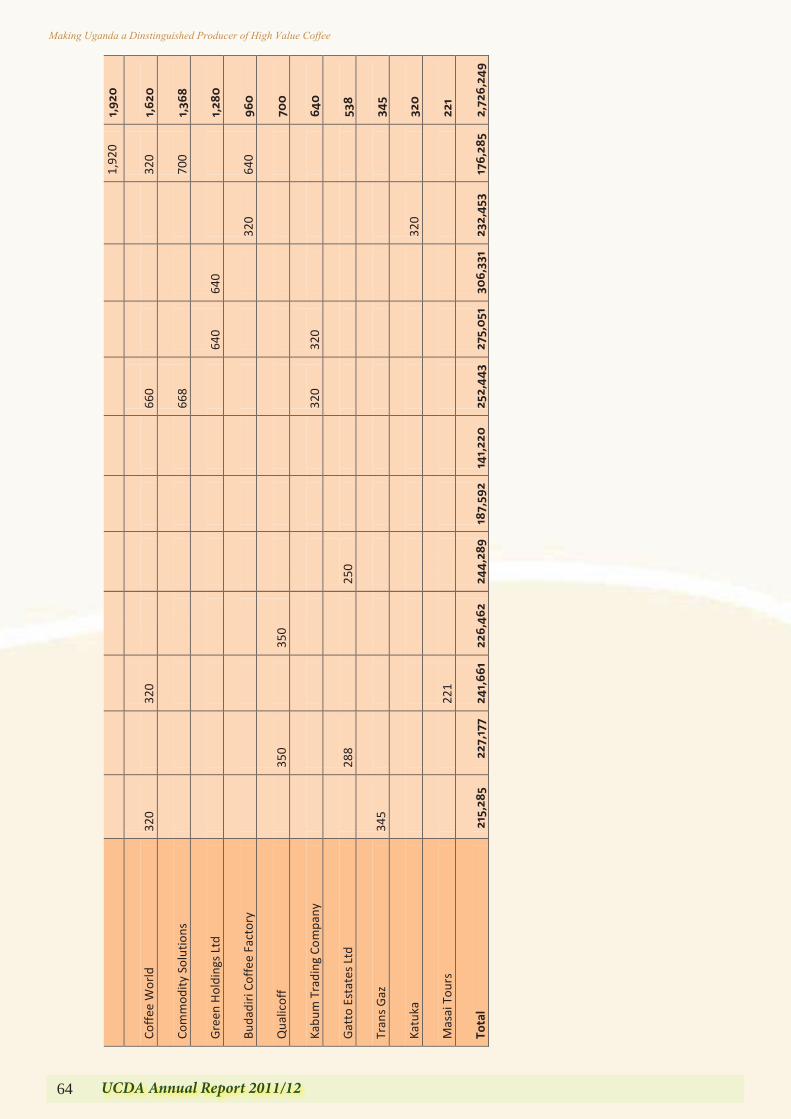
64 UCDA Annual Report 2011/12
Making Uganda a Dinstinguished Producer of High Value Coffee
1,92
0
1,92
0
Coffe
e W
orld
320
320
66
0
320
1,62
0
Com
mod
ity S
olut
ions
668
70
0
1,
368
Gree
n Ho
ldin
gs L
td
640
640
1,28
0
Buda
diri
Coffe
e Fa
ctor
y
320
640
96
0
Qua
licof
f
35
0
350
70
0
Kabu
m T
radi
ng C
ompa
ny
32
0
320
640
Gatt
o Es
tate
s Ltd
28
8
25
0
53
8
Tran
s Gaz
345
345
Katu
ka
32
0
32
0
Mas
ai T
ours
22
1
22
1
Tota
l 2
15,2
85
22
7,17
7
241,
661
22
6,46
2
244,
289
18
7,59
2
141,
220
25
2,44
3
275,
051
30
6,33
1
232,
453
17
6,28
5
2,72
6,24
9

65UCDA Annual Report 2011/12
Making Uganda a Dinstinguished Producer of High Value Coffee
1,92
0
1,92
0
Coffe
e W
orld
320
320
66
0
320
1,62
0
Com
mod
ity S
olut
ions
668
70
0
1,
368
Gree
n Ho
ldin
gs L
td
640
640
1,28
0
Buda
diri
Coffe
e Fa
ctor
y
320
640
96
0
Qua
licof
f
35
0
350
70
0
Kabu
m T
radi
ng C
ompa
ny
32
0
320
640
Gatt
o Es
tate
s Ltd
28
8
25
0
53
8
Tran
s Gaz
345
345
Katu
ka
32
0
32
0
Mas
ai T
ours
22
1
22
1
Tota
l 2
15,2
85
22
7,17
7
241,
661
22
6,46
2
244,
289
18
7,59
2
141,
220
25
2,44
3
275,
051
30
6,33
1
232,
453
17
6,28
5
2,72
6,24
9
63UCDA Annual Report 2011/12
Making Uganda a Dinstinguished Producer of High Value Coffee
APP
END
IX II
: 24
-Yea
r Cof
fee
Expo
rt P
erfo
rman
ce S
erie
s By
Typ
e &
Uni
t Pr
ice
- $/K
ilo
- in
60 K
ilo B
ags
-
Coff
ee Y
ear
Robu
sta
Ara
bica
To
tal
Uni
t Pri
ce in
US
$ /K
ilo
Qty
V
alue
$
Qty
V
alue
$
Qty
V
alue
$
Robu
sta
Ara
bica
A
vera
ge
pric
e
1988
/89
2,93
8,86
0
273
,806
,235
17
5,53
6
21,
061,
646
3,
114,
396
2
94,8
67,8
81
1.55
2.
00
1.58
1989
/90
2,22
8,29
3
125
,970
,229
13
6,45
8
13,
615,
502
2,
364,
751
1
39,5
85,7
31
0.94
1.
66
0.98
1990
/91
1,92
4,31
9
105
,733
,784
16
0,94
8
15,
647,
712
2,
085,
267
1
21,3
81,4
96
0.92
1.
62
0.97
1991
/92
1,88
4,18
3
9
1,74
2,54
2
169,
034
1
2,81
3,52
3
2,05
3,21
7
104
,556
,065
0.
81
1.26
0.
85
1992
/93
1,84
1,51
0
9
0,57
6,14
8
247,
132
1
8,11
7,84
3
2,08
8,64
2
108
,693
,991
0.
82
1.22
0.
87
1993
/94
2,47
1,96
0
192
,307
,120
53
3,24
5
81,
351,
730
3,
005,
205
2
73,6
58,8
50
1.30
2.
54
1.52
1994
/95
2,28
4,10
9
338
,762
,354
50
7,64
4
93,
731,
757
2,
791,
753
4
32,4
94,1
11
2.47
3.
08
2.58
1995
/96
3,76
2,34
7
345
,136
,777
38
6,45
6
43,
779,
380
4,
148,
803
3
88,9
16,1
57
1.53
1.
89
1.56
1996
/97
3,78
9,01
3
288
,858
,906
44
8,10
1
66,
267,
735
4,
237,
114
3
55,1
26,6
41
1.27
2.
46
1.40
1997
/98
2,69
1,27
8
227
,361
,611
34
1,06
0
49,
112,
624
3,
032,
338
2
76,4
74,2
35
1.41
2.
40
1.52
1998
/99
3,29
1,54
0
247
,869
,096
35
6,44
9
35,
126,
416
3,
647,
989
2
82,9
95,5
12
1.26
1.
64
1.29
1999
/00
2,39
0,68
2
121
,850
,127
52
6,57
5
42,
899,
788
2,
917,
257
1
64,7
49,9
15
0.85
1.
36
0.94
2000
/01
2,61
7,77
7
7
9,70
3,96
1
456,
996
2
5,07
2,46
3
3,07
4,77
3
104
,776
,424
0.
51
0.91
0.
57
2001
/02
2,71
5,95
5
6
4,49
6,82
0
430,
426
1
9,44
0,13
3
3,14
6,38
1
8
3,93
6,95
3
0.40
0.
75
0.44
2002
/03
2,22
1,44
0
8
1,84
3,93
4
442,
448
2
2,94
3,16
0
2,66
3,88
8
104
,787
,094
0.
61
0.86
0.
66
2003
/04
1,97
9,35
3
8
2,61
1,56
1
543,
689
3
3,09
3,28
3
2,52
3,04
2
115
,704
,844
0.
70
1.01
0.
76
2004
/05
1,98
6,89
0
105
,833
,286
51
8,00
0
56,
262,
950
2,
504,
890
1
62,0
96,2
36
0.89
1.
81
1.08
2005
/06
1,40
8,31
4
103
,873
,269
59
4,01
0
66,
470,
317
2,
002,
324
1
70,3
43,5
86
1.23
1.
87
1.42
2006
/07
2,14
4,48
2 19
2,77
9,54
6 55
9,75
4 63
,801
,298
2,
704,
236
256,
580,
844
1.50
1.
90
1.58
2007
/08
2,71
3,49
8 31
6,06
0,40
9 49
7,10
5 72
,337
,793
3,
210,
603
388,
398,
202
1.94
2.
43
2.02
2008
/09
2,40
5,13
7 21
2,84
8,98
0 64
8,55
1 78
,912
,759
3,
053,
688
291,
761,
739
1.47
2.
03
1.59
2009
/10
1,95
7,40
0 16
3,48
4,69
0 71
1,57
1 10
3,23
0,93
1 2,
668,
971
266,
715,
621
1.39
2.
42
1.67
2010
/11
2,48
4,01
3 29
4,60
6,04
5 66
5,41
0 15
4,28
4,62
5 3,
149,
423
448,
890,
669
1.98
3.
86
2.38
2011
/12
1,90
4,17
6 22
3,97
6,02
3 82
2,07
3 16
8,72
2,10
5 2,
726,
249
392,
698,
138
1.96
3.
42
2.40
AVE
RAG
E 2,
418,
189
182,
170,
561
453,
278
56,5
87,3
95
2,87
1,46
7 23
8,75
7,95
6
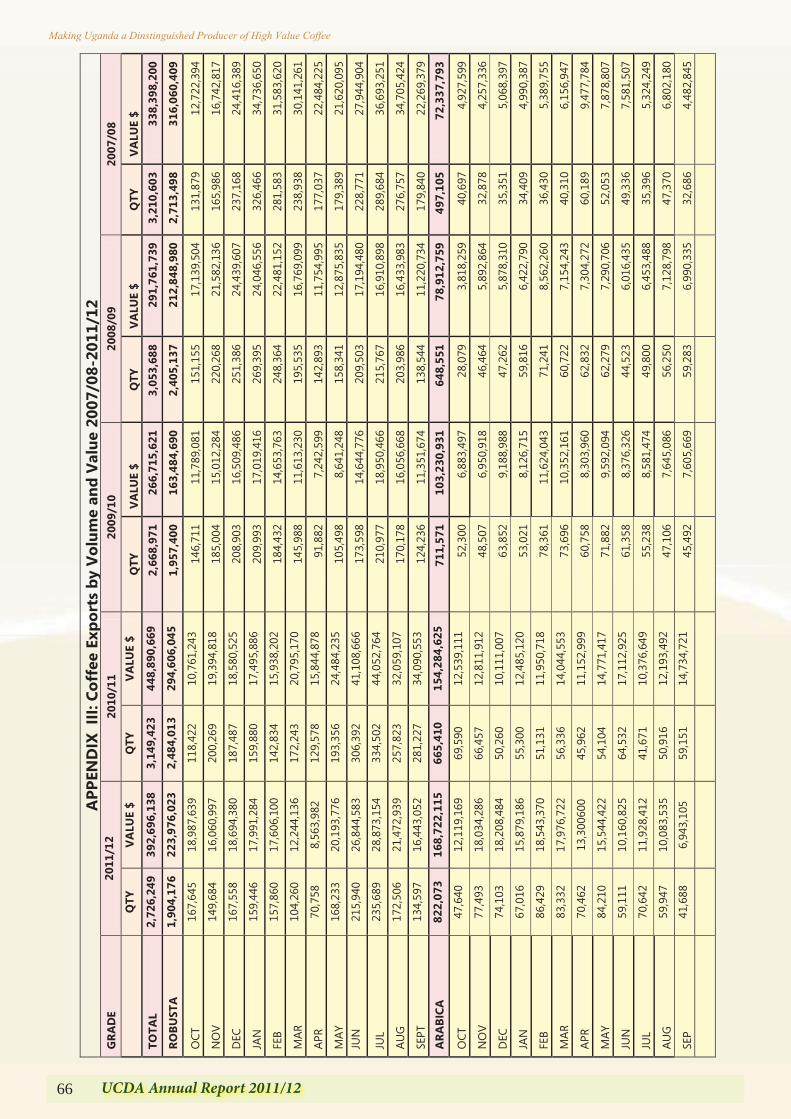
66 UCDA Annual Report 2011/12
Making Uganda a Dinstinguished Producer of High Value Coffee
64 UCDA Annual Report 2011/12
Making Uganda a Dinstinguished Producer of High Value Coffee
APP
END
IX I
II: C
offe
e Ex
port
s by
Vol
ume
and
Valu
e 20
07/0
8-20
11/1
2
GRA
DE
2011
/12
2010
/11
2009
/10
2008
/09
2007
/08
Q
TY
VALU
E $
QTY
VA
LUE
$ Q
TY
VALU
E $
QTY
VA
LUE
$ Q
TY
VALU
E $
TOTA
L 2,
726,
249
392,
696,
138
3,14
9,42
3 44
8,89
0,66
9 2,
668,
971
266,
715,
621
3,05
3,68
8 29
1,76
1,73
9 3,
210,
603
338,
398,
200
ROBU
STA
1,
904,
176
223,
976,
023
2,48
4,01
3 29
4,60
6,04
5 1,
957,
400
163,
484,
690
2,40
5,13
7 21
2,84
8,98
0 2,
713,
498
316,
060,
409
OCT
16
7,64
5 18
,987
,639
11
8,42
2 10
,761
,243
14
6,71
1
11,7
89,0
81
151,
155
17
,139
,504
13
1,87
9 12
,722
,394
NO
V 14
9,68
4 16
,060
,997
20
0,26
9 19
,394
,818
18
5,00
4
15,0
12,2
84
220,
268
21
,582
,136
16
5,98
6 16
,742
,817
DEC
16
7,55
8 18
,694
,380
18
7,48
7 18
,580
,525
2
08,9
03
16,5
09,4
86
251,
386
24
,439
,607
23
7,16
8 24
,416
,389
JAN
15
9,44
6 17
,991
,284
15
9,88
0 17
,495
,886
20
9,99
3
17,0
19,4
16
269,
395
24
,046
,556
32
6,46
6 34
,736
,650
FEB
157,
860
17,6
06,1
00
142,
834
15,9
38,2
02
184,
432
14
,653
,763
24
8,36
4
22,4
81,1
52
281,
583
31,5
83,6
20
MAR
10
4,26
0 12
,244
,136
17
2,24
3 20
,795
,170
14
5,98
8
11,6
13,2
30
195,
535
16
,769
,099
23
8,93
8 30
,141
,261
APR
70,7
58
8,56
3,98
2 12
9,57
8 15
,844
,878
9
1,88
2
7,24
2,59
9
142,
893
11
,754
,995
17
7,03
7 22
,484
,225
MAY
16
8,23
3 20
,193
,776
19
3,35
6 24
,484
,235
10
5,49
8
8,64
1,24
8
158,
341
12
,875
,835
17
9,38
9 21
,620
,095
JU
N
215,
940
26,8
44,5
83
306,
392
41,1
08,6
66
173,
598
14
,644
,776
20
9,50
3
17,1
94,4
80
228,
771
27,9
44,9
04
JUL
235,
689
28,8
73,1
54
334,
502
44,0
52,7
64
210,
977
18
,950
,466
21
5,76
7
16,9
10,8
98
289,
684
36,6
93,2
51
AUG
17
2,50
6 21
,472
,939
25
7,82
3 32
,059
,107
17
0,17
8
16,0
56,6
68
203,
986
16
,433
,983
27
6,75
7 34
,705
,424
SEPT
13
4,59
7 16
,443
,052
28
1,22
7 34
,090
,553
12
4,23
6
11,3
51,6
74
138,
544
11
,220
,734
17
9,84
0 22
,269
,379
A
RABI
CA
822,
073
168,
722,
115
665,
410
154,
284,
625
711,
571
103,
230,
931
648,
551
78,9
12,7
59
497,
105
72,3
37,7
93
OCT
47
,640
12
,119
,169
69
,590
12
,539
,111
52
,300
6,
883,
497
28
,079
3,
818,
259
40,6
97
4,92
7,59
9
NO
V 77
,493
18
,034
,286
66
,457
12
,811
,912
48
,507
6,
950,
918
46
,464
5,
892,
864
32,8
78
4,25
7,33
6
DEC
74
,103
18
,208
,484
50
,260
10
,111
,007
63
,852
9,
188,
988
47
,262
5,
878,
310
35,3
51
5,06
8,39
7
JAN
67
,016
15
,879
,186
55
,300
12
,485
,120
53
,021
8,
126,
715
59
,816
6,
422,
790
34,4
09
4,99
0,38
7
FEB
86,4
29
18,5
43,3
70
51,1
31
11,9
50,7
18
78,
361
11
,624
,043
71
,241
8,
562,
260
36,4
30
5,38
9,75
5
MAR
83
,332
17
,976
,722
56
,336
14
,044
,553
73
,696
10
,352
,161
60
,722
7,
154,
243
40,3
10
6,15
6,94
7
APR
70,4
62
13,3
0060
0 45
,962
11
,152
,999
60
,758
8,
303,
960
62
,832
7,
304,
272
60,1
89
9,47
7,78
4
MAY
84
,210
15
,544
,422
54
,104
14
,771
,417
71
,882
9,
592,
094
62
,279
7,
290,
706
52,0
53
7,87
8,80
7
JUN
59
,111
10
,160
,825
64
,532
17
,112
,925
61
,358
8,
376,
326
44
,523
6,
016,
435
49,3
36
7,58
1,50
7
JUL
70,6
42
11,9
28,4
12
41,6
71
10,3
76,6
49
55,2
38
8,58
1,47
4
49,8
00
6,45
3,48
8 35
,396
5,
324,
249
AUG
59
,947
10
,083
,535
50
,916
12
,193
,492
4
7,10
6
7,64
5,08
6
56,2
50
7,12
8,79
8 47
,370
6,
802,
180
SEP
41,6
88
6,94
3,10
5 59
,151
14
,734
,721
45
,492
7,
605,
669
59
,283
6,
990,
335
32,6
86
4,48
2,84
5
A
PPEN
DIX
1V:
Mon
thly
Cof
fee
Proc
urem
ent F
igur
es in
60-
Kilo
gram
mes
bag
s
Mon
th
2009
/10
2010
/11
2011
/12
Act
ual
Act
ual
Act
ual
Robu
sta
Ara
bica
To
tal
Robu
sta
Ara
bica
To
tal
Robu
sta
Ara
bica
To
tal
Oct
16
5,91
1 60
,500
22
6,41
1 12
0,41
2
68,5
29
188,
941
155,
167
50
,123
20
5,29
0
Nov
20
6,50
4 50
,201
25
6,70
5 21
2,47
7
69,3
23
281,
800
16
0,01
2
65,0
12
225,
024
Dec
22
5,63
7 65
,123
29
0,76
0 23
0,42
8
45,3
11
275,
739
17
0,23
5 69
,015
23
9,25
0
Jan
200,
454
65
,001
26
5,45
5
165,
114
52
,300
21
7,41
4
160,
012
68,5
10
228,
522
Feb
193,
502
75
,008
26
8,51
0
160,
006
53
,107
21
3,11
3
165,
009
90,0
18
255,
027
Mar
15
2,10
3
76,1
59
228,
262
15
5,00
1
52,1
76
207,
177
106,
105
85,6
58
191,
763
Apr
92,0
18
75,0
01
167,
019
16
5,00
2
45,0
89
210,
091
75
,013
72
,009
14
7,02
2
May
12
1,51
3
89,5
23
211,
036
20
0,44
4 49
,150
24
9,59
4 19
0,21
5 95
,145
28
5,36
0
Jun
179,
494
75
,096
25
4,59
0
321,
793
53
,087
36
7,10
0 25
2,14
8 80
,146
38
2,29
4
Jul
204,
100
82,1
32
286,
232
36
0,90
1
54,1
04
407,
225
320,
125
79,1
64
399,
289
Aug
180,
121
56
,046
23
6,16
7
286,
903
52
,009
33
2,13
2 27
0,12
5 70
,103
34
0,22
8
Sep
155,
200
47
,529
20
2,72
9
243,
899
50
,000
28
7,77
2
200,
136
65,1
58
265,
294
Tota
l 2,
076
,557
81
7,31
9 2,
893,
876
2,62
2,38
0 64
4,18
5 3,
266,
565
2,22
4,30
2 89
0,06
1 3,
114,
363

67UCDA Annual Report 2011/12
Making Uganda a Dinstinguished Producer of High Value Coffee
64 UCDA Annual Report 2011/12
Making Uganda a Dinstinguished Producer of High Value Coffee
APP
END
IX I
II: C
offe
e Ex
port
s by
Vol
ume
and
Valu
e 20
07/0
8-20
11/1
2
GRA
DE
2011
/12
2010
/11
2009
/10
2008
/09
2007
/08
Q
TY
VALU
E $
QTY
VA
LUE
$ Q
TY
VALU
E $
QTY
VA
LUE
$ Q
TY
VALU
E $
TOTA
L 2,
726,
249
392,
696,
138
3,14
9,42
3 44
8,89
0,66
9 2,
668,
971
266,
715,
621
3,05
3,68
8 29
1,76
1,73
9 3,
210,
603
338,
398,
200
ROBU
STA
1,
904,
176
223,
976,
023
2,48
4,01
3 29
4,60
6,04
5 1,
957,
400
163,
484,
690
2,40
5,13
7 21
2,84
8,98
0 2,
713,
498
316,
060,
409
OCT
16
7,64
5 18
,987
,639
11
8,42
2 10
,761
,243
14
6,71
1
11,7
89,0
81
151,
155
17
,139
,504
13
1,87
9 12
,722
,394
NO
V 14
9,68
4 16
,060
,997
20
0,26
9 19
,394
,818
18
5,00
4
15,0
12,2
84
220,
268
21
,582
,136
16
5,98
6 16
,742
,817
DEC
16
7,55
8 18
,694
,380
18
7,48
7 18
,580
,525
2
08,9
03
16,5
09,4
86
251,
386
24
,439
,607
23
7,16
8 24
,416
,389
JAN
15
9,44
6 17
,991
,284
15
9,88
0 17
,495
,886
20
9,99
3
17,0
19,4
16
269,
395
24
,046
,556
32
6,46
6 34
,736
,650
FEB
157,
860
17,6
06,1
00
142,
834
15,9
38,2
02
184,
432
14
,653
,763
24
8,36
4
22,4
81,1
52
281,
583
31,5
83,6
20
MAR
10
4,26
0 12
,244
,136
17
2,24
3 20
,795
,170
14
5,98
8
11,6
13,2
30
195,
535
16
,769
,099
23
8,93
8 30
,141
,261
APR
70,7
58
8,56
3,98
2 12
9,57
8 15
,844
,878
9
1,88
2
7,24
2,59
9
142,
893
11
,754
,995
17
7,03
7 22
,484
,225
MAY
16
8,23
3 20
,193
,776
19
3,35
6 24
,484
,235
10
5,49
8
8,64
1,24
8
158,
341
12
,875
,835
17
9,38
9 21
,620
,095
JU
N
215,
940
26,8
44,5
83
306,
392
41,1
08,6
66
173,
598
14
,644
,776
20
9,50
3
17,1
94,4
80
228,
771
27,9
44,9
04
JUL
235,
689
28,8
73,1
54
334,
502
44,0
52,7
64
210,
977
18
,950
,466
21
5,76
7
16,9
10,8
98
289,
684
36,6
93,2
51
AUG
17
2,50
6 21
,472
,939
25
7,82
3 32
,059
,107
17
0,17
8
16,0
56,6
68
203,
986
16
,433
,983
27
6,75
7 34
,705
,424
SEPT
13
4,59
7 16
,443
,052
28
1,22
7 34
,090
,553
12
4,23
6
11,3
51,6
74
138,
544
11
,220
,734
17
9,84
0 22
,269
,379
A
RABI
CA
822,
073
168,
722,
115
665,
410
154,
284,
625
711,
571
103,
230,
931
648,
551
78,9
12,7
59
497,
105
72,3
37,7
93
OCT
47
,640
12
,119
,169
69
,590
12
,539
,111
52
,300
6,
883,
497
28
,079
3,
818,
259
40,6
97
4,92
7,59
9
NO
V 77
,493
18
,034
,286
66
,457
12
,811
,912
48
,507
6,
950,
918
46
,464
5,
892,
864
32,8
78
4,25
7,33
6
DEC
74
,103
18
,208
,484
50
,260
10
,111
,007
63
,852
9,
188,
988
47
,262
5,
878,
310
35,3
51
5,06
8,39
7
JAN
67
,016
15
,879
,186
55
,300
12
,485
,120
53
,021
8,
126,
715
59
,816
6,
422,
790
34,4
09
4,99
0,38
7
FEB
86,4
29
18,5
43,3
70
51,1
31
11,9
50,7
18
78,
361
11
,624
,043
71
,241
8,
562,
260
36,4
30
5,38
9,75
5
MAR
83
,332
17
,976
,722
56
,336
14
,044
,553
73
,696
10
,352
,161
60
,722
7,
154,
243
40,3
10
6,15
6,94
7
APR
70,4
62
13,3
0060
0 45
,962
11
,152
,999
60
,758
8,
303,
960
62
,832
7,
304,
272
60,1
89
9,47
7,78
4
MAY
84
,210
15
,544
,422
54
,104
14
,771
,417
71
,882
9,
592,
094
62
,279
7,
290,
706
52,0
53
7,87
8,80
7
JUN
59
,111
10
,160
,825
64
,532
17
,112
,925
61
,358
8,
376,
326
44
,523
6,
016,
435
49,3
36
7,58
1,50
7
JUL
70,6
42
11,9
28,4
12
41,6
71
10,3
76,6
49
55,2
38
8,58
1,47
4
49,8
00
6,45
3,48
8 35
,396
5,
324,
249
AUG
59
,947
10
,083
,535
50
,916
12
,193
,492
4
7,10
6
7,64
5,08
6
56,2
50
7,12
8,79
8 47
,370
6,
802,
180
SEP
41,6
88
6,94
3,10
5 59
,151
14
,734
,721
45
,492
7,
605,
669
59
,283
6,
990,
335
32,6
86
4,48
2,84
5
A
PPEN
DIX
1V:
Mon
thly
Cof
fee
Proc
urem
ent F
igur
es in
60-
Kilo
gram
mes
bag
s
Mon
th
2009
/10
2010
/11
2011
/12
Act
ual
Act
ual
Act
ual
Robu
sta
Ara
bica
To
tal
Robu
sta
Ara
bica
To
tal
Robu
sta
Ara
bica
To
tal
Oct
16
5,91
1 60
,500
22
6,41
1 12
0,41
2
68,5
29
188,
941
155,
167
50
,123
20
5,29
0
Nov
20
6,50
4 50
,201
25
6,70
5 21
2,47
7
69,3
23
281,
800
16
0,01
2
65,0
12
225,
024
Dec
22
5,63
7 65
,123
29
0,76
0 23
0,42
8
45,3
11
275,
739
17
0,23
5 69
,015
23
9,25
0
Jan
200,
454
65
,001
26
5,45
5
165,
114
52
,300
21
7,41
4
160,
012
68,5
10
228,
522
Feb
193,
502
75
,008
26
8,51
0
160,
006
53
,107
21
3,11
3
165,
009
90,0
18
255,
027
Mar
15
2,10
3
76,1
59
228,
262
15
5,00
1
52,1
76
207,
177
106,
105
85,6
58
191,
763
Apr
92,0
18
75,0
01
167,
019
16
5,00
2
45,0
89
210,
091
75
,013
72
,009
14
7,02
2
May
12
1,51
3
89,5
23
211,
036
20
0,44
4 49
,150
24
9,59
4 19
0,21
5 95
,145
28
5,36
0
Jun
179,
494
75
,096
25
4,59
0
321,
793
53
,087
36
7,10
0 25
2,14
8 80
,146
38
2,29
4
Jul
204,
100
82,1
32
286,
232
36
0,90
1
54,1
04
407,
225
320,
125
79,1
64
399,
289
Aug
180,
121
56
,046
23
6,16
7
286,
903
52
,009
33
2,13
2 27
0,12
5 70
,103
34
0,22
8
Sep
155,
200
47
,529
20
2,72
9
243,
899
50
,000
28
7,77
2
200,
136
65,1
58
265,
294
Tota
l 2,
076
,557
81
7,31
9 2,
893,
876
2,62
2,38
0 64
4,18
5 3,
266,
565
2,22
4,30
2 89
0,06
1 3,
114,
363
65UCDA Annual Report 2011/12
Making Uganda a Dinstinguished Producer of High Value Coffee
A
PPEN
DIX
1V:
Mon
thly
Cof
fee
Proc
urem
ent F
igur
es in
60-
Kilo
gram
mes
bag
s
Mon
th
2009
/10
2010
/11
2011
/12
Act
ual
Act
ual
Act
ual
Robu
sta
Ara
bica
To
tal
Robu
sta
Ara
bica
To
tal
Robu
sta
Ara
bica
To
tal
Oct
16
5,91
1 60
,500
22
6,41
1 12
0,41
2
68,5
29
188,
941
155,
167
50
,123
20
5,29
0
Nov
20
6,50
4 50
,201
25
6,70
5 21
2,47
7
69,3
23
281,
800
16
0,01
2
65,0
12
225,
024
Dec
22
5,63
7 65
,123
29
0,76
0 23
0,42
8
45,3
11
275,
739
17
0,23
5 69
,015
23
9,25
0
Jan
200,
454
65
,001
26
5,45
5
165,
114
52
,300
21
7,41
4
160,
012
68,5
10
228,
522
Feb
193,
502
75
,008
26
8,51
0
160,
006
53
,107
21
3,11
3
165,
009
90,0
18
255,
027
Mar
15
2,10
3
76,1
59
228,
262
15
5,00
1
52,1
76
207,
177
106,
105
85,6
58
191,
763
Apr
92,0
18
75,0
01
167,
019
16
5,00
2
45,0
89
210,
091
75
,013
72
,009
14
7,02
2
May
12
1,51
3
89,5
23
211,
036
20
0,44
4 49
,150
24
9,59
4 19
0,21
5 95
,145
28
5,36
0
Jun
179,
494
75
,096
25
4,59
0
321,
793
53
,087
36
7,10
0 25
2,14
8 80
,146
38
2,29
4
Jul
204,
100
82,1
32
286,
232
36
0,90
1
54,1
04
407,
225
320,
125
79,1
64
399,
289
Aug
180,
121
56
,046
23
6,16
7
286,
903
52
,009
33
2,13
2 27
0,12
5 70
,103
34
0,22
8
Sep
155,
200
47
,529
20
2,72
9
243,
899
50
,000
28
7,77
2
200,
136
65,1
58
265,
294
Tota
l 2,
076
,557
81
7,31
9 2,
893,
876
2,62
2,38
0 64
4,18
5 3,
266,
565
2,22
4,30
2 89
0,06
1 3,
114,
363
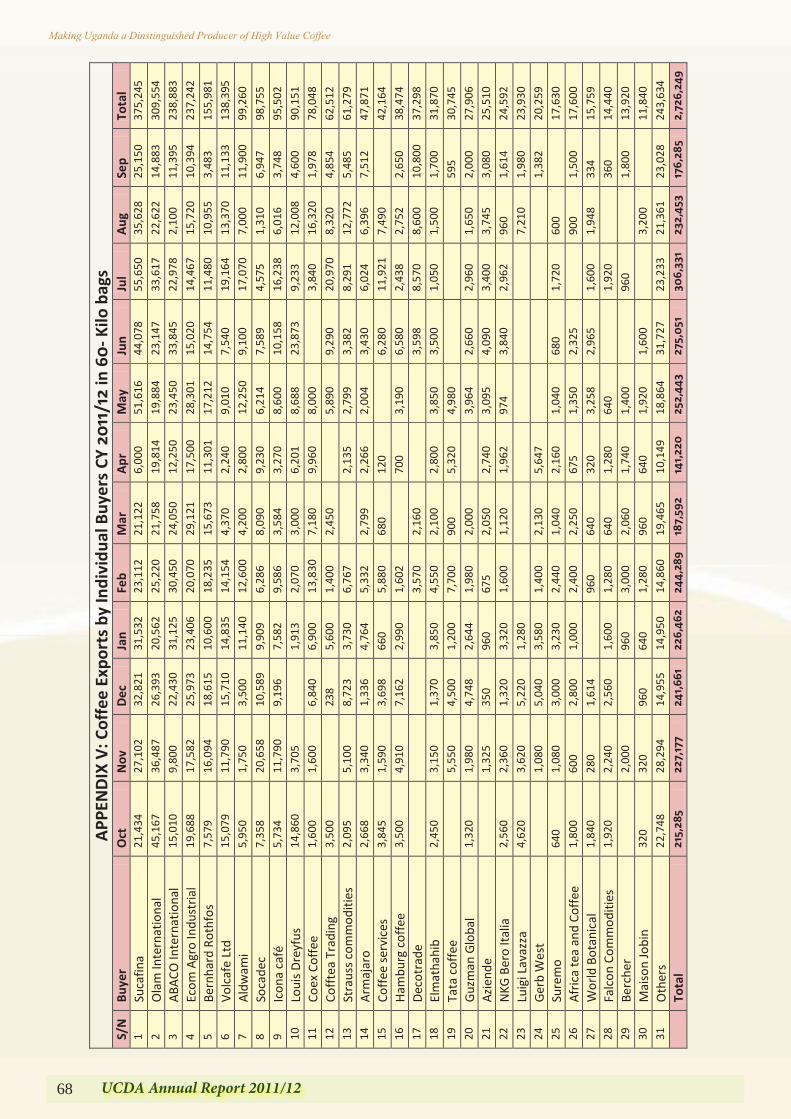
68 UCDA Annual Report 2011/12
Making Uganda a Dinstinguished Producer of High Value Coffee
66 UCDA Annual Report 2011/12
Making Uganda a Dinstinguished Producer of High Value Coffee
APP
END
IX V
: Cof
fee
Expo
rts
by In
divi
dual
Buy
ers
CY 2
011
/12
in 6
0- K
ilo b
ags
S/N
Bu
yer
Oct
N
ov
Dec
Ja
n Fe
b M
ar
Apr
M
ay
Jun
Jul
Aug
Se
p To
tal
1 Su
cafin
a 21
,434
27
,102
32
,821
31
,532
23
,112
21
,122
6,
000
51,6
16
44,0
78
55,6
50
35,6
28
25,1
50
375,
245
2 O
lam
Inte
rnat
iona
l 45
,167
36
,487
26
,393
20
,562
25
,220
21
,758
19
,814
19
,884
23
,147
33
,617
22
,622
14
,883
30
9,55
4 3
ABAC
O In
tern
atio
nal
15,0
10
9,80
0 22
,430
31
,125
30
,450
24
,050
12
,250
23
,450
33
,845
22
,978
2,
100
11,3
95
238,
883
4 Ec
om A
gro
Indu
stria
l 19
,688
17
,582
25
,973
23
,406
20
,070
29
,121
17
,500
28
,301
15
,020
14
,467
15
,720
10
,394
23
7,24
2 5
Bern
hard
Rot
hfos
7,
579
16,0
94
18,6
15
10,6
00
18,2
35
15,6
73
11,3
01
17,2
12
14,7
54
11,4
80
10,9
55
3,48
3 15
5,98
1 6
Volc
afe
Ltd
15,0
79
11,7
90
15,7
10
14,8
35
14,1
54
4,37
0 2,
240
9,01
0 7,
540
19,1
64
13,3
70
11,1
33
138,
395
7 Al
dwam
i 5,
950
1,75
0 3,
500
11,1
40
12,6
00
4,20
0 2,
800
12,2
50
9,10
0 17
,070
7,
000
11,9
00
99,2
60
8 So
cade
c 7,
358
20,6
58
10,5
89
9,90
9 6,
286
8,09
0 9,
230
6,21
4 7,
589
4,57
5 1,
310
6,94
7 98
,755
9
Icon
a ca
fé
5,73
4 11
,790
9,
196
7,58
2 9,
586
3,58
4 3,
270
8,60
0 10
,158
16
,238
6,
016
3,74
8 95
,502
10
Lo
uis D
reyf
us
14,8
60
3,70
5
1,91
3 2,
070
3,00
0 6,
201
8,68
8 23
,873
9,
233
12,0
08
4,60
0 90
,151
11
Co
ex C
offe
e 1,
600
1,60
0 6,
840
6,90
0 13
,830
7,
180
9,96
0 8,
000
3,
840
16,3
20
1,97
8 78
,048
12
Co
fftea
Tra
ding
3,
500
23
8 5,
600
1,40
0 2,
450
5,
890
9,29
0 20
,970
8,
320
4,85
4 62
,512
13
St
raus
s com
mod
ities
2,
095
5,10
0 8,
723
3,73
0 6,
767
2,
135
2,79
9 3,
382
8,29
1 12
,772
5,
485
61,2
79
14
Arm
ajar
o 2,
668
3,34
0 1,
336
4,76
4 5,
332
2,79
9 2,
266
2,00
4 3,
430
6,02
4 6,
396
7,51
2 47
,871
15
Co
ffee
serv
ices
3,
845
1,59
0 3,
698
660
5,88
0 68
0 12
0
6,28
0 11
,921
7,
490
42
,164
16
Ha
mbu
rg c
offe
e 3,
500
4,91
0 7,
162
2,99
0 1,
602
70
0 3,
190
6,58
0 2,
438
2,75
2 2,
650
38,4
74
17
Deco
trad
e
3,
570
2,16
0
3,
598
8,57
0 8,
600
10,8
00
37,2
98
18
Elm
atha
hib
2,45
0 3,
150
1,37
0 3,
850
4,55
0 2,
100
2,80
0 3,
850
3,50
0 1,
050
1,50
0 1,
700
31,8
70
19
Tata
cof
fee
5,
550
4,50
0 1,
200
7,70
0 90
0 5,
320
4,98
0
595
30,7
45
20
Guzm
an G
loba
l 1,
320
1,98
0 4,
748
2,64
4 1,
980
2,00
0
3,96
4 2,
660
2,96
0 1,
650
2,00
0 27
,906
21
Az
iend
e
1,32
5 35
0 96
0 67
5 2,
050
2,74
0 3,
095
4,09
0 3,
400
3,74
5 3,
080
25,5
10
22
NKG
Ber
o Ita
lia
2,56
0 2,
360
1,32
0 3,
320
1,60
0 1,
120
1,96
2 97
4 3,
840
2,96
2 96
0 1,
614
24,5
92
23
Luig
i Lav
azza
4,
620
3,62
0 5,
220
1,28
0
7,
210
1,98
0 23
,930
24
Ge
rb W
est
1,
080
5,04
0 3,
580
1,40
0 2,
130
5,64
7
1,
382
20,2
59
25
Sure
mo
640
1,08
0 3,
000
3,23
0 2,
440
1,04
0 2,
160
1,04
0 68
0 1,
720
600
17
,630
26
Af
rica
tea
and
Coffe
e 1,
800
600
2,80
0 1,
000
2,40
0 2,
250
675
1,35
0 2,
325
90
0 1,
500
17,6
00
27
Wor
ld B
otan
ical
1,
840
280
1,61
4
960
640
320
3,25
8 2,
965
1,60
0 1,
948
334
15,7
59
28
Falc
on C
omm
oditi
es
1,92
0 2,
240
2,56
0 1,
600
1,28
0 64
0 1,
280
640
1,
920
36
0 14
,440
29
Be
rche
r
2,00
0
960
3,00
0 2,
060
1,74
0 1,
400
96
0
1,80
0 13
,920
30
M
aiso
n Jo
bin
320
320
960
640
1,28
0 96
0 64
0 1,
920
1,60
0
3,20
0
11,8
40
31
Oth
ers
22,7
48
28,2
94
14,9
55
14,9
50
14,8
60
19,4
65
10,1
49
18,8
64
31,7
27
23,2
33
21,3
61
23,0
28
243,
634
To
tal
215,
285
227,
177
241,
661
226,
462
244,
289
187,
592
141,
220
252,
443
275,
051
30
6,33
1 23
2,45
3 17
6,28
5 2,
726,
249
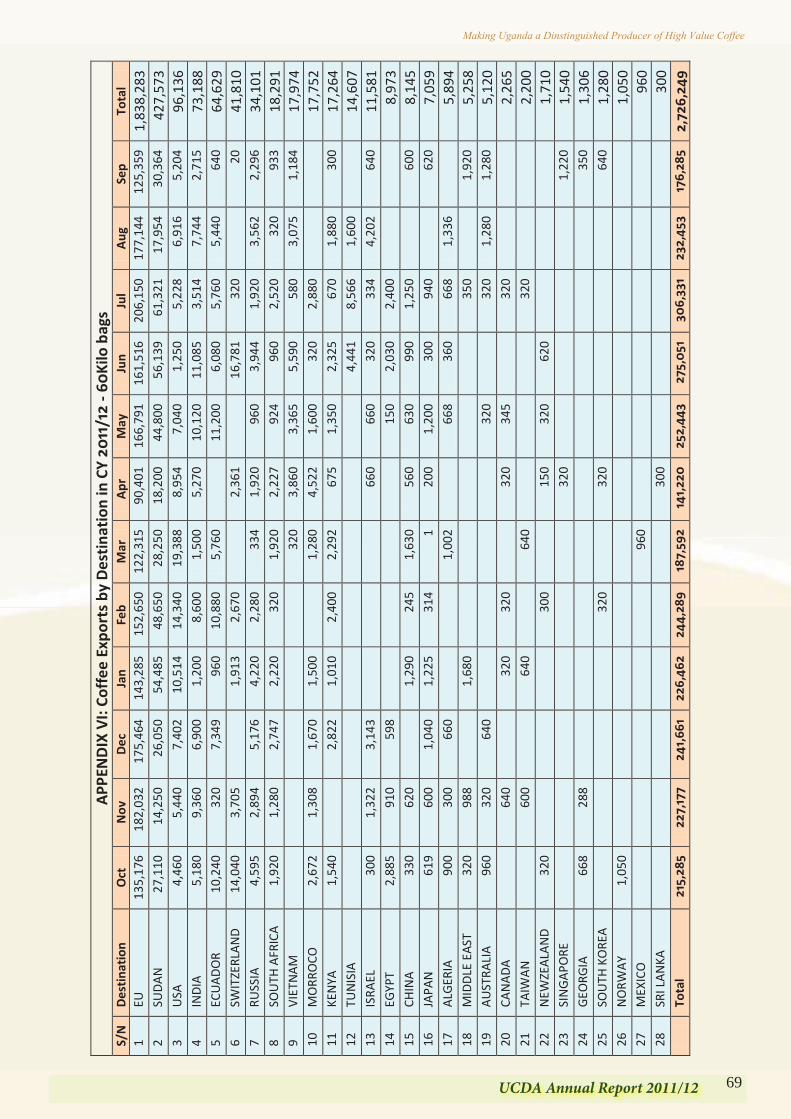
69UCDA Annual Report 2011/12
Making Uganda a Dinstinguished Producer of High Value Coffee
66 UCDA Annual Report 2011/12
Making Uganda a Dinstinguished Producer of High Value Coffee
APP
END
IX V
: Cof
fee
Expo
rts
by In
divi
dual
Buy
ers
CY 2
011
/12
in 6
0- K
ilo b
ags
S/N
Bu
yer
Oct
N
ov
Dec
Ja
n Fe
b M
ar
Apr
M
ay
Jun
Jul
Aug
Se
p To
tal
1 Su
cafin
a 21
,434
27
,102
32
,821
31
,532
23
,112
21
,122
6,
000
51,6
16
44,0
78
55,6
50
35,6
28
25,1
50
375,
245
2 O
lam
Inte
rnat
iona
l 45
,167
36
,487
26
,393
20
,562
25
,220
21
,758
19
,814
19
,884
23
,147
33
,617
22
,622
14
,883
30
9,55
4 3
ABAC
O In
tern
atio
nal
15,0
10
9,80
0 22
,430
31
,125
30
,450
24
,050
12
,250
23
,450
33
,845
22
,978
2,
100
11,3
95
238,
883
4 Ec
om A
gro
Indu
stria
l 19
,688
17
,582
25
,973
23
,406
20
,070
29
,121
17
,500
28
,301
15
,020
14
,467
15
,720
10
,394
23
7,24
2 5
Bern
hard
Rot
hfos
7,
579
16,0
94
18,6
15
10,6
00
18,2
35
15,6
73
11,3
01
17,2
12
14,7
54
11,4
80
10,9
55
3,48
3 15
5,98
1 6
Volc
afe
Ltd
15,0
79
11,7
90
15,7
10
14,8
35
14,1
54
4,37
0 2,
240
9,01
0 7,
540
19,1
64
13,3
70
11,1
33
138,
395
7 Al
dwam
i 5,
950
1,75
0 3,
500
11,1
40
12,6
00
4,20
0 2,
800
12,2
50
9,10
0 17
,070
7,
000
11,9
00
99,2
60
8 So
cade
c 7,
358
20,6
58
10,5
89
9,90
9 6,
286
8,09
0 9,
230
6,21
4 7,
589
4,57
5 1,
310
6,94
7 98
,755
9
Icon
a ca
fé
5,73
4 11
,790
9,
196
7,58
2 9,
586
3,58
4 3,
270
8,60
0 10
,158
16
,238
6,
016
3,74
8 95
,502
10
Lo
uis D
reyf
us
14,8
60
3,70
5
1,91
3 2,
070
3,00
0 6,
201
8,68
8 23
,873
9,
233
12,0
08
4,60
0 90
,151
11
Co
ex C
offe
e 1,
600
1,60
0 6,
840
6,90
0 13
,830
7,
180
9,96
0 8,
000
3,
840
16,3
20
1,97
8 78
,048
12
Co
fftea
Tra
ding
3,
500
23
8 5,
600
1,40
0 2,
450
5,
890
9,29
0 20
,970
8,
320
4,85
4 62
,512
13
St
raus
s com
mod
ities
2,
095
5,10
0 8,
723
3,73
0 6,
767
2,
135
2,79
9 3,
382
8,29
1 12
,772
5,
485
61,2
79
14
Arm
ajar
o 2,
668
3,34
0 1,
336
4,76
4 5,
332
2,79
9 2,
266
2,00
4 3,
430
6,02
4 6,
396
7,51
2 47
,871
15
Co
ffee
serv
ices
3,
845
1,59
0 3,
698
660
5,88
0 68
0 12
0
6,28
0 11
,921
7,
490
42
,164
16
Ha
mbu
rg c
offe
e 3,
500
4,91
0 7,
162
2,99
0 1,
602
70
0 3,
190
6,58
0 2,
438
2,75
2 2,
650
38,4
74
17
Deco
trad
e
3,
570
2,16
0
3,
598
8,57
0 8,
600
10,8
00
37,2
98
18
Elm
atha
hib
2,45
0 3,
150
1,37
0 3,
850
4,55
0 2,
100
2,80
0 3,
850
3,50
0 1,
050
1,50
0 1,
700
31,8
70
19
Tata
cof
fee
5,
550
4,50
0 1,
200
7,70
0 90
0 5,
320
4,98
0
595
30,7
45
20
Guzm
an G
loba
l 1,
320
1,98
0 4,
748
2,64
4 1,
980
2,00
0
3,96
4 2,
660
2,96
0 1,
650
2,00
0 27
,906
21
Az
iend
e
1,32
5 35
0 96
0 67
5 2,
050
2,74
0 3,
095
4,09
0 3,
400
3,74
5 3,
080
25,5
10
22
NKG
Ber
o Ita
lia
2,56
0 2,
360
1,32
0 3,
320
1,60
0 1,
120
1,96
2 97
4 3,
840
2,96
2 96
0 1,
614
24,5
92
23
Luig
i Lav
azza
4,
620
3,62
0 5,
220
1,28
0
7,
210
1,98
0 23
,930
24
Ge
rb W
est
1,
080
5,04
0 3,
580
1,40
0 2,
130
5,64
7
1,
382
20,2
59
25
Sure
mo
640
1,08
0 3,
000
3,23
0 2,
440
1,04
0 2,
160
1,04
0 68
0 1,
720
600
17
,630
26
Af
rica
tea
and
Coffe
e 1,
800
600
2,80
0 1,
000
2,40
0 2,
250
675
1,35
0 2,
325
90
0 1,
500
17,6
00
27
Wor
ld B
otan
ical
1,
840
280
1,61
4
960
640
320
3,25
8 2,
965
1,60
0 1,
948
334
15,7
59
28
Falc
on C
omm
oditi
es
1,92
0 2,
240
2,56
0 1,
600
1,28
0 64
0 1,
280
640
1,
920
36
0 14
,440
29
Be
rche
r
2,00
0
960
3,00
0 2,
060
1,74
0 1,
400
96
0
1,80
0 13
,920
30
M
aiso
n Jo
bin
320
320
960
640
1,28
0 96
0 64
0 1,
920
1,60
0
3,20
0
11,8
40
31
Oth
ers
22,7
48
28,2
94
14,9
55
14,9
50
14,8
60
19,4
65
10,1
49
18,8
64
31,7
27
23,2
33
21,3
61
23,0
28
243,
634
To
tal
215,
285
227,
177
241,
661
226,
462
244,
289
187,
592
141,
220
252,
443
275,
051
30
6,33
1 23
2,45
3 17
6,28
5 2,
726,
249
67UCDA Annual Report 2011/12
Making Uganda a Dinstinguished Producer of High Value Coffee
APP
END
IX V
: Cof
fee
Expo
rts
by In
divi
dual
Buy
ers
CY 2
011
/12
in 6
0- K
ilo b
ags
S/N
Bu
yer
Oct
N
ov
Dec
Ja
n Fe
b M
ar
Apr
M
ay
Jun
Jul
Aug
Se
p To
tal
1 Su
cafin
a 21
,434
27
,102
32
,821
31
,532
23
,112
21
,122
6,
000
51,6
16
44,0
78
55,6
50
35,6
28
25,1
50
375,
245
2 O
lam
Inte
rnat
iona
l 45
,167
36
,487
26
,393
20
,562
25
,220
21
,758
19
,814
19
,884
23
,147
33
,617
22
,622
14
,883
30
9,55
4 3
ABAC
O In
tern
atio
nal
15,0
10
9,80
0 22
,430
31
,125
30
,450
24
,050
12
,250
23
,450
33
,845
22
,978
2,
100
11,3
95
238,
883
4 Ec
om A
gro
Indu
stria
l 19
,688
17
,582
25
,973
23
,406
20
,070
29
,121
17
,500
28
,301
15
,020
14
,467
15
,720
10
,394
23
7,24
2 5
Bern
hard
Rot
hfos
7,
579
16,0
94
18,6
15
10,6
00
18,2
35
15,6
73
11,3
01
17,2
12
14,7
54
11,4
80
10,9
55
3,48
3 15
5,98
1 6
Volc
afe
Ltd
15,0
79
11,7
90
15,7
10
14,8
35
14,1
54
4,37
0 2,
240
9,01
0 7,
540
19,1
64
13,3
70
11,1
33
138,
395
7 Al
dwam
i 5,
950
1,75
0 3,
500
11,1
40
12,6
00
4,20
0 2,
800
12,2
50
9,10
0 17
,070
7,
000
11,9
00
99,2
60
8 So
cade
c 7,
358
20,6
58
10,5
89
9,90
9 6,
286
8,09
0 9,
230
6,21
4 7,
589
4,57
5 1,
310
6,94
7 98
,755
9
Icon
a ca
fé
5,73
4 11
,790
9,
196
7,58
2 9,
586
3,58
4 3,
270
8,60
0 10
,158
16
,238
6,
016
3,74
8 95
,502
10
Lo
uis D
reyf
us
14,8
60
3,70
5
1,91
3 2,
070
3,00
0 6,
201
8,68
8 23
,873
9,
233
12,0
08
4,60
0 90
,151
11
Co
ex C
offe
e 1,
600
1,60
0 6,
840
6,90
0 13
,830
7,
180
9,96
0 8,
000
3,
840
16,3
20
1,97
8 78
,048
12
Co
fftea
Tra
ding
3,
500
23
8 5,
600
1,40
0 2,
450
5,
890
9,29
0 20
,970
8,
320
4,85
4 62
,512
13
St
raus
s com
mod
ities
2,
095
5,10
0 8,
723
3,73
0 6,
767
2,
135
2,79
9 3,
382
8,29
1 12
,772
5,
485
61,2
79
14
Arm
ajar
o 2,
668
3,34
0 1,
336
4,76
4 5,
332
2,79
9 2,
266
2,00
4 3,
430
6,02
4 6,
396
7,51
2 47
,871
15
Co
ffee
serv
ices
3,
845
1,59
0 3,
698
660
5,88
0 68
0 12
0
6,28
0 11
,921
7,
490
42
,164
16
Ha
mbu
rg c
offe
e 3,
500
4,91
0 7,
162
2,99
0 1,
602
70
0 3,
190
6,58
0 2,
438
2,75
2 2,
650
38,4
74
17
Deco
trad
e
3,
570
2,16
0
3,
598
8,57
0 8,
600
10,8
00
37,2
98
18
Elm
atha
hib
2,45
0 3,
150
1,37
0 3,
850
4,55
0 2,
100
2,80
0 3,
850
3,50
0 1,
050
1,50
0 1,
700
31,8
70
19
Tata
cof
fee
5,
550
4,50
0 1,
200
7,70
0 90
0 5,
320
4,98
0
595
30,7
45
20
Guzm
an G
loba
l 1,
320
1,98
0 4,
748
2,64
4 1,
980
2,00
0
3,96
4 2,
660
2,96
0 1,
650
2,00
0 27
,906
21
Az
iend
e
1,32
5 35
0 96
0 67
5 2,
050
2,74
0 3,
095
4,09
0 3,
400
3,74
5 3,
080
25,5
10
22
NKG
Ber
o Ita
lia
2,56
0 2,
360
1,32
0 3,
320
1,60
0 1,
120
1,96
2 97
4 3,
840
2,96
2 96
0 1,
614
24,5
92
23
Luig
i Lav
azza
4,
620
3,62
0 5,
220
1,28
0
7,
210
1,98
0 23
,930
24
Ge
rb W
est
1,
080
5,04
0 3,
580
1,40
0 2,
130
5,64
7
1,
382
20,2
59
25
Sure
mo
640
1,08
0 3,
000
3,23
0 2,
440
1,04
0 2,
160
1,04
0 68
0 1,
720
600
17
,630
26
Af
rica
tea
and
Coffe
e 1,
800
600
2,80
0 1,
000
2,40
0 2,
250
675
1,35
0 2,
325
90
0 1,
500
17,6
00
27
Wor
ld B
otan
ical
1,
840
280
1,61
4
960
640
320
3,25
8 2,
965
1,60
0 1,
948
334
15,7
59
28
Falc
on C
omm
oditi
es
1,92
0 2,
240
2,56
0 1,
600
1,28
0 64
0 1,
280
640
1,
920
36
0 14
,440
29
Be
rche
r
2,00
0
960
3,00
0 2,
060
1,74
0 1,
400
96
0
1,80
0 13
,920
30
M
aiso
n Jo
bin
320
320
960
640
1,28
0 96
0 64
0 1,
920
1,60
0
3,20
0
11,8
40
31
Oth
ers
22,7
48
28,2
94
14,9
55
14,9
50
14,8
60
19,4
65
10,1
49
18,8
64
31,7
27
23,2
33
21,3
61
23,0
28
243,
634
To
tal
215,
285
227,
177
241,
661
226,
462
244,
289
187,
592
141,
220
252,
443
275,
051
30
6,33
1 23
2,45
3 17
6,28
5 2,
726,
249
APP
END
IX V
I: Co
ffee
Exp
orts
by
Des
tina
tion
in C
Y 20
11/1
2 - 6
0Ki
lo b
ags
S/N
D
esti
nati
on
Oct
N
ov
Dec
Ja
n Fe
b M
ar
Apr
M
ay
Jun
Jul
Aug
Se
p To
tal
1 EU
13
5,17
6 18
2,03
2 17
5,46
4 14
3,28
5 15
2,65
0 12
2,31
5 90
,401
16
6,79
1 16
1,51
6 20
6,15
0 17
7,14
4 12
5,35
9 1,
838,
283
2 SU
DAN
27,1
10
14,2
50
26,0
50
54,4
85
48,6
50
28,2
50
18,2
00
44,8
00
56,1
39
61,3
21
17,9
54
30,3
64
427,
573
3 U
SA
4,46
0 5,
440
7,40
2 10
,514
14
,340
19
,388
8,
954
7,04
0 1,
250
5,22
8 6,
916
5,20
4 96
,136
4
INDI
A 5,
180
9,36
0 6,
900
1,20
0 8,
600
1,50
0 5,
270
10,1
20
11,0
85
3,51
4 7,
744
2,71
5 73
,188
5
ECUA
DOR
10,2
40
320
7,34
9 96
0 10
,880
5,
760
11
,200
6,
080
5,76
0 5,
440
640
64,6
29
6 SW
ITZE
RLAN
D 14
,040
3,
705
1,
913
2,67
0
2,36
1
16,7
81
320
20
41
,810
7
RUSS
IA
4,59
5 2,
894
5,17
6 4,
220
2,28
0 33
4 1,
920
960
3,94
4 1,
920
3,56
2 2,
296
34,1
01
8 SO
UTH
AFR
ICA
1,92
0 1,
280
2,74
7 2,
220
320
1,92
0 2,
227
924
960
2,52
0 32
0 93
3 18
,291
9
VIET
NAM
320
3,86
0 3,
365
5,59
0 58
0 3,
075
1,18
4 17
,974
10
M
ORR
OCO
2,
672
1,30
8 1,
670
1,50
0
1,28
0 4,
522
1,60
0 32
0 2,
880
17,7
52
11
KEN
YA
1,54
0
2,82
2 1,
010
2,40
0 2,
292
675
1,35
0 2,
325
670
1,88
0 30
0 17
,264
12
TU
NIS
IA
4,44
1 8,
566
1,60
0
14,6
07
13
ISRA
EL
300
1,32
2 3,
143
66
0 66
0 32
0 33
4 4,
202
640
11,5
81
14
EGYP
T 2,
885
910
598
150
2,03
0 2,
400
8,97
3 15
CH
INA
330
620
1,
290
245
1,63
0 56
0 63
0 99
0 1,
250
60
0 8,
145
16
JAPA
N 61
9 60
0 1,
040
1,22
5 31
4 1
200
1,20
0 30
0 94
0
620
7,05
9 17
AL
GERI
A 90
0 30
0 66
0
1,
002
66
8 36
0 66
8 1,
336
5,
894
18
MID
DLE
EAST
32
0 98
8
1,68
0
350
1,
920
5,25
8 19
AU
STRA
LIA
960
320
640
320
32
0 1,
280
1,28
0 5,
120
20
CAN
ADA
64
0
320
320
32
0 34
5
320
2,26
5 21
TA
IWAN
600
64
0
640
32
0
2,
200
22
NEW
ZEAL
AND
320
30
0
150
320
620
1,
710
23
SIN
GAPO
RE
320
1,22
0 1,
540
24
GEO
RGIA
66
8 28
8
350
1,30
6 25
SO
UTH
KO
REA
320
32
0
64
0 1,
280
26
NO
RWAY
1,
050
1,
050
27
MEX
ICO
960
960
28
SRI L
ANKA
30
0
300
To
tal
215,
285
227,
177
241,
661
226,
462
244,
289
187,
592
141,
220
252,
443
275,
051
30
6,33
1 23
2,45
3 17
6,28
5 2,
726,
249
70 UCDA Annual Report 2011/12
Making Uganda a Dinstinguished Producer of High Value Coffee
71UCDA Annual Report 2011/12
Making Uganda a Dinstinguished Producer of High Value Coffee
Making Uganda a Distinguished Producer of High Value Coffee 53
Uganda Coffee Development Authority ANNUAL REPORT 2010 - 2011
Making Uganda a Distinguished Producer of High Value Coffee
Uganda Coffee Development Authority ANNUAL REPORT 2010 – 2011
49
2012
2012
2012
73UCDA Annual Report 2011/12
Making Uganda a Dinstinguished Producer of High Value Coffee
Making Uganda a Distinguished Producer of High Value Coffee
Uganda Coffee Development Authority ANNUAL REPORT 2010 - 2011
54 Making Uganda a Distinguished Producer of High Value Coffee
Uganda Coffee Development Authority ANNUAL REPORT 2010 – 2011
50 Making Uganda a Distinguished Producer of High Value Coffee 55
Uganda Coffee Development Authority ANNUAL REPORT 2010 - 2011
Making Uganda a Distinguished Producer of High Value Coffee
Uganda Coffee Development Authority ANNUAL REPORT 2010 – 2011
51
74 UCDA Annual Report 2011/12
Making Uganda a Dinstinguished Producer of High Value Coffee
Making Uganda a Distinguished Producer of High Value Coffee
Uganda Coffee Development Authority ANNUAL REPORT 2010 - 2011
56 Making Uganda a Distinguished Producer of High Value Coffee
Uganda Coffee Development Authority ANNUAL REPORT 2010 – 2011
52
75UCDA Annual Report 2011/12
Making Uganda a Dinstinguished Producer of High Value Coffee
Making Uganda a Distinguished Producer of High Value Coffee
Uganda Coffee Development Authority ANNUAL REPORT 2010 - 2011
56 Making Uganda a Distinguished Producer of High Value Coffee
Uganda Coffee Development Authority ANNUAL REPORT 2010 – 2011
52 Making Uganda a Distinguished Producer of High Value Coffee 57
Uganda Coffee Development Authority ANNUAL REPORT 2010 - 2011
Making Uganda a Distinguished Producer of High Value Coffee
Uganda Coffee Development Authority ANNUAL REPORT 2010 – 2011
53
76 UCDA Annual Report 2011/12
Making Uganda a Dinstinguished Producer of High Value Coffee
Making Uganda a Distinguished Producer of High Value Coffee
Uganda Coffee Development Authority ANNUAL REPORT 2010 - 2011
58 Making Uganda a Distinguished Producer of High Value Coffee
Uganda Coffee Development Authority ANNUAL REPORT 2010 – 2011
54
77UCDA Annual Report 2011/12
Making Uganda a Dinstinguished Producer of High Value Coffee
Making Uganda a Distinguished Producer of High Value Coffee
Uganda Coffee Development Authority ANNUAL REPORT 2010 - 2011
58 Making Uganda a Distinguished Producer of High Value Coffee
Uganda Coffee Development Authority ANNUAL REPORT 2010 – 2011
54
FINANCIAL APPENDICES

78 UCDA Annual Report 2011/12
Making Uganda a Dinstinguished Producer of High Value Coffee
Making Uganda a Distinguished Producer of High Value Coffee
Uganda Coffee Development Authority ANNUAL REPORT 2010 - 2011
60 Making Uganda a Distinguished Producer of High Value Coffee
Uganda Coffee Development Authority ANNUAL REPORT 2010 – 2011
56
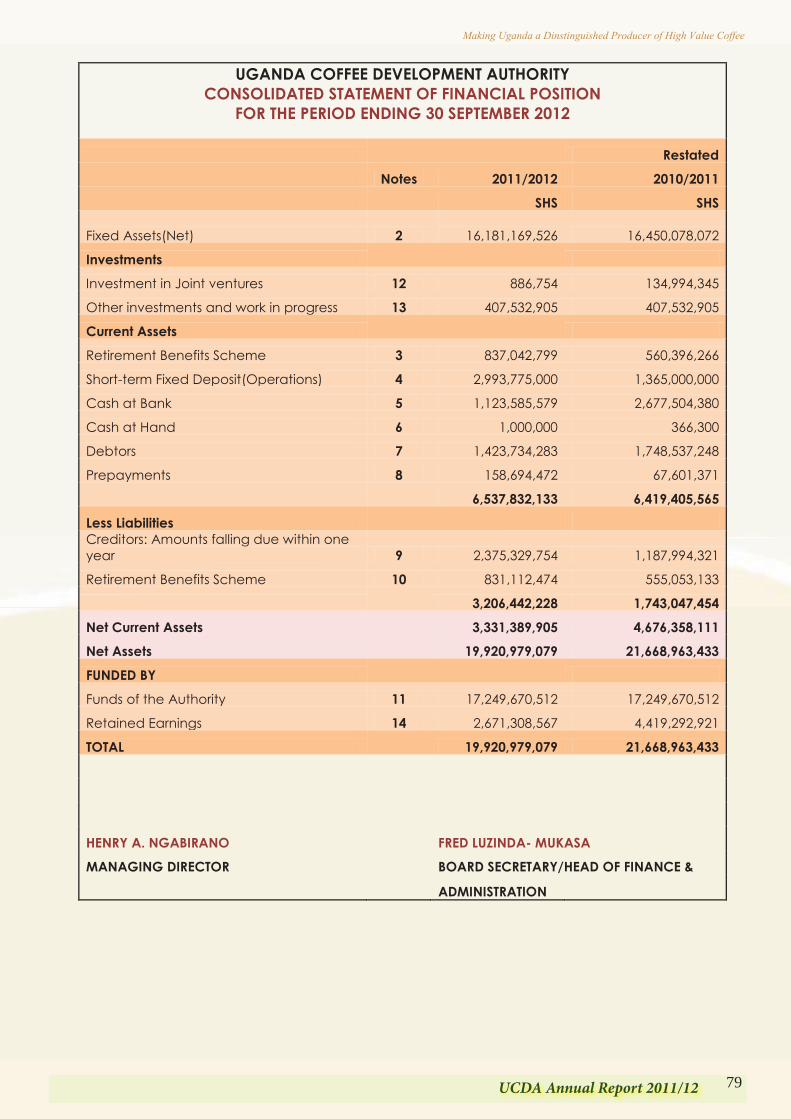
79UCDA Annual Report 2011/12
Making Uganda a Dinstinguished Producer of High Value Coffee
Making Uganda a Distinguished Producer of High Value Coffee
Uganda Coffee Development Authority ANNUAL REPORT 2010 - 2011
60 Making Uganda a Distinguished Producer of High Value Coffee
Uganda Coffee Development Authority ANNUAL REPORT 2010 – 2011
5679UCDA Annual Report 2011/12
Making Uganda a Dinstinguished Producer of High Value Coffee
UGANDA COFFEE DEVELOPMENT AUTHORITY CONSOLIDATED STATEMENT OF FINANCIAL POSITION
FOR THE PERIOD ENDING 30 SEPTEMBER 2012
Restated
Notes 2011/2012 2010/2011
SHS SHS
Fixed Assets(Net) 2
16,181,169,526 16,450,078,072
Investments
Investment in Joint ventures 12 886,754 134,994,345
Other investments and work in progress 13 407,532,905 407,532,905
Current Assets
Retirement Benefits Scheme 3 837,042,799 560,396,266
Short-term Fixed Deposit(Operations) 4 2,993,775,000 1,365,000,000
Cash at Bank 5 1,123,585,579 2,677,504,380
Cash at Hand 6 1,000,000 366,300
Debtors 7 1,423,734,283 1,748,537,248
Prepayments 8 158,694,472 67,601,371
6,537,832,133 6,419,405,565
Less Liabilities
Creditors: Amounts falling due within one year 9 2,375,329,754 1,187,994,321
Retirement Benefits Scheme 10 831,112,474 555,053,133
3,206,442,228 1,743,047,454
Net Current Assets
3,331,389,905 4,676,358,111
Net Assets
19,920,979,079 21,668,963,433
FUNDED BY
Funds of the Authority 11 17,249,670,512 17,249,670,512
Retained Earnings 14 2,671,308,567 4,419,292,921
TOTAL
19,920,979,079 21,668,963,433
HENRY A. NGABIRANO
FRED LUZINDA- MUKASA
MANAGING DIRECTOR
BOARD SECRETARY/HEAD OF FINANCE &
ADMINISTRATION
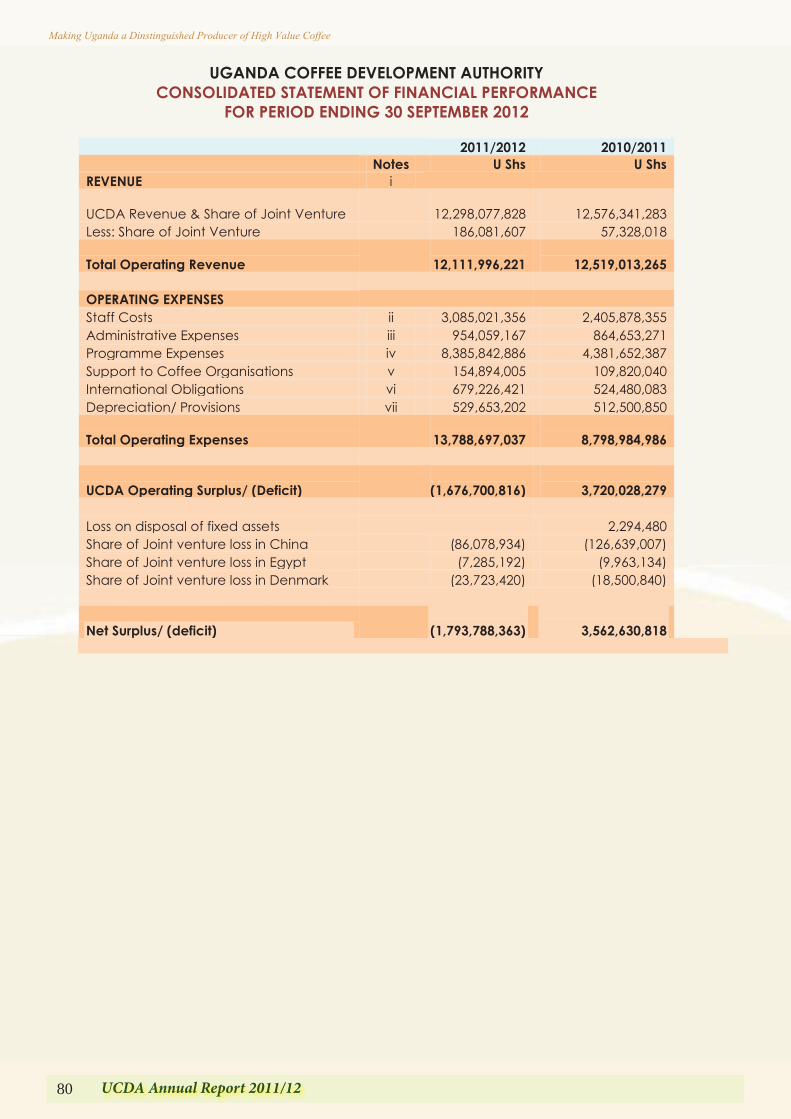
80 UCDA Annual Report 2011/12
Making Uganda a Dinstinguished Producer of High Value Coffee
80 UCDA Annual Report 2011/12
Making Uganda a Dinstinguished Producer of High Value Coffee
UGANDA COFFEE DEVELOPMENT AUTHORITY CONSOLIDATED STATEMENT OF FINANCIAL PERFORMANCE
FOR PERIOD ENDING 30 SEPTEMBER 2012
2011/2012 2010/2011
Notes U Shs U Shs
REVENUE i
UCDA Revenue & Share of Joint Venture
12,298,077,828
12,576,341,283
Less: Share of Joint Venture
186,081,607 57,328,018
Total Operating Revenue
12,111,996,221
12,519,013,265
OPERATING EXPENSES Staff Costs ii 3,085,021,356 2,405,878,355
Administrative Expenses iii 954,059,167 864,653,271 Programme Expenses iv 8,385,842,886 4,381,652,387 Support to Coffee Organisations v 154,894,005 109,820,040 International Obligations vi 679,226,421 524,480,083 Depreciation/ Provisions vii 529,653,202 512,500,850
Total Operating Expenses
13,788,697,037
8,798,984,986
UCDA Operating Surplus/ (Deficit)
(1,676,700,816)
3,720,028,279
Loss on disposal of fixed assets
2,294,480 Share of Joint venture loss in China
(86,078,934) (126,639,007)
Share of Joint venture loss in Egypt
(7,285,192) (9,963,134) Share of Joint venture loss in Denmark
(23,723,420) (18,500,840)
Net Surplus/ (deficit)
(1,793,788,363)
3,562,630,818
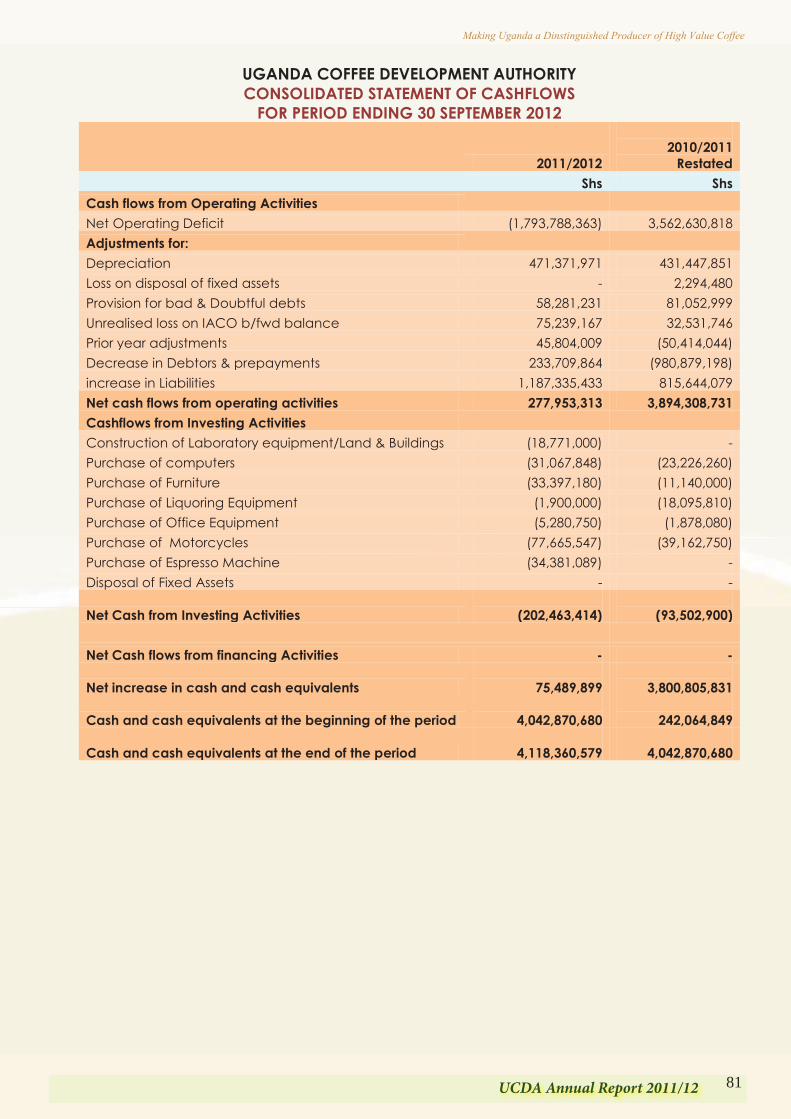
81UCDA Annual Report 2011/12
Making Uganda a Dinstinguished Producer of High Value Coffee
80 UCDA Annual Report 2011/12
Making Uganda a Dinstinguished Producer of High Value Coffee
UGANDA COFFEE DEVELOPMENT AUTHORITY CONSOLIDATED STATEMENT OF FINANCIAL PERFORMANCE
FOR PERIOD ENDING 30 SEPTEMBER 2012
2011/2012 2010/2011
Notes U Shs U Shs
REVENUE i
UCDA Revenue & Share of Joint Venture
12,298,077,828
12,576,341,283
Less: Share of Joint Venture
186,081,607 57,328,018
Total Operating Revenue
12,111,996,221
12,519,013,265
OPERATING EXPENSES Staff Costs ii 3,085,021,356 2,405,878,355
Administrative Expenses iii 954,059,167 864,653,271 Programme Expenses iv 8,385,842,886 4,381,652,387 Support to Coffee Organisations v 154,894,005 109,820,040 International Obligations vi 679,226,421 524,480,083 Depreciation/ Provisions vii 529,653,202 512,500,850
Total Operating Expenses
13,788,697,037
8,798,984,986
UCDA Operating Surplus/ (Deficit)
(1,676,700,816)
3,720,028,279
Loss on disposal of fixed assets
2,294,480 Share of Joint venture loss in China
(86,078,934) (126,639,007)
Share of Joint venture loss in Egypt
(7,285,192) (9,963,134) Share of Joint venture loss in Denmark
(23,723,420) (18,500,840)
Net Surplus/ (deficit)
(1,793,788,363)
3,562,630,818
81UCDA Annual Report 2011/12
Making Uganda a Dinstinguished Producer of High Value Coffee
UGANDA COFFEE DEVELOPMENT AUTHORITY CONSOLIDATED STATEMENT OF FINANCIAL PERFORMANCE
FOR PERIOD ENDING 30 SEPTEMBER 2012
2011/2012 2010/2011
Notes U Shs U Shs
REVENUE i
UCDA Revenue & Share of Joint Venture
12,298,077,828
12,576,341,283
Less: Share of Joint Venture
186,081,607 57,328,018
Total Operating Revenue
12,111,996,221
12,519,013,265
OPERATING EXPENSES Staff Costs ii 3,085,021,356 2,405,878,355
Administrative Expenses iii 954,059,167 864,653,271 Programme Expenses iv 8,385,842,886 4,381,652,387 Support to Coffee Organisations v 154,894,005 109,820,040 International Obligations vi 679,226,421 524,480,083 Depreciation/ Provisions vii 529,653,202 512,500,850
Total Operating Expenses
13,788,697,037
8,798,984,986
UCDA Operating Surplus/ (Deficit)
(1,676,700,816)
3,720,028,279
Loss on disposal of fixed assets
2,294,480 Share of Joint venture loss in China
(86,078,934) (126,639,007)
Share of Joint venture loss in Egypt
(7,285,192) (9,963,134) Share of Joint venture loss in Denmark
(23,723,420) (18,500,840)
Net Surplus/ (deficit)
(1,793,788,363)
3,562,630,818
UGANDA COFFEE DEVELOPMENT AUTHORITY CONSOLIDATED STATEMENT OF CASHFLOWS
FOR PERIOD ENDING 30 SEPTEMBER 2012
2011/2012
2010/2011
Restated
Shs Shs
Cash flows from Operating Activities Net Operating Deficit (1,793,788,363) 3,562,630,818
Adjustments for: Depreciation 471,371,971 431,447,851
Loss on disposal of fixed assets - 2,294,480 Provision for bad & Doubtful debts 58,281,231 81,052,999 Unrealised loss on IACO b/fwd balance 75,239,167 32,531,746 Prior year adjustments 45,804,009 (50,414,044) Decrease in Debtors & prepayments 233,709,864 (980,879,198) increase in Liabilities 1,187,335,433 815,644,079 Net cash flows from operating activities 277,953,313 3,894,308,731 Cashflows from Investing Activities
Construction of Laboratory equipment/Land & Buildings (18,771,000) - Purchase of computers (31,067,848) (23,226,260) Purchase of Furniture (33,397,180) (11,140,000) Purchase of Liquoring Equipment (1,900,000) (18,095,810) Purchase of Office Equipment (5,280,750) (1,878,080) Purchase of Motorcycles (77,665,547) (39,162,750) Purchase of Espresso Machine (34,381,089) - Disposal of Fixed Assets - -
Net Cash from Investing Activities
(202,463,414)
(93,502,900)
Net Cash flows from financing Activities - -
Net increase in cash and cash equivalents
75,489,899
3,800,805,831
Cash and cash equivalents at the beginning of the period
4,042,870,680
242,064,849
Cash and cash equivalents at the end of the period
4,118,360,579
4,042,870,680
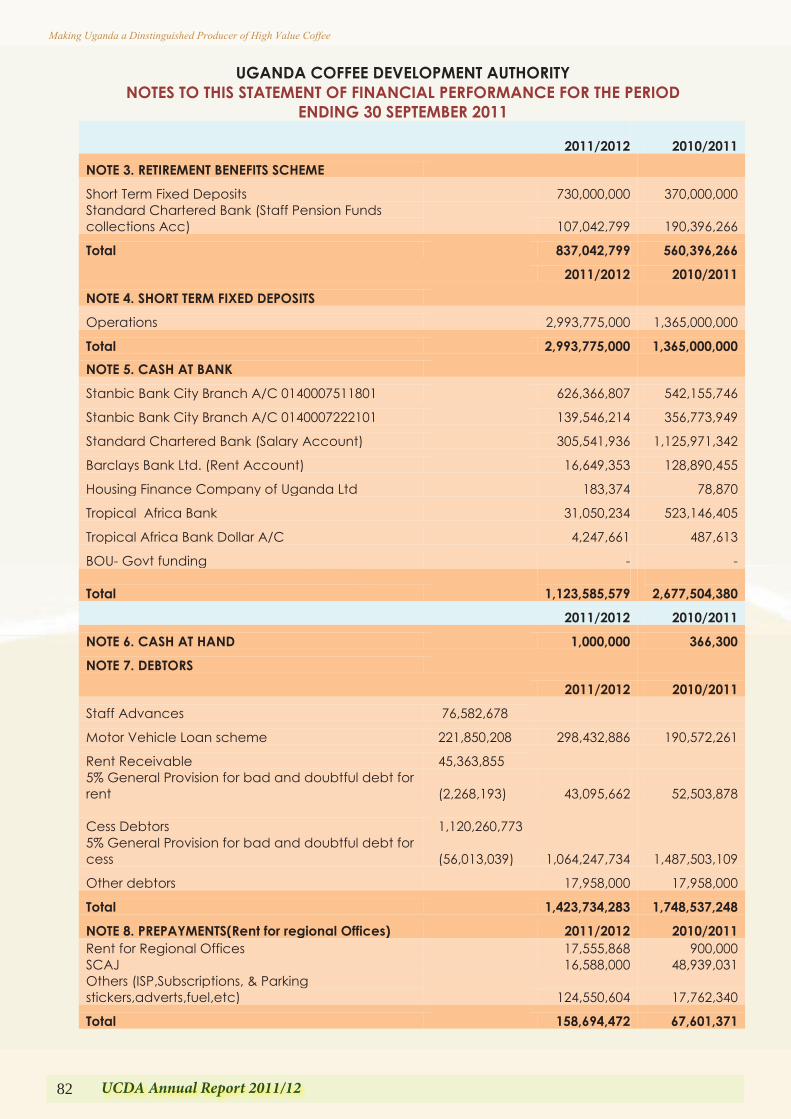
82 UCDA Annual Report 2011/12
Making Uganda a Dinstinguished Producer of High Value Coffee
82 UCDA Annual Report 2011/12
Making Uganda a Dinstinguished Producer of High Value Coffee
UGANDA COFFEE DEVELOPMENT AUTHORITY NOTES TO THIS STATEMENT OF FINANCIAL PERFORMANCE FOR THE PERIOD
ENDING 30 SEPTEMBER 2011
2011/2012 2010/2011
NOTE 3. RETIREMENT BENEFITS SCHEME Short Term Fixed Deposits
730,000,000 370,000,000 Standard Chartered Bank (Staff Pension Funds collections Acc)
107,042,799 190,396,266
Total
837,042,799 560,396,266
2011/2012 2010/2011
NOTE 4. SHORT TERM FIXED DEPOSITS Operations
2,993,775,000 1,365,000,000
Total
2,993,775,000 1,365,000,000 NOTE 5. CASH AT BANK
Stanbic Bank City Branch A/C 0140007511801
626,366,807 542,155,746
Stanbic Bank City Branch A/C 0140007222101
139,546,214 356,773,949
Standard Chartered Bank (Salary Account)
305,541,936 1,125,971,342
Barclays Bank Ltd. (Rent Account)
16,649,353 128,890,455
Housing Finance Company of Uganda Ltd
183,374 78,870
Tropical Africa Bank
31,050,234 523,146,405
Tropical Africa Bank Dollar A/C
4,247,661 487,613
BOU- Govt funding
- -
Total
1,123,585,579
2,677,504,380
2011/2012 2010/2011
NOTE 6. CASH AT HAND
1,000,000 366,300
NOTE 7. DEBTORS
2011/2012 2010/2011
Staff Advances 76,582,678 Motor Vehicle Loan scheme 221,850,208 298,432,886 190,572,261
Rent Receivable 45,363,855 5% General Provision for bad and doubtful debt for
rent (2,268,193)
43,095,662
52,503,878
Cess Debtors 1,120,260,773
5% General Provision for bad and doubtful debt for cess
(56,013,039) 1,064,247,734 1,487,503,109
Other debtors
17,958,000 17,958,000
Total
1,423,734,283 1,748,537,248
NOTE 8. PREPAYMENTS(Rent for regional Offices)
2011/2012 2010/2011 Rent for Regional Offices
17,555,868 900,000
SCAJ
16,588,000 48,939,031 Others (ISP,Subscriptions, & Parking stickers,adverts,fuel,etc)
124,550,604 17,762,340
Total
158,694,472 67,601,371
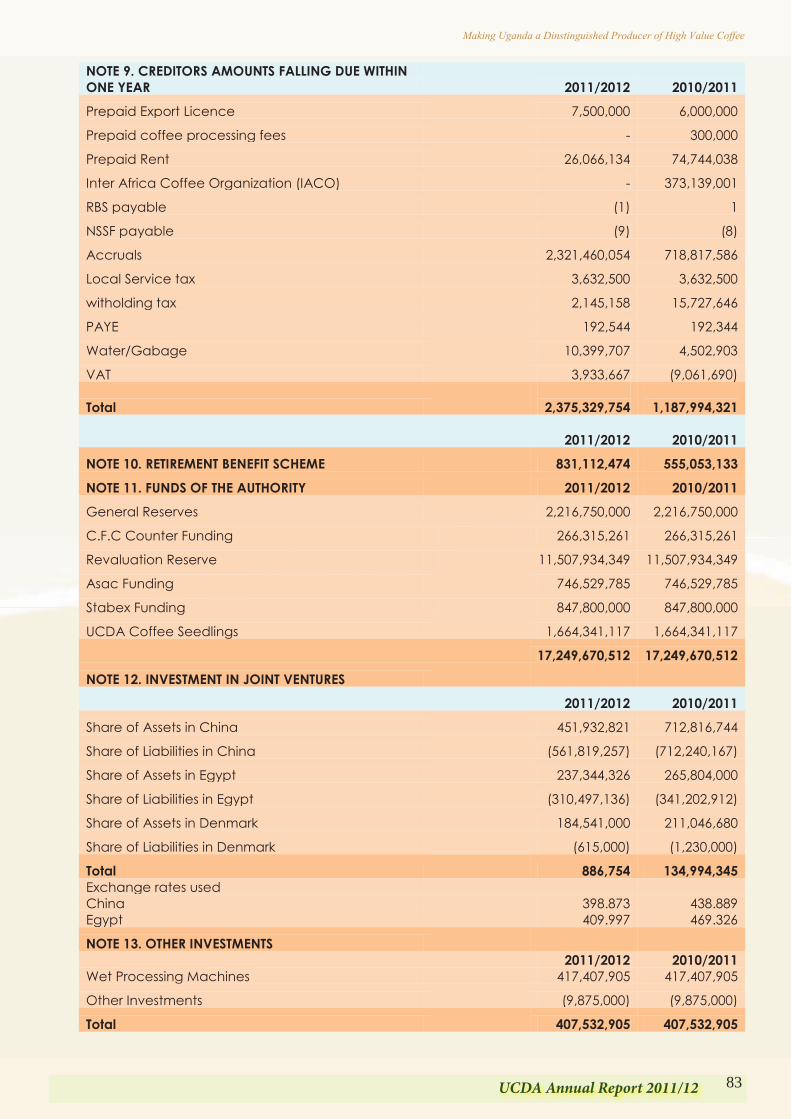
83UCDA Annual Report 2011/12
Making Uganda a Dinstinguished Producer of High Value Coffee
82 UCDA Annual Report 2011/12
Making Uganda a Dinstinguished Producer of High Value Coffee
UGANDA COFFEE DEVELOPMENT AUTHORITY NOTES TO THIS STATEMENT OF FINANCIAL PERFORMANCE FOR THE PERIOD
ENDING 30 SEPTEMBER 2011
2011/2012 2010/2011
NOTE 3. RETIREMENT BENEFITS SCHEME Short Term Fixed Deposits
730,000,000 370,000,000 Standard Chartered Bank (Staff Pension Funds collections Acc)
107,042,799 190,396,266
Total
837,042,799 560,396,266
2011/2012 2010/2011
NOTE 4. SHORT TERM FIXED DEPOSITS Operations
2,993,775,000 1,365,000,000
Total
2,993,775,000 1,365,000,000 NOTE 5. CASH AT BANK
Stanbic Bank City Branch A/C 0140007511801
626,366,807 542,155,746
Stanbic Bank City Branch A/C 0140007222101
139,546,214 356,773,949
Standard Chartered Bank (Salary Account)
305,541,936 1,125,971,342
Barclays Bank Ltd. (Rent Account)
16,649,353 128,890,455
Housing Finance Company of Uganda Ltd
183,374 78,870
Tropical Africa Bank
31,050,234 523,146,405
Tropical Africa Bank Dollar A/C
4,247,661 487,613
BOU- Govt funding
- -
Total
1,123,585,579
2,677,504,380
2011/2012 2010/2011
NOTE 6. CASH AT HAND
1,000,000 366,300
NOTE 7. DEBTORS
2011/2012 2010/2011
Staff Advances 76,582,678 Motor Vehicle Loan scheme 221,850,208 298,432,886 190,572,261
Rent Receivable 45,363,855 5% General Provision for bad and doubtful debt for
rent (2,268,193)
43,095,662
52,503,878
Cess Debtors 1,120,260,773
5% General Provision for bad and doubtful debt for cess
(56,013,039) 1,064,247,734 1,487,503,109
Other debtors
17,958,000 17,958,000
Total
1,423,734,283 1,748,537,248
NOTE 8. PREPAYMENTS(Rent for regional Offices)
2011/2012 2010/2011 Rent for Regional Offices
17,555,868 900,000
SCAJ
16,588,000 48,939,031 Others (ISP,Subscriptions, & Parking stickers,adverts,fuel,etc)
124,550,604 17,762,340
Total
158,694,472 67,601,371
83UCDA Annual Report 2011/12
Making Uganda a Dinstinguished Producer of High Value Coffee
NOTE 9. CREDITORS AMOUNTS FALLING DUE WITHIN ONE YEAR
2011/2012 2010/2011
Prepaid Export Licence
7,500,000 6,000,000
Prepaid coffee processing fees
- 300,000
Prepaid Rent
26,066,134 74,744,038
Inter Africa Coffee Organization (IACO)
- 373,139,001
RBS payable
(1) 1
NSSF payable
(9) (8)
Accruals
2,321,460,054 718,817,586
Local Service tax
3,632,500 3,632,500
witholding tax
2,145,158 15,727,646
PAYE
192,544 192,344
Water/Gabage
10,399,707 4,502,903
VAT
3,933,667 (9,061,690)
Total
2,375,329,754
1,187,994,321
2011/2012 2010/2011
NOTE 10. RETIREMENT BENEFIT SCHEME
831,112,474 555,053,133
NOTE 11. FUNDS OF THE AUTHORITY
2011/2012 2010/2011
General Reserves
2,216,750,000 2,216,750,000
C.F.C Counter Funding 266,315,261 266,315,261
Revaluation Reserve 11,507,934,349 11,507,934,349
Asac Funding
746,529,785 746,529,785
Stabex Funding 847,800,000 847,800,000
UCDA Coffee Seedlings
1,664,341,117 1,664,341,117
17,249,670,512 17,249,670,512
NOTE 12. INVESTMENT IN JOINT VENTURES
2011/2012 2010/2011
Share of Assets in China
451,932,821 712,816,744
Share of Liabilities in China
(561,819,257) (712,240,167)
Share of Assets in Egypt
237,344,326 265,804,000
Share of Liabilities in Egypt
(310,497,136) (341,202,912)
Share of Assets in Denmark
184,541,000 211,046,680
Share of Liabilities in Denmark
(615,000) (1,230,000)
Total
886,754 134,994,345 Exchange rates used
China
398.873 438.889 Egypt
409.997 469.326
NOTE 13. OTHER INVESTMENTS
2011/2012 2010/2011
Wet Processing Machines
417,407,905 417,407,905
Other Investments
(9,875,000) (9,875,000)
Total
407,532,905 407,532,905
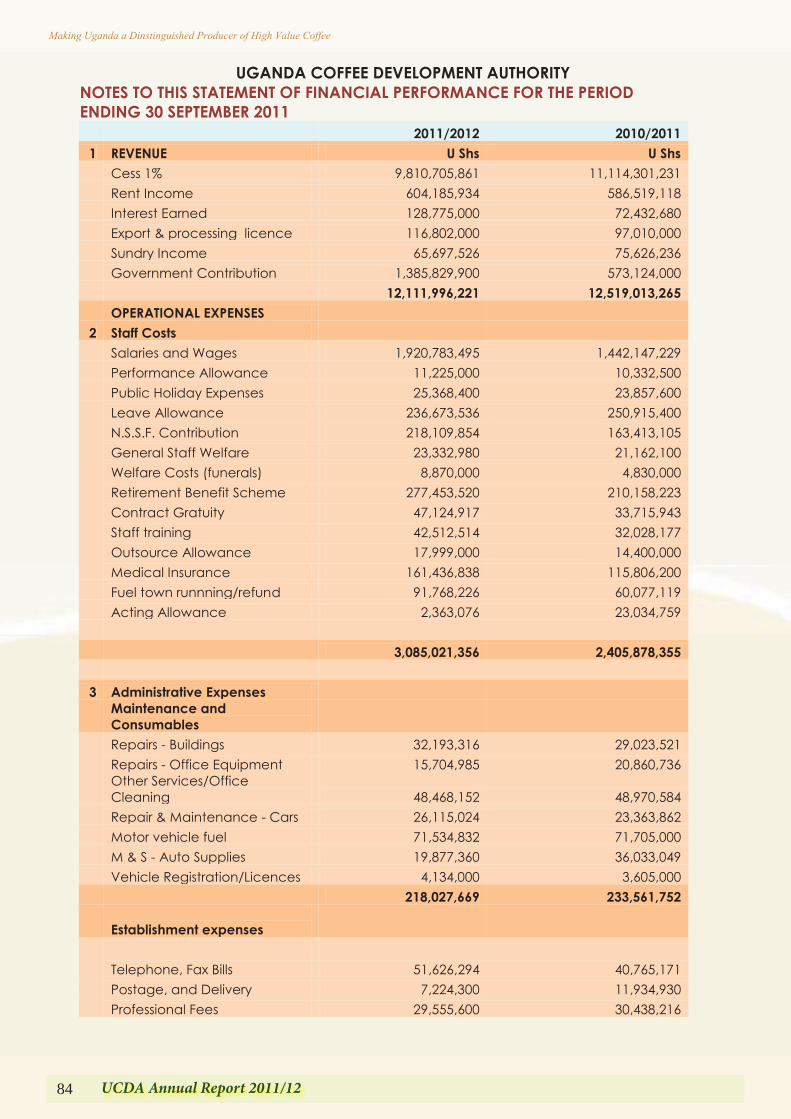
84 UCDA Annual Report 2011/12
Making Uganda a Dinstinguished Producer of High Value Coffee
84 UCDA Annual Report 2011/12
Making Uganda a Dinstinguished Producer of High Value Coffee
UGANDA COFFEE DEVELOPMENT AUTHORITY NOTES TO THIS STATEMENT OF FINANCIAL PERFORMANCE FOR THE PERIOD ENDING 30 SEPTEMBER 2011
2011/2012 2010/2011
1 REVENUE U Shs U Shs
Cess 1% 9,810,705,861 11,114,301,231
Rent Income 604,185,934 586,519,118
Interest Earned 128,775,000 72,432,680
Export & processing licence 116,802,000 97,010,000
Sundry Income 65,697,526 75,626,236
Government Contribution 1,385,829,900 573,124,000
12,111,996,221 12,519,013,265
OPERATIONAL EXPENSES
2 Staff Costs
Salaries and Wages 1,920,783,495 1,442,147,229
Performance Allowance 11,225,000 10,332,500
Public Holiday Expenses 25,368,400 23,857,600
Leave Allowance 236,673,536 250,915,400
N.S.S.F. Contribution 218,109,854 163,413,105
General Staff Welfare 23,332,980 21,162,100
Welfare Costs (funerals) 8,870,000 4,830,000
Retirement Benefit Scheme 277,453,520 210,158,223
Contract Gratuity 47,124,917 33,715,943
Staff training 42,512,514 32,028,177
Outsource Allowance 17,999,000 14,400,000
Medical Insurance 161,436,838 115,806,200
Fuel town runnning/refund 91,768,226 60,077,119
Acting Allowance 2,363,076 23,034,759
3,085,021,356 2,405,878,355
3 Administrative Expenses
Maintenance and Consumables
Repairs - Buildings 32,193,316 29,023,521
Repairs - Office Equipment 15,704,985 20,860,736
Other Services/Office Cleaning 48,468,152 48,970,584
Repair & Maintenance - Cars 26,115,024 23,363,862
Motor vehicle fuel 71,534,832 71,705,000
M & S - Auto Supplies 19,877,360 36,033,049
Vehicle Registration/Licences 4,134,000 3,605,000
218,027,669 233,561,752
Establishment expenses
Telephone, Fax Bills 51,626,294 40,765,171
Postage, and Delivery 7,224,300 11,934,930
Professional Fees 29,555,600 30,438,216
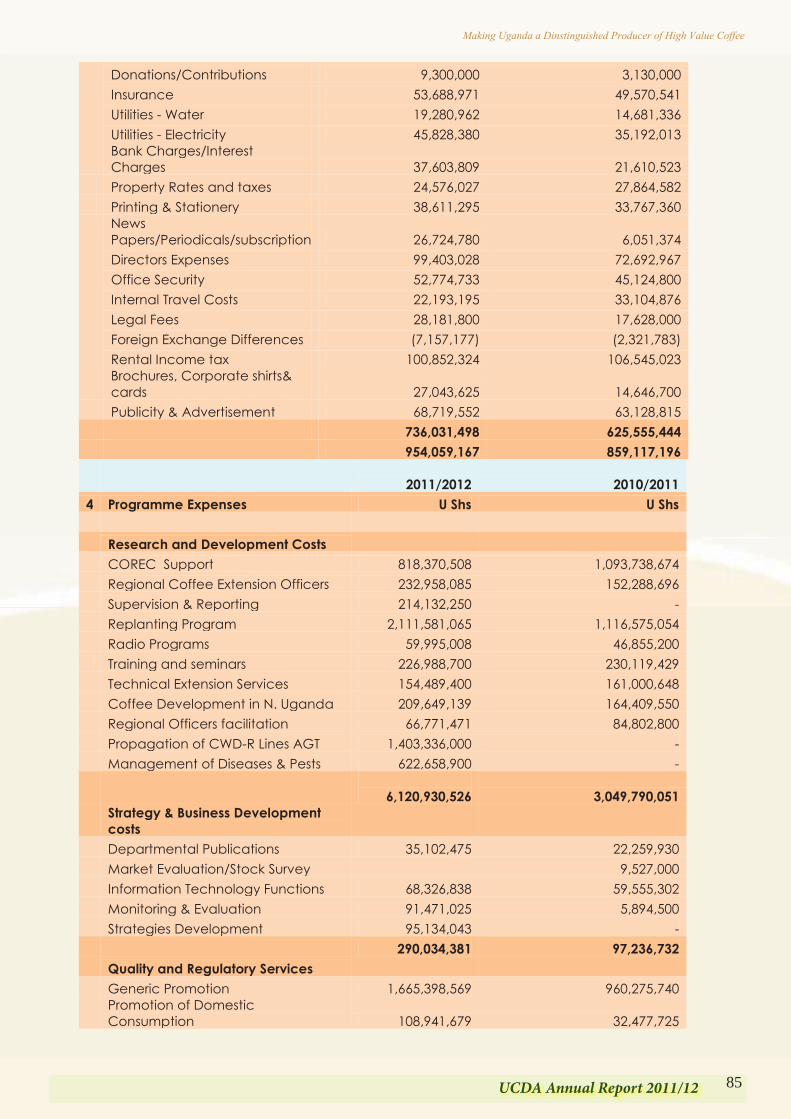
85UCDA Annual Report 2011/12
Making Uganda a Dinstinguished Producer of High Value Coffee
84 UCDA Annual Report 2011/12
Making Uganda a Dinstinguished Producer of High Value Coffee
UGANDA COFFEE DEVELOPMENT AUTHORITY NOTES TO THIS STATEMENT OF FINANCIAL PERFORMANCE FOR THE PERIOD ENDING 30 SEPTEMBER 2011
2011/2012 2010/2011
1 REVENUE U Shs U Shs
Cess 1% 9,810,705,861 11,114,301,231
Rent Income 604,185,934 586,519,118
Interest Earned 128,775,000 72,432,680
Export & processing licence 116,802,000 97,010,000
Sundry Income 65,697,526 75,626,236
Government Contribution 1,385,829,900 573,124,000
12,111,996,221 12,519,013,265
OPERATIONAL EXPENSES
2 Staff Costs
Salaries and Wages 1,920,783,495 1,442,147,229
Performance Allowance 11,225,000 10,332,500
Public Holiday Expenses 25,368,400 23,857,600
Leave Allowance 236,673,536 250,915,400
N.S.S.F. Contribution 218,109,854 163,413,105
General Staff Welfare 23,332,980 21,162,100
Welfare Costs (funerals) 8,870,000 4,830,000
Retirement Benefit Scheme 277,453,520 210,158,223
Contract Gratuity 47,124,917 33,715,943
Staff training 42,512,514 32,028,177
Outsource Allowance 17,999,000 14,400,000
Medical Insurance 161,436,838 115,806,200
Fuel town runnning/refund 91,768,226 60,077,119
Acting Allowance 2,363,076 23,034,759
3,085,021,356 2,405,878,355
3 Administrative Expenses
Maintenance and Consumables
Repairs - Buildings 32,193,316 29,023,521
Repairs - Office Equipment 15,704,985 20,860,736
Other Services/Office Cleaning 48,468,152 48,970,584
Repair & Maintenance - Cars 26,115,024 23,363,862
Motor vehicle fuel 71,534,832 71,705,000
M & S - Auto Supplies 19,877,360 36,033,049
Vehicle Registration/Licences 4,134,000 3,605,000
218,027,669 233,561,752
Establishment expenses
Telephone, Fax Bills 51,626,294 40,765,171
Postage, and Delivery 7,224,300 11,934,930
Professional Fees 29,555,600 30,438,216
85UCDA Annual Report 2011/12
Making Uganda a Dinstinguished Producer of High Value Coffee
UGANDA COFFEE DEVELOPMENT AUTHORITY NOTES TO THIS STATEMENT OF FINANCIAL PERFORMANCE FOR THE PERIOD ENDING 30 SEPTEMBER 2011
2011/2012 2010/2011
1 REVENUE U Shs U Shs
Cess 1% 9,810,705,861 11,114,301,231
Rent Income 604,185,934 586,519,118
Interest Earned 128,775,000 72,432,680
Export & processing licence 116,802,000 97,010,000
Sundry Income 65,697,526 75,626,236
Government Contribution 1,385,829,900 573,124,000
12,111,996,221 12,519,013,265
OPERATIONAL EXPENSES
2 Staff Costs
Salaries and Wages 1,920,783,495 1,442,147,229
Performance Allowance 11,225,000 10,332,500
Public Holiday Expenses 25,368,400 23,857,600
Leave Allowance 236,673,536 250,915,400
N.S.S.F. Contribution 218,109,854 163,413,105
General Staff Welfare 23,332,980 21,162,100
Welfare Costs (funerals) 8,870,000 4,830,000
Retirement Benefit Scheme 277,453,520 210,158,223
Contract Gratuity 47,124,917 33,715,943
Staff training 42,512,514 32,028,177
Outsource Allowance 17,999,000 14,400,000
Medical Insurance 161,436,838 115,806,200
Fuel town runnning/refund 91,768,226 60,077,119
Acting Allowance 2,363,076 23,034,759
3,085,021,356 2,405,878,355
3 Administrative Expenses
Maintenance and Consumables
Repairs - Buildings 32,193,316 29,023,521
Repairs - Office Equipment 15,704,985 20,860,736
Other Services/Office Cleaning 48,468,152 48,970,584
Repair & Maintenance - Cars 26,115,024 23,363,862
Motor vehicle fuel 71,534,832 71,705,000
M & S - Auto Supplies 19,877,360 36,033,049
Vehicle Registration/Licences 4,134,000 3,605,000
218,027,669 233,561,752
Establishment expenses
Telephone, Fax Bills 51,626,294 40,765,171
Postage, and Delivery 7,224,300 11,934,930
Professional Fees 29,555,600 30,438,216
Donations/Contributions 9,300,000 3,130,000
Insurance 53,688,971 49,570,541
Utilities - Water 19,280,962 14,681,336
Utilities - Electricity 45,828,380 35,192,013
Bank Charges/Interest Charges 37,603,809 21,610,523
Property Rates and taxes 24,576,027 27,864,582 Printing & Stationery 38,611,295 33,767,360
News Papers/Periodicals/subscription 26,724,780 6,051,374
Directors Expenses 99,403,028 72,692,967
Office Security 52,774,733 45,124,800
Internal Travel Costs 22,193,195 33,104,876
Legal Fees 28,181,800 17,628,000
Foreign Exchange Differences (7,157,177) (2,321,783)
Rental Income tax 100,852,324 106,545,023
Brochures, Corporate shirts& cards 27,043,625 14,646,700
Publicity & Advertisement 68,719,552 63,128,815
736,031,498 625,555,444
954,059,167 859,117,196
2011/2012 2010/2011
4 Programme Expenses U Shs U Shs
Research and Development Costs
COREC Support 818,370,508 1,093,738,674
Regional Coffee Extension Officers 232,958,085 152,288,696
Supervision & Reporting 214,132,250 -
Replanting Program 2,111,581,065 1,116,575,054
Radio Programs 59,995,008 46,855,200
Training and seminars 226,988,700 230,119,429
Technical Extension Services 154,489,400 161,000,648
Coffee Development in N. Uganda 209,649,139 164,409,550
Regional Officers facilitation 66,771,471 84,802,800
Propagation of CWD-R Lines AGT 1,403,336,000 -
Management of Diseases & Pests 622,658,900 -
6,120,930,526 3,049,790,051
Strategy & Business Development costs
Departmental Publications 35,102,475 22,259,930
Market Evaluation/Stock Survey
9,527,000
Information Technology Functions 68,326,838 59,555,302
Monitoring & Evaluation 91,471,025 5,894,500
Strategies Development 95,134,043 -
290,034,381 97,236,732
Quality and Regulatory Services
Generic Promotion 1,665,398,569 960,275,740
Promotion of Domestic Consumption 108,941,679 32,477,725
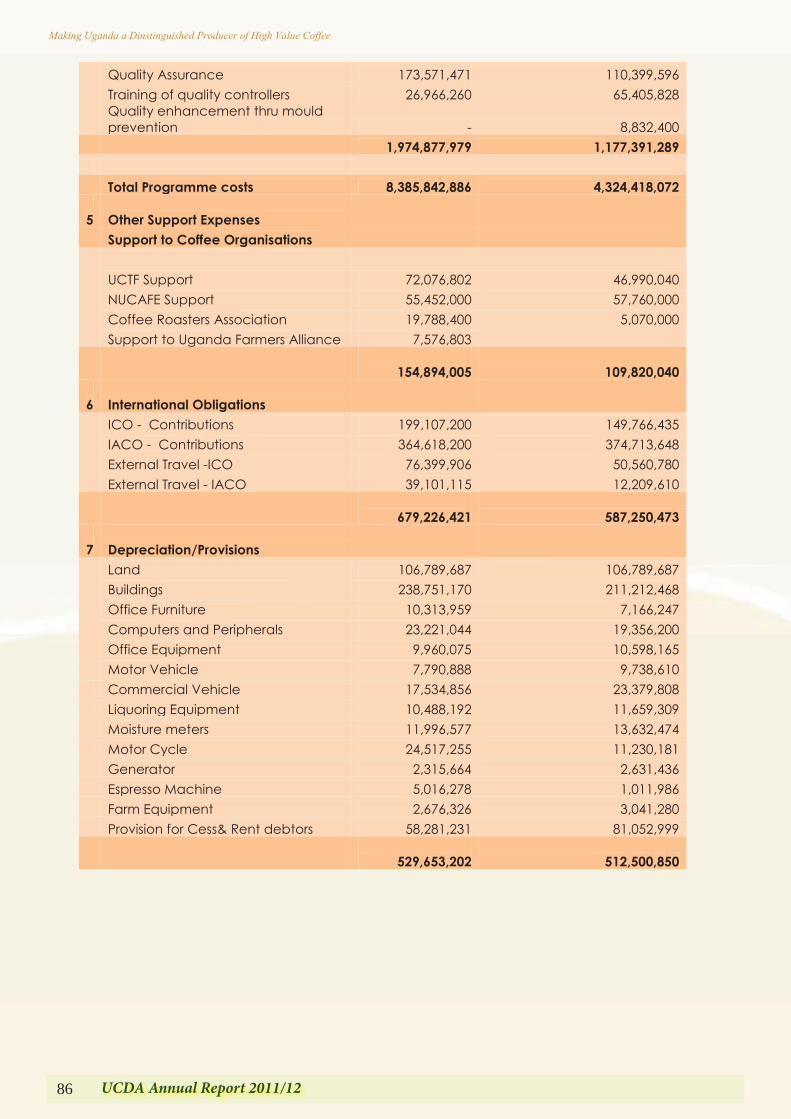
86 UCDA Annual Report 2011/12
Making Uganda a Dinstinguished Producer of High Value Coffee
86 UCDA Annual Report 2011/12
Making Uganda a Dinstinguished Producer of High Value Coffee
Quality Assurance 173,571,471 110,399,596
Training of quality controllers 26,966,260 65,405,828
Quality enhancement thru mould prevention - 8,832,400
1,974,877,979 1,177,391,289
Total Programme costs 8,385,842,886 4,324,418,072
5 Other Support Expenses
Support to Coffee Organisations
UCTF Support 72,076,802 46,990,040
NUCAFE Support 55,452,000 57,760,000
Coffee Roasters Association 19,788,400 5,070,000
Support to Uganda Farmers Alliance 7,576,803
154,894,005 109,820,040
6 International Obligations
ICO - Contributions 199,107,200 149,766,435
IACO - Contributions 364,618,200 374,713,648
External Travel -ICO 76,399,906 50,560,780
External Travel - IACO 39,101,115 12,209,610
679,226,421 587,250,473
7 Depreciation/Provisions
Land 106,789,687 106,789,687
Buildings 238,751,170 211,212,468
Office Furniture 10,313,959 7,166,247
Computers and Peripherals 23,221,044 19,356,200
Office Equipment 9,960,075 10,598,165
Motor Vehicle 7,790,888 9,738,610
Commercial Vehicle 17,534,856 23,379,808 Liquoring Equipment 10,488,192 11,659,309
Moisture meters 11,996,577 13,632,474
Motor Cycle 24,517,255 11,230,181
Generator 2,315,664 2,631,436
Espresso Machine 5,016,278 1,011,986
Farm Equipment 2,676,326 3,041,280
Provision for Cess& Rent debtors 58,281,231 81,052,999
529,653,202 512,500,850
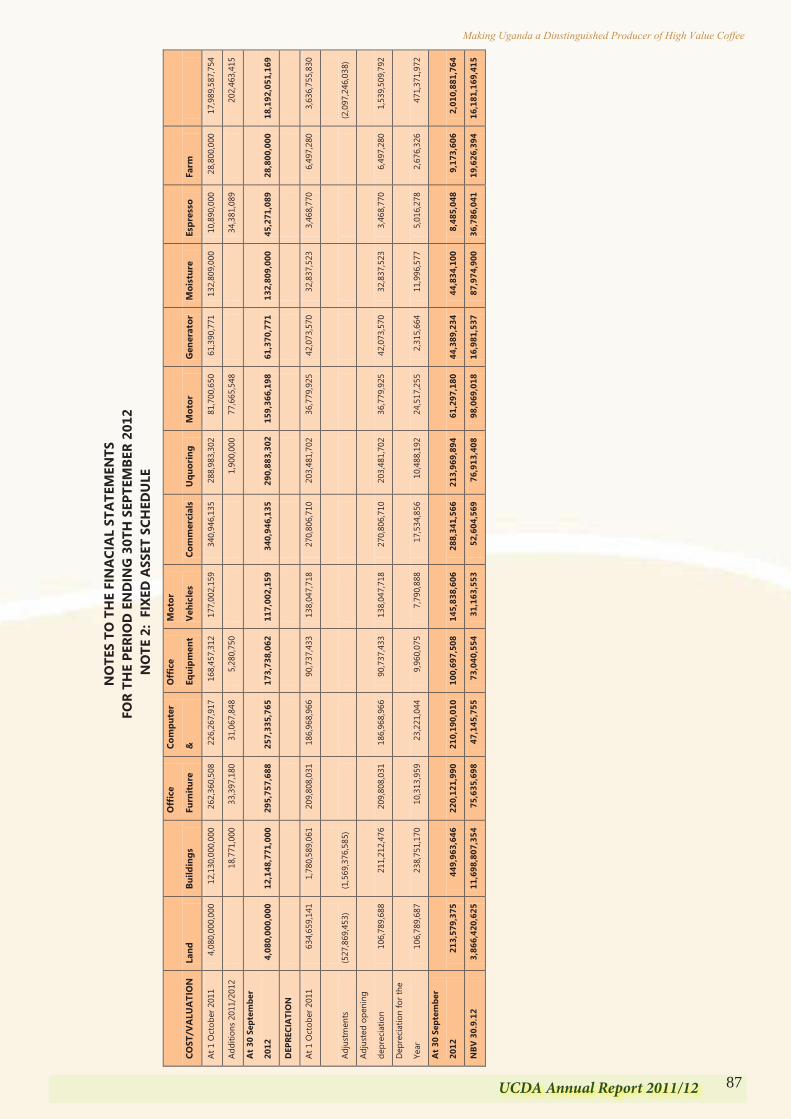
87UCDA Annual Report 2011/12
Making Uganda a Dinstinguished Producer of High Value Coffee
86 UCDA Annual Report 2011/12
Making Uganda a Dinstinguished Producer of High Value Coffee
Quality Assurance 173,571,471 110,399,596
Training of quality controllers 26,966,260 65,405,828
Quality enhancement thru mould prevention - 8,832,400
1,974,877,979 1,177,391,289
Total Programme costs 8,385,842,886 4,324,418,072
5 Other Support Expenses
Support to Coffee Organisations
UCTF Support 72,076,802 46,990,040
NUCAFE Support 55,452,000 57,760,000
Coffee Roasters Association 19,788,400 5,070,000
Support to Uganda Farmers Alliance 7,576,803
154,894,005 109,820,040
6 International Obligations
ICO - Contributions 199,107,200 149,766,435
IACO - Contributions 364,618,200 374,713,648
External Travel -ICO 76,399,906 50,560,780
External Travel - IACO 39,101,115 12,209,610
679,226,421 587,250,473
7 Depreciation/Provisions
Land 106,789,687 106,789,687
Buildings 238,751,170 211,212,468
Office Furniture 10,313,959 7,166,247
Computers and Peripherals 23,221,044 19,356,200
Office Equipment 9,960,075 10,598,165
Motor Vehicle 7,790,888 9,738,610
Commercial Vehicle 17,534,856 23,379,808 Liquoring Equipment 10,488,192 11,659,309
Moisture meters 11,996,577 13,632,474
Motor Cycle 24,517,255 11,230,181
Generator 2,315,664 2,631,436
Espresso Machine 5,016,278 1,011,986
Farm Equipment 2,676,326 3,041,280
Provision for Cess& Rent debtors 58,281,231 81,052,999
529,653,202 512,500,850
NO
TES
TO T
HE
FIN
ACI
AL
STA
TEM
ENTS
FO
R TH
E PE
RIO
D E
ND
ING
30T
H S
EPTE
MBE
R 20
12
N
OTE
2:
FIXE
D A
SSET
SCH
EDU
LE
COST
/VA
LUA
TIO
N
Land
Bu
ildin
gs
Off
ice
Furn
iture
Com
pute
r
&
Off
ice
Equi
pmen
t
Mot
or
Vehi
cles
Co
mm
erci
als
Uqu
orin
g M
otor
G
ener
ator
M
oist
ure
Espr
esso
Fa
rm
At 1
Oct
ober
201
1 4,
080,
000,
000
12,1
30,0
00,0
00
262,
360,
508
226,
267,
917
168,
457,
312
177,
002,
159
340,
946,
135
288,
983,
302
81,7
00,6
50
61,3
90,7
71
132,
809,
000
10,8
90,0
00
28,8
00,0
00
17,9
89,5
87,7
54
Addi
tions
201
1/20
12
18
,771
,000
33
,397
,180
31
,067
,848
5,
280,
750
1,90
0,00
0 77
,665
,548
34
,381
,089
202,
463,
415
At 3
0 Se
ptem
ber
2012
4,
080,
000,
000
12,1
48,7
71,0
00
295,
757,
688
257,
335,
765
173,
738,
062
117,
002,
159
340,
946,
135
290,
883,
302
159,
366,
198
61,3
70,7
71
132,
809,
000
45,2
71,0
89
28,8
00,0
00
18,1
92,0
51,1
69
DEP
RECI
ATI
ON
At 1
Oct
ober
201
1 63
4,65
9,14
1 1,
780,
589,
061
209,
808,
031
186,
968,
966
90,7
37,4
33
138,
047,
718
270,
806,
710
203,
481,
702
36,7
79,9
25
42,0
73,5
70
32,8
37,5
23
3,46
8,77
0 6,
497,
280
3,63
6,75
5,83
0
Adju
stm
ents
(527
,869
,453
)
(1,5
69,3
76,5
85)
(2,0
97,2
46,0
38)
Adju
sted
ope
ning
depr
ecia
tion
106,
789,
688
211,
212,
476
209,
808,
031
186,
968,
966
90,7
37,4
33
138,
047,
718
270,
806,
710
203,
481,
702
36,7
79,9
25
42,0
73,5
70
32,8
37,5
23
3,46
8,77
0 6,
497,
280
1,53
9,50
9,79
2
Dep
reci
atio
n fo
r the
Year
10
6,78
9,68
7 23
8,75
1,17
0 10
,313
,959
23
,221
,044
9,
960,
075
7,79
0,88
8 17
,534
,856
10
,488
,192
24
,517
,255
2,
315,
664
11,9
96,5
77
5,01
6,27
8 2,
676,
326
471,
371,
972
At 3
0 Se
ptem
ber
2012
21
3,57
9,37
5 44
9,96
3,64
6 22
0,12
1,99
0 21
0,19
0,01
0 10
0,69
7,50
8 14
5,83
8,60
6 28
8,34
1,56
6 21
3,96
9,89
4 61
,297
,180
44
,389
,234
44
,834
,100
8,
485,
048
9,17
3,60
6 2,
010,
881,
764
NBV
30.
9.12
3,
866,
420,
625
11,6
98,8
07,3
54
75,6
35,6
98
47,1
45,7
55
73,0
40,5
54
31,1
63,5
53
52,6
04,5
69
76,9
13,4
08
98,0
69,0
18
16,9
81,5
37
87,9
74,9
00
36,7
86,0
41
19,6
26,3
94
16,1
81,1
69,4
15
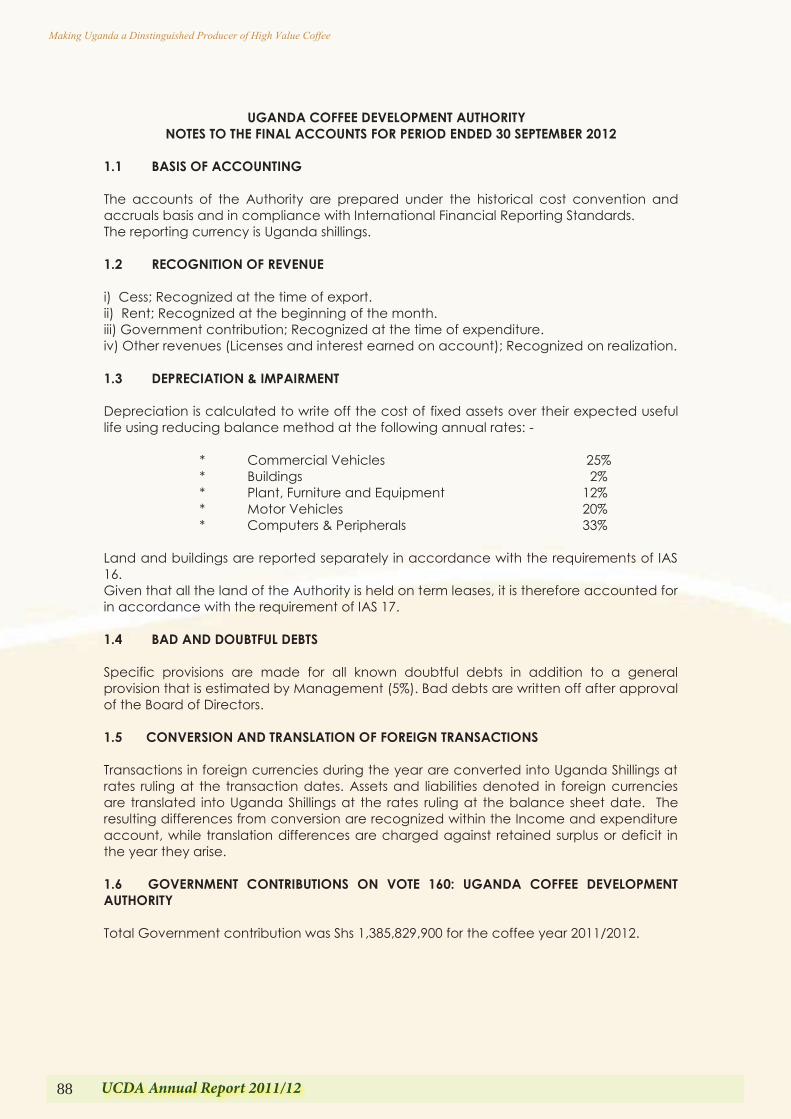
88 UCDA Annual Report 2011/12
Making Uganda a Dinstinguished Producer of High Value Coffee
UGANDA COFFEE DEVELOPMENT AUTHORITY
NOTES TO THE FINAL ACCOUNTS FOR PERIOD ENDED 30 SEPTEMBER 2012
1.1 BASIS OF ACCOUNTING The accounts of the Authority are prepared under the historical cost convention and accruals basis and in compliance with International Financial Reporting Standards. The reporting currency is Uganda shillings. 1.2 RECOGNITION OF REVENUE i) Cess; Recognized at the time of export. ii) Rent; Recognized at the beginning of the month. iii) Government contribution; Recognized at the time of expenditure. iv) Other revenues (Licenses and interest earned on account); Recognized on realization. 1.3 DEPRECIATION & IMPAIRMENT Depreciation is calculated to write off the cost of fixed assets over their expected useful life using reducing balance method at the following annual rates: - * Commercial Vehicles 25% * Buildings 2% * Plant, Furniture and Equipment 12% * Motor Vehicles 20% * Computers & Peripherals 33% Land and buildings are reported separately in accordance with the requirements of IAS 16. Given that all the land of the Authority is held on term leases, it is therefore accounted for in accordance with the requirement of IAS 17. 1.4 BAD AND DOUBTFUL DEBTS Specific provisions are made for all known doubtful debts in addition to a general provision that is estimated by Management (5%). Bad debts are written off after approval of the Board of Directors. 1.5 CONVERSION AND TRANSLATION OF FOREIGN TRANSACTIONS Transactions in foreign currencies during the year are converted into Uganda Shillings at rates ruling at the transaction dates. Assets and liabilities denoted in foreign currencies are translated into Uganda Shillings at the rates ruling at the balance sheet date. The resulting differences from conversion are recognized within the Income and expenditure account, while translation differences are charged against retained surplus or deficit in the year they arise. 1.6 GOVERNMENT CONTRIBUTIONS ON VOTE 160: UGANDA COFFEE DEVELOPMENT AUTHORITY Total Government contribution was Shs 1,385,829,900 for the coffee year 2011/2012.
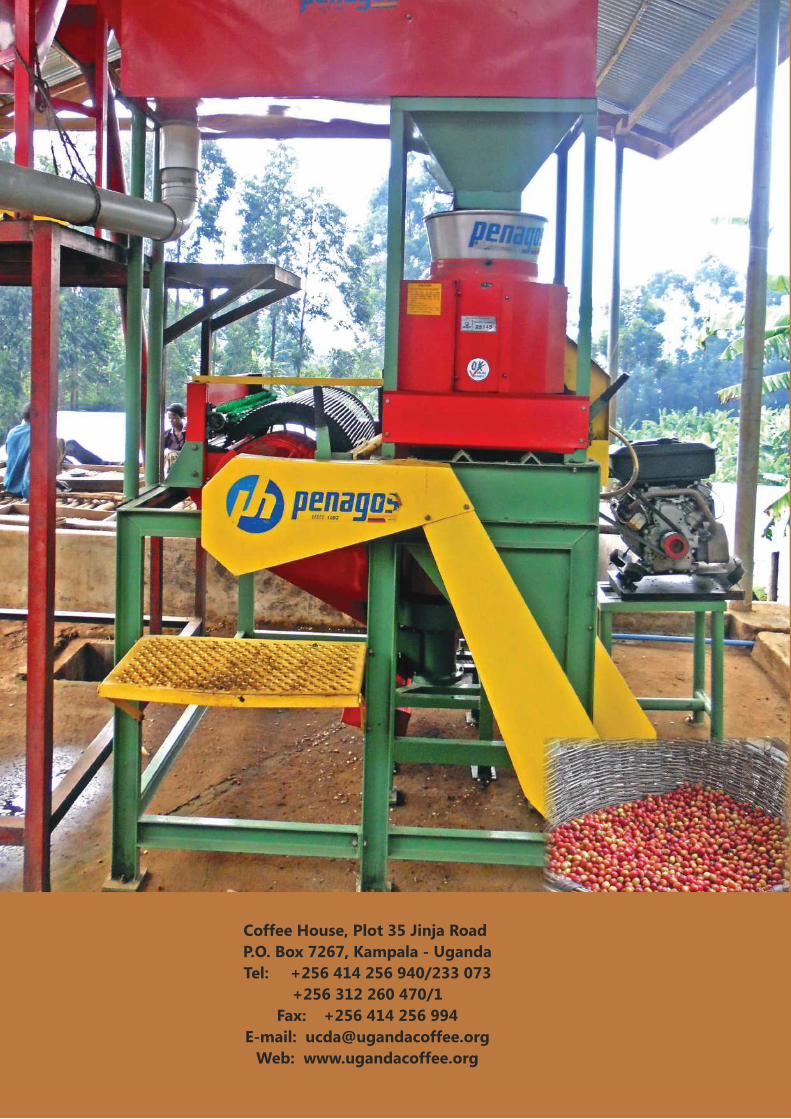
Uganda Coffee Development Authority
ANNUAL REPORTVOLUME 21
OCTOBER 01, 2011 – SEPTEMBER 30, 2012
UCD
AA
NN
UA
L REPORT
VOLU
ME 21
OCTO
BER 01, 2011 – SEPTEMBER 30, 2012
Coffee House, Plot 35 Jinja Road P.O. Box 7267, Kampala - UgandaTel: +256 414 256 940/233 073
+256 312 260 470/1Fax: +256 414 256 994
E-mail: [email protected]: www.ugandacoffee.org
Ministry of Agriculture, Animal Industries and Fisheries
Uganda Coffee Development Authority


![UGANDA COFFEE TRADE FEDERATION [UCTF] · 2015-09-12 · UCTF is registered as a non-profit company, limited by guarantee. Its membership include; coffee exporters, coffee processors,](https://img.pdfslide.us/doc/110x75/5e9fd243f06a00656e67f174/uganda-coffee-trade-federation-uctf-2015-09-12-uctf-is-registered-as-a-non-profit.jpg)