Embed Size (px)
Citation preview
The relationship of visual perceptionto first grade reading ability
Authors Nicholson, Elaine Ruthe
Publisher The University of Arizona.
Rights Copyright © is held by the author. Digital access to this materialis made possible by the University Libraries, University of Arizona.Further transmission, reproduction or presentation (such aspublic display or performance) of protected items is prohibitedexcept with permission of the author.
Download date 03/05/2018 16:03:41
Link to Item http://hdl.handle.net/10150/318061
THE RELATIONSHIP OF VISUAL PERCEPTION TO FIRST GRADE READING ABILITY.
Elaine Ruthe Nicholson
A Thesis Submitted to the Faculty of theDEPARTMENT OF EDUCATIONAL PSYCHOLOGY
In Partial Fulfillment of the Requirements For the Degree ofMASTER OF ARTS
In the Graduate CollegeTHE UNIVERSITY OF ARIZONA
1 9 6 8
STATEMENT BY AUTHOR
This thesis has been submitted in partial fulfillment of requirements for an advanced degree at The University of Arizona and is deposited in the University Library to be made available to borrowers under rules of the Library.
Brief quotations from this thesis are allowable without special permission, provided that accurate acknowledgment of source is made. Requests for permission for extended quotation from or reproduction of this manuscript in whole or in part may be granted by the head of the major department or the Dean of the Graduate College when in his judgment the proposed use of the material is in the interests of scholarship. In all other instances, however, permission must be obtained from the author.
APPROVAL BY THESIS DIRECTOR This thesis has been approved on the date shown below:
^ & &ROBERT^ET" 'KMn ER ™ — bateAssociate Professor of Education
ACKNOWLEDGMENTS
The cooperation of the Tucson Public Schools, District No. 1, Tucson, Arizona, particularly that of Dr. Charles Grubbs, Director of Research, made it possible for this study to become a reality. Special thanks are extended for the greatly appreciated assistance of Mr. Russell Gearin, principal of, Steele Elementary School and his patient and understanding first-grade teachers, Sally Vogel, Mildred Kerschke, Elouise Lane, Kathy Kolter, and Joan Lien.
Most particularly I wish to recognize the indis- pensible assistance extended by Dr. dqhn Bergan, Associate Professor, The University of Arizona. Without his interest and valuable time the completion of this study might, not have been realized. Great appreciation is also expressed to Dr. Robert Kraner, Associate Professor, The University of Arizona, for his advice and perseverance.
Finally, I gratefully appreciate the moral support given to me by my husband,Everett, and the inspirations received from my children, Lynda and Julie Ann.
iii
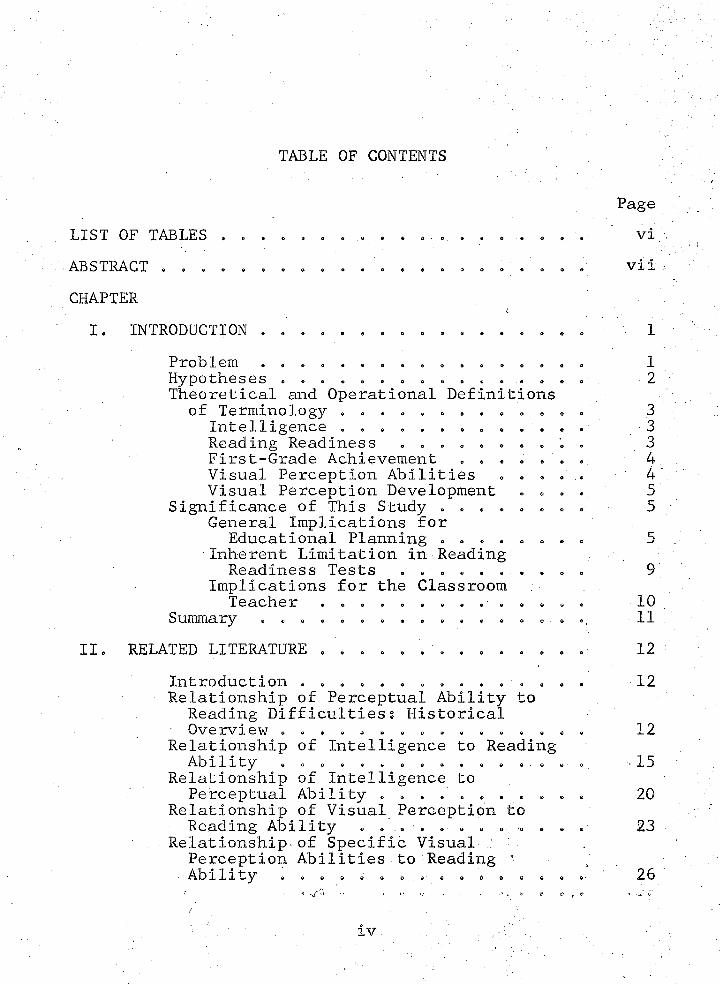
TABLE OF CONTENTS
PageLIST OF TABLES .. . . . . . . . . . . . . . . .. . . . viABSTRACT . . . . . . . . . . . . . . . . » . . . . . viiCHAPTER
i
I. INTRODUCTION . . . . . . . . . . . . . . . . . 1Problem . . . . . . . . . . . . 1Hypotheses . . . . . . . . . . . . . . . . 2Theoretical and Operational Definitions
of Terminology . . . . . . . . . . . . . 3Intelligence . . . . . . . . . . . . . 3Reading Readiness . . . . . . . . . . 3First-Grade Achievement . . . . . . . 4Visual Perception Abilities . . . . . 4Visual Perception Development . . . . 5
Significance of This Study . . . . . . . . 5General Implications for
Educational Planning . . . . . . . . 5Inherent Limitation in Reading
Readiness Tests . . . . . . . . . . 9Implications for the Classroom
Teacher . . . » . . . . . . . . . . 10Summary . . . . . . . « @ . . . . . . . .t 11
II. RELATED LITERATURE . . . . . . . . . . . . . . 12Introduction . . . . . . . . . . . . . . . 12Relationship of Perceptual Ability to
Reading Difficulties s Historical6 1 6 . . . . . . o . o . . . . . . . 12
Relationship of Intelligence to ReadingAbillty . . . . . . . . . . . @ . . . . '15
Relationship of Intelligence toPerceptual Ability . . . . . . . . . . . 20
Relationship of Visual Perception toReading Ability . . . . . . . . .. . . . 23
Relationship, of Specific Visual Perception Abilities to Reading ’Ab ill ty s o . e e o . 0 6 . 6 o . o o e- 2 6
1 > ‘ ' ' i i ‘ r .' ■ ■.: • , H 0 iS f O »
/ ;
: . 4 ' ■ . iv : ,v- V ■ ; - P _ ; '
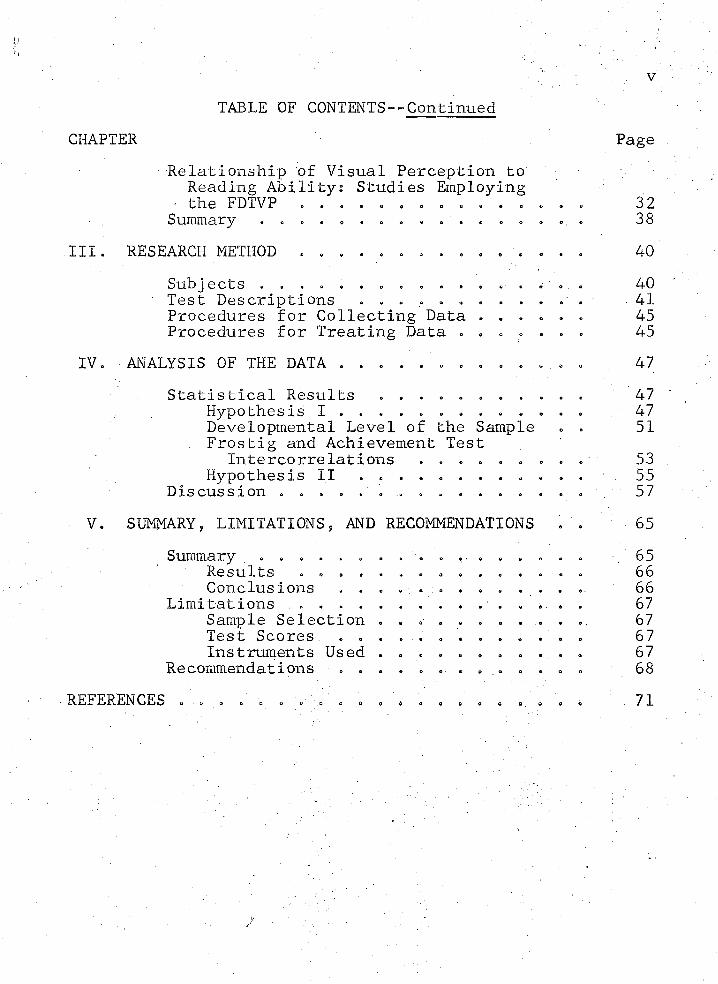
VTABLE OF CONTENTS--Continued
CHAPTER PageRelationship of Visual Perception to
Reading Ability: Studies Employing - the FDTVP . . . . . . . . . . . . . . . 32Summary . . . . . . . . . . . . . . . . . . 38
III. RESEARCH METHOD . . . . . . . . . . . . . . . 40Subjects . . . . ... . . . . . . . . . . . . 40Test Descriptions . . . . . . . . . . . .- 41Procedures for Collecting Data . . . . . . 45Procedures for Treating Data . . . . . . . 45
IV. ANALYSIS OF THE DATA . . . . . . . . . . . . . 47Statistical Results . . . . . . . . . . . 47
Hypothesis I . . . . . . . . 47Developmental Level of the Sample . . 51Frostig and Achievement Test
Intercorrelations . . . . . . . . . 53Hypothesis II . . . . . . . . . . . . 55
Discussion . . . . . . . . . . . . . . . . 57V. . SUMMARY, LIMITATIONS, AND RECOMMENDATIONS . . 65
Summary . . . . . . . . ' . . .... . . . . . 65Results . . . . . . . . . . . . . . . 66Conclusions . . . . . :. . . . . . . . . 66
Limitations ... . . . . . . . . . . . . . 67Sample Selection . . . . . . . . . . . . 67Test Scores . . . . . . . . . . . . . 67Instruments Used . . . 67
Recommendations . . . . . . . .... . . . 68REFERENCES . . . . . . . . . . . . . . « . . . . . ; 71
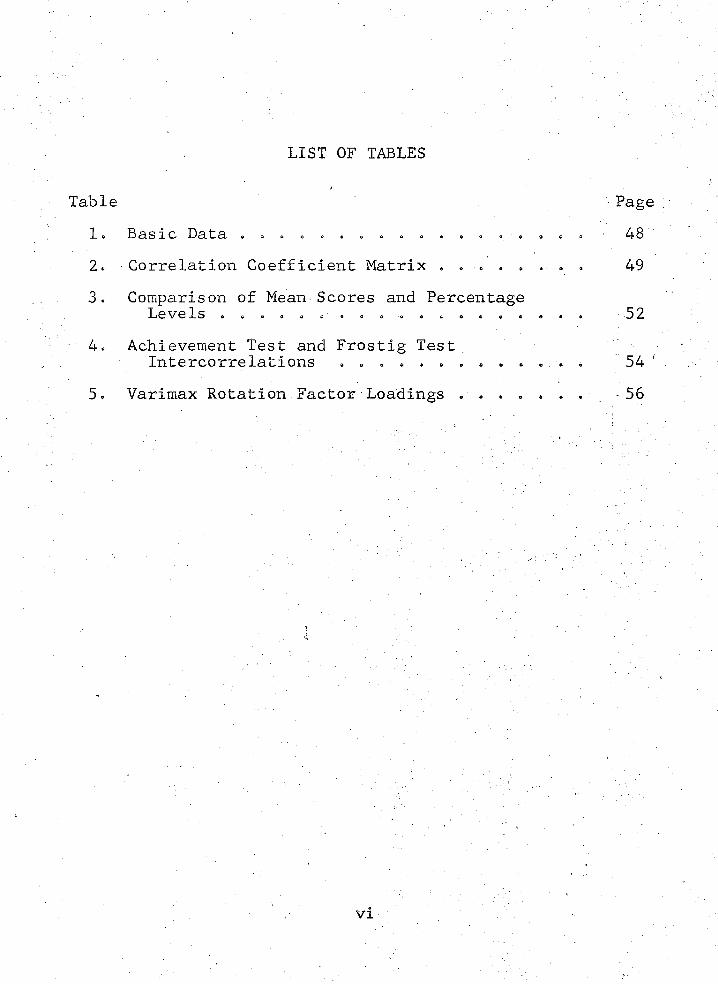
LIST OF TABLES
Table •Page1« Bas i o Data • o o <> • « » » » « » « » » # # @ @ 4 S2. •Correlation Coefficient Matrix . . . . . . . . 493. Comparison of Mean Scores and Percentage
Le e Is . . . . . . * . . . . . . . . . # . . - 5 24. Achievement Test and Frostig Test.
Intercorrelations . . . . . . . . . . ... . 545. Varimax Rotation.Factor Loadings . . . . . . . . -56
vi
ABSTRACT
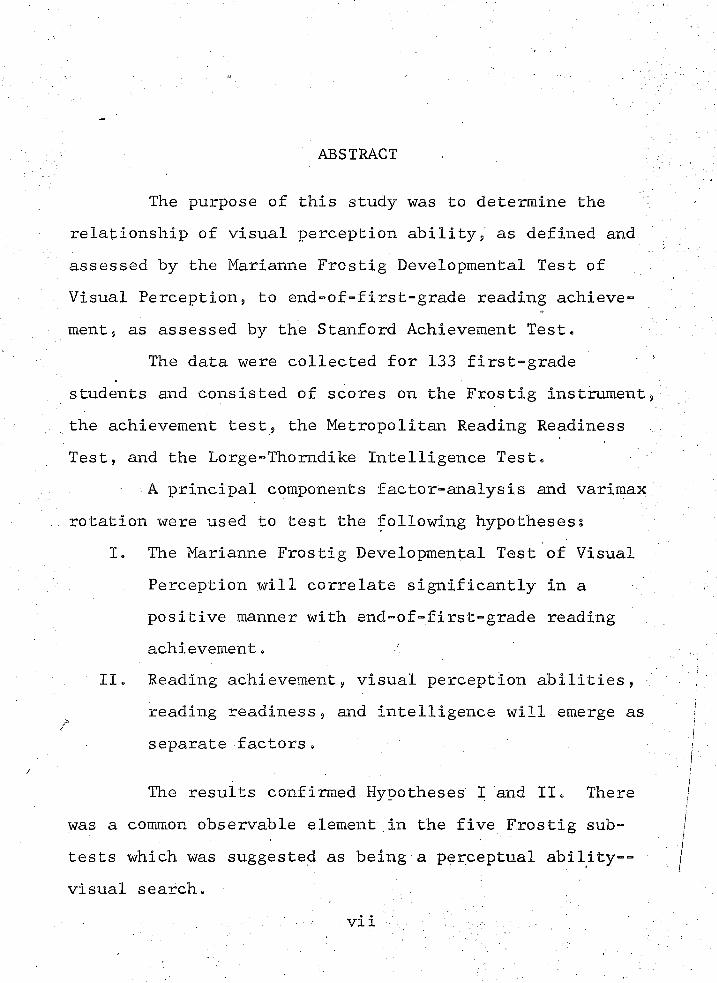
The purpose of this study was to determine the relationship of visual perception ability, as defined and assessed by the Marianne Frostig Developmental Test of Visual Perception„ to end-of-first-grade reading achievement 5, as assessed by the Stanford Achievement Test.
The data were collected for 133 first-grade students and consisted of scores on the Frostig instrument the achievement test, the Metropolitan Reading Readiness Test, and the Lorge-Thorndike Intelligence Test.
A principal components factor-analysis and varimax rotation were used to test the following hypothesess
I. The Marianne Frostig Developmental Test of Visual Perception will correlate significantly in a positive manner with end-of-first-grade reading achievement.
II. Reading achievement, visual perception abilities,reading readiness, and intelligence will emerge as? ■separate factors.
The results confirmed Hypotheses' I and II. There was a common observable element in the five Frostig subtests which was suggested as being a perceptual ability— ■ visual search.
CHAPTER I
INTRODUCTION
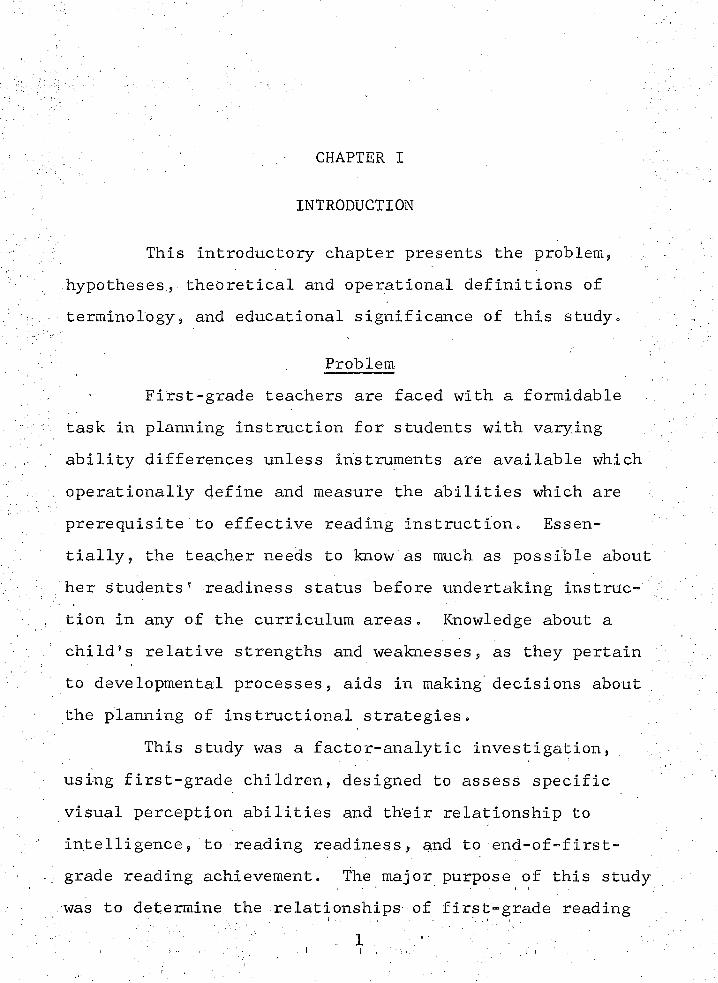
This introductory chapter presents the problem, hypotheses., theoretical and operational definitions of terminology, and educational significance of this study.
ProblemFirst-grade teachers are faced with a formidable
task in planning instruction for students with varying ability differences unless instruments are available which operationally define and measure the abilities which are prerequisite to effective reading instruction. Essentially, the teacher needs to know as much as possible about her students' readiness status before undertaking instruction in any of the curriculum areas. Knowledge about a child's relative strengths and weaknesses, as they pertain to developmental processes, aids in making decisions about the planning of instructional strategies.
This study was a factor-analytic investigation,. -
using first-grade children, designed to assess specificvisual perception abilities and their relationship tointelligence, to reading readiness, and to end-of-first-grade reading achievement. The major purpose of this studywas to determine the relationships of first-grade reading' - I - : 1 1 . : / - ,
1 * •• • • , i i i \ > • , . ; , I I ' '
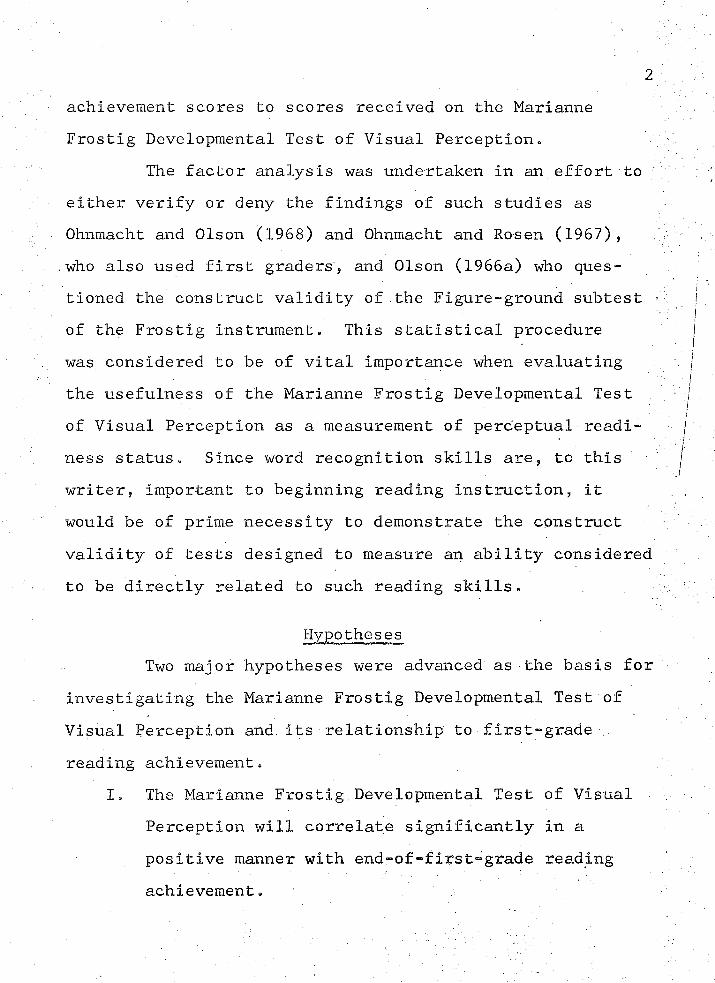
achievement scores to scores received on the Marianne Frostig Developmental Test of Visual Perception.
The factor analysis was undertaken in an effort to either verify or deny the findings of such studies as Ohnmacht and Olson (1968) and Ohnmacht and Rosen (1967), who also used first graders', and Olson (1966a) who questioned the construct validity of the Figure-ground subtest - of the Frostig instrument. This statistical procedure was considered to be of vital importance when evaluating the usefulness of the Marianne Frostig Developmental Test of Visual Perception as a measurement of perceptual readiness status. Since word recognition skills are, to this writer, important to beginning reading instruction, it would be of prime necessity to demonstrate the construct validity of tests designed to measure an ability considered to be directly related to such reading skills.
HypothesesTwo major hypotheses were advanced as the basis for
investigating the Marianne Frostig Developmental Test of Visual Perception and. its relationship to first-grade reading achievement.
I. The Marianne Frostig Developmental Test of Visual Perception will correlate significantly in a positive manner with end-of-first-grade reading achievement.
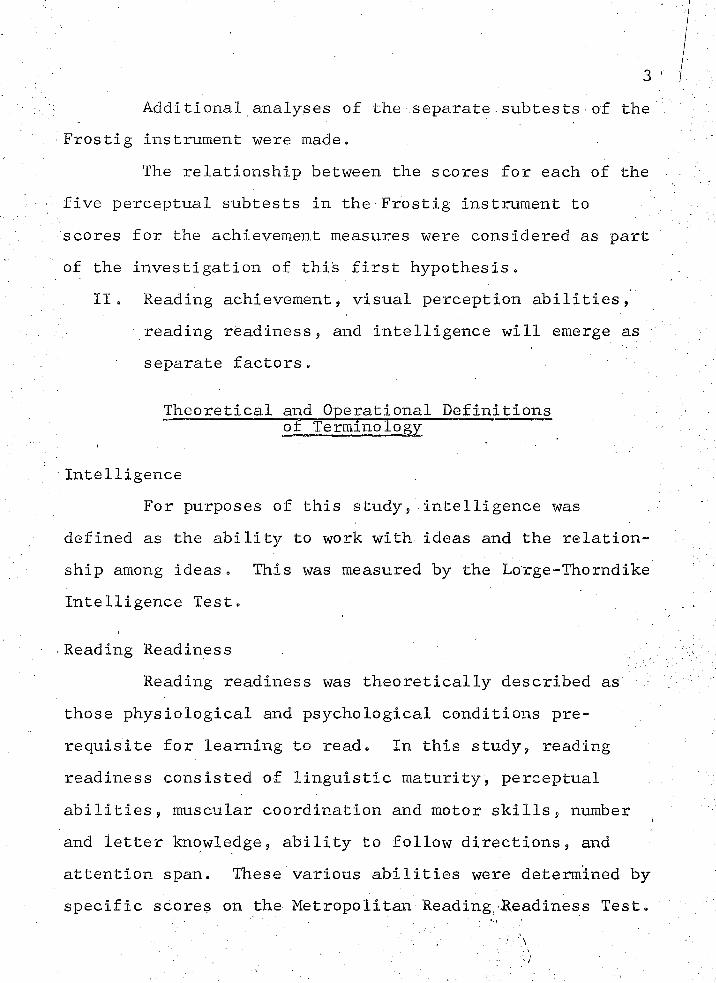
3Additional analyses of the separate subtests of the
■Frostig instrument were made.The relationship between the scores for each of the
five perceptual subtests in the Frostig instrument to scores for the achievement measures were considered as part of the investigation of this first hypothesis.
II. Reading achievement, visual perception abilities, reading readiness, and intelligence will emerge as separate factors.
Theoretical and Operational Definitions of Terminology ™
. ■ ■. ■ 1 •
IntelligenceFor purposes of this study, intelligence was
defined as the ability to work with ideas and the relationship among ideas. This was measured by the Lorge-Thorndike Intelligence Test.
■Reading ReadinessReading readiness was theoretically described as
those physiological and psychological conditions prerequisite for learning to read. In this study, reading readiness consisted of linguistic maturity, perceptual abilities, muscular coordination and motor skills, number and letter knowledge, ability to follow directions, and attention span. These various abilities were determined by specific scores on the Metropolitan Reading-JReadiness Test.
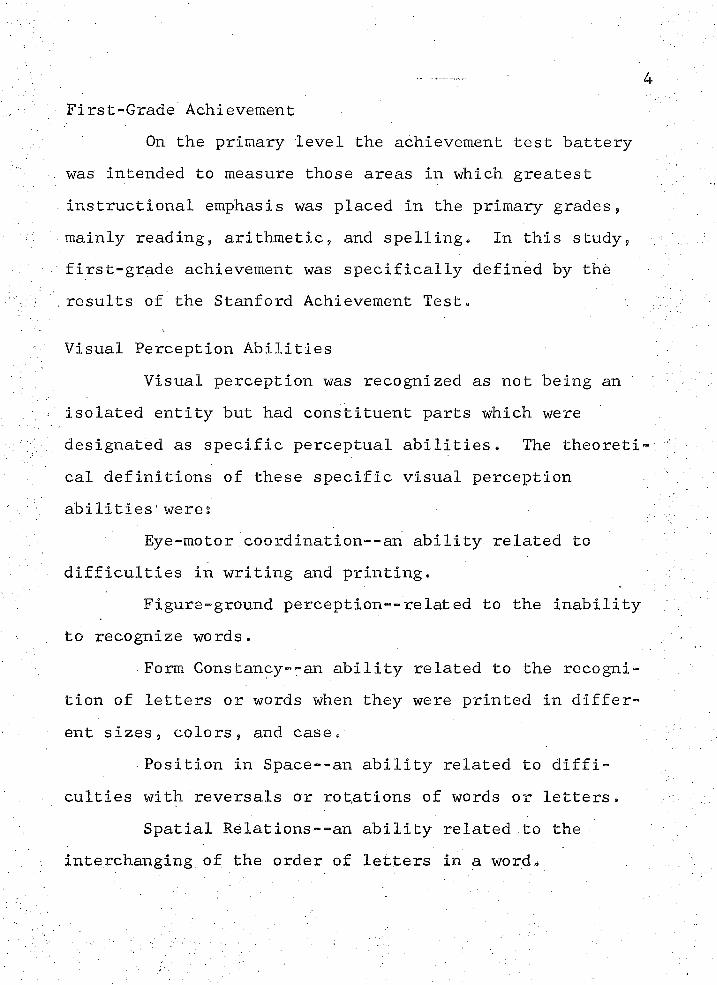
First-Grade AchievementOn the primary level the achievement test battery
was intended to measure those areas in which greatest instructional emphasis was placed in the primary grades, mainly reading, arithmetic, and spelling. In this study, first-grade achievement was specifically defined by the results of the Stanford Achievement Test.
Visual Perception AbilitiesVisual perception was recognized as not being an
isolated entity but had constituent parts which were designated as specific perceptual abilities. The theoreti cal definitions of these specific visual perception abilities'were?
Eye-motor coordination--an ability related to difficulties in writing and printing.
Figure-ground perception--related to the inability to recognize words.
Form Constancy--an ability related to the recognition of letters or words when they were printed in different sizes, colors, and case.
Position in Space--an ability related to difficulties with reversals or rotations of words or letters.
Spatial Relations--an ability related to the interchanging of the order of letters in a word.
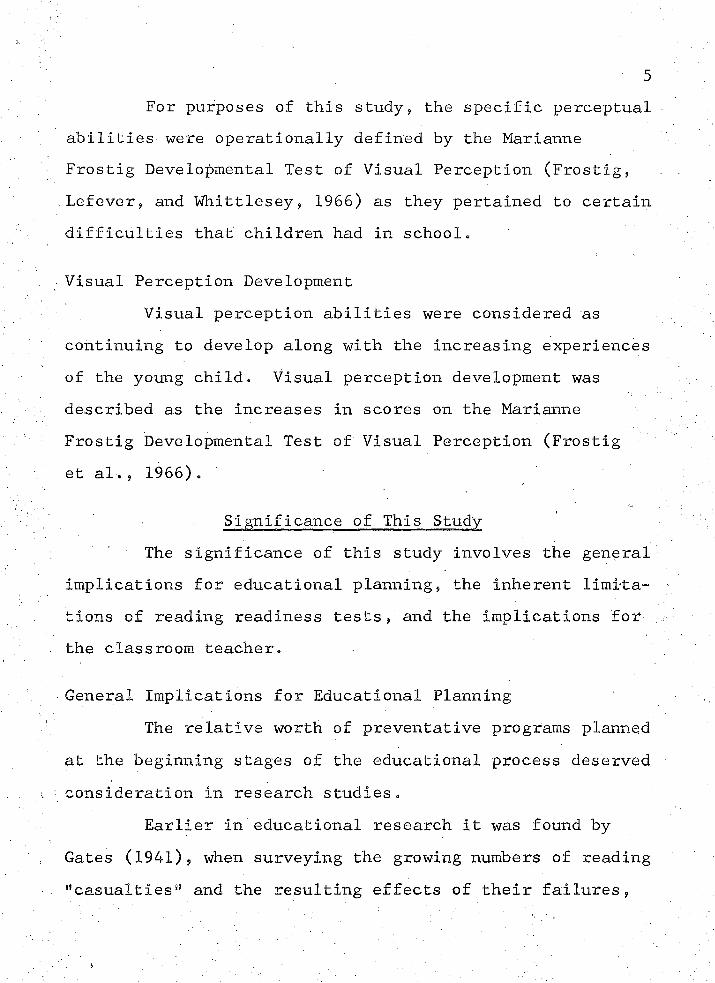
For purposes of this study, the specific perceptual abilities were operationally defined by the Marianne Frostig Developmental Test of Visual Perception (Frostig,.Lefever, and Whittlesey, 1966) as they pertained to certain difficulties that children had in school.
Visual Perception DevelopmentVisual perception abilities were considered as
continuing to develop along with the increasing experiences of the young child. Visual perception development was described as the increases in scores on the Marianne Frostig Developmental Test of Visual Perception (Frostig et al., 1966).
Significance of This Study The significance of this study involves the general
implications for educational planning, the inherent limitations of reading readiness tests, and the implications for the classroom teacher.
General Implications for Educational PlanningThe relative worth of preventative programs planned
at the beginning stages of the educational process deserved consideration in research studies.
Earlier in educational research it was found by Gates (1941), when surveying the growing numbers of reading "casualties" and the resulting effects of their failures,
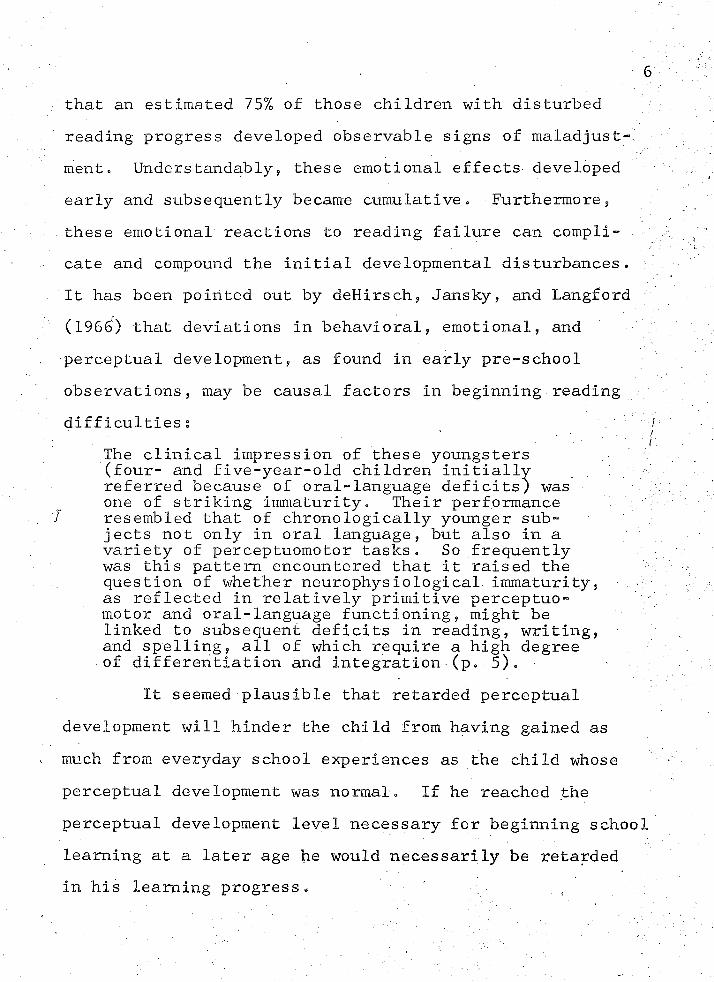
that an estimated 75% of those children with disturbed reading progress developed observable signs of maladjustment . Understandably, these emotional effects developed early and subsequently became cumulative. Furthermore, these emotional reactions to reading failure can complicate and compound the initial developmental disturbances.It has been pointed out by deHirsch, Jansky, and Langford (1966^) that deviations in behavioral, emotional, and perceptual development, as found in early pre-school observations, may be causal factors in beginning reading difficultiesi
The clinical impression of these youngsters (four- and five-year-old children initially referred because of oral-language deficits) was one of striking immaturity. Their performance
I resembled that of chronologically younger subjects not only in oral language, but also in a variety of perceptuomotor tasks. So frequently was this pattern encountered that it raised the question of whether neurophysiological, immaturity, as reflected in relatively primitive perceptuomotor and oral-language functioning, might be linked to subsequent deficits in reading, writing, and spelling, all of which require a high degree of differentiation and integration (p. 5). •
It seemed plausible that retarded perceptual development will hinder the child from having gained as much from everyday school experiences as the child whose perceptual development was normal. If he reached the perceptual development level necessary for beginning school learning at a later age he would necessarily be retarded in his learning progress.
I; ■ • ■■ ■■ I '' ■■
. ' 7Unfortunately, as more was learned about the
maturational processes of the five-, six-, and seven-year- old, sometimes the attitude was mistakenly adopted that, the child was basically immature and simply needed to wait longer until his developmental level progressed to the point that instruction would bear constructive results. On the other hand, it would be just as inappropriate to have subjected him to instructional methods which were not congruent with his developmental needs. It has been observed that older disabled readers still show signs of developmental lags in perceptual development (deHirsch et al. , 1966'; Frank, 1935), and it has been suggested that unless the disabled readers do not receive intensive perceptual remediation, their performance gap will continue to widen, perhaps to the point of irreversible handicaps. \ With this analysis in mind, it appeared even more crucial that research concentrate its efforts towards development of instruments capable of offering achievement prognosis with subsequent training programs to prevent disabilities from hindering his learning. In order to accomplish this, a first step might be to demonstrate that certain perceptual abilities are related to the reading process and that measures of these abilities can adequately predict future reading difficulties.
The Frostig instrument was chosen for this study because it was one of the first evaluative instruments which
offered subsequent training programs to improve the specific perceptual abilities operationally defined by Dr. Prostig. During initial investigations by Dr. Frostig and her associates, it was hypothesized that there was a specific relationship between the developmental level of these abilities and the child’s later primary school achievement. Originally, Frostig, Lefever, and Whittlesey(1961), in working with children diagnosed"*" as having minimal brain damage, found that visual perception difficulties were by far the most significant, in problems of learning. They found that children with poor eye-motor coordination had difficulty writing and those who could not recognize words had disturbances in figure-ground perception. Poor form constancy ability showed itself in inability to recognize letters or words when printed in different sizes or colors, or when printed in upper- or lower-case. Reversals or rotations being made were the result of difficulties in perceiving position in space and transposition of letters in words indicated spatial relation difficulties.
When these same children were later tested on Frostig1s preliminary instrument designed to measure the above abilities, they displayed greater subtest scatter (Frostig et al., 1961) which confirmed their hypothesis
1. Marianne Frostig School of Educational,Therapy, Los Angeles, California.
that the five perceptual abilities being measured were relatively separate and could be disturbed independently.
In the 1963 standardization study, normal developmental curves for the five perceptual areas were obtained and provided the basis for differential screening of perceptual dysfunctions and, in addition, gave the evidence of the presence of five separate abilities in normal children. These normative curves indicated that maximum perceptual development in these specific areas occurred between the ages of 3-1/2 and 5-1/2 with maximum test scores at about 6-1/2 years with less growth after approximately 7-1/2 years. This more specifically pointed out the need for an evaluative instrument, usable with young children, to facilitate the identification of developmental lags prior to first-grade entrance.
Inherent Limitation in Reading Readiness TestsAs was recently pointed out by deHirsch et al.
(1966), the readiness tests which are available for use by the first-grade teacher failed to accomplish two rather . vital jobs: (l) they gave no more than a global estimateof the child's readiness level, and (2) they did not allow for the planning of specific instructional strategies based on test results. The real educational value of a diagnos- . tic measure lies in its being able to evaluate ability strengths and weaknesses in such a precise manner as to
10afford the planning of specific instructional strategies. Heretofore, there have been few direct links between diagnosis and training in the normal classroom setting.The reading readiness tests did not effectively provide a direct interpretation of a student's relative strengths and weaknesses and, therefore, gave no practical information, as to the relative contributions of the various subtests included in the global estimate Of readiness level. In fact, they discouraged the attachment of significance to subtest scores by making no provision for converting these subtest raw scores into percentile ranks or readiness levels. The usual instructional strategy which resulted from such estimates was the grouping of students according to readiness level without cognizance of the differentiations which existed within the levels themselves. This approach presupposed that whatever ability existed would become strengthened by whatever method of instruction was utilized. Should this be the case, the need for remedial reading instruction would not exist. - -
Implications for the Classroom Teacher, Secondary to the problem of the probability of
future reading difficulties in first-grade children, was a closer analysis of the operational definitions which are employed when undertaking the use of diagnostic instruments . Quite obvious to the classroom teacher were the
shortcomings of instruments whose ability definitions were not directly related to those prerequisite skills which were necessary to benefit from the teacher's instructionalstrategies.. To state that a student had poor figure-ground
. ■ :perception had greater meaning when it was demonstrated that this ability weakness would have a direct effect upon the child's reaction to the printed materials which he was expected to process perceptually.
SummaryThis study was a factor-analytic investigation of
the specific visual perceptual abilities which have been previously related to reading achievement on the primary school level. It was designed to yield an evaluation of the Marianne Frostig Developmental Test of Visual Perception as a measure of specific perceptual abilities and the relationships, of these abilities to reading difficulties in first-grade children. , ■
CHAPTER II
RELATED LITERATURE
IntroductionThis chapter presents the literature in terms of
the relationship of intelligence to reading ability, the relationship of intelligence to perceptual ability, the relationship of visual perception to reading ability, and the relationship of specific visual perceptual abilities to reading ability, and, more specifically, those studies which deal directly with the Marianne Frostig Developmental Test of Visual Perception (Psychological Abstracts, 1961- 1967). The literature review is prefaced with a historic overview of the relationship of perceptual ability to reading difficulties.
- Relationship of Perceptual Ability to Reading Difficulties: Historical Overview
Initially, the major emphasis of research concerned with determining the underlying causes of difficulties with reading was medically oriented. The first description of special reading disabilities in otherwise normal children in medical literature was made in 1896 by an English school-doctor, James Kerr. "Congenital word blindness [p. 1378]" Was the term used by Morgan (1896), an English ■ - '■ - ■ V :V:: ■ r ■' - ' 12 ■ :■ - - ' 1 . ■
oculist, to describe such special reading problems which he concluded were due to a congenital injury to the "reading centre [p.' 1378]" in the brain (Malmquist, 1958) „ Hinshelwood (1917), in agreement with Morgan, pointed out that difficulties in understanding and interpreting printed words were not due to specific ocular defects but were the result of a pathological condition in which the brain was : undamaged in other areas. The premise was that the damage was centered within "the visual memory centre [p. 9}»11
Kussmaul (1877) asserted that word blindness was not necessarily congenital, but rather was the result of disease affecting visual perception. A person who suffered from "acquired word blindness [p. 102]" could see the printed words but was unable to make identifications, a loss of a previous ability. Elaborations of Kussmaul’s view were suggested by Lashley (1929) who maintained that the organization of the brain’s functions were thrown out of order, and, by Bachmann (1927) who related reading disabilities to associative defects.
Unfortunately, the above remained unconfirmed hypotheses which had their bases in theoretical premises and depended upon informal observations. Investigations in educational psychology adopted, as a result of medical theorizing, the attitude that only on rare occasions were reading disabilities attributed to a single cause. Many educational psychoIdgists could not agree (Skydsgaard,
141942; Monroe, 1946; Tordrup, 1955; Malmquist, 1958) with the medical view that those children suffering from a specific disease "congenital word-blindness" made distinctive reading errors which could be considered as being characteristic of a specific physiological disorder. A • vast variety of reading errors were observed in children with reading problems and the only generalization which could be made was that the number of errors for suph children was greater than was the case for normal readers. It is now recognized that many factors, including perceptual difficulties, may contribute to reading disabilities (Robinson, 1955; deHirsch et al., 1966). It became necessary to make clarifications of the nature of the reading process and reading disabilities in order for psychological research to have any practical significance for education. Within this setting, it was realized that sometimes only statements of symptoms can be made without being able to determine whether these symptoms were causes or consequences .
Further scientific investigations of the nature of the reading process were carried on in experimental settings until about 1910 when a need for research work to be adjusted to the needs of the classroom and reading clinics was recognized (Gray, 1950). ,Early attempts were made to apply■objective measurements to these educational settings, the results of which demonstrated the wide range
15of reading abilities within specific grade levels. This opened the way for comparative studies with regard to a variety of aspects. Just prior to 1930, and continuing to the present time, the attention of psychological research was directed to determining the prerequisite conditions for being able to benefit from beginning reading instruction through the study of the elementary reading process and the factors bearing on the beginnings of reading disabilities on the lower educational levels. Parallel to these undertakings were further investigations in the laboratories concerning the reading process and causes of difficulties with the aim of constructing psychological and educational aids for the correction of difficulties and the improvement of teaching of reading methods.
Relationship of Intelligence to Reading AbilityMedical investigations in the late 1880's and early
1900's usually did not consider intelligence as a factor in reading disabilities, partly because it was not within their chosen domain of research, and partly because their original case studies included persons described as having normal levels of intellectual functioning (Hinshelwood, 1917; Morgan, 1896; Kussmaul, 1877).
The attitude of researchers toward the contribution of intelligence to reading had markedly changed by the early 19301s . A number of investigators (Deputy, 1930;
Hayes , 1933; Tinker, 1932; Davidson, 1931; Gates, 1947) considered intelligence to be an important factor in predicting future reading ability» Research has strongly supported this view. Malmquist (1958) reported numerous studies revealing correlations from .40 to .60 between intelligence and reading ability. Deputy (1930) found a correlation of .70 with reading using the Pinter- Cunningham Primary Mental Test with first-grade children.
Investigators have attempted to establish a minimal level of intelligence as being necessary for learning beginning reading skills. Gates (1930) asserted, "It is a remarkable achievement to teach any child of less than . 65, IQ to read new material unassisted [p. 14]." Others have set mental age limits at which reading instruction can be undertaken with profitable results. Morphett and Washbume (1931) and Rosebrook (1935), according to Malmquist (1958), held that a mental age of 6-1/2 to 7 years was required to read, while Merrill (1921) found few benefits from beginning instruction with children whose mental age was below 6 years. On the other hand, Gates and Bond (1936) expressed the relationship as not being completely dependent on the mental age level since the nature of the reading program can be a strong determinant in the total process.
On the other side of the picture, some researchers have not found significant relationships between
17intelligence and reading ability. Harrington and Durrell (1955) , using the Otis Quick Scoring Mental Ability Test (Alpha,. Form A) with second graders, found that mental age had little influence on reading achievement. The results of the extensive studies concerning first grade reading difficulties by Malmquist (1958) led her to emphasize that poor reading ability need not be described, as being due to sub-normal intelligence. However, the results did confirm the view that intelligence is an important factor in read- . ing success. She also found that, contrary to the views of Robinson (1946), the distribution of intelligence among children with reading disabilities was not similar to the distribution of disabilities in the general population.The mean intelligence quotient for the poor readers deviated significantly from the total sample. Malmquist (1958) found that children were likely to be more successful if their mental age was 7-1/2 years at the end of first grade. ' In addition it was found that 4.8 per cent of the sample with mental ages below 6-1/2 years at the end of first grade were in.a group of medium readers. Malmquist also found that at the end of first grade about three- fourths of the children with mental ages below 7-1/2 years had satisfactory reading levels and that not less than 64.1 per cent of the poor readers had normal or above average intelligence. She concluded that taking intelligence scores or mental age levels in isolation from bther
factors could lead to misleading results. A more precise description of the effect of intellectual factors on reading was found in the following study: Tordrup (1953) askedthe question9."Are children who are word-blind less intelligent than normal readers [p. 7]?" His answer was no. He. went on to explain that his results demonstrated that sometimes more intelligent children, as measured by the Binet test, eventually succeeded in reading without remedial help or, if they received special teaching, required a shorter amount of teacher time.
One important finding with respect to the relationship between intelligence and reading was that correlations between reading and intelligence tend to be highest at the upper grade levels. Bond and Tinker (1957) reported a correlation on only .35 between intelligence and reading achievement at the end of first grade while a correlation of .65 was observed at the end of sixth grade. Leton(1962) explained these lower correlations in the primary grades as reflecting a dichotomy between reading and intellectual development at that level. Higher correlations in the later grades would indicate the abstract-verbal abilities which were measured by intelligence tests as being related to advanced reading skills. Later mental development can be hindered if reading disabilities should persist. Lennon (1950) found correlations of .34 at the second-grade level and .85 at the eighth-grade level.
19Although these findings might be interpreted as meaning that intellectual functioning played a greater part in the reading process on the higher reading levels and was, therefore, more closely related to reading ability, Lennon related his results to differences between intelligence tests used at different age levels. Similarly, Harrington and Durrell (1955), who found little influence of intelligence on reading success, felt that the fact that the mental test they used was primarily a measure of oral language comprehension may have affected their results. In accordance with this reasoning were the contentions of Ladd (1933);/ It seems that correlations between reading and
Binet intelligence tests average about .50, but may be greater or less according to the range of the group tested, the correlations between reading and verbal group intelligence tests are usually about .60 to .65, sometimes higher but seldom lower, and the correlations between reading and non-verbal intelligence tests are very much lower [pp. 21-22].
• That the reading factor which existed in some measures of intelligence may affect the scores on reading tests was explored by Durrell (1933) who found that this factor may cause many children to be classified as lower than their true ability level. This would cause numerous miscalculations to be made when measuring the relative effect of intelligence on reading success. If reading ability did influence the results of intelligence tests, or, in other words, the instruments used for measuring intelligence and
20reading ability were in some way related to the reading process itself, then any attempts to determine the relative effect of intellectual status on reading ability must consider the operational definitions used by the tests' authors. Ladd (1933) demonstrated that non-verbal tests have lower correlations with reading achievement. If all verbal or reading elements were removed from the intelligence measuring instruments the effect was for the correlations between the two abilities to be lower. A study by Bond and Fay (1950) showed that children in fourth-, fifth-, and sixth-grade whose reading ability was low were found to be handicapped by their poor reading ability on selected items of the Stanford-Binet which were verbal and depended upon reading ability for solution.
MaJmquist (1958) correlated intelligence with different reading tests and found that those tests designed to measure reading comprehension had the highest correlations (.50 and .42) with intelligence, while those tests designed to measure the mechanics of reading showed lower correlations (.29 and .40) with intelligence.
,Relationship of Intelligence to Perceptual AbilityGates (1926) found that mental age as measured by the
Stanford-Binet Test had a high correlation with his perceptual tests containing verbal material and low correlations with non-verbal tasks. Sister Mary Phelan (1940) reported
21a study in which the relationship between mental age and reading achievement was .499 on the first-grade level. •In :. the same study, the correlation between visual discrimination and reading was .432. She compared these results to her own fourth- and fifth-grade sample and concluded that visual perception contributed less to reading on the upper levels than did intelligence.
Using the Frostig instrument and a relatively small sample, Sprague (1963) found a correlation of .235 with the Goodenough Intelligence Test using kindergarten children and .273 with the same children when in first grade. It was decided that the low correlations indicated the measurement of relatively distinct factors by the two instruments. Malmquist (1958) found a correlation of .415 between her total visual perception test scale and intelligence on the first-grade level. A higher correlation was found between visual perception and reading comprehension (.326) than between visual perception and a reading test designed to . measure mechanical aspects of reading (.227);
Goins (1958) found substantial relations between intelligence and her tests of Pattern Copying (.477) and Figures (.451). Leton (1962) has suggested that, "The common variance in reading readiness and intelligence scores is largely due to the mutual assessment of visual- motor capacities [pi 414] .11
Corah and Powell (1963) undertook a factor analytic study of the Marianne Frostig Developmental Test of Visual Perception with nursery school children. Using the Full- Range Picture Vocabulary Test (Ammons and Ammons) as a measure of intelligence„ they observed a relationship of .386 with the Frostig Perceptual Quotient. They found a general intelligence factor with moderate loadings on Frostig subtests of Eye-Motor Coordination, Position in Space and Spatial Relations. The other major factor that was extracted tended to be one of developmental changes in perception.
Olson (1966a), using second graders, measured relationships among the Frostig subtests and the California Short-form Test of Mental Maturity. He found that the Eye- Motor Coordination subtest did not correlate significantly with either IQ (.18) or mental age (.21). The Position in Space subtest did not correlate significantly with mental age (.15) but did with IQ (.26). The Spatial Relations subtest correlated significantly with IQ (.26), but not with mental age' (.10). The Figure-Ground subtest correlated significantly with both mental age (.18) and IQ (.32) and the Form Constancy subtest correlated at a significant ;; level with mental age (.361) and IQ (.372). The Frostig total scores were related to mental age at .31 and with IQ at .38. The results involving nursery school children and second graders in the above studies were similar.
Relationship of Visual Perception to Reading Ability The earliest investigators of the relationship
between perception and reading were concerned with the measurement of eye movements. Malmquist (1958) attributed the undertaking of investigations into the conditions of eye movements in reading to a French oculist, Javal. In 1878, Malmquist (1958) related, Javal discovered "that the eye traverses the lines of printed or written material by a series of movements and pauses, and not, as had hitherto been supposed, by a continuous passage along the lines [pp. 25-26]." The results of early eye movement studies, according to Malmquist (1958), have demonstrated wide variations in number of fixations and regressions across age levels and within age levels but not across reading ability levels.
Gates (1926) studied relationships among various perceptual tasks in order to determine if there was a general perceptual ability. His results led him to say, "What we call visual perception is not a single, unitary capacity or power which operates uniformly upon all sorts of data and under all conditions; perception, on the contrary is specialized [p. 436]." (
Gates undertook to correlate his tests with reading achievement in grades one through seven and found that word perception was the most closely related to reading, intelligence having the next highest relationship and perception
24of digits and geometric figures have only slight correlations with reading.
Sister Mary of the Visitation.(.1929) using fourth- and fifth-grade children and the tests constructed by Gates found a group factor suggesting a general perceptual ability. Fendrick (1935) felt his test results indicated a specific perceptual factor in reading ability. "Group differences were found that indicated a more efficient performance on the part of good readers in certain tests of visual perception [p. 51]."
Another approach to visual perception, as reported by Goins (1.958), was that of considering it as a primary mental ability. "The issue implied was t Is there ,a primary, an inherent, visual perception ability or factor that accounts for part of the individual differences in . :reading skill [p. 10]?" Langsam (1941), in a factor ’ analysis of various reading abilities, found a factor which had functional unity with a general test of visual perception. Goins (1958) cited the work of L. L.Thurstone and Thelma Thurstone in which they defined the perceptual function as a "facility in perceiving detail ’ that is imbedded in irrelevant material [p. 12]." This work will be referred to in greater detail in a later section of this paper.
The studies of Gates (1922, 1926), Sister Mary of the Visitation (1929), and Sister Mary Phelan (1940) all
25.demonstrated a positive relationship of visual perception and reading achievement. The correlations were low only when the perceptual content included material not like that found in reading matter. An argument put forth in support of a general perceptual ability by Stroud (1945) explained the closer relationship of tests using words and letters as having been due to the practice of such content at early school levels.
■Were standard geometric designs used and were likewise made the object of specific instruction in school for from four to six years, it is thinkable that they likewise would correlate with rate of reading scores to as high a degree as do the other tests (p. 495).
Frank (1935), as reported by Malmquist (1958), postulated that reading disabilities were caused by the lack of maturity of the perceptual processes. Her findings corresponded to those of deHirsch et al. (1966) in which the retarded reader who was older was still at the same level of visual perception functioning as the beginning reader. Malmquist (1958) found a relationship of .31 (significant at the .01 per cent level) between visual perception tests and a composite reading index. Olson (1966a) reported that in a study of.second grade children the correlation between the Marianne Frostig Developmental Test of Visual Perception total score and the California Achievement Test was significant at the .01 per cent level
26and that all subtests contributed to the correlation except Frostig's Fora Constancy subtest.
Relationship of Specific Visual Perception Abilities to Reading Ability
Thurstone (1938a) undertook studies in order to delineate more clearly the initially defined perceptual, function or "P-factor" and its psychological nature.
The perceptual function here seems to be a facility in perceiving detail that is imbedded in irrelevant material. The simplest expression of this function would be a task in which the subject is asked to identify.some particular detail that is buried in distracting material.Given the task to find a particular word in a page of print, some people seem to be able to
\ locate it by a dispersed attention to the page as a whole, while others require systematic search through each successive line of print.
It might be suggested here that the various tests for reading readiness of young children are probably good examples of the factor P. If this should be verified, it would be psycho-
'. logically interesting to determine whether slow and fast readers can be differentiated by the factor P under similar conditions of practice in reading. It will also be of interest to determine to what extent this factor is involved in what is sometimes called "quick intelligence" as distinguished from its more analytical and reflective, aspects (pp. 81-82).
Thurstone (1938b) constructed a battery which included nine tests designed to measure perception. The results seemed to indicate that the common factor in the tests was fluency of association with perceptual material. They stated, ". . . this factor is of considerable significance in determining the speed of reading, and it may be involved in reading disabilities [p. SjV'Y-.'The'
description of the P-factor was then to include "fluency of association with perceptual material" and renamed "perceptual-speed factor P." Further study of this factor (Thurstone, 1944) revealed five factors which seemed to be concerned with speed of different functions; reading time, speed of perception, speed of judgment, speed and strength of closure, and rate of reversals in perception„ The speed of closure seemed to involve the strength with which a stimulus configuration was held against distractions. The other important factor seemed to involve the manipulation of two configurations simultaneously or in succession.
Thurstone set about to determine whether or not these factors could distinguish between fast and slow readers by using college students. Their general conclusion was that the fast readers were more fluent in making associations. They stated that, "Reading is primarily a perceptual function in which the subject makes associations quickly with rapidly changing visual stimuli [p. 130]." ::;1
Later (1949), Thurstone identified and sharply defined the two closure factors. was found in perceptual tests in which "the presented perceptual field has no initial organization and in which the subject is asked to unify the field without any previous structuring [p. 16]." In other words, closure occurred in an unorganized field of was the unification of a complex situation. C2 was more closely connected to the original P-factor of "the ability
28to keep in mind a configuration in a distracting field," and was further defined as a strength of closure in how well the configuration can be retained.
Goins (1958) in her extensive work using first graders limited her perceptual tests to non-verbal tasks.By using fourteen tests, she isolated two perceptual factors, one of which was not related to reading achievement. The purest measure of this latter factor showed no significant correlation with reading test scores. Two of the tests which loaded on this factor, Identical Pictures A and Identical Pictures B, were originally designed by Thelmg. Thurstone as tests measuring "perceptual-speed." However, because of the nature of the tests which loaded on this factor, Goins felt the factor may not merely measure speed of perception, but also the ability to hold a configuration in mind during rapid perception. She felt that these findings were significant because of the general use of tests of this nature in reading-readiness inventories. Her results ruled out their.use as indicators of the perceptual components of the reading process. The factor P-2 which was highly related to reading achievement appeared to be a closure factor, highly congruent with :Thurstone1s factor C2 « She concluded that this factor measured some ability common to the reading process and that reading achievement at the first-grade level depended a great deal upon ability in this perceptual aspect.
Barrett (1965a) found that perception of letters and numbers was most highly correlated to reading achievement . He also found that Pattern Copying (Goins' test) was more useful in predicting Word Recognition than in Paragraph Reading. This substantiated Goins' findings that the Pattern Copying subtest produced the highest correlation with reading scores (.519). It also had the highest loading on the perceptual closure factor, P-2 (.930), a factor on which reading achievement loaded to an extent of .600.The Reversals Test and combined perceptual score were most highly related to reading achievement. Her results showing relationships between non-verbal perceptual tasks and reading achievement were contrary to earlier studies and also substantiated the premise that visual perception was quite important at the beginning stages of reading instruction. •
The results of Malmquist's study demonstrated that comprehension and discrimination between letters (.31) and numbers (.33) were more closely related to reading achievement than was visual perception of geometric figures and the ability to hold in mind a shape or picture involving distracting elements. Her dichotomy of perceptual abilities was described as perception of letters and numbers on one hand, and the ability to discriminate between rather similar optical patterns and structures other than words. ;
This latter ability agreed with both Skysgaard (1942) and Goins (1958).' t
Barrett (1965b) reported several studies of visual discrimination of non-verbal material. Using geometric designs, Monroe (1935) found a correlation of .60 with reading. Robinson (1958), however, found a much lower relationship of .24. Keogh (1963) found a correlation of .50 between Bender-Gestalt test Scores and achievement.The above three studies all used first-grade children and Barrett (1965b) summarized their findings as indicating that relative relationships will depend on the complexity of the visual and/or visual-motor abilities they measured. Barrett (1965b) surveyed numerous studies to determine the relative effectiveness of verbal visual discrimination as against non-verbal discrimination, the verbal materials (words) received higher values than did designs, numbers or pictures and the conclusion was drawn that verbal visual discrimination tests are better predictors of reading achievement in first-grade than are non-verbal visual discrimination tasks.
In summarizing the findings of those studies related to verbal or non-verban perceptual stimuli, it is noted that the earlier studies, having found low correlations when measuring non-verbal visual perceptual abilities, stressed their finding of verbal abilities as being more
closely related to reading ability (Deputy, 1930; Gates, .1922, 1926| Smith, 1928).
Later studies by Olson (1958), Gavel (1958), and Weiner and Feldmann (1963) further substantiated the use of verbal material in readiness measures. It should be pointed out that in many of these studies there were no relative comparisons between verbal and non-verbal visual discrimi- > nation.
Support of non-verbal visual discrimination was found in studies by Barrett (1965a),.Bryan (1964), Goins (1958), Monroe (1935),.Skydsgaard (1942), Potter (1949),
, and Robinson (1958) . The perceptual measures involved such abilities as visual form discrimination, visual-motor coordination, etc. Factor-analytic studies such as Goins (1958) isolated and described a specific visual perception factor (strength of closure) which was significantly related to reading achievement and another factor (speed of perception) which was related to the first.
It is evident that the trend in educational research was toward the isolation of specific perceptual abilities . which could be demonstrated to be directly related to specific reading difficulties and could be utilized in prediction of school success and in clinical diagnosis.More recently the emphasis has been to design perceptual instruments which have diagnostic value and for which
instructional material for perceptual training can be constructed (Frostig, Maslow, Lefever, and Wittlesey,1964).
.Relationship of Visual Perception to Reading Ability; Studies Employing the FDTVP
Frostig et al. (1961) supported their use of five separate perceptual ability measures by referring to the findings of Cruickshank, Bice, and Wallen (1957) that individual cerebral perceptual functions in cerebral palsied children were disturbed to varying degrees.Frostig1s et al. (1961) statistical findings demonstrated that the five abilities developed relatively independently of the others. They proposed, then, that each of these abilities should show specific relationships with academic achievement.
The results of a predictive study by Olson (1966a), using the Frostig instrument with second graders, did not support the claim that all five abilities were substantially related to reading achievement. The relationship between word recognition skills and the Figure-ground subtest was lacking. The Fora Constancy subtest showed little predictive value, while, on the other hand, the Position in Space subtest was related significantly (.386) to a reversible words in context test that was used. This finding supported Frostig's claim that the test measured an ability
related to the specific reading difficulty of word and letters reversals.
Olson (1966b) did another predictive study, this time using 121 third-grade subjects. He felt that at this level the specific reading difficulties described by Prostig as being related to the Marianne Frostig. Developmental Test of Visual Perception.subtests can no longer be attributed to maturation. The resulting correlations demonstrated that the Form Constancy test was significantly, related (.01 level) to all subtests of the California Achievement Test, the Hearing Sounds in Words and Visual Memory for Words Test from the Durre11 Analysis of Reading . Difficulty, and tests of reversible words in context and word synthesis test similar to the Developmental Reading Tests by Bond, Clymer, and Hoyt. This finding was in <_ direct contradiction to his previous findings with 71 •second graders. The highest correlation (.61) related Frostig total scores with synthesizing sounds. .Again, he found as in his second grade sample, h moderate correlation between Frostig total scores and Arithmetic Reasoning (.51) and with Arithmetic Fundamentals (.45). Olson concluded that the Frostig instrument as a total test was a fair predictor of school achievement and specific reading ability; however,.the Figure-ground and Position in Space subtests did not appear to have significant correlations
with the California Achievement Test or the special reading ski 11 tests.
The highest correlation (.66) with IQ scores was the total Frostig scores, Arithmetic Reasoning (.60) was next and then synthesizing sounds (.59). In his second grade sample of.the previously mentioned study, IQ correlated at .38 with Frostig total and was significant at the .01 level. These findings substantiated the reasoning of Leton (1962) who felt that intelligence became a. more important factor in reading with the higher grade levels.It has been pointed out that Corah and Powell (1963) obtained a correlation of only .386 between the Frostig test and IQ measures on the nursery school age level.
It was of special significance to survey studies, particularly those of a factor analytic nature, which dealt directly with the Marianne Frostig Developmental Test of Visual Perception. Mention has already been made of a study by Olson (1966a) which was undertaken to determine the relationship with specific reading abilities and predictive value of the Frostig. Results supported Frostig11 s premise that the Position in Space subtest was related to difficulties with reversals or rotations of words and it was also found to be related to word recognition skills. Ohnmacht and Rosen (1967) found four highly congruent factors--general reading achievement, perceptual readiness, figure-ground perception, and specific readiness
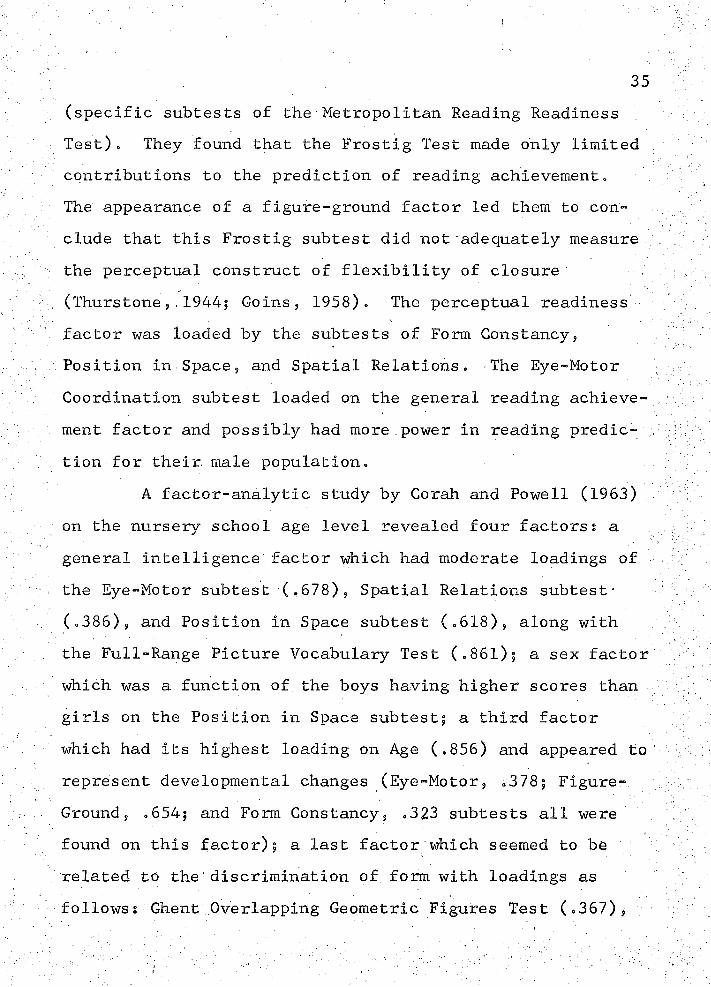
35(specific subtests of the Metropolitan Reading Readiness Test). They found that the Frostig Test made only limited contributions to the prediction of reading achievement.The appearance of a figure-ground factor led them to conclude that this Frostig subtest did not adequately measure the perceptual construct of flexibility of closure (Thurstone, 1944; Go ins, 1958). The perceptual readiness factor was loaded by the subtests of Form Constancy, Position in Space, and Spatial Relations. The Eye-Motor Coordination subtest loaded on the general reading achievement factor and possibly had more.power in reading prediction for their, male population.
A factor-analytic study by Corah and Powell (1963) , on the nursery school age level revealed four factors $ a general intelligence factor which had moderate loadings of the Eye-Motor subtest (.678), Spatial Relations subtest• (.386), and Position in Space subtest (.618), along with the Full-Range Picture Vocabulary Test (.861); a sex factor which was a function of the boys having higher scores than girls on the Position in Space subtest; a third factor which had its highest loading on Age (.856) and appeared to represent developmental changes (Eye-Motor, .378; Figure- Ground, .654; and Form Constancy, .323 subtests all were found on this factor); a last factor which seemed to be related to the discrimination of form with loadings as follows: Ghent Overlapping Geometric Figures Test (.367),
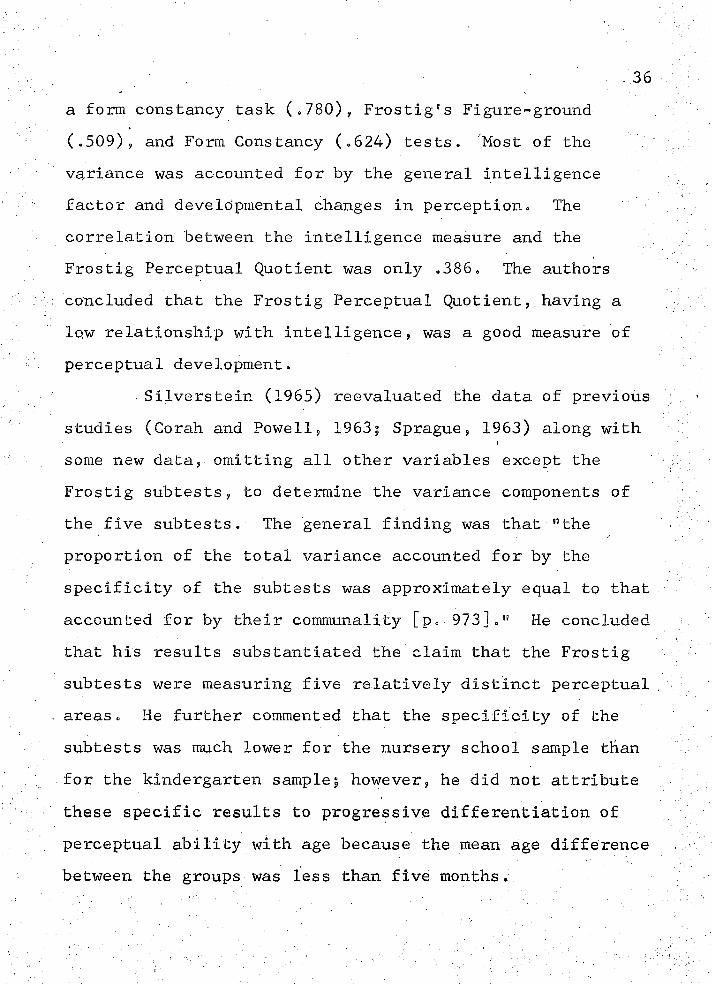
' 36- ■a form constancy task (.780), Frostig's Figure-ground (.509), and Form Constancy (.624) tests. Most of the variance was accounted for by the general intelligence factor and developmental changes in perception. The correlation between the intelligence measure and the Frostig Perceptual Quotient was only .386. The authorsconcluded that the Frostig Perceptual Quotient, having aIqw relationship with intelligence, was a good measure of perceptual development.
Silverstein (1965) reevaluated the data of previousstudies (Corah and Powell, 1963; Sprague, 1963) along withsome new data, omitting all other variables except the Frostig subtests, to determine the variance components of the five subtests. The general finding was that 16the proportion of the total variance accounted for by the specificity of the subtests was approximately equal to that accounted for by their communality [p. 973]." He concluded that his results substantiated the claim that the Frostig subtests were measuring five relatively distinct perceptual, areas. He further commented that the specificity of the subtests was much lower for the nursery school sample than for the kindergarten sample; however, he did not attribute these specific results to progressive differentiation of perceptual ability with age because the mean age difference between the groups was less than five months»
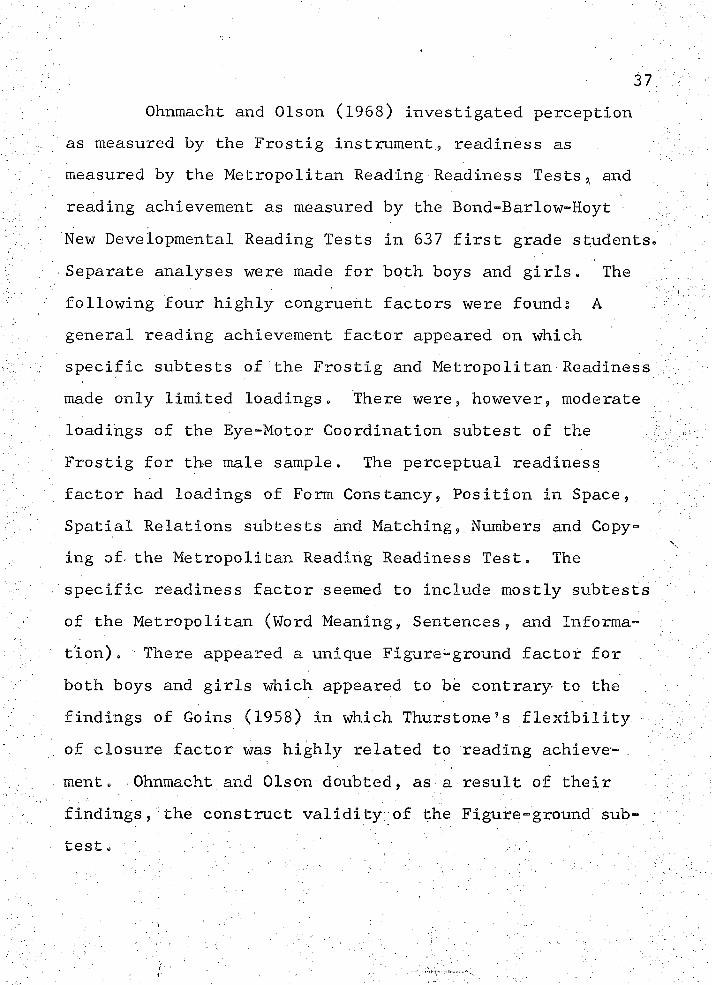
Ohnmacht and Olson (1968) investigated perception as measured by the Frostig instrument, readiness as measured by the Metropolitan Reading Readiness Tests, and reading achievement as measured by the Bond-Barlow-Hoyt ■ New Developmental Reading Tests in 637 first grade students Separate analyses were made for both boys and girls. The following four highly congruent factors were founds A general reading achievement factor appeared on which specific subtests of the Frostig and Metropolitan Readiness made only limited loadings. There were, however, moderate loadings of the Eye-Motor Coordination subtest of the Frostig for the male sample. The perceptual readiness factor had loadings of Form Constancy, Position in Space, Spatial Relations subtests and Matching,.Numbers and Copying of the Metropolitan Reading Readiness Test. The specific readiness factor seemed to include mostly subtests of the Metropolitan (Word Meaning, Sentences, and Information). There appeared a unique Figure-ground factor for both boys and girls which appeared to be contrary to the findings of Goins (1958) in which Thurstone1s flexibility of closure factor was highly related to reading achieve- . ment. Ohnmacht and Olson doubted, as a result of their findings, the construct validity; of the Figure-ground sub-
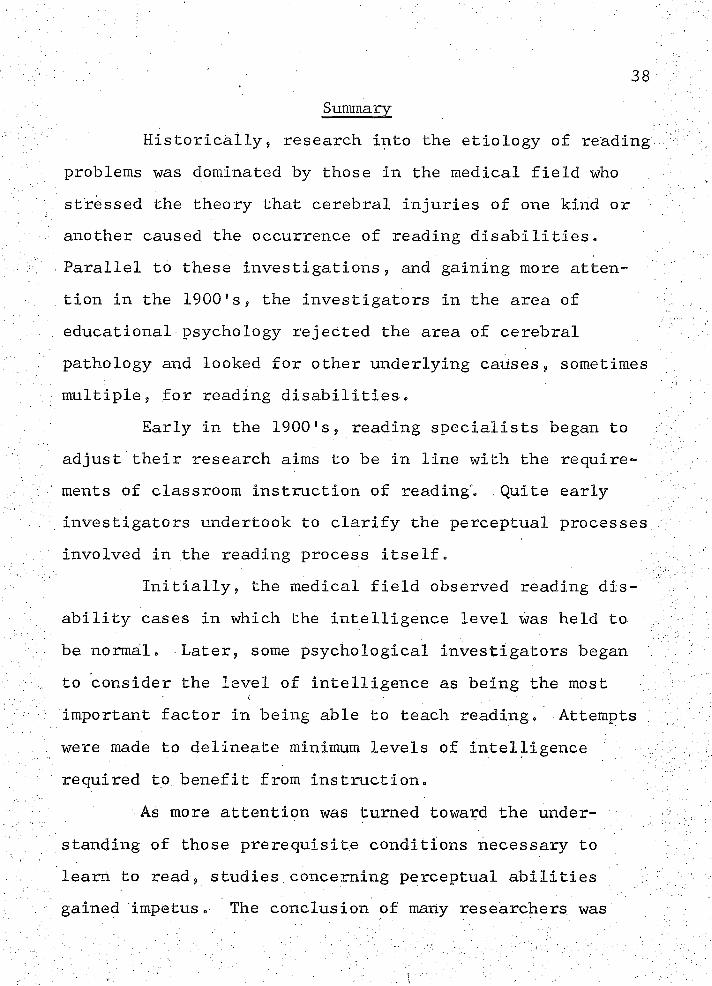
SummaryHistorically, research into the etiology of reading
problems was dominated by those in the medical field who stressed the theory that cerebral injuries of one kind or another caused the occurrence of reading disabilities. Parallel to these investigations, and gaining more attention in the 1900's, the investigators in the area of educational psychology rejected the area of cerebral pathology and looked for other underlying causes, sometimes multiple, for reading disabilities.
Early in the 1900's, reading specialists began to adjust their research aims to be in line with the requirements of classroom instruction of reading". Quite early investigators undertook to clarify the perceptual processes involved in the reading process itself.
Initially, the medical field observed reading disability cases in which the intelligence level was held to be normal. Later, some psychological investigators began to consider the level of intelligence as being the most important factor in being able to teach reading. Attempts were made to delineate minimum levels of intelligence required to benefit from instruction.
As more attention was turned toward the understanding of those prerequisite conditions necessary to 1earn to read, studies concerning perceptual abilities gained impetus. The conclusion of many researchers was
that perception was not a singular function or capacity which always operated in the same manner, but, instead, was specialized and varied with differing types of stimulus material. Visual perception and specific visual perception abilities, then, became the factors considered to be most important in the elementary reading process.
Several studies have been reported which attempted to demonstrate the relationship between reading disabilities and specific visual perception abilities as defined and measured by the Marianne Frostig Developmental Test of Visual Perception. The greatest problem which arose from these studies was the operational definitions and the construct validity of . some of the Frostig subtests
CHAPTER III
RESEARCH METHOD
This section covers the areas of subjects used in the sample, test descriptions, procedures for collecting data, and procedures for treating data. ■
SubjectsOne hundred thirty-three first-grade children, 66
boys and 67 girls, from five first-grade classrooms made up the sample. These classes constituted the entire first grade of a middle-class suburban school in a Southwestern school district. ,
The chronological age of.the subjects was calculated at the time of Lorge-Thorndike testing, midpoint into the school year (February). The age range was from 72 months to 94 months with 6 years 7 months (79.286 months) being the mean age. .The mean IQ for this sample was 109.053 with a SD of 11.898. The IQ range was from 69 to ''133. -
The original group tested with the Frostig in October consisted of 165 students. A loss of 32 students was mainly attributed to students moving away from the school's district. - ?
41Test Descriptions
Metropolitan Reading Readiness Tests: (Form A, j 1964 edition). The total reading readiness score was comprised of the following subtestss Test I--Word Meaning (range of vocabulary and verbal concepts); Test 2-— Listening (comprehension of phrases and sentences, sustained attention, capacity for inference); Test 3--Matching (visual perception of similarities and differences in word forms and figures); Test 4--Alphabet (ability to recognize lower-case letters by name); Test 5--Numbers (vocabulary, ; counting, recognition of written numerals, interpreting number symbols, simple numerical problems); Test 6-- , 'Copying (combination of visual perception and motor control).
Marianne Frostig Developmental Test of Visualf- _ -Perception: This instrument was designed to measure thefive visual perception abilities that were selected as having face validity with relevance to school achievement. The assumption made by the test authors was that these are five different and relatively independent abilities.
1« ■ Eye-Motor Coordinations The task required thedrawing of continuous straight, curved, or angled line or line combinations within certain boundaries of varying widths or to connect points without guidelines. There were 16 items with the highest possible score being 30/
Figure-Grounds The task required the recognition and reproduction of figures (triangles, crosses, moons, stars, kites, and ovals) which were intersecting and.hidden. The grounds became increasingly complex. They were to recognize these stimuli by matching a presented standard stimulus. There were 8 items with the highest possible score at 20.Form Constancy: The task involved recognition andreproduction of geometric figures (circles and squares) presented in a variety of sizes, shadings,; - textures, grounds, and positions in space and complicated by similar but non-precise geometric figures, i.e., ovals, trapezoids, parallelograms, rectangles, ellipses. There were 17 possible correct responses and 14 incorrect responses. The total raw score was the number of correct responses minus incorrect responses.Position in Space: The task required the discrimination of reversals and rotations of schematic figures representing common objects. Four items required the discrimination of an unlike figure from a series and four items required discrimination and matching of a presented figure. ,Thehighest score was all 8 correct.Spatial Relations: The test presented eight itemswhich increased in difficulty and required"the
subject to reproduce a presented stimulus of dot with line patterns which involved a variety of angles and lengths, of lines.
In the 1963 standardization study (Frostig et al., : 1964)„ the authors had not as yet found evidence that the above average scores, as compared to scores in that range on intelligence scales, were of value in predicting school achievement. Low scores, on the other hand, were significant in predicting poor achievement in the earlier grades.In computing scores on the Frostig the separate subtest raw scores were convertible to Age Equivalents by use of a table and were defined as being the performance of the average child in that Age Equivalent or perceptual age level. (This score designation was eliminated for use in the present study.) The raw scores were evaluated in terms of Scale Scores (perceptual ages divided by chronological age and multiplied by 10) and totaled to obtain a Perceptual Quotient (deviation score) for each child. This Perceptual Quotient was interpreted in terms of a range (approximately 66 to 125, depending upon the particular C.A.’table) with a total scale score of 50 converted to a median PQ of 100.For purposes of this study, the score values were reported as separate subtest and total raw score.
Lorge-Thorndike Intelligence Test (Level 1; Kindergarten and Grade 1; Form A; 1954 Edition)i The first
subtest required the child to identify a picture which pictorially described a word concept or phrase. The second subtest required the child to identify a pictured object or action which did not belong with the others. The third subtest required the child to identify two objects or pictures which went together as a result of association.On the primary level the test made use of pictorial materials (familiar common objects and simple geometric shapes) with item-by-item oral instructions.
The three subtest 11 item-correct" totals were added to obtain a total raw score, which on the basis of chronological age, was converted to a deviation Intelligence Quotient by use of tables. The total raw score and DIQ for each student was used in this study.
Stanford Achievement Test (Primary I Battery, Form W, 1964 Edition): The primary subtests were Word Reading,Paragraph Meaning (reading comprehension), and Word Study Skills (measuring reading skills)Arithmetic (containing three parts: Measures,.Problem Solving, and Number Concepts), Spelling Test, and a test of Vocabulary which was included as a measure of general knowledge.
The only values considered in this report were the• " ■. ■■ ; ■ • ■ ■ ■ subtest raw scores and a student's total raw score.
Procedures for Collecting: Data The Metropolitan Reading Readiness Test was
administered by the five classroom teachers in September, 1967. The Marianne Frostig Developmental Test of Visual Perception was administered over a period of a week in October, 1967, by an experienced test administrator with the assistance of six previously trained graduate studentsi The Lorge-Thomdike Intelligence Test was administered during February, 1968, by this experimenter in the regular classroom groups with each teacher having assisted in her own group. Stanford Achievement Tests were given in the classrooms during the last two weeks in April, 1968. .All of the above tests were administered in the, classroom settings as group tests.
:Procedures for Treating Data The means and standard deviations for the
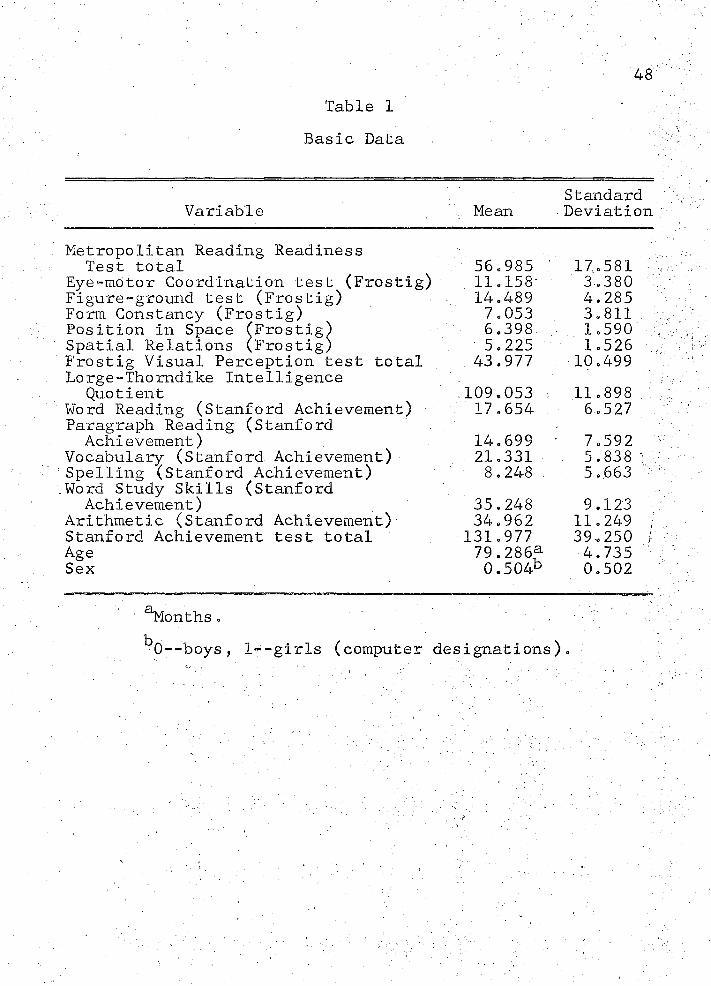
Metropolitan Reading Readiness total raw score, Frostig subtest and total raw scores,, Stanford Achievement subtest and total raw scores, Lorge-Thomdike Deviational IQ, and age were reported for the sample. .
Intercorrelations using the product-moment coefficient were derived for all 17 variables. The Frostig total score was included because it had not been converted to Perceptual Quotient which might have given spurious results.
A principal-components factor-analysis (Harman, 1960) was carried out using the 17 variables. Varimax rotation was then carried out.
CHAPTER IV
ANALYSIS OF THE DATA
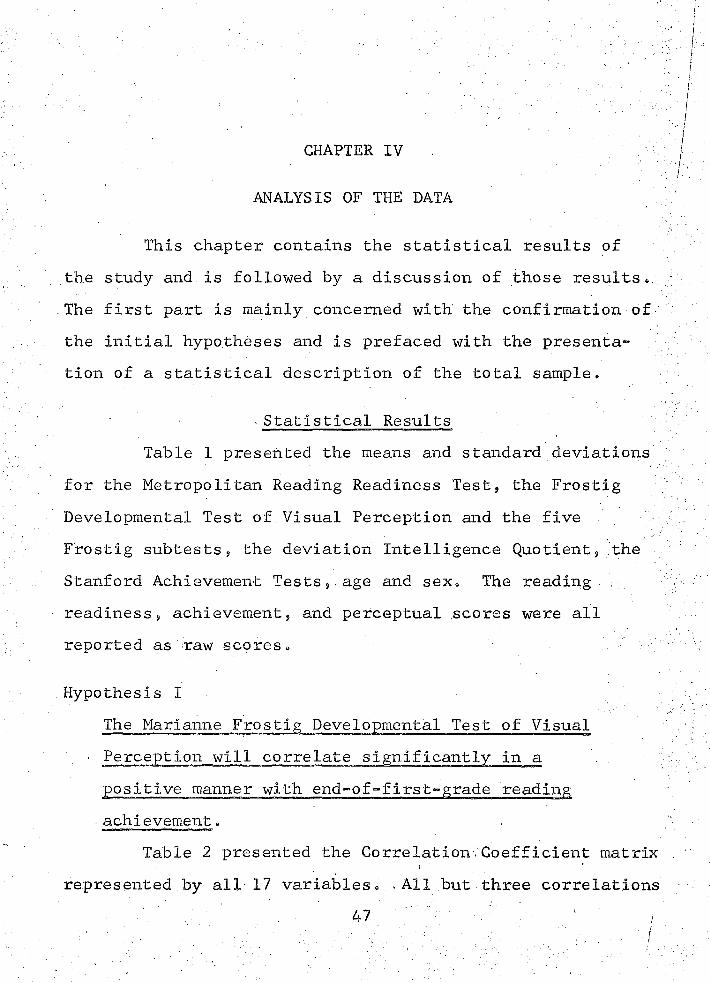
This chapter contains the statistical results of the study and is followed by a discussion of those results«, The first part is mainly concerned with the confirmation of the initial hypotheses and is prefaced with the presentation of a statistical description of the total sample.
'Statistical Results Table 1 presented the means and standard deviations
for the Metropolitan Reading Readiness Test, the Frostig Developmental Test of Visual Perception and the five Frostig subtests, the deviation Intelligence Quotient, the Stanford Achievement Tests, age and sex. The reading readiness, achievement, and perceptual scores were all reported as raw scores.
Hypothesis IThe Marianne Frostig Developmental Test of Visual
' Perception will correlate significantly in a positive manner with end-of-first-grade reading • achievement.
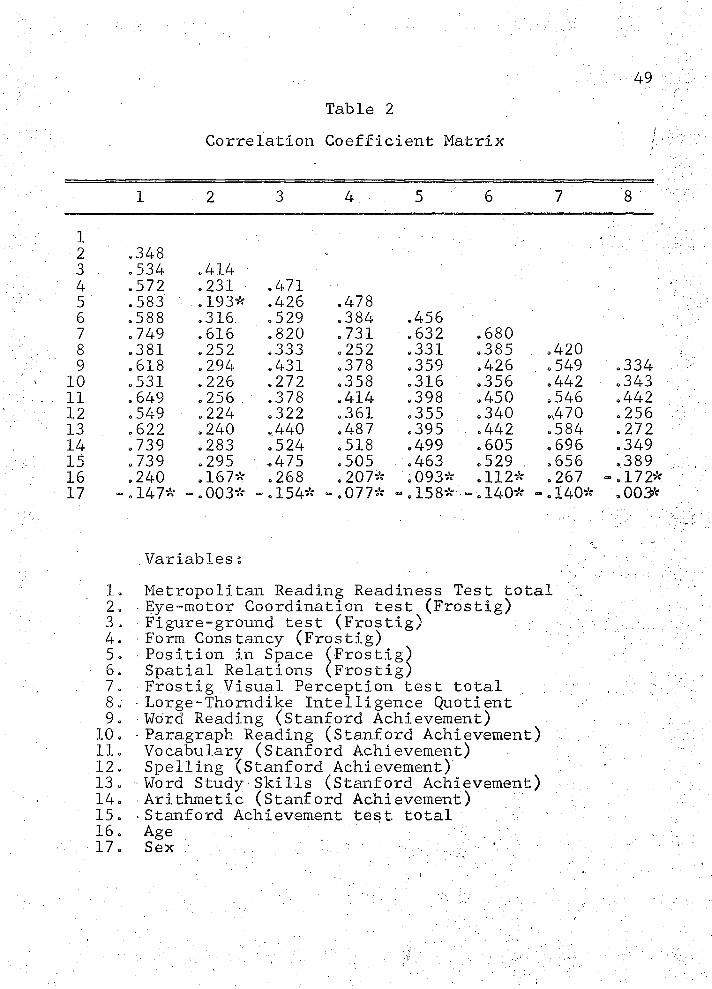
Table 2 presented the Correlation Coefficient matrixi *
represented by all 17 variables. .All but three correlations■ v ‘ . 4 7 ■ 1 /
48Table 1
Basic Data
Variable MeanStandardDeviation
Metropolitan Reading ReadinessTest total 56 .985 ' 17,,.581 '
Eye-motor Coordination test (Frostig) 11 .158 3-,.380 .Figure-ground test (Frostig) 14 .489 4,.285Form Constancy (Frostig) 7 .053 3,.811Position in Space (Frostig) 6 .398 , 1..590Spatial Relations (Frostig) 5 .225 1,.526Frostig Visual Perception test total . 43 .977 io.,499Lorge-Thorndike Intelligence
Quotient 109 .053 11.,898Word Reading (Stanford Achievement) 17 .654 6,.527Paragraph Reading (Stanford
Achievement) 14 .699 • 7,.592Vocabulary (Stanford Achievement) 21 .331 5,, 838 vSpelling (Stanford Achievement) ; 8 .248 : 5 ,,663 -Word Study Skills (Stanford
Achievement) 35 .248 9,,123Arithmetic (Stanford Achievement) 34 .962 11.,249 iStanford Achievement test total 131 .977 39,,250 fAge 79 .286f 4,,735 'Sex 0 . 504b 0,,502
^Months.^0--boys, 1--girls (computer designations).
49Table 2
: " 1Correlation Coefficient Matrix j
1 2 3 4. 5 6 7 8
12 .348
-
3 . .534 .4144 .572 .231 .4715 .583 . 193* .426 .4786 .588 .316 .529 .384 .4567 .749 .616 .820 .731 .632 .6808 .381 .252 .333 .252 .331 .385 .4209 .618 .294 .431 .378 .359 .426 . .549 .334
10 .531 .226 .272 .358 .316 .356 .442 .34311 .649 .256 .378 .414 .398 .450 .546 .44212 .549 .224 .322 .361 .355 .340 .,470 .25613 .622 .240 .440 .487 .395 .442 .584 .27214 .739 .283 .524 .518 .499 .605 .696 .34915 .739 .295 .475 .505 . 463 .529 . .656 .38916 .240 .167* .268 . 207* .093* .112* .267 -.172*17 . 147* ~ .003* -.154* — .077* -.158* • — .140* “ e140* .003*
.Variables:1. Metropolitan Reading Readiness Test total2. ■ Eye-motor Coordination test (Frostig)3. ■ Figure-ground test (Frostig)4. Form Constancy (Frostig)5. Position in Space (Frostig)6. Spatial Relations (Frostig)7. Frostig Visual Perception test total8 . Lorge-Thomdike Intelligence Quotient9. Word Reading (Stanford Achievement)
10. - Paragraph Reading (Stanford Achievement)11. Vocabulary (Stanford Achievement)12. Spelling (Stanford Achievement)13. ■ Word Study Skills (Stanford Achievement)14. Arithmetic (Stanford Achievement)15. Stanford Achievement test total1 6 • A g e , ' ... ’ . y . . .17 o ■ ■ S 6 X -- .... .:v::V 4-
50Table c2 .--Continued
9 10 11 12 13 14 15 16 17
1 ■ ; . ; ■■ .2 ' : ■ '■ - ' ' ■ ' .. ; :I ' ■ : v y - -
! ■ ■ . i9 - ' 1 : ;10 .77711 .476 .43212 .787 .780 .43013 ,765 .724 .546 .81814 .658 .588 .654 .652 .75815 . ,869 .839 .686 .870 .917 .87516 ,057* . 003* .130* .062* .114* .099* .093*17 — .069* ".026* “ .148* -.012* ~ .080* ".183* — .107* ,083*
‘ ■ . . ;*Not significant at o01 level (all others sdgnifi =* cant at .01 level). .
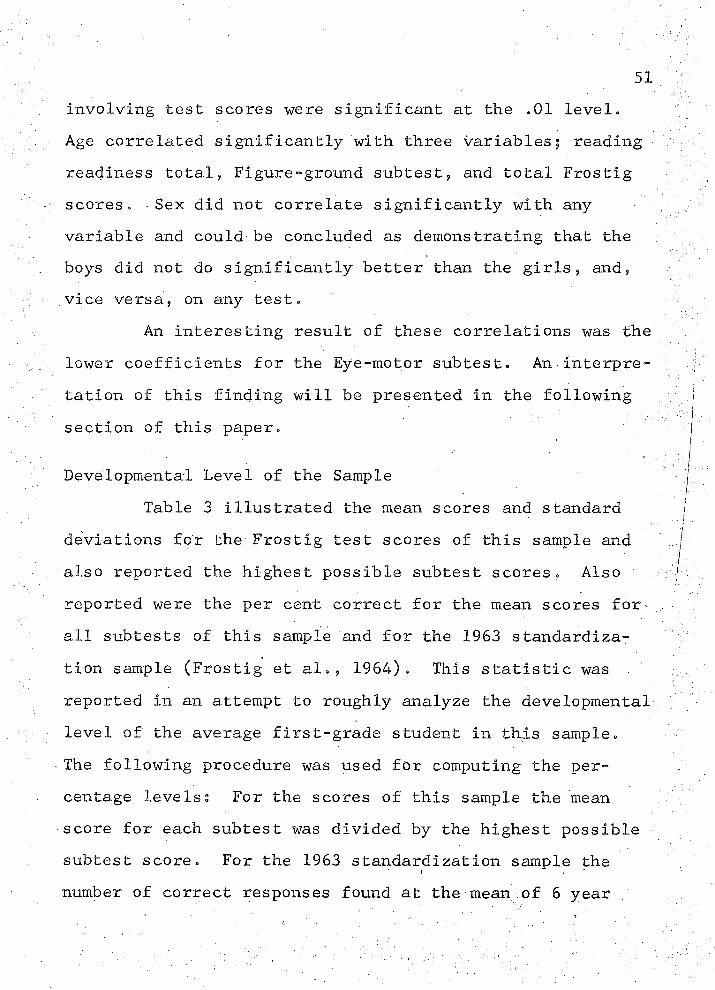
51involving test scores were significant at the .01 level.Age correlated significantly with three variables; reading readiness total, Figure-ground subtest, and total Frostig scores. •Sex did not correlate significantly with any variable and could be concluded as demonstrating that the boys did not do significantly better than the girls, and, vice versa, on any test.
An interesting result of these correlations was the lower coefficients for the Eye-motor subtest. An interpretation of this finding will be presented in the following section of this paper.
Developmental Level of the SampleTable 3 illustrated the mean scores and standard
deviations for the Frostig test scores of this sample and also reported the highest possible subtest scores. Also reported were the per cent correct for the mean scores for all subtests of this sample and for the 1963 standardization sample (Frostig et al., 1964). This statistic was reported in an attempt to roughly analyze the developmental level of the average first-grade student in th,is sample.
■ The following procedure was used for computing the percentage levelsi For the scores of this sample the mean score for each subtest was divided by the highest possible subtest score. For the 1963 standardization sample the number of correct responses found at the mean of 6 year
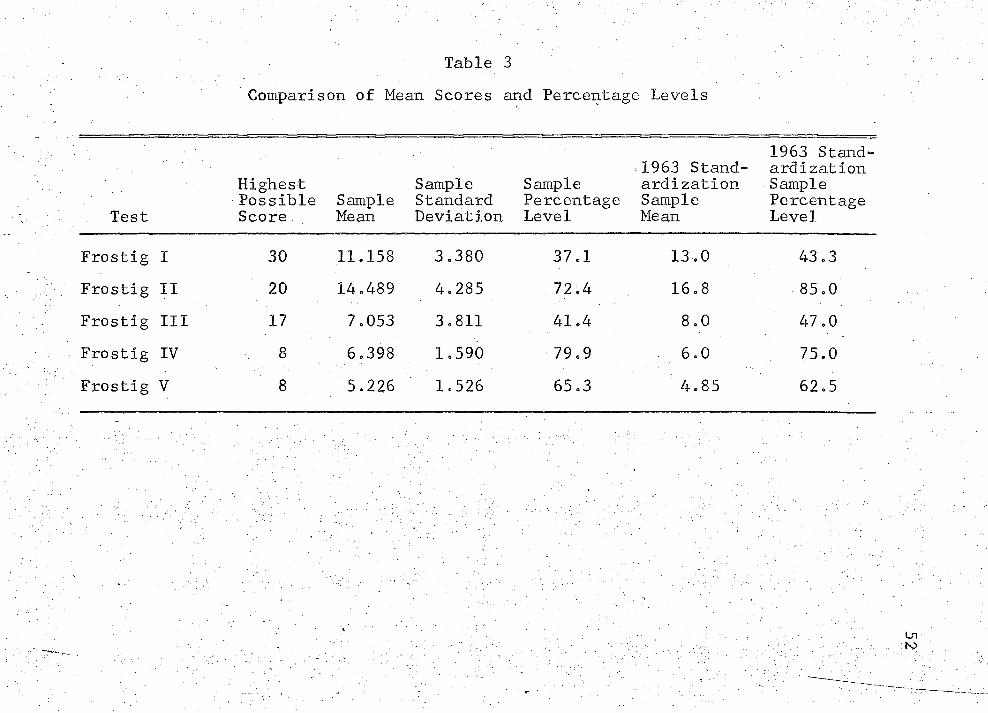
Table 3Comparison of Mean Scores and Percentage Levels
TestHighestPossibleScore
SampleMean
SampleStandardDeviation
SamplePercentageLevel
:1963 Standardization Sample Mean
1963 Standardization Sample Percentage Level
Frostig I 30 11.158 3.380 37.1 13.0 43.3Frostig II 20 14.489 4.285 72.4 16.8 85.0Frostig III 17 7.053 3.811 41.4 8.0 47.0Frostig IV 8 6.398 1.590 79.9 6.0 75.0Frostig V 8 5.226 1.526 65.3 4.85 62.5
o3 month age group on the standardization curves (Prostig et al., 1964) was divided by the highest possible subtest score.
The results presented in Table 3 indicated that the children in the sample used for this study were at about ; the same developmental level perceptually as children of comparable age which Prostig used in her norm group.
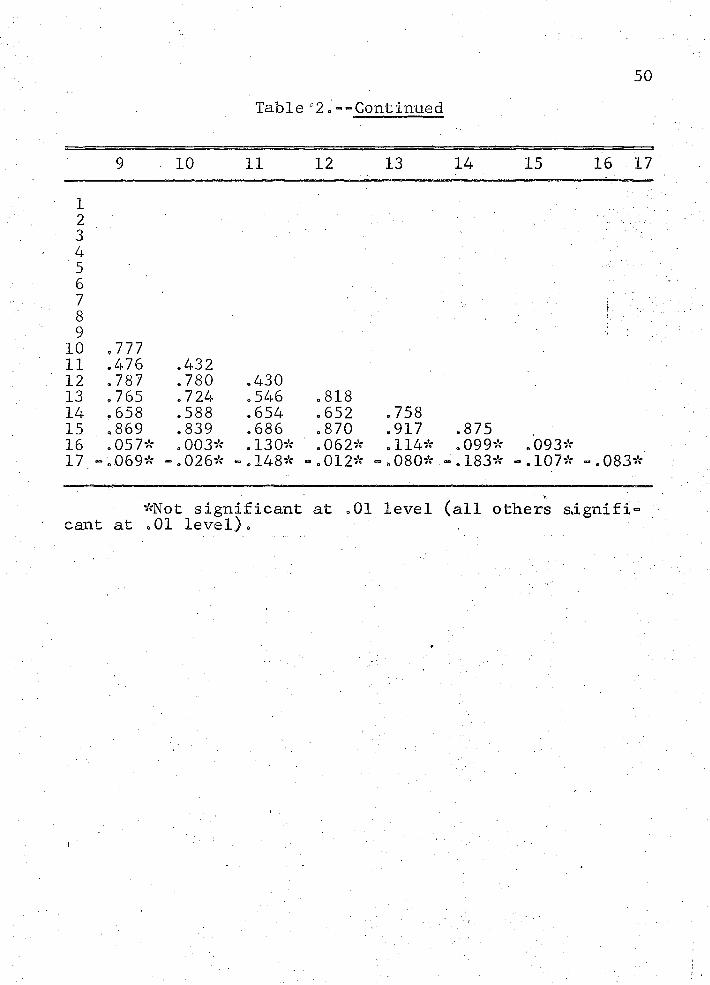
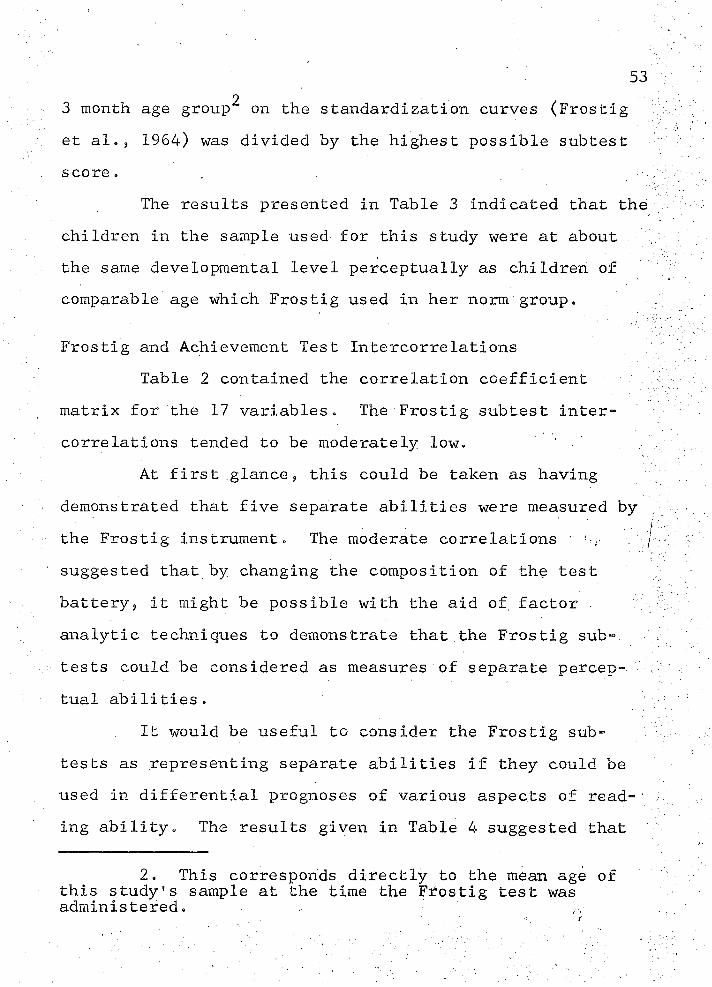
Prostig and Achievement Test IntercorrelationsTable 2 contained the correlation coefficient
matrix for the 17 variables. The Prostig subtest intercorrelations tended to be moderately low. '
At first glance, this could be taken as having demonstrated that five separate abilities were measured by the Pros tig instrument. The moderate correlations ' suggested that by changing the composition of the test battery, it might be possible with the aid of factor analytic techniques to demonstrate that the Prostig subtests could be considered as measures of separate perceptual abilities.
It would be useful to consider the Prostig subtests as representing separate abilities if they could be used in differential prognoses of various aspects of reading ability. The results given in Table 4 suggested that
2. This corresponds directly to the mean age of this study's sample at the time the Prostig test was administered.
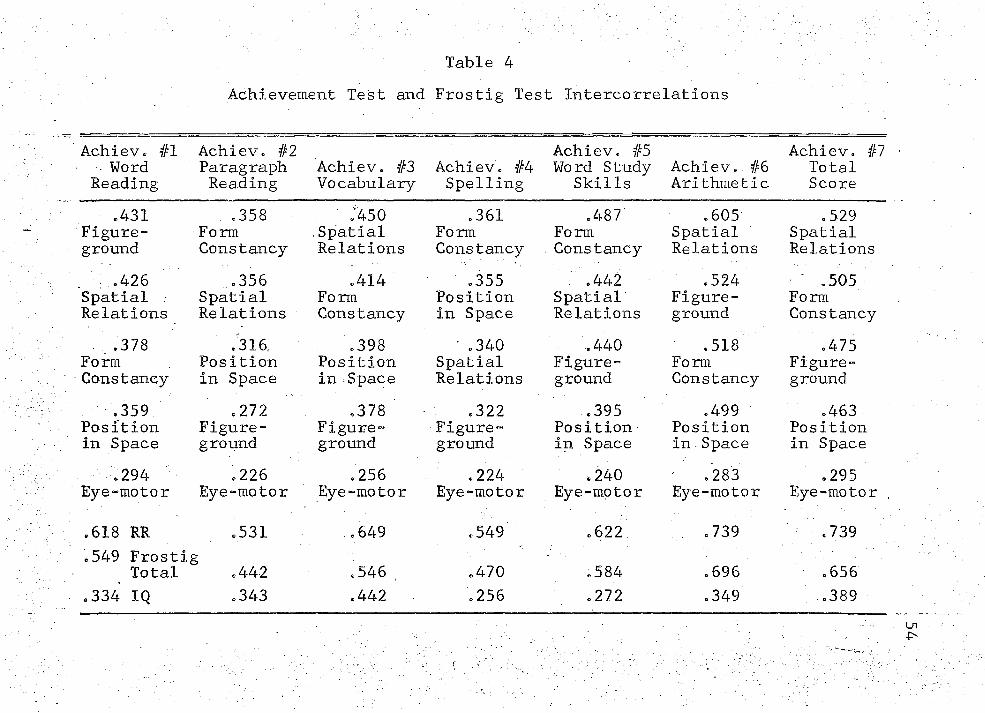
Table 4Achievement Test and Frostig Test Intercorrelations
Achiev. #1 Word
ReadingAchiev. #2 Paragraph Reading
Achiev. #3 Vocabulary
Achiev. #4 Spelling
Achiev. #5 Wo rd S tudy
SkillsAchiev. #6 Arithmetic
Achiev. #" Total Score
.431Figure-ground
.358FormConstancy
.450 . Spatial Relations
.361FormConstancy
.487 Form . Constancy
.605SpatialRelations
.529SpatialRelations
.426 Spatial . Relations
.356SpatialRelations
.414FormConstancy
.355 Position in Space
.442SpatialRelations
.524Figure-ground
,505FormConstancy
, .378 FormConstancy
.316. Position in Space
.398 Position in Space
' .340 Spatial Relations
.440Figure-ground
.518FormConstancy
.475Figure-ground
.359 Position in Space
.272Figure-ground
.378Figure-ground
.322Figure-ground
.395 Position in Space
.499 Position in Space
.463 Position in Space
.294Eye-motor
.226Eye-motor
.256Eye-motor
.224Eye-motor
.240Eye-motor
' .283 Eye-motor
.295Eye-motor
.618 RR .531 . 649 .549 .622 .739 .739
.549 Frosti Total g .442 .546 , .470 .584 .696 .656
.334 IQ .343 .442 .256 .272 .349 .389
the Frostig subtests did not yield differential prognoses with regard to reading achievement subtests. Table 4 presented the specific intercorrelations among the achievement and Frostig scores. Each Frostig subtest was arranged in rank order, the highest first, under each achievement sub- ' test and total. Included at the bottom were figures for the reading readiness total, the Frostig total, and the deviation Intelligence Quotient. For the most part, each Frostig subtest tended to correlate significantly with all achievement subtests rather than with just one or two.This suggested that there was a general underlying relationship between Frostig and achievement measures rather than specific relationships between particular Frostig and ' reading achievement measures.
Hypothesis IIReading achievement, visual perception abilities, reading readiness, and intelligence will emerge as separate factors.
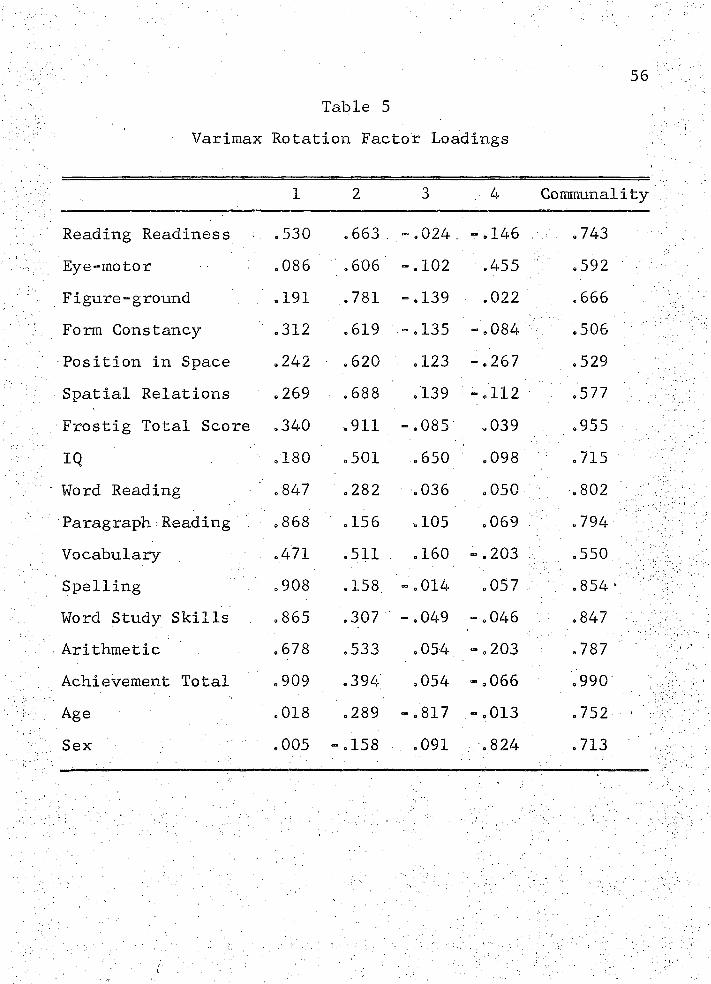
Table 5 presented the Varimax rotations of the Principal Component Factor Analysis. The results confirmed part of the hypothesis, namely, that reading achievement, visual perception.abilities and intelligence did emerge as separate factors. The reading readiness variable was loaded to the greatest extent on the visual perception abilities factor and to a lesser extent on the achievement factor.
56Table 5
Varimax Rotation Factor Loadings
1 2 3 4 Communality
Reading Readiness .530 .663 “ . 024 ; -.146 .743Eye-motor .086 .606 -. 102 .455 .592Figure-ground .191 .781 -. 139 ,022 . 666Form Constancy .312 .619 -.135 -»084 v .506 ;Position in Space .242 .620 .123 -.267 .529Spatial Relations .269 .688 .139 -.112 : .577Frostig Total Score .340 ,911 -. 085 .039 ,955IQ ,180 .501 .650 .098 .715Word Reading ' .847 .282 .036 .050 .802Paragraph:Reading V .868 .156 . 105 .069 .794Vocabulary .471 .511 .160 -.203 ;v.55° ; ; $Spelling .908 .158 — • 014 .057 ; .854';/:^Word Study Skills .865 .307 - . 049 -.046 : .847 \Arithmetic .678 .533 .054 -.203 : .787Achievement Total .909 .394 .054 -. 066 .990Age .018 .289 -.817 -.013 .752Sex .005 -.158 ,091 .824 .713
57This result led to a discussion concerning the
task requirements of the readiness test which were found to be similar to those required by the Frbstig instrument and the achievement tests. .This will be discussed more fully in the following section. - .
DiscussionThe confirmation of Hypothesis I resulted from the
significant relationships found between the Frostig test scores and achievement test scores. .The Eye-motor Coordination subtest had the lowest relationship with all of the achievement tests. Two possible explanations were offered:
1. The percentage level at which the sample's meanfell (37.1%) was considerably lower than any other subtest, except for Form Constancy (41.4%). These findings concurred with the standardization curves obtained by Frostig et al. (1964) which she used to demonstrate the relative developmental rate of each perceptual ability. The standardization curves tended to show slower rates of development for both :Eye-motor coordination and Form Constancy. It was tempting to interpret these results as demonstrating that both Eye-motor Coordination and Form Constancy subtests were measuring abilities which were not, yet, as highly developed as the other perceptual
■- . a b i l i t i e s . v ; v ;:- . :
582. It should be pointed out that the Eye-motor
Coordination subtest was designed to predict difficulties in writing or printing (Frostig et al., 1961), an ability which was not specifically measured by the Stanford Achievement Test. The results of the correlations could, at least negatively, have indicated that this subtest did measure a separate perceptual ability which was related to a specific school performance task.The overall lower intercorrelations between this subtest and the other Frostig subtests did tend to demonstrate its relative distinction.
The demonstration of the Frostig subtests as having measured five separate perceptual abilities still appeared to be open to question. The questionable aspect within this demonstration was the degree of relationship which was found throughout the subtests, except for the Eye- motor subtest. This relationship did not appear when analyzing the data but became readily apparent when scrutinizing the test materials and instructions. There appeared an underlying aspect involved in the Figure- ground, Form Constancy, and Position in Space subtests.The student was instructed to scan the stimulus material in order to find a particular figure or shape which corresponded to one visually presented, to him. As
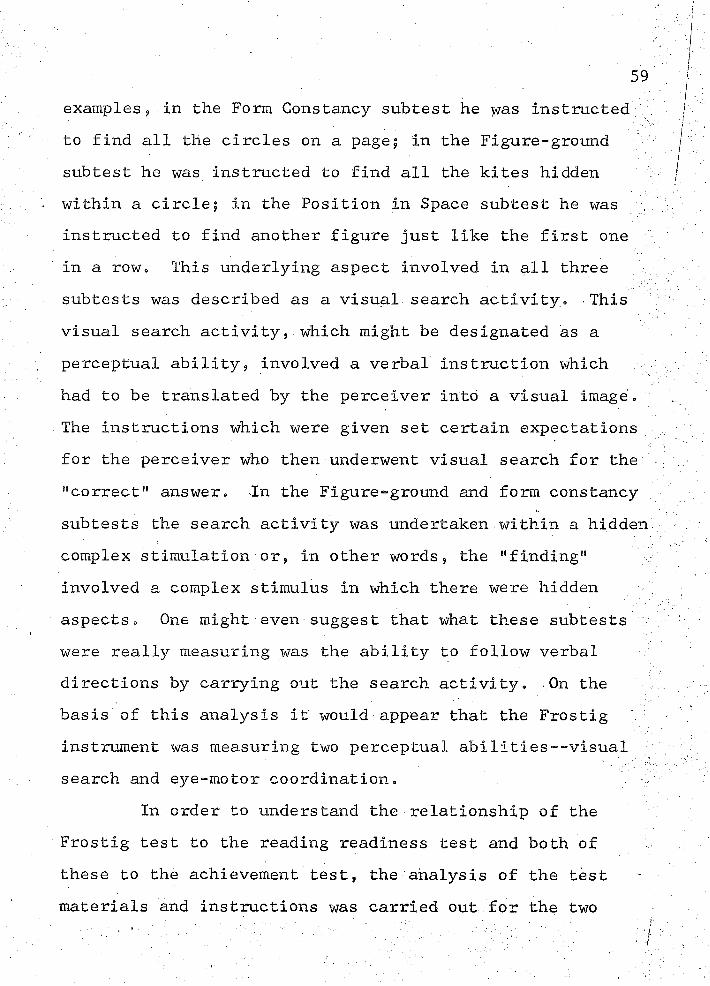
59
examples <, in the Form Constancy subtest he >zas instructed to find all the circles on a page; in the Figure-ground subtest he was instructed to find all the kites hidden within a circle; in the Position in Space subtest he was instructed to find another figure just like the first one in a row. This underlying aspect involved in all three subtests was described as a visual search activity. This visual search activity, which might be designated as a perceptual ability, involved a verbal instruction which had.to be translated by the perceiver into a visual image. The instructions which were given set certain expectations for the perceiver who then underwent visual search for the "correct" answer. In the Figure-ground and form constancy subtests the search activity was undertaken within a hidden complex stimulation or, in other words, the "finding" involved a complex stimulus in which there were hidden aspects. One might even suggest that what these subtests were really measuring was the ability to follow verbal directions by carrying out the search activity. On the basis of this analysis it would appear that the Frostig instrument was measuring two perceptual abilities--visual search and eye-motor coordination.
In order to understand the relationship of the Frostig test to the reading readiness test and both of these to the achievement test, the analysis of the test materials and instructions was carried out for the two
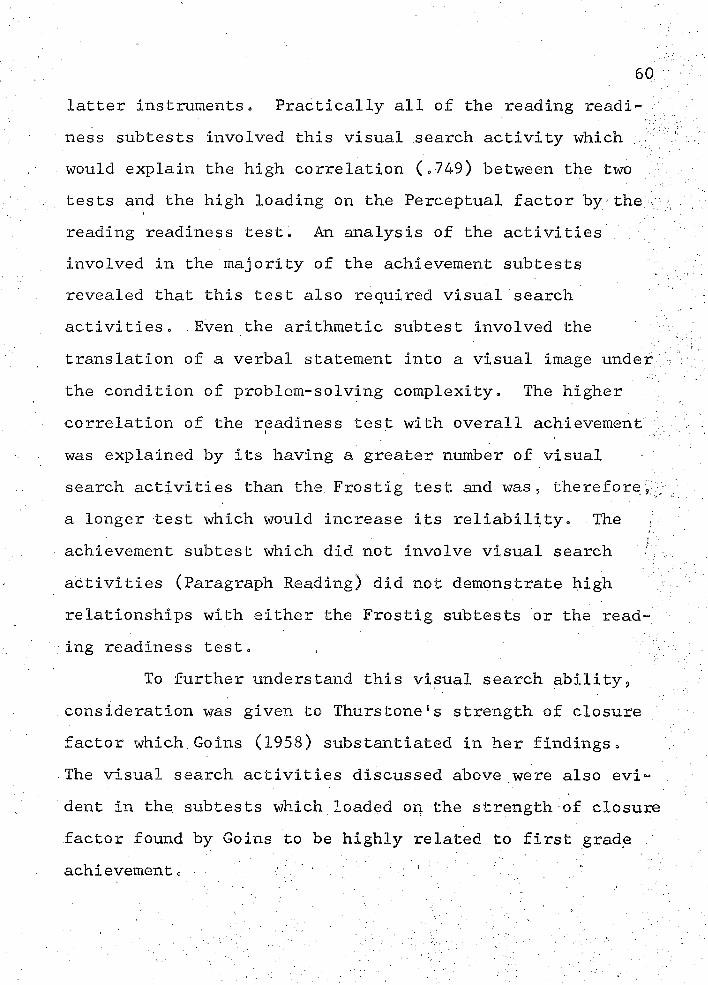
60latter instruments. Practically all of the reading readiness subtests involved this visual search activity which would explain the high correlation (.749) between the two tests and the high loading on the Perceptual factor by the reading readiness test. An analysis of the activities involved in the majority of the achievement subtests revealed that this test also required visual search activities. Even the arithmetic subtest involved the translation of a verbal statement into a visual image under the condition of problem-solving complexity. The higher correlation of the readiness test with overall achievement was explained by its having a greater number of visual • search activities than the Frostig test and was, therefore, ■ a longer test which would increase its reliability. The ; achievement subtest which did not involve visual search • ;activities (Paragraph Reading) did not demonstrate high relationships with either the Frostig subtests or the reading readiness test.
To further understand this visual search ability, consideration was given to Thurstone's strength of closure factor which.Goins (1958) substantiated in her findings.The visual search activities discussed above were also evident in the subtests which loaded on the strength of closure factor found by Goins to be highly related to first grade . achievement, ^ - ; 'r .
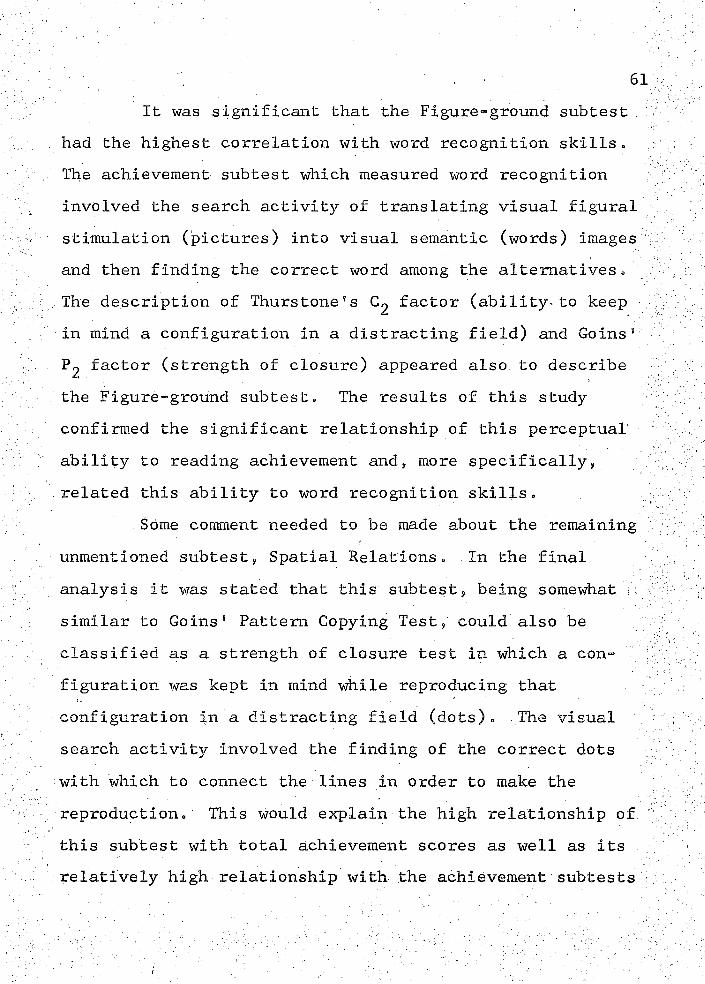
It was significant that the Figure-ground subtest had the highest correlation with word recognition skills. The achievement subtest which measured word recognition involved the search activity of translating visual figural stimulation (pictures) into visual semantic (words) images and then finding the correct word among the alternatives. The description of Thurstone ’ s 0>2 factor (ability to keep in mind a configuration in a distracting field) and Goins’ ?2 factor (strength of closure) appeared also to describe the Figure-ground subtest. The results of this study confirmed the significant relationship of this perceptual ability to reading achievement and, more specifically, related this ability to word recognition skills.
Some comment needed to be made about the remaining unmentioned subtest, Spatial Relations. In the final analysis it was stated that this subtest, being somewhat >. similar to Goins’ Pattern Copying Test, could also be classified as a strength of closure test in which a configuration was kept in mind while reproducing that configuration in a distracting field (dots). The visual search activity involved the finding of the correct dots with which to connect the lines in order to make the reproduction. This would explain the high relationship of this subtest with total achievement scores as well as its relatively high relationship with the achievement subtests
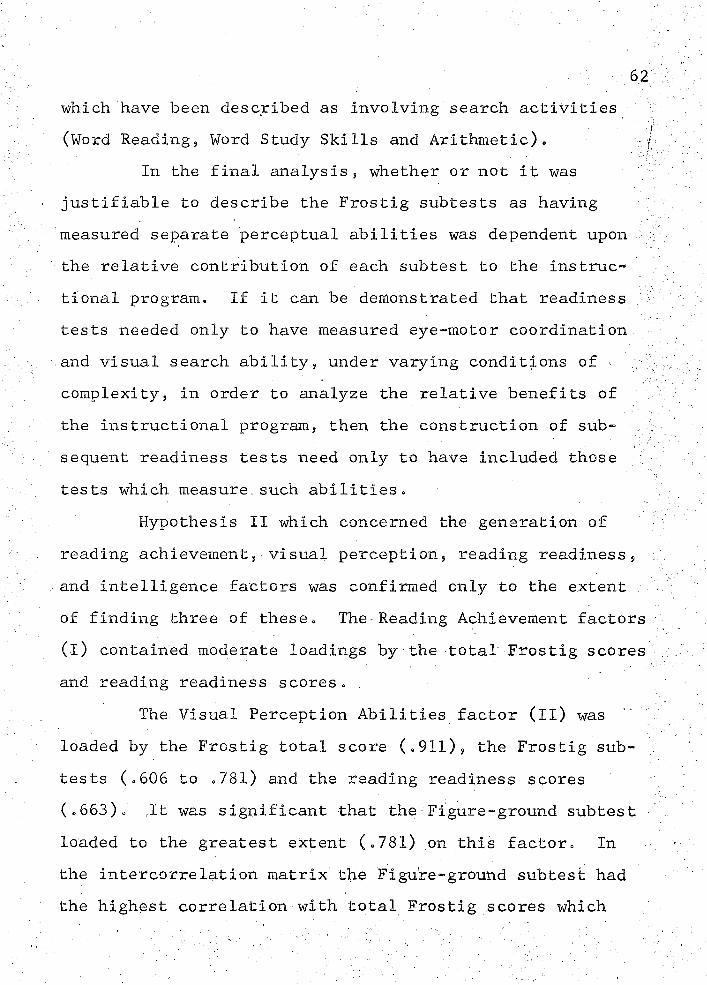
which have been described as involving search activities (Word Reading, Word Study Skills and Arithmetic).
In the final analysis, whether or not it was justifiable to describe the Frostig subtests as having measured separate perceptual abilities was dependent upon the relative contribution of each subtest to the instructional program. If it can be demonstrated that readiness tests needed only to have measured eye-motor coordination and visual search ability, under varying conditions of - complexity, in order to analyze the relative benefits of the instructional program, then the construction of subsequent readiness tests need only to have included those . tests which measure, such abilities.
Hypothesis II which concerned the generation of reading achievement, visual perception, reading readiness, and intelligence factors was confirmed only to the extent of finding three of these. The Reading Achievement factors (l) contained moderate loadings by the total Frostig scores and reading readiness scores. .
The Visual Perception Abilities factor (II) was loaded by the Frostig total score (.911), the Frostig subtests (.606 to .781) and the reading readiness scores (.663). ,.It was significant that the Figure-ground subtest loaded to the greatest extent (.781) on this factor. In the intercorrelation matrix the Figure-ground subtest had the highest correlation with total Frostig scores which
would indicate that this subtest was more highly related to the other Frostig subtests than the subtests were to themselves. In other words, this subtest accounts for more of the variance of the total score than any of the other subtests .
The best explanation for the reading readiness test scores loading on the Visual Perception factor was that the two test batteries were measuring some of the same perceptual abilities. It was said, based on the previous discussion, that the similar perceptual tasks involved can be designated as visual search activities.
The third factor was explicitly an Intelligence factor on which there were no other loadings. It should be pointed out that the deviation Intelligence Quotient values were related to achievement on a much lower level than any of the perceptual measures. This finding, along with the findings of previously reported studies which used different grade levels, would tend to confirm the notion that perceptual ability was of greater importance on the 'primary grade levels and that intelligence was not highly related to perceptual ability at this early school level. The results reported in Table 3 demonstrated that intelligence was more strongly related to reading comprehension (Paragraph Reading) than it was to reading mechanics (Word Reading and Word Study Skills) when having compared, its relative relationship against the Frostig
64subtests and reading readiness scores„ Although these differences were not tested for significance, it would seem to indicate that studies designed to investigate these relative relationships might be,valuable.
The fourth factor was one designated by Sex and had only a moderate loading (.455) by the Eye-motor subtest.No explanation of this loading seemed possible since there were no differences between the performances of the boys and those of the. girls.
CHAPTER V
SUMMARY,.LIMITATIONS,.AND RECOMMENDATIONS
An overview of the results and conclusions of this study is presentedfollowed by an outline of the limita~. tions found in this study. .Recommendations for future research based on the findings of the study are also put forth.
SummaryThe purpose of this factor-analytic study was to ’
investigate the relationship of visual perception abilir; ties, as measured by the Marianne Frostig Developmental Test of Visual Perception, to end-of-first-grade reading achievement. Certain hypotheses concerning visual perception abilities were formulated in an effort to determine the effectiveness of using such an instrument on the ' ^primary school level as a form of prognosis for the prevention of the occurrence of reading disabilities.
An important aspect of Hypothesis I concerned the delineation of separate perceptual abilities which can be operationally defined andsubsequently, demonstrated to be highly related to specific reading abilities.
. Data were obtained from scores on an intelligence test, a reading readiness test, and the visual perception test for 133 first grade students in a public school.
Results 'An analysis of the data, confirmed Hypothesis I
wherein the visual perception test was positively related to reading achievement at the end of first grade.
The assumption, as put forth by the authors, that the Marianne Frostig Developmental Test of Visual Perception measured separate perceptual abilities, was not conclusively confirmed by the results of this study. As mentioned earlier, however, the moderate intercorrelations among the subtests suggested that separate perceptual abilities could be demonstrated if the test battery were altered and additional factor analyses undertaken.
The Varimax factor rotation generated factors' for reading achievement, visual perception abilities and intelligence, but did not fully confirm Hypothesis II due to the absence of a separate reading readiness factor;
ConclusionsThe most important conclusion of this study was
that the instruments designed to measure reading readiness, visual perception, and achievement all had similar task
requirements, which, in effect , gave evidence for their high relationshipso The activities which they were all measuring to some extent were visual search activities which were, subsequently, designated as a specific perceptual ability. . .
Limitations
Sample SelectionIt would have been far more significant if this
sample could have been stratified so that generalization to larger populations could have been made possible.
Test ScoresThe subtest scores for the Metropolitan Reading
Readiness Test were not reported which hindered .the further analysis of visual search activities by not having subtest % intercorrelations to observe.
Instruments UsedIn order to demonstrate the relative effectiveness .
of the Frostig instrument as a measurement of perceptual development lags and demonstrating their direct relationship to reading achievement, it would have been more valuable if tests other than the usual classroom achievement test had been administered. .Although its use would have been cumbersome for a sample of this size, a
standardized test of reading ability which was individually , administered would possibly have been more reliable.
• . RecommendationsIt would be exceedingly profitable to avoid the
cumulative effect of reading difficulties through early diagnosis of the kinds of abilities which are directly related to the reading process. In order to identify the visual perception abilities which have a direct relationship with learning to read and to carrying out other academic performances, i.e., writing, arithmetic, etc., it ■ is evident that further research attempting to demonstrate the specific processes involved in visual search activity needs to be carried out.
,1*, Tests should be specifically designed involving the identified visual search activity under varying conditions; for example, . visual search activity with problem-solving complexity, visual search activity with complex stimuli. By so designating each subtest, it would be possible to demonstrate the specific academic performance skill to which it bore a crucial relationship. It would be necessary to carefully select and analyze the performance activities involved in the measurement of end-of- first-grade achievement in order to avoid the statistical relationship being the result of similar
69;
perceptual activities being involved in both testing instruments. In constructing the visual search measurements precaution should be taken to control the amount and type of initial stimulation or, in another word, the instruction (auditory or visual) given to the child, to determine the perceptual expectancies which might be operating. ,Inclusion, should be made of tests specifically designed to measure eye-motor coordination and writing performance at end-of-first-grade because this study indicated that eye-motor coordination was not crucially related to the achievement being measured. It was demonstrated that this perceptual- motor ability, at least tentatively, was a separate ability when compared to the other Frostig subtests. Research efforts such as these could more adequately define the specific perceptual abilities which determine later achievement.The improvement of operational definitions and the demonstration of the construct validity of instruments used for the diagnosis of prerequisite abilities could result in the facilitation of the construction of instructional aids and training programs which would have greater meaning for the classroom teacher. When the relationships between abilities, as measured by various instruments, and
70later performance in school can be more clearly defined, rather than talking about vague.constructs, the teacher will have greater understanding of the readiness status of each of her pupils.The results of the correlations between intelligence scores and reading tests of comprehension and of mechanics as compared with those between perceptual ability scores and comprehension and mechanics of reading, need to receive some further attention. With intelligence scores tending to be more closely related to reading comprehension than the scores of the perceptual tests, suggests that a delineation between the processes of mechanics and comprehension may exist. Studies directed toward demonstrating what kinds of relationships did exist could provide more information as to how instructional programs in reading could be constructed.
i , r- Y T Y i . ' '
1 f j i ». i • 1 u / I . < l ' i , , . I . } < ■ / ■ . s * » I
REFERENCES
Bachmann, F . Uber kongenitale Wortb1indheit (angeborene Leseschwache). .Abhandl. Neurologie, Psychiatrie, Psychologie u. ibren Grenzgebieten, Berlin, 1927, 40. Cited by E. Malmquist, Factors related toreading disabilities in first grade. Sweden; Almqvist & Wiksell, 1958. ™P,
Stockholm,19.
Barrett, T.C. Visual discrimination tasks as predictors of first grade reading achievement. Reading Teacher, 1965, 18(4), 276-282. (a)
Barrett, T. C. The relationship between measures of pre- reading visual discrimination and first grade reading achievement; A review of the literature..Reading Research Quarterly, 1965, Fall, 51-57. (b)
Bond, G., and Fay, L. A comparison of the performance of gond and poor readers on the individual items of the Stanford-Binet scale, form L and M. ,Journal of Educational Research, 1950, 43, 475-479.
Bond, G., and Tinker, M. Reading difficulties: Their diagnosis and correction! New York: Appleton- Century-Crofts, 195/. *
Bryan, Q. The relative importance of intelligence andvisual perception in predicting reading achievement. California Journal of Educational Research, 1964, 15, 44-48. ™ — ‘
Corah, N . L., and Powell, B . J . A factor analytic studyof the Frostig Developmental Test of Visual Perception. Perceptual & Motor Skills, 1963, 16, 59-63.
Cruickshank, W. M . , Bice, H. V., and Wallen, N „ E. Perception and cerebral palsy. Syracuse, N « Y .: SyracuseUniversity Press, I957.
Davidson, H. An experimental study of bright, average and dull children at the four-year mental level.. Genetic Psychology Monographs, 1931, 9, 119-289.
71
72deHirsch, K., Jansky, J . J., and Langford, W. S. Pre
dicting reading failure; A preliminary study of . reading, writing, and spelling disabilities in preschool children. New York: Harper & Row, T966.
Deputy, E. C. Predicting first-grade reading achievement.Teacher College Contributions to Education, 1930,N o . 421.
Durrell, D. The influence of reading ability on intelligence measures. Journal of Educational Psychology, 19.33, 24, 412-4167" ~~ “
Fendrick, P. Visual characteristics of poor readers.Teachers College Columbia University Contributions to Education, New York, 1935, 6567 51. ! "
.Frank, H. A comparative study of children who are backward in reading and beginners in the infant school. British Journal of Educational Psychology, 1935, 5, 7 n _ T g _ : ----------------
Frostig, M . , Lefever,.D. W . , and Whittlesey, J. R. B. .A developmental test of visual perception for evaluating normal and neurologically handicapped children. Perceptual & Motor Skills, 1961, 12, 383-389. ; i
Frostig, M . , Lefever, D. W., and Whittlesey, J . R. B .Marianne Frostig Developmental Test of Visual Perception. (.Rev. ed. ) Palo Alto , California? Consulting Psychologists Press, 1966.
Frostig, M . , Mas low, P., Lefever, D. W., and Whittlesey,J. R. B. The Marianne Frostig Developmental Test of Visual Perception? 1963 standardization. Perceptual & Motor Skills, 1964, 19, 463-499.
Gates,. A.. I. The psychology of reading and spelling with special reference to disability. Teachers College Columbia University Contributions to Education,1922, No. 129. ~”~
Gates, A. I. A study of the role of visual perception,intelligence and certain associative processes in reading and spelling. Journal of Educational Psychology, 1926, 18, 433-445. ~
Gates,.A. I. Interest and ability in reading. New York? Macmillan, 1930.
73Gates,.A. I. The role of personality maladjustment in
reading disability. Journal of Genetic Psychology, 1941, 59, 77-83. ;
Gates, A. I. The improvement of. reading. A program of diagnostic and remedial methodsT . New York: Macmillan, 1947.
Gates, A. I., and Bond, G. Reading readiness: A study of factors determining success and failure in beginning reading. Teachers College Record, 1936, 37, 679-686.
Gavel,.S. R. June reading achievements of first-grade children. Journal of Education, 1958, 140(3), 37-43. “
Goins, J. T . Visual perceptual abilities and early reading progressi Supplementary Educational Monograph, Chicago: University of Chicago Press, 1958, No. 87.
Gray, W. Reading. In W. Monroe (Ed.), Encyclopedia of educational research. New York, 1950. Pp. 965-tuot:---- -— ------
Harman, H. H. Modern factor analysis. Chicago: University of Chicago Press, i960. """
Harrington, Sister Mary James, and Burrell, D. D. Mental maturity vs. perception abilities in primary reading. Journal of Educational Psychology, 1955, 46, 375-380.
Hayes,.E. Why pupils fail. Educational Method, 1933, 13, 25-28. ' — — —Hinshelwood, J. Congenital word blindness. London, 1917.
Cited by E. Malmquist, Factors related to reading disabilities in first grade. Stockholm, Sweden:
: Almqvist & Widsell, IWjBl "Pp. 15-18.Keogh,.B . K. Form copying tests for prediction of first
grade reading. In 27th Yearbook Claremont Reading Conference. Claremont, California: Claremont Graduate School Curriculum Laboratory, 1963, 141-■ 144. . •
Kussmaul, A. Die Storangen der Sprache. In H. Ziemssen (Ed.), Handbuch der Speziellen Pathologie und Therapiel Leipzig, To"77” 1"02~ 174-176? Cited by "El Malmquist, Factors related to reading disabilities in first gradeJ Stockholm, Swedens Almqvist & Wiksell, 1958. P. 17.
Ladd, M. The relation of social, economic and personal characteristics to reading ability. Teachers College Columbia University Contributions to , EducationT 1933, 582, 21-22. ----------- :---
Langsam, R.S. A factorial analysis of reading ability.Journal of Experimental Education, 1941, 10, 57-63.
Lashley, K. S. Brain mechanisms and intelligence.,Chicago, 1929. Cited by E. Malmquist, Factors related to reading disabilities in first grade. Stockholm, Sweden? Almqvist & Wiksell, 1958. ’P. 19.
Lennon,. R . The relation between intelligence and achievement test results for a group of communities. Journal of Educational Psychology, 1950, 41, 301-. iuf:— ;— — ...— L ^
Leton, D. A. Visual-motor capacities and ocular efficiency in reading. Perceptual & Motor Skills, 1962, 15, 407-432. ' ■
Malmquist, E . Factors related to reading disabilities in . the first grade of the elementary school.Stockholm, Swedens Almqvist & Wiksell, T958.
Mary of the Visitation, Sister. Visual perception inreading and spelling. Education Research Bulletin
' Catholic University of America, 1929, 4, 1. " “Merrill, M. The relation of intelligence to ability in
the "Three R's" in the case of retarded children.• Pediatric Sem., 1921, 28, 249-274.
Monroe, M. Reading aptitude tests for the prediction of success and failure in beginning.reading. Education, 1935, 56(1), 7-14. _
Monroe, M. Children who cannot read. Chicago: Chicago ., University Press, 1946.
75Morgan,.?. A case of congenital word blindness. British
Medical Journal, 1896, 1378. Cited by E.Malmquist, Factors related to reading disabilities in first grade. Stockholm,. Sweden: Almqvist & T \ x Wiksell, 1958. Pp. 15-16.
Morphett, M. , and Washbume, C. When should children begin to read? Elementary School Journal, 1931, 31, 496-503. ■
Ohnmacht, F. W . , and Olson, A. V. Canonical analysis of reading readiness measures and the Frostig Developmental Test of Visual Perception. Paper presented at the meeting Of the American Educational Research Association 1968 Annual Meeting, Chicago, Illinois, February 7-10, 1968. Educational and Psychological Measurement Journal, 1968, in press.
Ohnmacht, F . W ., and Rosen, C. L. Perception, readiness,and reading achievement in first grade. Proceedings of the International Reading Association Conference, Seattle, 1967, in press. "L>
Olson, A. V. Growth in word perception abilities as itrelates to success in beginning reading. ■Journal of Education, 1958, 140(3), 25-36.
Olson, A. V. Relation of achievement test scores andspecific reading abilities to the Frostig Developmental Test of Visual Perception. Perceptual & Motor Skills, 1966, 22, 179-184. (aT
Olson,. A. V. School achievement, reading ability, and specific visual perception skills in the third grade. Reading Teacher, 1966, 19, 490-492. (b)
Phelan, Sr. M. B . Visual perception in relation to variance in reading and spelling. Washington, D.. C.s Catholic Education Press, 1940 (Catholic University : of America Educational Research Monograph, 1940,12, No. 3).
Potter, M. Perception of symbol orientation and early reading successV Teacher College Columbia University Contributions to Education, 1949, 939.
Psychological Abstracts,- 1961-1967 *.
76Robinson, H. Why pupils fail in reading. Chicago;
University of Chicago Press, 1046.Robinson, H. Factors which affect success in reading.
Elementary School Journal, 1955, 55, 263-269.Robinson, H. M. Vision and reading difficulties. The
findings of research on visual difficulties in reading. In J . A. Figurel (Ed.), Reading for effective living. Conference proceedings of the International Reading Association, 1958, 3, 107-111.
Rosebrook, W. Preventing reading deficiency. .Elementary School Journal, 1935, 36, 276-280.
Silyerstein, A. B. Variance Components in the developmental test of visual perception. Perceptual & Motor Skills, 1965, 20, 973-976.
Skydsgaard, H. Den konstitutionelle dyslexi, ,l0rdb 1 indhed.” Diss. , Kobenhavn, 1942. Cited by E. Malmquist,• Factors related to reading disabilities in first grade. Stockholm, Sweden: Almqvist & Wiksell,1956. Pp. 16-24. —
:Smith,.N . B . Matching ability as a factor in first-grade reading. Journal of Educational Psychology, 1928, 19,560-5717“
Sprague, R. . Learning difficulties of first grade children diagnosed by the Frostig visual perceptual testss A factor analytic study. Unpublished doctoral dissertation, Wayne University, 1963.
Stroud, J . B . Rate of visual perception as a factor inrate of reading. Journal of Educational Psychology, 1945, 36, 495-496.
Thurstone,.L . L. Primary mental abilities. Psychometric:;^ Monographs. Chicago: University of Chicago Press, J 1938 , No'. 1. (a)
Thurstone, L. L. The perceptual factor. Psychometrika, 1938, 3, 1-17. (b) . "
Thurstone, L . L. A factorial study of perception..Psychometric Monographs. Chicago: University of Chicago Press, 1944, No.- 4.
Thurstone, L.L. Mechanical aptitude Ills Analysis of group tests.. Psychometric Laboratory, Chicagos University of Chicago, 1949, N o „ 55.
Tinker, M. Diagnostic and remedial reading. Elementary School Journal, 1932, 33, 293-307.
Tordrup, S. A. De ordblinde b o m s intelligent.Laesepaedagogen, 1953, 1, 3, 2-7. Cited by E. Malmquist, Factors related to reading disabilities in first grade. Stockholm, Swedens Almqvist & Wiksell, 1958. Pp. 138-139.
Tordrup, S. A. Laese- og skrivevenskeligheder hos bom. Laesepaedagogen, 195.5, 4, 1, 3-12, Kobenhavn.Cited by E. Malmquist, Factors related to reading disabilities in first grade. Stockholm, Swedens Almqvist & Wiksell, 1^58. "Pp. 40-41.
Weiner,.M., and Feldmann, S. Validation studies of areading prognosis test for children of lower and middle socio-economic status. . Educational and Psychological Measurement, 1963 , 23, 807-814.