Embed Size (px)
Citation preview
Old Dominion UniversityODU Digital Commons
Psychology Theses & Dissertations Psychology
Summer 2003
The Relationship of MMPI-A Item Effectiveness toItem Content, Diagnostic Category, andClassification AccuracyKathleen D. LynchOld Dominion University
Follow this and additional works at: https://digitalcommons.odu.edu/psychology_etds
Part of the Clinical Psychology Commons, and the Quantitative Psychology Commons
This Dissertation is brought to you for free and open access by the Psychology at ODU Digital Commons. It has been accepted for inclusion inPsychology Theses & Dissertations by an authorized administrator of ODU Digital Commons. For more information, please [email protected].
Recommended CitationLynch, Kathleen D.. "The Relationship of MMPI-A Item Effectiveness to Item Content, Diagnostic Category, and ClassificationAccuracy" (2003). Doctor of Psychology (PsyD), dissertation, Psychology, Old Dominion University, DOI: 10.25777/mwp3-hw58https://digitalcommons.odu.edu/psychology_etds/205

THE RELATIONSHIP OF MMPI-A ITEM EFFECTIVENESS TO ITEM
CONTENT, DIAGNOSTIC CATEGORY, AND CLASSIFICATION ACCURACY
by
Kathleen D. Lynch Virginia Consortium Program in Clinical Psychology
A Dissertation Submitted to the Faculties o f
The College of William and Mary Eastern Virginia Medical School
Norfolk State University Old Dominion University
In Partial Fulfillment o f the Requirement for the Degree of
DOCTOR OF PSYCHOLOGY
CLINICAL PSYCHOLOGY
VIRGINIA CONSORTIUM PROGRAM IN CLINICAL PSYCHOLOGYAugust, 2003
Approved by:
Robert P. Archer/Ph.D. (Director) Eastern Virginia Medical School
Richard W. Handel, Ph.D. (Member) Eastern Virginia Medical School
Michelle Kelley, Ph.D. (Membpf) Old Dominion University
A .D . Ball, Ph.6. (Member) Eastern Virginia Medical School
Neill Watson, Ph.D. (Member) College o f William and Mary
Reproduced with permission of the copyright owner. Further reproduction prohibited without permission.
ABSTRACT
THE RELATIONSHIP OF MMPI-A ITEM EFFECTIVENESS TO ITEM CONTENT, DIAGNOSTIC CATEGORY, AND CLASSIFICATION ACCURACY
Kathleen D. Lynch Old Dominion University, 2000
Director: Robert P. Archer, Ph.D.
Archer, Handel, and Lynch (2001) recently compared the item endorsement
! frequencies for the MMPI-A normative sample against two adolescent clinical samples.
Results showed that the MMPI-A contains a substantial number o f items that do not show|
I a significant difference in item endorsement frequency between normative and clinicalII samples. The current study extends Archer et al.’s (2001) research in three ways: 1) it|
examines the item endorsement frequencies o f the Supplementary scales, Harris Lingoes
subscales, and subtle-obvious items; 2) it examines the Basic, Content, and
Supplementary scales, and Harris Lingoes subscales with two homogeneous diagnostic
criterion groups (as suggested by Archer, Handel, and Lynch); and finally 3) it re
examines and recalculates Basic scale data using only those items that were shown byI| Archer, Handel, and Lynch (2001) to effectively discriminate between the normative and
clinical populations. The mean profiles of the normative and clinical groups were
contrasted based on these “revised” Basic scales using a newly acquired independent
clinical sample to evaluate the extent to which profile sensitivity and specificity is
affected by these scale modifications. Results demonstrated that examining the
Supplementary scales and Harris-Lingoes subscales, or subtle-obvious items, or when
extended to homogeneous criterion groups led to no improvement in item effectiveness
from the results o f Archer and his colleagues’ study. However, results supported the
Reproduced with permission of the copyright owner. Further reproduction prohibited without permission.
i hypothesis in that the overall effectiveness o f Basic scale discrimination increased, in
terms o f sensitivity, specificity, positive and negative predictive power, and hit rate, when
the Basic clinical scale items were removed that did not discriminate between normative
and clinical groups of adolescents.
t
i
i
i
i
Reproduced with permission of the copyright owner. Further reproduction prohibited without permission.
ACKNOWLEDGMENTS
I would like to thank Bob Archer for his endless source o f support, guidance and
sense o f humor. You are the ultimate mentor. I would also like to thank Rick Handel,
who went above and beyond his duties as a committee member. Your constant
involvement in this project was much appreciated. Thank you to my committee for their
time and help throughout this process. Thanks to David Elkins for saving a “damsel in
distress” more times than I can count. A million “thank you’s” to Denise Holloway for
everything!
To my parents, thank you for all o f your emotional and financial support, I
honestly could not have done this without you. To my family, thank you for your
patience and encouragement through this very long endeavor. Finally, thanks to my
friends, who are constant reminders that there is a world outside o f school and for helping
me live it; especially, Jenny, Nicole, Katie, Jen and Jessie.
Reproduced with permission of the copyright owner. Further reproduction prohibited without permission.
TABLE OF CONTENTS
Page
LIST OF TABLES................................................................................................ ix
Chapter
I. INTRODUCTION....................................................................................................1Adolescent Development.............................................................................3Prevalence Data............................................................................................5Overview of the MMPI................................................................................ 8History of the MMPI with Adolescents...................................................... 9Development o f the MMPI-A....................................................................12Administration and Scoring of the MMPI-A.................... 15Interpretation o f the MMPI-A....................................................................17Reliability and Validity..............................................................................28The Problem o f Low T-scores................................................................... 29
II. METHOD ..................................’.................................................................36Participants................................................................................................. 36Design and Procedure................................................................................38Data Analysis..............................................................................................40
III. RESULTS............................................................................................................ 42
IV. DISCUSSION..................................................................................................... 79
REFERENCES................................................................................ 95
VITA..................................................................................................................................... 105
Reproduced with permission of the copyright owner. Further reproduction prohibited without permission.
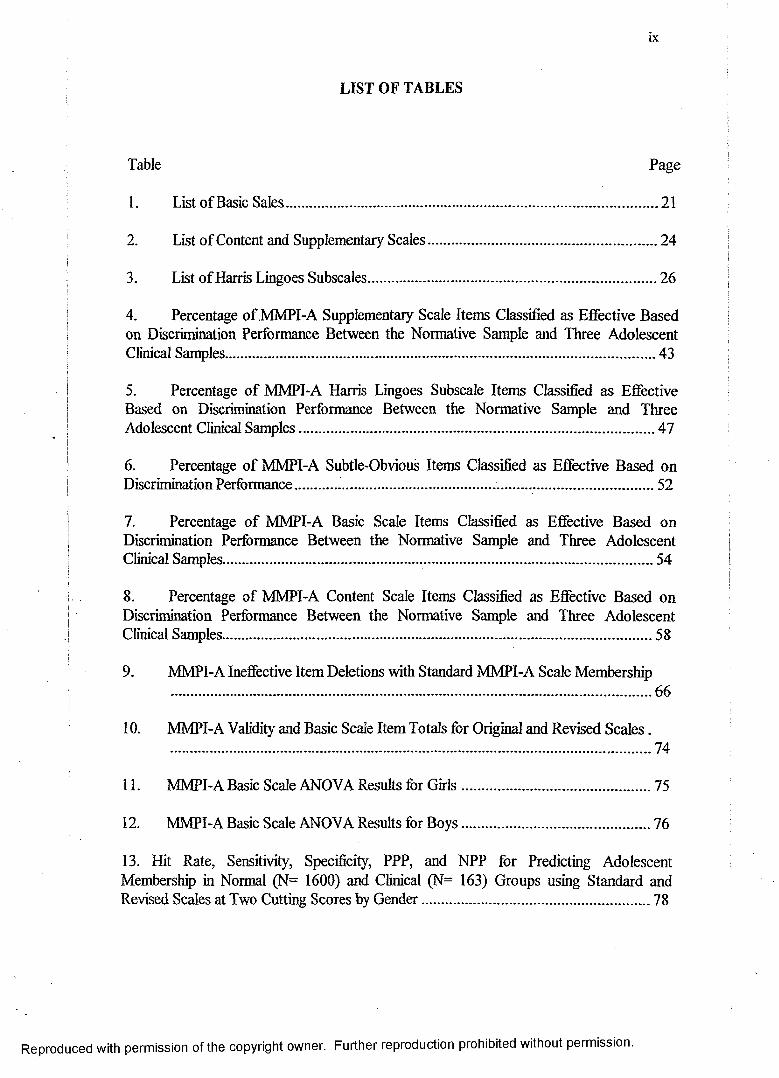
LIST OF TABLES
Table Page
1. List of Basic Sales........................................................................................................ 21
2. List o f Content and Supplementary Scales................................................................. 24
3. List o f Harris Lingoes Subscales..................................................................................26
4. Percentage o f MMPI-A Supplementary Scale Items Classified as Effective Basedon Discrimination Performance Between the Normative Sample and Three Adolescent Clinical Samples...................................................................................................................... 43
5. Percentage o f MMPI-A Harris Lingoes Subscale Items Classified as EffectiveBased on Discrimination Performance Between the Normative Sample and Three Adolescent Clinical Samples..................................................................................................47
6. Percentage o f MMPI-A Subtle-Obvious Items Classified as Effective Based onDiscrimination Performance .......................................... 52
7. Percentage o f MMPI-A Basic Scale Items Classified as Effective Based onDiscrimination Performance Between the Normative Sample and Three Adolescent Clinical Samples...................................................................................................................... 54
8. Percentage o f MMPI-A Content Scale Items Classified as Effective Based onDiscrimination Performance Between the Normative Sample and Three Adolescent Clinical Samples......................................................................................................................58
9. MMPI-A Ineffective Item Deletions with Standard MMPI-A Scale Membership 66
10. MMPI-A Validity' and Basic Scale Item Totals for Original and Revised Scales. .................................................................................................................................... 74
11..................MMPI-A Basic Scale ANOVA Results for Girls.......................................... 75
12. MMPI-A Basic Scale ANOVA Results for Boys.......................................... 76
13. Hit Rate, Sensitivity, Specificity, PPP, and NPP for Predicting AdolescentMembership in Normal (N= 1600) and Clinical (N= 163) Groups using Standard andRevised Scales at Two Cutting Scores by Gender...............................................................78
Reproduced with permission of the copyright owner. Further reproduction prohibited without permission.
CHAPTER I
INTRODUCTION
The ability to assess psychological functioning is crucial to identifying
adolescents with significant psychopathology, developing treatment plans, and evaluating
treatment outcomes. A recent survey o f practitioners has shown that the Minnesota
Multiphasic Personality Inventory-Adolescent (MMPI-A) is currently the most widely
used objective personality assessment instrument with adolescents (Archer & Newsom,
2000). The adolescent form o f the original MMPI was developed after several researchers
(e.g., Archer, 1992, 1987; Klinge, Lachar, Grisell, & Berman, 1978) documented that the
original MMPI was producing extremely elevated profiles when administered to
adolescents. While the development o f the MMPI-A reduced or eliminated several
problems associated with administering the original form o f the MMPI to adolescents, the
MMPI-A now has been found to produce a high frequency of Within Normal Limits
Basic scale profiles for adolescents in clinical settings. Archer, Handel, and Lynch (2001)
suggested that these within normal limit profiles may be produced, at least in part,
because many MMPI-A items are not effective at discriminating between normative and
clinical populations. These authors recently compared the item endorsement frequencies
for the MMPI-A normative sample against two adolescent clinical samples. These
adolescent sample results were also contrasted with item endorsement frequencies
The Publication Manual o f the American Psychological Association (5th edition) was the
model used for this manuscript.
Reproduced with permission of the copyright owner. Further reproduction prohibited without permission.
2
obtained for the MMPI-2 normative samples and from a clinical adult psychiatric
inpatient sample. Results showed that the MMPI-A contains a substantial number o f
items that do not show a significant difference in item endorsement frequency between
normative and clinical samples. Further, the frequency o f “ineffective” items was much
higher for the MMPI-A in contrast to similar comparisons conducted with the MMPI-2.
It is unclear why there is a high frequency of non-discriminating items between
the normative and clinical sample. One possibility is that the high frequency of non
discriminating items is due not to the characteristics of any particular clinical sample, but
the high frequency o f endorsement o f MMPI-A items found for the normative sample.
This latter hypothesis was supported in Archer et al.’s (2001) results that normal
adolescents endorse many items with a higher frequency than do normal adults.
The current study extends the work of Archer, Handel, and Lynch (2001) by
examining item-endorsement frequencies for the Harris-Lingoes subscales, Subtle-
Obvious items, and homogeneous diagnostic criterion groups. These comparisons helped
to further clarify the specific characteristics and content o f items that do, and do not,
discriminate in terms o f the item endorsement frequencies found for normative and
clinical samples o f adolescents. Further, the effects o f the deletion of non-discriminating
items on classification accuracy o f the MMPI-A Basic scales in discriminating clinical
and normative samples was evaluated.
In order to evaluate adolescent response patterns on an objective personality
assessment measure, it is important to first examine historical views on adolescence and
how development effects psychological functioning. It is also necessary to understand the
frequency with which adolescent psychopathology occurs, and how such pathology
Reproduced with permission of the copyright owner. Further reproduction prohibited without permission.
3
deviates from normal development, in order to underscore the importance o f accurate
assessment, diagnosis, and treatment. In the following sections, adolescent development,
adolescent psychopathology and an overview o f the most widely used adolescent
personality assessment instrument to date are examined.
Adolescent Development
Historically, normal adolescence has been viewed as a time o f emotional
instability, rapid shifts in mood, and conflictual relationships with authority figures
(Erikson, 1956; Freud, 1958; Hall, 1916). G. Stanley Hall (1916), Anna Freud (1958) and
others supported a “storm and stress” model o f adolescence that suggested adolescents
were likely to appear mildly, mentally ill due to the stress associated with attempting to
manage physical, social, and psychological changes. Hall characterized adolescence as a
time in which the young person is oscillating between contradictory tendencies. A typical
adolescent, according to Hall, was emotionally labile, vacillating between euphoria and
depression.
Anna Freud (1958) also shared the notion that adolescence was filled with
emotional lability and periods o f psychiatric illness. Freud believed that adolescents who
did not display adjustment difficulties during this period were at risk to develop
psychopathology later in life. Freud stated “adolescence is by its nature an interruption of
peaceful growth, and... the upholding o f a steady equilibrium during the adolescent
process is in itself abnormal” (p. 275).
Erikson (1956) perceived adolescence as the time in which the individual moved
toward identity formation. He posed the question, “how can a stage as ‘abnormal’ as
adolescence be trusted to accomplish it [identity formation]?” (p.72). Erikson also
Reproduced with permission of the copyright owner. Further reproduction prohibited without permission.
4
suggested that this period is a normal state o f increased conflict in which neurosis and
psychosis commonly occur. However, he noted that the neurosis and psychosis that ensue
during adolescence are productive for the individual, unlike the neurosis and psychosis o f
mental illness that are seen later in life.
Although many have endorsed this psychopathological view o f adolescence,
others have suggested that adolescence is filled with peaceful and productive times. In a
study o f middle-class teenage boys, Bandura (1964) found that the adolescents in his
sample were not typically in conflict with their parents over peer relations or household
rules and that they typically had positive interactions with their parents. Bandura
suggested that emotional lability and oppositional behaviors were an extension o f pre
adolescent and childhood problems that were more easily managed in childhood.
Additionally, Offer and Offer (1975) found transient episodes o f mild depression and
anxiety to be fairly common in their sample o f adolescents; however, moderate to severe
levels o f psychopathology were reported in about 20% o f their subjects. As will be
discussed later, this percentage is consistent with findings from contemporary studies on
the prevalence o f adolescent psychopathology.
Ferdinand and Verhulst (1995) examined the stability o f behavioral and emotional
problems from adolescence to young adulthood and found psychological maladjustment
to be a stable, rather than a transient phenomenon for adolescents in their sample. The
authors evaluated 459 adolescents using the Child Behavior Checklist (CBC) completed
by parents and eight years later with a young adult self-report (YAS). They found that
those participants who exhibited significant levels o f distress during adolescence
(approximately 27% o f their sample), also had scores in the deviant range as indicated by
Reproduced with permission of the copyright owner. Further reproduction prohibited without permission.
the YAS at the eight-year follow up. Ferdinand and Verhulst concluded “the absence of
psychopathology in adolescence, rather than the presence of behavioral or emotional
problems or adolescent turmoil, should be regarded as normative” (p. 1593).
Weiner and Del Gaudio (1976) offered three conclusions regarding adolescent
psychopathology: (1) a significant level o f psychological distress is not a normative
feature o f adolescence; (2) boundary lines between normal and abnormal levels o f
psychological distress during adolescence should be drawn with careful evaluation; (3)
clinically significant psychopathology in an adolescent is unlikely to remit without
intervention and will most likely continue into adulthood. Although it is important to
understand that psychopathology is not a normal part o f adolescence, it is still a
significant problem in today’s society. The next section will attempt to explore just how
prevalent psychopathology has become in children and adolescents.
Prevalence Data
Prevalence studies conducted in the past decade have suggested that the number
o f children and adolescents suffering from mental disorders ranges between 14 and 22
percent (Bradenburg, Friedman, & Silver, 1990; Gould, Wunsch-Hitzig, & Dohrenwend,
1981; McGee, Feehan, Williams, Partirdge, Silva, & Kelly, 1990; NIMH, 1990; Rutter,
Graham, Chadwick, & Yule, 1976). Although large methodological discrepancies exist
between studies, to date, no investigations suggest that less than one in ten children or
adolescents could be diagnosed with a mental disorder.
Gould, Wunsch-Hitzig, and Dohrenwend (1981) reviewed 25 studies conducted in
the United States between 1928 and 1975 that examined the prevalence o f clinical
maladjustment in children and adolescents. They suggested that the rate for child and
Reproduced with permission of the copyright owner. Further reproduction prohibited without permission.
adolescent psychiatric disturbance was probably not lower than 11.8%, which is
considered a very conservative estimate. The authors stated that many of the studies they
reviewed had serious methodological problems. These problems included single
informant methodologies. The authors concluded that interviewing the adolescent directly
could provide a more accurate estimate o f adolescent psychopathology.
More recent studies have utilized more refined approaches to study the prevalence
of adolescent psychopathology. Brandenburg, Friedman, and Silver (1990) used a
multimethod, multistage model o f identification which collected information from a
variety o f sources and measures. This model allowed for the identification of different
levels o f psychiatric disturbances. Brandenburg and colleagues examined eight studies
which utilized this approach. The authors were then able to more accurately estimate the
prevalence rate o f child and adolescent psychopathology. They concluded that the
prevalence rate was between 14% and 20%.
McGee and colleagues (1990) evaluated 943 fifteen-year-old adolescents using
interviews and parental report measures. The authors found that 207 adolescents (22% of
the sample) had at least one psychological disorder. The most prevalent problem was
overanxious disorder, followed by non-aggressive conduct disorder, and simple phobia.
Females had higher prevalence rates for all disorders with the exception of social phobia,
attention deficit disorder, and aggressive conduct disorder.
In their study of 1710 high school students, Lewinsohn, Hops, Roberts, Seeley,
and Andrews (1993) found that almost 10% of the adolescents met the criteria for a
DSM-III-R disorder, and that more than 33% had experienced a psychological disorder at
some point in their lifetime. Lewinsohn and colleagues used the Schedule for Affective
Reproduced with permission of the copyright owner. Further reproduction prohibited without permission.
7
Disorders and Schizophrenia for School-Age Children to obtain these prevalence rates.
Major depression had the highest lifetime prevalence rate. This was followed by anxiety
disorders. As in the McGee and colleagues (1990) study, female respondents at all age
levels had higher incidence rates for several disorders including unipolar depression,
anxiety, eating disorders, and adjustment disorders. Male subjects had higher incidence
rates o f disruptive behavior disorder.
McDermott (1996) conducted a nationwide study of youths 5 to 17 years o f age.
The sample comprised the national normative sample of the Adjustment Scales for
Children and Adolescents (ASCA). A subsample of 1400 subjects were randomly
selected and then stratified to conform to U.S. Census proportions for a variety of
demographic variables. McDermott examined age and gender prevalence for six core
syndromes. A demarcation point o f T > 60 was chosen to represent significant pathology
on the ASCA, which reflected a 15% prevalence rate for the sample. Results indicated
that for the hyperactive, aggressive-provocative, and aggressive-impulse syndromes,
prevalence was significantly elevated among the youngest children, where as the avoidant
syndrome showed a higher incidence among the adolescent age group. For all but one
syndrome, the percentage of boys exhibiting the syndrome was higher for boys than for
girls.
More recently, Kessler, Avenevoli, and Merikangas (2001) reviewed the
epidemiological literature on child and adolescent mood disorders. Their review suggests
that major depression is common among adolescents, with up to a 25% lifetime
prevalence by the end of adolescence. Kessler and colleagues state that retrospective data
suggests 50% of adolescents experiencing depression and 90% of adolescents
Reproduced with permission of the copyright owner. Further reproduction prohibited without permission.
8
experiencing mania will have reoccurrences in adulthood. The authors state that these
reoccurrences are likely mediated by adverse role transitions (e.g., truncated educational
achievement and teenage childbearing) that typically occur before the time o f initial
treatment.
Hyman (2001) reviewed evolving NIMH priorities for research on pediatric mood
disorders. Ultimately, over the next decade, NIMH will be striving to understand the
etiology o f disorders such as depression and ADHD but also attempting to develop cures
for these disorders, and most importantly, to prevent new onset o f these disorders. Until a
cure or preventative measures are developed, effective use o f diagnostic assessment
measures not only aids in designing treatment interventions for adolescents, but also
serves to identify those adolescents at increased risk for several forms o f psychiatric
disorders during childhood. The next section attempts to explore the development o f the
MMPI-A, one o f the most widely used diagnostic assessment tools for adolescents.
Overview o f the MMPI
In the 1930’s and 40’s Stark Hathaway and J.C. McKinley were searching for a
more efficient and reliable way to arrive at appropriate psychodiagnostic labels. They
collected a large pool o f potential inventory items from textbooks and earlier published
scales. Then, appropriate diagnostic criterion groups were selected for patient
populations. The Minnesota “normals” consisted o f visitors and patients to the University
o f Minnesota Hospital. The clinical group was comprised o f psychiatric patients at the
University of Minnesota Hospital. Clinical participants were divided into subgroups
determined by their clinical diagnosis. Only those with a clear diagnosis were included.
The different subgroups formed were hypochondriasis, depression, hysteria, psychopathic
Reproduced with permission of the copyright owner. Further reproduction prohibited without permission.
9
deviate, paranoia, psychasthenia, schizophrenia, and hypo mania. The potential items
were then administered to the Minnesota “normals” and the clinical groups. An item
analysis was conducted for each o f the clinical groups to identify which items
differentiated between the clinical group and a group o f “normal” persons. Those 504
items that were identified as discriminating between groups were retained. Using this
criterion keying method, Hathaway and McKinley (1943) developed the original form o f
the MMPI. This form originally contained eight basic clinical scales that measured the
presence o f a variety o f psychological disorders and traits and included hypochondriasis
(scale 1), depression (scale 2), hysteria (scale 3), psychopathic deviant (scale 4), paranoia
(scale 6), anxiety (scale 7), schizophrenia (scale 8), and mania (scale 9). Two more
scales, the Masculinity-Femininity scale (scale 5) and the Social Introversion-
Extroversion scale (scale 0) were added later and used to identify personal preferences
and personality traits, rather than psychological disturbance. The MMPI also includes
four validity scales which aid in the detection o f invalid protocols due to aberrant or
deceptive responding to test items. These include the Cannot Say scale (scale ?), which is
the number o f items the responder did not answer; the L or lie scale, which may be
elevated when a responder consciously or unconsciously attempts to present oneself in a
favorable manner; the F scale, which contains infrequently endorsed items; and the K
scale, which measures the responders level of psychological defensiveness. Other scales
such as the Supplementary, Content, and Harris-Lingoes (1955) scales and subscales
have also been developed to allow7 for refinement o f interpretation and research purposes.
History o f the MMPI with Adolescents
While the original instrument was intended for use with individuals 16 years and
Reproduced with permission of the copyright owner. Further reproduction prohibited without permission.
10
older, Dahlstrom, Welsh, and Dahlstrom (1972) stated that the MMPI could be used with
“bright children as young as 12” (p.21). In fact, use o f the MMPI with adolescents
appears to have been more widespread than originally intended by Hathaway and
McKinley. Both Capwell (1945a) and Monachesi (1948, 1950) found that the MMPI
accurately discriminates between delinquent and non-delinquent adolescents based on the
elevations o f the Pd scale and that these differences were maintained over time (Capwell,
1945b).
Although the MMPI was used with adolescents, the first systematic effort aimed
at collecting a large amount of data on adolescents using the MMPI was known as the
“statewide sample” and was undertaken by Hathaway and Monachesi (1953, 1961, 1963).
The statewide sample included approximately 15,000 Minnesota adolescents tested
between 1948 and 1954. Participants also completed intelligence measures and a
vocational interest inventory. Additionally, participants’ teachers were asked to report on
which students they thought were likely to have psychiatric or legal problems. A
subsample was re-tested three years later in an effort to identify and predict
longitudinally the personality variables related to the onset o f delinquency. Monachesi
and Hathaway (1969) stated that higher scores on the Pd, Sc, and Ma scales were
predictive o f higher rates o f delinquent behavior in their sample o f adolescents. Archer
(1992, 1997) concluded that the Hathaway and Monachesi findings were important in
several ways. Most importantly, the studies demonstrated that the MMPI could predict
delinquent behavior. Additionally, the studies provided information regarding differences
in item endorsements between males versus females, adults versus adolescents, and
longitudinal test-retest differences in item endorsement for individuals in middle versus
Reproduced with permission of the copyright owner. Further reproduction prohibited without permission.
11
late adolescence. Hathaway and Monachesi also provided clinical correlate data for their
sample of adolescents for both high and low scores for each of the ten standard clinical
scales. These early efforts provided the data for the development of two sets of
adolescent norms for the MMPI.
Marks and Briggs (1972), Gottesman, Hanson, Kroeker, and Briggs (1987), and
Colligan and Oflford (1989) all developed adolescent norms for use with the original form
o f the MMPI. However the Marks and Briggs and the Gottesman norms included the
Hathaway and Monachesi data set which was extremely dated and did not represent
contemporary adolescent response patterns (Archer & Krishnamurthy, 1996).
Additionally, Archer (1987) found that the use o f these norms produced an inflated
number o f false-negative MMPI profiles for adolescents evaluated in clinical settings, a
problem that continues to be seen today, even with the revision of the instrument.
Although Colligan and Oflford used a more contemporary sample o f adolescents tested in
the 1980’s, their norms were criticized due to the geographically and ethnically restricted
sample from which the norms were developed (Archer & Krishnamurthy, 1996).
Several studies have examined the differences that exist on an adolescents’ profile
when scored on each of the three adolescent normative sets developed for the MMPI.
Some studies (Archer, Pancoast, & Klinefelter, 1989; Klinefelter, Pancoast, Archer, &
Pruitt, 1990) indicate that when an adolescent’s MMPI is scored on all three normative
sets, large differences are observed in the profiles. The lowest T-scores are produced by
the Colligan and Ofiford (1989) norms. In addition, major differences occur when
attempting to derive code-types from the three scoring systems. Archer (1987) suggests
that clinicians use caution in applying codetype descriptors developed on one set of
Reproduced with permission of the copyright owner. Further reproduction prohibited without permission.
adolescent norms to an MMPI profile scored on a different set o f adolescent norms.
Research also has indicated that when an adolescent’s MMPI profile is scored on
both adult and adolescent norms, the profile is more elevated overall when the adult
norms are used (Archer, 1984; Ehrenworth & Archer, 1985; Klinge, Lachar, Grissell, &
Berman, 1978; Klinge & Strauss, 1976; Lachar, Klinge, & Grissell, 1976; Marks,
Seeman, & Haller, 1974). These Basic scale profiles have been particularly elevated on
scales F, 4, and 8. It appears that both normative and clinical samples o f adolescents
more frequently endorse items that indicate the presence o f psychopathology than do
their adult counterparts. This results in profiles that overemphasize pathological features
(Archer, 1984).
In addition to the aforementioned problems in using the MMPI with adolescents,
several more obvious problems exist. Archer, Maruish, Imhof, and Piotrowski (1991)
found that the length of the test, the relatively high reading level o f test items, and the
outdated and sometimes inappropriate language used in the test items were the most
commonly cited problems clinicians mentioned related to the use o f the MMPI with an
adolescent population. Additionally, the content o f many items was thought to
inappropriate for adolescents and did not address some o f the specific issues adolescents
face, such as drug use, school related problems, and eating disorders (Butcher et al.,
1992). Due to the many problems in using the MMPI with an adolescent population, the
University o f Minnesota appointed a project committee to assess the need for an
adolescent form of the MMPI.
Development o f the MMPI-A
In 1989, the MMPI Adolescent Project Committee convened to develop an
Reproduced with permission of the copyright owner. Further reproduction prohibited without permission.
13
adolescent form of the MMPI. The committee established goals to develop contemporary
norms based on a national representative sample, shorten the length o f the instrument,
retain the standard validity and clinical scales to ensure continuity with the original test
instrument, modify and improve existing scales, and standardize and refine assessment
practices with adolescents (Butcher et al., 1992).
Form TXi:
; An experimental test booklet (labeled MMPI Form TX) was created for the
development o f the MMPI-A (Butcher et al., 1992). This form consisted o f the 550
| original MMPI items and 154 new items. Approximately 13 percent o f the original
| MMPI items were reworded or modified to eliminate awkward wording and outdated|
expressions or sexist language. Also, the 16 repeated items from the MMPI were
| dropped. Modifications that occurred in the MMPI-A did not result in significant changesi|| in response patterns for these items (Archer & Gordon, 1994). Form TX was used in bothi
! adolescent normative and clinical data collection along with a biographical information
I form and a Life Events form. These were administered in order to obtain data on familyji
! structure, parental occupation, residence, and family history. The Life Events form was
! developed to assess stressful events that had occurred in the six months prior to thei
testing situation.
Sample
The normative sample o f the MMPI-A included junior high and high school
students from California, Minnesota, New York, North Carolina, Ohio, Pennsylvania,
Virginia, and Washington (Butcher, et al., 1992). These eight states were chosen to obtain
a wide range of diversity in geographical location, ethnic background, and rural-urban
Reproduced with permission of the copyright owner. Further reproduction prohibited without permission.
14
residence. Students were each paid ten dollars for their participation (with the exception
of those students from New York) and data collection was conducted in the schools (with
groups o f 5 to 100 students). Two criteria were developed in order to ensure that only
complete and valid data were included in the normative sample. First, only participants
who completed all three measures were included in the sample. Second, if the participant
left more than 35 items blank, or they had an F scale raw score greater than 25, the data
from that participant was not included in the sample. The final MMPI-A normative
sample was comprised o f 1620 participants (805 boys and 815 girls).
The clinical sample included a smaller and less ethnically diverse sample o f 420
boys and 293 girls from a variety o f treatment settings around the Minneapolis area. The
settings included were inpatient alcohol and drug treatment units, inpatient mental health
facilities, day-treatment programs, and a special school program. These subjects ranged
in age from 14 to 18 years, and were currently enrolled in school in grades 7 through 12.
These subjects completed all three measures, Form TX, the Biographical Information
form, and the Life Events form. Additionally, data on the clinical sample o f adolescents
were collected using the Child Behavior Checklist (Achenbach & Edelbrock, 1983), the
Devereux Adolescent Behavior Rating Scale (Spivack, Haimes, & Spotts, 1967), and a
review o f hospital records. These additional measures provided behavioral ratings from
parents and treatment staff that supplemented self-report data in the creation of scale
descriptors.
The current form of the MMPI-A has been in use for almost a decade. Today, the
MMPI-A is one o f the most widely used assessment instruments with adolescents (Archer
& Newsom, 2000). Due to the frequency with which the MMPI-A is administered, it is
Reproduced with permission of the copyright owner. Further reproduction prohibited without permission.
15
important that the test be re-examined to ensure that the test is providing an accurate
diagnostic picture for clinicians.
Administration and Scoring o f the MMPI-A
Qualifications o f Test Users
As with any testing instrument, it is important that the individual administering
the test should have sufficient background in test theory and test construction, as well as
an understanding o f the instrument itself. Although the MMPI-A manual states that the
MMPI-A may be administered by carefully trained support staff under close supervision,
the responsibility o f an appropriate administration ultimately lies with the clinician.
Archer (1992) recommends that at a minimum the test user should have completed
graduate-level coursework in psychological testing, adolescent development, personality,
psychopathology, and psychodiagnosis.
Age Criteria
Although the MMPI-A was essentially created for use with individuals’ ages 14 to
18 years, it may be selectively administered to 12- and 13- year-old adolescents who have
the cognitive and social maturity that would enable them to read and understand the items
(Archer, 1992). Adolescents who are 18 years o f age are eligible to take either the
MMPI-2 or the MMPI-A. Eighteen-year-old high school students who are still living at
home and are still dependent on parents should be administered the MMPI-A. An 18-
year-old individual who is living independently (e.g., married or holds a full-time job)
should be administered the MMPI-2.
Reading Requirements
It is essential that the test-taker have an adequate level of reading comprehension
Reproduced with permission of the copyright owner. Further reproduction prohibited without permission.
16
in order to take the MMPI-A. The majority o f the items were determined by Butcher and
colleagues (1992) to be at the fifth- to seventh-grade reading level. Audiotaped versions
o f the MMPI-A are available for adolescents who have literacy problems. Adolescents
with limited intelligence, reading disorders, or speak English as a second language are
examples o f individuals who may have difficulties taking the MMPI-A.
Testing Environment
The test-taker should have adequate privacy and supervision during the testing
session. Examiners may respond to questions about the meaning o f words using a
dictionary definition or clarifying idioms. It is important for the test-taker to have a quiet
environment free from distractions with comfortable seating and adequate lighting.
Additionally, breaks from testing are permitted for adolescents who become fatigued
during testing (Butcher et al., 1992).
Materials
The MMPI-A is available in a booklet, audiocassette, and computer version. In
the booklet format, items are presented in either a hard or soft cover, reusable, 478-item
test booklet and a separate answer sheet. Subjects fill in the circle marked “T” if the item
is true or mostly true and “F” if the item is false or mostly false. The audiocassette
version can be used in either the individual or group setting (Butcher et al., 1992). The
audiocassette version may be useful for the visually impaired, as well as for those
adolescents with significant reading difficulties. Individuals can also take the MMPI-A
on a computer using software provided through National Computer Systems (NCS).
Scoring
Answer sheets should be carefully examined upon completion for items left
Reproduced with permission of the copyright owner. Further reproduction prohibited without permission.
17
unanswered and items endorsed in both the true and false direction (Archer, 1992). If
there are a substantial number o f items left blank, the individual may be asked to
complete as many o f those items as possible. Raw scores for all validity, clinical, and
Supplementary scales are obtained through the use o f scoring templates or a computer-
scoring program. Butcher et al. (1992) note that raw score values are then converted to
either linear T-scores (scales VR1N, TRIN, FI, F2, F, L, K, 5, 0, MAC-R, ACK, PRO,
IMM, R, and A) or uniform T-scores (scales I, 2, 3, 4, 6, 7, 8, 9, and all 15 Content
scales).
Interpretation o f the MMPI-A
Assessment o f the Validity o f Individual Protocols
The MMPI-A contains scales that provide information regarding the test-takers
tendency to answer the items in an accurate and consistent manner: Cannot Say (?), L
(Lie), F (Frequency), K (Defensiveness), VRIN (Variable Response Inconsistency), and
TRIN (True Response Inconsistency).
Cannot say (?). The Cannot Say (?) scale consists o f the total number o f items
that have been omitted or that have been answered in both the true and false direction. A
profile is considered invalid with more than 30 items omitted, and therefore
uninterpretable. Archer (1997) suggests that adolescents who omit more than 30 items be
asked to complete the remaining items or to retake the entire test if their reading level is
consistent with this task.
The L (Lie) scale. The MMPI-A L scale consists o f 14-items designed to detect
naive attempts o f individuals to portray themselves in a favorable or overly moralistic
light. Individuals endorsing items on this scale are denying minor flaws or weaknesses.
Reproduced with permission of the copyright owner. Further reproduction prohibited without permission.
MMPI-A profiles with elevated L scale scores (T > 65) suggest a conscious or
unconscious effort to appear moral, ethical, and without common foibles.
The F (Frequencyj scale and the FI and F2 subscales. The F scale consists of 66
items that were endorsed in the deviant direction by no more than 20% o f the MMPI-A
normative sample. Those individuals with high scores on this scale are endorsing a wide
variety o f strange and unusual experiences either due to the presence o f psychopathology,
a random response style, or a response style in which the individual is exaggerating
symptoms. The FI subscale consists o f the first 33 items that make up the F scale, and
the F2 scale consists o f the second 33 F scale items. The MMPI-A manual (Butcher et
al., 1992) suggests that comparison o f the T-score values for these two subscales can
provide information on the consistency of the individual’s responding throughout the test.
However, recent data by Archer, Handel, Lynch, and Elkins (2002) indicate that
comparison o f FI and F2 subscale 7-score values is o f limited effectiveness in detecting
random response patterns in the latter half of the test booklet.
The K (Defensiveness) scale. The K scale attempts to identify individuals who
display a significant degree of psychopathology, but produce profiles within normal
limits. This 30-item scale can be considered a measure of defensiveness against
psychopathology. In the MMPI-2, there is a /^-correction procedure which was not
carried over to the MMPI-A because K-weights developed for the MMPI-A were not
effective at improving classification accuracy for adolescent subgroups when compared
to the standard aon-K corrected norms (Alperin, Archer, & Coates, 1996). MMPI-A
profiles with elevated 7-scores (> 65) may represent a defensive test-taking attitude in the
adolescent.
Reproduced with permission of the copyright owner. Further reproduction prohibited without permission.
19
The VR1N (Variable Response Inconsistency) and TRIN (Tme Response
Inconsistency) scales. These scales indicate the tendency of an individual to respond to
items in an inconsistent or contradictory manner. The VR1N scale is made up o f pairs o f
items that are either similar or opposite in content. For each pair o f items that is answered
inconsistently, the test-taker receives a point on the VRIN scale. The TRIN scale is made
up o f pairs that are opposite in content only. One point is added to the TRIN scale raw
score if the test-taker answers true to both items in a particular pair. One point is
subtracted from the TRIN scale raw score if the test-taker answers faise to both items in
the pair. Therefore, a very high raw score on this scale represents a tendency to answer
indiscriminately true to the items and a very low score indicates a tendency to answer
indiscriminately false to the items. The VRIN scale is helpful in identifying inconsistent
profiles that represent either acquiescent or nonacquiescent response patterns. Archer
(1992) suggests that profiles containing VRIN or TRIN T-scores > 80 should be
considered invalid.
If the profile is invalid, Greene (2000) suggests that the MMPI-A be
readministered if the clinician determines that the profile is unacceptable due to
inconsistency of responding. However, Greene suggests that the instrument not be
readministered if it is deemed invalid due to accuracy problems. When a profile is
deemed reliable, the clinician should proceed with interpretation o f the clinical scales.
The Basic Clinical Scales
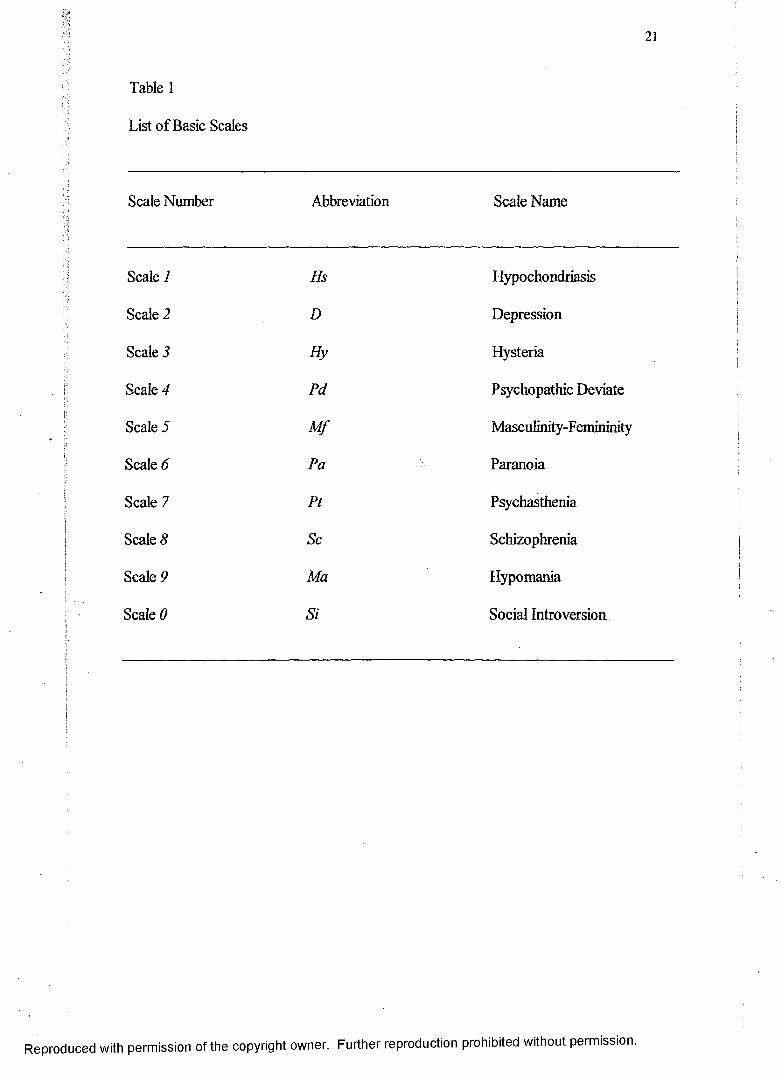
The MMPI contains 10 Basic clinical scales, as well as Content, Supplementary,
and a variety of other special scales that may provide interpretive information in regard to
the MMPI-A respondent (see Table 1). In most cases, interpretations are limited to
Reproduced with permission of the copyright owner. Further reproduction prohibited without permission.
20
clinical scales with T’-score elevations > 65 (Butcher et al., 1992). Scales with T-score
elevations between 60 and 64, that fell into what test developers call the “shaded” or gray
zone”, are considered moderately elevated, making interpretations more difficult. Butcher
and colleagues (1992) suggest examiners should exercise caution when interpreting
scales with T-scores in this range.
Code Type Interpretation
Using the highest pattern o f elevation on clinical scales, codetypes can be
developed to classify profiles. Although there is not yet any clinical codetype correlate
data available from studies using the MMPI-A beyond single scale correlates, Archer
(1992, 1997) provided codetype correlate descriptions for 29 code types based on studies
o f adolescent populations using the MMPI.
Reproduced with permission of the copyright owner. Further reproduction prohibited without permission.
21
Table 1
List o f Basic Scales
Scale Number Abbreviation Scale Name
Scale 1 Hs Hypochondriasis
Scale 2 D Depression
Scale 3 Hy Hysteria
Scale 4 Pd Psychopathic Deviate
Scale 5 M f Masculinity-Femininity
Scale 6 Pa Paranoia
Scale 7 Pt Psychasthenia
Scale 8 Sc Schizophrenia
Scale 9 Ma Hypomania
Scale 0 Si Social Introversion
Reproduced with permission of the copyright owner. Further reproduction prohibited without permission.
Content and Supplementary Scales
The Content scales were created by adapting those MMPI-2 Content scales that
were appropriate for adaptation to the MMPI-A. Next, items were added or deleted to
improve psychometric properties. Eleven o f the 15 Content MMPI-A scales overlap with
the MMPI-2 and four scales are unique to the MMPI-A (see Table 2): Alienation (A-aln),
Low Aspiration (A-las), School Problems (A-sch), and Conduct Problems (A-con).
Uniform T-score transformation procedures are used when converting MMPI-A Content
scale raw score totals to T-score values. The Content scales appear to have relatively high
internal reliability with alpha coefficient values ranging from .55 to .83 (Archer, 1997).
Additionally, Content scales can only be interpreted when all 478-items of the MMPI-A
are administered. Content scales can be considered helpful in supplementing the
information received from Basic scales but should not be used independently of the Basic
scales.
There are six Supplementary scales, three o f which were taken from the MMPI-2
(MacAndrew Alcoholism scale, MAC-R; Welsh's Anxiety and Repression scales, A, and
R, respectively) and three new scales (see Table 2). The Immaturity (IMM) scale, is a
scale measuring immaturity as it relates to interpersonal style, cognitive complexity, self-
awareness, and a variety o f other factors (Archer, Pancoast, & Gordon, 1994). Items for
this scale were chosen using a multistage procedure using both rational and statistical
criteria. The Alcohol-Drug Problem (ACK) scale was developed to assess an adolescent’s
willingness to acknowledge alcohol or drug use-related symptoms. The 13 items were
initially selected based on the rational judgement that item content was related to drug
use, and then later refined based on statistical criteria. The Alcohol-Drug Proneness
Reproduced with permission of the copyright owner. Further reproduction prohibited without permission.
(PRO) scale consists o f 36 items that were empirically selected based on item
endorsement differences found between adolescents in alcohol and drug treatment
programs and adolescents in inpatient psychiatric facilities (Archer, 1992; Weed,
Butcher, & Williams, 1994). In contrast to the Content scales, the raw scores for all
Supplementary scales are converted to T-score values based on linear T-score
transformation procedures. Consistent with the Content scales, all 478- items must be
administered and the results from the Supplementary scales should be used to supplement
and refine interpretations o f the MMPI-A Basic scales.
Reproduced with permission of the copyright owner. Further reproduction prohibited without permission.
24
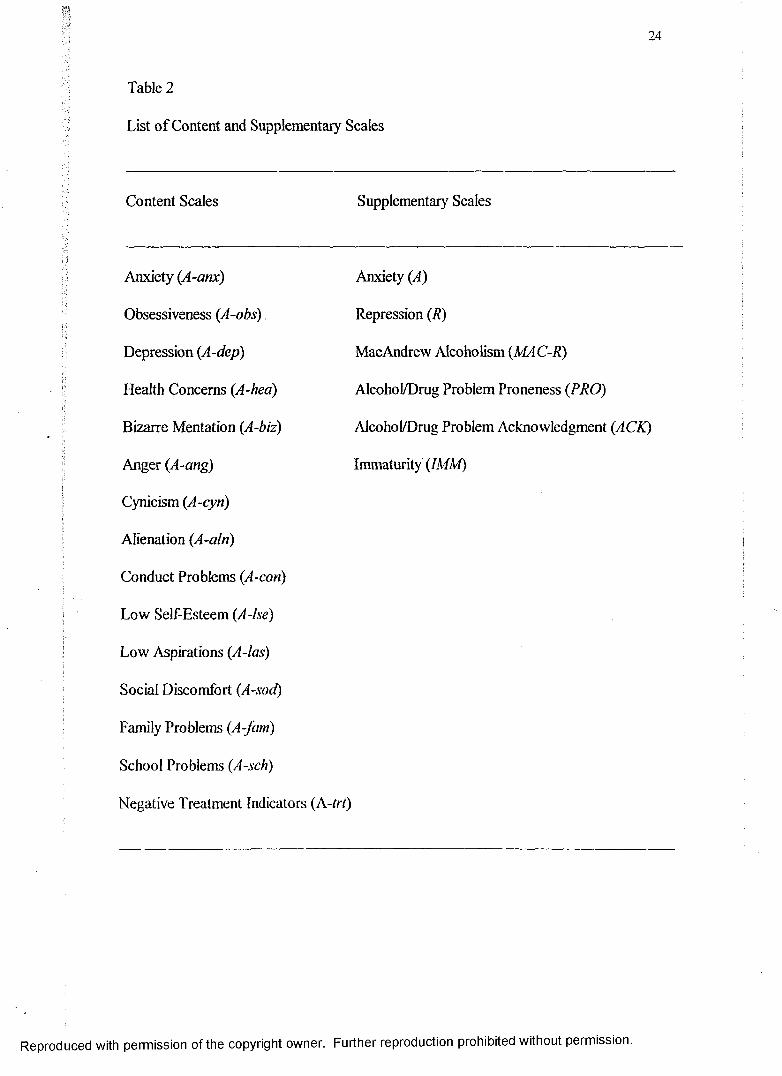
Table 2
List of Content and Supplementary Scales
Content Scales Supplementary Scales
Anxiety (A-anx) Anxiety (A)
Obsessiveness (A-obs) Repression (R)
Depression (A-dep) MacAndrew Alcoholism (MAC-R)
Health Concerns (A-hea) Alcohol/Drug Problem Proneness (PRO)
Bizarre Mentation {A-biz) Alcohol/Drug Problem Acknowledgment (ACK)
Anger (A-ang) Immaturity (IMM)
Cynicism (A-cyn)
Alienation (A-aln)
Conduct Problems (A-con)
Low Self-Esteem (A-lse)
Low Aspirations (A-las)
Social Discomfort (A-sod)
Family Problems (A-Jam)
School Problems (A-sch)
Negative Treatment Indicators (A-trt)
Reproduced with permission of the copyright owner. Further reproduction prohibited without permission.
25
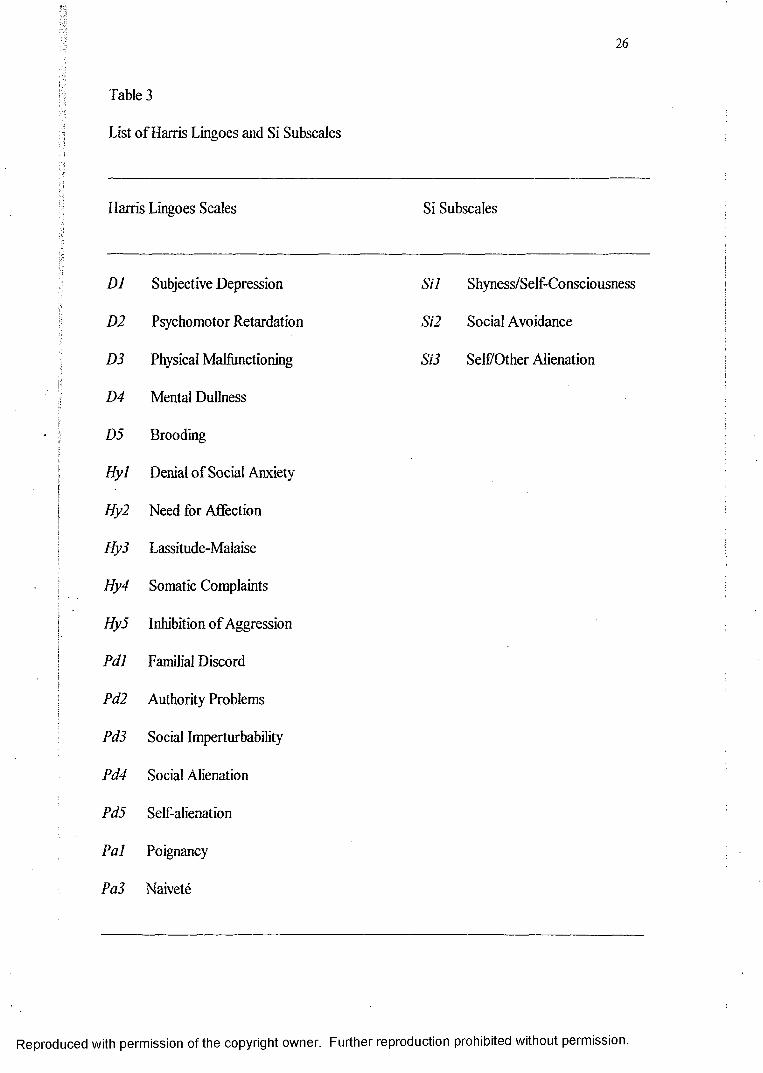
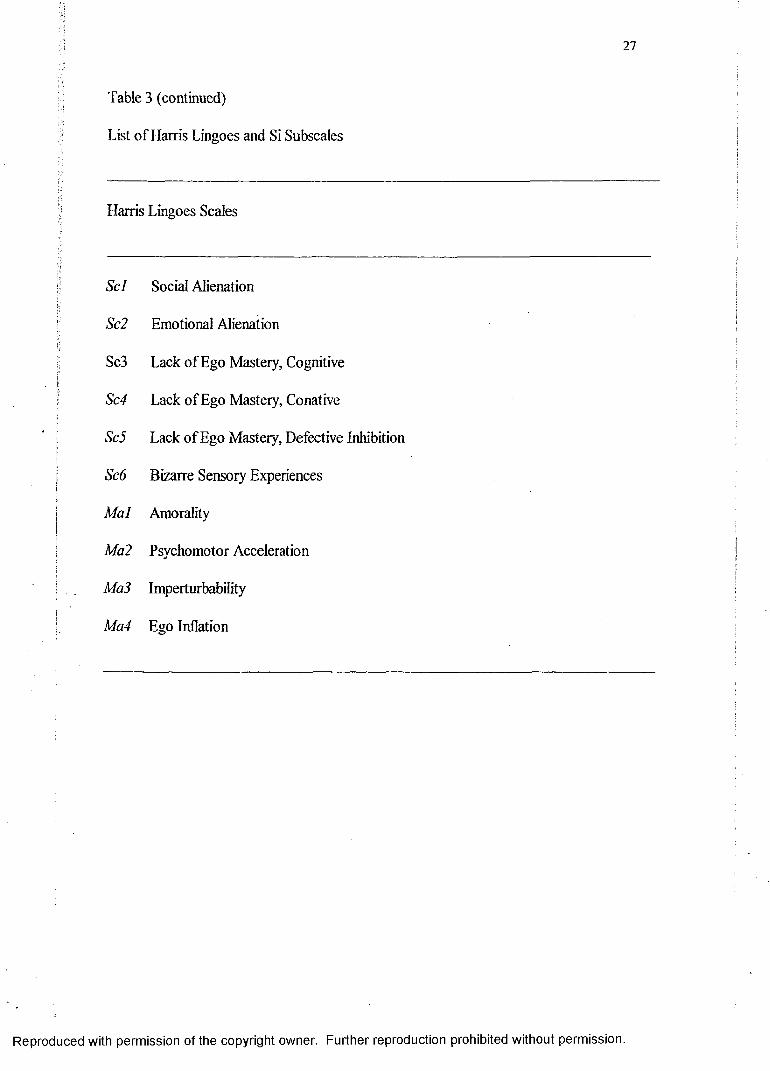
Harris Lingoes and Si Subscales
Six of the Basic clinical scales have subscales that allow for a more specific focus
in item content areas. Harris and Lingoes (1955) created subscales for these six MMPI
clinical scales (2,3,4,6,8,9) which were carried over to the MMPI-A (see Table 3). The
scales were developed by examining the content o f items within a clinical scale and
grouping items together which appeared to reflect a similar trait. Archer (1997) cautions
that the subscales should only be used to supplement or refine interpretation due to the
lack of validity data on these measures. Additionally, there are three Scale 0 subscales
created for the MMPI and carried over to the MMPI-A (Ben-Porath, Hostetler, Butcher,
& Graham, 1989) to help differentiate the nature o f social isolation.
Reproduced with permission of the copyright owner. Further reproduction prohibited without permission.
26
Table 3
List of Harris Lingoes and Si Subscales
Harris Lingoes Scales Si Subscales
D1 Subjective Depression Sil Shyness/Self-Consciousness
D2 Psychomotor Retardation Si2 Social Avoidance
D3 Physical Malfunctioning Si3 Self Other Alienation
D4 Mental Dullness
D5 Brooding
Hyl Denial of Social Anxiety
Hy2 Need for Affection
Hy3 Lassitude-Malaise
Hy4 Somatic Complaints
Hy5 Inhibition o f Aggression
PdJ Familial Discord
Pd2 Authority Problems
Pd3 Social Imperturbability
Pd4 Social Alienation
Pd5 Self-alienation
Pal Poignancy
Pa3 Naivete
Reproduced with permission of the copyright owner. Further reproduction prohibited without permission.
27
Table 3 (continued)
List of Harris Lingoes and Si Subscales
Harris Lingoes Scales
Scl Social Alienation
Sc2 Emotional Alienation
Sc3 Lack of Ego Mastery, Cognitive
Sc4 Lack of Ego Mastery, Conative
Sc5 Lack of Ego Mastery, Defective Inhibition
Sc6 Bizarre Sensory Experiences
Mai Amorality
Ma2 Psychomotor Acceleration
Ma3 Imperturbability
Ma4 Ego Inflation
Reproduced with permission of the copyright owner. Further reproduction prohibited without permission.
28
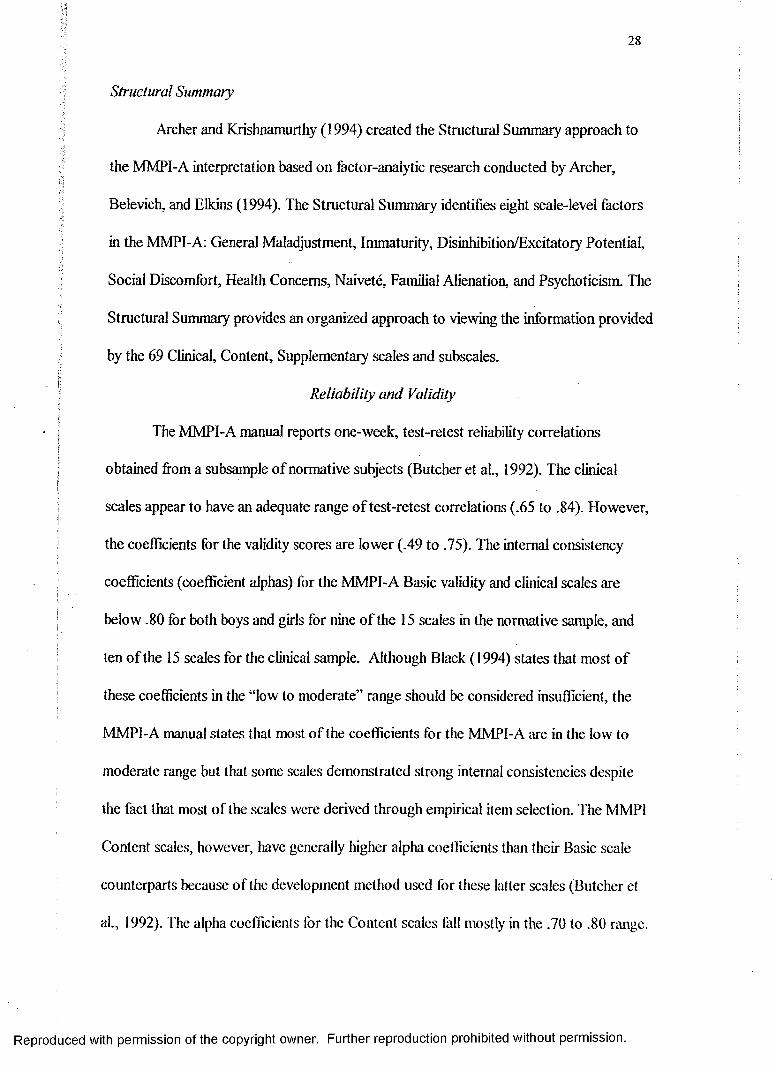
Structural Summary
Archer and Krishnamurthy (1994) created the Structural Summary approach to
the MMPI-A interpretation based on factor-analytic research conducted by Archer,
Belevich, and Elkins (1994). The Structural Summary identifies eight scale-level factors
in the MMPI-A: General Maladjustment, Immaturity, Disinhibition/Excitatory Potential,
Social Discomfort, Health Concerns, Naivete, Familial Alienation, and Psychoticism. The
Structural Summary provides an organized approach to viewing the information provided
by the 69 Clinical, Content, Supplementary scales and subscales.
Reliability and Validity
The MMPI-A manual reports one-week, test-retest reliability correlations
obtained from a subsample o f normative subjects (Butcher et al., 1992). The clinical
scales appear to have an adequate range o f test-retest correlations (.65 to .84). However,
the coefficients for the validity scores are lower (.49 to .75). The internal consistency
coefficients (coefficient alphas) for the MMPI-A Basic validity and clinical scales are
below .80 for both boys and girls for nine o f the 15 scales in the normative sample, and
ten o f the 15 scales for the clinical sample. Although Black (1994) states that most o f
these coefficients in the “low to moderate” range should be considered insufficient, the
MMPI-A manual states that most o f the coefficients for the MMPI-A are in the low to
moderate range but that some scales demonstrated strong internal consistencies despite
the fact that most of the scales were derived through empirical item selection. The MMPI
Content scales, however, have generally higher alpha coefficients than their Basic scale
counterparts because o f the development method used for these latter scales (Butcher et
al., 1992). The alpha coefficients for the Content scales fall mostly in the .70 to .80 range.
Reproduced with permission of the copyright owner. Further reproduction prohibited without permission.
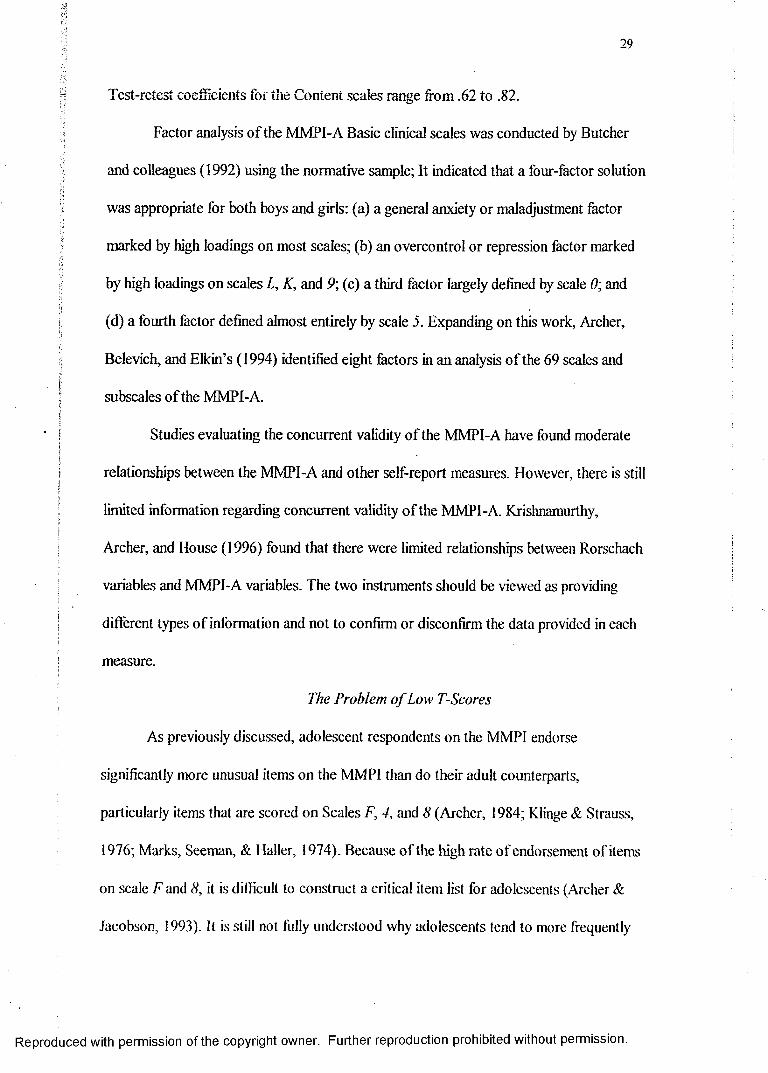
•? Test-retest coefficients for the Content scales range from .62 to .82.
Factor analysis o f the MMPI-A Basic clinical scales was conducted by Butcher
i and colleagues (1992) using the normative sample; It indicated that a four-factor solution
< was appropriate for both boys and girls: (a) a general anxiety or maladjustment factorI f
marked by high loadings on most scales; (b) an overcontrol or repression factor marked
by high loadings on scales L, K, and 9; (c) a third factor largely defined by scale 0; and
is: (d) a fourth factor defined almost entirely by scale 5. Expanding on this work, Archer,
Belevich, and Elkin’s (1994) identified eight factors in an analysis o f the 69 scales and
subscales o f the MMPI-A.
Studies evaluating the concurrent validity o f the MMPI-A have found moderate
relationships between the MMPI-A and other self-report measures. However, there is still
| limited information regarding concurrent validity o f the MMPI-A. Krishnamurthy,
! Archer, and House (1996) found that there were limited relationships between Rorschach:
variables and MMPI-A variables. The two instruments should be viewed as providing
| different types o f information and not to confirm or disconfirm the data provided in each
: measure.
The Problem o f Low T-Scores
As previously discussed, adolescent respondents on the MMPI endorse
significantly more unusual items on the MMPI than do their adult counterparts,
particularly items that are scored on Scales F, 4, and 8 (Archer, 1984; Klinge & Strauss,
1976; Marks, Seeman, & Haller, 1974). Because o f the high rate of endorsement of items
on scale F and 8, it is difficult to construct a critical item list for adolescents (Archer &
Jacobson, 1993). It is still not fully understood why adolescents tend to more frequently
Reproduced with permission of the copyright owner. Further reproduction prohibited without permission.
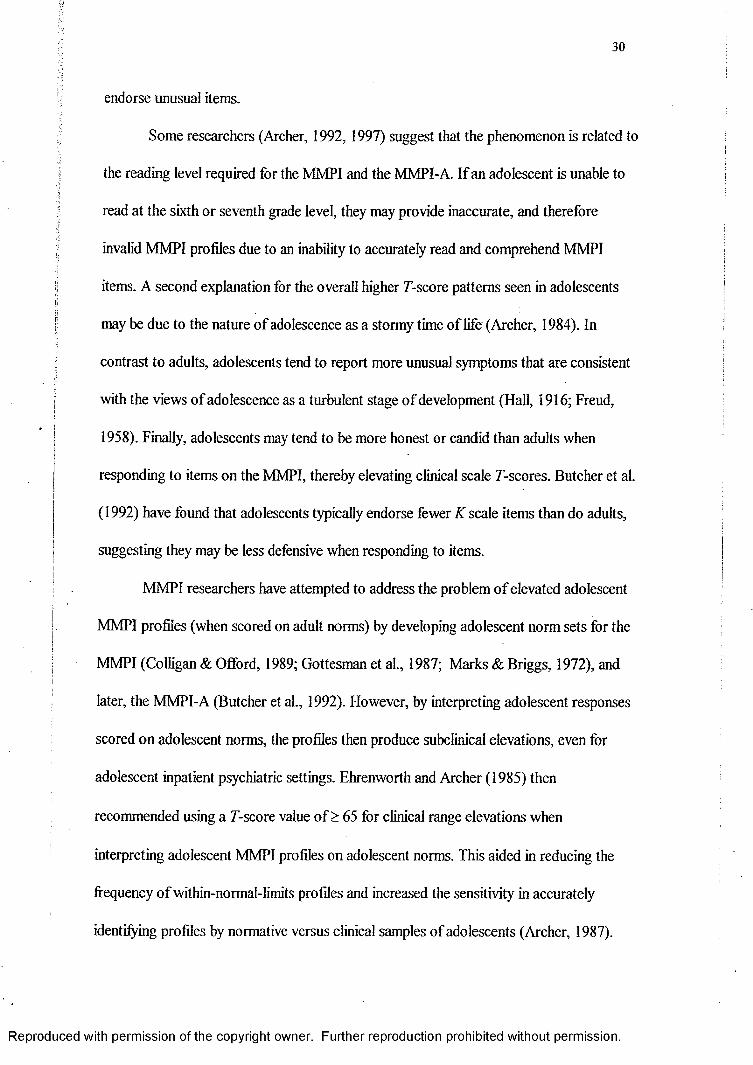
30
endorse unusual items.
Some researchers (Archer, 1992, 1997) suggest that the phenomenon is related to
the reading level required for the MMPI and the MMPI-A. If an adolescent is unable to
read at the sixth or seventh grade level, they may provide inaccurate, and therefore
invalid MMPI profiles due to an inability to accurately read and comprehend MMPI
items. A second explanation for the overall higher E-score patterns seen in adolescents
may be due to the nature o f adolescence as a stormy time of life (Archer, 1984). In
contrast to adults, adolescents tend to report more unusual symptoms that are consistent
with the views of adolescence as a turbulent stage of development (Hall, 1916; Freud,
1958). Finally, adolescents may tend to be more honest or candid than adults when
responding to items on the MMPI, thereby elevating clinical scale E-scores. Butcher et al.
(1992) have found that adolescents typically endorse fewer K scale items than do adults,
suggesting they may be less defensive when responding to items.
MMPI researchers have attempted to address the problem of elevated adolescent
MMPI profiles (when scored on adult norms) by developing adolescent norm sets for the
MMPI (Colligan & Oflford, 1989; Gottesman et al., 1987; Marks & Briggs, 1972), and
later, the MMPI-A (Butcher et al., 1992). However, by interpreting adolescent responses
scored on adolescent norms, the profiles then produce subclinical elevations, even for
adolescent inpatient psychiatric settings. Ehrenworth and Archer (1985) then
recommended using a E-score value o f > 65 for clinical range elevations when
interpreting adolescent MMPI profiles on adolescent norms. This aided in reducing the
frequency o f within-normal-limits profiles and increased the sensitivity in accurately
identifying profiles by normative versus clinical samples o f adolescents (Archer, 1987).
Reproduced with permission of the copyright owner. Further reproduction prohibited without permission.
31
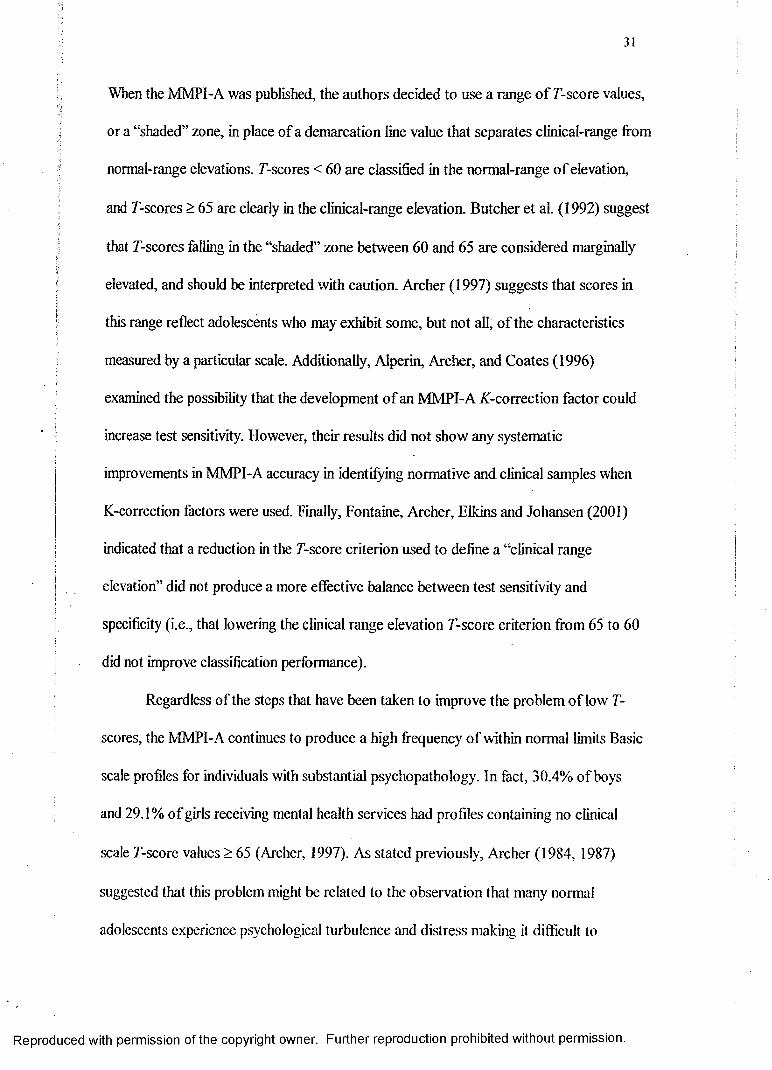
When the MMPI-A was published, the authors decided to use a range o f 73-score values,
or a “shaded” zone, in place o f a demarcation line value that separates clinical-range from
normal-range elevations. F-scores < 60 are classified in the normal-range o f elevation,
and ^scores > 65 are clearly in the clinical-range elevation. Butcher et al. (1992) suggest
that F-scores felling in the “shaded” zone between 60 and 65 are considered marginally
I elevated, and should be interpreted with caution. Archer (1997) suggests that scores in
this range reflect adolescents who may exhibit some, but not all, o f the characteristics
measured by a particular scale. Additionally, Alperin, Archer, and Coates (1996)i :[j examined the possibility that the development o f an MMPI-A /^-correction factor could
increase test sensitivity. However, their results did not show any systematic
improvements in MMPI-A accuracy in identifying normative and clinical samples when
K-correction factors were used. Finally, Fontaine, Archer, Elkins and Johansen (2001)
indicated that a reduction in the F-score criterion used to define a “clinical range
I elevation” did not produce a more effective balance between test sensitivity and
specificity (i.e., that lowering the clinical range elevation F-score criterion from 65 to 60j| did not improve classification performance).i
j Regardless of the steps that have been taken to improve the problem o f low 73-
scores, the MMPI-A continues to produce a high frequency o f within normal limits Basic
scale profiles for individuals with substantial psychopathology. In fact, 30.4% of boys
and 29.1% o f girls receiving mental health services had profiles containing no clinical
scale 7'-score values > 65 (Archer, 1997). As stated previously, Archer (1984, 1987)
suggested that this problem might be related to the observation that many normal
adolescents experience psychological turbulence and distress making it difficult to
Reproduced with permission of the copyright owner. Further reproduction prohibited without permission.
32
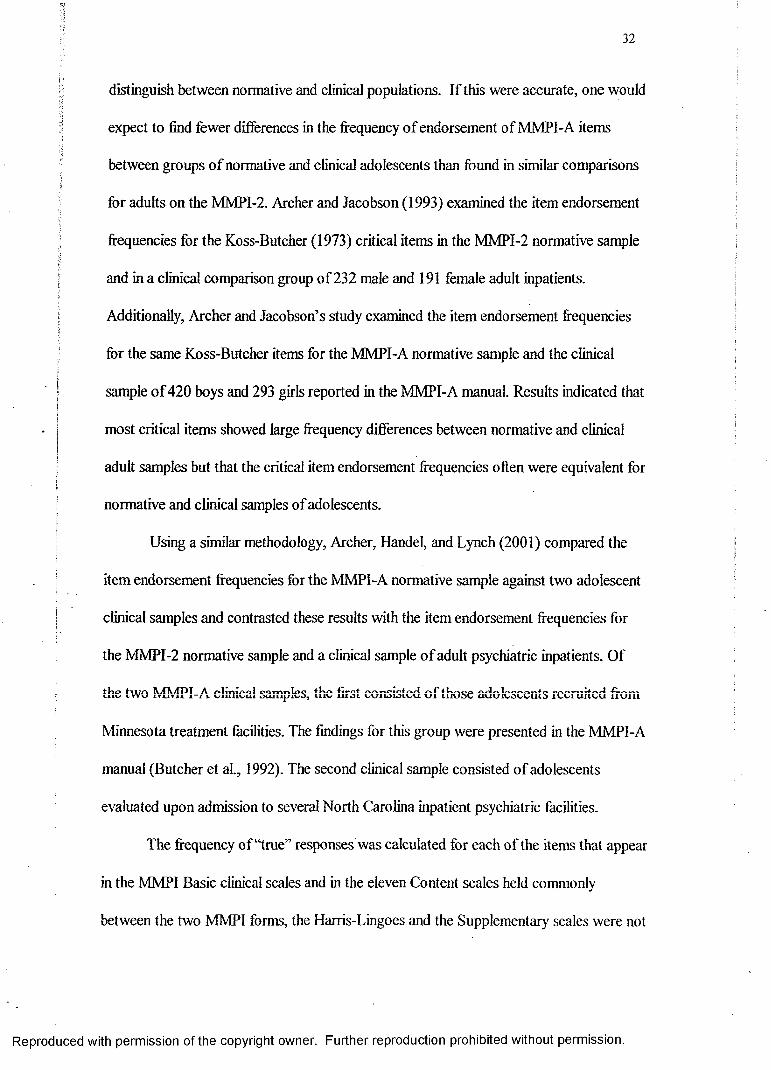
distinguish between nonnative and clinical populations. If this were accurate, one would
expect to find fewer differences in the frequency o f endorsement of MMPI-A items
between groups o f normative and clinical adolescents than found in similar comparisons
for adults on the MMPI-2. Archer and Jacobson (1993) examined the item endorsement
frequencies for the Koss-Butcher (1973) critical items in the MMPI-2 normative sample
and in a clinical comparison group o f232 male and 191 female adult inpatients.
Additionally, Archer and Jacobson’s study examined the item endorsement frequencies
for the same Koss-Butcher items for the MMPI-A normative sample and the clinical
sample o f420 boys and 293 girls reported in the MMPI-A manual. Results indicated that
most critical items showed large frequency differences between normative and clinical
adult samples but that the critical item endorsement frequencies often were equivalent for
normative and clinical samples of adolescents.
Using a similar methodology, Archer, Handel, and Lynch (2001) compared the
item endorsement frequencies for the MMPI-A normative sample against two adolescent
clinical samples and contrasted these results with the item endorsement frequencies for
the MMPI-2 normative sample and a clinical sample o f adult psychiatric inpatients. Of
the two MMPI- / 1 clinical samples, the first consisted o f those adolescents recruited from
Minnesota treatment facilities. The findings for this group were presented in the MMPI-A
manual (Butcher et al., 1992). The second clinical sample consisted o f adolescents
evaluated upon admission to several North Carolina inpatient psychiatric facilities.
The frequency of “true” responses was calculated for each of the items that appear
in the MMPI Basic clinical scales and in the eleven Content scales held commonly
between the two MMPI forms, the Harris-Lingoes and the Supplementary scales were not
Reproduced with permission of the copyright owner. Further reproduction prohibited without permission.
33
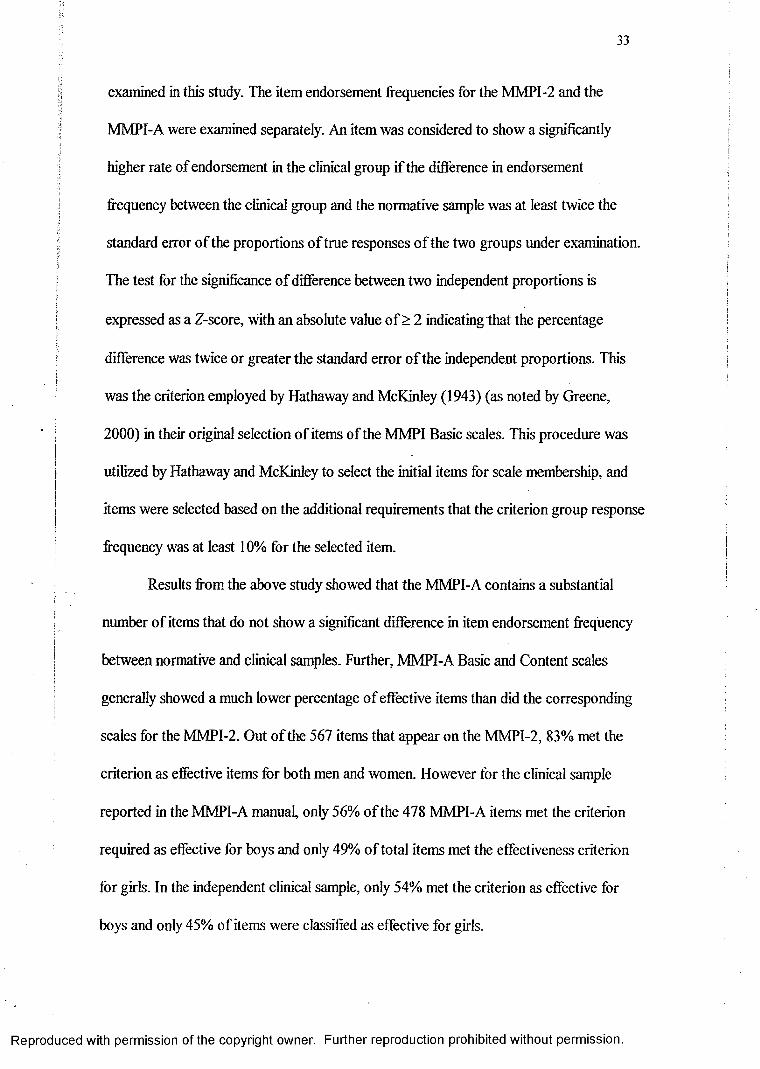
examined in this study. The item endorsement frequencies for the MMPI-2 and the
MMPI-A were examined separately. An item was considered to show a significantly
higher rate of endorsement in the clinical group if the difference in endorsement
frequency between the clinical group and the normative sample was at least twice the
standard error o f the proportions o f true responses o f the two groups under examination.
The test for the significance o f difference between two independent proportions is
expressed as a Z-score, with an absolute value o f > 2 indicating that the percentage
difference was twice or greater the standard error o f the independent proportions. This
was the criterion employed by Hathaway and McKinley (1943) (as noted by Greene,
2000) in their original selection o f items of the MMPI Basic scales. This procedure was
utilized by Hathaway and McKinley to select the initial items for scale membership, and
items were selected based on the additional requirements that the criterion group response
frequency was at least 10% for the selected item.
Results from the above study showed that the MMPI-A contains a substantial
number of items that do not show a significant difference in item endorsement frequency
between normative and clinical samples. Further, MMPI-A Basic and Content scales
generally showed a much lower percentage o f effective items than did the corresponding
scales for the MMPI-2. Out o f the 567 items that appear on the MMPI-2, 83% met the
criterion as effective items for both men and women. However for the clinical sample
reported in the MMPI-A manual, only 56% o f the 478 MMPI-A items met the criterion
required as effective for boys and only 49% o f total items met the effectiveness criterion
for girls. In the independent clinical sample, only 54% met the criterion as effective for
boys and only 45% of items were classified as effective for girls.
Reproduced with permission of the copyright owner. Further reproduction prohibited without permission.
34
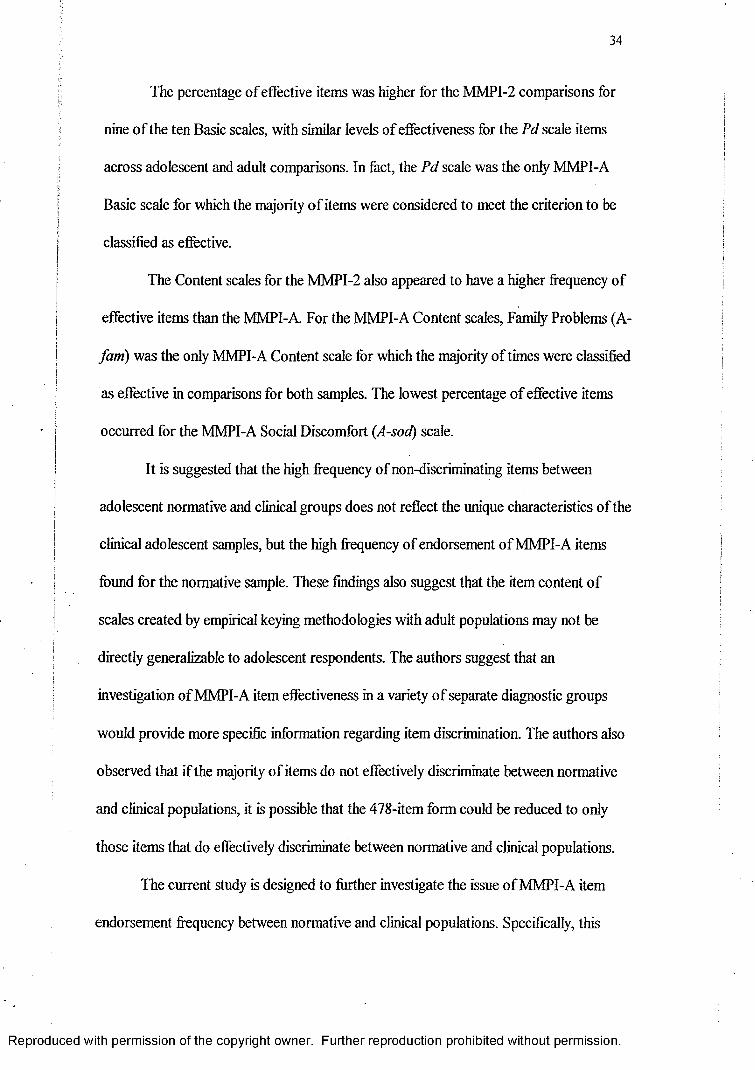
The percentage of effective items was higher for the MMPI-2 comparisons for
nine o f the ten Basic scales, with similar levels of effectiveness for the Pd scale items
across adolescent and adult comparisons. In fact, the Pd scale was the only MMPI-A
Basic scale for which the majority o f items were considered to meet the criterion to be
classified as effective.
The Content scales for the MMPI-2 also appeared to have a higher frequency of
effective items than the MMPI-A. For the MMPI-A Content scales, Family Problems (A-
fam) was the only MMPI-A Content scale for which the majority of times were classified
as effective in comparisons for both samples. The lowest percentage o f effective items
occurred for the MMPI-A Social Discomfort (A-sod) scale.
It is suggested that the high frequency of non-discriminating items between
adolescent normative and clinical groups does not reflect the unique characteristics o f the
clinical adolescent samples, but the high frequency of endorsement o f MMPI-A items
found for the normative sample. These findings also suggest that the item content o f
scales created by empirical keying methodologies with adult populations may not be
directly generalizable to adolescent respondents. The authors suggest that an
investigation of MMPI-A item effectiveness in a variety o f separate diagnostic groups
would provide more specific information regarding item discrimination. The authors also
observed that if the majority of items do not effectively discriminate between normative
and clinical populations, it is possible that the 478-item form could be reduced to only
those items that do effectively discriminate between normative and clinical populations.
The current study is designed to further investigate the issue o f MMPI-A item
endorsement frequency between normative and clinical populations. Specifically, this
Reproduced with permission of the copyright owner. Further reproduction prohibited without permission.
study has three purposes: 1) To extend the Archer, Handel and Lynch (2001) study by
examining the item endorsement frequencies o f the Supplementaiy scales, Harris Lingoes
subscales, and subtle-obvious items; 2) To examine the Basic, Content, and
Supplementary scales, and Harris Lingoes subscales with two homogeneous diagnostic
criterion groups (as suggested by Archer, Handel, and Lynch), and finally; 3) To re
examine and recalculate Basic scale data using only those items that prove to
discriminate effectively between the normative and clinical populations. The mean
profile o f the normative and clinical groups was contrasted based on the “revised” Basic
scales with an independent clinical sample to evaluate the extent to which profile
sensitivity and specificity is affected by these scale modifications. The hypotheses are as
follows:
1) The frequency o f effective items would not be significantly related to
membership on specific Supplementary and Harris Lingoes scales. The frequency o f item
effectiveness in the Basic scales would be substantially higher among obvious items in
contrast to subtle items.
2) The specific content o f non-discriminating items would vary as a function o f
the diagnostic groups used in contrast to normative groups, (i.e., the frequency of
effective items would increase when item content and diagnostic group are related.)
3) The overall rate o f discrimination would increase, in terms o f sensitivity, when
the Basic clinical scale items are removed that did not discriminate between normative
and clinical groups o f adolescents, (i.e., when the Basic scales are revised based only on
responses to retained items and Basic scale clinical profiles recalculated for normative
and clinical groups.).
Reproduced with permission of the copyright owner. Further reproduction prohibited without permission.
36
CHAPTER II
METHOD
Participants
Participants for this study consisted of norms for a group of normative subjects,
and a clinical sample as reported in the MMPI-A manual, and two samples o f adolescents
evaluated with the MMPI-A while receiving clinical services. The MMPI-A normative
sample was used as the control group in this study, and consisted o f 1620 adolescents
(805 males and 815 females), between grades 7 and 12, inclusive. Participants ranged in
age from 14 through 18, inclusive, mean age of 15.5 (SD= 1.17) for boys and 15.6 (SD=
1.10) for girls. The MMPI-A normative sample is described in detail in Archer (1997)
and in the MMPI-A manual by Butcher et al. (1992). The MMPI-A normative sample
will be referred to as the normative sample. The MMPI-A manual clinical sample
consisted o f420 boys and 293 girls, aged 14 through 18, with grade placements o f 7
through 12, inclusive. This clinical sample was recruited from treatment facilities in the
Minneapolis area, including inpatient alcohol and drug treatment centers (N= 299 boys,
163 girls), inpatient mental health facilities (N= 67 boys, 96 girls), day-treatment
programs (N - 13 boys, 24 girls), and a special school program (N= 41 boys, 10 girls).
Diagnoses are not available for this clinical sample. This sample is referred to as the
manual-clinical sample.
The first additional clinical sample for the current study used to test the diagnostic
homogeneity hypothesis were selected from 271 boys and 160 girls between the ages o f
14 through 18, inclusive, who were evaluated with the MMPI-A upon their admission to
adolescent units in inpatient psychiatric treatment facilities in North Carolina (N=90),
Reproduced with permission of the copyright owner. Further reproduction prohibited without permission.

37
Texas (77=202), and Virginia (A7=139). This clinical sample will be designated as the
inpatient clinical sample. The diagnostic breakdown (based on DSM-III-R and DSM-IV
criteria) for the combined inpatient sample, based on principle diagnosis as provided in
the admission medical record was as follows: Conduct Disorder = 192 (44.5%),
Dysthymic disorders = 63 (14.6%); missing = 42 (9.8%); Major Depression = 34 (7.9%);
other = 30 (6.9%); Depressive disorder NOS - 16 (3.7%); Disruptive Behavior disorder =
15 (3.5%); Oppositional Defiant Disorder = 13 (3.0%); Adjustment disorders = 12
(2.8%); Bipolar disorders = 10 (2.0%); and Sexual disorders = 4 (.9%). The first
diagnostic subsample from this inpatient sample are those participants diagnosed with
conduct disorder and are referred to as the conduct disorder sample. The second
diagnostic subsample from this inpatient sample are comprised o f those participants
diagnosed with depression and dysthymia and are referred to as the depression sample.
The second clinical sample in this study, used to calculate classification
characteristics for standard and revised Basic MMPI-A scales, consisted of 90 boys and
73 girls between grades 7 and 12 inclusive, who received outpatient evaluations or
outpatient therapy services at the Hampton-Newport News Community Services Board
(CSB). Participants ranged in age from 13 to 18, inclusive. The mean age was 15.7 (SD=
1.29) for boys and 15.7 (SD= 1.07) for girls. The diagnostic breakdown (based on DSM-
IV criteria) was Depressive Disorders (N-14), Conduct Disorder/Oppositional Defiant
Disorder (N= 21), Bipolar I Disorder (N - 3), Substance Abuse (N - 2), Adjustment
Disorder (N= 5), Attention Deficit/Hyperactivity Disorder (N= 5), Learning Disorders
(N= 2), Child Abuse/Neglect (jV=4), Missing (N= 107). This data collection project is not
yet completed; therefore, many of the diagnoses are missing for this data set. This sample
Reproduced with permission of the copyright owner. Further reproduction prohibited without permission.
38
is referred to as the independent outpatient clinical sample.
Design and Procedure
The first purpose of this study was to evaluate the item discrimination
effectiveness o f MMPI-A items when examined in relation to the Supplementary scales,
Harris Lingoes subscales, and subtle versus obvious Basic scale items for the normative
versus manual clinical sample. Differences in item endorsement frequencies were
evaluated by using the Test for the Significance o f Difference between two independent
proportions expressed as a Z-score, with an absolute value o f > 2 indicating that the
percentage difference was twice or greater the standard error o f the independent
proportions. This criterion was used to define a significant difference in item
endorsement, and as noted earlier, is consistent with the primary criterion employed by
Hathaway and McKinley (1940) in their selection o f the original items for the MMPI
Basic scales. The subtle and obvious components o f the MMPI-A Basic scales were
identified by consulting the MMPI-2 (Butcher et al., 1989,2001) manual for the item
composition o f subtle and obvious components o f the Basic scales, and then extrapolating
this information to all o f those Basic scales items retained within the MMPI-A Basic
scale structure.
A second purpose o f the present study was to evaluate the frequency of item
effectiveness for Basic, Content, and Supplementary scales and Harris Lingoes subscales
in relation to membership in two homogeneous diagnostic groups. Participants for
specific diagnostic groups were selected from the first clinical sample based on their
membership in the conduct disorders diagnostic group (N= 192) and in the depression
group (N=\ 13), that consisted of the combined dysthymic disorders (N= 63), major
Reproduced with permission of the copyright owner. Further reproduction prohibited without permission.
39
depression (A7=34), and depressive disorders NOS (7V=16) subgroups.
The third and final purpose o f this study was to examine the rate of classification
accuracy on an independent outpatient clinical sample after those items previously
determined as ineffective were removed from Basic scale membership. Items were
considered ineffective, and subsequently removed from the scales, if they met the
“ineffective” criteria (Z score absolute value o f < 2) for the manual clinical sample and an
independent sample used in Archer et al. (2001). Scales 2, 4, and 9 were required to meet
additional criteria in that they also had to be ineffective for the homogeneous criterion
group that corresponds to the scale (i.e., scale 2- Depression; scales 4 and 9, Conduct
Disorder). The uniform T-scores utilized to evaluate the revised Basic scales, that is, the
Basic scale compositions following the deletion o f non-discriminating items, was based
upon the derivation o f Uniform T-score values from the MMPI-A normative sample,
calculated separately by gender. A software package for the derivation o f Uniform 7-
scores for the MMPI-2 Scales (Hoeglund & Tellegen, 1998) was utilized for this purpose.
Uniform 7-scores were developed to provide a raw score to a 7-score transformation
procedure that produced relatively comparable percentile values across scales for a given
7-score value (Hoeglund & Tellegen, 1998). The Uniform 7'-score transformation
process consisted o f three stages. The goal o f the first stage was to derive from raw score
frequencies the corresponding linear 7-scores for each scale. The second stage was to
derive for each scale the regression weights and intercept values for the Uniform /'-score
equation(1JT= Bq + BjX + l^U ^ iB^f)^). Finally, the third stage involved the
development o f a table with all possible raw scores and the corresponding Uniform 7-
scores for each raw score value.
Reproduced with permission of the copyright owner. Further reproduction prohibited without permission.
40
Data Analysis
The test for significance o f difference between two independent proportions was
used as means of evaluating item endorsement frequency differences. This test is
expressed as a Z-score, and a criterion o f an absolute value o f > 2 was utilized to signify
a significant difference in endorsement frequencies. Two-tailed Chi square tests, with
Yates correction, were used in order to evaluate differences between endorsement of
subtle versus obvious items, gender, homogeneous versus manual clinical samples, and
Harris Lingoes subscales versus Basic scales. The Yates continuity correction is designed
to yield more accurate chi-square approximations under conditions in which expected
frequencies are limited and there is only one degree of freedom. However, Howell (1992)
argues that Chi square approximations with limited frequencies are not completely
accurate with or without a chi square approximation. To evaluate T-score differences for
the original versus revised scales on the independent clinical sample, a series of
univariate ANOVA’s were performed. To protect against the inflation of the alpha level
that occurs as a product o f conducting multiple tests on related data sources, a MANOVA
was used to evaluate the overall group effect on the basic scales. Further, due to the
number o f tests conducted, alpha level was also adjusted to p < .01 for subsequent
univariate tests for individual scales.
Finally, overall hit-rate, sensitivity, specificity, positive predictive power and
negative predictive power was used to evaluate the effects o f the deletion o f non
discriminating items from the Basic scales on the level of accurate prediction of
adolescents status in either the normative or clinical groups. Hit rate, in the current study,
is the ability o f the Basic scale profile to accurately identify true positives and true
Reproduced with permission of the copyright owner. Further reproduction prohibited without permission.
41
i! negatives (calculated by adding the true positives and the true negatives and dividing by
the total number of subjects). Sensitivity is the percentage o f participants whose protocols
indicate the presence of clinical status who in fact were from the clinical sample.
Specificity is the percentage o f participants whose within normal limits protocols
accurately indicate the absence o f pathology because, in fact, they were from the
i normative group. Positive predictive power is defined as the probability that an elevated
score is being produced by a protocol from the clinical sample. Negative predictive
power is the probability that a within normal limits protocol was produced by ai|
participant in the normative group.
Reproduced with permission of the copyright owner. Further reproduction prohibited without permission.
42
CHAPTER III
RESULTS
Results will be examined in three parts. First, the endorsement frequencies for the
manual’s normative and clinical sample are presented for the Supplementary scales,
Harris Lingoes subscales, and subtle-obvious items. Next, the endorsement frequencies
for the homogeneous criterion groups (i.e., depression and conduct disorder samples) are
examined on the Basic, Content, and Supplementary scales and Harris Lingoes subscales.
Finally, overall hit-rate, sensitivity, specificity, positive predictive power and negative
predictive power are examined for the revised Basic scales in contrast to the standard
MMPI-A Basic scales for the independent clinical sample.
The first objective o f this study was to extend Archer, Handel, and Lynch’s
(2001) study by examining the item endorsement frequencies of the Supplementary
scales, the Harris Lingoes subscales, and subtle versus obvious Basic scale items for the
normative and the manual clinical sample. There are six Supplementary scales on the
MMPI-A (MAC-R, ACK, PRO, IMM, A and R). As shown in Table 4, the right hand
columns illustrate the percentage of effective items by gender for the normative versus
manual clinical sample. There were no significant gender differences in item
endorsement frequency on any o f the Supplementary scales. MAC-R, ACK, and PRO
scales all contained more than 60% effective items (except MAC-R for girls, 49%) where
as IMM, A, and R, all contained less than 50% effective items.
Reproduced with permission of the copyright owner. Further reproduction prohibited without permission.
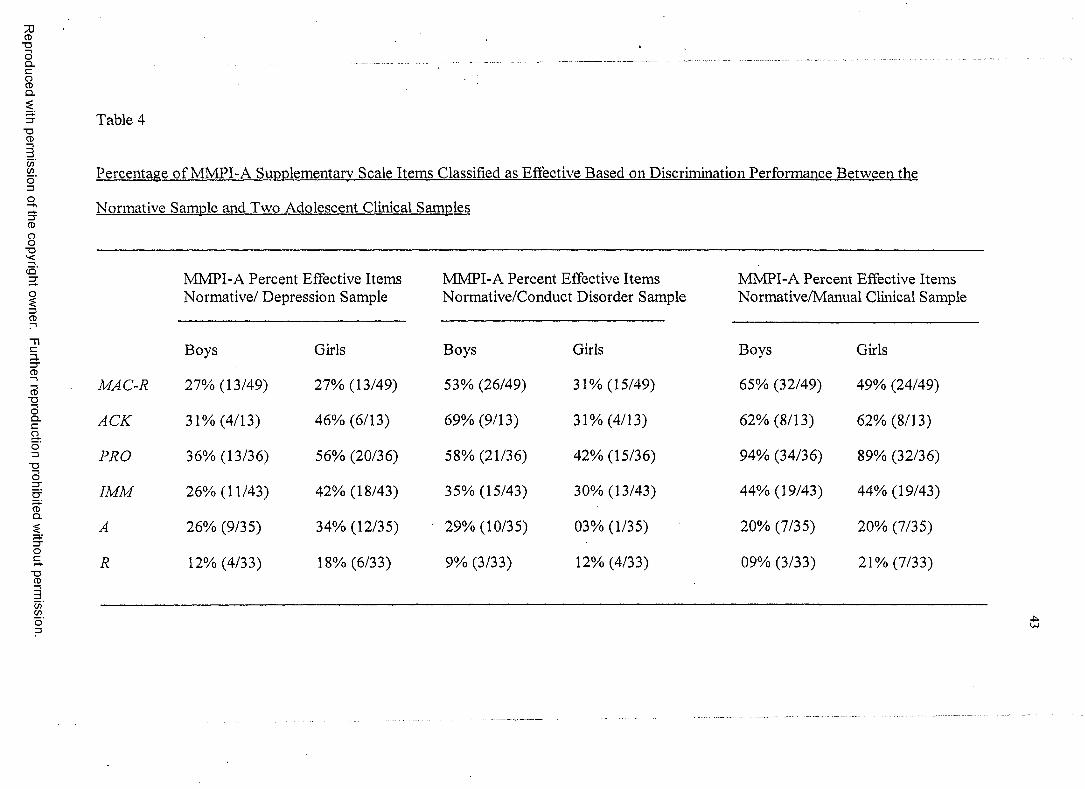
Reproduced
with perm
ission of the
copyright ow
ner. Further
reproduction prohibited
without
permission.
Table 4
Percentage o f MMPI-A Supplementary Scale Items Classified as Effective Based on Discrimination Performance Between the
Normative Sample and Two Adolescent Clinical Samples
MMPI-A Percent Effective Items MMPI-A Percent Effective Items MMPI-A Percent Effective ItemsNormative/ Depression Sample Normative/Conduct Disorder Sample Normative/Manual Clinical Sample
Boys Girls Boys Girls Boys Girls
MAC-R 27% (13/49) 27% (13/49) 53% (26/49) 31% (15/49) 65% (32/49) 49% (24/49)
ACK 31% (4/13) 46% (6/13) 69% (9/13) 31% (4/13) 62% (8/13) 62% (8/13)
PRO 36% (13/36) 56% (20/36) 58% (21/36) 42% (15/36) 94% (34/36) 89% (32/36)
IM M 26% (11/43) 42% (18/43) 35% (15/43) 30% (13/43) 44% (19/43) 44% (19/43)
A 26% (9/35) 34% (12/35) 29% (10/35) 03% (1/35) 20% (7/35) 20% (7/35)
R 12% (4/33) 18% (6/33) 9% (3/33) 12% (4/33) 09% (3/33) 21% (7/33)
Reproduced
with perm
ission of the
copyright ow
ner. Further
reproduction prohibited
without
permission
Table 4 (continued)
Note. Percent figures reflect the total percentage o f items within each scale that showed significant differences in item endorsement frequencies between the normative and clinical sample, i.e., items classified as “effective” in terms o f discrimination between samples. The first number within each parentheses indicates the number o f “effective” items within the scale, and the second number reflects the total number o f items in the scale.
£
45
There are 28 Harris Lingoes (HL) subscales for seven o f the ten Basic scales. As
shown in Table 5, the right hand columns illustrate the percentage o f effective items
using the normative versus manual clinical sample by gender for each of the Harris
Lingoes subscales. There were no significant gender differences in item endorsement
frequency for any of the HL subscales. On the HL D subscale, the percentage o f
effective items was highest on D4 (Mental Dullness) for girls (67%, 10/15 effective
items) and for boys (80%, 12/15). The percentage o f effective items was lowest on D2
(Psychomotor Retardation) for girls (7%, 1/14 items) and for boys (21% 3/14). Of the HL
Hy subscales, only Hy3 (Lassitude-Malaise) for girls had more than 50% o f the items
classified as effective. Hy4 (Somatic Complaints) had only one effective item out o f 17
for both boys and girls. The HL Pd subscales contained the highest percentage of
effective items o f all the Harris Lingoes subscales; all of the Pd subscales had more than
half o f their items classified as effective. On HL Pa, only Pal (Persecutory ideas) was
above 50% effectiveness and only for girls. None o f the 9 items on Pa3 (Naivete)
distinguished between the normative and clinical samples. Similarly, on HL Sc, only one
subscale (Sc2, Emotional Alienation) was above 50 % item effectiveness, and that result
was found only for girls. There were no items on either Sc5 (Lack o f Ego Mastery,
Defective Inhibition) or Sc6 (Bizarre Sensory Experiences) that distinguished between
the normative and clinical samples. For HL Ma, only M ai (Amorality) had more than
50% classified as effective and this was only for boys. All the other Ma scales were
below 50% effectiveness.
Comparing the HL subscales against their corresponding parents scales, none
performed significantly better than the parent scales. However, on two occasions (Hy3
Reproduced with permission of the copyright owner. Further reproduction prohibited without permission.
46
(X2 (1, N - 60) = 7.59, p < .01) and Sc6 (y2( l, N - 77) = 6.26, p < .01), the parent scales
performed significantly better than the corresponding HL subscale.
Reproduced with permission of the copyright owner. Further reproduction prohibited without permission.
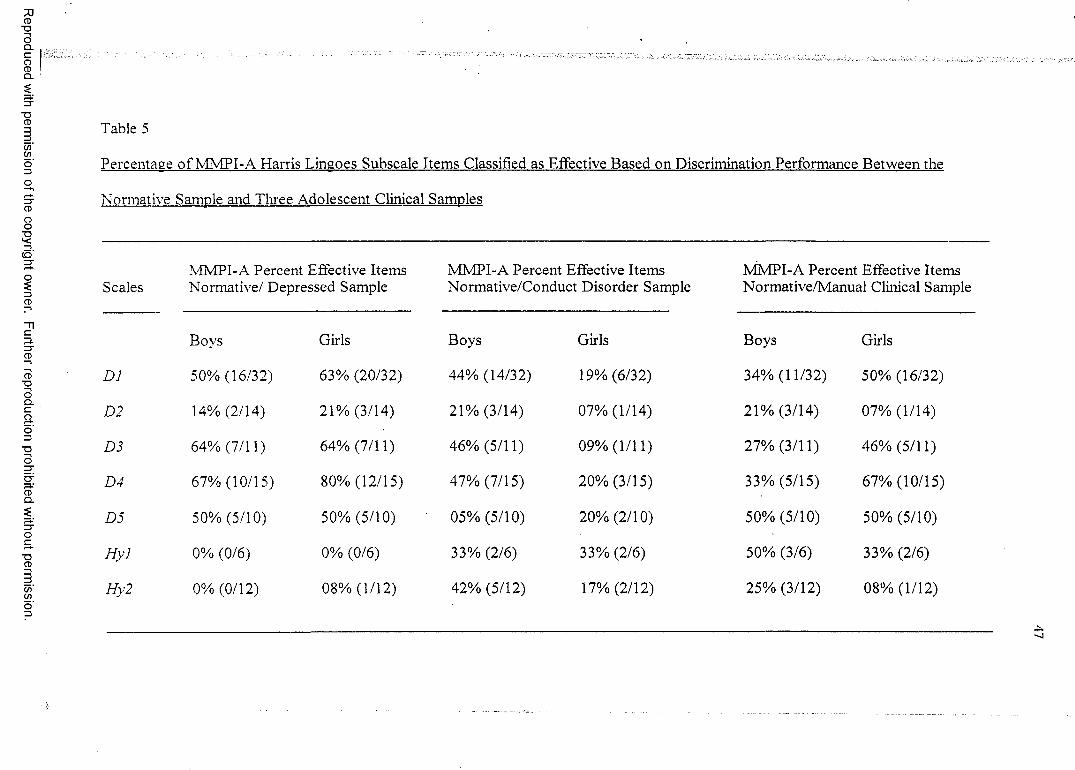
Reproduced
with perm
ission of the
copyright ow
ner. Further
reproduction prohibited
without
permission.
Table 5
Percentage o f MMPI-A Harris Lingoes Subscale Items Classified as Effective Based on Discrimination Performance Between the
Normative Sample and Three Adolescent Clinical Samples
MMPI-A Percent Effective Items MMPI-A Percent Effective Items MMPI-A Percent Effective ItemsScales Normative/ Depressed Sample Normative/Conduct Disorder Sample Normative/Manual Clinical Sample
Boys Girls Boys Girls Boys Girls
DJ 50% (16/32) 63% (20/32) 44% (14/32) 19% (6/32) 34% (11/32) 50% (16/32)
D2 14% (2/14) 21% (3/14) 21% (3/14) 07% (1/14) 21% (3/14) 07% (1/14)
D3 64% (7/11) 64% (7/11) 46% (5/11) 09% (1/11) 27% (3/11) 46% (5/11)
D4 67% (10/15) 80% (12/15) 47% (7/15) 20% (3/15) 33% (5/15) 67% (10/15)
D5 50% (5/10) 50% (5/10) 05% (5/10) 20% (2/10) 50% (5/10) 50% (5/10)
H yl 0% (0/6) 0% (0/6) 33% (2/6) 33% (2/6) 50% (3/6) 33% (2/6)
Hy2 0% (0/12) 08% (1/12) 42% (5/12) 17% (2/12) 25% (3/12) 08% (1/12)
•t.
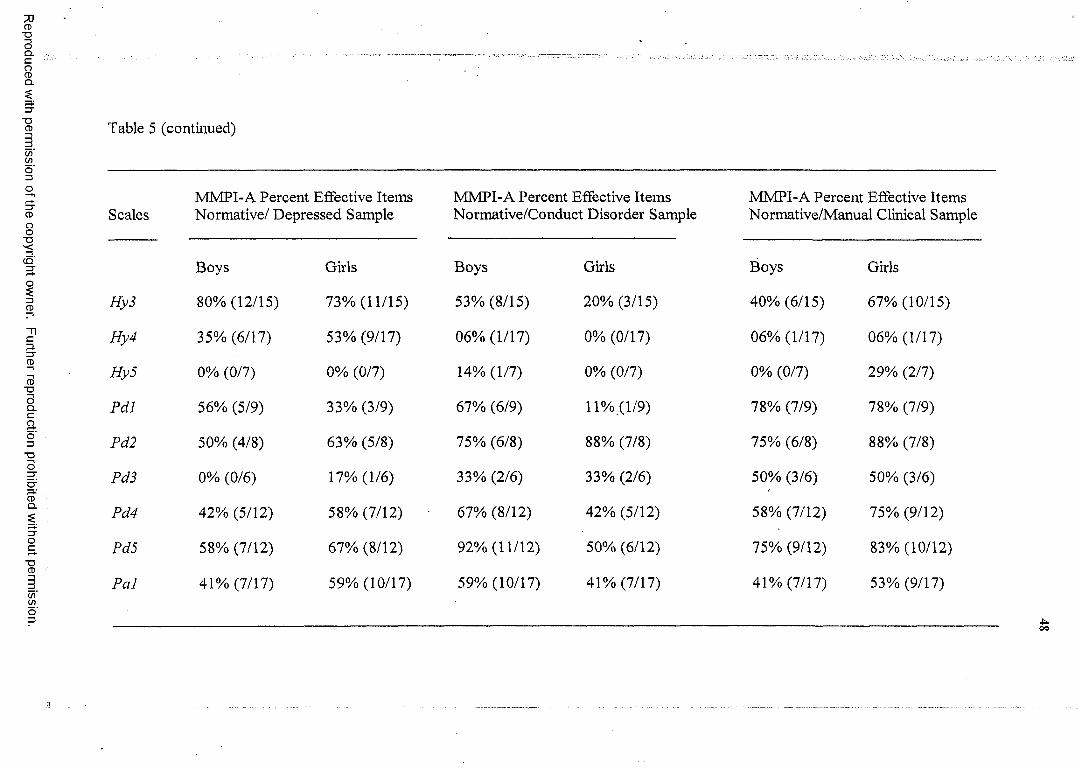
Reproduced
with perm
ission of the
copyright ow
ner. Further
reproduction prohibited
without
permission.
Table 5 (continued)
MMPI-A Percent Effective Items MMPI-A Percent Effective Items MMPI-A Percent Effective ItemsScales Normative/ Depressed Sample Normative/Conduct Disorder Sample Normative/Manual Clinical Sample
Boys Girls Boys Girls Boys Girls
Hy3 80% (12/15) 73% (11/15) 53% (8/15) 20% (3/15) 40% (6/15) 67% (10/15)
Hy4 35% (6/17) 53% (9/17) 06% (1/17) 0% (0/17) 06% (1/17) 06% (1/17)
Hy5 0% (0/7) 0% (0/7) 14% (1/7) 0% (0/7) 0% (0/7) 29% (2/7)
Pdl 56% (5/9) 33% (3/9) 67% (6/9) 11% (1/9) 78% (7/9) 78% (7/9)
Pd2 50% (4/8) 63% (5/8) 75% (6/8) 88% (7/8) 75% (6/8) 88% (7/8)
Pd3 0% (0/6) 17% (1/6) 33% (2/6) 33% (2/6) 50% (3/6) 50% (3/6)
Pd4 42% (5/12) 58% (7/12) 67% (8/12) 42% (5/12) 58% (7/12) 75% (9/12)
Pd5 58% (7/12) 67% (8/12) 92% (11/12) 50% (6/12) 75% (9/12) 83% (10/12)
Pal 41% (7/17) 59% (10/17) 59% (10/17) 41% (7/17) 41% (7/17) 53% (9/17)
■ t * .oo
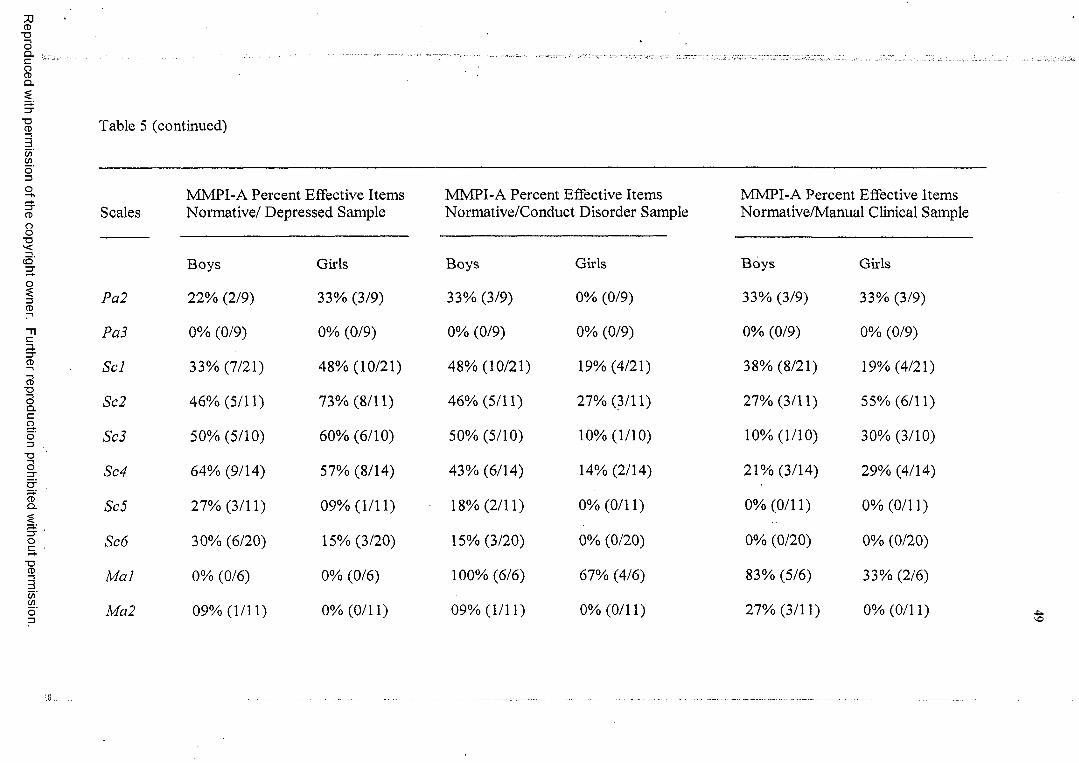
Reproduced
with perm
ission of the
copyright ow
ner. Further
reproduction prohibited
without
permission.
Table 5 (continued)
MMPI-A Percent Effective Items MMPI-A Percent Effective Items MMPI-A Percent Effective ItemsScales Normative/ Depressed Sample Normative/Conduct Disorder Sample Normative/Manual Clinical Sample
Boys Girls Boys Girls Boys Girls
Pa2 22% (2/9) 33% (3/9) 33% (3/9) 0% (0/9) 33% (3/9) 33% (3/9)
Pa3 0% (0/9) 0% (0/9) 0% (0/9) 0% (0/9) 0% (0/9) 0% (0/9)
Scl 33% (7/21) 48% (10/21) 48% (10/21) 19% (4/21) 38% (8/21) 19% (4/21)
Sc2 46% (5/11) 73% (8/11) 46% (5/11) 27% (3/11) 27% (3/11) 55% (6/11)
Sc3 50% (5/10) 60% (6/10) 50% (5/10) 10% (1/10) 10% (1/10) 30% (3/10)
Sc4 64% (9/14) 57% (8/14) 43% (6/14) 14% (2/14) 21% (3/14) 29% (4/14)
Sc5 27% (3/11) 09% (1/11) 18% (2/11) 0% (0/11) 0% (0/11) 0% (0/11)
Sc6 30% (6/20) 15% (3/20) 15% (3/20) 0% (0/20) 0% (0/20) 0% (0/20)
M ai 0% (0/6) 0% (0/6) 100% (6/6) 67% (4/6) 83% (5/6) 33% (2/6)
Ma2 09% (1/11) 0% (0/11) 09% (1/11) 0% (0/11) 27% (3/11) 0% (0/11)
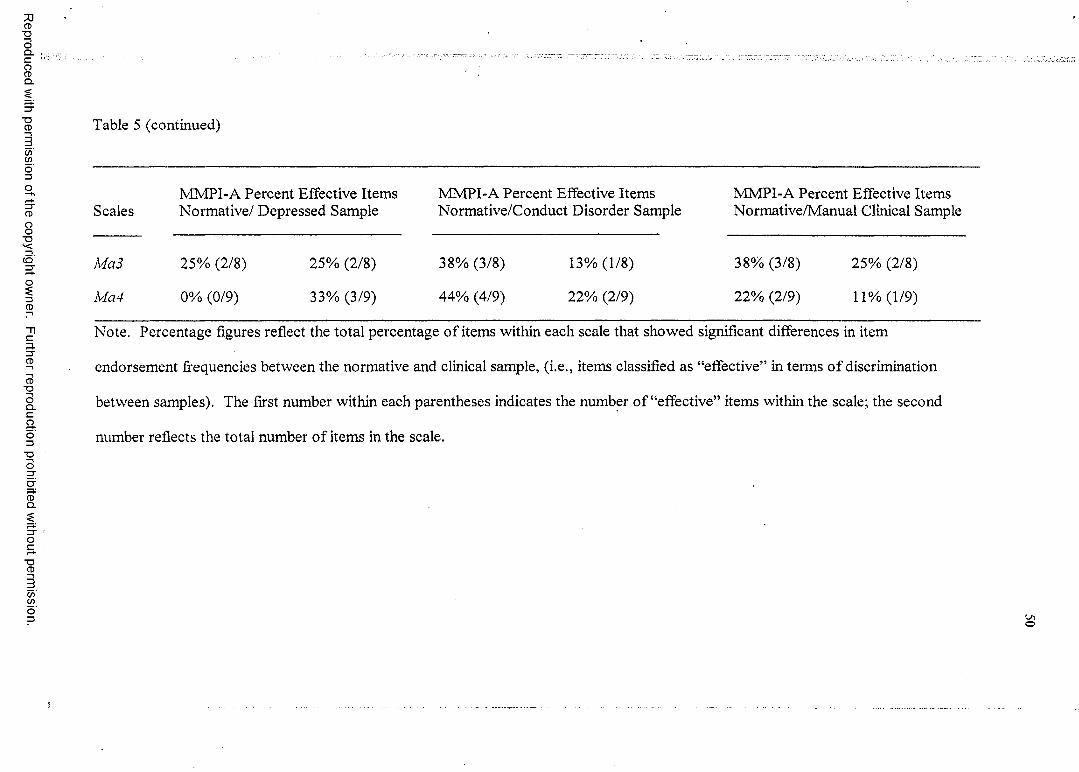
Reproduced
with perm
ission of the
copyright ow
ner. Further
reproduction prohibited
without
permission.
Table 5 (continued)
ScalesMMPI-A Percent Effective Items Normative/ Depressed Sample
MMPI-A Percent Effective Items Normative/Conduct Disorder Sample
MMPI-A Percent Effective Items Normative/Manual Clinical Sample
Ma3 25% (2/8) 25% (2/8) 38% (3/8) 13% (1/8) 38% (3/8) 25% (2/8)
Ma4 0% (0/9) 33% (3/9) 44% (4/9) 22% (2/9) 22% (2/9) 11% (1/9)
Note. Percentage figures reflect the total percentage o f items within each scale that showed significant differences in item
endorsement frequencies between the normative and clinical sample, (i.e., items classified as “effective” in terms o f discrimination
between samples). The first number within each parentheses indicates the number o f “effective” items within the scale; the second
number reflects the total number o f items in the scale.
o

Although the MMPI-A does not have specific subtle-obvious scales (Butcher et
al., 1992), each item on the Weiner-Harmon Subtle-Obvious Subscales used from the
MMPI-2 was matched with a corresponding MMPI-A item. There were no significant
differences between subtle and obvious item endorsement effectiveness for the any of the
five scales as evaluated in Chi-square analyses (see Table 6).
Reproduced with permission of the copyright owner. Further reproduction prohibited without permission.
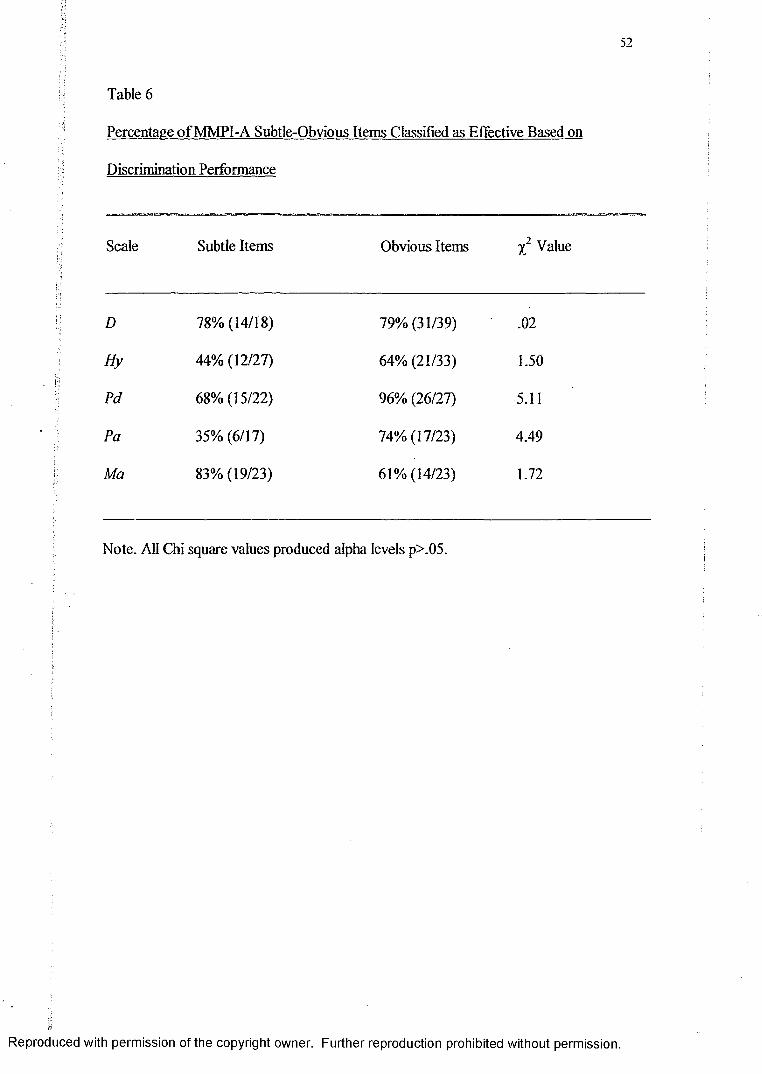
52
Table 6
Percentage o f MMPI-A Subtle-Obvious Items Classified as Effective Based on
Discrimination Performance
Scale Subtle Items Obvious Items X2 Value
D 78% (14/18) 79% (31/39) .02
Hy 44% (12/27) 64% (21/33) 1.50
Pd 68% (15/22) 96% (26/27) 5.11
Pa 35% (6/17) 74% (17/23) 4.49
Ma 83% (19/23) 61% (14/23) 1.72
Note. All Chi square values produced alpha levels p>.05.
i
Reproduced with permission of the copyright owner. Further reproduction prohibited without permission.
53
The second purpose o f this study was to evaluate the frequency of item
effectiveness for the Basic, Content, Supplementary scales, and Harris Lingoes subscales
in relation to two homogeneous diagnostic criterion groups (i.e., depression and conduct
disorder). Results will be examined under the heading of each diagnosis.
Depression sample
The results found for the frequency of effective items produced in comparisons of
the normative and depressed clinical sample for Basic scales are shown in the left hand
side o f Table 7. For the Depression scale, there were no significant differences in
frequency of effective items between the depression sample and the manual clinical
sample for both boys and girls. As shown in the left column o f Table 7, there were only
two scales that demonstrated over 50% effectiveness, Hs and Pd (both results restricted to
girls). Not surprisingly, given its classification as a “non-clinical” scale, M/'performed
the most poorly (7% effective items), with only 3 of 44 items effectively distinguishing
between the normative sample and the depression sample for either gender.
Reproduced with permission of the copyright owner. Further reproduction prohibited without permission.
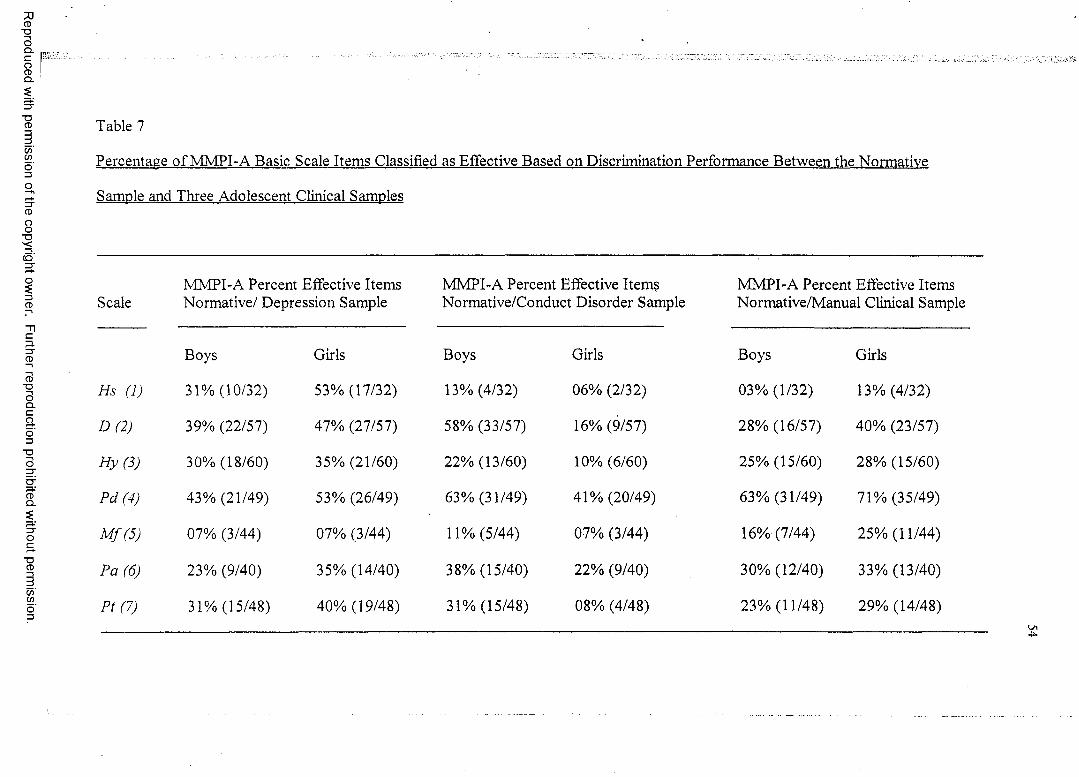
Reproduced
with perm
ission of the
copyright ow
ner. Further
reproduction prohibited
without
permission.
Table 7
Percentage o f MMPI-A Basic Scale Items Classified as Effective Based on Discrimination Performance Between the Normative
Sample and Three Adolescent Clinical Samples
ScaleMMPI-A Percent Effective Items Normative/ Depression Sample
MMPI-A Percent Effective Items Normative/Conduct Disorder Sample
MMPI-A Percent Effective Items Normative/Manual Clinical Sample
Boys Girls Boys Girls Boys Girls
Hs (1) 31% (10/32) 53% (17/32) 13% (4/32) 06% (2/32) 03% (1/32) 13% (4/32)
D (2) 39% (22/57) 47% (27/57) 58% (33/57) 16% (9/57) 28% (16/57) 40% (23/57)
H y(3) 30% (18/60) 35% (21/60) 22% (13/60) 10% (6/60) 25% (15/60) 28% (15/60)
Pd (4) 43% (21/49) 53% (26/49) 63% (31/49) 41% (20/49) 63% (31/49) 71% (35/49)
M f(5) 07% (3/44) 07% (3/44) 11% (5/44) 07% (3/44) 16% (7/44) 25% (11/44)
Pa (6) 23% (9/40) 35% (14/40) 38% (15/40) 22% (9/40) 30% (12/40) 33% (13/40)
Pt (7) 31% (15/48) 40% (19/48) 31% (15/48) 08% (4/48) 23% (11/48) 29% (14/48)
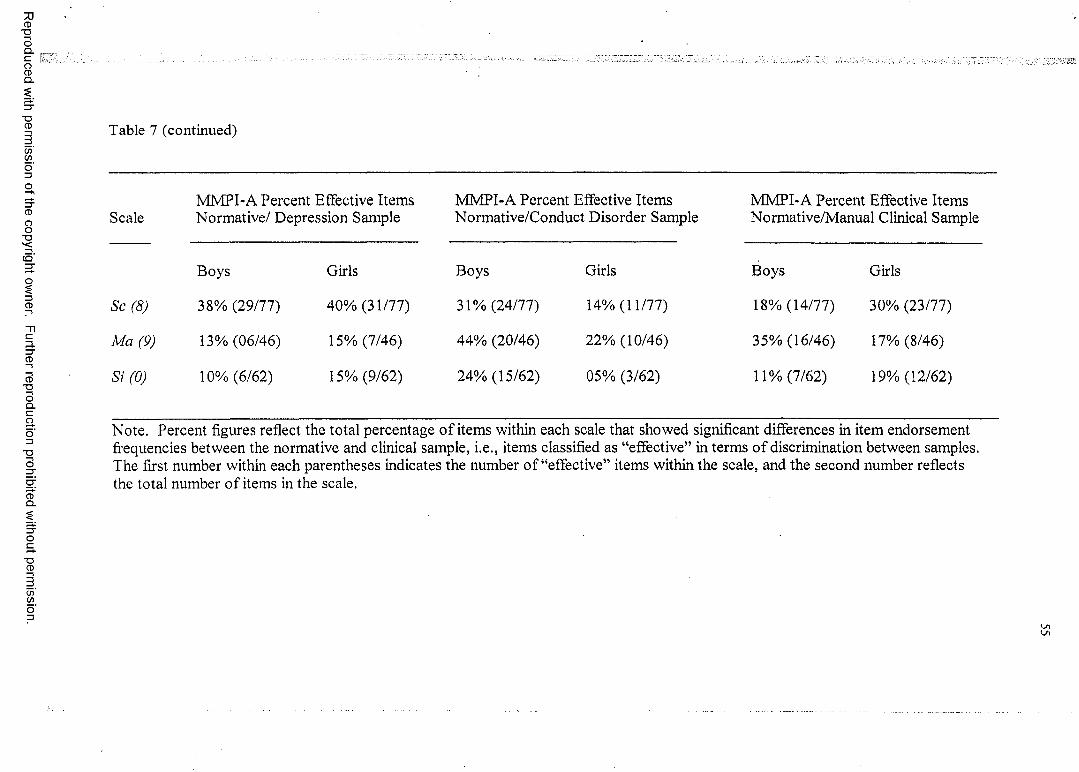
Reproduced
with perm
ission of the
copyright ow
ner. Further
reproduction prohibited
without
permission.
Table 7 (continued)
Scale
Sc (8)
Ma (9)
Si (0)
MMPI-A Percent Effective Items Normative/ Depression Sample
Boys
38% (29/77)
13% (06/46)
10% (6/62)
Girls
40% (31/77)
15% (7/46)
15% (9/62)
MMPI-A Percent Effective Items Normative/Conduct Disorder Sample
Boys
31% (24/77)
44% (20/46)
24% (15/62)
Girls
14% (11/77)
22% (10/46)
05% (3/62)
MMPI-A Percent Effective Items Normative/Manual Clinical Sample
Boys
18% (14/77)
35% (16/46)
11% (7/62)
Girls
30% (23/77)
17% (8/46)
19% (12/62)
Note. Percent figures reflect the total percentage o f items within each scale that showed significant differences in item endorsement frequencies between the normative and clinical sample, i.e., items classified as “effective” in terms o f discrimination between samples. The first number within each parentheses indicates the number o f “effective” items within the scale, and the second number reflects the total number o f items in the scale.
' i
$
56
There were no significant differences in item endorsement frequency between
boys and girls in the normative and the depression sample on any of the 10 scales.
There was a significant difference between the boys depressed group and the boys from
the manual clinical sample for Sc (x2 (1, N = 77) = 6.32, p < .01). There were more
i j items in the depression sample that correctly discriminated between the normative and■ ';■>
: clinical population than for the manual clinical sample. Additionally, on Hs, there was a
h significant difference in the frequency of effective items between the depression groupi;; and the manual clinical sample for both boys (% ( l , N = 3 2 ) ~ 7.02, p < .01) and girls
(X2 ( l , N = 32) = 10.20,p < .01). There were significantly more items that were able to
effectively discriminate between the normative and the depression sample in these
comparisons.
The data related to the item effectiveness found in normative versus the
depression clinical sample for the Content scales is shown in the left hand side o f Table
8. There were no significant differences in item endorsement frequency between boys
and girls in the depression sample and the normative sample for any of the Content
scales, as evaluated by Chi square analyses. The A-dep (Depression) was the only
Content scale that had 50% or more effective items for both boys and girls, however, it
did not differ significantly from the effective item frequency found for the manual
clinical sample. A-ang (Anger) was the only Content scale that showed a significant
difference in frequency o f item effectiveness between the depression group and the
manual clinical sample (only for boys) (x2 (1, N = 17) = 17.17, p < .01). There were
significantly more effective items produced in the comparisons for boys between the
Reproduced with permission of the copyright owner. Further reproduction prohibited without permission.
iiitl
i ? i ' J
57
normative and manual clinical sample, in contrast to the normative-depressed sample
comparisons.
Reproduced with permission of the copyright owner. Further reproduction prohibited without permission.
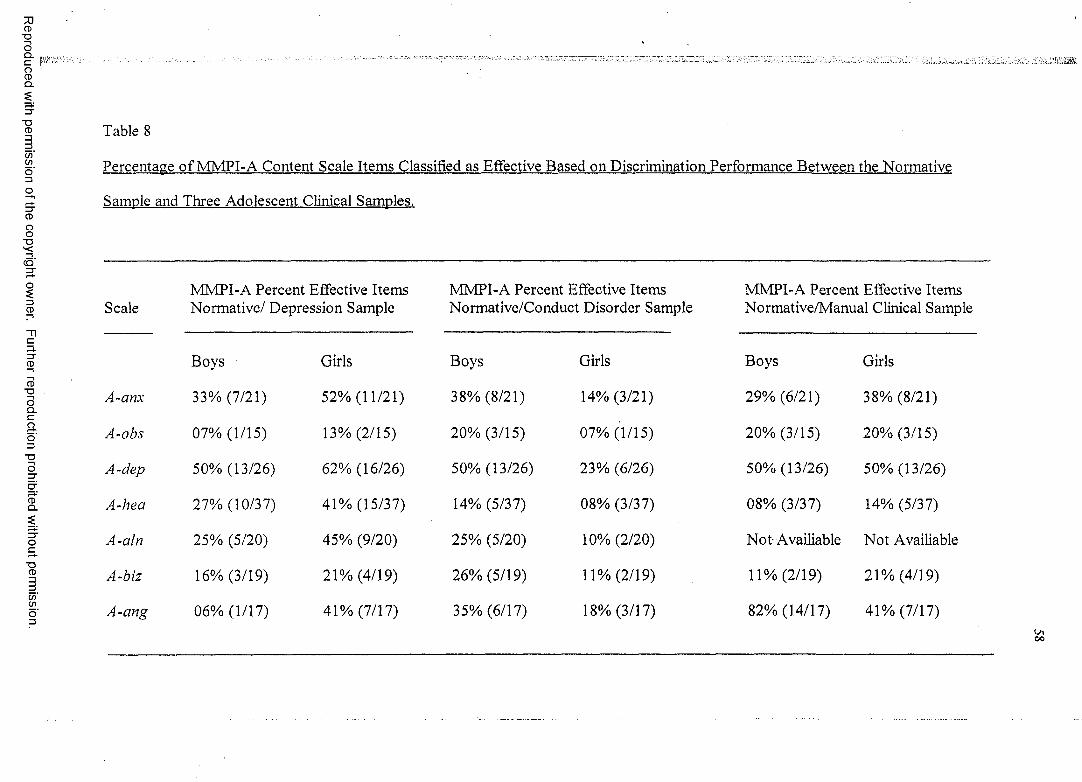
Reproduced
with perm
ission of the
copyright ow
ner. Further
reproduction prohibited
without
permission.
Table 8
Percentage o f MMPI-A Content Scale Items Classified as Effective Based on Discrimination Performance Between the Normative
Sample and Three Adolescent Clinical Samples.
MMPI-A Percent Effective Items MMPI-A Percent Effective Items MMPI-A Percent Effective ItemsScale Normative/ Depression Sample Normative/Conduct Disorder Sample Normative/Manual Clinical Sample
Boys Girls Boys Girls Boys Girls
A-anx 33% (7/21) 52% (11/21) 38% (8/21) 14% (3/21) 29% (6/21) 38% (8/21)
A-obs 07% (1/15) 13% (2/15) 20% (3/15) 07% (1/15) 20% (3/15) 20% (3/15)
A-dep 50% (13/26) 62% (16/26) 50% (13/26) 23% (6/26) 50% (13/26) 50% (13/26)
A-hea 27% (10/37) 41% (15/37) 14% (5/37) 08% (3/37) 08% (3/37) 14% (5/37)
A-aln 25% (5/20) 45% (9/20) 25% (5/20) 10% (2/20) N o t Availiable Not Availiable
A-biz 16% (3/19) 21% (4/19) 26% (5/19) 11% (2/19) 11% (2/19) 21% (4/19)
A-cmg 06% (1/17) 41% (7/17) 35% (6/17) 18% (3/17) 82% (14/17) 41% (7/17)
00
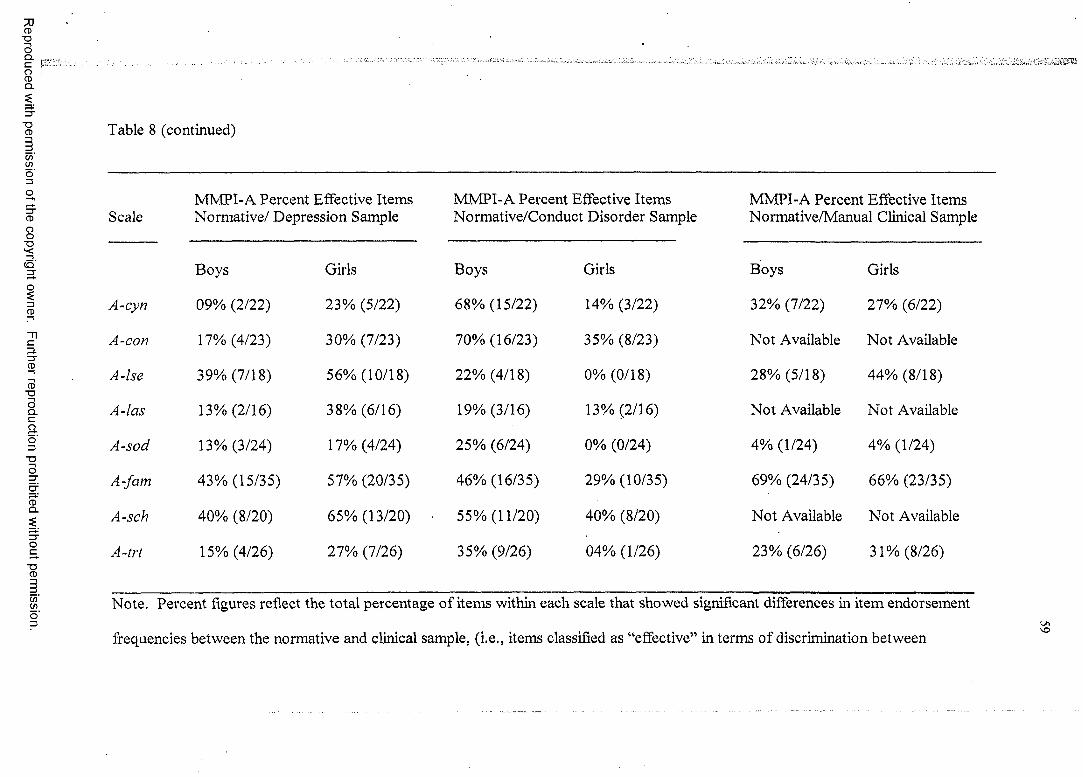
Reproduced
with perm
ission of the
copyright ow
ner. Further
reproduction prohibited
without
permission.
p , .
Table 8 (continued)
MMPI-A Percent Effective Items MMPI-A Percent Effective Items MMPI-A Percent Effective ItemsScale Normative/ Depression Sample Normative/Conduct Disorder Sample Normative/Manual Clinical Sample
Boys Girls Boys Girls Boys Girls
A-cyn 09% (2/22) 23% (5/22) 68% (15/22) 14% (3/22) 32% (7/22) 27% (6/22)
A-con 17% (4/23) 30% (7/23) 70% (16/23) 35% (8/23) Not Available Not Available
A-lse 39% (7/18) 56% (10/18) 22% (4/18) 0% (0/18) 28% (5/18) 44% (8/18)
A-las 13% (2/16) 38% (6/16) 19% (3/16) 13% (2/16) Not Available Not Available
A-sod 13% (3/24) 17% (4/24) 25% (6/24) 0% (0/24) 4% (1/24) 4% (1/24)
A-fam 43% (15/35) 57% (20/35) 46% (16/35) 29% (10/35) 69% (24/35) 66% (23/35)
A-sch 40% (8/20) 65% (13/20) 55% (11/20) 40% (8/20) Not Available Not Available
A-trt 15% (4/26) 27% (7/26) 35% (9/26) 04% (1/26) 23% (6/26) 31% (8/26)
Note. Percent figures reflect the total percentage of items within each scale that showed significant differences in item endorsement
'Ofrequencies between the normative and clinical sample, (i.e., items classified as “effective” in terms of discrimination between
Reproduced
with perm
ission of the
copyright ow
ner. Further
reproduction prohibited
without
permission.
samples). The first number within each parentheses indicates the number o f “effective” items within the scale; the second number
reflects the total number o f items in the scale.
ONO
The results found for the frequency of effective items produced in comparisons of
the normative and depressed clinical sample for Supplementary scales are shown in the
Tleft hand columns o f Table 4. There were no significant gender differences, as evaluated
Iby Chi Square analyses, in item endorsement frequency within the depression group for
■'•Vi
4any o f the Supplementary scales. However, on PRO Supplementary scale, there were
1* * 2 i significant differences in frequency of effective items for both boys (y (1, N= 36) =1‘ 224.51, p < .01) and girls (y (1, N~ 36) = 8.37, p < .01) between the depression group and
the manual clinical sample. In both comparisons, there were higher frequencies o f
effective items in the normative versus the manual clinical sample comparison. There
were also significant differences for boys between the depression group and the manual
clinical sample for MAC-R (%2 (1, N= 49) = 13.31, /? < .01). There was a significantly
higher frequency of effective items in the manual clinical versus normative sample
? comparison, in contrast to the depression versus normative sample comparison.
The findings generated by the comparisons o f frequency of effective items in the
normative versus depressed sample for the Harris Lingoes subscales are shown in the left
columns o f Table 5. There were no significant gender differences in the frequency of
effective items for the depression group versus the normative sample comparisons on any
o f the Harris Lingoes subscales. There was a significant difference between the
depression group and the manual clinical sample in frequency o f item effectiveness for
girls on Hy4 (%2 (I, N= 17) = 6.94,/? < .01). There were more effective items in
normative sample versus the depression sample comparisons than were found for
comparisons between manual clinical and normative samples.
Reproduced with permission of the copyright owner. Further reproduction prohibited without permission.
62
Conduct Disorder sample
The frequency o f effective items found in normative versus conduct disorder
sample comparisons for the Basic scales is shown in the middle columns o f Table 7.
There were significant differences in item endorsement frequency between boys and girls
on 3 of the 10 scales, D (*2 (1, N= 57) = 19.94, p < .01), Pt (*2 (1, N= 48) = 6.65, p <
.01), and Si (x2 (1, N= 46) = 7.86, p < .01). Specifically, on all three scales, the
frequency of occurrence of items that effectively discriminated between normative and
conduct disorder samples was higher for boys than girls.
There were significant differences in frequency of effective items on D between
the conduct disorder sample and the manual clinical sample for both boys (x2 (1, N= 57)
~ 9.16,p < .01) and girls (x2 (1, N= 57) = 7.34, p < .01), however these differences were
in opposite directions. Comparisons between the normative and conduct disorder samples
for boys show a significantly higher frequency o f effective items than comparisons for
the normative and the manual clinical samples. Comparisons between the normative and
manual clinical samples for girls show a significantly higher frequency o f effective items
than comparisons for the normative and the conduct disorder samples. There was also a
significant difference in frequency o f effective items on scale Pd for girls, between the
conduct disorder sample and the manual clinical sample (x2 (1, N - 49) = 8.12,p < .01).
There were more effective items in the manual clinical sample versus the normative
sample comparisons than were found between the conduct disorder and the normative
sample comparisons.
The frequency o f effective items found in normative versus conduct disorder
sample comparisons for the Content scales is shown in the middle column o f Table 8.
Reproduced with permission of the copyright owner. Further reproduction prohibited without permission.
There were significant differences in the frequency o f effective items found for
comparisons between boys and girls on A-cyn (x (1, N - 22) = 11.37, p < .01) and A-trt
(X2 (1, 26) = 6.06, p < .01). The frequency o f effective items produced by
comparisons of the normative and the conduct disorder clinical sample was higher for
boys than for girls on both A-cyn and A-trt. There were also significant differences in the
frequency o f effective items between the girls in the conduct disorder sample and girls in
the manual clinical sample for A-lse {'i (1, N= 18) = 7.87, p < .01) and A-fam (x2 (1, N=
35) = 8.25, p < .01). There were more effective items in the manual clinical sample
versus the normative sample comparisons than were found for comparisons between the
conduct disorder and the normative samples.
The frequency of effective items found in normative versus conduct disorder
sample comparisons for the Supplementary scales is shown in the middle column of
Table 4. There was a significant gender difference in the frequency o f effective items for
the Welsh’s Anxiety (A) scale (x2 (1, W= 35) = 6.90, p < .01). Boys showed a higher
frequency o f items that effectively discriminated between normative and conduct disorder
samples than girls. There was also a significant difference for the PRO scale between the
frequency o f effective items produced in comparisons o f the normative sample and the
conduct disorder sample, versus the normative sample and manual clinical sample. This
difference was significant for both boys (x2 (1,7/= 36) = 11.08, p < .01) and girls (x2
(1, N= 36) = 15.68, p < .01). A significantly higher frequency o f effective items was
produced by the normative-manual clinical sample comparisons (in contrast to the
normative-conduct disorder clinical sample).
tiiReproduced with permission of the copyright owner. Further reproduction prohibited without permission.

:; ; i-}S
64
The frequency of effective items found in normative versus conduct disorder
sample comparisons for the Harris Lingoes subscales is shown in the middle column of
Table 5. There were no significant gender differences in the frequency of occurrence of
items that effectively discriminated between the normative and conduct disorder samples.
When comparing the frequency of effective items between the conduct disorder sample
and the manual clinical sample, there were no significant differences for both genders.
The third purpose of this study was to evaluate the predictive accuracy of revised
MMPI-A Basic scales, constructed by deleting ineffective items from scale membership
and recalculating gender specific Uniform T-scores for raw score values produced by the
revised and shortened scales on an independent clinical sample. Items were considered
ineffective, and subsequently removed from the scales, if they met the “ineffective”
criteria (Z score absolute value o f < 2) for the manual clinical sample and an independent
sample used in Archer et al. (2001). Scales 2,4, and 9 were required to meet additional
criteria in that they also had to be ineffective for the homogeneous criterion group that
corresponds to the scale (i.e., scale 2- Depression; scales 4 and 9, Conduct Disorder).
Table 9 presents the list o f deleted items and their scale membership. Additionally, Table
10 presents MMPI-A validity and Basic scale item totals for the original and revised
scales. MANOVAs were also performed separately by gender and both were found to be
significant at the .01 level (Girls: F (8, 137) = 5.14, p < .001 and Boys: F (8 , 171) = 2.72,
p < .01). ANOVAs were performed separately for each scale by gender to assess for
significance o f difference between the standard and revised scales. For girls, all eight
scales showed a significant difference (p<-01) between standard and revised scales (see
Reproduced with permission of the copyright owner. Further reproduction prohibited without permission.
3
U
I
S
■ )
Table 11). For boys, five o f the eight scales showed a significant difference (p<01)
between standard and revised scales (see Table 12).
i iReproduced with permission of the copyright owner. Further reproduction prohibited without permission.
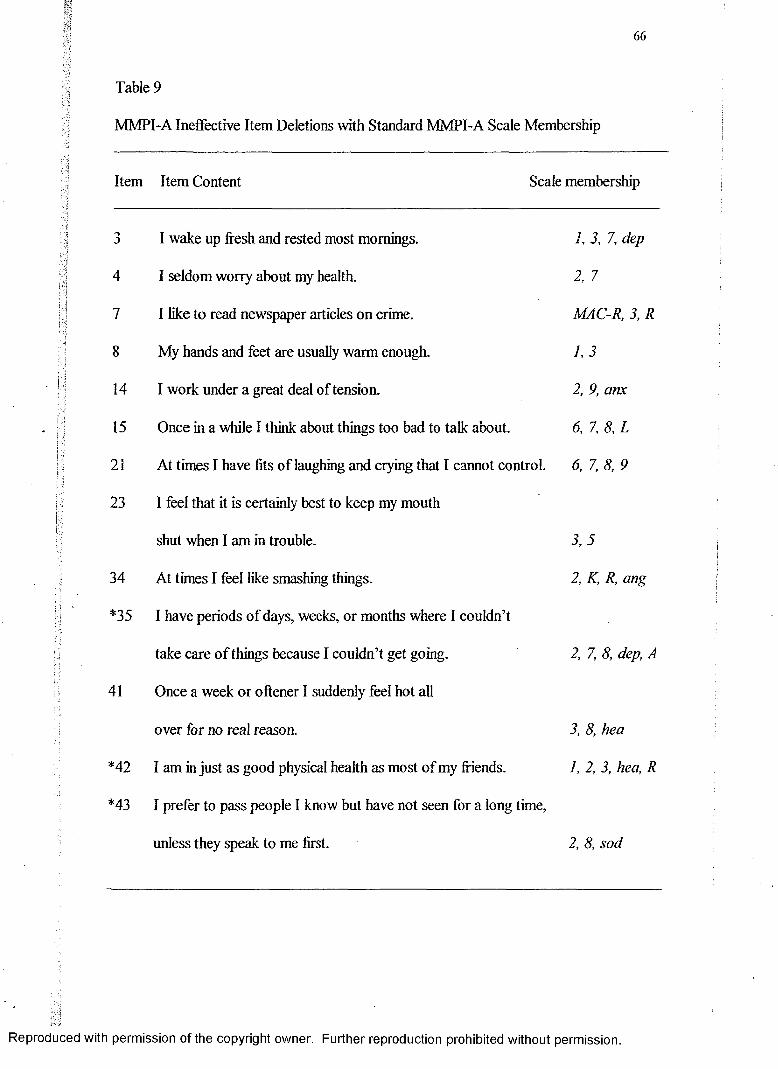
66"Vi ; .v7; .:t
'f'i
I
tl
■i
Table 9
MMPI-A Ineffective Item Deletions with Standard MMPI-A Scale Membership
Item Item Content Scale membership
3 I wake up fresh and rested most mornings. 1, 3, 7, dep
4 I seldom worry about my health. 2, 7
7 I like to read newspaper articles on crime. MAC-R, 3, R
8 My hands and feet are usually warm enough. 1,3
14 I work under a great deal of tension. 2, 9, anx
15 Once in a while I think about things too bad to talk about. 6, 7, 8, L
21 At times I have fits o f laughing and crying that I cannot control. 6, 7, 8, 9
23 I feel that it is certainly best to keep my mouth
shut when I am in trouble. 3 ,5
34 At times I feel like smashing things. 2, K, R, ang
*35 I have periods o f days, weeks, or months where I couldn’t
take care o f things because I couldn’t get going. 2, 7, 8, dep, A
41 Once a week or oftener I suddenly feel hot all
over for no real reason. 3, 8, hea
*42 I am in just as good physical health as most o f my friends. 1, 2, 3, hea, R
*43 I prefer to pass people I know but have not seen for a long time,
unless they speak to me first. 2, 8, sod
Reproduced with permission of the copyright owner. Further reproduction prohibited without permission.

Table 9 (Continued)
Item Item Content Scale membership
44 I am almost never bothered by pains over my heart or in my chest. I, 3, hea
45 Most anytime I would rather sit and daydream
than do anything else. 8 ,1 MM
46 I am a very sociable person. 2, 0, sod,
MAC-R
47 I have often had to take orders from someone who did not
know as much as I did. 9, cyn
50 Parts of my body often feel like they are burning, tingling,
or “going to sleep.” 1, hea
52 I sometimes keep on at a thing until others lose
their patience with me. 2, 9, obs
58 I am an important person. 9, Ise
67 I am easily downed in an argument. 4, 0, Ise
77 I think most people would lie to get ahead. 3, 6, cyn
81 At times I have a strong urge to do something harmful or shocking. 8, 9, ACK
85 My hardest battles are within myself. 4, 7
93 There seems to be a fullness in my head or nose most o f the time. 1, hea
96 I have never done anything dangerous for the thrill o f it. 6, 9, 0, con
Reproduced with permission of the copyright owner. Further reproduction prohibited without permission.
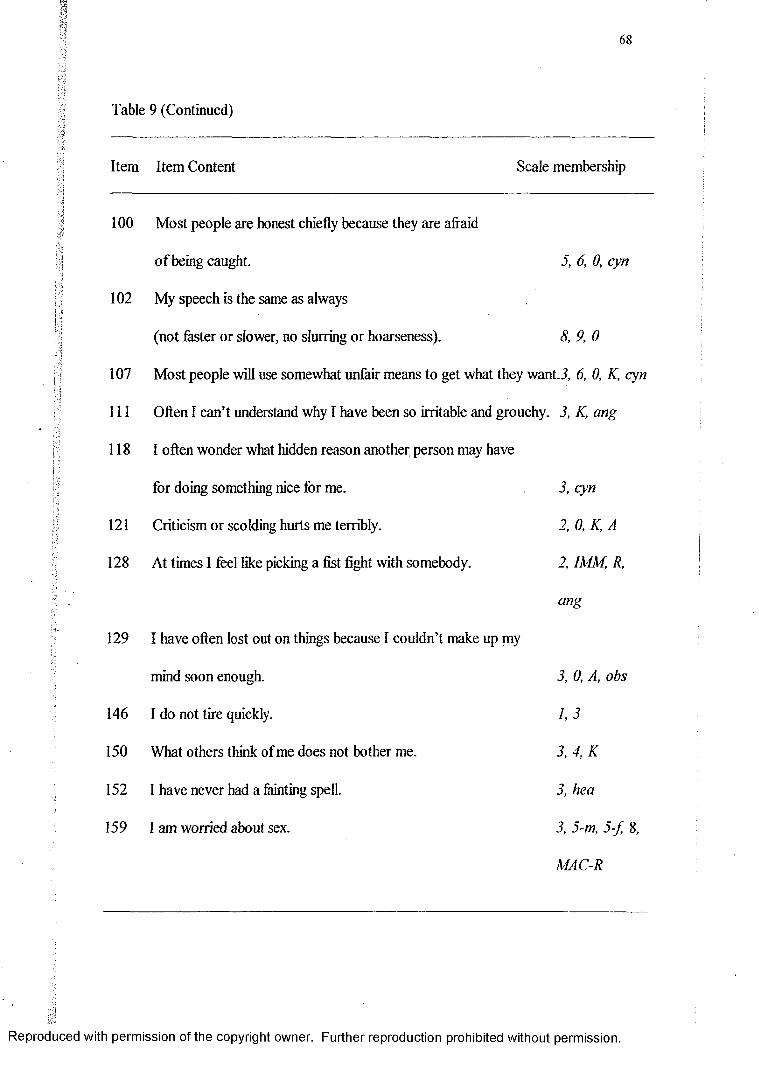
;V
:<-/S
Table 9 (Continued)
Item Item Content Scale membership
100 Most people are honest chiefly because they are afraid
o f being caught. 5, 6, 0, cyn
102 My speech is the same as always
(not faster or slower, no slurring or hoarseness). 8, 9, 0
107 Most people will use somewhat unfair means to get what they want.3, 6, 0, K, cyn
111 Often I can’t understand why I have been so irritable and grouchy. 3, K, ang
118 I often wonder what hidden reason another person may have
for doing something nice for me. 3, cyn
121 Criticism or scolding hurts me terribly. 2, 0, K, A
128 At times I feel like picking a fist fight with somebody. 2, IMM, R,
ang
129 I have often lost out on things because I couldn’t make up my
mind soon enough. 3, 0, A, obs
146 I do not tire quickly. 1,3
150 What others think of me does not bother me. 3, 4, K
152 I have never had a fainting spell. 3, hea
159 1 am worried about sex. 3, 5-m, 5-fr 8,
MAC-R
Reproduced with permission of the copyright owner. Further reproduction prohibited without permission.
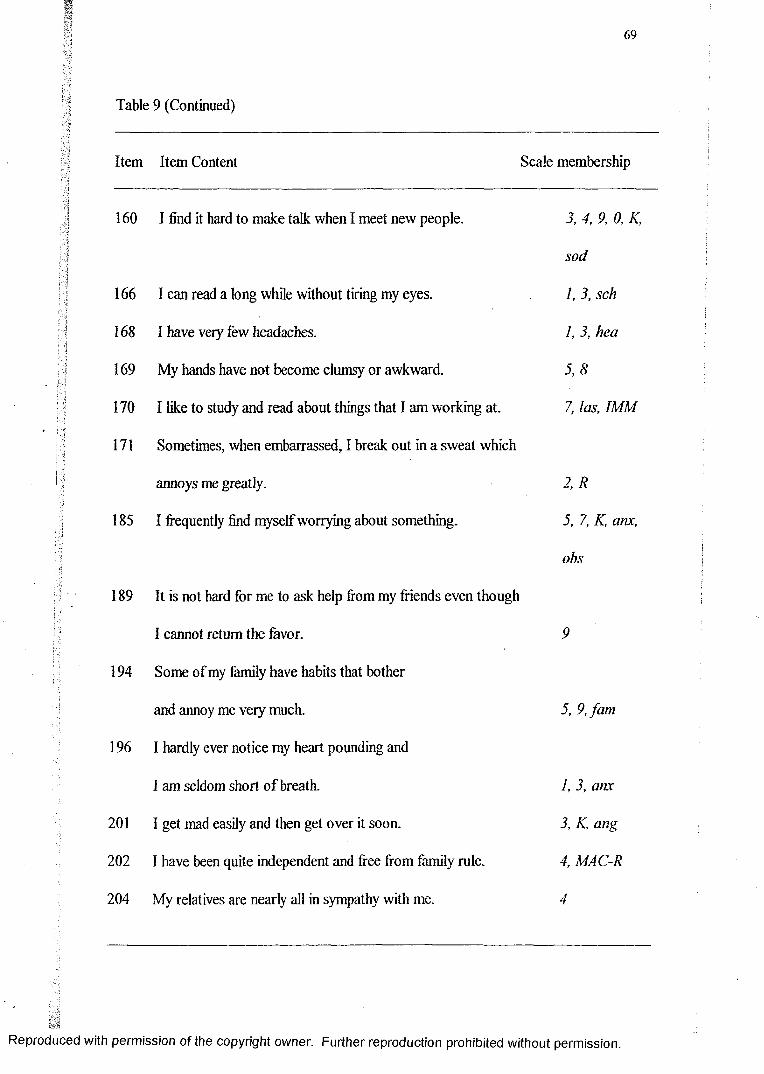
69
•1
Table 9 (Continued)
k|
I-
Item Item Content Scale membership
160 I find it hard to make talk when I meet new people. 3, 4, 9, 0, K,
sod
166 I can read a long while without tiring my eyes. 1, 3, sch
168 I have veiy few headaches. 1, 3, hea
169 My hands have not become clumsy or awkward. 5 ,8
170 I like to study and read about things that I am working at. 7, las, IMM
171 Sometimes, when embarrassed, I break out in a sweat which
annoys me greatly. 2 ,R
185 I frequently find myself worrying about something. 5, 7, K, anx,
obs
189 It is not hard for me to ask help from my friends even though
I cannot return the favor. 9
194 Some of my family have habits that bother
and annoy me veiy much. 5, 9,fam
196 I hardly ever notice my heart pounding and
I am seldom short o f breath. 1, 3, anx
201 I get mad easily and then get over it soon. 3, K, ang
202 I have been quite independent and free from family rule. 4, MAC-R
204 My relatives are nearly all in sympathy with me. 4
Reproduced with permission of the copyright owner. Further reproduction prohibited without permission.
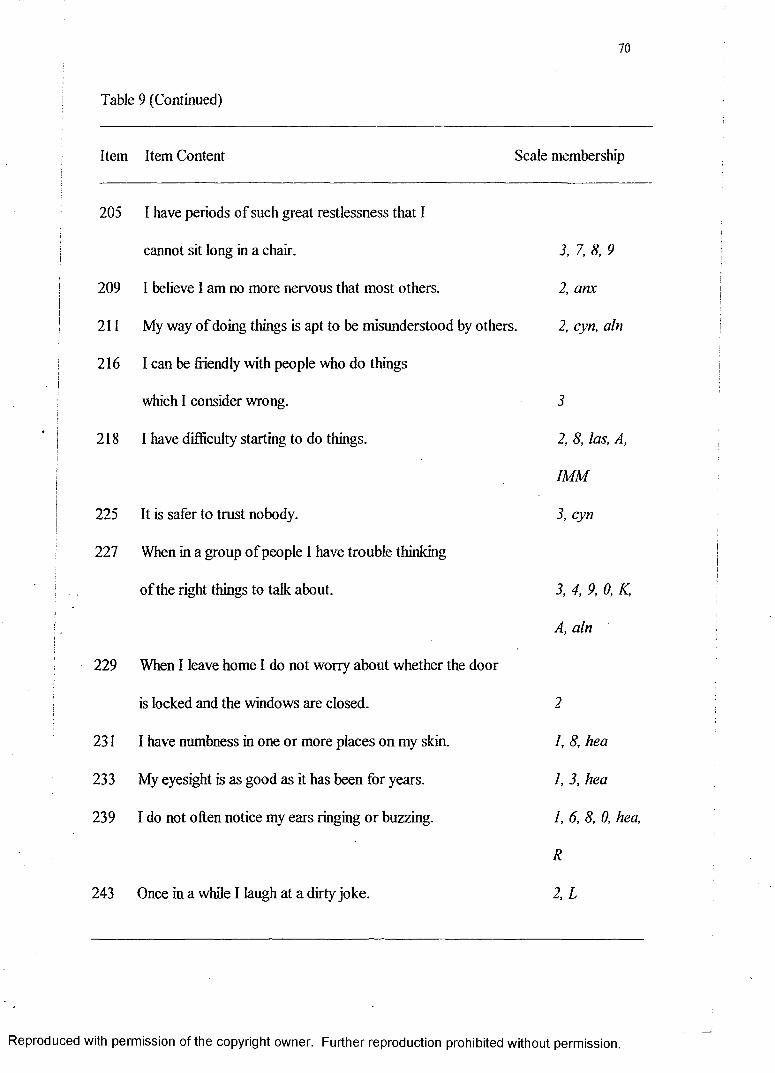
70
Table 9 (Continued)
Item Item Content Scale membership
205 I have periods of such great restlessness that I
cannot sit long in a chair. 3, 7, 8, 9
209 I believe I am no more nervous that most others. 2, anx
211 My way o f doing things is apt to be misunderstood by others. 2, cyn, aln
216 I can be friendly with people who do things
which I consider wrong. 3
218 I have difficulty starting to do things. 2, 8, las, A,
IMM
225 It is safer to trust nobody. 3, cyn
227 When in a group o f people I have trouble thinking
of the right things to talk about. 3, 4, 9, 0, K,
A, aln
229 When I leave home I do not worry about whether the door
is locked and the windows are closed. 2
231 I have numbness in one or more places on my skin. I, 8, hea
233 My eyesight is as good as it has been for years. I, 3, hea
239 I do not often notice my ears ringing or buzzing. 1, 6, 8, 0, hea,
R
243 Once in a while I laugh at a dirty joke. 2, L
Reproduced with permission of the copyright owner. Further reproduction prohibited without permission.
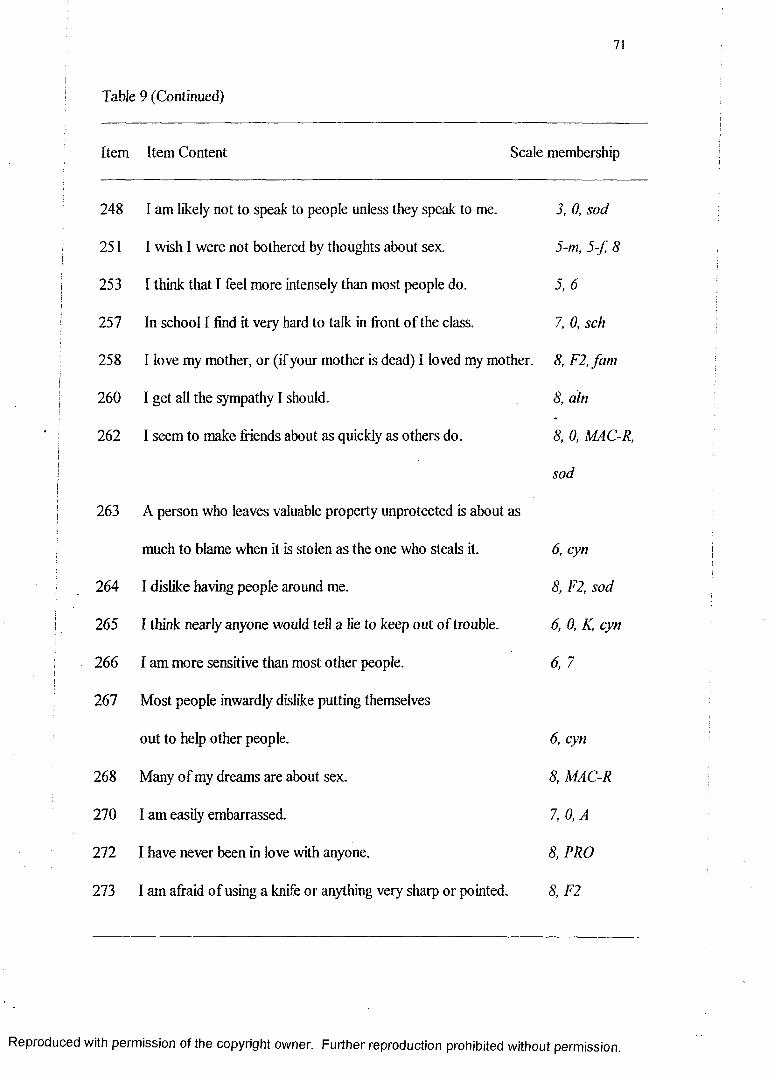
71
Table 9 (Continued)
Item Item Content Scale membership
248 I am likely not to speak to people unless they speak to me. 3, 0, sod
251 I wish I were not bothered by thoughts about sex. 5-m, 5 -f 8
253 I think that I feel more intensely than most people do. 5, 6
257 In school I find it very hard to talk in front of the class. 7, 0, sch
258 I love my mother, or (if your mother is dead) I loved my mother. 8, F2, fam
260 I get all the sympathy I should. 8, aln
262 I seem to make friends about as quickly as others do. 8, 0, MAC-R,
sod
263 A person who leaves valuable property unprotected is about as
much to blame when it is stolen as the one who steals it. 6, cyn
264 I dislike having people around me. 8, F2, sod
265 I think nearly anyone would tell a lie to keep out of trouble. 6, 0, K, cyn
266 I am more sensitive than most other people. 6, 7
267 Most people inwardly dislike putting themselves
out to help other people. 6, cyn
268 Many of my dreams are about sex. 8, MAC-R
270 I am easily embarrassed. 7, 0,A
272 I have never been in love with anyone. 8, PRO
273 I am afraid o f using a knife or anything very sharp or pointed. 8, F2
Reproduced with permission of the copyright owner. Further reproduction prohibited without permission.
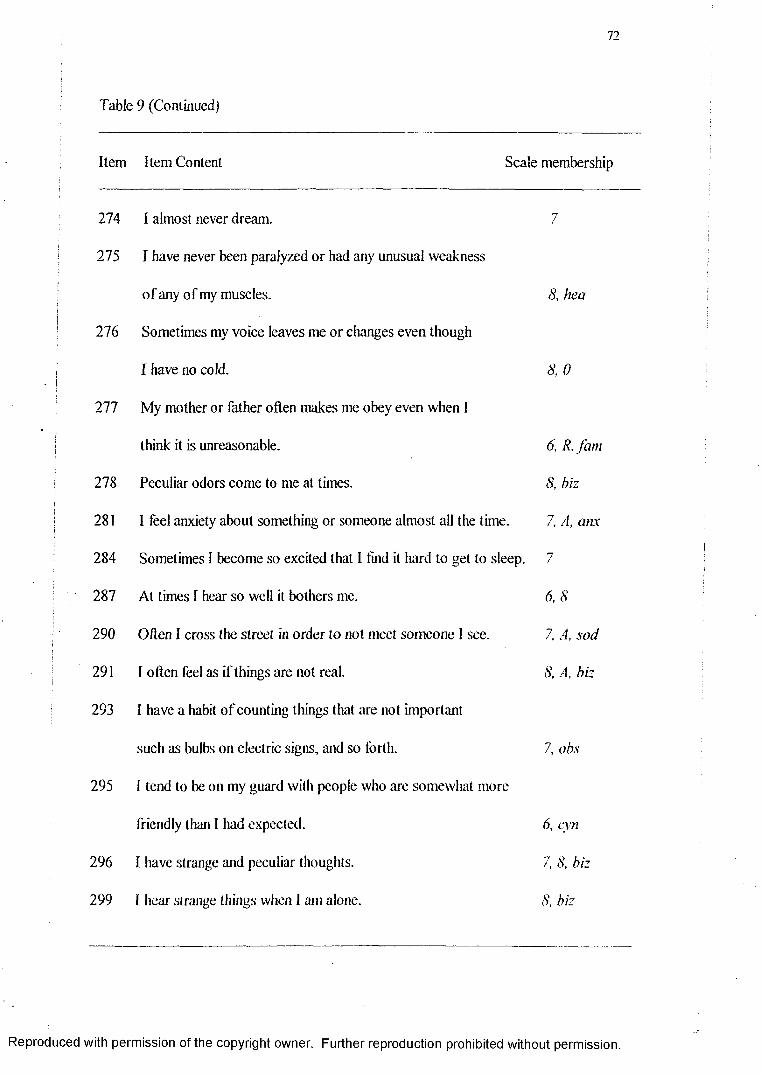
72
Table 9 (Continued)
Item Item Content Scale membership
274 I almost never dream. 7
275 I have never been paralyzed or had any unusual weakness
of any of my muscles. 8, hea
276 Sometimes my voice leaves me or changes even though
I have no cold. 8, 0
277 My mother or father often makes me obey even when 1
think it is unreasonable. 6, R, jam
278 Peculiar odors come to me at times. 8, biz
281 I feel anxiety about something or someone almost all the time. 7, A, anx
284 Sometimes I become so excited that I find it hard to get to sleep. 7
287 At times I hear so well it bothers me. 6, 8
290 Often I cross the street in order to not meet someone 1 see. 7, A, sod
291 I often feel as if things are not real. 8, A, biz
293 I have a habit o f counting things that are not important
such as bulbs on electric signs, and so forth. 7. obs
295 I tend to be on my guard with people who are somewhat more
friendly than I had expected. 6, cyn
296 1 have strange and peculiar thoughts. 7. 8, biz
299 I hear strange things when 1 am alone. 8, biz
Reproduced with permission of the copyright owner. Further reproduction prohibited without permission.

73
Table 9 (Continued)
Item Item Content Scale membership
300 I have been afraid o f things or people that
I knew could not hurt me. 7,8
301 I have no dread of going into a room by myself where
other people have already gathered and are talking. 7,0
303 Sometimes I enjoy hurting the persons I love. 8, F2,fam
307 Bad words, often terrible words, come into my mind
and I cannot get rid of them. 7, IMM, obs
308 Sometimes some unimportant thought will run through my
mind and bother me for days. 7, 0, A, obs
309 Almost everyday something happens to frighten me. 7, 8, F2
310 I usually have to stop and think before I act in even small matters. 7, A, obs
311 I am inclined to take things hard. 7, dep
315 Someone has control over my mind. 6, F2, biz
332 At one or more times in my life I felt that someone was making
me do things by hypnotizing me. 6, 8, F2, biz
Note. Items with an asterisk next to them were dropped on all listed scales except scale 2. The item was able to distinguish between the normative sample and the homogenous depression sample on all other listed scales except scale 2. Therefore, these items were not completely dropped from the test.
Reproduced with permission of the copyright owner. Further reproduction prohibited without permission.
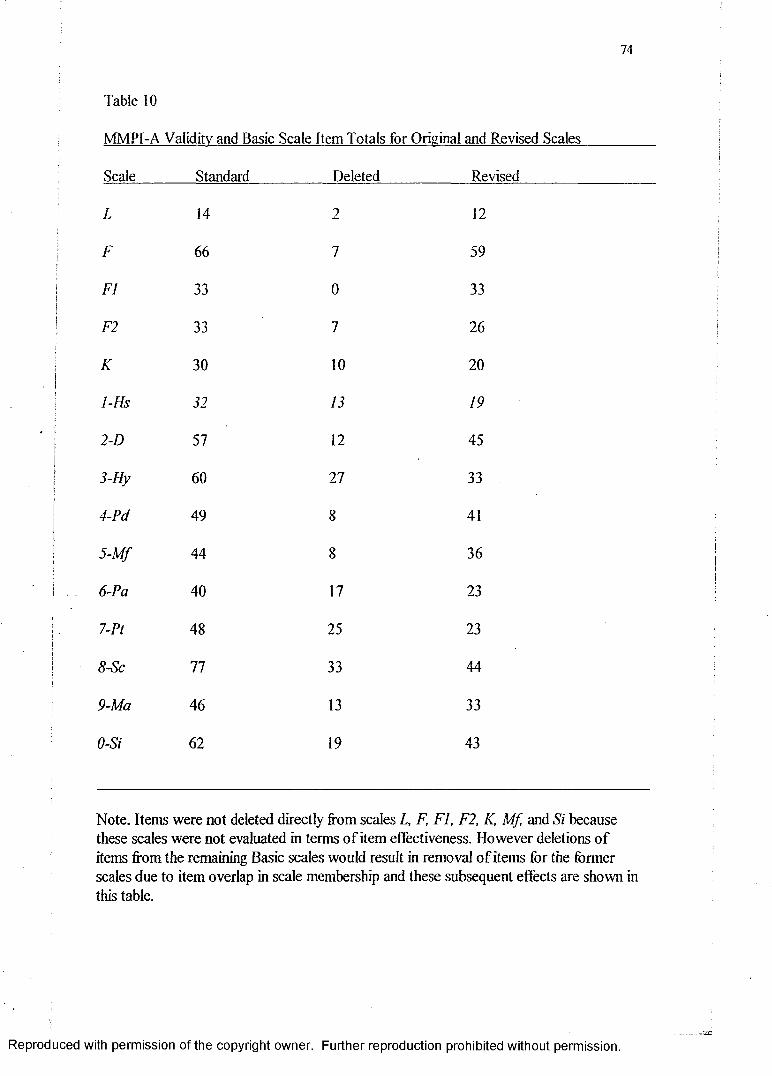
74
Table 10
MMPI-A Validity and Basic Scale Item Totals for Original and Revised Scales
Scale Standard Deleted Revised
L 14 2 12
F 66 7 59
FI 33 0 33
F2 33 7 26
K 30 10 20
1-Hs 32 13 19
2-D 57 12 45
3-Hy 60 27 33
4-Pd 49 8 41
5-M f 44 8 36
6-Pa 40 17 23
7-Pt 48 25 23
8-Sc 77 33 44
9-Ma 46 13 33
0-Si 62 19 43
Note. Items were not deleted directly from scales L, F, FI, F2, K, Mf, and Si because these scales were not evaluated in terms o f item effectiveness. However deletions o f items from the remaining Basic scales would result in removal o f items for the former scales due to item overlap in scale membership and these subsequent effects are shown in this table.
Reproduced with permission of the copyright owner. Further reproduction prohibited without permission.— 332
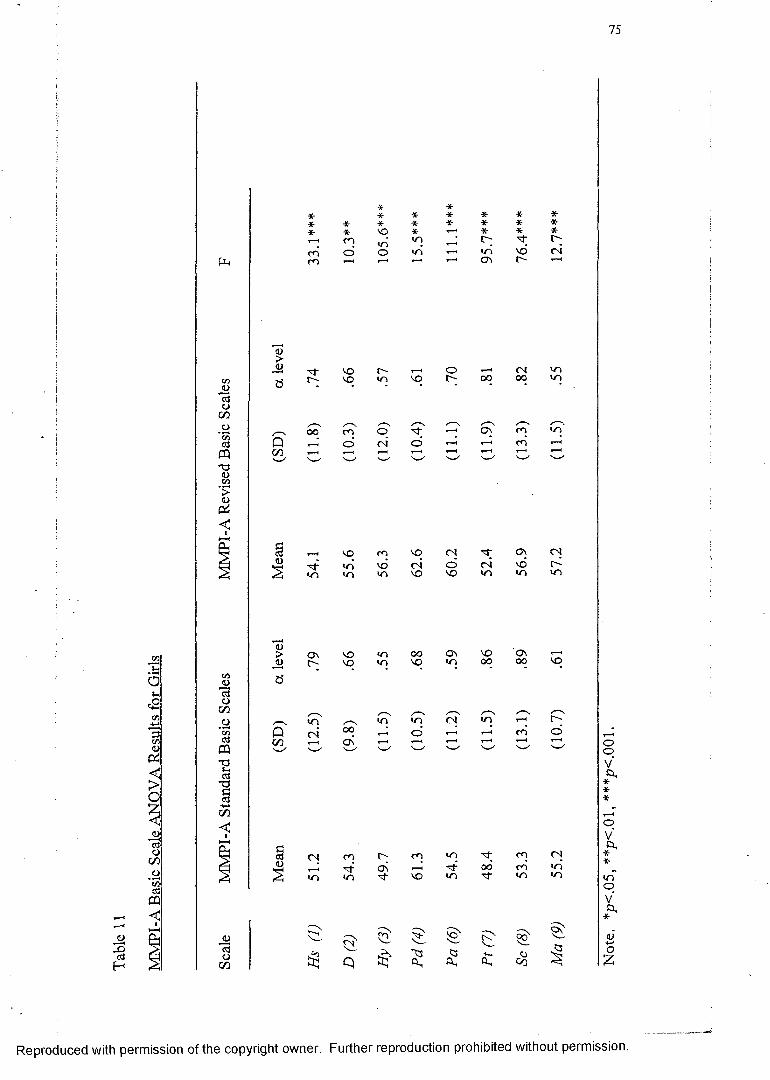
MM
PI-A
Ba
sic
Scale
AN
OVA
Res
ults
for
G
irls
75
Reproduced with permission of the copyright owner. Further reproduction prohibited without permission.
Not
e.
*p<.
05,
**p<
.01,
***
p<.0
01.
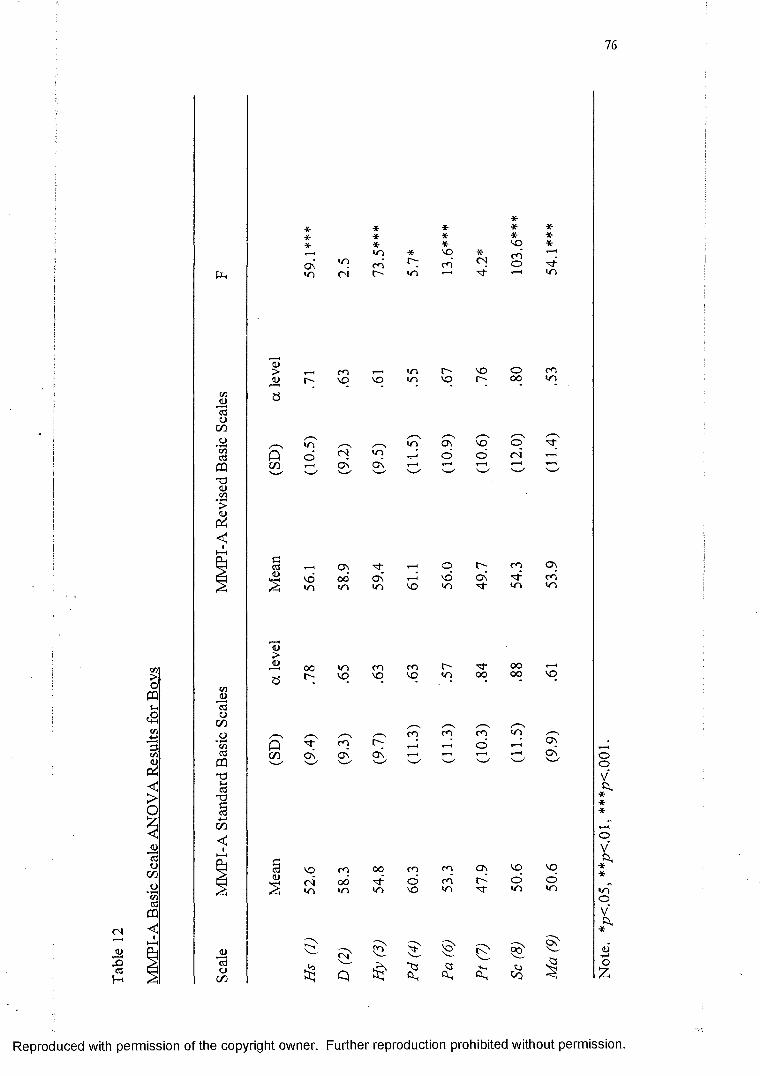
76
X>03H
w>OCPIh<2oCO<0
<>o
ij”55oc/3
PC/3
ac3«
< u><l>
PC/3
1)
* * *- * *•* * * * ** * *- no *r—* yn * vq * c*"i T—HON in co r*; rn CN O
oi r- in T“* 1 in
(L)
<u r-
t oo
vot o
oor ~
O n
coVO
CNO n
inVO
COON
VOt oin
inO n
t"VO
ONo
VOr-
voo
COVO
ON
COVO
r-00
COo
ooo
oCN
COto
O) tj- «-« o m ON0 0 C \ v d ON 1̂- c nin in VO <n t n in
oooo
to
VO
ONON
NO cO o o CO CO O n VO VO
o j 0 0 o CO o o '«/N i n i n VO i n ■*r t o t o
$ $ $ F >O n
p $<3 o
C o
Reproduced with permission of the copyright owner. Further reproduction prohibited without permission.
Not
e.
*p<.
05,
**fK
.01,
***
/?<.
001
.
77
Table 13 shows the percentages for hit rate, sensitivity, specificity, positive
predictive power and negative predictive power are given for boys and girls at
two different cut-off scores for the standard and revised Basic scales. The revised
scales demonstrated an increase in hit rate, sensitivity, specificity, positive
predictive power and negative predictive power (see Table 13). Further, thei
| overall prediction accuracy found for both the standard and revised scales wasi
! consistently higher for predictions based on the T > 6 5 criterion in contrast to the
T > 60 criterion. Specifically, using the T > 65, all classification indices increased
iI (i.e., the ability o f the Basic scales to correctly identify clinical respondents andii| normal respondents increased when the clinical designation was set at T > 65).)
] Specifically, there was a decrease in sensitivity for the revised scales for boys,
and a decrease in specificity in the revised scales for females. However, as
expected, sensitivity was generally lower than specificity for a cut-off o f T > 65,
and sensitivity was generally higher than specificity for a cut off o f T> 60.
I!!
Reproduced with permission of the copyright owner. Further reproduction prohibited without permission.
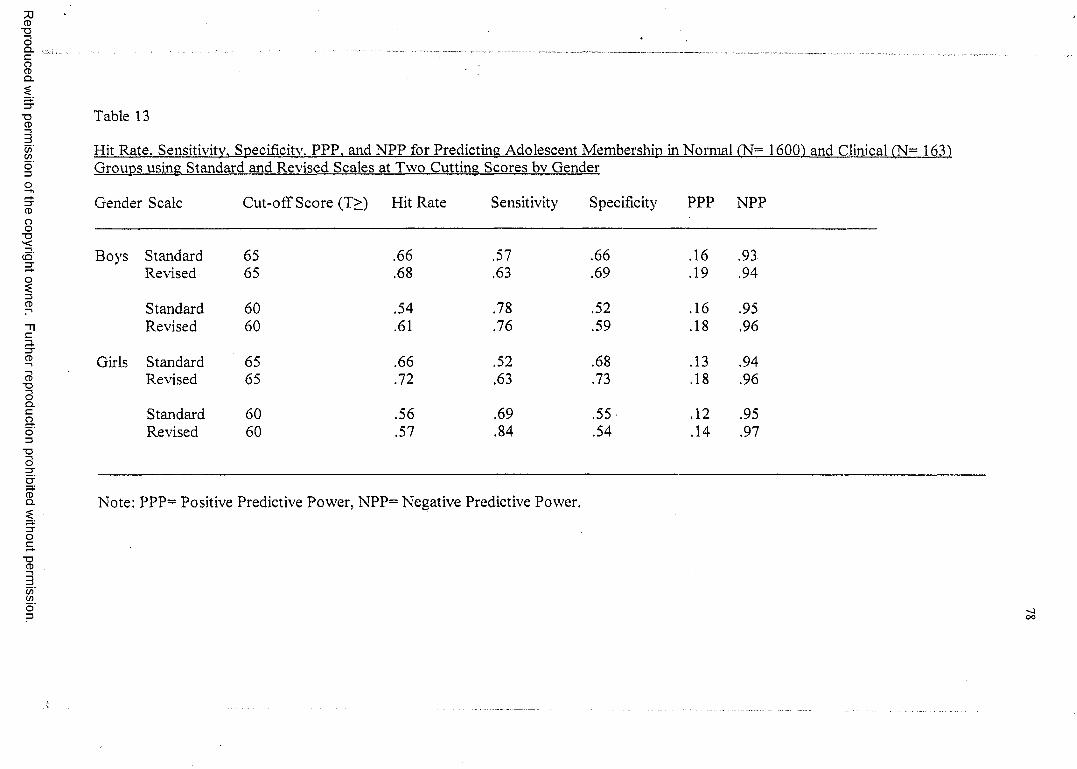
Reproduced
with perm
ission of the
copyright ow
ner. Further
reproduction prohibited
without
permission.
Table 13
Hit Rate. Sensitivity. Specificity. PPP. and NPP for Predicting Adolescent Membership in Normal fN~ 16001 and Clinical (N= 1631 Groups using Standard and Revised Scales at Two Cutting Scores bv Gender
Gender Scale Cut-off Score (T>) Hit Rate Sensitivity Specificity PPP NPP
Standard 65 .66 .57 .66 .16 .93Revised 65 .68 .63 .69 .19 .94
Standard 60 .54 .78 .52 .16 .95Revised 60 .61 .76 .59 .18 .96
Standard 65 .66 .52 .68 .13 .94Revised 65 .72 .63 .73 .18 .96
Standard 60 .56 .69 .55- .12 .95Revised 60 .57 .84 .54 .14 .97
Note: PPP= Positive Predictive Power, NPP= Negative Predictive Power.
OO
79
I CHAPTER IV
DISCUSSION
: The discussion of findings will be organized into three sections, corresponding!
with the three primary objectives o f the study. The first objective o f this study was to
j extend Archer, Handel, and Lynch’s (2001) investigation of item effectiveness within thej
| MMPI-A Basic and Content scales to item-effectiveness evaluations for the!t{
j Supplementary scales, Harris Lingoes subscales, and subtle versus obvious items. The
i' purpose o f this extension was to evaluate if there was an increase in the frequency of
i occurrence o f effective items in scales and subscales that were more homogeneous than
the Basic clinical scales, in terms of item content. It was hypothesized that this research
extension o f Archer et aL’s (2001) study to include additional MMPI-A scales and
subscales would not significantly effect the frequency of effective items in contrast to
those frequencies established for the Basic and Content Scales.
In terms of supplementary scale findings, using the manual clinical sample as the
criterion group, the three substance abuse scales {MAC-R, ACK, and PRO) demonstrated
a relatively high frequency of effective items, ranging from 62% of the item composition
for the ACK scale (for both boys and girls) to 94% o f the item composition for the PRO
scale (for boys). While these findings are impressive, results are also consistent with the
observation that o f the 420 boys and 293 girls included in the manual clinical sample, 299
o f those boys and 163 of those girls were evaluated in inpatient alcohol and drug
treatment facilities (Butcher et al., 1992). Additionally, higher scores on the substance
abuse scales may have been a product o f the process by which these MMPI-A scales
were developed. The MAC-R scale was derived from the MAC scale on the original form
Reproduced with permission of the copyright owner. Further reproduction prohibited without permission.
80
o f the MMPI by contrasting the item responses from 300 adult male alcoholics with 300
adult male psychiatric patients (MacAndrew, 1965). The items that showed the greatest
difference between the substance abusing group and the psychiatric group were selected
for scale membership. Forty-five of the forty-nine items from MAC were retained for the
MMPI-A, and four new items were added to the scale (Butcher et al., 1992). The PRO
scale was developed for the MMPI-A in a similar fashion to the MAC scale. PRO scale
items were empirically selected based on item endorsement differences found between
adolescents in alcohol and drug treatment programs and adolescents receiving inpatient
psychiatric services (Weed, Butcher, & Williams, 1994). These adolescents in the alcohol
and drug treatment settings were the same adolescents used to develop the clinical sample
data reported in the MMPI-A manual and used in our study as one o f the primary clinical
groups to evaluate item effectiveness. Because the clinical group used to create the PRO
scale heavily overlapped with the clinical group we used to determine item effectiveness,
it would be expected that the PRO scale would have the highest percentage o f effective
items for boys (94%) and girls (89%). However, previous research has also shown that
the MMPI-A substance abuse scales are effective with independent substance abuse
samples. Michucci (2002), for example, was able to accurately classify approximately
90% of substance abuse cases on at least one o f the scales. Gantner, Graham, and Archer
(1992) examined three different samples (residential substance abusers, psychiatric
inpatients, and high school students) and results indicated that the highest degree of
discrimination on the MAC scale occurred between substance abusing adolescents and
normal adolescents. Additionally, other studies have found positive correlations between
the substance abuse scales and therapist ratings o f adolescents substance-abusing
Reproduced with permission of the copyright owner. Further reproduction prohibited without permission.
81
behaviors (Gallucci, 1997a). These findings, in conjunction with numerous other studies,
support the utility of the MMPI-A substance abuse scales (e.g., Aharoni, 1999; Gallucci,
1997b; Gantner, Graham & Archer, 1992; Stein & Graham, 2001; Walfish, Massey, &
Krone, 1990; Weed, Butcher, & Williams, 1994).
Since each o f the MMPI-A Basic Scales typically contain several content areas,
and it is possible that item effectiveness may vary as a function o f content area, this
hypothesis was tested using the Harris Lingoes subscales. These subscales were
developed by Harris and Lingoes (1955) for the MMPI to identify the major item content
areas. The items scored in each o f the Basic scales were examined and grouped into
subscales that reflected a single trait or content area and then given a name that was
thought to be descriptive o f this trait or attitude. The Harris-Lingoes subscales were
carried over to the MMPI-A because few o f the original items used to construct the scales
were deleted during the development o f the MMPI-A.
In general, current findings provide little evidence that the frequency o f item
effectiveness was related to the homogeneity o f content areas, at least as those areas were
defined in the Harris Lingoes subscale (see Table 5). O f the 28 Harris Lingoes subscales
(56 tabulations done separately by gender), only 13 subscales showed item effectiveness
above 50% when comparing the normative versus clinical manual sample. Not
surprisingly, HL Pd subscales contained the highest percentages o f effective items,
similar to the performance o f the Pd parent scale among the Basic scales.
Comparing the Harris Lingoes subscales (see right side o f Table 5) with their
Basic clinical scale counterparts (see right side o f Table 7), there were no HL subscales
that contained a significantly higher frequency o f effective items when contrasted to their
Reproduced with permission of the copyright owner. Further reproduction prohibited without permission.
82
“parent” Basic scale. Indeed, two parent scales (Basic scales) had a frequency o f item
effectiveness that was significantly higher than the corresponding Harris Lingoes
subscales (i.e. Hy3 vs. Fly and Sc6 vs. Sc), while all other remaining comparisons were
not significantly different. Thus, there appears to be no difference in item effectiveness
when the scales are more homogeneous in terms of content.
Further, it was possible that the frequency of item effectiveness varied as a
function o f obviousness or subtlety o f MMPI-A items. Although the MMPI-A does not
contain a set o f subtle-obvious items, Weiner and Harmon subtle-obvious items
developed for the MMPI were utilized in this study. The Weiner-Harmon Subtle-Obvious
scales on the MMPI were developed by dividing MMPI items from five scales into two
groups (Weiner, 1948). One group consisted o f items that were relatively easy to detect
as indicating disturbance (obvious) and the other group consisted o f items that were
difficult to detect as indicating disturbance (subtle). These scales were developed to
assess the frequency with which respondents endorse obvious or subtle items, thus
allowing test-givers to assess the test-taking attitude o f a respondent. Weiner and Harmon
assumed those respondents who endorse more obvious items and less subtle items, may
be over-reporting or magnifying their problems, whereas the converse is true for
respondents underreporting their problems. However, there have been mixed findings
regarding the utility of these scales on the MMPI and on the MMPI-2. Some studies
demonstrate that the usefulness of the Weiner-Harmon scales in determining profile
accuracy is limited (e.g., Bagby, Buis, & Nicholson, 1995; Boone, 1994; Herkov, Archer,
& Gordon, 1991; Timbrook, Graham, Keiller, & Watts, 1993; Weed, Ben-Porath, &
Butcher, 1990), where as others have found that these scales are useful in accurately
Reproduced with permission of the copyright owner. Further reproduction prohibited without permission.
83
identifying individuals who over-report or under-report symptomatology (e.g., Brems &
Johnson, 1991; Hsu, Santelli, & Hsu, 1989; Schretlen, 1988). In the current study, the
obvious item component on the Basic clinical scales did not show a significant difference
in frequency of item effectiveness when contrasted with the frequencies of effective items
found for subtle item components within each o f these basic scales. Specifically, there
was no significant difference between subtle and obvious item endorsement effectiveness
for the Depression, Hysteria, Psychopathic Deviate, Paranoia and Mania Scales. Thus,
overall findings provide no support for the possibility that obvious items would produce a
higher frequency of effective items than subtle items. This finding is consistent with the
decision of the MMPI-A steering committee to discourage clinical use of these subscales
by not including a subtle-obvious profile sheet or norms for the MMPI-A (Archer, 1997;
Butcher et al., 1992).
Overall, there has been no improvement in item effectiveness from the results of
Archer and his colleagues’ study when examining the Supplementary scales and Harris-
Lingoes subscales, or subtle-obvious items. Because the MMPI-A scales have not been
useful in helping to understand the item effectiveness issue, a logical step was to examine
item effectiveness in relationship to various diagnostic groups.
The second broad purpose o f the study was to examine frequency of item
effectiveness among the Basic, Content, and Supplementary scales, and Harris Lingoes
subscales with reference to two homogeneous diagnostic criterion groups. This
hypothesis proposed that the frequency of non-discriminating items within specific scales
would vary as a function of the diagnostic groups used in contrast to normative groups,
i.e., the frequency o f effective items would increase when the normative sample was
Reproduced with permission of the copyright owner. Further reproduction prohibited without permission.
84
I| contrasted with homogeneous groups that were specifically related to the purpose o f the
scale (e.g., depressed patients used to determine item effectiveness for the D Basic scale).
j Although this hypothesis proposed that the frequency of effective items in the
Depression scale (D) would increase when normative samples were compared with
specific depression samples, this was not supported. Specifically, there was no significant
item effectiveness difference between the manual clinical sample frequency and the
homogeneous depression sample frequency. The depression sample contrasts only
produced a higher frequency of effective items than the general clinical sample on scales
Hs (for both genders) and scale Sc (for boys), that is, Basic scales that are not directly
related to the depression construct.
Similar comparisons regarding the frequency of item effectiveness were made for
the Conduct disorder group on Psychopathic Deviate scale (Pd). One would expect the
frequency of effective items to be higher on the Pd scales for evaluations that contrasted
the endorsement frequency o f the normative sample with that o f conduct disordered
adolescents rather than a more heterogeneous clinical sample. However, the results o f the
current study did not produce evidence that the frequency of item effectiveness for the Pd
scale improved as a result o f using the more homogeneous and construct relevant clinical
sample.
In contrast to the results obtained when the normative sample was compared to
the homogeneous depression sample for scale 2, the comparison o f item endorsement
frequencies between the normative and the conduct disorder sample produced a higher
frequency of effective items for boys than the normative-manual sample for scale 2.
Although it was expected that boys in the conduct disorder group would also endorse
Reproduced with permission of the copyright owner. Further reproduction prohibited without permission.
85
symptoms o f depression, it is interesting that there would be a significant difference
between the normative-conduct samples on the D scale but no significant difference
between the normative-depression samples when compared to the normative-manual
clinical sample. Given that these results may be due to chance, it is suggested that these
findings be replicated on other independent clinical samples.
Further, on the Content scales (see Table 8), the depression sample did not show a
higher frequency o f effective items than the general manual clinical sample on the
conceptually related scales. Although statistical comparisons were unable to be made
between A-con for the conduct disorder group and the manual clinical sample, boys had a
70% frequency o f item effectiveness, a relatively high rate, compared to other content
scales. However, it is unknown if this scale performs better with the conduct disorder
group than the general manual clinical sample. Among the 15 MMPI-A Content scales,
the only significant difference is that the manual clinical sample has a higher frequency
o f effective items than the depression sample for boys on A-ang, and in the conduct
disorder sample for girls on A-Ise and A-fam. In both the depression and conduct disorder
sample, results are not consistent with hypotheses in that significant differences do not
reflect apriori predictions.
As might be expected, given the prior pattern o f results, none o f the
Supplementary scales or Harris Lingoes subscales performed significantly better in
comparisons using the homogeneous diagnostic groups rather than the manual clinical
sample. However, when examining Supplementary scale results for the manual clinical
sample there was a statistical difference between the manual clinical sample and the two
homogeneous diagnostic groups, especially on the PRO subscale. Specifically, the
Reproduced with permission of the copyright owner. Further reproduction prohibited without permission.
86
Supplementary substance abuse scales (especially PRO) performed better (in terms of a
i higher frequency of effective items) in contrast with the manual clinical sample rather
! than the homogeneous samples. As stated before, this may be due to the fact that the
manual sample was largely composed in part form a residential substance abuse treatment
sample, all o f whom were used as the criterion group in the development o f the PRO|j scale (Weed, Butcher, & Williams, 1994).!
1j The overall conclusion regarding the second purpose of this study is that there are
no stable or reliable improvements in item endorsement effectiveness when using
homogeneous clinical samples in contrast to the general clinical sample. It does notj
appear that the diagnostic specificity o f the sample systematically increases item
effectiveness for scales selected based on constructs related to the diagnostic criterion
group. However, it may be argued that in the case o f the Supplementary scales, thei
jsubstance abuse scales performed at a significantly higher rate o f effectiveness for the
manual clinical sample (largely collected at substance abuse settings) than any of the
I other samples because we (unintentionally) included a clinical sample with a substancei
abuse component- the very criterion group used to construct the PRO scale as stated by
Weed et al. (1994). Thus, at least for the PRO findings, results may be artificially
inflated. This is illustrated by the relatively increased frequency of item effectiveness for
the PRO scale versus the MAC-R and ACK scale.
A remaining question for future research focuses on why the substance abuse
largely homogeneous sample produced a higher frequency o f effective items within their
conceptually related scales (i.e., MAC-R, ACK, and PRO) than the depression or the
conduct disorder samples for their conceptually related scales, (i.e., Basic scales D and
Reproduced with permission of the copyright owner. Further reproduction prohibited without permission.
Pd, respectively). One possible explanation might be that substance abuse constitutes a
more specific and reliable diagnosis in contrast to Depression and Conduct disorder.
However, there is no persuasive evidence to support this argument in the literature.
Although there are many potentially relevant diagnostic groups that could have been used
in this study, only two homogeneous samples were utilized. Future research should
examine various disorders on several scales, e.g., anxiety disorders and scale 7; school
problems and A-sch; psychosomatic symptoms and scales /, 5, and A-hea; psychotic
disorders and scale 8 and A-biz, etc. Using additional samples will help to define areas, if
any exist, in which specific diagnostic groups produce higher frequencies of effective
items.
Despite the impressive substance abuse scale item effectiveness findings, there
are still numerous non-discriminating items within all the scales on the MMPI-A, both
when examined in terms of homogeneous diagnostic groups and in terms of a general
sample. Additionally, there appears to be no consistent or reliable gender differences. The
only exception is for the conduct disordered group, where there were more effective
items for boys than girls on three Basic scales (D, Pi, and Si), two content scales (A-cyn
and A-trl), and one Harris Lingoes subscafe (A). This finding is consistent with the
perspective o f the DSM-1V (1994) authors who note “Conduct Disorder, especially the
Childhood-Onset Type, is much more common in males” (p. 88). However, non-
discriminating items appear to persist regardless of item content, sample, and gender.
This problem may exist for several reasons explored in detail below.
The decision to carry over the Basic scales from the MMPI to the MMPI-A
without re-establishing item composition through (lie use of criterion groups may have
Reproduced with permission of the copyright owner. Further reproduction prohibited without permission.
failed to be sensitive to relatively unique factors that play a part in adolescent
development. Generalizing MMPI results based on adults to adolescents (for example,
scale construction and composition) may have contributed to the inability o f many of
items to distinguish between a normative and clinical population. This idea is partially
supported by the Archer et al. (2001) findings that there were many more items on the
MMPI-2 scales that were able to discriminate between normative and clinical samples
than found for MMPI-A counterpart scales. However, scales that were developed solely
for the use o f the MMPI-A (A-aln, A-las, A-sch, A-con, ACK, PRO, IMM), did not appear
to perform that much better than those carried over from the MMPI.
Additionally, the relatively higher frequency of ineffective items may be created,
in part, by lower base rates in adolescents for certain psychiatric disorders and symptoms
found among the standard MMPI Basic scales (e.g., Schizophrenia). For example, none
o f the adolescents in our clinical sample were diagnosed with schizophrenia. However,
many of the adolescents in this sample were diagnosed with Depression or Conduct
Disorder, and there were still few items within these scales that were able to discriminate
between clinical and normative group endorsement frequencies. Further research should
attempt to examine those disorders that are frequently diagnosed in adolescence,
extending this examination o f item effectiveness to new homogeneous samples (e.g..
Anxiety disorders), as well as replicating ilem-eftectiveness results using additional
independent Depression, Conduct disorder, and Substance abuse samples.
Another possible explanation lor current findings is that “normaI” adolescents
tend to endorse more symptoms of psychological disturbance than do “normal” adults,
lending to blunt the discrimination achievable between normal and clinical adolescent
Reproduced with permission of the copyright owner. Further reproduction prohibited without permission.
89
groups. Support for this idea was found in the study by Archer and his colleagues (2001)
that demonstrated mean raw score values for the majority o f the Basic Scales in the
normative groups was higher for the MMPI-A than the MMPI-2. This further underscores
the observation that methodologies used to develop scales for adults may not prove
appropriate for adolescent inventories. There is substantial literature supporting the
salient differences between adolescents and adults in their responses to objective
personality inventories, including the MMPI (e.g., Archer 1984, 1987). Further, normal
adolescence has been viewed as a time o f emotional instability, rapid shifts in mood, and
conflictual relationships with authority figures (Erikson, 1956; Freud, 1958; Hall, 1916).
Offer and Offer (1975) found transient episodes o f mild depression and anxiety to be
fairly common in their surveys o f normal adolescents.
The results shown in the current study may also have been produced, in part, by
limitations or confounding influences inherent in the MMPI-A normative sample. Current
literature indicates that the prevalence and incidence o f psychopathology in adolescents
ranges from 14-22% (Bradenburg, Friedman, & Silver, 1990; Gould, Wunsch-Hitzig, &
Dohrenwend, 1981; McGee, Feelian, Williams, Partirdge, Silva, & Kelly, 1990; NIMH,
1990; Rutter, Graham, Chadwick, & Yule, 1976). This raises an important question
regarding the normative sample used in the development o f the MMPI-A. That is, the
sample was not screened for the occurrence of psychological disorders. The MMPI-A
normative sample may have included adolescents endorsing items similar to the clinical
populations, because they were, in fact, clinical respondents. While data on this issue is
not directly available, the normative sample did complete a Life Events form that
contained an item asking respondents if they had “been referred to a therapist or
Reproduced with permission of the copyright owner. Further reproduction prohibited without permission.
90
counselor” in the past six months. Of the 1620 respondents in the normative sample, 84%
(«=I360) responded “no” to this question and 15% (n= 256) responded yes (four
respondents did not answer the question). Interestingly, this incidence is consistent with
estimates of the national incidence o f adolescent psychopathology (Bradenburg, et al.,
1990; Gould, et al., 1981; McGee, et al., 1990; NIMH, 1990; Rutter, et al., 1976). An
important extension to this study is to explore the implications o f a normative group that
contains respondents recently referred to counseling or therapy. Removing those
respondents who answered “yes” to the question “Have you been referred to counseling
or therapy?” from the normative sample and comparing the frequency of effective items
on the revised normative and clinical groups on several independent samples would help
in understanding if the normative sample is indeed part o f the problem in producing
ineffective items. This extension, while logistically relatively easy to perform, would aid
in clarifying the problem o f item-ineffectiveness. I f in fact, a substantial difference was
found between the current normative sample and a revised normative sample, procedures
similar to Colligan and Oflford (1989) screening out those individuals diagnosed with
medical or psychological problems or who report they have been referred for therapy)
could and should be utilized in collecting a truly normative sample for future research in
this area.
In addition to limitations o f the MMPI-A normative sample, there were
differences between the MMPI-A manual clinical sample and those independent clinical
samples used in this study. The MMPI-A clinical sample presented in the test manual
included inpatient adolescents, but also contained adolescents from day treatment and
special school programs for emotionally disturbed children. In contrast, the independent
Reproduced with permission of the copyright owner. Further reproduction prohibited without permission.
91
homogeneous clinical samples used for this study for comparison purposes exclusively
contained adolescents whose psychiatric symptomatology required treatment in inpatient
treatment facilities. Although those differences did not appear to significantly effect
current results, it would be methodologically more desirable to have clinically similar
groups for comparisons, if at all possible, because one could argue that the normative
sample versus the manual-clinical sample comparisons might have produced higher rates
o f ineffective items (because the clinical sample population may be closer to the
normative sample, in terms of psychological functioning, than a completely independent
inpatient population).
The third purpose o f this study was to re-examine and recalculate Basic scale data
using only those items that effectively discriminated between the normative and clinical
populations. The mean profile o f the normative and clinical groups was contrasted based
on the “revised” Basic scales with an independent clinical sample (CSB) to evaluate the
extent to which profile sensitivity and specificity was effected by these scale
modifications. Results supported the hypothesis in that the overall effectiveness of Basic
scale discrimination increased, in terms o f sensitivity, specificity, positive and negative
predictive power and hit rate, when the Basic clinical scale items were removed that did
not discriminate between normative and clinical groups of adolescents. Hit rate,
sensitivity, specificity, positive predictive power (PPP) and negative predictive power
(NPP) improved for both genders at a T> 65. While most classification scores improved
at T > 60 it was not as effective for sensitivity and specificity as a cut-off o f T > 65.
Fontaine, Archer, Elkins, and Johansen (2001) demonstrated that a T-score cut-off of 65
resulted in higher levels of accurate classification overall while minimizing the
Reproduced with permission of the copyright owner. Further reproduction prohibited without permission.
92
misclassification of both clinical and normal cases. This study indicated that a reduction
in the T-score criterion used to define a “clinical range elevation” did not produce a more
effective balance between test sensitivity and specificity (i.e., that lowering the clinical
range elevation T-score criterion from 65 to 60 did not improve classification
performance). However, a unique feature on the MMPI-A is the “shaded” zone between
T scores in the 60 to 64 range alerting the test-user to approaching psychopathology. For
this reason, classification scores were evaluated at both T > 65 and T> 60. All
classification percentages were above .50 except for PPP (defined as the probability that
an elevated score is being produced by a protocol from the clinical sample). One
explanation for low PPP values is that 15% of the normative sample reported being
referred for counseling or therapy, i.e., these adolescents may not have been “normal”.
Thus, there were many respondents (potentially 256 of 1620) that were misclassified as
“normal” but “accurately” produced elevated protocols, thus, dramatically reducing PPP.
That also may be the reason that sensitivity (the percentage of participants whose
protocols indicate the presence o f clinical status who in fact were from the clinical
sample) is lower than specificity (the percentage o f participants whose within normal
limits protocols accurately indicate the absence o f pathology because, in fact, they were
from the normative group) when T > 6 5. Future research should attempt to find a truly
“normal” sample, as discussed earlier, in order to improve PPP. However, regardless of
the limitations of PPP, there is still substantial evidence that removal of the ineffective
items results in an overall increase in prediction accuracy.
In addition to improving hit rate performance, deleting “ineffective” items would
also serve another important purpose. Archer, Maruish, Imhof, and Piotrowski (1991)
Reproduced with permission of the copyright owner. Further reproduction prohibited without permission.
93
conducted a practitioner survey concerning the use o f the MMPI with adolescents.
Results demonstrated o f the 124 respondents, 49% («= 61 respondents) indicated that the
primary disadvantage o f using the MMPI with adolescents was the length/administration
time o f the test, followed by concerns regarding poor/outdated norms (20%) and reading
level too high (18%). The MMPI-A, while shorter (478 items) than the original version of
the MMPI (566 items), is still a lengthy instrument and demands a good deal of
concentration and attention. While attempts have been made to shorten the test (i.e.,
Archer, Tirrell, & Elkins, 2001), short forms tend to be generally less reliable than their
short form counterparts. In the current study, essentially shortened Basic scales (by over
100 items) produced results showing small increases in overall hit rate. Before applying
the current revised basic clinical scales in clinical settings, however, many questions
require evaluation. For example, when deleting items from a scale, does the scale still
retain its original “meaning” in terms o f extra-test correlates? Related to this point, would
the code-type patterns produced by revised scales retain correlate patterns established for
specific code-types with the standard instrument? An important future research direction
is to examine the revised MMPI-A Basic scales with external correlate data such as
diagnoses, self-report forms (e.g., Youth Self Report), and parent-report forms (Child
Behavior Checklist and Personality Inventory for Children-Adolescent version). Another
limitation of the current study is that items were only evaluated in terms o f effectiveness
on clinical scales and not on validity scales. For this reason, ineffective items should not
be dropped from the test until the effects o f such deletions on MMPI-A validity scales are
assessed. Because the strength and usefulness o f the validity scales distinguish the
Reproduced with permission of the copyright owner. Further reproduction prohibited without permission.
94
MMPI-A from many other self report measures, future research focusing on the deletion
o f non-discriminating items on L,F,K, VRIN, and TRIN is warranted.
Reproduced with permission of the copyright owner. Further reproduction prohibited without permission.
95
REFERENCES
Achenbach, T. M., & Edelbrock, C. S. (1983). Manual o f the Child Behavior Checklist
and revised child behavior profile. Burlington: University o f Vermont.
Aharoni, D. M. (1999). The effectiveness of the MMPI-A in the assessment o f adolescent
substance abuse. Dissertation Abstracts International, 6 0 ,6B. (UMI No.
9502196).
Alperin, J. J., Archer, R. P., & Coates, G. D. (1996). Development of the effects o f an
MMPI-A K-correction procedure. Journal o f Personality Assessment, 67, 155-
168.
American Psychiatric Association. (1994). Diagnostic and statistical manual o f mental
disorders (4th ed.). Washington DC: American Psychiatric Association.
Archer, R. P. (1984). The use of the MMPI with adolescents: A review of salient issues.
Clinical Psychology Review, 4, 241-251.
Archer, R. P. (1987). Using the MMPI with adolescents. Hillsdale, NJ: Lawrence
Erlbaum Associates.
Archer, R. P. (1992). MMPI-A: Assessing Adolescent Psychopathology. Hillsdale, NJ:
Lawrence Erlbaum Associates.
Archer, R. P. (1997). MMPI-A: Assessing adolescent psychopathology (2nd ed.).
Mahwah, NJ: Lawrence Erlbaum.
Archer, R. P., Belevich, J. K. S., & Elkins, D. E. (1994). Item-level and scale-level factor
structures o f the MMPI-A. Journal o f Personality Assessment, 62, 332-345.
Reproduced with permission of the copyright owner. Further reproduction prohibited without permission.
96
Archer, R. P., & Gordon, R. A. (1994). Psychometric stability o f MMPI-A item
modifications. Journal o f Personality Assessment, 62, 416-426.
Archer, R. P., Handel, R. W., Lynch, K. D. (2001). The effectiveness of MMPI-A items
in discriminating between normative and clinical samples. Journal o f Personality
Assessment, 77,420-435.
Archer, R. P., Handel, R. W., Lynch, K. D., Elkins, D. E. (2002). MMPI-A validity scale
uses and limitations in detecting varying levels o f random responding. Journal o f
Personality Assessment, 78,417-431.
Archer, R. P., & Jacobson, J. M. (1993). Are critical items “criticaP’ for the MMPI-A?
Journal o f Personality Assessment, 61, 547-556.
Archer, R. P., & Krishnamurthy, R. (1994). A structural summary approach for the
MMPI-A: Development and empirical correlates. Journal o f Personality
Assessment, 63, 554-573.
Archer, R. P., & Krishnamurthy, R. (1996). The Minnesota Multiphasic Personality
Inventory- Adolescent (MMPI-A). In C. S. Newmark (Ed.), Major psychological
assessment instruments (pp. 59-107). Boston: Allyn and Bacon.
Archer, R. P., Maruish, M., Imhofi E. A., & Piotrowski, C. (1991). Psychological
test usage with adolescent clients: 1990 survey findings. Professional
Psychology: Research and Practice, 22, 247-252.
Archer, R. P., & Newsom, C. R. (2000). Psychological test usage with adolescent clients:
Survey update. Assessment, 7, 227-236.
Reproduced with permission of the copyright owner. Further reproduction prohibited without permission.
97
Archer, R. P., Pancoast, D. L., & Gordon, R. A. (1994). The development of the MMPI-
A Immaturity (IMM) scale: Findings for normal and clinical samples. Journal o f
Personality Assessment, 62, 145-156.
Archer, R. P., Pancoast, D. L. & Klinefelter, D. (1989). A comparison o f MMPI
codetypes produced by traditional and recent adolescent norms. Psychological
Assessment: A Journal o f Consulting and Clinical Psychology, 1, 23-29.
Archer, R. P., Tirrell, C. A., & Elkins, D. E. (2001). An evaluation o f an MMPI-A short
form: Implications for adaptive testing. Journal o f Personality Assessment, 76,
76-89.
Bagby, R. M., Buis, T. N., Nicholson, R. A. (1995). Relative effectiveness of the standard
validity scales in detecting fake-bad and fake-good responding: Replication and
extension. Psychological Assessment, 7, 84-92.
Bandura, A. (1964). The stormy decade: Fact o f fiction? Psychology in the School, I,
224-231.
Ben-Porath, Y. S., Hostetler, K., Butcher, J. N., Graham, J. R., (1989). New subscales for
the MMPI-2 Social Introversion (Si) scale. Psychological Assessment: A Journal
o f Consulting and Clinical Psychology, 1, 169-174.
Black, K. (1994). A critical review o f the MMPI-A. Child Assessment News, 4, 9-12.
Boone, D. (1994). Reliability o f the MMPI-2 subtle and obvious scales with psychiatric
inpatients. Journal o f Personality Assessment, 62, 346-351.
Bradenburg, N. A., Friedman, R. M., & Silver, S. E. (1990). The epidemiology of
childhood psychiatric disorders: Prevalence findings from recent studies. Journal
o f the American Academy o f Child and Adolescent Psychiatry, 29, 76-83.
Reproduced with permission of the copyright owner. Further reproduction prohibited without permission.
98
Brems, C., & Johnson, M. E. (1991). Subtle-obvious scales o f the MMPI: Indicators of
profile validity in a psychiatric population. Journal o f Personality Assessment, 56,
536-544.
Butcher, J. N., Dahlstrom, W. G., Graham, J. R., Tellegen, A., Kaemmer, B. (1989).
MMPI-2 Manual fo r Administration and Scoring. Minneapolis, MN: University
of Minnesota Press.
Butcher, J. N., Graham. J. R., Ben-Poarth, Y. S., Tellegen, A., Dahlstrom, W. G., &
Kaemmer, B. (2001). Minnesota Multiphasic Personality Inventory-2. Manual for
administration, scoring, and interpretation. Revised edition. Minneapolis:
University o f Minnesota Press.
Butcher, J. N., Williams, C. L., Graham, J. R., Archer, R. P., Tellegen, A., Ben-Porath,
Y.S., & Kaemmer, B. (1992). MMPI-A (Minnesota Multiphasic Personality
Inventory - Adolescent): Manual fo r Administration, Scoring, and Interpretation.
Minneapolis, MN: University o f Minnesota Press.
Capwell, D. F. (1945a). Personality patterns of adolescent girls. I. Girls who show
improvement in IQ. Journal o f Applied Psychology, 29, 212-228.
Capwell, D. F. (1945b). Personality patterns o f adolescent girls. II. Delinquents and non
delinquents. Journal o f Applied Psychology, 29, 284-297.
CoIIigan, R. C., & Offord, K. P. (1989). The aging MMPI: Contemporary norms for
contemporary teenagers. Mayo Clinic Proceedings, 64, 3-27.
Dahlstrom, W. G., Welsh, G. S., & Dahlstrom, L. E. (1972). An MMPI handbook: Vol. I
Clinical interpretation (rev. ed.). Minneapolis: University o f Minnesota Press.
Reproduced with permission of the copyright owner. Further reproduction prohibited without permission.
99
Ehrenworth, N. V., & Archer, R. P. (1985). A comparison of clinical accuracy ratings of
interpretive approaches for adolescent MMPI responses. Journal o f Personality
Assessment, 49, 413-421.
Erikson, E. H. (1956). The concept o f ego identity. The Journal o f the American
Psychoanalytic Association, 4, 56-121.
Ferdinand, R. F., & Verhulst, F. C. (1995). Psychopathology from adolescence into
young adulthood: An 8-year follow-up study. American Journal o f Psychiatry,
152, 1586-1594.
Fontaine, J. L., Archer, R. P., Elkins, D. E., & Johansen, J. (2001). The effects of
MMPI-A T-score elevation on classification accuracy of normal and clinical
adolescent samples. Journal o f Personality Assessment, 76,264-281.
Freud, A. (1958). Adolesence. Psychoanalytic Study o f the Child, 13, 255-278.
Gallucci, N. T. (1997a). Correlates of MMPI-A substance abuse scales. Assessment, 4,
87-94.
Gallucci, N. T. (1997b). On the identification o f patterns of substance abuse with the
MMPI-A. Psychological Assessment, 9, 224-232.
Gantner, A. B., Graham, J. R., & Archer, R. P. (1992). Usefulness o f the MAC scale in
differentiating adolescents in normal, psychiatric, and substance abuse settings.
Psychological Assessment, 4, 133-137.
Gottesman, 1.1., Hanson, D. R., Kroeker, T. A., & Briggs, P. F. (1987). New MMPI
normative data and power-transformed T-score tables for the Hathaway-
Monachesi Minnesota cohort o f 14,019 fifteen-year-old and 3,674 eighteen-year-
Reproduced with permission of the copyright owner. Further reproduction prohibited without permission.
100
olds. In R. P. Archer, Using the MMPI with adolescents (pp. 241-297). Hillsdale,
NJ: Lawrence Erlbaum Associates.
Gould, M. S. Wunsch- Hitzig, R., & Dohrenwend, B. (1981). Estimating the prevalence
of childhood psychopathology: A critical review. Journal o f the American
Academy o f Child Psychiatry, 20, 462-476.
Greene, R. L. (2000). The MMPI-2: An interpretive manual (2nd ed.). Boston, MA:
Allyn & Bacon.
Hall, G. S. (1916). Adolescence. New York: Appelton.
Harris, R. E., & Lingoes, J. C. (1955). Subscales for the MMPI: An aid to profile
interpretation. Department o f Psychiatry, University o f California School o f
Medicine and the Langley Porter Clinic, mimeographed materials.
Hathaway, S. R., & McKinley, J. C. (1943). The Minnesota Multiphasic Personality
Inventory (rev. ed.). Minneapolis: University o f Minnesota Press.
Hathaway, S. R., & Monachesi, E. D. (Eds.). (1953). Analyzing and predicting juvenile
delinquency with the MMPI. Minneapolis: University of Minnesota Press.
Hathaway, S. R., & Monachesi, E. D. (1961). An atlas o f juvenile MMPI profiles.
Minneapolis: University o f Minnesota Press.
Hathaway, S. R., & Monachesi, E. D. (1963). Adolescent personality and behavior:
MMPI patterns o f normal, delinquent, dropout, and other outcomes. Minneapolis:
University of Minnesota Press.
Herkov, M. J., Archer, R. P., & Gordon, R. A. (1991). MMPI response sets among
adolescents: An evaluation o f the limitations o f the subtle-obvious subscales.
Reproduced with permission of the copyright owner. Further reproduction prohibited without permission.

101
Psychological Assessment: A Journal o f Consulting and Clinical Psychology, 3,
424-426.
Hoeglund, T. & Tellegan A. (1998). A software package fo r the derivation o f Uniform T
scores fo r MMPI-2 scales. Minneapolis: Regents of the University of Minnesota.
Ho well, D. C. (1992). Statistical methods fo r Psychology. Belmont, CA: Duxbury Press.
Hsu, L. M., Santelli, J., & Hsu, J. (1989). Faking detection validity and incremental
validity o f response latencies to MMPI subtle and obvious items. Journal o f
Personality Assessment, 53, 278-295.
Hyman, S. E. (2001). Mood disorders in children and adolescents: An NIMH perspective.
Biological Psychiatry, 49, 962-969.
Kessler, R. C., Avenevoli, S., & Merikangas, K. R. (2001). Mood disorders in children
and adolescents: An epidemiological perspective. Biological Psychiatry, 49,
1002-1014.
Klinefelter, D., Pancoast, D. L., Archer, R. P., & Pruitt, D. L. (1990). Recent adolescent
MMPI norms: T-score elevation comparisons to Marks and Briggs. Journal o f
Personality Assessment, 54, 379-389.
Klinge, V. & Lachar, D., Grissell, J., & Berman, W. (1978). Effects o f scoring norms on
psychiatric drug users’ and nonusers’ MMPI profiles. Adolescence, 13, 1-11.
Klinge, V., & Strauss, M. E. (1976). Effects o f scoring norms on adolescent psychiatric
patients’ MMPI profiles. Journal o f Personality Assessment, 40, 13-17.
Koss, M. T., & Butcher, J. N. (1973). A comparison of psychiatric patients’ self-report
with other sources o f clinical information. Journal o f Research in Personality, 7,
225-236.
Reproduced with permission of the copyright owner. Further reproduction prohibited without permission.

Krishnamurthy, R., Archer, R. P., & House, J. J. (1996). The MMPI-A and Rorschach: A
failure to establish convergent validity. Assessment, 3, 179-191.
Lachar, D., Klinge, V., & Grissell, J. L. (1976). Relative accuracy of automated MMPI
narratives generate from adult norm and adolescent norm profiles. Journal o f
Consulting and Clinical Psychology, 44, 20-24.
Lewinsohn, P. M., Hops, H. Roberts, R. E., Seeley, J. R., & Andrews, J. A. (1993).
Adolescent psychopathology: I. Prevalence and incidence o f depression and other
DSM-III-R disorders in high school students. Journal o f Abnormal Psychology,
102, 133-144.
MacAndrew, C. (1965). The differentiation o f male alcoholic outpatients from non
alcoholic psychiatric outpatients by means o f the MMPI. Quarterly Journal o f
Studies on Alcohol, 26, 238-246.
Marks, P. A., & Briggs, P. F. (1972). Adolescent norm tables for the MMPI. In W. G.
Dahlstrom, G. S. Welsh, & L. E. Dahlstrom, An MMPI Handbook: Vol. 1.
Clinical Interpretation (rev. ed., pp. 388-399). Minneapolis: University of
Minnesota Press.
Marks, P. A., Seeman, W., & Haller, D. L. (1974). The actuarial use o f the MMPI with
adolescents and adults. Baltimore: Williams & Wilkins.
McDermott, P. A. (1996). A nationwide study o f developmental and gender prevalence
for psychopathology in childhood and adolescence. Journal o f Abnormal Child
Psychology, 24, 53-66.
Reproduced with permission of the copyright owner. Further reproduction prohibited without permission.
103
McGee, R., Feehan, M., Williams, S., Partridge, F., Silva, P. A., & Kelly, J. (1990).
DSM-III disorders in a large sample of adolescents. Journal o f the American
Academy o f Child and Adolescent Psychiatry, 29, 611-619.
Michucci, J. (2002). Accuracy of MMPI-A scales, ACK, MAC-R, and PRO in detecting
comorbid substance abuse among psychiatric inpatients. Assessment, 9, 111-122.
Monachesi, E. D. (1948). Some personality characteristics of delinquents and non
delinquents. Journal o f Criminal Law and Criminology, 38, 487-500.
Monachesi, E. D. (1950). Personality characteristics o f institutionalized and non
institutionalized male delinquents. Journal o f Criminal Law and Criminology,
47,167-179.
Monachesi, E. D., & Hathaway, S. R. (1969). The personality of delinquents. In
J. N. Butcher (Ed.). MMPI: Research developments and clinical applications (pp.
207-219). Minneapolis: University o f Minnesota Press.
National Institute o f Mental Health (NIMH). (1990). National plan fo r research on child
and adolescent mental disorders (DHHS Publication No. ADM 90-1683).
Washington, DC. U. S. Government Printing Office.
Offer D., & Offer, J. B. (1975). From teenager to young manhood. New York: Basic
Books.
Rutter, M., Graham, P., Chadwick, O. F. D., & Yule, W. (1976). Adolescent turmoil: Fact
or fiction? Journal o f Child Psychology and Psychiatry, 17, 35-56.
Schretlen, D. J. (1988). The use o f psychological tests to identify malingered symptoms
of mental disorders. Clinical Psychology Review, 8, 451-456.
with permission of the copyright owner. Further reproduction prohibited without permission
104
Spivack, G., Haimes, P. E., & Spotts, J. (1967). Devereux Adolescent Behavior (DAB)
Rating Scale Manual. Devon, PA: The Devereux Foundation.
Stein, L. A., & Graham, J. R. (2001). Use o f the MMPI-A to detect substance abuse in a
juvenile correctional setting. Journal o f Personality Asessment, 77, 508-523.
Timbrook, R. E., Graham, J. R., Keiller, S. W., & Watts, D. (1993). Comparison o f the
Wiener-Harmon Subtle Obvious Scales and the standard validity scales in
detecting valid and invalid MMPI-2 profiles. Psychological Assesment, 5, 53-61.
Walfish, S., Massey, R., & Krone, A. (1990). MMPI profiles o f cocaine-addicted
individuals in residential treatment: Implications for practical treatment planning.
Journal o f Substance abuse Treatment, 7, 151-154.
Weed, N. C., Ben-Porath, Y. S., & Butcher, J. N. (1990). Failure o f Wiener and Harmon
MMPI subtle scales as personality descriptors and as validity indicators.
Psychological Assessment: A Journal o f Consulting and Clinical Psychology, 2,
281-285.
Weed, N. C., Butcher, J. N., & Williams, C. L. (1994). Development o f MMPI-A
alcohol/drug problem scales. Journal o f Studies on Alcohol, 55, 296-302.
Weiner, I. B. (1948) Subtle and obvious keys for the MMPI. Journal o f Consulting
Psychology, 12, 164-170.
Weiner, I. B., & Del Gaudio, A. C. (1976). Psychopathology in adolescence: An
epidemiological study. Archives o f General Psychiatry, 33, 187-193.
Reproduced with permission of the copyright owner. Further reproduction prohibited without permission.
105
VITA
Kathleen D. Lynch, M.A.
1416 Hampton Boulevard, Apt. 6B Norfolk, Virginia 23517 (757) 640-1405
VCPCPPembroke Two/Suite 301 287 Independence Blvd.Virginia Beach, VA 23462 (757)518-2550
Kathleen D. Lynch attended the College o f Charleston from 1993-1997 and
received a B.S. in Psychology. She then attended Western Carolina University (1997-
1999) for her masters in Clinical Psychology. She completed her thesis “Parental
Predictions o f Children’s Interests and Cognitive Performance” under the supervision of
Bruce Henderson, Ph.D. and her internship in Washington D.C. working with children.
Kathleen was then accepted to the Virginia Consortium Program in Clinical Psychology
(VCPCP) in 1999. She trained at several sites including the Hampton Veterans Affairs
Medical Center, Virginia Beach Public Schools, Suffolk Department o f Social Services,
and Hampton Roads Neuropsychology Clinic. Kathleen taught Introductory Psychology
and Developmental Psychology at Norfolk State University and held a position as a
research assistant for Robert P. Archer, Ph.D. at Eastern Virginia Medical School
(EVMS). Her third year concentration was in Neuropsychology at Eastern State Hospital
and The Neuropsychology Center at EVMS. In July o f2003, she will finish her
internship at Eastern Virginia Medical School and graduate with her Psy.D. in Clinical
Psychology. In September 2003, Kathleen will be a Post-Doctoral Fellow in Clinical
Neuropsychology at Eastern Virginia Medical School and Eastern State Hospital.
Kathleen also works for Virginia Beach Psychiatric Center as a consulting clinician to
area Emergency Rooms.
Reproduced with permission of the copyright owner. Further reproduction prohibited without permission.