Embed Size (px)
Citation preview

APPROVED: Eugenia Bodenhamer-Davis, Major Professor Randall J. Cox, Minor Professor Jack G. Dial, Committee Member Gina M. Graci, Committee Member Frances A. McManemin, Committee Member Linda Marshall, Chair of the Department of
Psychology Sandra L. Terrell, Dean of the Robert B. Toulouse
School of Graduate Studies
A COMPARISON OF THE MCMI-III AND THE MMPI-2
IN A CHRONIC PAIN POPULATION
John C. Hardie, A.B., M.A., M.S.
Dissertation Prepared for the Degree of
DOCTOR OF PHILOSOPHY
UNIVERSITY OF NORTH TEXAS
December 2004

Hardie, John C. The relationship between the MCMI-III and the MMPI-2 in a chronic
pain population. Doctor of Philosophy (Psychology), December 2004, 90 pp., 15 tables, 2
figures, references, 116 titles.
The purpose of the present study was to study the relationship of MCMI-III clinical
scales with MMPI-2 clusters in a chronic pain population. Data was obtained through
assessment data (N = 242) from the Dallas Spinal Rehabilitation Center (DSRC), that included
MMPI-2 and MCMI-III, as well as pre-and post-assessment information (n = 21) and follow-up
questionnaires (n = 19). Subjects’ age ranged from 18 to 64. Each patient had a primary
diagnosis related to a back and/or a cervical injury, a chronic pain diagnosis, and often medical
prescription dependency and/or addition. Each has experienced back pain in the lumbar region
(L1 to L5) or cervical region (C1 to C7) for an average of 32 months. Patients with thoracic
(mid-spine) and carpal tunnel pain were excluded from this study. A multivariate cluster
analysis procedure was performed that yielded 3 homogeneous female MMPI-2 clusters and 4
MMPI-2 homogeneous male clusters. Seven multiple regression analyses were performed to
determine which MCMI-III clinical scales predicted cluster membership in the MMPI-2 clusters.
Results indicated that MCMI-III clinical scales “7” Compulsive, “X” Validity and “C”
Borderline were predictors for membership in the male MMPI-2 clusters. Membership in the
female MMPI-2 clusters were predicted by MCMI-III clinical scales “4” Histrionic, “T” Drug
Dependence and “2A” Avoidant. Nineteen pre-and post-MCMI-IIIs were analyzed for change
after participants completed the six-week pain management program. Paired-sample t-tests were
performed on these data and revealed that significant change was noted on 10 MCMI-III clinical
scales. Follow-up data questionnaires were available on these same individuals. Results from a
correlation analysis indicated that patients who reported having supportive relationships with

their spouse and family and a secure source of income report better quality of sleep, better mood,
are able to relax and are believe that they are able to manage their pain. Participants who were
able to relax and remain calm report better quality of sleep, exercise frequently, report better
quality of mood and believe that they will return to work soon. Findings from this study suggest
that rather than using the MCMI-III as a diagnostic tool, a more efficient use of this instrument
would be to understand maladaptive coping styles that may be present under stressful situations.
This study’s findings suggest that pain treatment program staff could utilize follow up
information, as well as diagnostic information about coping strategies that might appear under
stress, to shape interventions. Future research might focus on investigation of factors that predict
both improvement and program failure, especially those present at initial intake.

ii
Copyright 2004
by
John C. Hardie

iii
ACKNOWLEDGMENTS
I would like to take this opportunity to thank a number of people for their support,
guidance and invaluable contributions to this project: Dr. Frances A. McManemin and Dr. Gina
M. Graci and my committee members. A very special note of appreciation goes to my major
professor, Dr. Eugenia Bodenhamer-Davis, who is a model of an academic advisor and student
advocate. To both Dr. Jack G. Dial and Dr. Frances A. McManemin for mentoring me in
research and providing me with role models to develop my clinical skills. I would also like to
thank my partner of 13 years, Paul Garzotto, as well as my family and friends for their
unyielding support throughout the process of my studies and training. I will also be eternally
grateful for Dr. Ernest Harrell’s guidance, support and suggestions during the proposal stage of
this project. His contributions gave heuristic value to this research. Although I shall always miss
him, I feel privileged to be able to say that I was one of the students he worked with during his
life. His memory will live on.

iv
TABLE OF CONTENTS
Page
ACKNOWLEDGMENTS ...........................................................................................................iii
LIST OF TABLES AND FIGURES............................................................................................. v
INTRODUCTION ........................................................................................................................ 1
Classifying Chronic Pain Patients
Classifying Chronic Pain Patients Using the MMPI
Cluster Analysis and the MMPI
Classifying Chronic Pain Using the Millon Clinical MultiAxial Inventory
Purpose of Study METHOD ................................................................................................................................... 21
Subjects
Procedure
Instruments
Statistics
Power RESULTS ................................................................................................................................... 28
Descriptive Statistics
Male Clusters
Female Clusters
Hypothesis Testing
Hypothesis Testing – Females
Pre and Post Data Analysis DISCUSSION............................................................................................................................. 44
APPENDICES ............................................................................................................................ 60
REFERENCES ........................................................................................................................... 77

v
LIST OF FIGURES AND TABLES
Page
Figures
1. MMPI-2 male clusters..................................................................................................... 30
2. MMPI-2 female clusters ................................................................................................. 32
Tables
1. Regression summary hypothesis 1 – males .................................................................... 33
2. Regression summary hypothesis 2 – males .................................................................... 34
3. Regression summary hypothesis 3 – males .................................................................... 35
4. Regression summary hypothesis 4 – males .................................................................... 36
5. Regression summary hypothesis 2 – females ................................................................. 38
6. Regression summary hypothesis 3 – females ................................................................. 39
7. Regression summary hypothesis 4 – females ................................................................. 40
8. Paired samples test: MCMI-III clinical scales pre and post treatment ........................... 43
Supplemental Tables
1. Coefficient summary hypothesis 1 – males .................................................................... 70
2. Coefficient summary hypothesis 2 – males .................................................................... 71
3. Coefficient summary hypothesis 3 – males .................................................................... 72
4. Coefficient summary hypothesis 4 – males .................................................................... 73
5. Coefficient summary hypothesis 2 – females ................................................................. 74
6. Coefficient summary hypothesis 3 – females ................................................................. 75
7. Coefficient summary hypothesis 4 – females ................................................................. 76

1
INTRODUCTION
Chronic, intractable pain is a difficult problem to treat and an enormously
frustrating clinical problem, exacting a huge cost in personal suffering, quality of life,
and productivity. It promotes huge financial losses to society at large. In the United
States, one-third to one-half of the population will seek medical attention for a persistent
pain problem at some time in their lives (Chapman & Bonica, 1985; Strang, 1985). Low
back pain is the principal diagnosis in 10% of all chronic health conditions, and painful
musculoskeletal conditions are the leading cause of functional (i.e., activity) limitation in
patients of working age (Anderson, Pope & Frymoyer, 1984; Kelsey, White, Patides &
Bisbee, 1979; Steinberg, 1992).
Although most individuals experiencing back pain do not seek medical attention
or make major alterations in their activities (Crook, Rideout & Brown, 1994; Reisbord &
Greenland, 1995), the number of persons annually who are partially or totally disabled by
back pain is estimated as high as 8 million (Bonica, 1990). A review of studies from the
1980s and earlier concluded that chronic back disorders caused the loss of 240 million
workdays annually (Chapman & Bonita, 1995). The incidence of back pain is highest in
working-age adults between 25 and 55 years old, accounting for about 2% of its national
productivity (Cypress, 1993; Harkins, Kwentus & Price, 1994; Steinberg, 1992).
A congressionally mandated Institute of Medicine (IOM) report on pain and
disability found that “between 1980 and 1992, estimated total disability expenditures
from all sources for members of the population aged 18 to 64 years old more than
doubled, from $60.2 billion to $121.5 billion in real 1992 dollars” (Institute of Medicine,

2
1997, p. 91). The Social Security Disability Insurance program also expanded rapidly
over the past 25 years: “Between 1970 and 1995, the number of beneficiaries increased
by 480% and the total annual benefits paid under the program increased by 778%. This
growth far outstripped the increase in the U.S. adult population, which grew by only 51%
during that period, and that of the working population insured for disability under the
Social Security Administration, which increased by 135% (Institute of Medicine, 1997,
page 38). Back injuries account for approximately 20 – 30% of all Workers’
Compensation costs (Edwards, 1993; Snook and Jensen, 1994), and the frequency of
claims for back injury has risen more rapidly than for any other injury (Fordyce, 1994;
Steinberg, 1992).
On the positive side, most cases of back pain are self-limited; 80-90% of patients
recover within two months of seeking medical attention and only 8 to 10% suffer for
more than six months with any given episode (Steinberg, 1992; Strang, 1985). However,
this latter group represents a significant and costly subgroup of the U.S. labor force. The
longer the duration an individual’s pain problem lasts, the chances of their returning to
work drops drastically (Beals & Hickman, 1992) and the costs in disability payments,
litigation and medical expenses rise. About 25% of back injury cases account for about
90% of all medical compensation costs (Snook & Jensen, 1994; Strang, 1995).
These statistics suggest that medical science has not developed an effective
treatment for intractable pain. To understand the reasons for the lack of effective
treatment, it is necessary to understand the complexity of the problem. Pain is most
commonly thought of as a warning signal of tissue injury or disease. This specificity

3
definition assumes that the amount of pain experienced is roughly proportional to the
amount of tissue damage sustained. However, such a purely physiological, dualistic
model of pain (“real” = clearly related to tissue damage, “imaginary” = suffering with no
clear organic base) is relatively new in the history of pain concepts (Chapman & Bonica,
1985; Ford, 1993; Fordyce, 1986; Pennebaker, 1992). Aristotle and Plato regarded pain
as a passion and an emotion, while Biblical references recognize that pain “felt in the
body may well arise from misery, sadness or unhappiness” (Merskey, 1980, p. 4). Even
our daily language retains an affective conception of pain: “You really hurt me by saying
that,” or “he is really a pain in the neck.”
The past three decades have witnessed a move away from the dichotomous
Cartesian model of pain and a return to a multidimensional definition that recognizes
affective, cognitive, behavioral and social components, as well as somatosensory aspects
of pain (Chapman & Bonica, 1995; Eisenberg, 1987; Ford, 1993; Fordyce, 1986; 1987,
Melzack and Wall; 1965; 1983; Pennebaker, 1982; Turk & Flor, 1984). The specificity
model was unable to account for the observed absence of pain in certain injury states or
for the persistence of pain complaints in the absence of sufficient organic findings. The
International Association for the Study of Pain has defined pain as “an unpleasant
sensory and emotional experience associated with actual or potential tissue damage, or
described in terms of such damage” (1986, p 217). This definition removes the
relationship between tissue damage and pain, instead emphasizing that pain is a
subjective psychological experience, which although the patient must associate it with a
somatic sensation, does not necessarily have to result from a physiological stimulus. This

4
multi-component definition of pain helps in understanding the complexities of chronic
pain problems.
Definitions of chronic pain vary, but the term itself implies extended duration.
Typically, it is characterized as a persistent problem that is refractory to traditional
medical treatment. Pain of six months’ duration is the “standard definition” used in the
research literature, as this duration is well beyond the expected healing time for most
injuries. Studies vary as to the types of pain problems included in the category of chronic
pain vary, but most exclude patients with degenerative diseases or cancer, which could
cause continuing sensory input from progressive tissue or nerve damage. The definition
of chronic pain also includes the patient’s experience or complaints of pain that go
beyond what might be expected from the known extent of organic involvement.
Psychosocial factors must be considered in addition to whatever physiological factors
may be contributing to the pain complaints. Pain problems of extended duration involve
and affect all aspects of patients’ lives (Strang, 1995; Watson, 1982).
Just as the inadequacies of the specificity model led to the development of a
multi-factional definition of pain, the inadequacies of traditional medical treatment have
led to treatment programs aimed at the multiplicity of physical and psychosocial factors
thought to contribute to chronic pain problems. Any assessment or treatment approach
must take into consideration the wide variety of factors that have been proposed as
influencing pain. For a particular patient, one perspective may be more useful than
another in understanding the specific factors causing his or her difficulties. Overall,
however, current approaches to the management of chronic pain tend to assume that

5
effective treatment programs need to incorporate to some degree a multidisciplinary
approach based on medical/physiological diagnoses, as well as strategies from many
theoretical model, such as classical conditioning and learning theory, social learning and
modeling, systems theory, cognitive and information processing, and stress management.
Just as the treatment of pain needs to encompass tools from various treatment models, so
must the assessment process of the patient prior to treatment (Van Houdenhove, 1986;
Turk & Flor, 1986).
Classifying chronic pain patients
Classifying chronic pain has moved far beyond a model of pain as a sensory
signal of tissue injury. The enormous complexity of chronic pain must be approached as
a psychosocial as well as physiological phenomenon. The chronic pain patient can only
be understood when the interaction of affective, cognitive life history, learning and
conditioning, social modeling, physiological and psychiatric systems are taken into
account. Current pain treatment programs take a pragmatic, eclectic view of the problem
and attempt to address as many facets of the chronic pain syndrome as possible
(Chapman & Bonica, 1985; Fordyce, 1986; Turk & Flor, 1984).
Adequate classification of chronic pain patients can help to address many of the
problems inherent in the complex multidimensional models of chronic pain etiology and
approaches to treatment. Two major goals of classification strategies should be to
describe the characteristics of the typical pain patient’s personality and to describe the
differences among pain patients (Keller & Butcher, 1992). The relevance of these typical
pain patient descriptions have guided clinicians in discovering the etiologic and

6
maintaining factors in chronic pain states, in developing general treatment programs that
address all these components of chronic pain, and potentially for predicting the
development of pain problems premorbidly (Prokop, 1988).
Multidisciplinary treatment approaches have required an enormous financial
investment and the involvement of many professionals from diverse backgrounds
(Aranoff, 1985). Adequate classification of the constellation of factors contributing to a
particular patient’s pain problem could potentially cut these costs by accurately
predicting who might benefit from such a program (Turk & Flor, 1985). However, even
more helpful would be the ability to identify groups of patients with certain factors in
common who would respond best to certain treatment components. Research on chronic
pain patients has generally conformed to the same uniformity myth (Keisler, 1988) that
has pervaded psychotherapy outcome research in general. If subgroups of patients who
have certain etiologic or maintaining factors in common could be identified, matching
them to an appropriate treatment could simultaneously cut costs and improve outcome
statistics.
Many studies have tried to characterize the typical chronic pain patient. Such
investigations provide important data needed to hypothesize and test theories of chronic
pain etiology and maintenance. The available literature providing demographic
descriptions suggests that the average chronic pain patient tends to be high-school-
educated, Caucasian, protestant, from lower socioeconomic backgrounds, blue-collar
workers engaged in physically demanding, monotonous work. He or she is 25 to 55
years old, was injured on the job, and has insurance compensation available. If married,

7
his or her marriage is likely to be marked by communication difficulties and
unacknowledged conflict; and it is fairly likely that the spouse is having somatic
problems as well. The patient is likely to be overweight and a smoker. He or she
probably grew up in a large family, within an atmosphere of conflict. The conflict more
than likely erupted in physical abuse but was rarely acknowledged or discussed. In
addition, one or more family members may have served as models of physical or
psychiatric disability. A majority of chronic pain patients have had bouts of illness and
disability before the current problem. Previous health problems usually included alcohol
abuse (Andersson, 1981; Beals & Hickman, 1972; Craig, 1983; Edwards et al., 1985;
Feurerstain, Papciak, & Hoon, 1987; Feuerstein, Sult, & Houle, 1985; Fishbain,
Goldberg, Meagher, Steele, & Rosomoff, 1986; France, Krishnan, & Trainor, 1986;
Gentry, Shows & Thomas, 1974; Katon, Egan, & Miller, 1985; Klein, Jensen, &
Sanderson, 1984; McArthur et al., 1987; Murray, 1982; Steinberg, 1982).
Blumer and Heilbronn (1981, 1982) have described pain patients as
hypochondriacal “preoccupied with somatic complaints and disease phobias, anxious and
irritable, withdrawing from life problems.” Van Houdenhove, (1986) found that a
majority of patients in pain management programs have hysterical personality styles
(marked denial of psychological problems, inhibition of aggression, attention-seeking,
dependent, suggestible, with somatic symptoms serving to resolve emotional conflict and
express needs), and alexithymic (concrete, no language for feelings or abstract concepts;
interpersonal and emotional expression is in “body language”). They may have assumed
adult care taking and work roles early in life, resulting in unmet dependency needs

8
(Feurestein, et al., 1987). They are often described as suffering from obvious or masked
depression, and have manipulated social systems to meet their needs. Typically, chronic
pain patients have viewed themselves as helpless and without resources or skills to take
control of their lives (Aronoff & Rutrick, 1985; Catchlove et al., 1985; Crown 1980;
Engel, 1959; Evans, 1985; Gentry et al., 1984; Murray, 1982; Sternback, 1974.)
Although a variety of measures and observational methods have been used in
arriving at the above descriptions, the most widely cited objective assessment device
used with chronic pain patients is the Minnesota Multiphasic Personality Inventory
(MMPI), a 566-item true-false self-report questionnaire. Items on the MMPI are grouped
into scales, which were originally developed in the 1940s to discriminate empirically
between groups of patients with various psychiatric diagnoses and a group of normal
adults. Raw scores on the scales are transformed into standardized “t-scores,” designed
to have a mean of 50 and a standard deviation of 10 in the original normative sample.
These scores are then plotted on a test profile. While diagnostic systems have changed
and interpretive strategies are now based more on profile patterns of scores (“codetypes”)
and item content than on single scale scores, four validity scales and ten clinical scales
have remained in the standard set of MMPI scores reported across studies in a wide
variety of patient populations (Dahlstrom, Welsh, & Dahlstrom, 1972; 1975; Graham,
1987; Keller, Butcher, & Slutske, 1990).

9
Classifying chronic pain patients using the MMPI
The problem of classifying chronic pain patients has been most consistently
addressed using the MMPI and MMPI-2. At this point other assessment instruments and
approaches have not received enough attention in the literature to provide comparably
extensive data. A survey by Hickling, Sison, and Holtz (1995) reported that the MMPI
was the most commonly used assessment tool in the pain clinic and used by 78.7% of all
clinics. The MMPI has been a major tool in identifying psychological problems in
patients with chronic pain.
Several attempts have been made to use the MMPI to describe the personality
characteristics of low back pain patient in terms of personality characteristics. Most
research has classified the treated chronic pain patient population as a homogeneous
group whose shared personality characteristics await discovery (Keller & Butcher, 1991).
Most personality characteristics are based on MMPI mean profile correlates: The pattern
of scale scores found when the MMPIs of a group of patients are averaged together.
Studies reporting mean profiles of pain patients show great consistency in reporting one
of two similar configural patterns. The first common profile is a “conversion-V”; highest
elevations (T scores > 70) on scales Hs and Hy, with a relative absence of elevation on D
(Love & Peck, 1987; McGrath & O’Malley, 1986); Murray, 1982; Southwick & White,
1983). This configuration is interpreted as converting personally distressing troubles into
10
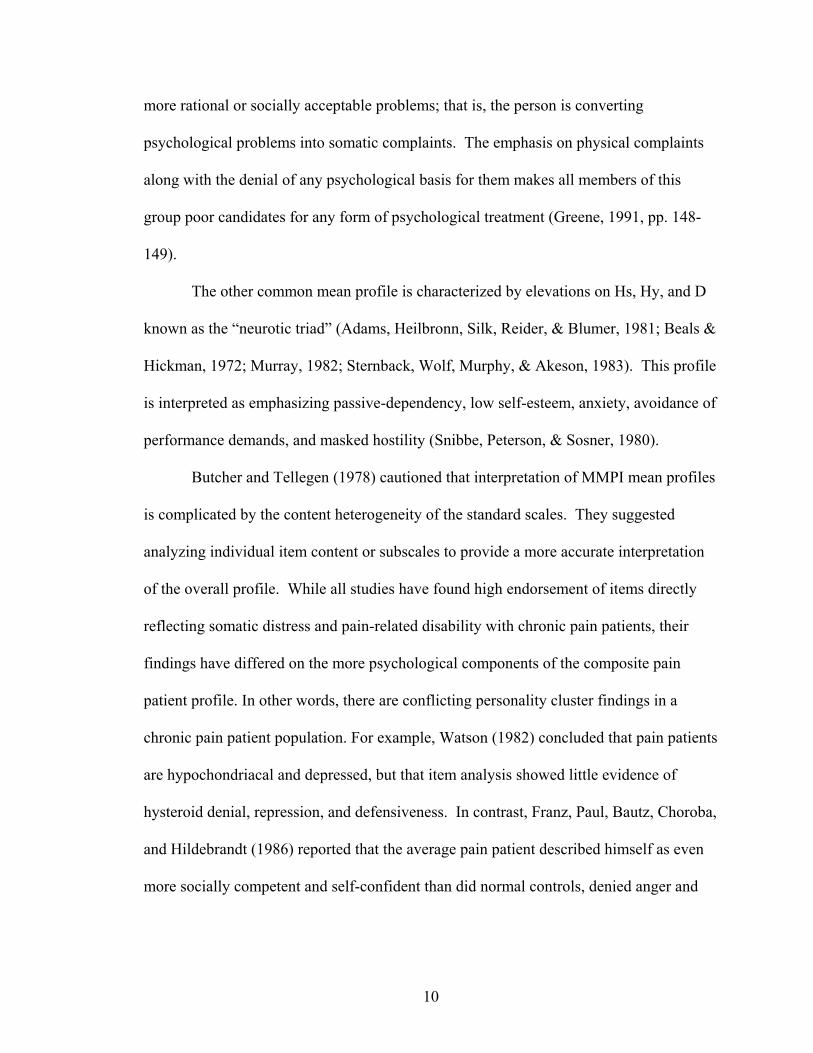
more rational or socially acceptable problems; that is, the person is converting
psychological problems into somatic complaints. The emphasis on physical complaints
along with the denial of any psychological basis for them makes all members of this
group poor candidates for any form of psychological treatment (Greene, 1991, pp. 148-
149).
The other common mean profile is characterized by elevations on Hs, Hy, and D
known as the “neurotic triad” (Adams, Heilbronn, Silk, Reider, & Blumer, 1981; Beals &
Hickman, 1972; Murray, 1982; Sternback, Wolf, Murphy, & Akeson, 1983). This profile
is interpreted as emphasizing passive-dependency, low self-esteem, anxiety, avoidance of
performance demands, and masked hostility (Snibbe, Peterson, & Sosner, 1980).
Butcher and Tellegen (1978) cautioned that interpretation of MMPI mean profiles
is complicated by the content heterogeneity of the standard scales. They suggested
analyzing individual item content or subscales to provide a more accurate interpretation
of the overall profile. While all studies have found high endorsement of items directly
reflecting somatic distress and pain-related disability with chronic pain patients, their
findings have differed on the more psychological components of the composite pain
patient profile. In other words, there are conflicting personality cluster findings in a
chronic pain patient population. For example, Watson (1982) concluded that pain patients
are hypochondriacal and depressed, but that item analysis showed little evidence of
hysteroid denial, repression, and defensiveness. In contrast, Franz, Paul, Bautz, Choroba,
and Hildebrandt (1986) reported that the average pain patient described himself as even
more socially competent and self-confident than did normal controls, denied anger and
11
aggressiveness, and did not possess hypochondriacal tendencies. Other researchers have
shown that similar elevations on scales such as Hs and Sc may in fact reflect quite
different combinations of item content, suggesting that interpretation in these items may
have varied by different patients (McGrath & O’Malley, 1986; Moore, McFall, Kivlahan,
& Capestany, 1988; Prokop, 1986). These inconsistent results have reflected the
heterogeneity of chronic pain patients. The dilemmas with research addressing the
chronic pain personality is that mean profiles and group averages have obscured
individual differences and possible pain patient subgroups (Keller & Butcher, 1991).
Fordyce (1976) cautioned researchers what the illusion of homogeneity in both patients
and treatments. Researchers and clinicians have too often assumed that labeling a person
as a chronic pain patient or labeling treatment as cognitive may mean that both patient
and treatment have conformed to the typical characteristics of each. In order to move
away from obscuring individual differences and the illusion of homogeneity, the MMPI
literature has reflected a growing tendency to look beyond group homogeneity. The
MMPI literature has reflected a growing tendency to look beyond group averages and
concentrate on pattern analysis and subgrouping of pain patient profiles. Several
different classification approaches have been identified in attempting to subgroup, and
better understand, the chronic pain patient. Some of these approaches have included, but
are not limited to, functional versus organic pain and secondary gain compensation
status.
The major dichotomy into which researchers have tried to classify patients is
functional versus organic pain. Functional has implied that the pain problem has been

12
caused or maintained by psychosocial factors, whereas organic has assumed a
physiologic basis (Keller & Butcher, 1991). Hanvik (1949) first described a method of
discriminating functional and organic pain patients on the basis of MMPI profiles. He
found that patients classified as functional tended to score higher on scales Hs, Hy, Pt,
Sc, and Pd, with the overall profile characterized by a conversion-V pattern of
hypochondriasis and hysteria with relatively little depression. Other researchers have
reported that functional patients are characterized by elevated profiles, evidence of
greater psychopathology, and a conversion-V or neurotic-triad pattern (Freeman, Calsyn,
& Louks, 1976; Lair & Trapp, 1962; McCreary, Turner, & Dawson, 1977). However,
these researchers and others have cautioned that conversion-V profiles occur in the
organic population as well, and the degree of overlap between organic and functional
groups made it impossible to use such profiles for individual diagnoses (Adams,
Heilbronn, Silk, Reider, & Blumer, 1981; Osborne, 1985). Other researchers, in contrast
to Hanvik, have failed to find differences between organic and functional groups even
when using mean profiles (Cox, Chapman, & Black, 1978; Hendler, Mollett, Talo, &
Levin, 1988; Leavitt, 1985). In general, classification of patients into organic and
functional categories has not proven particularly replicable or useful in treatment
planning.
Another way to classify patients has been based on evidence of secondary gain as
exemplified by studies of compensation status. Elevated pain reports and elevated Hs, D,
Hy, and Pd scales on the MMPI have been associated with potential or ongoing insurance
compensation or litigation (Beals & Hickman, 1972; Pollack & Grainey, 1984; Shaffer,

13
Nussbaum, & Little, 1972). However, other investigators have found no differences
between compensation claimants and nonclaimants on various measures including reports
of pain severity, MMPI patterns, level of psychological disturbance, or treatment
outcome (Chapman, Brena, & Bradford, 1981; Mendelson, 1984; Trief & Stein, 1985).
Just as with the previous classification schemes discussed, grouping patients by
compensation status alone is probably too simplistic to result in reliable, meaningful
patient correlates and treatment prognosis.
Although the classification approaches cited above show promise in defining
subgroups of patients with shared treatment-relevant characteristics, they were based on
preconceived classification schemes with little empirical validation that these
characteristics actually form reliable and meaningful patient groups. Given the
multifaceted nature of chronic pain problems, it has seemed unlikely that subgrouping
patients along single dimensions will lead to more than minimal improvements in the
accuracy with which treatment efficacy can be predicted (Keller & Butcher, 1991). One
way to address this complexity would be to abandon the search for the chronic pain
personality and instead look for subgroups of patients who are similar to each other in
their pattern of scores on the MMPI.
Recently, several investigators have employed cluster analysis to explore the
complexities in relationships inherent in an entire profile of assessment data, with the
hope of discovering empirically which patient characteristics are reliably associated with
each other and can be used to classify treatment-relevant subgroups of patients.
Cluster Analysis and the MMPI

14
Cluster analysis in its broadest definition is “the general logic, formulated as a
procedure, by which we objectively group together entities on the basis of their
similarities and differences” (Tyron & Bailey, 1970). When the entities to be grouped
are variables such as test scores measured across several individuals, the clustering
procedure is known as factor analysis. Cluster analysis in its narrower definition is the
opposite procedure to factor analysis. It is a method for grouping objects on the basis of
the similarity of their patterns of scores across multiple variables. A common example
would be the attempt in medicine to group patients by syndromes, different patterns of
intercorrelated individual signs and symptoms (Green, 1978; Tryon & Bailey, 1970).
Theoretically, cluster analysis differs from other discriminant analysis (also a
multivariate method for classifying subjects) because it is not necessary to know the
group membership of a few individuals ahead of time, or even how many meaningful
subgroups exist. It provides a method for identifying subgroups of patients whose
patterns of scores are maximally similar to each other and maximally different from the
patterns of subjects in other groups (Norusis, 1985).
There are several methods of performing a cluster analysis. Most studies of
chronic pain patients have used a hierarchical clustering procedure. The program starts
by treating each individual as a separate cluster and then progressively combines similar
individuals into larger and larger clusters, ending with the total sample (Green, 1878;
Norusis, 1985; SPSS, 1986; Tryon & Bailey, 1970). Since cluster solutions may vary
with the computer program used, similarity measure chosen, and the procedure used to
determine the optimal number of clusters, it is important for researchers to describe their
15
procedure and assumptions carefully (Blashfield, 1980). There is no single correct
number of clusters existing in a data set; the researcher must determine the optimal
combination of between group difference, within group similarity, and meaningfulness of
profile patterns for his or her particular application.
Researchers have performed cluster analyses on both mixed chronic pain and
chronic low-back pain populations. Sternbach (1974) was the first to explore
conceptually an MMPI cluster analysis. He collected MMPIs on a mixed-pain
population at a Veteran’s Administration hospital and determined that 4 male clusters
were found. Prokop, (1980) replicated Sternbach’s (1974) study in other samples of
chronic pain patients. Their sample contained patients with multiple pain complaints,
ranging from headaches and pain in the extremities to total body pain, but excluded
patients with low-back pain alone. The analysis yielded 3 female and 4 male clusters.
Armentrout (1982) analyzed MMPIs collected on 240 patients that were being treated at
a Veterans Administration hospital. A cluster analysis was performed that yielded 3 male
clusters. In 1983, Bernstein performed a hierarchical-group cluster analysis on MMPIs
collected on 77 female mixed pain patients in a private clinic. The analysis yielded 5
female clusters. A hierarchical cluster analysis attempts to identify relatively
homogeneous groups or cases based on selected characteristics, using an algorithm that
starts with each case in a separate cluster, and combines clusters until only one is left
(Tabachnick, 2001).
Hart (1984) analyzed MMPIs collected on 70 mixed pain patients being treated at
a university hospital, utilizing a K-means cluster analysis yielded 4 male clusters. A k-

16
means cluster analysis attempts to identify relatively homogeneous groups, based on
selected characteristics, using an algorithm that can handle large numbers of cases.
However, the algorithm requires you to specify the number of clusters. You are able to
specify the initial cluster centers if you know this information. You can select either one
or two methods for classifying cases, either updating cluster centers iteratively or
classifying only (Tabachnick, 2001).
Costello (1987) performed a weighted average/cosine cluster analysis on 170
MMPIs collected on females with mixed pain being treated at a university clinic, which
yielded 3 female clusters. A weighted average/cosine procedure is an agglomerative
hierarchical clustering method that uses a cosine, or pattern similarity measure, that
constructs proximities matrices while the clustering method averages linkages within
groups.
Bombardier, Divine, Jordan, Brooks and Neelon (1993) looked at 548 MMPIs
collected on low-back pain patients being treated at a university hospital. A cluster
analysis was performed on k-corrected MMPI T-scores using the fastclus procedure from
SAS (1985). Fastclus is a cluster optimization technique, which does not assume a
hierarchical relationship among clusters and allows relocation of cases throughout the
clustering process, which yielded 4 female and 3 male clusters. McGill (1983) performed
an h-group cluster analysis on 92 MMPIs collected on low-back pain patients collected at
a private clinic, which yielded 4 male and 4 female clusters. Bradley (1984) performed
an h-group cluster analysis on 314 MMPIs collected on low-back pain patients at a
university hospital, which yielded 4 female and 4 male clusters. McCreary (1985)

17
performed a k-means cluster analysis on 401 MMPIs collected on low-back pain patients
being treated at a university hospital, which yielded 5 female and 4 male clusters.
To date, 3 researchers have performed cluster analysis utilizing MMPI-2 data.
Keller and Butcher (1991) performed an SPSS hierarchical cluster analysis on 502
MMPI-2s collected on mixed-pain patients being treated at a pain clinic, which yielded 3
male and 3 female clusters. Riley (1993) performed a hierarchical/agglomerative cluster
analysis on 201 MMPI-2s collected at a pain clinic, which yielded 4 mixed clusters.
DeBeus (1997) performed a hierarchical cluster analysis on 2051 chronic low-back pain
patients being treated at a multidisciplinary pain clinic, which yielded 4 male and 4
female clusters.
Classifying Chronic Pain Using the Millon Clinical Multiaxial Inventory–III (MCMI-III)
The MCMI-III is a revision of the MCMI. The MCMI-III was introduced in
August 1994 at the meeting of the American Psychological Association. It is a revision
of the MCMI-II (Millon, 1987) and MCMI-I (Millon, 1977), which have become
increasingly popular since their introductions. To date, only one MCMI-III cluster
analysis study has been completed. Allen, Huntoon and Evans (1999) employed cluster
analysis of the MCMI-III personality disorder scales to determine whether there is
meaningful heterogeneity within a group of 227 severely traumatized women who were
treated in a specialized inpatient program. Their analysis distinguishes 5 clinically
meaningful clusters, which were labeled alienated, withdrawn, aggressive, suffering and
adaptive. Their study employed Ward’s hierarchical cluster analysis on the participants
(with squared Euclidian distance as the distance measure).

18
To date, no study has been cited utilizing the MCMI-III with chronic pain
patients, yet the MCMI-III is utilized in the assessment process regularly. It is one of the
25 most popular personality inventories administered in chronic pain programs (Allen,
Huntoon & Evans, 1999). Furthermore, no study in the literature compares the MMPI-2
and the MCMI-III in the assessment process.
Purpose of the Study
Adequate assessment of chronic pain patients can help to address many of the
problems inherent in the complex multidimensional models of chronic pain etiology and
approaches to treatment (Keller and Butcher, 1991). Therefore, it is suggested that two
major goals of assessment should be:
(1) To describe the characteristics of the typical pain patient and to understand
the average pain-patient personality. Such descriptions have relevance for
guiding clinicians in developing general treatment programs that address
these components of the chronic pain syndrome.
(2) To describe the differences among pain patients. Adequate assessment of the
constellation of factors contributing to a particular client’s pain problem
could potentially cut these costs by accurately predicting who might benefit
from such a program, allowing selection of those patients most likely to show
gains. Even more helpful, however, would be the ability to identify groups of
patients with certain factors in common that will respond best to certain
treatment components. It is possible that matching patients to an appropriate
treatment could simultaneously cut costs and improve outcome statistics.

19
Both of these assessment goals have been most consistently addressed using the
Minnesota Multiphasic Personality Inventory (MMPI). At this point other assessment
instruments and approaches have not received enough attention in the literature to
provide comparably extensive data. Often, pain programs will employ a variety of
instruments during the assessment process. The Millon Clinical Multiaxial Inventory
Third Edition (MCMI-III) now occupies a central place in assessment tools used. Often,
the MMPI-2 and the MCMI-III are given simultaneously during an assessment process;
however, to date, no studies have compared these two instruments with pain patients.
As noted in the previous literature review, there have been at least 11 MMPI
clustering studies involving pain populations, and three MMPI-2 clustering studies with
the same population, over a period of 26 years. Therefore, the present study has
examined which MCMI-III subscales predicted cluster membership in the previously
reported MMPI-2 clusters. Several hypotheses were developed for this study using
correlations between the MCMI-III clinical scales (Millon, 1997) and the MMPI-2
clinical scales.
As cited earlier, previous MMPI-2 cluster analysis studies have produced four
clusters. This study used the same four clusters. The first cluster was to have been an
MMPI-2-within-normal limits profile (all scores remained under the clinical cut-off of
65). The second cluster was to have contained the MMPI-2 conversion-V profile (Hs and
HY 10 points > D). The third cluster was to have produced a neurotic triad elevation.
The fourth cluster was to have produced a generally elevated profile. The MMPI-2
cluster members were determined by the algorhythms utilized by Pearson Assessments,

20
using the three validity scales and ten clinical scales. Males and females were analyzed
separately. Statistical Package for the Social Sciences (SPSS) (SPSS, 2001, Ver. 11) was
the statistical software used for analysis.
The present study has examined the following 4 hypotheses:
1. Membership in the first MMPI-2 cluster profile (within-normal-limits)
was to be predicted by no elevations of any MCMI-III clinical subscale.
The dependent variable will be cluster membership on MMPI-2 cluster
1.
2. Cluster membership in the second MMPI-2 cluster profile (conversion-
V profile [Hs and HY 10 points > D] and elevations on the Pt and Sc
scales) was to be predicted by elevations on MCMI-III scales H
(Somatoform), CC (Major Depression), SS (Thought Disorder), A
(Anxiety), 3 (Dependent), B (Borderline), D (Dysthymia), R (Post
Traumatic Stress Disorder) and 2B (Depressive).
3. Cluster membership in the third MMPI-2 cluster profile, neurotic triad
profile (elevations on Hs, D, HY) was to be predicted by elevations on
MCMI-III scales CC (Major Depression), D (Dysthymia), H
(Somatoform), and 3 (Dependent), 8B (Masochistic) and the dependent
variable being MMPI-2 cluster number 3.
21
4. Cluster membership in the fourth MMPI-2 cluster profile (generally
elevated profile) was to be predicted by elevations on MCMI-III scales
H (Somatoform), D (Dysthymia), CC (Major Depression), 6A
(Antisocial), SS (Thought Disorder), 3 (Dependent) and S
(Schizotypal) with the dependent variable being membership in MMPI-
2 cluster number 4.
METHOD
Subjects
Two hundred and forty-two participants were drawn from the assessment data
base of the Dallas Spinal Rehabilitation Center (DSRC). DSRC is a multi-disciplinary
outpatient rehabilitation center, specializing in physical and behavioral medicine for
treatment of back injury and/or failed back surgery. While most DSRC patients have
sustained lumbar (low-back) injuries, the program also treats those with cervical injuries
(neck). The rehabilitation center is a secondary and tertiary treatment program based in
Dallas, Texas. Each patient has a primary diagnosis related to a back and/or a cervical
injury and is experiencing in addition, a chronic back pain diagnosis and often medical
prescription dependency and addiction. Each has experienced back pain in the lumbar
region (L1 to L5) or cervical region (C1 to C7) for more than 32 months. Patients with
thoracic (mid-spine) and carpal tunnel pain were excluded from this study.
The sample included 118 females 126 males. Subjects ranged in age from 22 to
68 years old, with a mean age of 45.9 years. The ethnic makeup of the participants

22
included 127 Caucasians, 54 African Americans, 47 Hispanics and 8 “other.” Educational
level ranged from 2 to 18 years, with a mean educational level of 11.45 and standard
deviation of 2.637. Only those patients who had completed the written portions of the
assessment procedures were included.
All clinic patients assessed with the Minnesota Multiphasic Personality Inventory
–Second Edition (MMPI-2) and Millon Clinical Multiaxial Inventory – Third Edition
(MCMI-III) were able to read and write. They had all given informed consent (Appendix
A, B) for their assessment and their participation in the rehabilitation program. The clinic
is Health Information Portability and Privacy Act (HIPPA) and CARF compliant.
Procedure
Each patient in this study sample was referred to the clinic by his/her physician.
Most have Worker’s Compensation patients or private insurance patients who had not
recovered satisfactorily from a back or neck injury as described above. Each was
interviewed and oriented to the program prior to admission. At admission, each patient
was required to complete a set of documents regarding informed consent. Full
demographic information was obtained and the medical and health care histories were
carefully reviewed. Assessment procedures were fully explained to them at orientation,
and all questions were answered. Patients completed another face-to-face intake
interview, as well as a set of written assessments. Among the written assessments
administered were MMPI-2 and the MCMI-III, which are the focus of this research. The
test instruments were given in a testing room under supervision of behavioral medicine
staff.
23
Responses to the MMPI-2 and the MCMI-III were entered into a software scoring
package (Pearson) by their assigned DSRC case manager. Other assessment and
demographic information was entered into a computerized data collection file for further
analysis. Follow-up information was entered into the data base by a behavioral medicine
therapist. Client confidentiality was carefully preserved at every step in this process.
Client information was transferred into the research data base by a member of the
behavioral medicine staff, who is trained in HIPPA compliance regulations. Each patient
was assigned a subject number in the research data base to further insure confidentiality
and disidentification.
Instruments
The MMPI-2 (Butcher, et al., 1989) is a 567-item true/false self-report
questionnaire. The MMPI-2 represents the restandardization of the MMPI that marks the
advent of a new era of clinical usage and research of this venerable inventory.
Restandardization of the MMPI was needed to provide current norms for the inventory,
develop a nationally representative and larger normative sample, provide appropriate
representation of ethnic minorities, and update item content where needed (Greene,
2000). The MMPI-2 was standardized on a sample of 2,600 individuals (1138 men and
1462 women) selected to reflect national census (1980 U.S. Census) parameters on age,
marital status, ethnicity, and so on (Butcher, Dahlstrom, Graham, Tellegen, & Kaemmer,
1989). Continuity between the MMPI and the MMPI-2 was maintained because new
criterion groups and item derivation procedures were not used on the standard Validity
and Clinical scales. Thus, the items on the validity and clinical scales of the MMPI are
24
essentially unchanged on the MMPI-2 except for the elimination of 13 items based on
item content and rewording of 68 items (Green, 2000). One difference between the
MMPI and MMPI-2 is the conversion of raw scores into T-scores. The MMPI’s T-scores
were developed to be “uniform” by combining the raw scores of the eight clinical sales
(Hs, D, Hy, Pd, Pa, Pt, Sc, and Ma) into a composite distribution, then regressing the
component scales against the composite to obtain T-score conversion formulas (Tellegen,
1988). Out of this new approach, the “critical” level of elevation has been changed to a T-
score of 65, appearing to be the optimal point for separating the normative sample from
various clinical groups (See Appendices A and B) (Butcher, Dahlstrom, Graham,
Tellegen, & Kaemmer, 1989). The revised MMPI-2 Manual for Administration, Scoring
and Interpretation (Hathaway and McKinley, 1989) describes the distributions of age,
geographic location, ethnic origin, educational attainment, marital status, occupation, and
income level in the male and female samples.
The MCMI-III (Millon, 1994) is a self-report measure of personality disorders
whose scales underwent a three-step validation model based on a model developed by
Loevinger (1957). In the first, theoretical-substantive step items were selected that were
consistent with Millon’s theoretical framework (Millon, 1990, Millon & Davis, 1996). In
the second, internal-structural stage scales were constructed on the basis of high internal
consistency and proper overlap with other theoretically congruent personality disorder
scales. The third, external-criterion stage, ensured correspondence between the test scale
items and a variety of nonscale measures of the trait or syndrome under study. The third
stage entails correlating results obtained on preliminary forms of the inventory with

25
relevant clinical behavior. This latter step indicates that the MCMI should be an
important source of data regarding associations between personality disorders, but the
first two steps have raised concerns because they indicate the test was slanted in the
direction of one theory. In particular, the overlap between theoretically congruent scales
is partially due to the use of overlapping items; some items were used in computing
scores for more than one personality scale.
The normative sample for the MCMI-III instrument consists of 998 males and
females representing a wide variety of diagnoses. The group includes patients seen in
independent practices, clinics, mental health centers, residential settings, and hospitals.
Because the norms are based on clinical samples, the instrument is not appropriate for
use with non-clinical populations.
The MCMI-III the second major revision of the MCMI, is a 175-item True-False
inventory with five sets of scales, including (a) 11 personality disorder scales (Schizoid,
Avoidant, Depressive, Dependent, Histrionic, Narcissistic, Antisocial, Aggressive,
Compulsive, Negativistic, and Masochistic), (b) 3 severe personality disorder scales
(Schizotypal, Borderline, and Paranoid), (c) 7 clinical syndrome scales (Anxiety,
Somatic, Manic, Dysthymic, Alcohol, Drug, and PTSD), (d) 3 severe syndrome scales
(Thought Disorder, Major Depression, and Delusional), and (e) 3 validity scales
(Disclosure, Desirability, and Debasement). This latest revision of the MCMI includes 1
new personality disorder scale (Depressive) and 1 new clinical syndrome scale (PTSD),
which are both highly relevant to the concerns of this study. The base-rate scores are
intended to reflect the likelihood of disorder, and low scores are not intended to be
26
clinically meaningful, yet we will allow the full range of base-rate scores to enter the data
analyses.
The MCMI-III attempts to predict the dichotomous presence or absence of a
clinical disorder through the use of base rate scores. Patients with scores over 84 are
identified as having the disorder, and those with scores under 85 are seen as not having
the disorder. These data allow the use of Bayesian statistics for validity estimates
(Retzlaff, 1996). Actual knowledge of the presence or absence of a disorder is
unattainable, so clinician judgment is substituted for reality. These hit rate statistics are
in addition to and usually more demanding than the traditional convergent and divergent
correlation coefficients against other scales of similar construct (Nunnally, 1978).
Statistics
The present study explored four hypotheses. The first hypothesis, membership in
the first MMPI-2 cluster profile (within-normal-limits) was to be predicted by no
elevations on any MCMI-III clinical subscales and was tested using a multiple regression
analysis. The independent variables will be the MCMI-III clinical subscales and the
dependent variable was cluster membership in MMPI-2 cluster 1.
The second hypothesis, cluster membership in the second MMPI-2 cluster profile
(conversion-V profile [Hs and HY 10 points > D] and elevations on the Pt and Sc scales)
was to be predicted by elevations on MCMI-III scales H (Somatoform), CC (Major
Depression), SS (Thought Disorder), A (Anxiety), 3 (Dependent), B (Borderline), D
(Dysthymia), R (Post Traumatic Stress Disorder) and 2B (Depressive). This hypothesis

27
was tested utilizing a multiple regression with the dependent variable being cluster
membership in MMPI-2 cluster number 2.
The third hypothesis, cluster membership in the third MMPI-2 cluster profile
(neurotic triad profile elevations on Hs, D, HY) was to be predicted by elevations on
MCMI-III scales CC (Major Depression), D (Dysthymia), H (Somatoform), and 3
(Dependent), 8B (Masochistic) and was tested utilizing a multiple regression analysis
with the dependent variable of cluster membership in MMPI-2 cluster number 3.
The fourth hypothesis, cluster membership in the fourth MMPI-2 cluster profile
(generally elevated profile) was to be predicted by elevations on MCMI-III scales H
(Somatoform), D (Dysthymia), CC (Major Depression), 6A (Antisocial), SS (Thought
Disorder), 3 (Dependent) and S (Schizotypal). Hypothesis four was tested using a
multiple regression analysis with the dependent variable being membership in MMPI-2
cluster number 4.
In addition to the above-mentioned research hypothesis, data was analyzed for 19
subjects who completed an MCMI-III at discharge. Paired Samples t-tests were
performed on each MCMI-III clinical scale to assess change following treatment.
Furthermore, follow-up data from patient questionnaires was collected on these same
individuals at discharge and one month following discharge. Correlations of behavioral
changes were performed for the purpose of generating future research hypotheses.
Power
Since power (the probability of detecting an effect if one is present) was a
concern, a power analysis was conducted to estimate the sample size necessary to detect

28
an effect of the relationship of the MCMI-III clinical scales and the MMPI-2 clusters.
Cohen (1988) has suggested that .80 is a good standard for the minimum power necessary
before beginning a study (as cited in Aiken & West, 1991). Using power tables, a sample
size of 180 participants was found to be sufficient to detect a small effect (r = -.15) with a
power = .95.
29
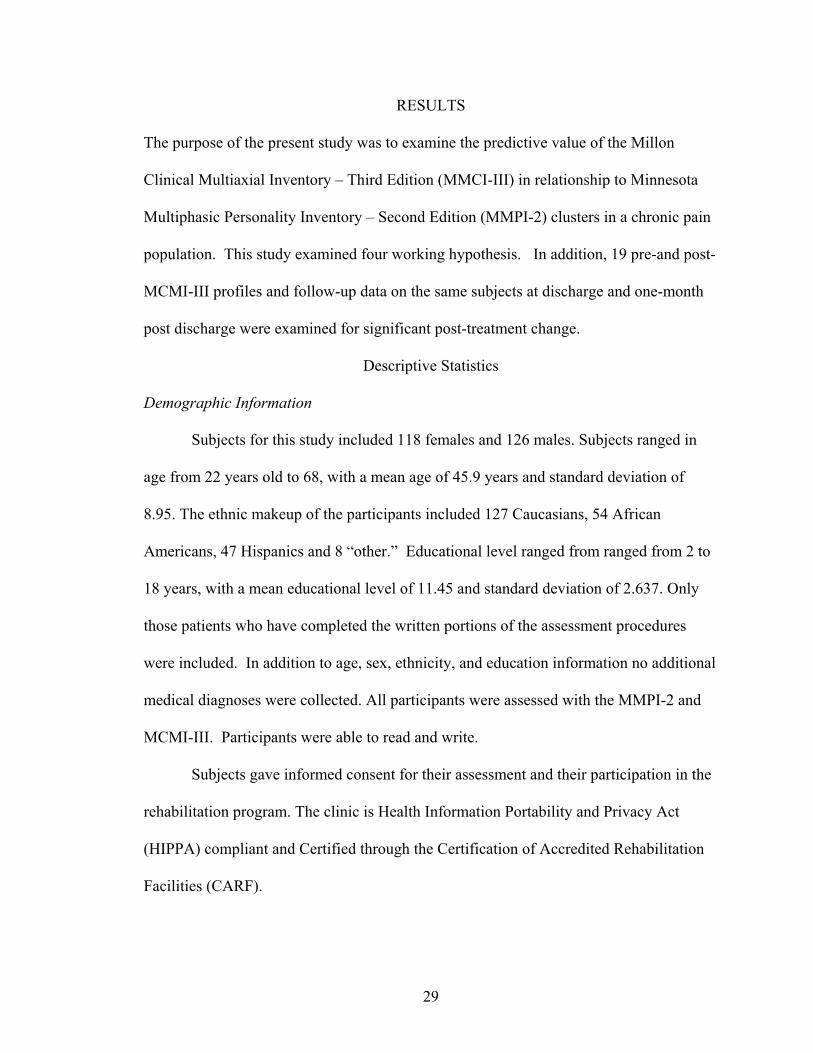
RESULTS The purpose of the present study was to examine the predictive value of the Millon
Clinical Multiaxial Inventory – Third Edition (MMCI-III) in relationship to Minnesota
Multiphasic Personality Inventory – Second Edition (MMPI-2) clusters in a chronic pain
population. This study examined four working hypothesis. In addition, 19 pre-and post-
MCMI-III profiles and follow-up data on the same subjects at discharge and one-month
post discharge were examined for significant post-treatment change.
Descriptive Statistics
Demographic Information
Subjects for this study included 118 females and 126 males. Subjects ranged in
age from 22 years old to 68, with a mean age of 45.9 years and standard deviation of
8.95. The ethnic makeup of the participants included 127 Caucasians, 54 African
Americans, 47 Hispanics and 8 “other.” Educational level ranged from ranged from 2 to
18 years, with a mean educational level of 11.45 and standard deviation of 2.637. Only
those patients who have completed the written portions of the assessment procedures
were included. In addition to age, sex, ethnicity, and education information no additional
medical diagnoses were collected. All participants were assessed with the MMPI-2 and
MCMI-III. Participants were able to read and write.
Subjects gave informed consent for their assessment and their participation in the
rehabilitation program. The clinic is Health Information Portability and Privacy Act
(HIPPA) compliant and Certified through the Certification of Accredited Rehabilitation
Facilities (CARF).

30
Descriptive statistics, including frequencies, means, standard deviations, stem-
and-leaf displays, box-whisker plots, skewness, kurtosis, and standard error (SE) of
skewness and kurtosis were performed on demographic and psychosocial information.
Diagnostic statistics investigated the areas of normality, linearity, homoscadicity and
heteroscadicity, and checked for the presence of outliers. There were no outliers;
however, violations of normality assumptions were found and log transformations were
attempted. Overall, the transformations did not significantly change the majority of
calculated results and are not reported. Perusal of scatterplots indicated no problems with
linearity or heteroscadasticity.
Preliminary analysis indicated that 19 male and two female MCMI-III profiles
were completed incorrectly. Therefore, these cases were discarded prior to hypothesis
testing.
Male Clusters
The clustering procedure produced 4 homogeneous cluster profiles across the
male sample. Please refer to figure 1 for a graphic presentation of the male clustering
results. The first male cluster showed elevations on scales Hs, D, Hy, as well as Pt and Sc
(n = 37, 30%). Specifically, Hs, D, and Hy all showed elevations over 80, Hs and Hy
being under 85, and D being at 85, Pt and Sc equaled 75.
The second male cluster produced slight elevations Hs and Hy. This cluster
profile produced a reduced elevation on the V profile. Specifically, the distance between
the D scale and Hs and Hy scales was 5 points but not more than 10 points. All other
scales were under the clinical cut-off of 65 (n = 39, 31%).

31
The third male cluster produced elevations on scales Hs, D, Hy and Pt, and a
slight elevation on Sc (n = 28, 23%). This cluster also produced a reduced elevation on
the V profile. The distance between the D scale and the Hs and Hy scales was more than
5 points, but not more than 10 points.
The fourth male cluster produced a generally elevated profile (n = 20, 16%). The
cluster contained generally elevated scales on F, Hs, D, Hy, Pd, Pa, Pt, Sc and Si. This
cluster, as with the second cluster, produced a reduced elevation on the V profile. The
fourth cluster had a distance between the D scale and the Hs and Hy scales of 5 points, no
more than 10 points. Figure 1 provides a summary of these profiles.
Figure 1 MMPI-2 Male Clusters
mmpi scales
0
20
40
60
80
100
120
T_L
T_F
T_K
T_Hs
T_D
T_Hy
T_Pd
T_M
t
T_Pa
T_Pt
T_Sc
T_M
a
T_Si
Scales
Mea
n
Cluster 1 (N=37)Cluster 2 (N=39)Cluster 3 (N=28)Cluster 4 (N=20)

32
Female Clusters
The clustering procedure yielded three homogeneous female MMPI-2 clusters.
We were expecting four distinct clusters; however, upon further examination of
individual female MMPI-2 profiles, no within-normal-limits profiles were found. Thus,
the within-normal-limits cluster is missing from this female sample. The first female
cluster produced slight elevations on Hs and Hy and a slight elevation on D (n = 49,
42%). This cluster profile produced a slightly elevated V profile, with the distance
between D and Hs and Hy scales were more than 5 and less than 10.
The second cluster profile produced elevations on F, Hs, D, Hy, Pd, Pa, Pt, Sc
and a slight elevation on Si. This profile would be characterized as the generally elevated
profile (n = 31, 27%). The third female cluster profile produced elevations on Hs, D, Hy,
Pt and Sc (n = 36, 31%). Figure 2 provides a summary of these profiles.

33
Figure 2
MMPI-2 Female clusters
mmpi scales
0102030405060708090
100
T_L
T_F
T_K
T_H
sT_
DT_
Hy
T_P
dT_
Mt
T_P
aT_
Pt
T_S
cT_
Ma
T_S
iScales
Mea
n Cluster 1 (N=36)Cluster 2 (N=31)Cluster 3 (N=49)
Hypothesis Testing
Males and females were analyzed separately. Therefore, this discussion will
report on men and women independently. The first hypothesis, membership in the first
male MMPI-2 cluster profile (within-normal-limits) will be predicted by no elevations of
any MCMI-III clinical subscales was tested using a multiple regression analysis. The
independent variables were the MCMI-III clinical subscales and the dependent variable
was cluster membership in the male MMPI-2 cluster 1. This hypothesis was not
supported by the statistical analysis as shown in Table 1. The regression equation while

34
not significant as a predictor of cluster membership in MMPI-2 male cluster 1, it did
show one individual predictor, MCMI-III 7 Compulsive (F = .917, p < .587 (See
Appendix D, Supplemental Table 1).
Table 1
Regression summary hypothesis 1 – males
________________________________________________________________________
Model Summary
R R Square Adjusted R Square
Std. Error of the
Estimate
Change Statistics
Model R SquareChange
FChange
df1 df2 Sig. F Change
1 .489 .239 -.022 .41715 .239 .917 27 79 .587 ANOVA
Model Sum of Squares
df Mean Square F Sig.
1 Regression 4.309 27 .160 .917 .587Residual 13.747 79 .174
Total 18.056 106a Predictors: (Constant), BR_PP - Delusional Disorder, BR_4 - Histrionic, BR_H - Somatoform, BR_5 - Narcisstic, BR_T - Drug Dependence, BR_7 - Compulsive, BR_D - Dysthymia, BR_N - Bipolar Manic, BR_6B - Sadistic (Agressive), BR_8B - Masochistic (Self-Defeating), BR_3 - Dependent, BR_8A - Negativistic (Passive Aggressive), BR_1 Schizoid, BR - S - Schizotypal, BR_A - Anxiety, BR_CC - Major Depression, BR_R - Post-Traumatic Stress Disorder, BR_X - (Validity? ) , BR_SS - Thought Disorder, BR_2A - Avoidant, BR_B Alcohol Dependence, BR - 2B Depressive, BR - Z Deabasement, BR_C - Borderline, BR_P - Paranoid, BR_Y-desirability, BR_6A - Antisocial b Dependent Variable: MMPI-II Cluster1
The second hypothesis, cluster membership in the second MMPI-2 cluster profile
(conversion-V profile [Hs and HY 10 points > D] and elevations on the Pt and Sc scales)
will be predicted by elevations on MCMI-III scales H (Somatoform), CC (Major
Depression), SS (Thought Disorder), A (Anxiety), 3 (Dependent), B (Borderline), D
(Dysthymia), R (Post Traumatic Stress Disorder) and 2B (Depressive), was tested

35
utilizing a multiple regression with the dependent variable being cluster membership in
MMPI-2 male cluster number 2. This hypothesis was not supported for males as shown
in Table 2. The regression equation was significant as a predictor of cluster membership
in MMPI-2 male cluster 2 (F = 1.650, p < .045). Furthermore, it did show one individual
predictor, MCMI-III scale 7 Compulsive (t = -2.347, p < .021). (See Appendix D,
Supplemental Table 2)
Table 2 Regression summary hypothesis 2-males
________________________________________________________________________
Model Summary
R R Square
AdjustedR Square
Std. Error of the Estimate
Change Statistics
Model R Square Change F Change df1 df2 Sig. FChange
1 .601 .361 .142 .41364 .361 1.650 27 79 .045 _____________________________________________________________________________________ ANOVA
Model Sum of Squares
df Mean Square
F Sig.
1 Regression 7.623 27 .282 1.650 .045Residual 13.517 79 .171
Total 21.140 106a Predictors: (Constant), BR_PP - Delusional Disorder, BR_4 - Histrionic, BR_H - Somatoform, BR_5 - Narcisstic, BR_T - Drug Dependence, BR_7 - Compulsive, BR_D - Dysthymia, BR_N - Bipolar Manic, BR_6B - Sadistic (Agressive), BR_8B - Masochistic (Self-Defeating), BR_3 - Dependent, BR_8A - Negativistic (Passive Aggressive), BR_1 Schizoid, BR - S - Schizotypal, BR_A - Anxiety, BR_CC - Major Depression, BR_R - Post-Traumatic Stress Disorder, BR_X - (Validity? ) , BR_SS - Thought Disorder, BR_2A - Avoidant, BR_B Alcohol Dependence, BR - 2B Depressive, BR - Z Deabasement, BR_C - Borderline, BR_P - Paranoid, BR_Y-desirability, BR_6A - Antisocial b Dependent Variable: MMPI-II Cluster2
The third hypothesis, cluster membership in the third male MMPI-2 cluster
profile (neurotic triad profile elevations on Hs, D, HY) will be predicted by elevations on

36
MCMI-III scales CC (Major Depression), D (Dysthymia), H (Somatoform), and 3
(Dependent), 8B (Masochistic) was tested utilizing multiple regression analysis with the
dependent variable being cluster membership in MMPI-2 male cluster number 3. The
regression equation was not significant as a predictor of cluster membership in MMPI-2
male cluster 3 (F = 1.456, p < .102) as shown in Table 3. Furthermore, it did show one
individual predictor, MCMI-III scale X Validity (See Appendix D, Supplemental Table
3).
Table 3 Regression summary hypothesis 3 – males
________________________________________________________________________
Model Summary
R R Square Adjusted RSquare
Std. Error of the
Estimate
Change Statistics
Model R SquareChange
FChange
df1 df2 Sig. FChange
1 .576 .332 .104 .33016 .332 1.456 27 79 .102 _____________________________________________________________________________________ ANOVA
Model Sum of Squares
df Mean Square F Sig.
1 Regression 4.286 27 .159 1.456 .102Residual 8.611 79 .109
Total 12.897 106a Predictors: (Constant), BR_PP - Delusional Disorder, BR_4 - Histrionic, BR_H - Somatoform, BR_5 - Narcisstic, BR_T - Drug Dependence, BR_7 - Compulsive, BR_D - Dysthymia, BR_N - Bipolar Manic, BR_6B - Sadistic (Agressive), BR_8B - Masochistic (Self-Defeating), BR_3 - Dependent, BR_8A - Negativistic (Passive Aggressive), BR_1 Schizoid, BR - S - Schizotypal, BR_A - Anxiety, BR_CC - Major Depression, BR_R - Post-Traumatic Stress Disorder, BR_X - (Validity? ) , BR_SS - Thought Disorder, BR_2A - Avoidant, BR_B Alcohol Dependence, BR - 2B Depressive, BR - Z Deabasement, BR_C - Borderline, BR_P - Paranoid, BR_Y-desirability, BR_6A - Antisocial b Dependent Variable: MMPI-II Cluster3

37
The fourth hypothesis, cluster membership in the fourth male MMPI-2 cluster
profile (generally elevated profile) will be predicted by elevations on MCMI-III scales H
(Somatoform), D (Dysthymia), CC (Major Depression), 6A (Antisocial), SS (Thought
Disorder), 3 (Dependent) and S (Schizotypal) was tested using multiple regression
analysis with the dependent variable being membership in MMPI-2 male cluster number
4. This hypothesis was not supported for males. The regression equation was not
significant as a predictor of cluster membership in MMPI-2 male cluster 4 (F = 1.173, p
< .287). Furthermore, it did show one individual predictor, MCMI-III X Validity. (See
Appendix D, Supplemental Table 4)
Table 4
Regression summary hypothesis 4 – males
Model Summary
R R Square Adjusted RSquare
Std. Error of the Estimate
Change Statistics
Model R SquareChange
F Change df1 df2 Sig. FChange
1 .535 .286 .042 .473 .286 1.173 27 79 .287 ANOVA
Model Sum of Squares
df Mean Square F Sig.
1 Regression 7.093 27 .263 1.173 .287Residual 17.692 79 .224
Total 24.785 106a Predictors: (Constant), BR_PP - Delusional Disorder, BR_4 - Histrionic, BR_H - Somatoform, BR_5 - Narcisstic, BR_T - Drug Dependence, BR_7 - Compulsive, BR_D - Dysthymia, BR_N - Bipolar Manic, BR_6B - Sadistic (Agressive), BR_8B - Masochistic (Self-Defeating), BR_3 - Dependent, BR_8A - Negativistic (Passive Aggressive), BR_1 Schizoid, BR - S - Schizotypal, BR_A - Anxiety, BR_CC - Major Depression, BR_R - Post-Traumatic Stress Disorder, BR_X - (Validity? ) , BR_SS - Thought Disorder, BR_2A - Avoidant, BR_B Alcohol Dependence, BR - 2B Depressive, BR - Z Deabasement, BR_C - Borderline, BR_P - Paranoid, BR_Y-desirability, BR_6A - Antisocial b Dependent Variable: MMPI-II Cluster4

38
Hypotheses Testing - Females
The first hypothesis, membership in the first female MMPI-2 cluster profile
(within-normal-limits) will be predicted by no elevations of any MCMI-III clinical
subscales was tested using a multiple regression analysis. The independent variables were
the MCMI-III clinical subscales and the dependent variable was cluster membership in
MMPI-2 female cluster 1. This hypothesis was not supported in the female sample, as
there were no female MMPI-2 profiles without elevations on the clinical scales.
Therefore, the “within-normal-limits” profile was missing.
The second hypothesis, cluster membership in the first female MMPI-2 cluster
profile (conversion-V profile [Hs and HY 10 points > D] and elevations on the Pt and Sc
scales) will be predicted by elevations on MCMI-III scales H (Somatoform), CC (Major
Depression), SS (Thought Disorder), A (Anxiety), 3 (Dependent), B (Borderline), D
(Dysthymia), R (Post Traumatic Stress Disorder) and 2B (Depressive), was tested
utilizing a multiple regression with the dependent variable being cluster membership in
female MMPI-2 cluster number 1. This hypothesis was not supported as shown in Table
5. While the regression equation was significant as a predictor of cluster membership in
MMPI-2 female cluster 1 (F = 3.663, p < .001); it did not yield an MCMI-III clinical
scale that has predictive value for cluster membership in this MMPI-2 female cluster.
39
Table 5
Regression summary hypothesis 2 – females
Model Summary
R R Square AdjustedR Square
Std. Error of the Estimate
Change Statistics
Model R Square Change
F Change df1 df2 Sig. FChange
1 .727 .529 .385 .37218 .529 3.663 27 88 .000 ANOVA
Model Sum of Squares df Mean Square F Sig.1 Regression 13.698 27 .507 3.663 .000
Residual 12.190 88 .139Total 25.888 115
a Predictors: (Constant), BR_PP Delusional Disorder, BR_X Validity, BR_5 Narcissistic, BR_7 Compulsive, BR_1 Schizoid, BR_T Drug Dependence, BR_H Somatoform, BR - N Bipolar: Manic, BR_B Alcohol Dependence, BR_3 Dependent, BR_6B Sadistic (Aggressive), BR_Z Debasement, BR_R Post-Traumatic Stress Disorder, BR_4 Histrionic, BR_8B Masochistic (Self-Defeating), BR_SS Thought Disorder, BR_A Anxiety, BR_8A Negativstic, BR_2B Depressive, BR_D Dysthymia, BR_P Paranoid, BR_6A Antisocial, BR_S Schizotypal, BR_Y Desirability, BR_C Borderline, BR_2A Avoidant, BR_CC Major Depression b Dependent Variable: MMPI Cluster I
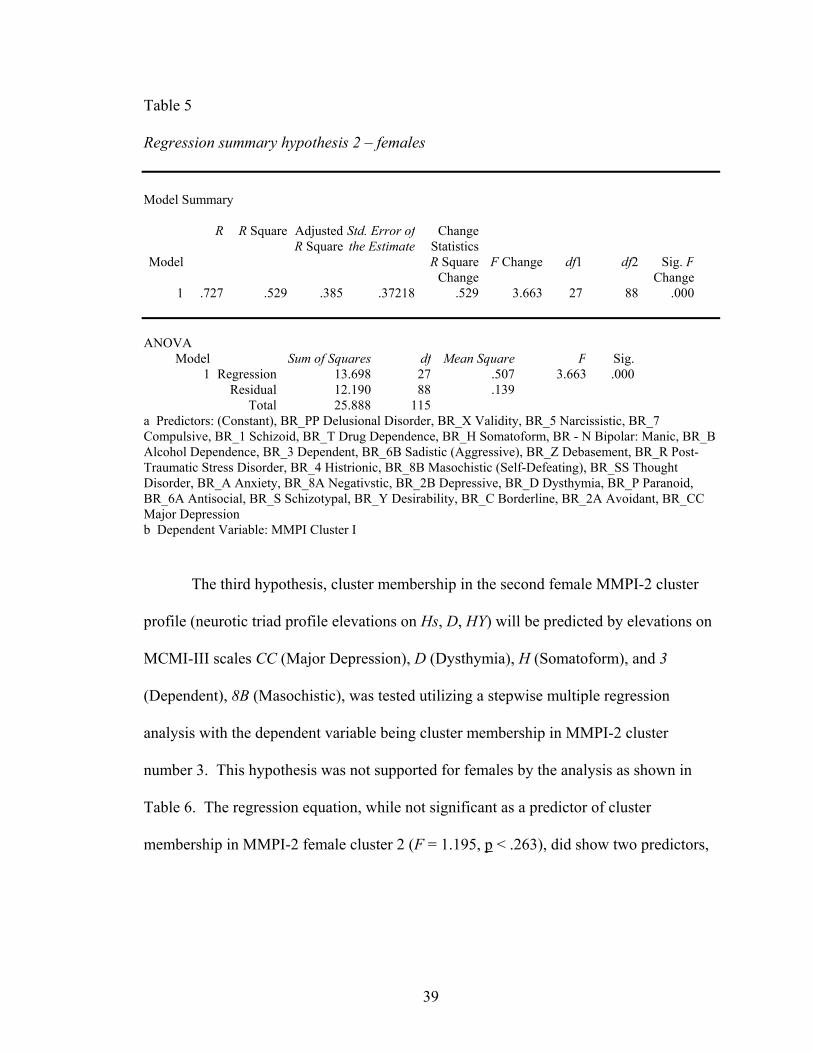
The third hypothesis, cluster membership in the second female MMPI-2 cluster
profile (neurotic triad profile elevations on Hs, D, HY) will be predicted by elevations on
MCMI-III scales CC (Major Depression), D (Dysthymia), H (Somatoform), and 3
(Dependent), 8B (Masochistic), was tested utilizing a stepwise multiple regression
analysis with the dependent variable being cluster membership in MMPI-2 cluster
number 3. This hypothesis was not supported for females by the analysis as shown in
Table 6. The regression equation, while not significant as a predictor of cluster
membership in MMPI-2 female cluster 2 (F = 1.195, p < .263), did show two predictors,

40
MCMI-III 4 Histrionic and MCMI-III T Drug Dependence. (See Appendix D,
Supplemental Table 6)
Table 6
Regression summary hypothesis 3- females
Model Summary
R R Square
Adjusted RSquare
Std. Error of the Estimate
Change Statistics
Model R Square Change
FChange
df1 df2 Sig. FChange
1 .518 .268 .044 .42528 .268 1.195 27 88 .263 ANOVA
Model Sum of Squares df Mean Square F Sig.1 Regression 5.834 27 .216 1.195 .263
Residual 15.916 88 .181Total 21.750 115
a Predictors: (Constant), BR_PP Delusional Disorder, BR_X Validity, BR_5 Narcissistic, BR_7 Compulsive, BR_1 Schizoid, BR_T Drug Dependence, BR_H Somatoform, BR - N Bipolar: Manic, BR_B Alcohol Dependence, BR_3 Dependent, BR_6B Sadistic (Aggressive), BR_Z Debasement, BR_R Post-Traumatic Stress Disorder, BR_4 Histrionic, BR_8B Masochistic (Self-Defeating), BR_SS Thought Disorder, BR_A Anxiety, BR_8A Negativstic, BR_2B Depressive, BR_D Dysthymia, BR_P Paranoid, BR_6A Antisocial, BR_S Schizotypal, BR_Y Desirability, BR_C Borderline, BR_2A Avoidant, BR_CC Major Depression b Dependent Variable: MMPI Cluster II
The fourth hypothesis, cluster membership in the third female MMPI-2 cluster
profile (generally elevated profile) will be predicted by elevations on MCMI-III scales H
(Somatoform), D (Dysthymia), CC (Major Depression), 6A (Antisocial), SS (Thought
Disorder), 3 (Dependent) and S (Schizotypal) was tested using a multiple regression
analysis with the dependent variable being membership in MMPI-2 cluster number 4 for
males and three for female MMPI-2 cluster 3. This hypothesis was not supported for
females as shown in Table 7. While the regression equation was significant as a

41
predictor of cluster membership in MMPI-2 female cluster 3 (F = 1.781, p < .023), it did
show two predictors, MCMI-III 4 Histrionic and MCMI-III 2A Avoidant (See Appendix
D, Supplemental Table 7).
Table 7
Regression summary hypothesis 4 – females
Model Summary
R R Square Adjusted RSquare
Std. Error of the Estimate
Change Statistics
Model R Square Change
FChange
df1 df2 Sig. F Change
1 .594 .353 .155 .40857 .353 1.781 27 88 .023 ANOVA
Model Sum of Squares df Mean Square F Sig.1 Regression 8.026 27 .297 1.781 .023
Residual 14.690 88 .167Total 22.716 115
a Predictors: (Constant), BR_PP Delusional Disorder, BR_X Validity, BR_5 Narcissistic, BR_7 Compulsive, BR_1 Schizoid, BR_T Drug Dependence, BR_H Somatoform, BR - N Bipolar: Manic, BR_B Alcohol Dependence, BR_3 Dependent, BR_6B Sadistic (Aggressive), BR_Z Debasement, BR_R Post-Traumatic Stress Disorder, BR_4 Histrionic, BR_8B Masochistic (Self-Defeating), BR_SS Thought Disorder, BR_A Anxiety, BR_8A Negativstic, BR_2B Depressive, BR_D Dysthymia, BR_P Paranoid, BR_6A Antisocial, BR_S Schizotypal, BR_Y Desirability, BR_C Borderline, BR_2A Avoidant, BR_CC Major Depression b Dependent Variable: MMPI Cluster III
Pre- and Post-Data Analysis
Subjects for post-treatment and follow-up analysis included 21 participants, who
completed an MCMI-III at discharge. Subjects included 10 women and 11 men.
Subjects ranged in age from 25 to 64, with a mean age of 45.33 and standard deviation of
9.67. The ethnic makeup of the participants included 12 Caucasians, 4 African
Americans, 2 Hispanic and 2 “other.” All participants had completed the six-week
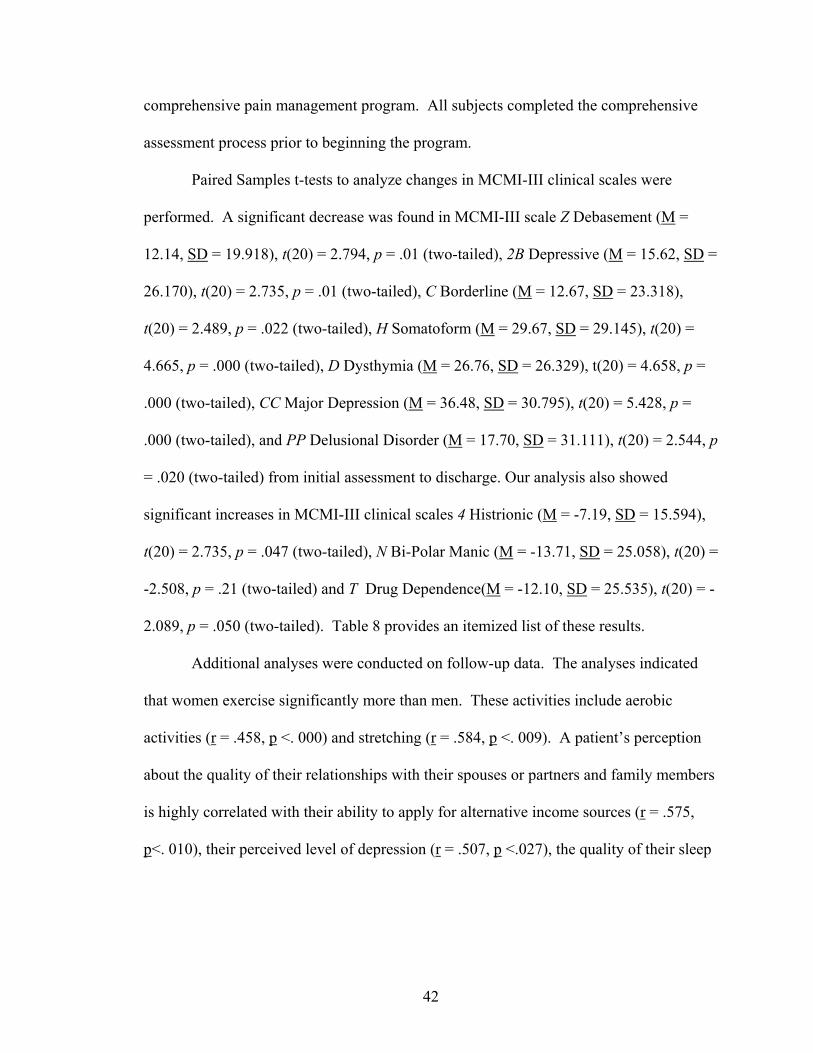
42
comprehensive pain management program. All subjects completed the comprehensive
assessment process prior to beginning the program.
Paired Samples t-tests to analyze changes in MCMI-III clinical scales were
performed. A significant decrease was found in MCMI-III scale Z Debasement (M =
12.14, SD = 19.918), t(20) = 2.794, p = .01 (two-tailed), 2B Depressive (M = 15.62, SD =
26.170), t(20) = 2.735, p = .01 (two-tailed), C Borderline (M = 12.67, SD = 23.318),
t(20) = 2.489, p = .022 (two-tailed), H Somatoform (M = 29.67, SD = 29.145), t(20) =
4.665, p = .000 (two-tailed), D Dysthymia (M = 26.76, SD = 26.329), t(20) = 4.658, p =
.000 (two-tailed), CC Major Depression (M = 36.48, SD = 30.795), t(20) = 5.428, p =
.000 (two-tailed), and PP Delusional Disorder (M = 17.70, SD = 31.111), t(20) = 2.544, p
= .020 (two-tailed) from initial assessment to discharge. Our analysis also showed
significant increases in MCMI-III clinical scales 4 Histrionic (M = -7.19, SD = 15.594),
t(20) = 2.735, p = .047 (two-tailed), N Bi-Polar Manic (M = -13.71, SD = 25.058), t(20) =
-2.508, p = .21 (two-tailed) and T Drug Dependence(M = -12.10, SD = 25.535), t(20) = -
2.089, p = .050 (two-tailed). Table 8 provides an itemized list of these results.
Additional analyses were conducted on follow-up data. The analyses indicated
that women exercise significantly more than men. These activities include aerobic
activities (r = .458, p <. 000) and stretching (r = .584, p <. 009). A patient’s perception
about the quality of their relationships with their spouses or partners and family members
is highly correlated with their ability to apply for alternative income sources (r = .575,
p<. 010), their perceived level of depression (r = .507, p <.027), the quality of their sleep

43
(r = .484, p < .023) and their report that they have adequate skills to manage their pain (r
= .512, p <.025).
In this sample, the better the reported mood (lower level of depression), the more
able the subject was able to seek alternative sources of income (r = .582, p <.018).
Reports of good pain management strategies (r = .476, p <.039) was related to decreased
levels of worry (r = .602, p <.006). Positive mood and pain management strategies,
combined with adequate income was related to exercise levels (r = .490, p <.033),
improved sleep (r = .503, p <.028), and improved relationships with family and friends (r
= .549, p <.015). The analysis also indicated that if a person believes that they will be
able to return to work soon, they would tend to be calm and worry less. These factors are
also related to higher quality of sleep (r = .612, p <.005); greater satisfaction with the
quality of their relationships (r = .477, p <.039), better mood (r = .791, p <.000) and the
ability to manage one’s pain (r = .522, p <.022).
Participants with a secure income source from work or disability also reported
better mood (r = .509, p <.044), engaging in strength training exercises (r = .509, p
<.044), and aerobic exercise (r = .458, p <.048) with less worry and the ability to remain
calm (r = .498, p <.030).

44
Table 8 Paired Samples Test: MCMI-III Clinical Scales Pre and Post Treatment MCMI-III Clinical Scale
M
SD
Std Error Mean
t
df
Sig (two-tailed)
Z Debasement
12.14
19.918
4.346
2.794
20
.011
2A Depressive
15.62
26.170
5.711
2.735
20
.013
4 Histrionic
-7.19
15.594
3.403
2.735
20
.047
C Borderline
12.67
23.318
5.088
2.489
20
.022
H Somatoform
29.67
29.145
6.360
4.665
20
.000
N Bi-Polar Manic
-13.71
25.058
5.468
-2.508
20
.021
D Dysthymia
26.76
26.329
5.745
4.658
20
.000
T Drug Dependence
-12.10
25.535
5.790
-2.089
20
.050
CC Major Depression
36.48
30.795
6.720
5.428
20
.000
PP Delusional Disorder
17.70
31.111
6.957
2.544
20
.020
45
DISCUSSION
The goal of this research project was to explore further the problem of proper assessment
of chronic pain patients utilizing standard assessment instruments. Adequate assessment
of chronic pain patients can help to address many of the problems inherent in the
complex multidimensional models of chronic pain etiology and approaches to treatment
(Keller and Butcher, 1991). Proper assessment and referrals of pain patients during the
intake process would allow pain programs to modify treatment during a standardized
program. Such modifications and tailoring would be a step towards patient treatment
compliance, and behavioral changes and adopting new coping strategies. Follow-up data
would verify treatment protocols, as well as help program staff modify inadequate
interventions.
One way to modify treatment programs and interventions would be to classify
patients during the intake process. A cluster analysis is a statistical procedure that
classifies a population into separate homogeneous groups. To date (2004), the Minnesota
Multiphasic Personality Inventory – Second Edition (MMPI-2) has been utilized in two
cluster analysis studies on this population. Nine cluster analysis studies were done with
the MMPI on a chronic pain population. Prior to the present study, one cluster analysis
study was performed on MMPI-2s from the same program. DeBeus, McManemin and
McCoy (1997) investigated 2051 MMPI-2s for cluster solutions of chronic low-back pain
patients. The current hypotheses were based on results from the deBeus study, as
participants were drawn from the same pain program.

46
The multivariate clustering procedure utilized in this study to classify MMPI-2
profile subgroups within this male and female sample of chronic pain patients was
successful in classifying four male clusters and three female clusters. These clustering
procedures did not yield a within-normal-limits profile for females as hypothesized.
Upon closer examination, no female MMPI-2 profile without elevations on the clinical
scales was found. The closest cluster found that fits a within-normal-limits profile had a
modified conversion V. Specifically, this cluster had both Hs and Hy > D by 5 and not
10 points.
Several factors must be considered when speculating on these results. Texas
Workers’ Compensation Law revisions now limit treatment for injured workers. Pain
patients are now referred to pain management programs after other types of treatment
fail. The range of time from injury to referral for assessment in the comprehensive pain
management program was from 145 days to 18 years, with the average of 2.88 years.
The increase in time that patients are now waiting for referrals to pain management
programs could possibly be associated with increased stress, psychopathology and
dependence on pain medication.
In discussing research hypotheses, we discuss the male MMPI-2 clusters first, as
we analyzed men and women separately.
Hypotheses testing – males
Our first hypothesis was that membership in the first male MMPI-2 cluster profile
(within-normal-limits) will be predicted by no elevations of any Millon Clinical
Multiaxial Inventory – Third Edition (MCMI-III) clinical subscales was tested using a

47
multiple regression analysis. The independent variables were the MCMI-III clinical
subscales and the dependent variable was cluster membership in male MMPI-2 cluster 1.
This hypothesis was not supported for men. Our regression procedure did not prove to be
significant in predicting membership. We did, however, find one individual predictor,
MCMI-III scale 7 compulsive.
A brief interpretation of the first male MMPI-2 cluster profile according to Green
(2002) might be that as a group, these chronic pain patients are generally honest in their
reporting of their current situation. They realize that they cannot solve their current
problems themselves. They are concerned about their current physical functioning,
acknowledge depression and will, at times, over-report these symptoms in an effort to get
others to understand how difficult their current situation is. They have a great deal of
anxiety, and will not hesitate to tell others about their difficulties.
As a contrast, the primary characteristic of those with elevations on the MCMI-III
(scale 7) Compulsive, according to Millon’s (1997) interpretation is ambivalent
orientation, coinciding with the DSM-IV obsessive-compulsive personality disorder.
Generally speaking, these individuals have been intimidated and coerced into accepting
the demands and judgments imposed on them by others. Their prudent, controlled, and
perfectionist ways derive from a conflict between hostility toward others and fear of
social disapproval. They resolve this ambivalence by suppressing their resentment and
by overconforming and placing high demands on themselves and others. Their
disciplined self-restraint serves to control intense, though hidden, oppositional feelings,
resulting in an overt passivity and seeming public compliance. Behind their front of
48
propriety and restraint, however, are intense anger and oppositional feelings that
occasionally break through their controls.
A comparison of these two interpretations suggests that Millon’s construct of
compulsiveness is rooted in a developmental model, where maladaptive coping
mechanisms are developed and reinforced through adulthood. As the individual develops
cognitively and emotionally, they are unable to be flexible and therefore become rigid
and resentful. This construct varies from the MMPI-2. The interpretation of the MMPI-2
cluster suggests that pain patients’ over-reporting is an act of desperation or reaction to
severe stress. They feel alone, hopeless and not understood. By contrast, Millon’s
construct and interpretation fits the psychiatric population for which the MCMI-III was
normed, and follows strict diagnostic traits. The MMPI-2 cluster has a broader overall
interpretation of the subject’s current psychological situation, as well as how they are
coping with stress. The MCMI-III cluster characteristics amplify maladaptive coping
strategies that this group might possess and utilize under extreme stress.
Our second hypothesis, cluster membership in the second MMPI-2 cluster profile
(conversion-V profile [Hs and HY 10 points > D] and elevations on the Pt and Sc scales)
to predicted by elevations on MCMI-III scales H (Somatoform), CC (Major Depression),
SS (Thought Disorder), A (Anxiety), 3 (Dependent), B (Borderline), D (Dysthymia) R
(Post Traumatic Stress Disorder) and 2B (Depressive), was tested utilizing a multiple
regression with the dependent variable being cluster membership in male MMPI-2 cluster
number 2. This hypothesis was not supported. Our analysis indicated that the regression

49
is significant as a predictor. In addition, we found the MCMI-III scale 7, Compulsive, as
an individual predictor.
The MMPI-2 interpretation of the second MMPI-2 male cluster group suggests
members of this group are putting forth a good effort to communicate their current
psychological situation. They may at times be inconsistent with their reporting, as they
may exaggerate how bad things are in an attempt to get the interviewer to understand
how difficult their current situation is. The predominant clinical picture for these patients
is depression and a concern for their current physical level of functioning. They are
rather withdrawn and inwardly focused on their physical troubles.
The MCMI-III best predictor for this cluster is 7 Compulsive. As described
above, MCMI-III scale 7 reflects the construct of a severe personality disorder that is
developmental in nature and maladaptive in day-to-day functioning. The MCMI-III scale
7 does address the inward focus of these men, describing this focus as hidden rage and
hostility towards others.
The MCMI-III provides useful clinical information about a patient’s coping style
under severe stress. In this chronic pain patient population, the predictive value of
MCMI-III’s scale 7 addresses current repression that patients might be experiencing.
The MMPI-2 addresses the inward focus in a different context – that of focus and
concern on physical functioning. The MCMI-III scale 7 describes the inward focus as
repression of rage and hostility. The MCMI-III scale 7 addresses symptoms that are life-
long and enduring, rather than those that are the result of a major life event, such as a

50
severe work-related injury. In contrast, the MMPI-2 gives information about mood,
anxiety and cognitive functioning.
Our third hypothesis, cluster membership in the third MMPI-2 cluster profile
(neurotic triad profile elevations on Hs, D, HY) was to be predicted by elevations on
MCMI-III scales CC (Major Depression), D (Dysthymia), H (Somatoform), and 3
(Dependent), 8B (Masochistic). This hypothesis was tested utilizing a multiple
regression analysis with the dependent variable being cluster membership in male
MMPI-2 cluster number 3. The hypothesis was not supported. The regression was
significant and one MCMI-III scale was found to be a predictor, MCMI-III scale X
Validity.
A brief interpretation of the third MMPI-2 male cluster, according to Greene
(2002) suggests that these men appear to be putting forth a good effort in the assessment
process and are not exaggerating their current level of distress. Clinically, they are
reporting depression and concern for their physical functioning. Their depression and
focus on their physical discomfort are predominant in their clinical presentation. Their
level of anxiety is not as great as their depression; however, their thinking is impacted by
their constant and continuous worry about the future and whether their current situation
will resolve positively.
According to Millon (1997) people with an elevated or positive score on the
MCMI-III scale V, the Validity Index, may mean an invalid profile. MCMI-III scale V
contains three bizarre or highly improbable items. When two or more of these items are
marked “True”, the protocol is considered invalid. A score of zero is considered is valid,
51
and a score of 1 indicates questionable validity. A protocol with a score of 1 should be
interpreted with caution.
In comparing these two descriptions, the MMPI-2 looks at a broad range of
factors that affect the individual at the time of testing. It addresses the effort an
individual makes, their mood, anxiety, cognitive functioning as well as physical
difficulties. The MCMI-III is extremely sensitive to carelessness, stress or confusion,
and does not offer any clinical information about the patient.
Our fourth hypothesis, cluster membership in the fourth MMPI-2 cluster profile
(generally elevated profile) will be predicted by elevations on MCMI-III scales H
(Somatoform), D (Dysthymia), CC (Major Depression), 6A (Antisocial), SS (Thought
Disorder), 3 (Dependent) and S (Schizotypal) was tested using a multiple regression
analysis with the dependent variable being membership in the male MMPI-2 cluster
number 4. Our regression analysis was not a significant predictor of cluster membership.
We did find, one individual predictor MCMI-III scale C Borderline.
A brief interpretation for the fourth male MMPI-2 cluster according to Green
(2002) suggests that this population over reports their symptoms to the point of
incredibility. They do appear, however, to be exaggerating to be believed. They also
believe that they do not have psychological resources to solve their problems. Clinically,
they are very depressed and overly concerned with their physical functioning. They are
experiencing conflict with those that they consider to be authority figures. They may
have difficulty following suggestions made by their treatment team. Their thinking is
self-focused and they do not trust those around them. Their thinking and worry

52
contributes to their anxiety, and they may have poor judgment. More than likely, they are
impulsive and may appear grandiose.
The MCMI-III predictor for membership in the fourth MMPI-2 male cluster was
MCMI-III scale C Borderline. Millon (1997) suggests that patients with elevations on
the MCMI-III scale C have severe personality disorders. They will experience intense
endogenous moods with recurring periods of deflection and apathy, often interspersed
with spells of anger, anxiety or euphoria. What distinguishes people with elevations on
this scale is the dysregulation of affect, seen most clearly in the instability and lability of
their moods. Additionally, many have recurring thoughts about self-mutilation and
suicide, appear overly preoccupied with securing affection, have difficulty maintaining a
clear sense of identity, and display a cognitive-affective ambivalence that is evident in
conflicting feelings of rage, love and guilt toward others.
While the MCMI-III provides good information about potential maladaptive
coping styles under severe stress, it does not take into account mood and cognitive
functioning. The MMPI-2 gives a broader picture of the patients’ current level of
emotional functioning. The MCMI-III scale C identifies the symptoms of severe
psychopathology that develops in childhood and is enduring. The MCMI-III scale C may
not be useful for individuals under severe acute stress. However, extreme caution should
be exercised if using the MCMI-III for the sake of formulating a diagnosis in this
population.

53
Hypotheses testing females
Since the multivariate clustering procedure used in this study found three rather
than four female clusters, this discussion will refer to female MMPI-2 cluster 1, rather
than female MMPI-2 cluster 2; female MMPI-2 cluster 2, rather than female MMPI-2
cluster 3, and female MMPI-2 cluster 3, rather than female MMPI-2 cluster 4.
The first hypothesis was that membership in the first female MMPI-2 cluster
profile (within-normal-limits) will be predicted by no elevations of any MCMI-III
clinical subscales. This hypothesis was tested using a multiple regression analysis. The
independent variables were the MCMI-III clinical subscales and the dependent variable
was cluster membership in male MMPI-2 cluster 1. This hypothesis was not supported,
as the within-normal-limits profile MMPI-2 cluster was missing in this population
sample. Further analysis revealed we learned that all female MMPI-2 profiles had
elevations on clinical scales. Perhaps one reason for these elevations is that the length of
time since injury averaged 2.88 years. Another consideration would be that this sample
had wide range of education levels, and low reading levels could have skewed the
clinical profiles.
The second hypothesis, cluster membership in the first female MMPI-2 cluster
profile (conversion-V profile [Hs and HY 10 points > D] and elevations on the Pt and Sc
scales) will be predicted by elevations on MCMI-III scales H (Somatoform), CC (Major
Depression), SS (Thought Disorder), A (Anxiety), 3 (Dependent), B (Borderline), D
(Dysthymia) R (Post Traumatic Stress Disorder) and 2B (Depressive), was tested utilizing
a multiple regression with the dependent variable being cluster membership in MMPI-2

54
cluster number 2. The regression proved to be significant as a predictor for cluster
membership in the first MMPI-2 female cluster. Our analysis did not yield a MCMI-III
clinical scale that serves as a predictor for the first female MMPI-2 cluster.
A brief interpretation according to Green (2002) of the female cluster suggests
that these women are honest in their portrayal of their current situation, and are not over
exaggerating their concerns and they acknowledge that they lack current resources to
solve their problems. Clinically, they are depressed and very concerned about their
physical condition. They may speak about their physical problems often and also report
a lot of anxiety. They will function well with a group, in that they will talk freely with
peers. They are preoccupied with their thinking about their current stressors to the point
that they may appear distracted and not pay attention well. Their thinking is impacting
their depression and anxiety.
In this cluster, the MMPI-2 looks at a broad picture of psychological picture. The
MCMI-III offers no interpretation or clinical scale that serves as a predictor for this
cluster. While these instruments are supposed to measure similar traits, the MMPI-2
examines a patient’s psychological presentation, while the MCMI-III looks at a patient’s
current state, which may or may not be a stable picture of the patient’s coping styles.
The third hypothesis, cluster membership in the second female MMPI-2 cluster
profile (neurotic triad profile elevations on Hs, D, HY) will be predicted by elevations on
MCMI-III scales CC (Major Depression), D (Dysthymia), H (Somatoform), and 3
(Dependent), 8B (Masochistic), was tested utilizing a multiple regression analysis with
the dependent variable being cluster membership in female MMPI-2 cluster number 2.

55
This hypothesis was not supported for females. The regression analysis was not a
significant predictor of cluster membership; however, two individual predictors were
found: MCMI-III scale T Drug Dependent and MCMI-III scale 4 Histrionic for cluster
membership in female cluster number 2.
A brief interpretation of the second MMPI-2 female cluster according to Greene
(2002) suggests that as a group, this female population tends to exaggerate their current
psychological state in the hopes of gaining others’ understanding of their stress and
struggle. They admit that they are unable to solve their current problems and are seeking
help. Clinically, they are depressed about their physical functioning and may become
tearful and frustrated. They report a great deal of anxiety, and their thinking is distorted
due to their current stress. Their distorted thinking impacts their judgment and they may
utilize poor coping strategies in their daily life.
Millon (1997) describes individuals with elevated MCMI-III scale 4 Histrionic as
individuals that turn to others, they appear on the surface to be quite dissimilar from their
passive counterparts. This difference in overt style arises from their facile and
enterprising manipulation of events, through which they maximize the attention and
favors they receive and avoid the indifference and disapproval of others. These
individuals often exhibit an insatiable if not indiscriminate search for stimulation and
affection. Their clever and often artful social behavior gives the appearance of inner
confidence and independent self-assurance. Beneath this guise, however, is a fear of
genuine autonomy and a need for repeated signs of acceptance and approval. Tribute and

56
affection must be constantly replenished and are sought from every interpersonal source
and in every social context.
The other predictor for the second MMPI-2 female cluster membership is the
MCMI-III scale T Drug Dependence. Millon describes individuals with elevated MCMI-
III scale T Drug Dependence scales probably having a current or recent history of drug
abuse. They tend to find it difficult to restrain impulses or keep them within
conventional social limits, and are unable to manage the personal consequences of this
behavior. As the Alcohol Dependence scale, this cluster is composed of many subtle and
indirect items. The scale may be useful in identifying individuals who are readily
disposed to admit their drug problems.
Comparing Millon’s interpretations of members in the female MMPI-2 cluster
and MMPI-2 interpretation, two distinct viewpoints emerge. The MMPI-2 considers
mood, anxiety, cognitive functioning, physical functioning and stress in their
interpretation. The MCMI-III focuses on maladaptive coping strategies that are
amplified in stressful situations. In the population sampled in this study, many patients
were referred for intake and were taking large amounts of addictive pain medication.
More than likely, these patients were uncomfortable by the dose and number of
medications that they were taking, and embarrassed by the detoxification process that
they were involved in. Furthermore, the MCMI-III does not consider that the coping
strategies that are emerging are acute, rather than chronic.
The fourth hypothesis, cluster membership in the third female MMPI-2 cluster
profile (generally elevated profile) will be predicted by elevations on MCMI-III scales H

57
(Somatoform), D (Dysthymia), CC (Major Depression), 6A (Antisocial), SS (Thought
Disorder), 3 (Dependent) and S (Schizotypal) was tested using a multiple regression
analysis with the dependent variable being membership in the male MMPI-2 cluster
number 4. The regression analysis was a significant predictor. Two individual predictors
were found: MCMI-III scale 2A Avoidant and MCMI-III scale 4 Histrionic.
The third female cluster did not produce the elevated profile that had been
predicted. Most likely, this is because the first and second clusters were both more
elevated than expected. As mentioned earlier, examination of individual profiles
revealed that that all MMPI-2 female profiles had clinical elevations. A brief
interpretation of the female cluster according to Green (2002) suggests that the chronic
pain patients in this cluster are slightly inconsistent in their reporting. They may give
information that tends to conflict with documented facts. They are also very confident in
their ability to solve their current problems. Clinically, they are depressed. They
ruminate about their physical problems and will have difficulties with people they
consider to be authority figures. Under stress, they may appear impulsive and emotional.
They are repressing a great deal of anxiety and concern about their future.
Millon describes individuals with elevations on MCMI-III scale 2A as individuals
who experience few positive reinforcers from themselves or others. They are vigilant
and always on guard, ready to distance himself or herself from anxious anticipation of
life’s painful or negatively reinforcing experiences. Their adaptive strategy reflects a
fear and mistrust of others. They maintain a constant vigil to prevent their impulses and
their longing for affection from resulting in a repetition of the pain and anguish they have

58
experienced with others. Only by active withdrawal can they protect themselves.
Despite desires to relate, they have learned that it is best to deny these feelings and to
keep a good measure of interpersonal distance. The other predictor, MCMI-III scale 4
Histrionic, seems to contrast these individuals. Millon describes individuals with
elevations on the MCMI-III scale 4 as individuals that turn to others frequently for
approval. They appear on the surface to be quite dissimilar from their passive
counterparts. This difference in overt style arises from their facile and enterprising
manipulation of events, through which they maximize the attention and favors of others.
These individuals often exhibit an insatiable if not indiscriminate search for stimulation
and affection. Their clever and often artful social behavior gives the appearance of inner
confidence and independent self-assurance. Beneath this guise, however, is a fear of
genuine autonomy and a need for repeated signs of acceptance and approval. Tribute and
affection must be constantly replenished and are sought from every interpersonal source
and in every social context.
The MMPI-2 interpretation does address the impulsivity and emotionality that
this group may possess. The MMPI-2 also utilizes factors such as cognitive functioning,
mood, anxiety, as well as the effort the individuals put forth in the testing process. The
MCMI-III, by contrast, examines a small piece of these individuals’ lives. Specifically,
the MCMI-III highlights maladaptive coping strategies characteristically utilized by
individuals in extreme stress. The MMPI-2 addresses the isolation that persons with this
cluster profile experiences, and the cognitive ruminative process that accompanies their
loneliness. The MCMI-III offers a contrasting viewpoint, in that the isolation that these

59
individuals seek is the result of a long developmental process. The MCMI-III
interpretation appears to be rather limited for this cluster, as this test’s clinical scope does
not take into account individuals who are coping with an acquired medical condition.
Using this chronic pain population, some of the regression procedures used in this
study provided significant predictors of MMPI-s cluster membership: MCMI-III scale 7
Compulsive; MCMI-III scale X Validity; MCMI-III scale C Borderline; MCMI-III scale
T Drug Dependent and MCMI-III scale 4 Histrionic. The MCMI-III scales appear to be
sensitive to individuals who are under stress. Furthermore, the MCMI-III gives only
information concerning maladaptive coping styles that emerge under severe stress. The
MCMI-III did not highlight mood, cognitive functioning, anxiety or physiological
concerns that were apparent on the MMPI-2. When interpreting the MCMI-III in a
chronic pain population, it is imperative that one not use the clinical information to
formulate a diagnosis. Perhaps a more useful way to incorporate the MCMI-III in the
treatment planning process would be to use the information provided about maladaptive
coping strategies and incorporate those findings in stress management training.
This study also looked at a small sample of follow-up data. Twenty-one pre and
post MCMI-III protocols were available, as well as follow-data. All 21 subjects had
completed the six-week comprehensive pain management program. While the sample is
very small, it provides useful information for future research. Significant decreases were
found on 7 clinical MCMI-III scales. Increases were found in three scales. Two of the
subjects had a history of primary addiction. When these subjects were removed and the
t-tests were re-run on the MCMI-III clinical scales, results showed decreases on scale

60
scores. The information from these results suggests that future research include pre-post
data with a larger population. This examination also suggests that the MCMI-III is
sensitive to stress and change. Therefore, interpretation of the MCMI-III at intake should
be done with extreme caution, as patients may improve during the course of treatment. In
addition, patients who have a history of addiction may need to address their addiction
prior to entering a cognitively based treatment program.
Additional analyses were conducted on follow-up data. The sample size for this
portion of the study was small. The results provide useful information for treatment
planning, outcome measures and to generate ideas for future research. Findings from this
study might suggest that when designing a treatment plan, case managers for chronic pain
patients should verify that a patient is receiving a source of income, as this directly
affects their quality of sleep, relationships, and mood. Equally important would be to
teach patients new and adaptive coping strategies that can be utilized in their pain
management. Sobel (1995) reported that when patients are taught to be an interactive
part of their treatment team, increases in program adherence, quality of life and
functioning are noted.
Limitations
This study was limited in that follow-up data and pre- and post-assessment data
was not available for all subjects. The subject pool was limited to injured workers in the
Texas Workers’ Compensation system. However, this study was unique in that we were
able to look at a population that might not have been studied, because of the increased

61
length of time from injury to program intake, and to look at the potential that this time
increase may have had on a patient’s psychological condition.
This study makes a case for the development of special norms to be used with
pain patients. The study highlights the value of follow-up information that was both
subjective and objective. These results suggest that rather than being just a diagnostic
tool; the MCMI-III provides meaningful information about maladaptive coping strategies
that arise under acute stress. This quality was illustrated by the changes found in the pre-
and post-program assessment analysis. This study’s findings suggest that pain treatment
program staff could utilize follow up information, as well as diagnostic information about
coping strategies that might appear under stress, to shape interventions. Future research
might focus on discriminate analyses to investigate factors that predict both improvement
and program failure.

62
APPENDIX A

63
Dallas Spinal Rehabilitation Center
Pain Management Post-Program Questionnaire
Name: Social Security Number: Date of Birth: Injury Date: Discharge Date: Gender: Section 2. Home Exercise Status (please circle the indicated level of activity) 1. I stretch Never 2 times/week 3 times/week 4 times/week daily 2. I perform stabilization Exercises Never 2 times/week 3 times/week 4 times/week daily
3. I perform strengthening Activities Never 2 times/week 3 times/week 4 times/week daily
4. I do some form of aerobic
Exercise (Bike Treadmill, stairmaster) Never 2 times/week 3 times/week 4 times/week daily
_______________________________________________________________________ Section 3 – Quality of Life Status 1. My present level of depression (feelings of hopelessness)
Severe Very Bad Moderate Slight Non-existent
2. My present level of anxiety (worry and concern) Severe Very Bad Moderate Slight Non-existent
3. Right now, my quality of sleep is Very Poor Poor Fair-good/bad nights Good Excellent

64
4. Right now, the quality of relationships I have with my family and friends is Very Poor Poor Fair-good/bad times Good Excellent
5. My ability to manage my pain is Very Poor Poor Fair Good Excellent
Section 3: Work Status Are you Working? Yes No If not, how soon do you expect to return to work?
3 months 6 months 1 year 2 years Never

65
APPENDIX B

66
DALLAS SPINAL REHABILITATION CENTER, INC. CONSENT FOR CARE AND TREATMENT
I, the undersigned, do hereby agree and give my consent for Dallas Spinal Rehabilitation Center to furnish medical care and treatment to ___________________________________________________________ considered necessary and proper in diagnosing or treating their physical and mental condition. Patient/Guardian_______________________________________ Date___________________________
BENEFIT ASSIGNMENT/RELEASE OF INFORMATION I, hereby assign all medical and/or surgical benefits to include major medical benefits to which I am entitled, including Medicare, private insurance and any other health plans to Dallas Spinal Rehabilitation Center. A photocopy of this assignment is to be considered as valid as the original. I, hereby authorize said assignee to release all information necessary, including Medical Records, to secure payment. Patient/Guardian ______________________________________ Date____________________________
FINANCIAL POLICY STATEMENT It is our policy to bill your insurance carrier as a courtesy to you, although you are responsible for the entire bill when the services are rendered. We require that arrangements for payment of your estimated share be made today. If your insurance carrier does not remit payment within 60 days, the balance will be due in full from you. If any payment is subsequently made by your insurance carrier in excess of the balance of your account, we will promptly refund the credit. If any payment is made directly to you for services billed by us, you recognize an obligation to properly remit same to Dallas Spinal Rehabilitation Center. The above does not apply for those patients that are considered Worker’s Compensation. However, be advised as a Compensation patient that you may be held responsible for your charges in the event your Claim is controverted. I understand and agree that if I fail to make any of the payments for which I am responsible in a timely manner, after such default and upon referral to a collection agency or attorney by Dallas Spinal Rehabilitation Center, I will be responsible for all costs of collecting monies owed, including court costs, collection agency fees and attorney fees.
ESTIMATED INSURANCE BENEFITS ____________________________________________________________________________________ ____________________________________________________________________________________ Estimated patient payment % ____________________________________________________________ Arrangements for payment of patient’s share ________________________________________________ ____________________________________________________________________________________

67
NOTE: Estimated coverage information is provided as a courtesy to our patients, but is not intended to release them from total responsibility for their account balance. The above information has been read and explained to me. I UNDERSTAND MY RESPONSIBILITY FOR THE PAYMENT OF MY ACCOUNT. __________________________________________________ ________________________________ Patient or Responsible Party Date _________________________________________________ ________________________________ Dallas Spinal Rehabilitation Center Representative Date

68
APPENDIX C

69
DISCLOSURE AND CONSENT FORM FOR BEHAVIORAL MEDICINE SERVICES AND RESEARCH
This disclosure is not meant to be scary or alarming. It is an explanation, required by law, to make me better informed so that I may give, withhold, or terminate my consent to treatment offered by the Clinic. In regard to the psychological testing, therapy and biofeedback services, I understand that during the course of injury, illness, or other stressors, many patients develop pain, depression, anxiety, sleep disturbances and other conditions. The tests being administered are designed to help the treatment team understand the complexities of my situation and to identify if I might benefit from treatment for chronic pain and other conditions. I understand that psychological test results are maintained in a confidential file. The therapists and support staff have been instructed on the need to keep all information regarding these materials confidential. Reports summarizing my test results and treatment are generated. This information will only be released with my consent or that of a legal guardian. The exceptions to this include if I am a minor child in treatment, if it is determined that I may be a threat to myself (suicidal) or a threat of harm to others, or if there is reason to suspect abuse of a child. I do authorize this healthcare provider to release my report to the insurance company, the referring physician, and clinical medical records for use by treatment staff. Raw test data is released only with permission of the patient or in response to a subpoena. Though strong efforts are made to keep the information confidential, I realize that the treatment team can not be held responsible for misuse of this information by those to whom it is released. Testing report preparation, psychotherapy, and biofeedback services are supervised by a licensed psychologist, but may be performed by Master’s Degree therapists. I understand that the data may also be used in research, but that my name or any identifying information will be removed from published materials and that my rights to privacy will be respected. I understand that I will be encouraged to ask questions or voice concerns about my treatment. I understand that I can choose to stop my testing procedures at any time. I recognize, however, that this material enhances the treatment team’s ability to not only provide treatment, but to make appropriate referrals should this treatment setting not prove to be adequate to meet my needs. Patient Signature:____________________________ Date: _________________

70
APPENDIX D
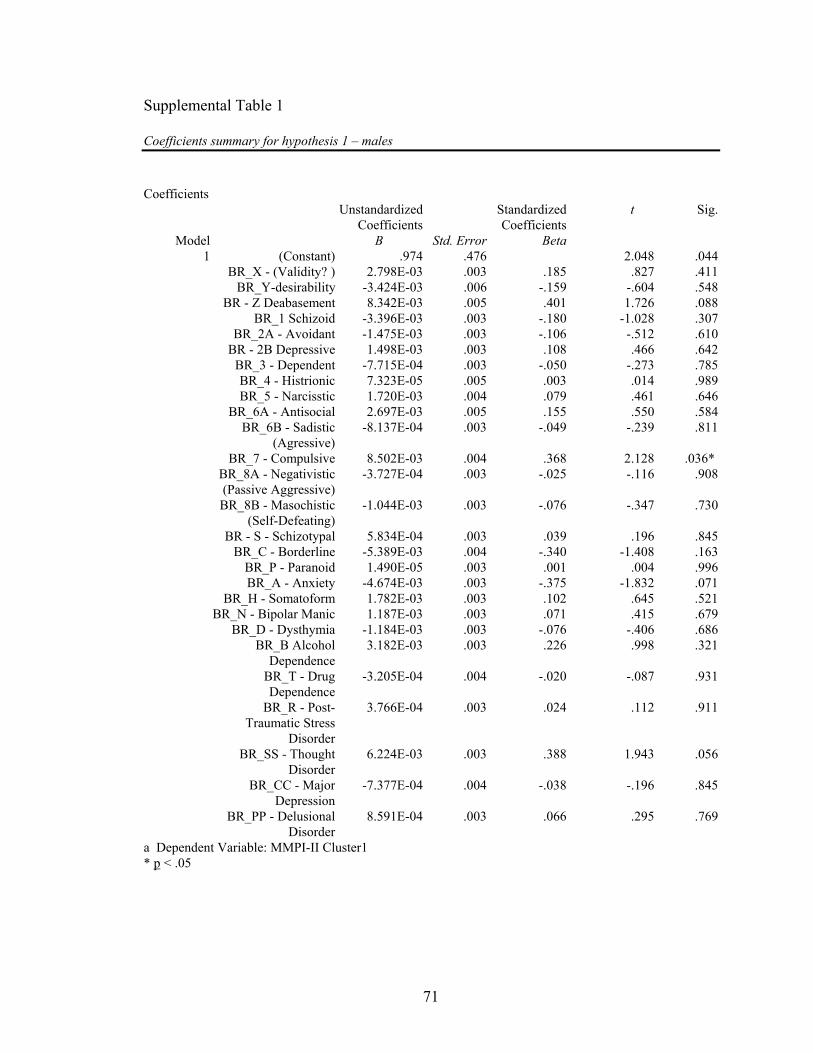
71
Supplemental Table 1
Coefficients summary for hypothesis 1 – males Coefficients
Unstandardized Coefficients
Standardized Coefficients
t Sig.
Model B Std. Error Beta1 (Constant) .974 .476 2.048 .044
BR_X - (Validity? ) 2.798E-03 .003 .185 .827 .411BR_Y-desirability -3.424E-03 .006 -.159 -.604 .548
BR - Z Deabasement 8.342E-03 .005 .401 1.726 .088BR_1 Schizoid -3.396E-03 .003 -.180 -1.028 .307
BR_2A - Avoidant -1.475E-03 .003 -.106 -.512 .610BR - 2B Depressive 1.498E-03 .003 .108 .466 .642
BR_3 - Dependent -7.715E-04 .003 -.050 -.273 .785BR_4 - Histrionic 7.323E-05 .005 .003 .014 .989BR_5 - Narcisstic 1.720E-03 .004 .079 .461 .646
BR_6A - Antisocial 2.697E-03 .005 .155 .550 .584BR_6B - Sadistic
(Agressive)-8.137E-04 .003 -.049 -.239 .811
BR_7 - Compulsive 8.502E-03 .004 .368 2.128 .036*BR_8A - Negativistic(Passive Aggressive)
-3.727E-04 .003 -.025 -.116 .908
BR_8B - Masochistic(Self-Defeating)
-1.044E-03 .003 -.076 -.347 .730
BR - S - Schizotypal 5.834E-04 .003 .039 .196 .845BR_C - Borderline -5.389E-03 .004 -.340 -1.408 .163
BR_P - Paranoid 1.490E-05 .003 .001 .004 .996BR_A - Anxiety -4.674E-03 .003 -.375 -1.832 .071
BR_H - Somatoform 1.782E-03 .003 .102 .645 .521BR_N - Bipolar Manic 1.187E-03 .003 .071 .415 .679
BR_D - Dysthymia -1.184E-03 .003 -.076 -.406 .686BR_B Alcohol
Dependence3.182E-03 .003 .226 .998 .321
BR_T - Drug Dependence
-3.205E-04 .004 -.020 -.087 .931
BR_R - Post-Traumatic Stress
Disorder
3.766E-04 .003 .024 .112 .911
BR_SS - ThoughtDisorder
6.224E-03 .003 .388 1.943 .056
BR_CC - Major Depression
-7.377E-04 .004 -.038 -.196 .845
BR_PP - DelusionalDisorder
8.591E-04 .003 .066 .295 .769
a Dependent Variable: MMPI-II Cluster1 * p < .05

72
Supplemental Table 2
Coefficients summary for hypothesis 2 – males Coefficients
Unstandardized Coefficients
Standardized Coefficients
t Sig.
Model B Std. Error Beta1 (Constant) 2.720 .472 5.768 .000
BR_X - (Validity? ) 6.050E-03 .003 .370 1.803 .075BR_Y-desirability -3.947E-03 .006 -.170 -.702 .485
BR - Z Deabasement -5.974E-04 .005 -.027 -.125 .901BR_1 Schizoid 3.586E-03 .003 .176 1.094 .277
BR_2A - Avoidant 2.554E-03 .003 .170 .893 .374BR - 2B Depressive -3.555E-03 .003 -.236 -1.116 .268
BR_3 - Dependent -3.231E-03 .003 -.193 -1.155 .252BR_4 – Histrionic 3.805E-03 .005 .162 .710 .480BR_5 – Narcisstic -4.799E-03 .004 -.204 -1.297 .199
BR_6A - Antisocial -7.831E-03 .005 -.415 -1.609 .112BR_6B – Sadistic
(Aggressive)3.277E-03 .003 .181 .972 .334
BR_7 – Compulsive -9.296E-03 .004 -.372 -2.347 .021*BR_8A – Negativistic(Passive Aggressive)
-2.610E-03 .003 -.164 -.821 .414
BR_8B – Masochistic(Self-Defeating)
1.904E-03 .003 .129 .638 .525
BR - S - Schizotypal -5.318E-03 .003 -.330 -1.803 .075BR_C – Borderline -7.336E-03 .004 -.428 -1.933 .057
BR_P – Paranoid -2.479E-03 .003 -.162 -.754 .453BR_A – Anxiety 2.412E-03 .003 .179 .953 .343
BR_H – Somatoform 1.870E-03 .003 .099 .682 .497BR_N - Bipolar Manic 2.208E-03 .003 .122 .778 .439
BR_D – Dysthymia -1.461E-03 .003 -.087 -.506 .615BR_B Alcohol
Dependence1.338E-03 .003 .088 .423 .673
BR_T - Drug Dependence
6.705E-03 .004 .383 1.829 .071
BR_R - Post-TraumaticStress Disorder
-1.090E-03 .003 -.065 -.327 .745
BR_SS - ThoughtDisorder
4.538E-04 .003 .026 .143 .887
BR_CC - Major Depression
-2.433E-03 .004 -.117 -.650 .517
BR_PP - DelusionalDisorder
2.864E-03 .003 .203 .991 .325
a Dependent Variable: MMPI-II Cluster2 p < .05

73
Supplemental Table 3 Coefficients summary hypothesis 3 – males Coefficients
Unstandardized Coefficients
Standardized Coefficients
t Sig.
Model B Std. Error Beta1 (Constant) 1.843 .376 4.898 .000
BR_X - (Validity? ) -8.005E-03 .003 -.626 -2.988 .004**BR_Y-desirability 4.817E-03 .004 .265 1.073 .286
BR - Z Deabasement -3.147E-03 .004 -.179 -.823 .413BR_1 Schizoid 6.543E-04 .003 .041 .250 .803
BR_2A - Avoidant -3.937E-04 .002 -.034 -.172 .863BR - 2B Depressive 1.047E-03 .003 .089 .412 .682
BR_3 - Dependent 3.323E-03 .002 .254 1.488 .141BR_4 – Histrionic -6.146E-03 .004 -.336 -1.437 .155BR_5 – Narcisstic 3.976E-03 .003 .216 1.346 .182
BR_6A - Antisocial 2.344E-03 .004 .159 .604 .548BR_6B - Sadistic
(Aggressive)-1.965E-03 .003 -.139 -.731 .467
BR_7 – Compulsive 2.588E-03 .003 .133 .818 .416BR_8A - Negativistic(Passive Aggressive)
1.883E-03 .003 .152 .742 .460
BR_8B - Masochistic(Self-Defeating)
-2.438E-03 .002 -.211 -1.023 .309
BR - S - Schizotypal 3.409E-03 .002 .271 1.448 .152BR_C – Borderline 2.890E-03 .003 .216 .954 .343
BR_P – Paranoid 1.928E-03 .003 .162 .734 .465BR_A – Anxiety -2.408E-04 .002 -.023 -.119 .905
BR_H – Somatoform -8.513E-04 .002 -.058 -.389 .698BR_N - Bipolar Manic -1.995E-03 .002 -.141 -.880 .381
BR_D – Dysthymia 1.266E-03 .002 .096 .549 .585BR_B Alcohol
Dependence-1.035E-03 .003 -.087 -.410 .683
BR_T - Drug Dependence
-2.822E-03 .003 -.206 -.964 .338
BR_R - Post-TraumaticStress Disorder
7.273E-04 .003 .055 .273 .785
BR_SS - ThoughtDisorder
-4.316E-03 .003 -.318 -1.702 .093
BR_CC - Major Depression
2.587E-03 .003 .159 .866 .389
BR_PP - DelusionalDisorder
-3.433E-03 .002 -.311 -1.488 .141
a Dependent Variable: MMPI-II Cluster3 **p < .001
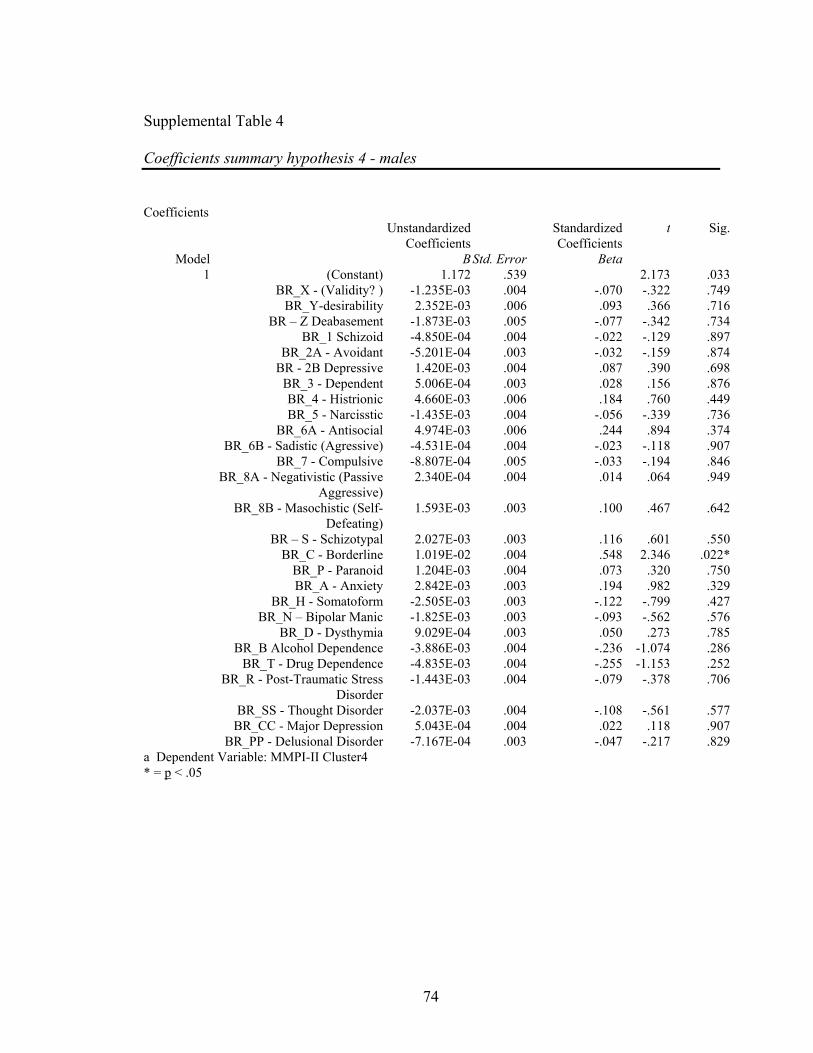
74
Supplemental Table 4 Coefficients summary hypothesis 4 - males Coefficients
Unstandardized Coefficients
Standardized Coefficients
t Sig.
Model B Std. Error Beta1 (Constant) 1.172 .539 2.173 .033
BR_X - (Validity? ) -1.235E-03 .004 -.070 -.322 .749BR_Y-desirability 2.352E-03 .006 .093 .366 .716
BR – Z Deabasement -1.873E-03 .005 -.077 -.342 .734BR_1 Schizoid -4.850E-04 .004 -.022 -.129 .897
BR_2A - Avoidant -5.201E-04 .003 -.032 -.159 .874BR - 2B Depressive 1.420E-03 .004 .087 .390 .698
BR_3 - Dependent 5.006E-04 .003 .028 .156 .876BR_4 - Histrionic 4.660E-03 .006 .184 .760 .449BR_5 - Narcisstic -1.435E-03 .004 -.056 -.339 .736
BR_6A - Antisocial 4.974E-03 .006 .244 .894 .374BR_6B - Sadistic (Agressive) -4.531E-04 .004 -.023 -.118 .907
BR_7 - Compulsive -8.807E-04 .005 -.033 -.194 .846BR_8A - Negativistic (Passive
Aggressive)2.340E-04 .004 .014 .064 .949
BR_8B - Masochistic (Self-Defeating)
1.593E-03 .003 .100 .467 .642
BR – S - Schizotypal 2.027E-03 .003 .116 .601 .550BR_C - Borderline 1.019E-02 .004 .548 2.346 .022*
BR_P - Paranoid 1.204E-03 .004 .073 .320 .750BR_A - Anxiety 2.842E-03 .003 .194 .982 .329
BR_H - Somatoform -2.505E-03 .003 -.122 -.799 .427BR_N – Bipolar Manic -1.825E-03 .003 -.093 -.562 .576
BR_D - Dysthymia 9.029E-04 .003 .050 .273 .785BR_B Alcohol Dependence -3.886E-03 .004 -.236 -1.074 .286
BR_T - Drug Dependence -4.835E-03 .004 -.255 -1.153 .252BR_R - Post-Traumatic Stress
Disorder-1.443E-03 .004 -.079 -.378 .706
BR_SS - Thought Disorder -2.037E-03 .004 -.108 -.561 .577BR_CC - Major Depression 5.043E-04 .004 .022 .118 .907
BR_PP - Delusional Disorder -7.167E-04 .003 -.047 -.217 .829a Dependent Variable: MMPI-II Cluster4 * = p < .05

75
Supplemental Table 5 Coefficients summary hypothesis 2 - females Coefficients
Unstandardized Coefficients
Standardized Coefficients
t Sig.
Model B Std. Error
Beta
1 (Constant) 1.400 .415 3.377 .001BR_X Validity -3.918E-03 .002 -.240 -1.578 .118
BR_Y Desirability -2.999E-03 .004 -.135 -.760 .449BR_Z Debasement 1.848E-03 .006 .062 .322 .748
BR_1 Schizoid 1.017E-03 .003 .050 .388 .699BR_2A Avoidant -1.184E-03 .003 -.070 -.366 .715
BR_2B Depressive -2.639E-03 .003 -.164 -1.025 .308BR_3 Dependent -2.981E-03 .002 -.163 -1.255 .213BR_4 Histrionic -1.169E-04 .003 -.007 -.038 .970
BR_5 Narcissistic -3.506E-03 .003 -.159 -1.175 .243BR_6A Antisocial 1.237E-03 .003 .066 .381 .704
BR_6B Sadistic (Aggressive) 2.791E-04 .003 .014 .111 .912BR_7 Compulsive 1.824E-04 .003 .008 .061 .952
BR_8A Negativstic 1.158E-03 .003 .063 .367 .714BR_8B Masochistic (Self-Defeating) 2.515E-03 .002 .173 1.117 .267
BR_S Schizotypal 3.996E-03 .003 .211 1.217 .227BR_C Borderline 9.679E-04 .003 .057 .290 .773
BR_P Paranoid -1.612E-03 .003 -.103 -.620 .537BR_A Anxiety 1.258E-03 .002 .087 .556 .580
BR_H Somatoform 3.614E-04 .003 .019 .135 .893BR - N Bipolar: Manic 5.466E-04 .002 .030 .222 .825
BR_D Dysthymia 1.520E-03 .003 .091 .571 .569BR_B Alcohol Dependence 2.728E-03 .002 .164 1.150 .253
BR_T Drug Dependence -2.675E-03 .002 -.152 -1.168 .246BR_R Post-Traumatic Stress Disorder -1.282E-04 .003 -.007 -.050 .960
BR_SS Thought Disorder 4.135E-03 .003 .217 1.285 .202BR_CC Major Depression 3.155E-03 .004 .165 .816 .417
BR_PP Delusional Disorder -1.554E-03 .002 -.107 -.725 .470a Dependent Variable: MMPI Cluster I

76
Supplemental Table 6 Coefficients summary for hypothesis 3- females Coefficients
Unstandardized Coefficients
Standardized Coefficients
t Sig.
Model B Std. Error Beta1 (Constant) 2.430 .474 5.130 .000
BR_X Validity 2.862E-03 .003 .191 1.009 .316BR_Y Desirability 5.143E-03 .005 .252 1.141 .257BR_Z Debasement -2.222E-03 .007 -.081 -.339 .735
BR_1 Schizoid -2.930E-03 .003 -.158 -.978 .331BR_2A Avoidant -4.621E-03 .004 -.299 -1.250 .215
BR_2B Depressive 2.364E-03 .003 .160 .803 .424BR_3 Dependent 2.989E-03 .003 .178 1.101 .274BR_4 Histrionic -8.557E-03 .004 -.527 -2.436 .017*
BR_5 Narcissistic 1.299E-03 .003 .064 .381 .704BR_6A Antisocial -6.349E-03 .004 -.368 -1.710 .091
BR_6B Sadistic(Aggressive)
-4.301E-04 .003 -.023 -.149 .882
BR_7 Compulsive -2.796E-03 .003 -.142 -.816 .417BR_8A Negativstic -1.708E-03 .004 -.102 -.474 .637
BR_8B Masochistic (Self-Defeating)
2.049E-03 .003 .154 .797 .428
BR_S Schizotypal -5.972E-03 .004 -.344 -1.591 .115BR_C Borderline -8.002E-04 .004 -.051 -.210 .834
BR_P Paranoid 4.273E-04 .003 .030 .144 .886BR_A Anxiety 3.065E-03 .003 .231 1.185 .239
BR_H Somatoform -2.972E-05 .003 -.002 -.010 .992BR - N Bipolar: Manic 3.683E-03 .003 .217 1.311 .193
BR_D Dysthymia -5.888E-04 .003 -.038 -.194 .847BR_B Alcohol
Dependence1.480E-03 .003 .097 .546 .586
BR_T Drug Dependence 6.493E-03 .003 .403 2.481 .015*BR_R Post-Traumatic
Stress Disorder-5.711E-04 .003 -.036 -.194 .847
BR_SS Thought Disorder -5.005E-03 .004 -.287 -1.361 .177BR_CC Major Depression -1.034E-03 .004 -.059 -.234 .815
BR_PP DelusionalDisorder
7.825E-04 .002 .059 .320 .750
a Dependent Variable: MMPI Cluster II * = p < .05

77
Supplemental Table 7
Coefficients summary hypothesis 4 - females Coefficients
Unstandardized Coefficients
Standardized Coefficients
t Sig.
Model B Std. Error Beta1 (Constant) .962 .455 2.113 .037
BR_X Validity 5.065E-03 .003 .332 1.858 .066BR_Y Desirability -1.746E-03 .004 -.084 -.403 .688BR_Z Debasement 5.877E-03 .006 .209 .934 .353
BR_1 Schizoid 1.350E-03 .003 .071 .469 .640BR_2A Avoidant 7.169E-03 .004 .453 2.018 .047*
BR_2B Depressive -9.544E-04 .003 -.063 -.338 .736BR_3 Dependent -1.693E-03 .003 -.099 -.649 .518BR_4 Histrionic 9.838E-03 .003 .593 2.915 .005*
BR_5 Narcissistic -2.472E-04 .003 -.012 -.075 .940BR_6A Antisocial 3.103E-03 .004 .176 .870 .387
BR_6B Sadistic(Aggressive)
5.024E-04 .003 .027 .182 .856
BR_7 Compulsive 3.444E-03 .003 .171 1.046 .298BR_8A Negativstic 6.868E-04 .003 .040 .198 .843
BR_8B Masochistic (Self-Defeating)
-2.331E-03 .002 -.172 -.944 .348
BR_S Schizotypal -1.180E-03 .004 -.067 -.327 .744BR_C Borderline -9.278E-04 .004 -.058 -.253 .801
BR_P Paranoid -4.505E-04 .003 -.031 -.158 .875BR_A Anxiety -3.679E-03 .002 -.271 -1.481 .142
BR_H Somatoform -7.987E-04 .003 -.045 -.273 .786BR - N Bipolar: Manic -1.687E-03 .003 -.097 -.625 .534
BR_D Dysthymia -2.118E-04 .003 -.013 -.073 .942BR_B Alcohol
Dependence6.577E-04 .003 .042 .253 .801
BR_T Drug Dependence -3.645E-03 .003 -.222 -1.450 .151BR_R Post-Traumatic
Stress Disorder3.981E-04 .003 .025 .141 .888
BR_SS Thought Disorder -1.405E-03 .004 -.079 -.398 .692BR_CC Major Depression -5.435E-03 .004 -.304 -1.281 .204
BR_PP DelusionalDisorder
2.335E-03 .002 .172 .993 .324
a Dependent Variable: MMPI Cluster III p < .05

78
REFERENCES
Adams, K. M., Heilbronn, M., Silk, S.D., Reider, E., & Blumer, D. P, (1981). Use of the
MMPI in a chronic pain patient sample. Journal of Clinical Psychology, 42, 878-
886.
Allen, J. G., Evans, R. B., & Huntoon, J. (1999). Complexities in complex
posttraumatic stress disorder in inpatient women: Evidence from cluster analysis of
MCMI-III personality disorder scales. Journal of Personality Assessment, 73(3), 449-
471.
American Psychiatric Association (1996). Diagnostic and statistical manual of
mental disorders (4th ed.). Washington, DC: American Psychiatric Association.
Andersson, G. B. J. (1981). Epidemiologic aspects on low-back pain in industry. Spine,
6, 53-60.
Anderson, G.B.J., Pope, M.H., & Frymoyer, J.W. (1984). Epidemiology. In M. H. Pope,
J. W. Frymoyer & G. Andersson (Eds.), Occupational low back pain (pp. 101-
114). New York: Praeger.
Armentrout, D.P., Moore, J.E., Parker, J.C., Hewett, J. E., & Feltz, C. (1982). Pain
patient MMPI subgroups: The psychological dimensions of pain. Journal of
Behavioral Medicine, 5, 201-211.
Aronoff, G. M. (1985). The role of the pain center in the treatment for intractable
suffering and disability resulting from chronic pain. In G.M. Aronoff (Ed.),
Evaluation and treatment of chronic pain (pp. 503-510). Baltimore: Urban and
Schwarzenberg.

79
Aronoff, G. M., & Rutrick, D. (1985). Psychodynamics and psychotherapy of the
chronic pain syndrome. In G. M. Aronoff (Ed.), Evaluation and treatment of
chronic pain (pp. 463-469). Baltimore: Urban & Schwarzenberg.
Beals, R. K., & Hickman, N.W. (1972). Industrial injuries of the back and extremities:
comprehensive evaluation – an aid in prognosis and management: A study of 180
patients. Journal of Bone and Joint Surgery, 54, 1593-1611.
Bergin, A. E. (1971). The evaluation of therapeutic outcomes. In A. E. Bergin & S. L.
Garfield (Eds.). Handbook of psychotherapy and behavior change: An empirical
analysis. New York: Wiley.
Bernstein, I. H., & Garbin, C. P. (1983). Hierarchical clustering of pain patients’ MMPI
profiles. Journal of Personality Assessment, 47, 171-172.
Beutler, L. E. (1979). Toward specific psychological therapies for specific conditions.
Journal of Consulting and Clinical Psychology, 48, 456-459.
Blashfield, R. K. (1980). Propositions regarding the use of cluster analysis in clinical
research. Journal of Consulting and Clinical Psychology, 48, 456-459.
Blumer, D., & Heilbronn, M. (1981). The pain-prone patient: A clinical and
psychological profile. Psychosomatics, 22, 395-402.
Blumer, D., & Heilbronn, M. (1982). Chronic pain as a variant of depressive disease: A
rejoinder. Journal of Nervous and Mental Disease, 172, 405-407.

80
Bombardier, C. H., Divine, G. W., Jordan, J.S., Brooks, W. B., & Neelson, F. A. (1993).
Minnesota Multiphasic Personality Inventory (MMPI) cluster groups among
chronically ill patients: Relationship to illness adjustment and treatment outcome.
Journal of Behavioral Medicine, 16, 467-484.
Bonica, J. J. (1980). Pain therapy research: Past and current status and future needs. In
L. K. Y. Ng and J. J. Bonica (Eds.), Pain, discomfort and humanitarian care (pp 1
– 46). New York: Elsevier/North Holland.
Bradley, L. A., & Van Der Heide, L. H. (1984). Pain-related correlates of MMPI profile
subgroups among back pain patients. Health Psychology, 3, 157-174.
Butcher, J. N. (1990). The MMPI-2 in psychological treatment. New York: Oxford
University Press.
Butcher, J. N. (2000). Revising Psychological Tests Lessons Learned from the Revision
of the MMPI. Psychological Assessment, 12 (3), 263-271.
Butcher, J.N., & Tellegen, A. (1978). Common methodological problems in MMPI
research. Journal of Consulting and Clinical Psychology, 46, 620-628.
Butcher, J.N., Dahlstrom, W.G., Graham, J.R., Tellegen, A., & Kaemmer, B. (1989).
Manual for administration and scoring. MMPI-2. Minneapolis: University of
Minnesota Press.
Catchlove, R. F., Cohen, D. R., Braha, R. E., & Demers-Desrorsiers, L. A. (1985).
Incidence and implications of alexithymia in chronic pain patients. Journal of
Nervous and Mental Disorders, 173, 246-248.
Chapman, C.R., & Bonica, J.J. (1985). Chronic Pain. Kalamazoo: Upjohn.
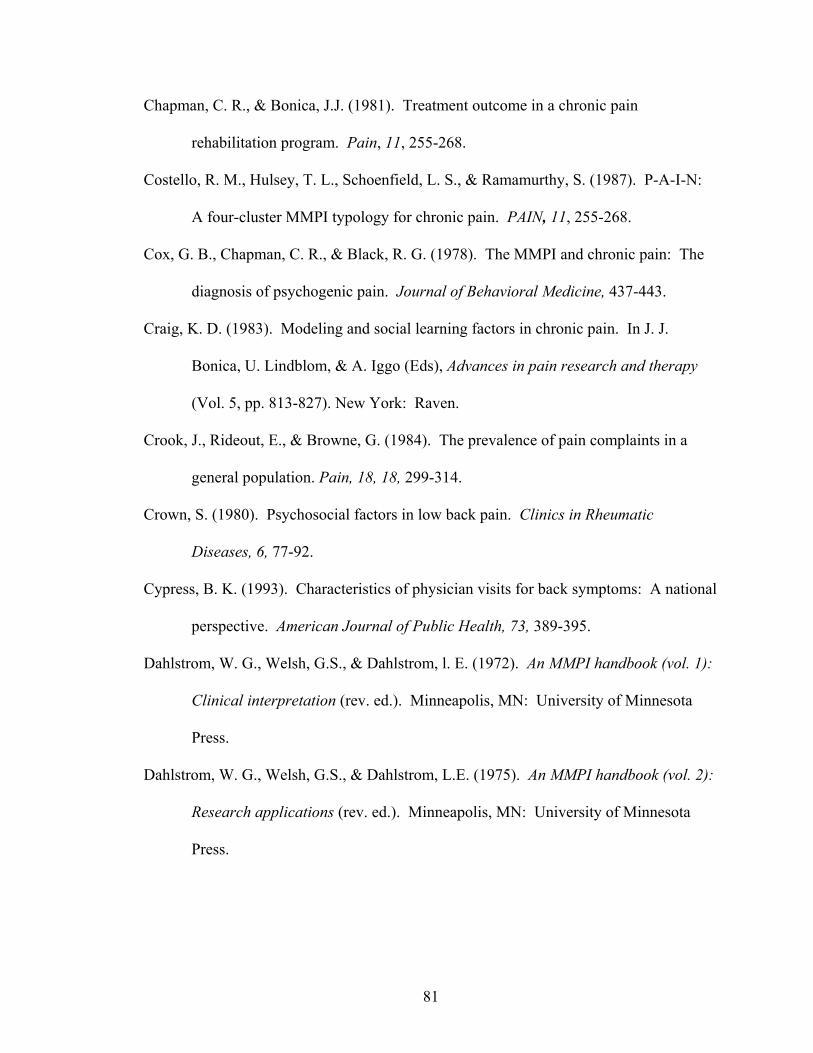
81
Chapman, C. R., & Bonica, J.J. (1981). Treatment outcome in a chronic pain
rehabilitation program. Pain, 11, 255-268.
Costello, R. M., Hulsey, T. L., Schoenfield, L. S., & Ramamurthy, S. (1987). P-A-I-N:
A four-cluster MMPI typology for chronic pain. PAIN, 11, 255-268.
Cox, G. B., Chapman, C. R., & Black, R. G. (1978). The MMPI and chronic pain: The
diagnosis of psychogenic pain. Journal of Behavioral Medicine, 437-443.
Craig, K. D. (1983). Modeling and social learning factors in chronic pain. In J. J.
Bonica, U. Lindblom, & A. Iggo (Eds), Advances in pain research and therapy
(Vol. 5, pp. 813-827). New York: Raven.
Crook, J., Rideout, E., & Browne, G. (1984). The prevalence of pain complaints in a
general population. Pain, 18, 18, 299-314.
Crown, S. (1980). Psychosocial factors in low back pain. Clinics in Rheumatic
Diseases, 6, 77-92.
Cypress, B. K. (1993). Characteristics of physician visits for back symptoms: A national
perspective. American Journal of Public Health, 73, 389-395.
Dahlstrom, W. G., Welsh, G.S., & Dahlstrom, l. E. (1972). An MMPI handbook (vol. 1):
Clinical interpretation (rev. ed.). Minneapolis, MN: University of Minnesota
Press.
Dahlstrom, W. G., Welsh, G.S., & Dahlstrom, L.E. (1975). An MMPI handbook (vol. 2):
Research applications (rev. ed.). Minneapolis, MN: University of Minnesota
Press.
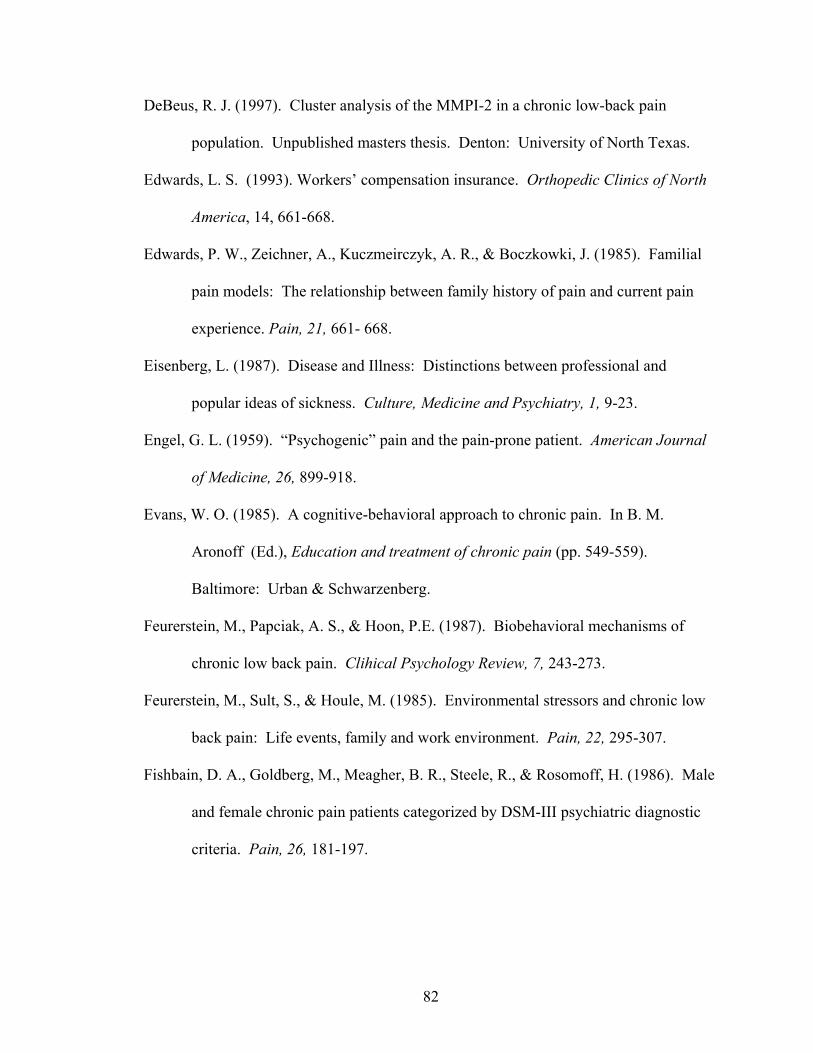
82
DeBeus, R. J. (1997). Cluster analysis of the MMPI-2 in a chronic low-back pain
population. Unpublished masters thesis. Denton: University of North Texas.
Edwards, L. S. (1993). Workers’ compensation insurance. Orthopedic Clinics of North
America, 14, 661-668.
Edwards, P. W., Zeichner, A., Kuczmeirczyk, A. R., & Boczkowki, J. (1985). Familial
pain models: The relationship between family history of pain and current pain
experience. Pain, 21, 661- 668.
Eisenberg, L. (1987). Disease and Illness: Distinctions between professional and
popular ideas of sickness. Culture, Medicine and Psychiatry, 1, 9-23.
Engel, G. L. (1959). “Psychogenic” pain and the pain-prone patient. American Journal
of Medicine, 26, 899-918.
Evans, W. O. (1985). A cognitive-behavioral approach to chronic pain. In B. M.
Aronoff (Ed.), Education and treatment of chronic pain (pp. 549-559).
Baltimore: Urban & Schwarzenberg.
Feurerstein, M., Papciak, A. S., & Hoon, P.E. (1987). Biobehavioral mechanisms of
chronic low back pain. Clihical Psychology Review, 7, 243-273.
Feurerstein, M., Sult, S., & Houle, M. (1985). Environmental stressors and chronic low
back pain: Life events, family and work environment. Pain, 22, 295-307.
Fishbain, D. A., Goldberg, M., Meagher, B. R., Steele, R., & Rosomoff, H. (1986). Male
and female chronic pain patients categorized by DSM-III psychiatric diagnostic
criteria. Pain, 26, 181-197.

83
Ford, M. R. (1983). The somatizing disorders: Illness as a way of life. New York:
Elsevier Biomedical, Inc.
Fordyce, W. E. (1994, February). Back pain, compensation, and public policy. In J.
Rosen (Ed.), Proceedings of the Vermont Conference on Primary Prevention of
Psychopathology.
Fordyce, W. E. (1986). Behavioral methods for chronic pain and illness. St. Louis: C.
V. Mosby.
Fordyce, W. E., Brockway, J. A., & Spengler, D. (1987). Acute back pain: A control-
group comparison of behavioral vs. traditional management methods. Journal of
Behavioral Medicine, 9, 127-140.
Franz, C., Paul, R., Bautz, M., Choroba, G., & Hildebrandt, J. (1986). Psychosomatic
aspects of chronic pain: A new way of description based on MMPI item analysis.
Pain, 26, 33-43.
Freeman, C., Calsyn, D., & Louks, J. (1976). The use of the Minnesota Multiphasic
Personality Inventory with low back pain patients. Journal of Clinical
Psychology, 32, 294-298.
Gentry, W. D., Shows, W. D., & Thomas, M. (1974). Chronic low back pain: A
psychological profile. Psychosomatics, 151, 174-177.
Graham, J.R. (1987). The MMPI: A practical guide (2nd ed.). New York: Oxford
University Press.
Gray, H. F. R. S. (1995). Gray’s anatomy (15th ed.). New York: Barnes & Noble Books.

84
Greene, R. L. (1988). The MMPI: Use with specific populations. Philadelphia: Grune
and Stratton.
Greene, R. L. (1991). The MMPI-2/MMPI: An interpretive manual. Boston: Allyn and
Bacon.
Greene, R. L. (2000). The MMPI-2: An interpretive manual, 2nd Edition. Needham
Heights: Allyn and Bacon.
Hanvik, L. J. (1949). MMPI profiles in patients with low-back pain. Journal of
Consulting Psychology, 15, 350-353.
Harkins, S. W., Kwentus, J., & Price, D. D. (1984). Pain and the elderly. In C.
Benedetti, C. R. Chapman, & G. Moricca (Eds.), Advances in pain research and
therapy (vol. 7, pp. 103-121. New York: Raven.
Hart, R. L. (1984). Replicated multivariate clustering of personality profiles. Journal of
Clinical Psychology, 40, 129-133.
Hendler, N., Mollet, Al, Talo, S., & Levin, S. (1988). A comparison between the MMPI
and the “Mensana Clinic Back Pain Test” for validating the complaint of chronic
back pain. Journal of Occupational Medicine, 30, 98-102.
Hickling, E. J., Sison, G.F. P., & Holtz, J. L. (1995). Role of psychologists in
multidisciplinary pain clinics: A national survey. Professional Psychology
Research and Practice, 16, 868-880.
Institute of Medicine Committee on Pain, Disability, and Chronic Illness Behavior
(1997). Pain and disability: Clinical, behavioral, and public policy perspectives.
Washington, DC: National Academy Press.

85
International Association for the Study of Pain, Subcommittee on Classification (1986).
Pain terms: A current list with definitions and notes on usage, Pain, Supp. 3,
215-221.
Katon, W., Egan, K., & Miller, D. (1985). Chronic pain: Lifetime psychiatric diagnoses
and family history. American Journal of Psychiatry, 142, 1156-1160.
Keisler, D. J. (1985). Some myths of psychotherapy research and the search for a
paradigm. Psychological Bulletin, 65, 110-136.
Keller, L. S., Butcher, J . N., & Sluske, W. S. (1990). Objective personality assessment.
In G. Goldstein & M. Hersen (Eds.), Handbook of Psychological Assessment (2nd
ed.). New York: Pergamon.
Keller, L. S., & Butcher, J. N., (1991). Assessment of chronic pain patients with the
MMPI-2. Minneapolis, MN: University of Minnesota Press.
Kelsey, J. White, A. A., Pastides, H., & Bisbee, G. E. (1979). The impact of
muskuloskeletal disorders on the population of the United States. Journal of
Bone and Joint Surgery, 61-A, 959-964.
Klein, B. P., Jensen, R. C., & Sanderson, L. M. (1984). Assessment of workers’
compensation claims for back strains/sprains. Journal of Occupational Medicine,
26, 443-448.
Lair, C. V., & Trapp, E. P. (1962). The differential diagnostic value of MMPI with
somatically disturbed patients. Journal of Clinical Psychology, 18, 146-147.
Leavitt, F. (1985). The value of the MMPI conversion V in the assessment of
psychogenic pain. Journal of Psychosomatic Research, 29, 125-131.

86
Love, A. W., & Peck, C. L. (1987). The MMPI and psychological factors in chronic low
back pain: A review. Pain, 28, 1-28.
McArthur, D. L., Cohen, M. J., Gottlieb, H. J., Naliboff, B.D., & Schandler, S. L. (1987).
Treating chronic low back pain. I. Admission to initial follow-up. Pain, 29, 1-
22.
McCreary, C., Turner, J., & Dawson, E. (1977). Differences between functional and
organic low back pain patients. Pain, 4, 73-78.
McCreary, C. (1985). Empirically derived MMPI profile clusters and characteristics of
low back pain: A review. Pain, 28, 1-28.
McGill, J., Lawlis, G. F., Selby, D., Mooney, V., & McCoy, C. E. (1983). The
relationship of Minnesota Multiphasic Personality inventory (MMPI) profile
clusters to pain behaviors. Journal of Behavioral Medicine, 6, 77-92.
McGrath, R. E., & O’Malley, W.B. (1986). The assessment of denial and physical
complaints: The validity of the Hy scale and associated MMPI signs. Journal of
Clinical Psychology, 42, 754-760.
Mendelson, G. (1984). Compensation, Pain complaints, and psychological disturbance.
Pain, 20, 169-177.
Melzack, R., & Wall, P.D. (1983). The challenge of pain. New York: Basic Books.
Melzack, R., & Wall, P.D. (1965). Pain mechanisms: A new theory. Science, 150, 971-
979.
Merskey, H. (1980). Some features of the history of the idea of pain. Pain, 9, 3-8.

87
Murray, J. B. (1982). Psychological aspects of low back-pain: Summary. Psychological
Report, 50, 343-351.
Millon, T. (1969/1983). Modern psychopathology: A biosocial approach to maladaptive
learning and functioning. Philadelphia: Saunders.
Millon, T. (1981). Disorders of personality: DSM-III, Axis II. New York: John Wiley.
Millon, T. (1990). Toward a new peronology. New York: John Wiley.
Millon, T. (Ed.) (1997). The Millon inventories. New York: Guilford Press.
Millon, T., & Davis, R. D. (1996). Disorders of the personality: DSM-IV and beyond
(rev. ed.). New York: John Wiley.
Millon, T., Davis, R., and Millon, C. (1997). Millon Clinical Multiaxial Inventory-III
(MCMI-III) (2nd ed). Minneapolis: National Computer Systems, Inc.
Moore, J. E., McFall, M.E., Kivlahan, D. R., & Capestany, F. (1988). Risk of
misinterpretation of MMPI schizophrenia scale elevations in chronic pain
patients. Pain, 32, 207-213.
National Computer Systems, Inc. (1989). The Minnesota Multiphasic Personality
Inventory – 2 (Computer program). Minneapolis, MN: University of Minnesota
Press.
Nouris, M. J. (1985). SPSS-X advanced statistics guide. New York: McGraw-Hill.
Nunnally, J.C. (1978). Psychometric theory. New York: McGraw-Hill.
Osborne, D. (1985). The MMPI in medical practice. Psychiatric Annals, 534-541.
Pennebaker, J. W. (1992). The psychology of physical symptoms. New York: Springer-
Verlag.

88
Pollack, D. R., & Grainey, T. F. (1984). A comparison of MMPI profiles for state and
private disability insurance applicants. Journal of Personality Assessment, 48,
121-125.
Prokop, C. K. (1986). Hysteria scale elevations in low back pain patients: A risk factor
for mis-diagnosis? Journal of Consulting and clinical Psychology, 46, 425-427.
Prokop, C. K. (1988). Chronic Pain. In R. L. Greene (Ed.), The MMPI: Use with
specific populations. Philadelphia, PA: Grune and Stratton.
Reisbord, L. S., & Greenland, S. (1995). Factors associated with self-reported low-back
pain prevalence: A population-based study. Journal of Chronic Diseases, 38,
691-702.
Retzlaff, P. (1996). MCMI-III Diagnostic validity: Bad test or bad validity study.
Journal of Personality Assessment, 1996, 66(2), 431-437.
Riley, J. L., Robinson, M.E., Geisser, M. E., & Wittmer, V. T. (1993). Multivariate
cluster analysis of the MMPI-2 in chronic low-back pain patients. The Clinical
Journal of Pain, 9, 248-252.
Shaffer, J. W., Nussbaum, K., & Little, J. M. (1972). MMPI profiles of disability
insurance claimants. American Journal of Psychiatry, 129, 403-407.
Snibbe, J.R., Peterson, P.J., & Sosner, B. (1980). Study of psychological characteristics
of workers’ compensation sample using the MMPI and Millon Clinical Multiaxial
Inventory. Psychological Reports, 47, 959-966.
89
Snook, S. H., & Jensen, R.C., (1994). Cost. In M. H. Pope, J. W. Frymoyer, & G.
Andersson (Eds.), Occupational low back pain (pp. 115-121). New York:
Praeger.
Sobel, D. S. (1995). Rethinking medicine: Improving health outcomes with cost-
effective psychosocial interventions. Psychosomatic Medicine, 57, 234-244.
Southwick, S. M., & White, A. A. (1983). The use of psychological tests in the
evaluation of low-back pain. Journal of Bone and Joint Surgery, 65, 560-565.
Statsoft, Inc. (2002). STATISTICA for WINDOWS (Computer Program). Tulsa:
StatSoft, Inc.
Steinberg, G.G. (1992). Epidemiology of low back pain. In M. Stanton-Hicks & R. Boas
(Eds.), Chronic low back pain (pp. 1-13. New York: Raven.
Sternbach, R. A. (1974). Psychological aspects of pain and the selection of patients.
Clinical Neurosurgery, 21, 323-333.
Sternbach, R. A., Wolf, S. R., Murphy, R. W., & Adeson, W.H. (1974). Traits of pain
patients: The low back “loser.” Psychosomatics, 14, 226-229.
Strang, J.P. (1995). The chronic disability syndrome. In G. M. Aronoff (Ed.),
Evaluation and treatment of chronic pain (pp. 603-623). Baltimore: Urban &
Schwarzenberg.
Tabacyhnick, B. G. and Fidell, L.S. (2001). Using multivariate statistics, 4th edition.
Needham Heights: Allyn & Bacon.

90
Tellegen, A. (1988). Derivation of uniform T-scores for the restandardized MMPI. In R.
D. Fowler (chair), Revision and restandardization of the MMPI: Rationale,
normative sample, new norms, and initial validation. Symposium conducted at
the 96th Annual Convention of the American Psychological Association, Atlanta,
GA.
Trief, P., & Stein, N. (1985). Pending litigation and rehabilitation outcome of chronic
back pain. Archives of Physical Medicine and Rehabilitation, 66, 95-99.
Turk, D. C., & Flor, H. (1984). Etiological theories and treatments for chronic back pain
II. Psychological models and interventions. Pain, 19, 209-233.
Tryon, R. C., & Bailey, D. E. (1970). Cluster analysis. New York: McGraw-Hill.
Van Houdenhove, B. (1986). Prevalence and psychodynamic interpretation of premorbid
hyperactivity in patients with chronic pain. Psychotherapeutics and
Psychosomatics, 45, 195-200.
Ward, J. H. (1963). Hierarchical grouping to optimize an objective function. American
Statistical Association Journal, 236-244.
Watson, D. (1982). Neurotic tendencies among chronic pain patients: An MMPI item
analysis. Pain, 14, 365-385.