Embed Size (px)
Citation preview

The relationship between shoot number and vigor in grapevines:
Physiological causes and practical implications.
By
Laura Susan Deyermond
A thesis submitted in partial fulfillment of
the requirements for the degree of
Master of Science in Horticulture
WASHINGTON STATE UNIVERSITY
Department of Horticulture and Landscape Architecture
May 2011

ii
To the Faculty of Washington State University:
The members of the Committee appointed to examine the thesis of Laura Susan Deyermond find it satisfactory and recommend that it be accepted.
________________________________
Markus Keller, Ph.D., Chair
________________________________
Bhaskar Bondada, Ph.D.
________________________________
Amit Dhingra, Ph.D.

iii
Acknowledgements
I would like to acknowledge and thank all those who have assisted me in my
education and research. Thank you, Dr. Markus Keller for allowing me to conduct my
research with you, even though it may have been tough at times. You have helped to
expand my knowledge and understanding of viticulture and I am extremely grateful for
the opportunity to learn from you. I would like to thank my committee, Dr. Bhaskar
Bondada and Dr. Amit Dhingra for your help both in the classroom and in the field.
Special thanks to Lynn Mills for not only assisting me in my research but in also helping
me feel welcome when I was so far from home. Thank you John Ferguson for helping
me figure out how to use the high pressure flow meter and providing company in the
field on long days of experiments.
Thank you, Gary Ballard, Alan Kawakami, Dr. Jim Harbertson, Maria Mirales,
Eric Harwood, Sally Longoria, Sushan Ru Geoff Hall, Yun Zhang, Matthew Halldorson,
Richard Hoff, Daniela Romero, and Eugenia Galet for your advice and support. Special
thanks to Nicolas Brannon for your last minute help editing my thesis. Thank you,
Washington State University Horticulture and Landscape Architecture, and the
Northwest Center for Small Fruits Research for the financial support. Last but not least,
I would like to thank my friends and family for supporting my move across the country to
pursue my degree.
iv
The relationship between shoot number and vigor in grapevines:
Physiological causes and practical implications.
Abstract
By Laura Susan Deyermond, M.S. Washington State University
May 2010
Chair: Markus Keller
One of the first lessons a viticulturist is taught is that high quality grapes are
dependent on the ideal balance between grapevine shoot and fruit growth. As most of
the vegetative growth occurs before fruit set, i.e. before the berries become strong
sinks, it seems that competition between berry and shoot growth cannot be the reason
for the reduction of vigor. A hydraulic limitation was believed to be the cause of the
differences in vigor of vines with varying shoot numbers. The hydraulic limitation
hypothesis was tested by pruning field-grown Merlot vines to a large range of bud
numbers and exposing the vines to repeated water stress and irrigation. The resulting
differences in vigor were assessed by measuring shoot length and final pruning weight,
gas exchange, water potential, and the resistance to water flow through the vine at key
stages of development. The study was conducted with field-grown, own-rooted
grapevines. 100 vines were pruned in winter leaving between 5 and 200 buds per vine,
and the clusters thinned to one cluster per shoot at bloom.
It was found that the inverse relationship between shoot number and vigor was
not caused by a hydraulic limitation as the vines’ resistance to water flow was higher in

v
vines with fewer shoots (i.e., more vigorous), and lower in vines with more shoots.
Despite there being a greater resistance to water flow through vines with fewer shoots,
the vulnerability of vines to water stress, increased with increasing shoot number,
possibly due to having a larger crop yield and a stronger sink demand. The increased
transpiration of vines with more shoots may have caused the decreased hydraulic
resistance as more water was needed to sustain a larger leaf canopy. At harvest, mean
cluster weight decreased with increasing shoot number per vine, while yield increased
with increasing shoot numbers as they had more and smaller clusters. Soluble solids
and titratable acidity both decreased as the number of shoots per vine increased, while
the number of shoots had little effect on the pH and color of the berry juice.
vi
TABLE OF CONTENTS
Page
ACKNOWLEDGEMENTS iii
ABSTRACT iv
LIST OF TABLES viii
LIST OF FIGURES x
APPENDIX xvi
CHAPTER
1) INTRODUCTION 1
General Aspects of the Washington Wine and Grape Industry 1
Vegetative Development of Grapevines 2
Reproductive Development of Grapevines 11
The Ideal Vine 15
Gas Exchange and Stomatal Conductance 17
Water Deficit Effects 19
Cavitation 22
The Hydraulic Limitation Hypothesis 23
Hypothesis and Objectives 25
2) MATERIALS AND METHODS 27
Plant Material 27
Regulated Deficit Irrigation 28
vii
De-fruiting Experiment 29
Viticultural Measurements 29
Gas-Exchange Measurements 31
Water Potential 33
Hydraulic Resistance 34
Yield Components and Fruit Composition 36
Statistical Analysis 38
3) RESULTS 39
De-fruiting Experiment 39
Viticultural Measurements 40
Gas Exchange 47
Water Potential 58
Hydraulic Resistance 64
Yield Components and Fruit Composition 71
4) DISCUSSION 77
Practical Recommendation and Implications 87
Conclusions 88
Future Research 88
REFERENCES 90
APPENDIX 94

viii
LIST OF TABLES
Page
1) 2009 Shoot growth of V. vinifera Merlot. Vines were separated into groups based on the number of shoots per vine. Values are means based on designated vine groups, ―a‖ and ―b‖ signify statistical differences between means based on Duncan’s multiple range tests. 42
2) 2010 Shoot growth of V. vinifera. Vines were separated into groups based on the number of shoots per vine. Shoot length and was measured from the base of the shoot to the tip. Values are means based on designated vine groups. ―a‖ and ―b‖ signify statistical differences between means based on Duncan’s multiple range tests 2010. 42
3) 2009 Canopy leaf area at veraison and harvest. Canopy leaf area was estimated by measuring the leaf area of a representative shoot and multiplying by the number of shoots. ―a‖ and ―b‖ signify statistical differences between means based on Duncan’s multiple range test. 43
4) 2010 Canopy leaf area at bloom, veraison, post-veraison, and harvest. Canopy leaf area was estimated by measuring the leaf area of a representative shoot and multiplying by the number of shoots. ―a‖ and ―b‖ signify statistical differences between means based on Duncan’s multiple range test. 43
5) 2009 Viticultural Measurements of V. vinifera Merlot. Vines were separated into groups based on the number of shoots per vine and values are means based on designated vine groups. ―a‖ and ―b‖ signify statistical differences between means based on Duncan’s multiple range test. 44
6) 7) 2010 Viticultural Measurements of V. vinifera Merlot. Vines were
separated into groups based on the number of shoots per vine and values are means based on designated vine groups. ―a‖ and ―b‖ signify statistical differences between means based on Duncan’s multiple range test. 45
ix
8) 2009 and 2010 Harvest yield components of V. vinifera Merlot. Values are means based on designated vine groups, letters signify statistical differences between means based on Duncan’s multiple range tests. 72
9) 2009 and 2010 Harvest fruit composition of V. vinifera Merlot. Values are means based on designated vine group; letters signify statistical differences between means based on Duncan’s multiple range tests. 73

x
LIST OF FIGURES
1) Primary shoot node configuration, with compound bud, lateral shoot, leaf petiole, and tendril. From Stewart, 1994. 5
2) A transverse section through a compound bud. LS- leaf scar; Lat- lateral shoots; 1,2,3- dormant buds. From Pratt (1974). 6
3) Diagrammatic longitudinal section of the apical section of a root (Keller,
2010). 10
4) Anatomical features of a mature grape berry from Coombe (1987) 13
5) Timing and pattern of grape berry development from fruit set to harvest from Coombe (2001). 14
6) 2010 Canopy Size of Merlot Vine with 30 Shoots. Photos taken on
October 13, 2010 from irrigation line (left) and 2.7m away (right) of V. vinifera Merlot. 30
7) 2010 Canopy Size of a Merlot Vine with 124 shoots. Photos taken on
October 13, 2010 from irrigation line (left) and 2.7m away (right). 31
8) LCpro+ leaf cuvette measuring gas exchange of a mature, fully expanded V. vinifera Merlot leaf. 32
9) High Pressure Flow Meter Connected to the Roots and the Trunk of V.
vinifera Merlot. 35
10) 2010 De-fruiting experiments. Vigor (measured from August 12th to September 15th 2010) in relation to the number of shoots per vine using V. vinifera Merlot. Fruit was removed from vines on August 10th and measured on August 12th and September 15th. Vigor was measured as the difference in shoot length in relation to the difference in time. 39
11) 2010 Total vine leaf area at harvest time (October 21, 2010) in relation
to the number of shoots per vine using V. vinifera Merlot. 40
12) 2009 and 2010 Mean daily air temperature (°C) from April 1 (DOY 91) to October 31 (DOY 304) from the Roza Weather Station. Data from the Washington Agricultural Weather Network, WSU Prosser. (www.weather.wsu.edu). 41
13) 2010 Vigor in relation to the number of shoots per vine of V. vinifera
Merlot. Vigor was calculated by dividing the difference in shoot length

xi
by the difference in time (days) between bloom (June 1, 2010) and veraison (August 12, 2010). 46
14) 2010 Vigor (veraison to harvest) in relation to the number of shoots per
vine of V. vinifera Merlot. Vigor was calculated by dividing the difference in shoot length by the difference in time (days) between veraison (August 12, 2010) and Harvest (October 15 2010). 46
15) 2009 Diurnal stomatal conductance (gs). Measurements were taken on
August 20, 2009. Measurements were taken every three hours using V. vinifera Merlot. Vines were irrigated on August 17, 2009(DOY 232). Sunrise was at 5:53am and sunset was at 7:50pm. Values are means based on designated vine groups. 48
16) 2009 Diurnal stomatal conductance (gs). Measurements were taken on
August 24, 2009. Measurements were taken every three hours using V. vinifera Merlot. Vines were irrigated on August 17, 2009. Sunrise was at 5:59am and sunset was at 7:42pm Values are means based on designated vine groups. 48
17) 2009 Stomatal conductance (gs), photosynthesis (A), transpiration (E).
Measurements were taken at 9 am, from August 17 (DOY 229) to October 7, 2009 (DOY 283) with V. vinifera Merlot. Vines were irrigated on August 20, 2009. Values are means based on designated vine groups. Values are means based on designated based on mean number of shoots per vine. Arrows indicate irrigation events. 49
18) 2009 Photosynthesis (A) in relation to stomatal conductance (gs).
Measurements taken at 9am using V. vinifera Merlot. Curve calculated using distance weighted least squares. 50
19) 2010 Pre-veraison diurnal stomatal conductance. Measurements taken
on July 7, 2010 using V. vinifera Merlot. Vines were irrigated on July 7, 2010. Sunrise and sunset were at 5:03 am and 8:44pm respectively. Values are means based on designated vine groups. Curves are fitted by the Distance Weighted Least Squares. 51
20) 2010 Pre-veraison diurnal transpiration (E). Measurements were taken
on July 7, 2010 using V. vinifera Merlot Vines were irrigated on July 7, 2010. Sunrise and sunset were at 5:03 am and 8:44pm respectively Values are means based on designated vine groups. Curves are fitted by the Distance Weighted Least Squares. Vines with a mean of 23 shoots per vine significantly higher transpiration values at hour 13 than those of the other groups (P-value: 0.050). 52
xii
21) 2010 Pre-veraison diurnal photosynthesis (A). Measurements were taken on July 7, 2010 using V. vinifera Merlot. Vines were irrigated on July 7, 2010. Sunrise and sunset were at 5:03 am and 8:44pm respectively Values are means based on designated vine groups. Curves are fitted by the Distance Weighted Least Squares. 52
22) 2010 Pre-veraison diurnal stomatal conductance (gs). Measurements
were taken on August 3, 2010 using V. vinifera Merlot. Vines were irrigated on July 7, 2010. Sunrise and sunset were at 5:31 am and 8:17pm respectively. Values are means based on designated vine groups. Curves are fitted by the Distance Weighted Least Squares. 53
23) 2010 Pre-veraison diurnal transpiration (E). Measurements were taken
on August 3, 2010 using V. vinifera Merlot. Vines were irrigated on July 7, 2010. Sunrise and sunset were at 5:31 am and 8:17pm respectively. Values are means based on designated vine groups. Curves are fitted by the Distance Weighted Least Squares. 54
24) 2010 Pre-veraison diurnal photosynthesis (A). Measurements were
taken on August 3, 2010 using V. vinifera Merlot. Negative photosynthesis values indicate respiration. Vines were irrigated on July 7, 2010. Sunrise and sunset were at 5:31 am and 8:17pm respectively. Values are means based on designated vine groups. Curves are fitted by the Distance Weighted Least Squares. Vines with a mean of 62 shoots per vine had significantly lower photosynthesis values than those of other groups (P-value: 0.025). 54
25) 2010 Post veraison diurnal stomatal conductance (gs). Measurements
were taken on October 6, 2010 using V. vinifera Merlot Vines were irrigated on October 6, 2010. Sunrise and sunset were at 6:54am and 6:19pm respectively. Values are means based on designated vine groups. Curves are fitted by the Distance Weighted Least Squares. 55
26) 2010 Post-veraison diurnal transpiration (E). Measurements were
taken on October 6, 2010 using V. vinifera Merlot. Vines were irrigated on October 6, 2010. Sunrise and sunset were at 6:54am and 6:19pm respectively. Values are means based on designated vine groups. Curves are fitted by the Distance Weighted Least Squares. 56
27) 2010 Post-veraison diurnal photosynthesis (A). Measurements were
taken on October 6, 2010 using V. vinifera Merlot. Vines were irrigated on October 6, 2010. Sunrise and sunset were at 6:54am and 6:19pm respectively. Values are means based on designated vine groups. Curves are fitted by the Distance Weighted Least Squares. 56
xiii
28) 2010 Diurnal stomatal conductance (gs). Measurements were taken on October 13, 2010 using Vitis V. vinifera Merlot. Vines were irrigated on October 6, 2010. Sunrise and sunset were at 7:04am and 6:05pm respectively. Values are means based on designated vine groups. Curves are fitted by the Distance Weighted Least Squares. 57
29) 2010 Diurnal transpiration (E). Measurements were taken on October
13, 2010 using Vitis V. vinifera Merlot. Vines were irrigated on October 6, 2010. Sunrise and sunset were at 7:04am and 6:05pm respectively. Values are means based on designated vine groups. Curves are fitted by the Distance Weighted Least Squares. 57
30) 2010 Diurnal photosynthesis (A). Measurements were taken on
October 13, 2010 using Vitis V. vinifera Merlot. Vines were irrigated on October 6, 2010. Sunrise and sunset were at 7:04am and 6:05pm respectively. Values are means based on designated vine groups. Curves are fitted by the Distance Weighted Least Squares. 58
31) 2009 Midday stem water potential (Ψstem) over the course of the
season using V. vinifera Merlot. Arrows indicate irrigation events. Values are means based on designated vine size groups. 59
32) 2009 Stomatal conductance (gs) and photosynthesis (A) in relation to
midday stem water potential (Ψstem). Measurements were taken on DOY 233, 240, and 252 using V. vinifera Merlot. Stomatal conductance and photosynthesis were measured at 9am, and midday Ψstem
measured at 12pm. 60
33) 2010 Stomatal conductance (gs) and photosynthesis (A) in relation to midday leaf water potential (Ψleaf). Measurements were taken on DOY 196, 201, and 215 using V. vinifera Merlot. Stomatal conductance and photosynthesis were measured at 9am, and midday Ψleaf measured at 12pm. 61
34) 2010 Soil moisture taken at 30cm in relation to predawn water potential
(Ψpredawn) of V. vinifera Merlot. Soil Moisture was measured using a neutron probe at 16 locations throughout the field. 62
35) 2010 Soil moisture measurements taken at 90, 60, and 30 cm from
April 10 to September 30, 2010. Soil Moisture was measured using a neutron probe at 16 locations throughout the field. 63
36) 2010 Predawn water potential (predawn) (Figure A) and midday leaf
water potential (leaf) (Figure B) measurements in relation to the number of shoots per vine taken after (July 8, 2010) and before (August 3, 2010) an irrigation event using V. vinifera Merlot. 64

xiv
37) 2010 Whole vine hydraulic resistance (rplant ) in relation to the number of shoots per vine. Resistance was calculated using the evaporative
flux method (Rplant = (leaf - E x Canopy leaf area). Data was collected on August 4, 2010 using V. vinifera Merlot. 65
38) 2010 Whole vine hydraulic resistances (rplant) in relation to the number
of shoots per vine. Resistance was calculated using the evaporative
flux method (Rplant = (leaf - E x Canopy leaf area). Data was collected on October 13, 2010 using V. vinifera Merlot. 66
39) 2010 Whole vine hydraulic resistance (Rplant) in relation to stomatal
conductance (gs). Resistance was calculated using the evaporative flux
method (Rplant = (leaf - E x Canopy leaf area). Water potential data was taken on October 13th, 2010 using V. vinifera Merlot. 67
40) 2010 Whole vine hydraulic resistance (rplant) in relation to midday leaf
Flux Method (Rplant = (leaf - E x Canopy leaf area). Water potential data was taken on October 13, 2010 using V. vinifera Merlot. 67
41) 2010 High pressure flow meter measurements of V. vinifera Merlot
shoots in relation to the shoot length(A), leaf area (B), and shoot diameter (C). Measured on October 5, 2010. 68
42) 2010 High Pressure Flow Meter Measurements of Trunk Resistnace.
V. vinifera Merlot. 69
43) 2010 High Pressure Flow Meter Measurements of Trunk and Cordon Resistance of V. vinifera Merlot. 69
44) 2010 Hydraulic resistance measurements of V. vinifera Merlot. Trunk
and cordon resistance (measured with a high pressure flow meter) in relation to whole vine resistance (measured by the evaporative flux method) on October 13, 2010. 70
45) 2010 Hydraulic resistance measurements of V. vinifera Merlot. Rplant measured with a high pressure flow meter, and rplant was measured by the evaporative flux method on September 20 and October 13, 2010 respectively. 70
46) 2010 Above ground and root hydraulic resistance measurements of V.
vinifera Merlot. Resistance was measured with a high pressure flow meter, on September 20, 2010. 71
47) 2009 and 2010 Mean cluster weight in relation to the number of shoots
per vine of V. vinifera. 74

xv
48) 2009 and 2010 Harvest vine yield (t/ha) in relation to the number of shoots per vine of V. vinifera Merlot. 74
49) 2009 and 2010 Harvest soluble solids in relation to the number of
shoots per vine of V. vinifera Merlot. 75
50) 2010 Yield to pruning weight ratio in relation to the number of shoots per Vine. Yield and pruning weights were measured in grams, using V. vinifera Merlot. 76

xvi
APPENDIX
1. BBCH system for identifying grapevine growth stages modified from Eichhorn and Lorenz (1977) by B.G. Coombe (1995).

1
CHAPTER ONE
INTRODUCTION
General Aspects of the Washington Wine and Grape Industry
Washington State is the second largest premium wine grape producing region in
the United States (following California), producing a total of 13759 hectares (ha) of wine
grapes and 10521 ha of juice grapes in 2009 (Washington Agricultural Statistics
Service, 2010). The major wine varieties grown are Chardonnay (30299 tonnes (t)),
White Riesling (29120 t), Cabernet Sauvignon (25038 t), and Merlot (22498 t). As of
2009, Washington contains ten American Viticultural Areas (AVA's): Yakima Valley,
Walla Walla Valley, Columbia Valley, Puget Sound, Red Mountain, Columbia Gorge,
Horse Heaven Hills, Wahluke Slope, Rattlesnake Hills, and Snipes Mountain (The
Washington Association of Wine Grape Growers (WAWGG)).
The Roza Unit, located in Prosser, WA, where the experiment occurred, is
located on the eastern side of the Cascade Mountains where a rain shadow effect
exists. The rain shadow gives rise to a semi-arid climate with less than 250 mm of rain
per year. The Roza Unit had 1426 growing degree days (GDD) in 2009 and 1276 GDD
in 2010 (GDD: base 10°C) (AgWeatherNet, www.weather.wsu.edu). Growing degree
days (GDD), also known as heat summation, are measured by taking the mean of the
maximum and minimum daily temperatures and subtracting 10°C. Daily values are
added from April 1st to October 31st for a total value (Watson, 1998). Prosser has an
average annual rainfall of 198 mm, with 75% of the rainfall occurring between October
and April, and with a short growing season of 158 frost-free days. The very dry climate
2
in central Washington allows irrigation management to be the largest single controlling
factor in vineyard management, and it influences fruit quality and winter hardiness
(Pratt, 1974). Vineyards in eastern Washington are susceptible to killing frosts and cold
temperatures, and vines are typically ―hardened-off‖ by late season drought stress.
Vegetative Development of Grapevines
Vitis vinifera L. is a swiftly growing, woody vine with several distinctive
morphological characteristics. Vitis have tendrils which support their weak stems by
coiling around other objects. It also has large vessels, rays that break up secondary
tissues into radial blocks, and extensive food-storage tissues (Pratt, 1974). Lorenz et al.
(1994) showed that grapevine growth can be separated into seven macro-stages—bud
development, leaf development, inflorescence development, flowering, fruit
development, fruit ripening, and senescence—annually as seen in the appendix
(Coombe, 1995). Sperry et al. (1987) showed that the xylem vessels of wild grapevines,
Vitis labrusca L. and Vitis riparia Michx., were gas-filled during the winter. Vegetative
development normally begins in March with bleeding, which is the exudation of xylem
sap from pruning cuts, and is noted as a transition from dormancy to active vegetative
growth. Prior to leaf expansion in the spring, the vine must refill its xylem tissues by
using root pressure to force the air to dissolve and remobilizing carbohydrate reserves,
proteins, amino acids and sugars into the phloem (Sperry et al.. 1987; Keller, 2010).
Auxin (a hormone) production and cell division in buds begins one to three weeks prior
to budbreak in the proximal leaf primordia of distal buds. In addition, concentrations of
abscisic acid (ABA) decline allowing buds to break dormancy (Keller, 2010).

3
The grapevine trunk is the permanent structure of the vine. The root supports the
canopy, provides xylem and phloem elements for transport of water, nutrients and
hormones, and is responsible for starch storage during dormancy. The trunk divides into
the main arms, or cordons, of the vine. Once established, the trunk and cordons only
grow in diameter from year to year. Shoots, arising from the grapevine’s cordon, are the
succulent stems which bear leaves, inflorescences, and tendrils (Stewart, 1994).The
shoot is the current season’s growth and is developed from an over-wintering primary
bud located within the node of a one-year-old cane (Morrison, 1991; Stewart, 1994).
The grapevine shoot is divided into nodes and internodes; leaves, tendrils and
inflorescences arise from nodes and the sections between nodes are termed
internodes. New shoot growth arises from the apical meristem (the growth tip) via cell
division in meristematic tissue and cell elongation of the newly formed cells. New leaf
primordium is produced every 2 to 3 days as the shoot is growing at a rate of 3 to 4 cm
per day. Once the primary vascular tissues are differentiated, the central meristematic
cells of the vascular bundle begin to function as a cambium with chloroplasts (Pratt,
1974). At the end of the growing season, or if the apical meristem dies during the
season, shoot growth ceases and the shoot will mature into a cane, growing only in
diameter (Stewart, 1994). In addition, by the end of the first growing season the living
cells of the stem contain starch. During the growing season, the starch content of the
vine is lowest in the spring and highest in late summer and winter (Pratt, 1974).
In temperate climates, daily mean temperatures above 8-10°C (depending on
species and cultivar) induce budbreak and initiate shoot growth. In addition to
temperature, budbreak is also affected by grape variety, time of pruning, nutrient
4
availability, and water stress (Mills et al., 2006). Early growth is entirely dependent on
nutrient reserves stored in the permanent structures of the vine, until the new leaves
reach photosynthetic maturity. The initial growth phase is characterized by apical
dominance. Auxin is released from leaf primordia and young leaves near the shoot
apex, inhibiting lateral shoot growth and stimulating internode extension (Keller, 2010).
Damage or removal of the apical meristem causes a decrease in auxin and stimulates
cytokinin synthesis, allowing for lateral shoot growth. Lateral shoots can comprise up to
40% of the vine’s total leaf area and are source organs providing grape clusters with
assimilate more effectively than main leaves late in the season (Candolfi-Vasconcelos
and Koblet, 1990). Shoot growth continues as nutrient and water availability permits
until mid summer. Shortly after midsummer, when the berries begin to ripen, the shoots
begin to harden off from the base to the shoot tip, allowing for maturation into canes due
to decreased concentrations of auxin and increased concentrations of abscisic acid, a
dormancy hormone synthesized in the roots. As autumn progresses, leaf senescence
signifies the completion of the shoot growth cycle. Senescence is also associated with
the recycling of nutrients from leaves to permanent portions of the vine, followed by leaf
abscission, and the dehydration and cold acclimation of all woody parts (Keller, 2010).
Grapevine tendrils pass through three phases of growth: a primordium
developing from a stem apical meristem, a hydathode differentiated from the apical
meristem of the tendril, and a pressure-sensitive twining organ that grows intercalary
away from the light until it meets a support. Tendrils are similar to a lateral bud, in that
they are inserted on the dorsal side of the shoot but in plane with the shoot (Pratt,
1974). Towards the end of the season the tendril becomes hardened and woody
5
through the development of collenchymas in the cortex, lignified ray cells, and fibers in
the vascular bundles.
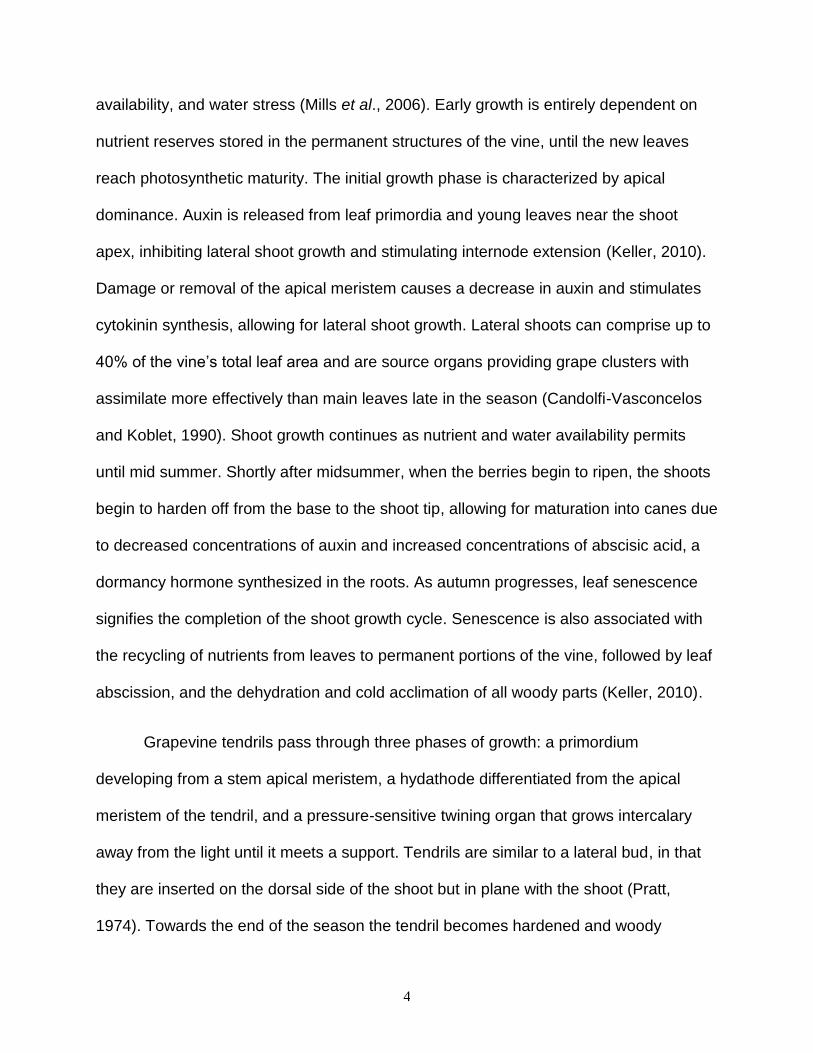
Figure 1: Primary shoot node configuration, with compound bud, lateral shoot, leaf petiole, and
tendril. From Stewart, 1994.
Grapevines, along with other members of the Vitaceae family, are characterized
by having a hierarchy of buds, and leaf-opposed inflorescences or tendrils, as seen in
Figure 1. Tendrils and inflorescences are homologous organs, and form from
uncommitted primordia (Morrison, 1991). Grapevines display a three-node sequence,
producing two buds in every leaf axil, a simple bud that is axillary to the leaf, and a
compound bud. The compound bud is also referred to as a dormant or latent bud, and is
composed of three parts: the large central primary bud, and two smaller secondary buds
as seen in Figure 2 (Morrison, 1991).
6
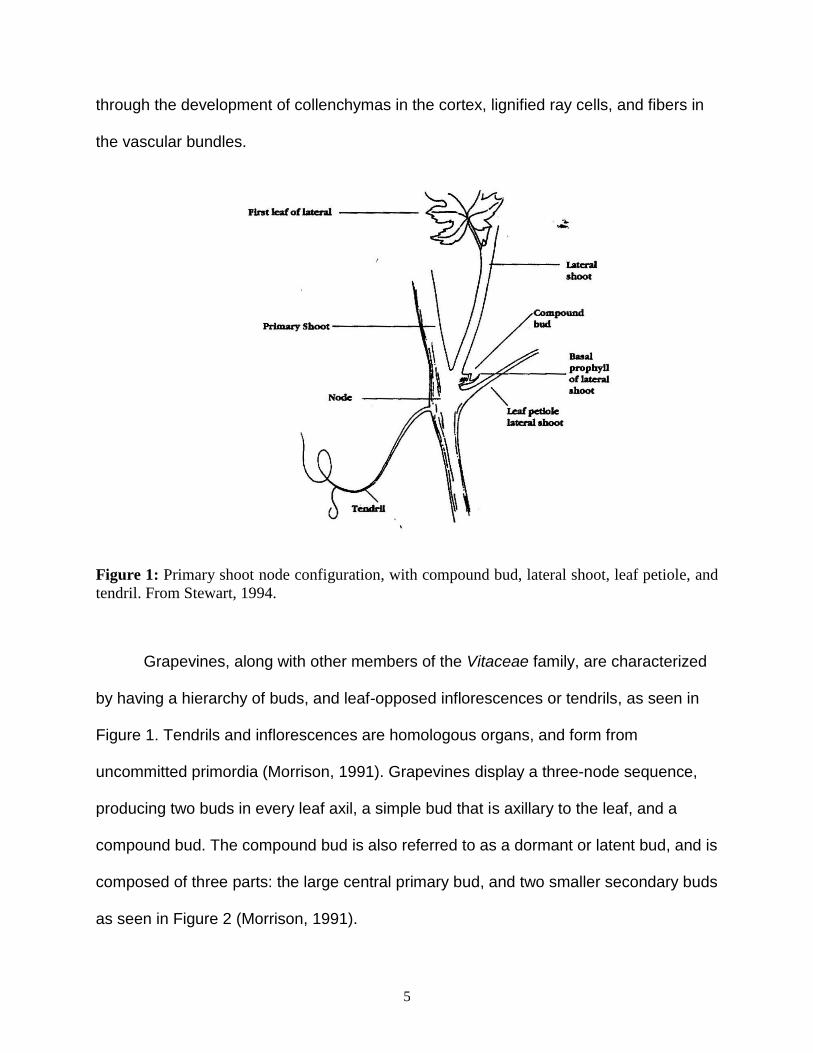
Figure 2: A transverse section through a compound bud. LS- leaf scar; Lat- lateral shoots; 1,2,3-
dormant buds. From Pratt (1974)
The primary latent buds develop slowly during the growing season, generally
producing six to ten basal nodes with leaf primordia, and up to three inflorescence or
tendril primordia (Morrison, 1991; Stewart, 1994). After over-wintering, the six
compound buds at the basal nodes of the primary shoot go through organ initiation from
February until May. During this time period, the primary bud develops two basal
prophylls, two to three bud scales, six to ten foliar leaf primordia, and two to four
uncommitted primordia (Morrison, 1991). After budbreak, the apical meristem
establishes a pattern of three leaves followed by two uncommitted primordia. Secondary
buds are initiated only after the primary bud forms several leaves.
Lateral shoots are formed in the leaf axil of true leaves (from a prompt bud) and
will grow in the same season following the development of the primary shoot. The
lateral shoots will grow to varying lengths depending on the vine vigor (the rate of shoot
growth). Generally, lateral shoots lack inflorescences, although a second crop can
sometimes be produced by a summer lateral in vigorous vines.
7
Grapevine leaves consist of a petiole, which connects the leaf to the shoot, and a
lamina (the leaf blade). Hegedus, as described by Pratt (1974), showed that in April and
May, the first leaf (in basipetal numbering) is a primordium. The second leaf shows
cellular differentiation and stipules, while the third leaf differentiates into a three-lobed
blade and petiole. The fourth leaf contains five lobes, with veins and plate meristems,
and the fifth leaf has seven lobes with veins, pearl glands and crystal-containing cells.
Finally, the sixth leaf has an increase in the number and vascularization of veins, a
blade with five layers of cells, and pearl glands and crystal-containing cells (Pratt,
1974).
Grapevine leaves are the primary source of photosynthates, and normally begin
exporting upon reaching 30 to 50% of their maximal size, while full leaf expansion
generally takes 30 to 40 days (Stewart, 1994). Mature grape leaf petioles have a
cutinized epidermis containing stomata and ground parenchyma covered in layers of
collenchyma on each side. The upper epidermis of mature leaves lack stomata and has
a cuticle consisting of overlapping platelets of wax (Pratt, 1974). Within mature leaves,
the largest veins consist of several vascular bundles, while the smallest veins have a
collateral bundle ending in tracheids (Pratt, 1974). Photosynthates are exported to
developing apical meristems and clusters. In addition, the majority of photosynthates
are transferred via the phloem tissue to the roots for storage to provide carbohydrate
reserves for next season’s growth (Stewart, 1994).
Mesophyll cells contain the majority of the photosynthetically active chloroplasts
located within a plant leaf. The light saturation level for C3 plants, such as grapevines,
occurs at a photon flux density of 600-700 µmol m-2 s-1. An increase in light intensity

8
above the level of saturation will not lead to an increase in photosynthesis, although the
environmental conditions under which the vine are grown may cause changes in the
value of light saturation (Mullins et al., 2003). Trellis type, vine orientation, and density
also play important roles in the vine’s photosynthetic efficiency. The light compensation
point for photosynthesis refers to the point of equilibrium in which the amount of CO2
assimilated by photosynthesis equals the amount lost during respiration. Mullins et al.
(2003) state that under conditions in which there are multiple layers of leaves in the
canopy, leaves in the shaded center of the vine canopy are not photosynthesizing at
their maximum capacity, affecting the vines total photosynthetic efficiency. Temperature
also plays a critical role in the vine’s rate of photosynthesis, the optimum leaf
temperature of field grown grapevines ranges between 25 and 35°C. Irrigation
management affects the water relations of the vine, which in turn affect photosynthesis.
Recently irrigated vines will maintain their rate of photosynthesis during the day,
whereas vines that are under a water deficit will show a decrease in photosynthesis
from before midday until sunset (Mullins et al., 2003).
The grapevine root system is vital to the growth and production of the entire vine.
The root provides various functions as an anchor, absorbs water and nutrients, stores
reserves, and is involved in the production of hormones. Roots, depending upon soil
type and depth, are mainly concentrated in the top meter of the soil directly under the
vine canopy, with the greatest mass of roots found at a depth of 20 to 60 centimeters
(Stewart, 1994). Roots differ from stems in that they lack nodes and internodes. At the
beginning of each growing season, new absorbing roots form from many growing points
from over-wintering roots. The primary structure of a root consists of a root tip, a zone of

9
elongation, and a zone of absorption. The root tip is 2-4mm long, surrounded by a
starchy cap. The starch derivatives, distal to the tip, enable the root to push through the
soil (Pratt, 1974). The cells proximal to the tip from the zone of elongation which is a
few mm long. Water and nutrients in the form of salts are absorbed in the zone of
absorption, which is 10cm long. In this zone, many epidermal calls elongate
perpendicularly to the surface and form root hairs. Roots hairs are responsible for the
majority of the absorptive surface of the root. Depending on the cultivar and
environment, root hairs can be 12-15 μm in diameter and 140-365 μm long (Pratt,
1974).
New roots are formed throughout the growing season, some of which develop
into main structural components, or anchors, while most of the annual root growth dies
in the same season. Roots absorb dissolved nutrients from the soil solution, which are
then actively transported into the vascular tissue and carried upward into the above-
ground portion of the vine (Stewart, 1994). Therefore, the amount of available soil
water directly influences the uptake of nutrients. The primary vascular cylinder of a
primary root consists of a pericyle made up of parenchyma between the endodermis
and the vascular cylinder, which encloses alternating bundles of primary phloem and
primary xylem, separated by medullary rays as seen in Figure 3. Primary phloem
develops centrifugally, consisting of sieve tubes and lacking companion cells and
parenchyma. Primary xylem differentiates centripetally and consists of only vessels
(Pratt, 1974).

10
Figure 3: Diagrammatic longitudinal section of the apical section of a root (Keller, 2010).
Secondary vascular tissue is located above the zone of absorption in the zone of
conduction, where lateral roots develop. In addition, a vascular cambium and a
periderm are formed. Secondary xylem consists of large scalariform-pitted vessels,
tracheids, parenchyma, and lignified fibers. At the end of the vegetative growing
season, many roots that were produced during this period die; only the strongest roots
become covered in periderm and overwinter (Pratt, 1974). In consecutive years, the
resumption of cell division and elongation of over-wintering root tips produces new

11
regions of absorption, and the radial expansion of permanent roots. Cambium continues
to form in a discontinuous ring of alternating bands of sieve tubes and phloem
parenchyma (soft phloem), and phloem fibers (hard phloem) are formed towards the
outside of the root (Pratt, 1974). Secondary xylem and rays are formed from the
vascular cambium opposite the phloem strands towards the inside of the root (Raven et
al., 2005). Starch is stored within rays, phloem parenchyma and fibers, and pith within
second-year-and-older roots (Pratt, 1974).
Reproductive Development of Grapevines
According to Stewart (1994), there are three defined stages in the formation of
grapevine inflorescences and flowers. The first stage involves the formation of anlagen
(undifferentiated primordia), club-shaped meristematic protrusions from dormant buds
(Stewart, 1994; Mullins et al., 2003). The formation of inflorescence primordia occurs if
the primordium undergoes repeated branching to develop many rounded branch
primordial. The formation depends on both environmental and endogenous factors
(Stewart, 1994). High temperatures are required for inflorescence formation, whereas
cool temperatures (<20°C) promote tendril formation in grapevines (Mullins et al., 2003).
The effect of light intensity on grapevine fruitfulness is independent of temperature, as
shading reduces fruitfulness. Thompson Seedless requires ten hours of sunlight per day
during which inflorescence formation is critical for an acceptable level of fertility (Mullins
et al., 2003). In addition, water stress may result in an increase in fertility of basal buds,
leading to an increased fruitfulness of the entire vine due to the reduced foliage density

12
of water-stressed vines. However, water stress can lead to an indirect reduction in both
bud fruitfulness and shoot dry mass by reducing photosynthesis (Mullins et al., 2003).
The first two stages of inflorescence formation occur during the development of the
latent bud in the previous spring and summer.
The final stage of flower formation occurs when the inflorescence primordia
differentiate into flowers shortly before and during budbreak in the spring. The flowers of
most V. vinifera varieties are small, between 4 and 5 mm long, and are grouped
together in an inflorescence (Stewart, 1994). Inflorescences form opposite a leaf, and
contain several hundred flowers per inflorescence. The newly formed flowers bloom six
to ten weeks following bud burst. The flowers of most V. vinifera varieties are
hermaphroditic, containing both a functional female pistil, comprised of a stigma, style,
and ovary, and male stamens, consisting of filaments and anther (Stewart, 1994). The
stamens and corollas (joined petals) develop successively under the influence of
gibberellin (a growth hormone), while the inflorescences become visible and separate.
The pistil develops after the individual flowers become visibly separated on the
inflorescence (Keller, 2010). The pedicel supports each individual flower and berry,
which is connected to a rachis which forms the main axis of the cluster. After pollination
and fertilization, the ovary develops into a berry and the inflorescence becomes a
cluster with a rachis, pedicels, and berries (Stewart, 1994). Only 20 to 30% of the
flowers will set. The rest fail to be fertilized and develop into mature fruits, and
eventually shriveling and dropping off (Mullins et al., 2003).

13
Figure 4: Anatomical features of a mature grape berry from Coombe (1987)
Individual berries consist of a skin, pulp, and seeds as seen in Figure 4. Skins of
grape berries develop different color variations during different stages of their life cycle,
due to the presence of pigments on the berry skin. In addition, tannins and aromatics
also reside within the berry skin (Stewart, 1994). The texture of the grape berry pulp
initially ranges from firm and tough, to soft and crisp, while the color may range from a
light green to red depending on grape age and variety. As the berry ripens the pulp
exhibits varying ranges of sweetness, as well as acidity. Berry seeds vary in their color,
shape, size, and amount (Stewart, 1994).
14
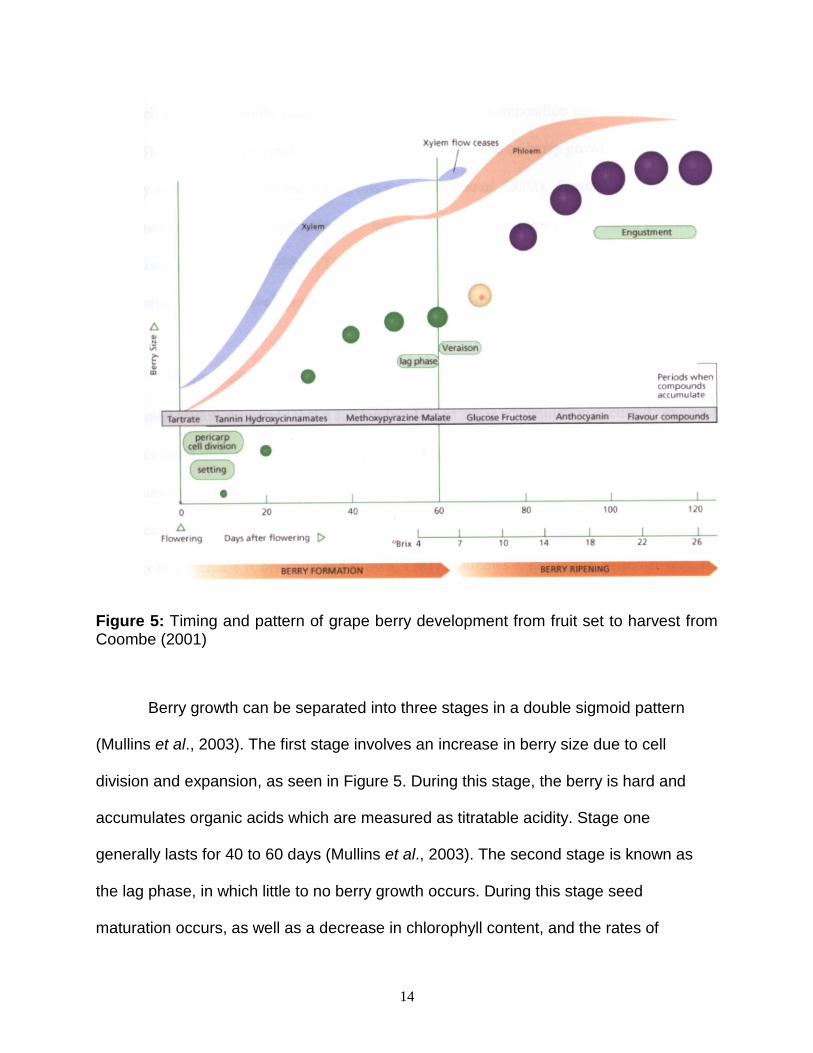
Figure 5: Timing and pattern of grape berry development from fruit set to harvest from Coombe (2001)
Berry growth can be separated into three stages in a double sigmoid pattern
(Mullins et al., 2003). The first stage involves an increase in berry size due to cell
division and expansion, as seen in Figure 5. During this stage, the berry is hard and
accumulates organic acids which are measured as titratable acidity. Stage one
generally lasts for 40 to 60 days (Mullins et al., 2003). The second stage is known as
the lag phase, in which little to no berry growth occurs. During this stage seed
maturation occurs, as well as a decrease in chlorophyll content, and the rates of

15
photosynthesis and respiration. Stage two lasts for 7 to 40 days depending on the grape
variety (Mullins et al., 2003). The onset of stage three is signaled by veraison, at which
point the berry undergoes a sudden change in color from green to yellow or red can be
observed as the berry ripens. In addition, the berry softens acid levels decrease and
sugar begins to accumulate within the berry to a concentration greater than 1M, and a
rapid increase in berry volume can be seen (Mullins et al., 2003; Stewart, 1994). Stage
three lasts 35 to 55 days on average in which the berry matures and almost no cell
division or enlargement occurs (Mullins et al., 2003; Pratt, 1971). The cell number in the
developing berry increases three to four fold, while the cell volume increases three
hundred fold (Mullins et al., 2003).
The Ideal Vine
Vineyard productivity is limited by the total seasonal amount of PAR
(photosynthetically active radiation) intercepted by the canopy. Canopy structure, mainly
the distribution of leaves, is crucial for adequate light interception and productivity. The
amount of energy and carbon captured by the canopy is dependent on the total leaf
area, leaf surface distribution, canopy structure, and the photosynthetic rate of individual
leaves (Keller, 2010). In order to achieve the highest rate of productivity, standard
canopy features should be obtained (Smart, 1985; Smart et al., 1990). Ideally, rows
should be orientated from north to south to obtain the maximum amount of light
interception by both sides of the canopy. One may deviate from the north to south
orientation in high light irradiance environments to protect the berries from overheating
16
on the west side of the canopy by shifting the row orientation slightly to the northeast.
Canopy height and row width should be in a one to one ratio for optimal light
interception to reduce shading of one canopy by another. The canopy should be trained
vertically to avoid shading and to promote leaf and fruit exposure, although in high
temperature and high light irradiance environments this is less important to prevent
sunburning of berries as some shading may be useful. The canopy surface area should
be approximately 21,000 m2/ha, 30 to 40 cm wide, containing 1 to 1.5 leaf layers, and
with 80-100% of the leaves on the outside of the canopy. Higher values may lead to
reduced light interception by shading and reduced fruit quality, while lower values are
associated with incomplete light interception. In addition, there should be approximately
15 shoots per meter of canopy to reduce crowding and shading. Lower numbers of
shoots may lead to suboptimal light interception. As with all guidelines, these values can
vary due to differences in cultivar and vine vigor, as well as environmental conditions.
Furthermore, 50 to 100% of the vine’s fruiting zone should be at the top or on the
outside of the canopy, in order to promote anthocyanin and tannin production and for
disease control. Fruit exposure should be 100% on the eastern side of the canopy, and
close to 50% on the western side due to daytime temperature differences. Too much
exposure can inhibit anthocyanin production, cause an increase in phenolic compounds
beyond desired concentrations, and result in sunburn and heat damage. The renewal
zone (the part of the shoot which will become a fruit-bearing unit in the following year)
should be towards the top of the canopy as to promote the initiation of inflorescences. In
addition, the pruning weight (the total weight of the canes pruned in the winter) should
be from 0.3 to 0.6 kg/m of canopy length, with each cane weighing 20 to 40 g each. A

17
ratio of yield to pruning weight per vine should be from 5 to 10; values higher than 10
are associated with delayed ripening and over cropping, while values lower than 5 are
associated with having low yield and high shoot vigor.
While these guidelines, as outlined by Keller (2010) [modified from Smart (1985)
and Smart et al. (1990)], should be used as a reference for vineyard establishment, they
must be edited based on site, environmental, cultivar, and vigor differences. Vineyard
sites with low to moderate vigor, and shallow root zones, which are located in low
fertility soils with limited water and nutrient-holding capacity, may produce canopies
close to the ideal canopy (Keller, 2010).
Gas Exchange and Stomatal Conductance
Plants have acquired the ability to regulate their stomatal conductance
depending on environmental conditions. Stomatal opening is regulated such that
photosynthesis is co-limited by CO2 diffusion through stomata and light-driven electron
transport (Lambers, 1988). Leaves conduct photosynthesis within chloroplasts,
converting light energy to chemical energy in the form of carbohydrates. The overall
reaction of photosynthesis consists of:
3CO2 + 6H2O Light→ C3H6O3 + 3O2 + 3H2O (Raven et al., 2005).
Chloroplasts are the organelles responsible for this conversion. Within the chloroplast,
thylakoids contain chlorophyll and are involved in the biophysical reactions converting
physical energy into chemical energy (Mullins et al., 2003). The water used in

18
photosynthesis is derived from the soil, and the carbon dioxide is diffused from the
ambient air, through stomata, into the leaf and then into the chloroplasts (Stewart, 1994;
Mullins et al., 2003). As the stomata close, the amount of carbon dioxide and water
becomes limited, causing a decline in the vine’s rate of photosynthesis. The rate of
photosynthesis is dependent on additional factors, such as light intensity, species and
variety, air temperature, and vine age (Stewart, 1994).
When turgor pressure of the leaf drops below a specific critical point, the
stomatal opening becomes smaller, reducing the amount of water lost via transpiration
(Raven et al., 2005). Abscisic acid (ABA) acts as a signal for changes in stomatal
conductance and gene expression in response to water deficits (Bray, 1997). During
water stress, ABA causes stomatal closure and reduces transpirational water loss.
When water relations return to normal, ABA concentrations decrease (Wan et al., 2009).
Plants can be separated into two groups, anisohydric and isohydric. In anisohydric
plants, leaf water potential is dependent on soil water status. An anisohydric grapevine’s
leaf water potential (leaf) decreases with increasing evaporative demand during the day
and is lower in drought-treated plants than in watered. Isohydric plants have a constant
leaf, which is not as dependent on soil water status. These differences and their effect
on stomatal conductance are thought to be caused by the differences in the perception
of ABA by stomata; primarily to avoid damaging water deficits causing cavitations in the
xylem (Schultz, 2003). Stomatal closure, or loss of solutes from guard cells, begins
when ABA produced in the roots, upon exposure to drying soil, is transported in the
xylem from the root to the leaves. Stomatal closure may fully account for the inhibition of
photosynthesis induced by water deficit as well as other environmental stresses
19
(Downton et al., 1988). It seems reasonable to assume that earlier stomatal closure will
limit the daily carbon assimilation, and thus reduce grapevine growth and productivity.
Water Deficit Effects
The soil-plant-atmosphere continuum (SPAC) model is based on the theory that
water must be under tension to be transported through the plant’s xylem (Choné et al.,
2001). The steepest gradient in the soil-plant-atmosphere continuum occurs at the leaf
surface, demonstrating that the stomata are the major control point for plant-water
relations (Lambers et al.,1988). This theory is essential in the use of the concept of
measuring plant water potential. The pressure chamber has been demonstrated as a
reliable method for determining the water status of field-grown grapevines (Downton et
al., 1988).
Plant water potential can be measured reliably using a pressure chamber by
measuring predawn leaf water potential (predawn) and midday stem water potential
(stem). predawn measures plant water status near zero plant water flux, providing
information on the root zone soil water potential because predawn water status is
considered to be in equilibrium with the soil water status (Downton et al., 1988). In
addition, predawn is said to be a measure of the relative ability of the vine to mine water
from the soil, also termed the average water deficit (Jackson, 2008). stem indicates the
capacity of the grapevine to conduct water from the soil to the atmosphere, and has
been shown to be more important in revealing differences in water status of the soil as

20
soil water conditions become drier (Downton et al., 1988). The same relationships were
found by Noar and Wample (1994) in Vitis labruscana. When field-grown grapevines
experience water limitation, leaf can be used as the first indicator of water deficit,
followed by predawn (Choné et al., 2001).
While the main driving force of water movement through plants is caused by
differences in water pressures, in the direction of high to low pressure (or from a region
of low solute concentrations to high concentrations). The passive forces of the plant’s
hydraulic system pull water up from the soil through the roots and up to the leaves due
to transpiration. Keller (2010) describes the transpiration-cohesion-tension theory of
xylem sap flow as the evaporation of water from cell walls inside the leaf creating
tension, and adhesion pulls water towards the sides of the xylem, counteracting gravity
(Keller, 2010). Therefore, evaporation of water from leaves, driven by the plant’s
utilization of solar energy, drives the uptake and distribution of water throughout the
plant. Transpiration accounts for approximately 95 to 98% of water absorbed by the
plant’s subsequent loss to the atmosphere; the remaining water is used in cell
expansion, cell metabolism, and phloem transport. Plant growth must compete with
transpiration for water. Growing cells must maintain lower water potentials during the
day than at night in order to sustain the necessary water concentrations within their cells
for expansion (Keller, 2010). Fluctuating xylem water potentials cause the growth rates
of all tissues to change rapidly, with growth being extremely sensitive to water stress.
Growing tissues must maintain turgor pressures high enough to enlarge cells, but low
enough to form the required growth-sustaining water potential gradients. Decreasing
xylem water potential in a stem or leaf can cause a reversal of the gradient in a few cells
21
next to the xylem, immediately blocking water flow to the surrounding cells and inhibiting
growth (Boyer and Silk, 2004). Thus, water stress causes a decline in plant growth and
in turn vigor (the vine’s growth rate over time). Re-establishment of growth occurs when
the water potential gradient is resumed. Rapid transpiration is responsible for the
increase in the rate of absorption and mobilization of nutrients from the soil to the plant.
According to Hsiao (1973), plants have four degrees of water stress (Hsiao,
1973). Mild water stress causes the lowering of the plant water potential by 0.5 to 0.7
MPa or relative water content by 8 to 10% below corresponding values in well-watered
plants under mild evaporative demand. Moderate water stress lowers the water
potential of the plant by more than 0.7MPa, but less than 1.2 to 1.5 MPa, or decreases
the relative water content by 10-20%. Severe water stress causes the lowering of the
plant water potential by more than 1.5 MPa or by more than 20% of its relative water
content. Desiccation occurs when the plant loses more than 50% of tissue water (Hsiao,
1973).
Water is driven through the plant from the soil to the atmosphere by a difference
in water potentials between the atmosphere and the soil. As water transpires from the
leaf, the leaf water potential is reduced, becoming more negative. If water is available in
the soil, the water will flow into the leaf to refill the loss with only a small reduction in leaf
water potential (Blum, 2008). As the soil water potential decreases, the leaf water
potential is further decreased in order to create the necessary gradient in potentials to
pull water up from the drying soil to the leaf. As mentioned above, turgor maintenance
and transpiration are thus critical controls for the plant when under water stress, causing
a reduction in stomatal conductance. The reduction in stomatal conductance also

22
reduces CO2 fixation and photosynthetic assimilation, and increases leaf temperature.
Turgor can be sustained through solute accumulation, or osmotic adjustment. Under
severe water deficits, the older leaves are sacrificed first so as to reduce the plant’s leaf
area and water requirement (Blum, 2008).
Plant water deficits occur when the rate of transpiration exceeds plant water
uptake, and is a component of a number of different stresses, such as drought, salinity,
and chilling stresses (Bray, 1997). Resistances to water deficit occur when a plant
withstands an imposed stress by either tolerance or an avoidance mechanism. The
avoidance mechanisms of water deficit can occur during the plants life cycle on the
whole-plant level and on the cellular level.
Cavitation
Cavitation of xylem vessels, a common occurrence in V. vinifera caused by a
break in the water column allowing air bubbles to form within the xylem vessel, plays an
important role in the inhibition of shoot growth at moderate water deficits (Schultz and
Matthews, 1988). To maintain their hydraulic capacity plants must replace embolized
vessels, maintain a highly redundant transport system, or repair embolized conduits
(Holbrook and Zwieniecki, 1999). On the leaf level, the arrangement of the major veins
within a leaf play an essential role in the distribution of water across the lamina and
could buffer the impacts of damage and/or cavitations by providing pathways for around
damaged or blocked veins (Sack and Holbrook, 2006). In addition, root xylem are

23
commonly more vulnerable to cavitations than stem xylem as shown by less-negative
xylem pressures required to cause 100% cavitation (Hacke et al., 2001).
In grapevines, cavitation repair requires both an increase in water potential and
a temporary suspension of flow through the xylem (Holbrook et al., 2001). To repair a
cavitation, the plant must increase the xylem pressure to near atmospheric pressure or
above before gasses within the xylem can dissolve back into the water solution (Sperry
et al., 2002). Martin J. Canny showed that cavitations were being refilled with water
during vigorous transpiration, where the petiole acts as a water pump on a 24-hour
cycle. Water is squeezing out of the parenchyma cells into the vessels during the day to
refill them, and refilling the parenchyma cells at night from the vessels below, for
tomorrow's repairs (Canny, 1988). Later, it was shown that repair did not occur under
light conditions, even in a fully hydrated grapevine, but started immediately after dark
due to a decrease in water loss by transpiration and an increase of water potential from
the roots (Holbrook et al., 2001). The effect of cavitation formation and refilling may
predispose the vessel to subsequent cavitations later on. Even if stress and cavitations
had no effect on pit membrane function, the refilling of xylem may leave small micro-
bubbles behind that could initiate cavitations prematurely during subsequent stress
(Hacke et al., 2001).
The Hydraulic Limitation Hypothesis
The hydraulic limitation hypothesis developed for forest trees states that the older
and larger a tree, the earlier the leaves’ stomata will close during the day in order to

24
sustain the regulation of leaf water status, or leaf water potential (Ryan and Yoder,
1997). The hydraulic limitation hypothesis proposed that taller trees had greater
stomatal closure as a result of three associated factors: increased resistance with
increasing hydraulic path length, increased gravitational potential opposing the ascent
of water in taller trees, and the maintenance of a species-specific minimum water
potential within the leaves (Ryan et al., 2006). Increased path length in roots, stems and
branches decreases the leaf-specific hydraulic conductance as trees grow in height. In
addition, if stomata close in order to regulate leaf water status to a constant mid-day
minimum as trees grow taller, tall trees must close their stomata at a lower leaf to air
saturation deficit than shorter trees. Closure of stomata restricts the diffusion of carbon
dioxide into the leaf, thus reducing net photosynthesis, tree growth, and the ultimate
height of the tree (Ryan et al., 2006). The hydraulic limitation hypothesis is thought to
be necessary because the hydraulic resistance to water flow from the roots to the
leaves increases with tree age and size. Most of this hydraulic resistance is imposed by
the plant’s hydraulic architecture, which is mainly determined by the arrangement,
shape, and size of xylem conduits, as well as the number and shape of bends in the
flow pathway and its total length (Keller and Mills, 2005).
Xylem conductivity is determined by the structure and size of the vessels and by
their efficiency, which may be modified by the presence of cavitations. Water stress
induces a decrease in the average diameter of grapevine vessels and a decrease in the
xylem hydraulic conductivity. Water-stressed plants were shown to have a lower shoot
growth and total transectional xylem area, both of which can affect hydraulic
conductivity. In addition, vessel size modification regulated water flow throughout the

25
plant at relatively low water stress levels, while at lower water potentials the regulation
of water flow was taken over by stomatal control (Lovisolo and Shubert, 1998).
It was concluded by Lovisolo and Shubert (1988) that grapevine shoots respond
to water stress by two parallel mechanisms, modification of xylem vessel size, which is
induced under moderate stress, and vessel cavitation, which can occur under more
severe water stress. In grapevines, which tend to have larger vessels, the reduction of
vessel size may be an adaptation to a persistent situation of moderate water stress,
while cavitations may be induced by a rapid and severe water stress. The susceptibility
of xylem vessels to cavitation is linked to the size and structure of their pit pores, and in
general smaller vessels, probably since they have less developed pores, are less
susceptible (Lovisolo and Shubert, 1988).
Hypothesis and Objectives
One of the main goals in viticulture is to find the ideal balance between grapevine
shoot and fruit growth to ensure sufficient photosynthetic leaf area to ripen fruit and to
replenish reserves in the permanent structure of the vine. The ―big vine effect‖ is
commonly used in Australia as an effective means to control shoot vigor and maintain
vine balance by light pruning of widely spaced vines in order to devigor the vine (Smart
et al., 1990). However, South African experiments suggest that this effect maybe
dependent on the available rooting volume (Hunter and Volschenk, 2001). While the
root to shoot ratio apparently plays a crucial role in controlling vine vigor, there have
been little research conducted to explain why the vine vigor decreases as the shoot

26
number increases. As most of the vegetative growth occurs before fruit set, i.e. before
the berries become strong sinks, it seems that competition between grapevine vigor and
ripening cannot be the reason for the reduction of vigor (Keller et al., 2004). In addition,
the larger leaf area of lightly pruned vines may intercept more sunlight early in the
season, but have higher rates of transpiration (Lasko and Dunst, 1999) increasing their
vulnerability to water stress (Keller et al., 2004; Keller and Mills, 2005).
The major aim of this hypothesis was to test whether the shoot number to vigor
relationship in grapevines is caused by a hydraulic limitation, and to determine if the
vulnerability of vines to water stress increases with increasing shoot number. Practical
recommendations for planting density, pruning, and irrigation management were
developed and will be made available to growers.
27
CHAPTER TWO
Materials and Methods
Plant Material
The study was conducted on field grown grapevines (V. vinifera L. cv. Merlot)
planted at the Washington State University Irrigated Agriculture Research and
Extension Center (WSU-IAREC) Roza Unit, Prosser, WA (46°17’49‖ N; 119°44’07‖ W;
elevation 364 m). The Roza Unit is a 129 ha research site, located 5 kilometers north of
WSU-IAREC. The vines were planted on their own roots in 1999 in north-south
orientated rows on a ~2% south facing slope and spaced at 1.8 m within rows and 2.7m
between rows.
The vines were trained to a bilateral cordon (90cm above the ground) with a
loose vertical shoot positioning and spur-pruned, allowing for flexibility in terms of bud
numbers. During each of the 2 years of this study, 100 vines were pruned in winter to
between 50 and 150 buds in 2009 and 10 and 200 buds per vine in 2010 and clusters
were thinned after bloom to 1 cluster per shoot to decrease variability between vine
fruitfulness for vines with varying shoot numbers. In 2009, the number of shoots per
vine ranged from 50 to 100 shoots; in 2010 the number of shoots per vine range was
enlarged to create more extremes in vine size to 10 to 124. 40 vines were randomly
selected from the 100 vines and were used for gas exchange and water potential
measurements. The 40 vines were separated in to four groups based on shoot number.
In 2009 Group A had 45 to 50 shoots per vine with a mean of 48 shoots, Group B had
52 to 60 shoots per vine with a mean of 56 shoots, Group C had 60 to 66 shoots per
28
vine with a mean of 63 shoots, and Group D had 70 to 105 shoots per vine with a mean
of 80 shoots. In 2010 Group A had 11 to 32 shoots with a mean of 23 shoots, Group B
had 33 to 51shoots per vine with a mean of 42 shoots, Group C had 53 to 72 shoots per
vine with a mean of 62 shoots, and Group D had 73 to124 shoots per vine with a mean
of 95 shoots.
Regulated Deficit Irrigation
Regulated deficit irrigation (RDI) is a common practice used in Eastern
Washington to control grapevine vigor, because 75% of the yearly rainfall occurs
between October and April. RDI has been shown to be a viable practice in vineyards
for controlling excess vigor, reducing pest populations and disease pressure, improving
wine quality, reducing shoot growth and leaf area, and optimizing the balance between
canopy and fruit (the source/sink ratio) (Tarara et al., 2005). In areas with dry soils,
such as Eastern Washington, the sensitivity of the apical meristem may be exploited as
a method to control vigor by using appropriate deficit irrigation strategies (Keller, 2010).
Regulated deficit irrigation is defined as a controlled soil water deficit applied at specific
periods of a crop season, saving water and maintaining yield (Shaozhong et al., 2000).
The absence of visual symptoms of severe water stress, such as premature leaf
senesce, suggests that the targeted soil water levels are just sufficient to reduce canopy
growth and photosynthesis (Tarara et al., 2005).
The vineyard was drip-irrigated using regulated deficit irrigation after bloom. The
grapevines experienced repeated dry down and re-watering cycles starting at veraison
in 2009 and after bloom in 2010 until harvest in order to detect the effect of shoot
29
number on the vine’s response to water deficit. Irrigation water was applied at the first
sign of leaf wilting following each dry-down cycle at a rate of 2L water per hour. Soil
moisture was monitored using 16 neutron probes, with PVC access tubes installed
equidistant between drip emitters to a depth of 100cm in 2010. Frequent measurements
of vines with widely varying shoot numbers allowed for the determination of the potential
threshold shoot number and quantitative relationships between carbon assimilation,
hydraulic resistance, shoot number, and vigor.
De-fruiting Experiment
During the 2010 growing season, fruit from ten vines representing the largest and
smallest vines sizes were de-fruited after berry set as a control to discover if the strong
sink strength of ripening grape berries after fruit set is the variable which controls shoot
vigor. After fruit set the berries and seeds become dominant photosynthates sinks out
competing young unfolding leaves (Wardlow, 1990). One shoot from each vine was
tagged as a representative for measuring shoot growth rate (vigor), and to estimate total
leaf area. A comparison between the de-fruited vines and those with one cluster per
shoot will be conducted.
Viticultural Measurements
Shoot number per vine was counted at the beginning of each growing season,
and a representative shoot 30 cm from the trunk was tagged and measured during

30
veraison (August 13, 2009) and at harvest (October 8, 2009) during the 2009 growing
season; and prior to bloom (June 1, 2010), pre-veraison (August 12, 2010), veraison
(September 19, 2010), and at harvest (October 21, 2010) during the 2010 growing
seasons. In 2009, 20 shoots were selected and measured, while in 2010, the sample
size was increased to 100 shoots in hopes of obtaining more definitive results. Shoot
measurements, including shoot length and the number of nodes, laterals, leaves, and
leaf are were used to estimate shoot growth rates (vigor). Shoot length was measured
from the base of the shoot to the shoot tip. Total vine leaf area was estimated based on
the total leaf area of each shoot, measured using a LI-3100C Area Meter (LI-COR,
Lincoln, NE) multiplied by the number of shoots per vine. As this method is destructive,
sample shoots were collected and the number of leaves and leaf area were recorded
and used to estimate leaf area of shoots prior to harvest. At harvest time, each tagged
shoot was removed and the leaf area recorded. Trunk diameters were measured with a
ProMax Electronic Caliper (Fred V. Fowler Co., Inc., Newton, Massachusetts) after
harvest in 2009 and at bud break and harvest in 2010 at the drip irrigation tubing level.
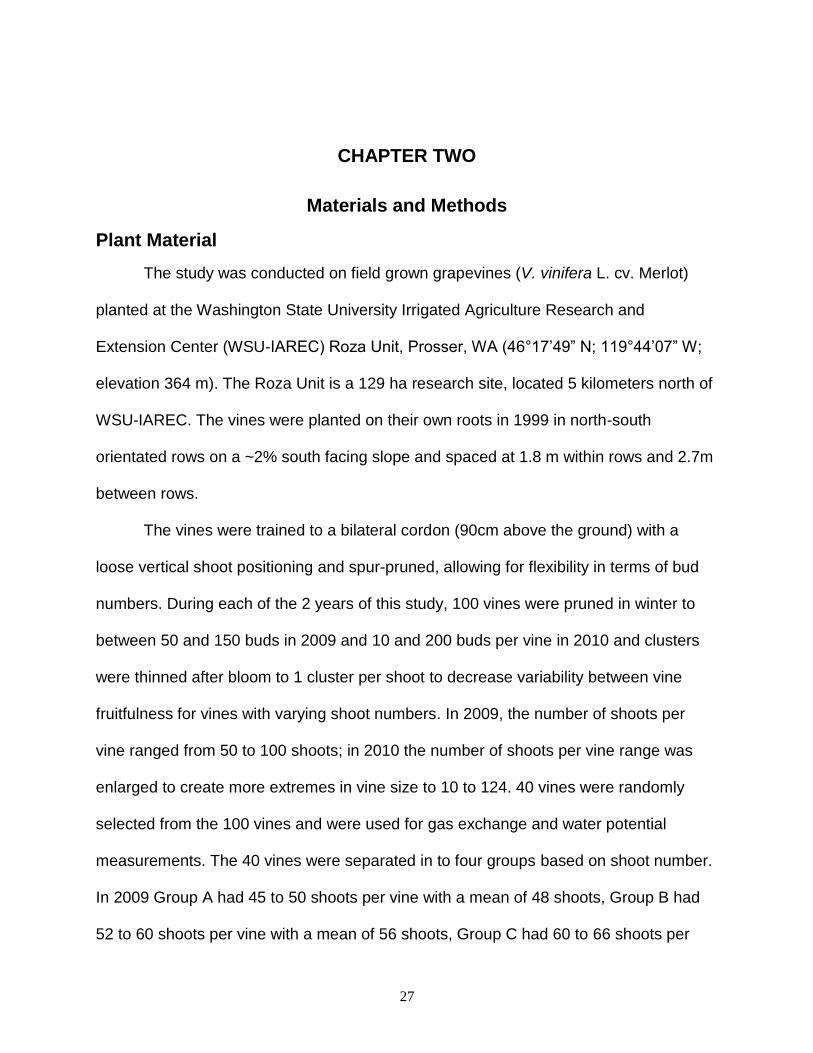
Figure 6: 2010 Canopy Size of Merlot Vine with 30 Shoots. Photos taken on October 13, 2010
from irrigation line (left) and 2.7m away (right) of V. vinifera Merlot.

31
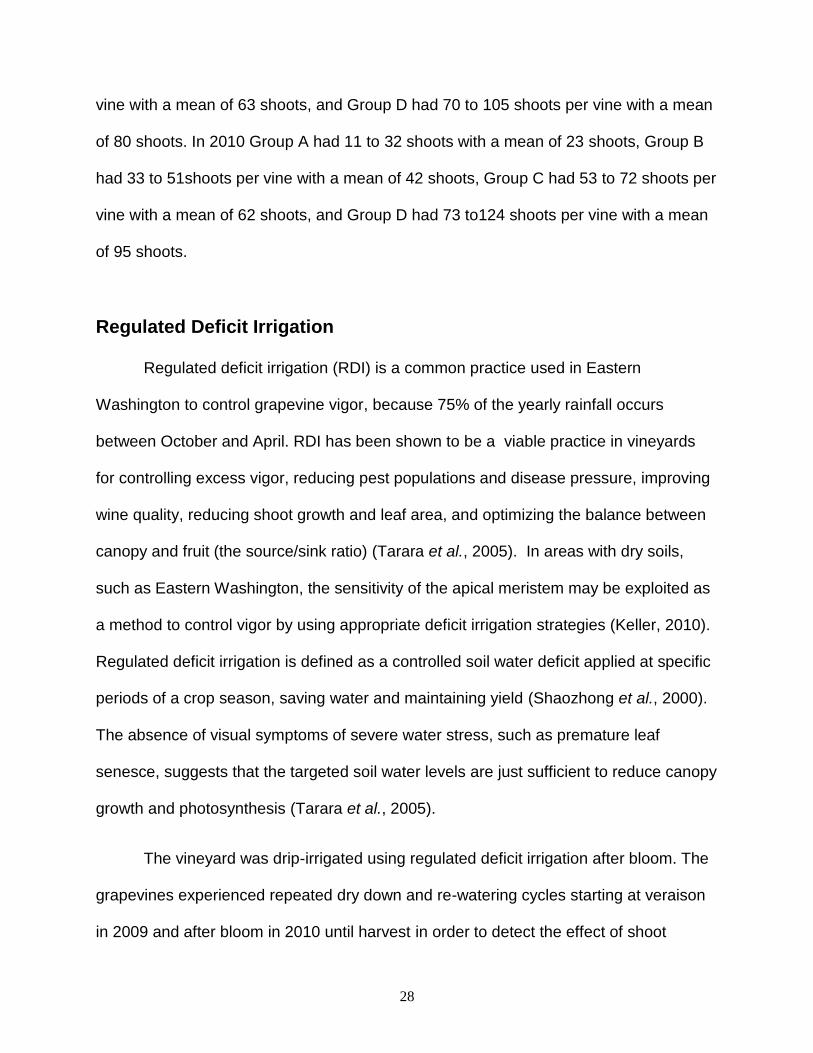
Figure 7: 2010 Canopy Size of a Merlot Vine with 124 shoots. Photos taken on October 13,
2010 from irrigation line (left) and 2.7m away (right).
Yield was determined by measuring the number of clusters at harvest and cluster
weight. 100 berries were collected from each vine to determine mean berry weight, and
to calculate the number of berries per cluster. 20 berries from each sample were then
used for fruit composition measurements. Pruning weights were collected in February of
2009 and 2010.
Gas-Exchange Measurements
Single-leaf measurements were conducted using a portable infrared gas analyzer
(PP Systems Ciras-2 Portable Photosynthesis System, Haverhill, MA) with a PLC6 (U)
Automatic Universal Leaf Cuvette (PP Systems). The CIRAS-2 was used in the field as
a method to measure gas exchange of leaves by enclosing 2.5cm2 of the leaf area in a
cuvette, passing 200mL min-1 of air over the leaf, and measuring the change in
concentration of CO2 and H2O in the air with a reference CO2 set at 375 ppm. Zeroing
and differential balancing between reference CO2and differential CO2 within the
instrument occurred every 30 minutes. Photosynthetic rate (µmol m-2 s-1), transpiration

32
rate (mmol m-2 s-1), and stomatal conductance (mmol m-2 s-1) were measured on 40
preselected vines, 10 from each vine group, from sunrise to sunset.
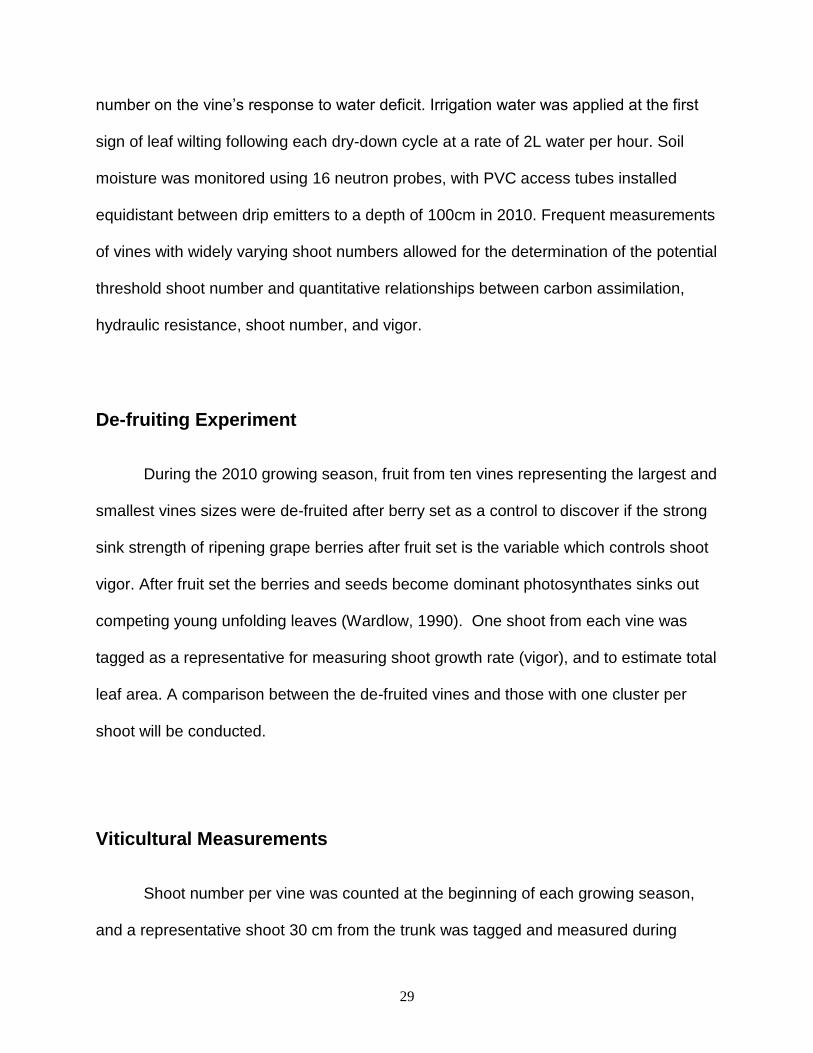
Figure 8: LCpro+ leaf cuvette measuring gas exchange of a mature, fully expanded V. vinifera
Merlot leaf.
Diurnal gas exchange measurements will allow for the determination of the time
of day at which stomata close and gas exchange declines to determine at what time the
vines began to suffer from water stress, and to see if there was a difference between
vines with varying numbers of shoots. Vines were measured every three hours
following sunrise using the same labeled, fully expanded leaf exposed to sunlight, and
located around six to eight leaves from the shoot tip each day as seen in Figure 8.
Diurnal measurements were taken at the beginning, middle and end of each irrigation
cycle during fruit set, pre veraison, veraison, and at harvest.

33
During September of the 2010 growing season, a new photosynthesis system,
LCpro+ (OPTI-SCIENCES; Hudson, NY) was purchased and used for the remainder of
the season. The differential between the CIRAS-2 and the LCpro+ was calculated and
used to compare data by measuring gas exchange rates of 40 leaves using both
machines sequentially and then using the slope of the correlation to calculate the
differential.
Water Potential
Leaf water potential was determined at predawn (Ψleaf and midday (Ψleaf and
Ψstem), using a Model 610 PMS Instrument Pressure chamber (PMS Instrument
Company, Corvallis, OR). Predawn Ψleaf was used as a proxy for Ψsoil as detailed by
Schultz (2003). Predawn Ψleaf was measured two hours before sunrise at bloom and
several times throughout deficit irrigation cycles. A fully expanded leaf, exposed to
direct sunlight from each of the 40 preselected vines was bagged and placed in
pressure chamber. One leaf per vine was placed into a small plastic bag and secured,
in order to cease transpiration. The leaf petiole was then cut with a sharp razor blade
and quickly placed through the lid of the pressure chamber and secured tightly, with the
cut side of the petiole outside and the bagged leaf inside the chamber. The chamber
was then sealed and slowly pressurized with nitrogen gas. Liquid in the leaf blade was
forced out of the cut edge as the positive pressure of the chamber equaled the negative
pressure within the leaf. As soon as moisture formed on the cut surface, the
corresponding pressure was recorded from the chamber gauge as the mid-day Ψleaf in

34
negative (-) MPa. Mid-day Ψstem was measured during the same time period as mid-day
Ψleaf tests, but each leaf was bagged an hour prior to testing in a aluminum foil coated
sealed bag, in order to equalize the leaf’s water potential with that of the stem and stop
transpiration.
In 2009, stem water potential was measured as it has been shown to be a better
indicator of water stress in plants (Choné et al., 2001), while in 2010 leaf water potential
was measured in order to calculate the whole plant hydraulic conductance by the
evaporative flux method as described in the following section.
Hydraulic Resistance
Hydraulic Resistance (rh) was measured by two independent techniques as
described by Tsuda and Tyree (1997): by the evaporative flux method (EF) and the high
pressure flow method (HPFM). The EF and HPFM method were shown to give
comparable results. Measurements of transpiration (E) and Ψleaf and Ψpredawn will be
used to estimate whole-vine hydraulic resistance to the evaporative flux method (rh =
(Ψpredawn – Ψleaf)/(E x Canopy Leaf Area)) where rh is the whole plant hydraulic
resistance. Transpiration values will be collected during gas exchange measurements,
while xylem pressure potentials measured by Ψleaf and Ψpredawn. EF measurements were
calculated on August 4 and October 13, 2010 as they were near the dates of canopy
measurements.

35
The high pressure flow meter method measures individual components of
hydraulic resistance to water flow (rh = rroot + rtrunk + rcordon + rshoot + rleaf) throughout a
grapevine (Dynamax, Houston, TX). The HPFM measurements were made on 20
grapevines during at the time of harvest. The high pressure flow meter was filled with
1.5 gallons (5.7 L) of water; the water was degassed by bubbling helium gas at a rate of
120mL/min for 20 minutes. The high pressure flow meter was used to conduct a quasi-
steady state measurement, as outlined by Tyree et al. (1995).
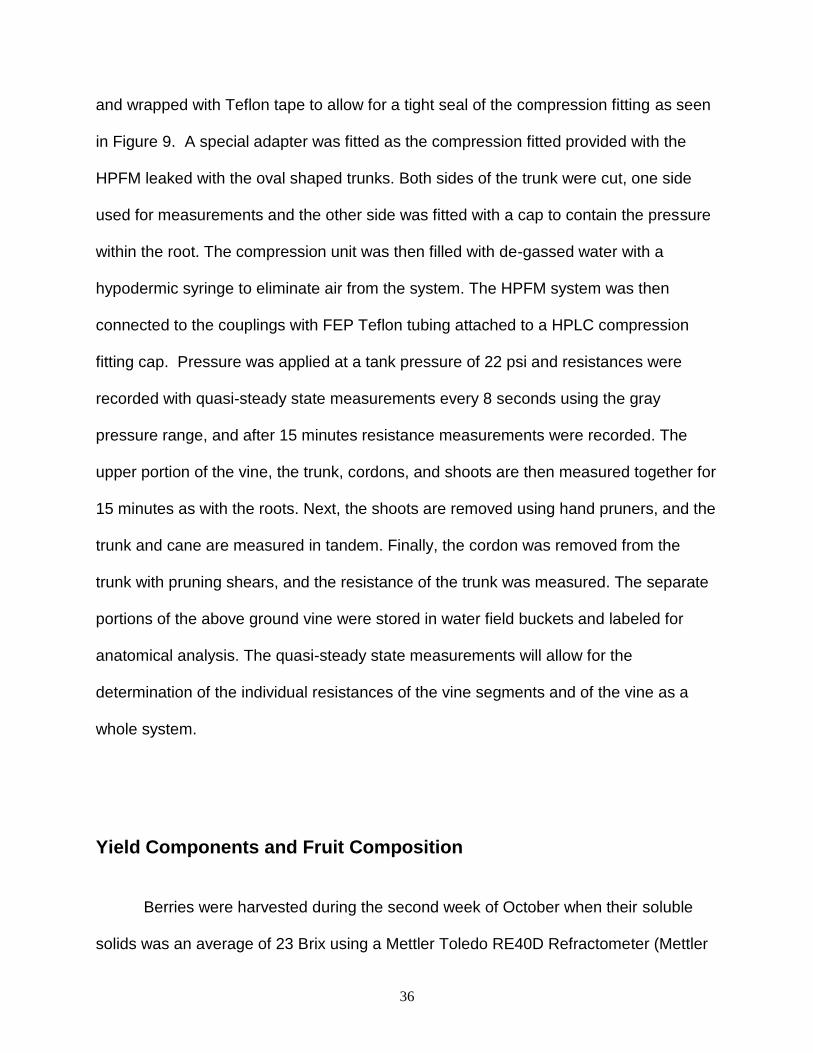
Figure 9: High Pressure Flow Meter Connected to the Roots and the Trunk of V. vinifera Merlot.
The vine was separated into distinct segments, the root, trunk, cordons, and
shoots and each segment measured separately. As each vine had two trunks, the north
facing trunk was first cut using a 16 inch (40.6 cm) curved blade, medium duty, pruning
saw to separate the trunk from the root system at the drip irrigation line level, cut
perpendicular to the stem. The trunk portion was immediately placed in water after
cutting to prevent cavitation formation. Rough bark was removed down to the cambium
36
and wrapped with Teflon tape to allow for a tight seal of the compression fitting as seen
in Figure 9. A special adapter was fitted as the compression fitted provided with the
HPFM leaked with the oval shaped trunks. Both sides of the trunk were cut, one side
used for measurements and the other side was fitted with a cap to contain the pressure
within the root. The compression unit was then filled with de-gassed water with a
hypodermic syringe to eliminate air from the system. The HPFM system was then
connected to the couplings with FEP Teflon tubing attached to a HPLC compression
fitting cap. Pressure was applied at a tank pressure of 22 psi and resistances were
recorded with quasi-steady state measurements every 8 seconds using the gray
pressure range, and after 15 minutes resistance measurements were recorded. The
upper portion of the vine, the trunk, cordons, and shoots are then measured together for
15 minutes as with the roots. Next, the shoots are removed using hand pruners, and the
trunk and cane are measured in tandem. Finally, the cordon was removed from the
trunk with pruning shears, and the resistance of the trunk was measured. The separate
portions of the above ground vine were stored in water field buckets and labeled for
anatomical analysis. The quasi-steady state measurements will allow for the
determination of the individual resistances of the vine segments and of the vine as a
whole system.
Yield Components and Fruit Composition
Berries were harvested during the second week of October when their soluble
solids was an average of 23 Brix using a Mettler Toledo RE40D Refractometer (Mettler

37
Toledo, Columbus, Ohio). 25 berries from each of the 40 grapevines were weighed and
cooled to less than 10°C prior to homogenizing to minimize oxidation. Berries from each
sample were then macerated at high speed (24,000 rpm) for 15 seconds using an IKA
All Basic Blender (IKA, Wilmington, North Carolina) to mix the flesh, skins and seeds
into a homogenous mixture. Homogenate remaining on the shaft of the blender was
scraped with a spatula and placed into the homogenizing vessel. Anthocyanin
concentrations were determined using the Iland method (Iland et al., 2000). Extracting
with Ethanol and HCl and then the absorbance was measured with a Beckman 640
spectrophotometer at 700nm and 520nm. After anthocyanin analysis, the homogenate
was transferred into a centrifuge tube and centrifuged at 3500 rpm for 5 minutes
(Eppendorf Centrifuge 5804R, Eppendorf International, Hamburg, Germany). The
supernatant was then decanted into a marked tube for use in pH and Titratable acidity
(TA) analysis. The TA of each sample was determined using a pH meter and titrating to
pH 8.2 as outlined by Iland et al. (2000) using a Mettler Toledo DL50 Rondolino (Mettler
Toledo, Inc. Columbus, Ohio). The TA analysis method was changed slightly for the
2010 harvest as the berries were smaller in size. 3ml of supernatant was used for
extraction, as opposed to 5ml, and the calculation altered to provide accurate values.
The pH and soluble solid concentration of each sample supernatant was measured
using a Mettler Toledo MP 225 pH Meter and Mettler Toledo RE40D Refractometor
respectively (Mettler Toledo, Inc. Columbus, Ohio).

38
Statistical Analysis
Data were analyzed using the Statistica (version 7.1, StatSoft. Tulsa, Oklahoma). All
results were subjected to analysis of variance using the Duncan’s multiple range tests to
find differences between vine groups, and correlations were used to study the effect of
the number shoots per vine on vigor, gas exchange, water potential, hydraulic
resistance, and yield and berry composition.

39
CHAPTER THREE
RESULTS
De-fruiting Experiment
Among the 10 de-fruited vines, as shown in Figure 10, there was no statistical
difference between vines with 13 and 115 shoots per vine, as measured from August
12th and September 15th, 2010.
0 20 40 60 80 100 120
Shoots per vine
-0.02
0.00
0.02
0.04
0.06
0.08
0.10
0.12
0.14
0.16
0.18
0.20
Vig
or
(cm
/day)
r = 0.2026, p = 0.5746
Figure 10: 2010 De-fruiting experiments. Vigor (measured from August 12th
to September 15th
2010) in relation to the number of shoots per vine using V. vinifera Merlot. Fruit was removed
from vines on August 10th and measured on August 12th and September 15th. Vigor was
measured as the difference in shoot length in relation to the difference in time.

40
0 20 40 60 80 100 120
Shoots per vine
600
800
1000
1200
1400
1600
1800
2000
2200
Harv
est le
af are
a (
cm
2)
r = 0.0990, p = 0.7855
Figure 11: 2010 Total vine leaf area at harvest time (October 21, 2010) in relation to the number
of shoots per vine using V. vinifera Merlot.
As with vine vigor, the total leaf area per vine at harvest time in relation to the
number of shoots per vine shows that there are no statically significant differences
between vines with 13 to 115 shoots per vine as seen in Figure 11.
Viticultural Measurements
As seen in Figure 12, the mean daily temperatures from April 1st to October 31st
during the 2009 and 2010 growing seasons showed a similar temperature fluctuation
pattern, with both years having their warmest temperatures around the onset of
veraison in August. 2009 was a slightly warmer year, having a warm spell in May,
before returning to normal seasonal temperatures, and then having longer peak high
temperatures in August. In addition on October 11th, 2009 after harvest, there was an
early freeze leading to early leaf defoliation.
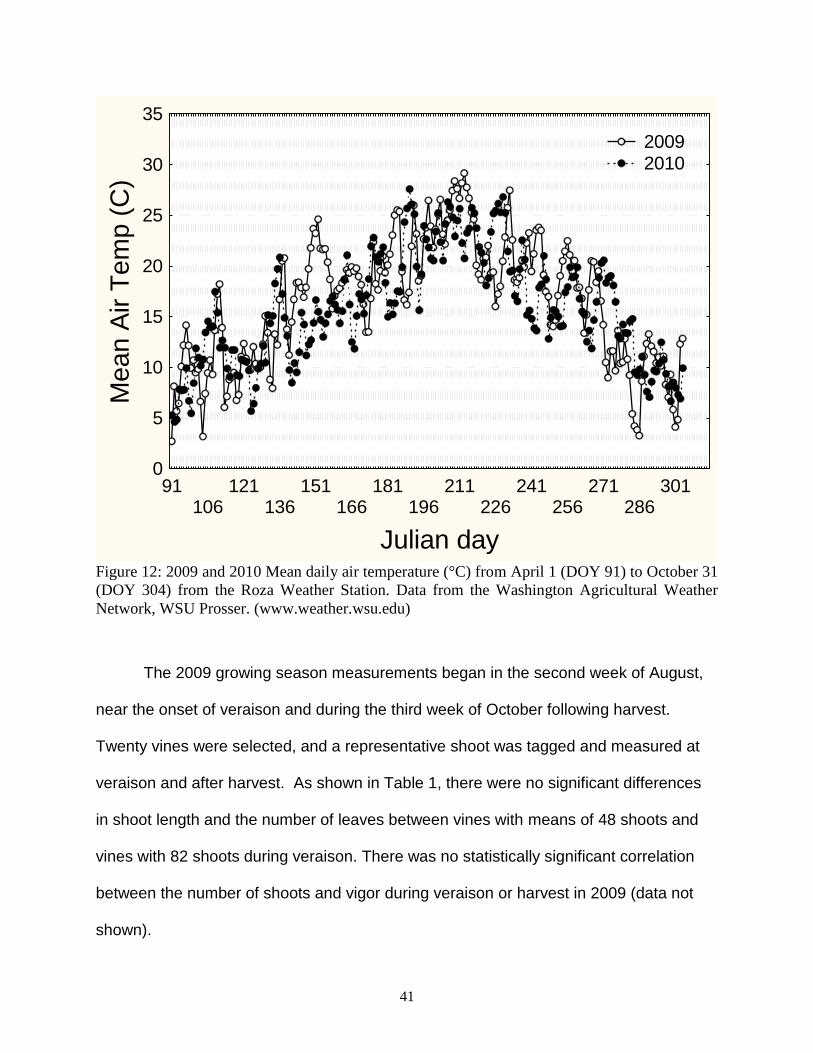
41
91106
121136
151166
181196
211226
241256
271286
301
Julian day
0
5
10
15
20
25
30
35M
ean A
ir T
em
p (
C)
2009 2010
Figure 12: 2009 and 2010 Mean daily air temperature (°C) from April 1 (DOY 91) to October 31
(DOY 304) from the Roza Weather Station. Data from the Washington Agricultural Weather
Network, WSU Prosser. (www.weather.wsu.edu)
The 2009 growing season measurements began in the second week of August,
near the onset of veraison and during the third week of October following harvest.
Twenty vines were selected, and a representative shoot was tagged and measured at
veraison and after harvest. As shown in Table 1, there were no significant differences
in shoot length and the number of leaves between vines with means of 48 shoots and
vines with 82 shoots during veraison. There was no statistically significant correlation
between the number of shoots and vigor during veraison or harvest in 2009 (data not
shown).

42
Table 1: 2009 Shoot growth of V. vinifera Merlot. Vines were separated into groups based on
the number of shoots per vine. Values are means based on designated vine groups, “a” and “b”
signify statistical differences between means based on Duncan’s multiple range tests.
Vine
group Shoots per vine
Shoot length (cm)
Nodes Mean lateral length (cm)
Laterals Lateral leaves
Total leaves
Veraison
A 48 80.3 14 8.7 3 9 25
B 56 92.3 17 5.3 5 7 22
C 63 79.3 16 5.4 7 9 27
D 82 86.3 19 3.6 4 6 24
p-value 0.486 0.492 0.536 0.773 0.843 0.921
Harvest
A 48 101.3ab 20 12.2 8 13 33
B 56 107.1a 19 6.1 5 7 26
C 63 86.8b 18 8.9 5 7 25
D 82 107.7a 20 9.3 8 11 31
p-value 0.084 0.299 0.320 0.556 0.554 0.477
During the 2010 growing season, vines were deficit irrigated following fruit set. At
the time of bloom, the vines had statistically similar shoot lengths, and numbers of
nodes, laterals, lateral leaves and total leaves per shoot. At veraison, as shown in Table
2, vines with in group A with a mean shoot number of 23 were more vigorous than those
with more shoots, group D being the least vigorous based on mean shoot lengths and
the number of nodes, laterals, and leaves. There was little growth change between
veraison and harvest.
Table 2: 2010 Shoot growth of V. vinifera. Vines were separated into groups based on the
number of shoots per vine. Shoot length and was measured from the base of the shoot to the tip.
Values are means based on designated vine groups. “a” and “b” signify statistical differences
between means based on Duncan’s multiple range tests
Vine
group Shoots per
vine Shoot length
(cm) Nodes Laterals
Lateral leaves
Total leaves
Bloom
A 23 23.9 9 1 1 10
B 42 26.3 9 2 2 11
C 62 21.9 9 1 1 10
D 95 24.1 10 1 1 11
p-value 0.504 0.160 0.630 0.630 0.521
Veraison A 23 99.1
a 20a 9
a 20
a 40a
B 42 86.7ab 18
ab 7ab
10ab 29
ab
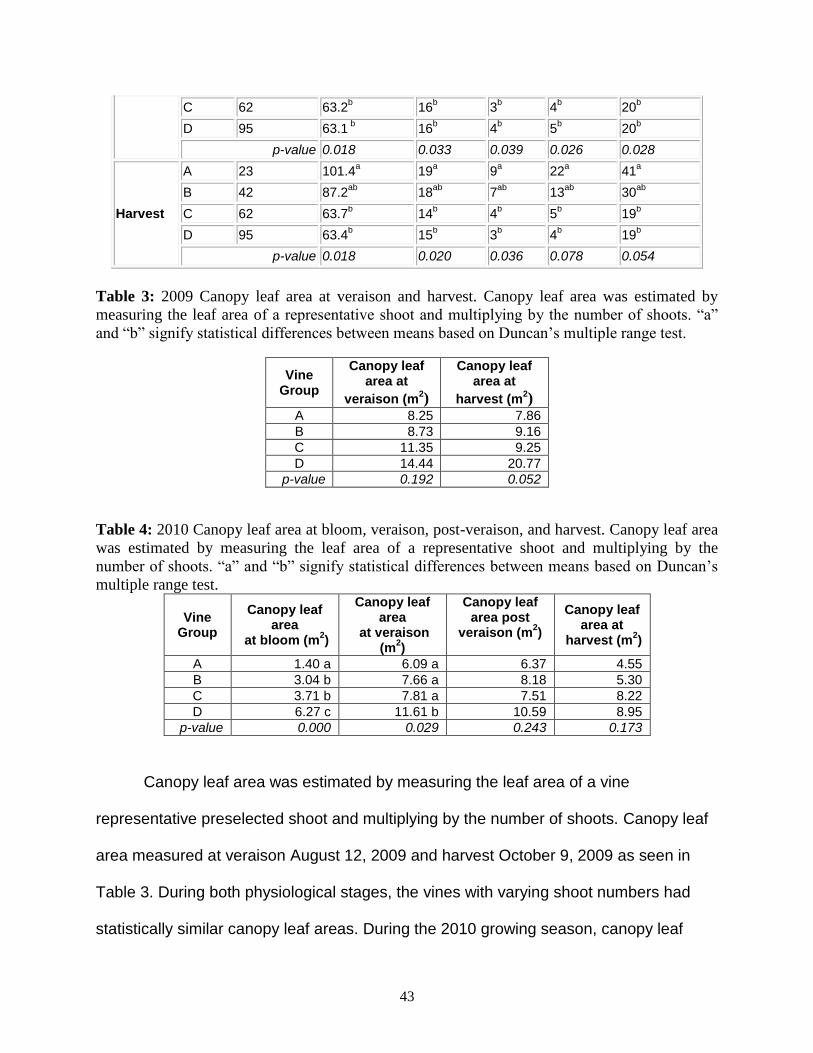
43
C 62 63.2b 16
b 3b 4
b 20b
D 95 63.1 b 16
b 4b 5
b 20b
p-value 0.018 0.033 0.039 0.026 0.028
Harvest
A 23 101.4a 19
a 9a 22
a 41a
B 42 87.2ab 18
ab 7ab 13
ab 30ab
C 62 63.7b 14
b 4b 5
b 19b
D 95 63.4b 15
b 3b 4
b 19b
p-value 0.018 0.020 0.036 0.078 0.054
Table 3: 2009 Canopy leaf area at veraison and harvest. Canopy leaf area was estimated by
measuring the leaf area of a representative shoot and multiplying by the number of shoots. “a”
and “b” signify statistical differences between means based on Duncan’s multiple range test.
Vine Group
Canopy leaf area at
veraison (m2)
Canopy leaf area at
harvest (m2)
A 8.25 7.86 B 8.73 9.16 C 11.35 9.25 D 14.44 20.77
p-value 0.192 0.052
Table 4: 2010 Canopy leaf area at bloom, veraison, post-veraison, and harvest. Canopy leaf area
was estimated by measuring the leaf area of a representative shoot and multiplying by the
number of shoots. “a” and “b” signify statistical differences between means based on Duncan’s
multiple range test.
Vine Group
Canopy leaf area
at bloom (m2)
Canopy leaf area
at veraison (m
2)
Canopy leaf area post
veraison (m2)
Canopy leaf area at
harvest (m2)
A 1.40 a 6.09 a 6.37 4.55 B 3.04 b 7.66 a 8.18 5.30 C 3.71 b 7.81 a 7.51 8.22 D 6.27 c 11.61 b 10.59 8.95
p-value 0.000 0.029 0.243 0.173
Canopy leaf area was estimated by measuring the leaf area of a vine
representative preselected shoot and multiplying by the number of shoots. Canopy leaf
area measured at veraison August 12, 2009 and harvest October 9, 2009 as seen in
Table 3. During both physiological stages, the vines with varying shoot numbers had
statistically similar canopy leaf areas. During the 2010 growing season, canopy leaf

44
area at bloom (June 1, 2010) showed that vines with more shoots had a larger leaf area
than vines with fewer shoots as seen in Table 4. At veraison, measured on August 1,
2010, vines with more shoot still had a larger leaf area than those with fewer shoots,
while the other three vine groups had similar canopy leaf areas. Post veraison
(September 15, 2010) and harvest time (October 21, 2009) canopy leaf areas were
statistically similar.
Table 5: 2009 Viticultural Measurements of V. vinifera Merlot. Vines were separated into
groups based on the number of shoots per vine and values are means based on designated vine
groups. “a” and “b” signify statistical differences between means based on Duncan’s multiple
range test.
Vine Group
Number of canes at pruning
Mean cane wt
(g)
Trunk diameter (cm)
A 25.3a 6.01 2.20
B 30.1ab 5.83 2.46
C 32.2ab 7.35 2.52
D 33.8b 5.71 2.41
p-value 0.020 0.680 0.807
Vines were pruned in February 2010 and the number of canes and the weight of
the prunings for each vine were measured. Table 5 shows a significant difference in the
number of canes per vine, where there was an increase in the number of canes as the
number of shoots per vine increased. Canes were classified as shoots having a
diameter greater than 7mm (the mean diameter of a number 2 pencil) as not all shoots
grew to be large enough to count as canes there are fewer canes per vine than shoots
during both years. There were no significant differences due to vine size (number of
shoots) on the mean trunk diameter, as each vine had 2 trunks and the mean cane

45
weight for each vine as they were statistically the same based on Duncan’s Multiple
Range Test.
Table 6: 2010 Viticultural Measurements of V. vinifera Merlot. Vines were separated into
groups based on the number of shoots per vine and values are means based on designated vine
groups. “a” and “b” signify statistical differences between means based on Duncan’s multiple
range test.
Vine Group
Number of canes
at pruning
Mean cane wt
(g)
Trunk Diameter
(cm)
A 24 21 26
B 26 18 26
C 16 13 25
D 18 15 26
p-value 0.127 0.921 0.993
As seen in Table 6, there was no statistical difference based on designated vine
group on the number of canes and mean cane weight when pruned on February 29,
2011. In addition, there was no difference between trunk diameters of vines. Canopy
leaf area at bloom June 1, 2010 showed that vines with more shoots had a larger leaf
area than vines with fewer shoots. At veraison, measured on August 1, 2010, vines
with more shoots still had a larger leaf area then those with fewer shoots, while the
other 3 vine groups had similar canopy leaf areas. Veraison and harvest time canopy
leaf areas were statistically similar.

46
0 20 40 60 80 100 120 140
Shoots per vine
0.0
0.2
0.4
0.6
0.8
1.0
1.2
1.4
1.6
Vig
or:
blo
om
to
ve
rais
on
(cm
/da
y)
r = -0.4836, p = 0.0018
Figure 13: 2010 Vigor in relation to the number of shoots per vine of V. vinifera Merlot. Vigor
was calculated by dividing the difference in shoot length by the difference in time (days)
between bloom (June 1, 2010) and veraison (August 12, 2010).
0 20 40 60 80 100 120 140
Number of shoots
0.0
0.2
0.4
0.6
0.8
1.0
1.2
1.4
1.6
Vig
or:
vera
ison to h
arv
est
(cm
/day)
r = -0.5209, p = 0.0011 Figure 14: 2010 Vigor (veraison to harvest) in relation to the number of shoots per vine of V.
vinifera Merlot. Vigor was calculated by dividing the difference in shoot length by the difference
in time (days) between veraison (August 12, 2010) and harvest (October 15 2010).
Vigor was calculated by dividing the difference in shoot length by the difference
in time between bloom (June 1, 2010) and veraison (August 12, 2010) during the 2010

47
growing season. Figure 13 shows that as the number of shoots per vine increases, the
level of grapevine vigor decreases. The same pattern was seen in Figure 14, where
vigor was highest in vines with fewer shoots from veraison (August 12, 2010) to harvest
(October 15, 2010).
Gas Exchange
During the 2009 growing season, gas exchange was measured over the course
of multiple irrigation cycles from August 17th (Day of Year (DOY) 229) until October 6th
(DOY 279), the time of harvest. Figures 15-16 show diurnal stomatal conductance
measurements over the course of an irrigation cycle from August 20th to August 24th, in
which irrigation was applied on the 17th. On August 20, 2009 stomatal conductance
increased with sunlight and warming temperatures until 9am, then stomata begin to
close as the available water declined and temperatures increased. Stomatal
conductance values for August 24th showed that stomatal conductance was highest at
sunrise, but due to water stress conductance values declined towards zero by 3pm with
a slight increase after 4pm as the daily temperature decreased. There was no statistical
difference between vines with varying shoot numbers based on stomatal conductance
for both days.

48
Time of day (hour)
gs (m
mol/m
2/s
)
7 10 13 16 190
50
100
150
200
250
300
350
400
48 Shoots
55 Shoots
62 Shoots
83 Shoots
Figure 15: 2009 Diurnal stomatal conductance (gs). Measurements were taken on August 20,
2009. Measurements were taken every three hours using V. vinifera Merlot. Vines were irrigated
on August 17, 2009(DOY 232). Sunrise was at 5:53am and sunset was at 7:50pm. Values are
means based on designated vine groups.
Time of day (hour)
gs (m
mol/m
2/s
)
7 10 13 16 190
50
100
150
200
250
300
350
400
48 Shoots
55 Shoots
62 Shoots
83 Shoots
Figure 16: 2009 Diurnal stomatal conductance (gs). Measurements were taken on August 24,
2009. Measurements were taken every three hours using V. vinifera Merlot. Vines were irrigated
on August 17, 2009. Sunrise was at 5:59am and sunset was at 7:42pm Values are means based
on designated vine groups.
As shown in Figure 17, after irrigation, gas exchange peaks to optimal levels and
as the soil slowly dried gas exchange declined as the vine closed its stomata and
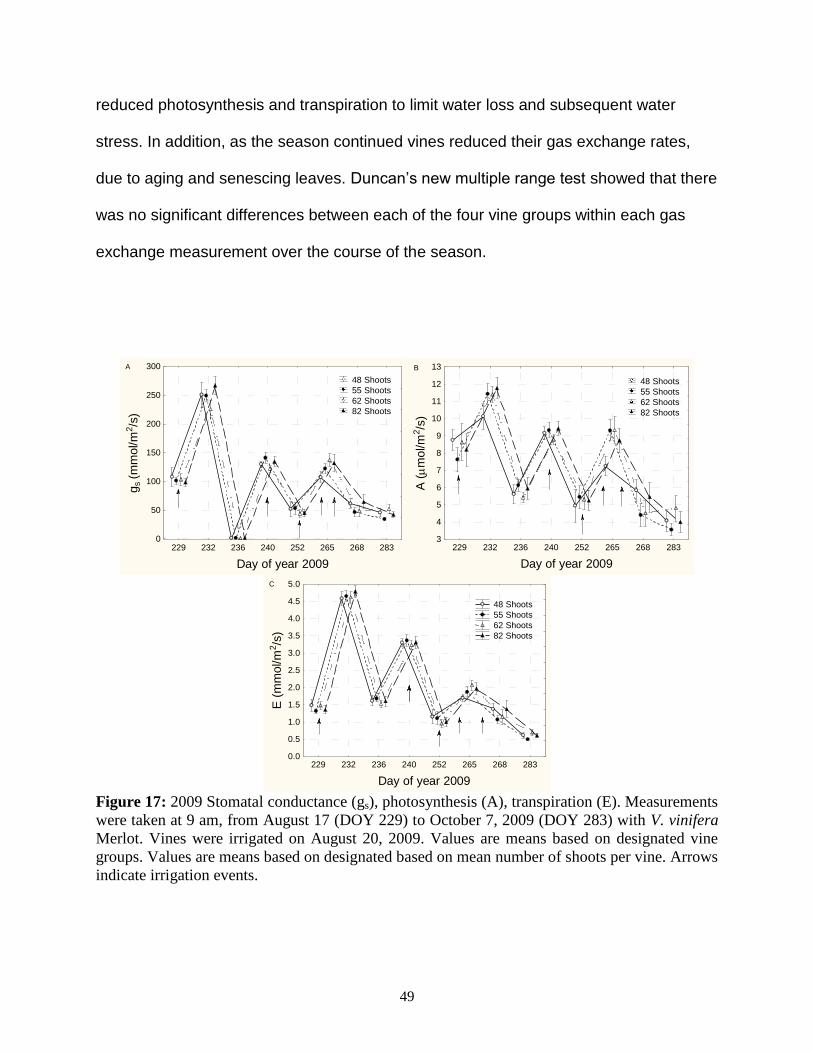
49
reduced photosynthesis and transpiration to limit water loss and subsequent water
stress. In addition, as the season continued vines reduced their gas exchange rates,
due to aging and senescing leaves. Duncan’s new multiple range test showed that there
was no significant differences between each of the four vine groups within each gas
exchange measurement over the course of the season.
229 232 236 240 252 265 268 283
Day of year 2009
0
50
100
150
200
250
300
gs (m
mo
l/m
2/s
)
A
48 Shoots
55 Shoots
62 Shoots
82 Shoots
229 232 236 240 252 265 268 283
Day of year 2009
3
4
5
6
7
8
9
10
11
12
13
A (
mol/m
2/s
)
B
48 Shoots
55 Shoots
62 Shoots
82 Shoots
229 232 236 240 252 265 268 283
Day of year 2009
0.0
0.5
1.0
1.5
2.0
2.5
3.0
3.5
4.0
4.5
5.0
E (
mm
ol/m
2/s
)
C
48 Shoots
55 Shoots
62 Shoots
82 Shoots
Figure 17: 2009 Stomatal conductance (gs), photosynthesis (A), transpiration (E). Measurements
were taken at 9 am, from August 17 (DOY 229) to October 7, 2009 (DOY 283) with V. vinifera
Merlot. Vines were irrigated on August 20, 2009. Values are means based on designated vine
groups. Values are means based on designated based on mean number of shoots per vine. Arrows
indicate irrigation events.

50
During the 2009 growing season, a correlation between photosynthesis and
stomatal conductance measured the relationship between these two physiological
parameters, showing a positive correlation. Figure 18 shows that stomatal conductance
and photosynthetic rate are closely related at 9am.
0 50 100 150 200 250 300 350
gs (mol/m2/s)
0
2
4
6
8
10
12
14
16
A (
mol/m
2/s
)
gs:A: r = 0.8616, p = 0.0000
Figure 18: 2009 Photosynthesis (A) in relation to stomatal conductance (gs). Measurements
taken at 9am using V. vinifera Merlot. Curve calculated using distance weighted least squares.
Diurnal gas exchange was measured over the course of the 2010 growing
season as seen in Figures 19-30. Figure 19 shows stomatal conductance at the
beginning of an irrigation and dry-down cycle, around fruit set. As in 2009, stomata are
shown to slowly begin opening after sunrise until 10am, in which they then begin to
close as the day progresses. Vines with a mean of 23 shoots per vine had a greater
stomatal conductance over the course of the day followed by vines with 42 shoots, 95
shoots and 62 shoots respectively. As seen in Figure 20, transpiration measurements
slowly increase after sunrise and reached peak levels around 10am. They remained
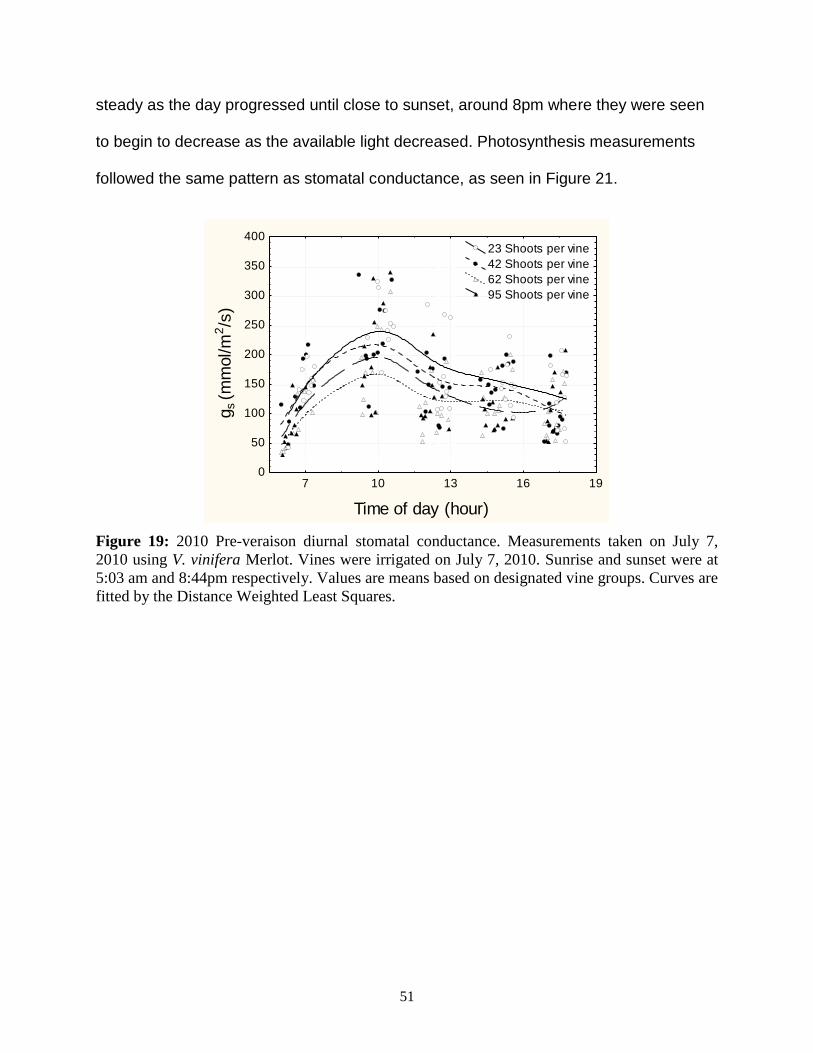
51
steady as the day progressed until close to sunset, around 8pm where they were seen
to begin to decrease as the available light decreased. Photosynthesis measurements
followed the same pattern as stomatal conductance, as seen in Figure 21.
Time of day (hour)
gs (m
mol/m
2/s
)
7 10 13 16 190
50
100
150
200
250
300
350
40023 Shoots per vine
42 Shoots per vine
62 Shoots per vine
95 Shoots per vine
Figure 19: 2010 Pre-veraison diurnal stomatal conductance. Measurements taken on July 7,
2010 using V. vinifera Merlot. Vines were irrigated on July 7, 2010. Sunrise and sunset were at
5:03 am and 8:44pm respectively. Values are means based on designated vine groups. Curves are
fitted by the Distance Weighted Least Squares.

52
Time of day (hour)
E (
mm
ol/m
2/s
)
7 10 13 16 190
1
2
3
4
5
6
7
8
23 Shoots
42 Shoots
62 Shoots
95 Shoots
Figure 20: 2010 Pre-veraison diurnal transpiration (E). Measurements were taken on July 7,
2010 using V. vinifera Merlot Vines were irrigated on July 7, 2010. Sunrise and sunset were at
5:03 am and 8:44pm respectively Values are means based on designated vine groups. Curves are
fitted by the Distance Weighted Least Squares. Vines with a mean of 23 shoots per vine
significantly higher transpiration values at hour 13 than those of the other groups (P-value:
0.050).
Time of day (hour)
A (
mol/m
2/s
)
7 10 13 16 190
2
4
6
8
10
12
14
16
18
20 23 Shoots
42 Shoots
62 Shoots
95 Shoots
Figure 21: 2010 Pre-veraison diurnal photosynthesis (A). Measurements were taken on July 7,
2010 using V. vinifera Merlot. Vines were irrigated on July 7, 2010. Sunrise and sunset were at
5:03 am and 8:44pm respectively Values are means based on designated vine groups. Curves are
fitted by the Distance Weighted Least Squares.

53
On August 3, 2010, (Figures 22-24) at the end of dry-down cycle stomatal
conductance is at its highest at 7am, as also seen in figure 19, directly after sunrise and
then is shown to collectively decline for the remainder of the day as the plant begins to
suffer from water stress. Gas exchange values were seen to increase near sunset as
the daily temperature declined. Transpiration and photosynthesis followed the same
trend as stomatal conductance.
Time of day (hour)
gs (m
mol/m
2/s
)
7 10 13 15 180
50
100
150
200
250
300
350
400
23 Shoots per vine42 Shoots per vine62 Shoots per vine95 Shoots per vine
Figure 22: 2010 Pre-veraison diurnal stomatal conductance (gs). Measurements were taken on
August 3, 2010 using V. vinifera Merlot. Vines were irrigated on July 7, 2010. Sunrise and
sunset were at 5:31 am and 8:17pm respectively. Values are means based on designated vine
groups. Curves are fitted by the Distance Weighted Least Squares.

54
Time of day (hour)
E (
mm
ol/m
2/s
)
7 10 13 16 200
1
2
3
4
5
6
7
8
23 Shoots 42 Shoots 62 Shoots 95 Shoots
Figure 23: 2010 Pre-veraison diurnal transpiration (E). Measurements were taken on August 3,
2010 using V. vinifera Merlot. Vines were irrigated on July 7, 2010. Sunrise and sunset were at
5:31 am and 8:17pm respectively. Values are means based on designated vine groups. Curves are
fitted by the Distance Weighted Least Squares.
Time of day (hour)
A (
mol/m
2/s
)
7 10 13 16 20-2
0
2
4
6
8
10
12
14
16
18
20
23 Shoots 42 Shoots 62 Shoots 95 Shoots
Figure 24: 2010 Pre-veraison diurnal photosynthesis (A). Measurements were taken on August
3, 2010 using V. vinifera Merlot. Negative photosynthesis values indicate respiration. Vines were
irrigated on July 7, 2010. Sunrise and sunset were at 5:31 am and 8:17pm respectively. Values
are means based on designated vine groups. Curves are fitted by the Distance Weighted Least
Squares. Vines with a mean of 62 shoots per vine had significantly lower photosynthesis values
than those of other groups (P-value: 0.025).

55
Figures 25-30 depict post veraison gas exchange measurements. The vines
were irrigated on October 6, 2010 and show a similar pattern with Figure 19 (July 7,
2010). The vine group curves are closer together as the vine is beginning to harden off
and the leaves are beginning to age. Transpiration and photosynthesis (Figures 26 and
27) values show a slow increase after sunrise and peak around 10 am. Vines with an
mean of 95 shoots had slightly lower peak photosynthesis values than vines with fewer
shoots per vine.
Time of day (hour)
gs (m
mol/m
2/s
)
7 10 13 150
50
100
150
200
250
300
350
400
23 Shoots per vine42 Shoots per vine62 Shoots per vine95 Shoots per vine
Figure 25: 2010 Post veraison diurnal stomatal conductance (gs). Measurements were taken on
October 6, 2010 using V. vinifera Merlot Vines were irrigated on October 6, 2010. Sunrise and
sunset were at 6:54am and 6:19pm respectively. Values are means based on designated vine
groups. Curves are fitted by the Distance Weighted Least Squares.

56
Time of day (hour)
E (
mm
ol/m
2/s
)
7 10 13 160
1
2
3
4
5
6
7
8
23 Shoots 42 Shoots 62 Shoots 95 Shoots
Figure 26: 2010 Post-veraison diurnal transpiration (E). Measurements were taken on October 6,
2010 using V. vinifera Merlot. Vines were irrigated on October 6, 2010. Sunrise and sunset were
at 6:54am and 6:19pm respectively. Values are means based on designated vine groups. Curves
are fitted by the Distance Weighted Least Squares.
Time of day (hour)
A (
mol/m
2/s
)
7 10 13 160
2
4
6
8
10
12
14
16
18
20
23 Shoots 42 Shoots 62 Shoots 95 Shoots
Figure 27: 2010 Post-veraison diurnal photosynthesis (A). Measurements were taken on October
6, 2010 using V. vinifera Merlot. Vines were irrigated on October 6, 2010. Sunrise and sunset
were at 6:54am and 6:19pm respectively. Values are means based on designated vine groups.
Curves are fitted by the Distance Weighted Least Squares.
October 13, 2010, Figures 28-20, near harvest and towards the end of a dry-
down, there is no difference in the gas exchange between vine groups. Due to frequent
rains, the vines were only slightly water stressed. Stomatal conductance and
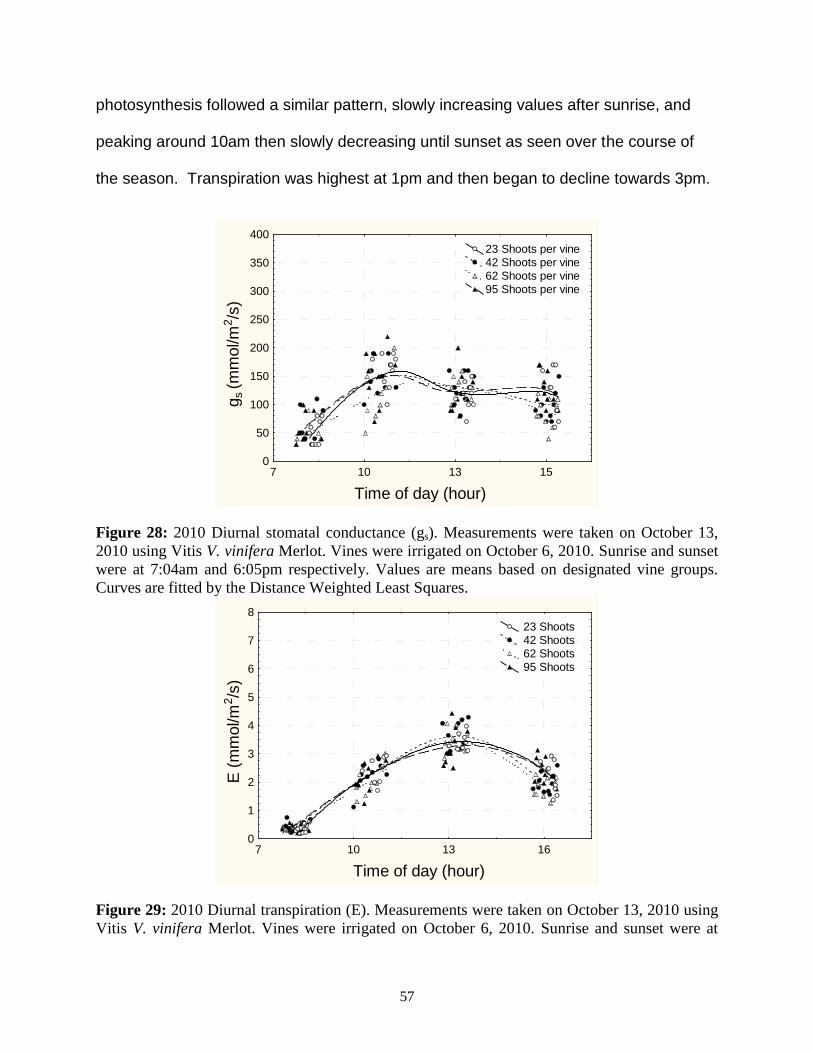
57
photosynthesis followed a similar pattern, slowly increasing values after sunrise, and
peaking around 10am then slowly decreasing until sunset as seen over the course of
the season. Transpiration was highest at 1pm and then began to decline towards 3pm.
Time of day (hour)
gs (m
mol/m
2/s
)
7 10 13 150
50
100
150
200
250
300
350
400
23 Shoots per vine42 Shoots per vine62 Shoots per vine95 Shoots per vine
Figure 28: 2010 Diurnal stomatal conductance (gs). Measurements were taken on October 13,
2010 using Vitis V. vinifera Merlot. Vines were irrigated on October 6, 2010. Sunrise and sunset
were at 7:04am and 6:05pm respectively. Values are means based on designated vine groups.
Curves are fitted by the Distance Weighted Least Squares.
Time of day (hour)
E (
mm
ol/m
2/s
)
7 10 13 160
1
2
3
4
5
6
7
8
23 Shoots 42 Shoots 62 Shoots 95 Shoots
Figure 29: 2010 Diurnal transpiration (E). Measurements were taken on October 13, 2010 using
Vitis V. vinifera Merlot. Vines were irrigated on October 6, 2010. Sunrise and sunset were at

58
7:04am and 6:05pm respectively. Values are means based on designated vine groups. Curves are
fitted by the Distance Weighted Least Squares.
Time of day (hour)
A (
mol/m
2/s
)
7 10 13 160
2
4
6
8
10
12
14
16
18
20
23 Shoots 42 Shoots 62 Shoots 95 Shoots
Figure 30: 2010 Diurnal photosynthesis (A). Measurements were taken on October 13, 2010
using Vitis V. vinifera Merlot. Vines were irrigated on October 6, 2010. Sunrise and sunset were
at 7:04am and 6:05pm respectively. Values are means based on designated vine groups. Curves
are fitted by the Distance Weighted Least Squares.
Water Potential
Midday stem was measured through out the 2009 season as an indicator of plant
water stress. Midday stem of each vine quickly responded to irrigation applied the night
prior to measurement, as seen on August 30, 2009 (day of year 240), September 11,
2009 (DOY 252), and September 18, 2009 (DOY 259) as seen in Figure 31. As with gas
exchange, midday stem declines with available soil moisture with prolonged deficit
irrigation.

59
233 240 243 244 245 246 247 249 251 252 253 254 258 259 261
Day of year 2009
-2.0
-1.8
-1.6
-1.4
-1.2
-1.0
-0.8
-0.6
S
tem
(M
Pa
)
48 Shoots 55 Shoots 62 Shoots 82 Shoots
Figure 31: 2009 Midday stem water potential (stem) over the course of the season using V.
vinifera Merlot. Arrows indicate irrigation events. Values are means based on designated vine
size groups.
Midday stem water potential is positively correlated with both stomatal
conductance and photosynthesis (as seen in Figure 32 A and B) taken at 9am. As water
potential increases toward zero, stomatal conductance and photosynthesis rate
increase. Stomatal conductance has a steeper slope, and a greater rate of change than
photosynthesis in relation to water potential.
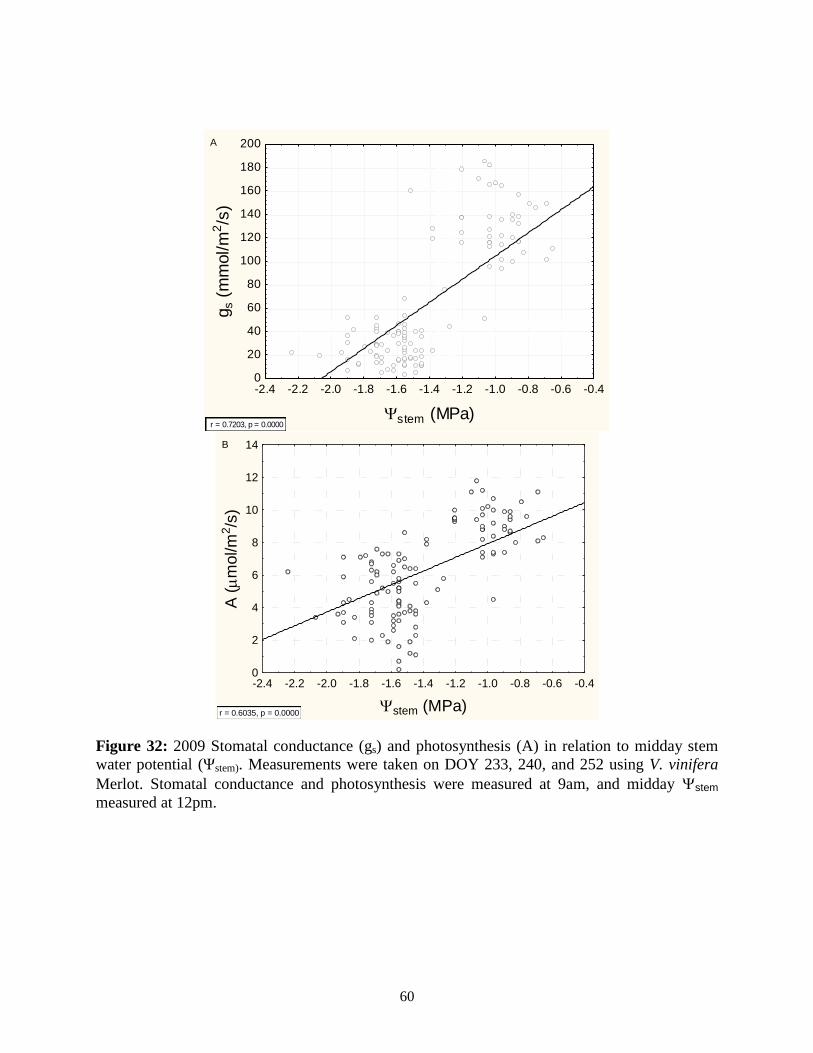
60
-2.4 -2.2 -2.0 -1.8 -1.6 -1.4 -1.2 -1.0 -0.8 -0.6 -0.4
stem (MPa)
0
20
40
60
80
100
120
140
160
180
200
gs (
mm
ol/m
2/s
)
r = 0.7203, p = 0.0000
A
-2.4 -2.2 -2.0 -1.8 -1.6 -1.4 -1.2 -1.0 -0.8 -0.6 -0.4
stem (MPa)
0
2
4
6
8
10
12
14
A (
mol/m
2/s
)
r = 0.6035, p = 0.0000
B
Figure 32: 2009 Stomatal conductance (gs) and photosynthesis (A) in relation to midday stem
water potential (Ψstem). Measurements were taken on DOY 233, 240, and 252 using V. vinifera
Merlot. Stomatal conductance and photosynthesis were measured at 9am, and midday stem
measured at 12pm.

61
-1.2 -1.1 -1.0 -0.9 -0.8 -0.7 -0.6
leaf (MPa)
0
20
40
60
80
100
120
140
160
180
200
220
gs (
mm
ol/m
2/s
)
r = 0.4055, p = 0.00001
A
-1.2 -1.1 -1.0 -0.9 -0.8 -0.7 -0.6
leaf (MPa)
0
2
4
6
8
10
12
14
A (
mol/m
2/s
)
r = 0.4120, p = 0.00000
B
Figure 33: 2010 Stomatal conductance (gs) and photosynthesis (A) in relation to midday leaf
water potential (Ψleaf). Measurements were taken on DOY 196, 201, and 215 using V. vinifera
Merlot. Stomatal conductance and photosynthesis were measured at 9am, and midday leaf
measured at 12pm.
Figure 34, depicts a positive relationship between soil moisture to the depth of
30cm (where most of the roots are concentrated) and predawn water potential, which is
used as a proxy for soil water potential (Downton et al., 1988). Soil moisture and
predawn water potential are significanlty correlated (p-value= 0.0085), as the soil
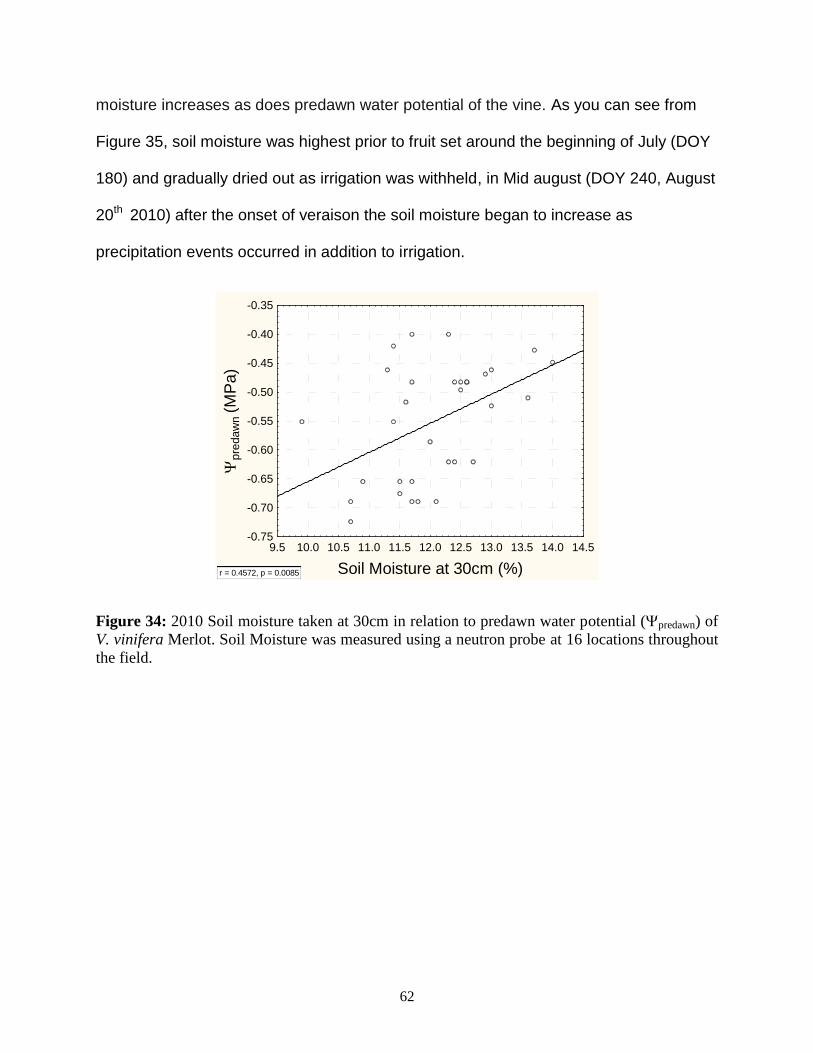
62
moisture increases as does predawn water potential of the vine. As you can see from
Figure 35, soil moisture was highest prior to fruit set around the beginning of July (DOY
180) and gradually dried out as irrigation was withheld, in Mid august (DOY 240, August
20th 2010) after the onset of veraison the soil moisture began to increase as
precipitation events occurred in addition to irrigation.
9.5 10.0 10.5 11.0 11.5 12.0 12.5 13.0 13.5 14.0 14.5
Soil Moisture at 30cm (%)
-0.75
-0.70
-0.65
-0.60
-0.55
-0.50
-0.45
-0.40
-0.35
p
reda
wn
(M
Pa)
r = 0.4572, p = 0.0085
Figure 34: 2010 Soil moisture taken at 30cm in relation to predawn water potential (predawn) of
V. vinifera Merlot. Soil Moisture was measured using a neutron probe at 16 locations throughout
the field.

63
80 100 120 140 160 180 200 220 240 260 280
Day of year
6
8
10
12
14
16
18
20
22
24
26
28
30
32
Soil
mois
ture
(%
)
90 cm 60 cm 30 cm
Figure 35: 2010 Soil moisture measurements taken at 90, 60, and 30 cm from April 10 to
September 30, 2010. Soil Moisture was measured using a neutron probe at 16 locations
throughout the field.
While not being statistically significant, Figure 36 depicts the difference
between predawn (Figure A) and midday leaf (Figure B) water potentials of vines before
and after irrigation in relation to the number of shoots per vine. There appears to be
very little difference between the water potentials of vines with greater than 120 shoots
and those less than 20 shoots per vine when well watered. Upon the onset of water
stress, as seen in A, predawn water potentials were less negative with vines having
fewer shoots.

64
0 20 40 60 80 100 120 140
Shoots per vine
-1.6
-1.4
-1.2
-1.0
-0.8
-0.6
-0.4
-0.2
0.0
P
redaw
n (
MP
a)
r = -0.1954, p = 0.2465
r = -0.5473, p = 0.0005
After Irrigation Before Irrigation
A
0 20 40 60 80 100 120 140
Shoots per vine
-1.9
-1.8
-1.7
-1.6
-1.5
-1.4
-1.3
-1.2
-1.1
-1.0
Leaf (M
Pa)
r = 0.2673, p = 0.1326
r = -0.1883, p = 0.2939
After Irrigation Before Irrigation
B
Figure 36: 2010 Predawn water potential (predawn) (Figure A) and midday leaf water potential
(leaf) (Figure B) measurements in relation to the number of shoots per vine taken after (July 8,
2010) and before (August 3, 2010) an irrigation event using V. vinifera Merlot.
Hydraulic Resistance (EF, HPFM)
Whole vine hydraulic resistance as calculated by the evaporative flux method
(Rplant leaf soil )/(E x Canopy Leaf Area)) was negatively correlated with the

65
number of shoots per vine, as shown in Figure 37and 38, on August 4 and October 13,
2010. As the number of shoots increases the vine the whole plant hydraulic resistance
decreased. Whole plant hydraulic resistance was also negatively correlated with
stomatal conductance and midday leaf water potential, as seen in Figures 39 and 40.
0 20 40 60 80 100 120 140
Shoots per vine
0.0000
0.0002
0.0004
0.0006
0.0008
0.0010
rp
lan
t (M
Pa
/mm
ol/s)
Shoots:EF: r = -0.3418, p = 0.0413
Figure 37: 2010 Whole vine hydraulic resistance (rplant ) in relation to the number of shoots per
vine. Resistance was calculated using the evaporative flux method (Rplant leaf soil/E x
Canopy leaf area). Data was collected on August 4, 2010 using V. vinifera Merlot.

66
0 20 40 60 80 100 120
Shoots per vine
0E-01
2E-06
4E-06
6E-06
8E-06
1E-05
1E-05
1E-05
2E-05
2E-05
2E-05
r pla
nt (M
Pa/m
mol/s)
r = -0.3607, p = 0.0462
Figure 38: 2010 Whole vine hydraulic resistances (rplant) in relation to the number of shoots per
vine. Resistance was calculated using the evaporative flux method (Rplant leaf soil/E x
Canopy leaf area). Data was collected on October 13, 2010 using V. vinifera Merlot.

67
0.0000 0.0001 0.0002 0.0003 0.0004 0.0005
rplant (MPa/mmol/s)
0
20
40
60
80
100
120
gs (m
mol/m
2/s
)
EF:GS: r = -0.4039, p = 0.0178
Figure 39: 2010 Whole vine hydraulic resistance (Rplant) in relation to stomatal conductance (gs).
Resistance was calculated using the evaporative flux method (Rplant leaf soil/E x
Canopy leaf area). Water potential data was taken on October 13th
, 2010 using V. vinifera
Merlot.
0.0000
0.0001
0.0002
0.0003
0.0004
0.0005
0.0006
0.0007
0.0008
0.0009
rplant (MPa/mmol/s)
-1.15
-1.10
-1.05
-1.00
-0.95
-0.90
-0.85
-0.80
le
af (M
Pa)
EF:Leaf (Mpa): r = -0.3291, p = 0.0500
Figure 40: 2010 Whole vine hydraulic resistance (rplant) in relation to midday leaf water potential
(leaf). Resistance calculated using the Evaporative Flux Method (Rplant leaf soil/E).
Water potential data was taken on October 13th
, 2010 using V. vinifera Merlot.

68
20 40 60 80 100 120 140 160 180 200
Shoot length (cm)
0
5000
10000
15000
20000
25000
30000
35000
40000
45000
50000
Re
sis
tan
ce
(M
Pa s
/kg
)
r = -0.9092, p = 0.000007
r = -0.6049, p = 0.0219
Shoots with leaves
Shoots without leaves
A
0 500 1000 1500 2000 2500 3000 3500 4000 4500
Leaf area (cm2)
0
5000
10000
15000
20000
25000
30000
35000
40000
45000
50000
Resis
tance (
MP
a/s
/kg)
r = -0.9171, p = 0.000004
r = -0.5470, p = 0.0430
Shoots with leaves
Shoots without leaves
B
4.0 4.5 5.0 5.5 6.0 6.5 7.0 7.5 8.0 8.5 9.0
Shoot diameter (mm)
0
5000
10000
15000
20000
25000
30000
35000
40000
45000
50000
Resis
tance (
MP
a/s
/kg)
r = -0.8482, p = 0.0001
r = -0.4682, p = 0.0914
Shoots with leaves
Shoots without leaves
C
Figure 41: 2010 High pressure flow meter measurements of V. vinifera Merlot shoots in relation
to the shoot length(A), leaf area (B), and shoot diameter (C). Measured on October 5, 2010.
Figures 41 A, B, and C show the relationship between vigor and resistance of
shoots with and without leaves (leaves removed), as measured using a high pressure
flow meter. Figure 41A shows that as the length of the shoot increases the resistance
to flow decreases dramatically, and that shoots with leaves have a higher resistance
than shoots without leaves. In addition, shoots with greater leaf areas also have
developed lower resistances to water flow as shown in Figure 41B. Figure 41C, depicts
shoots of varying stem diameters, measured at the base of the shoot. As the stem
diameter increases the resistance to water flow decreases. In addition, there was a
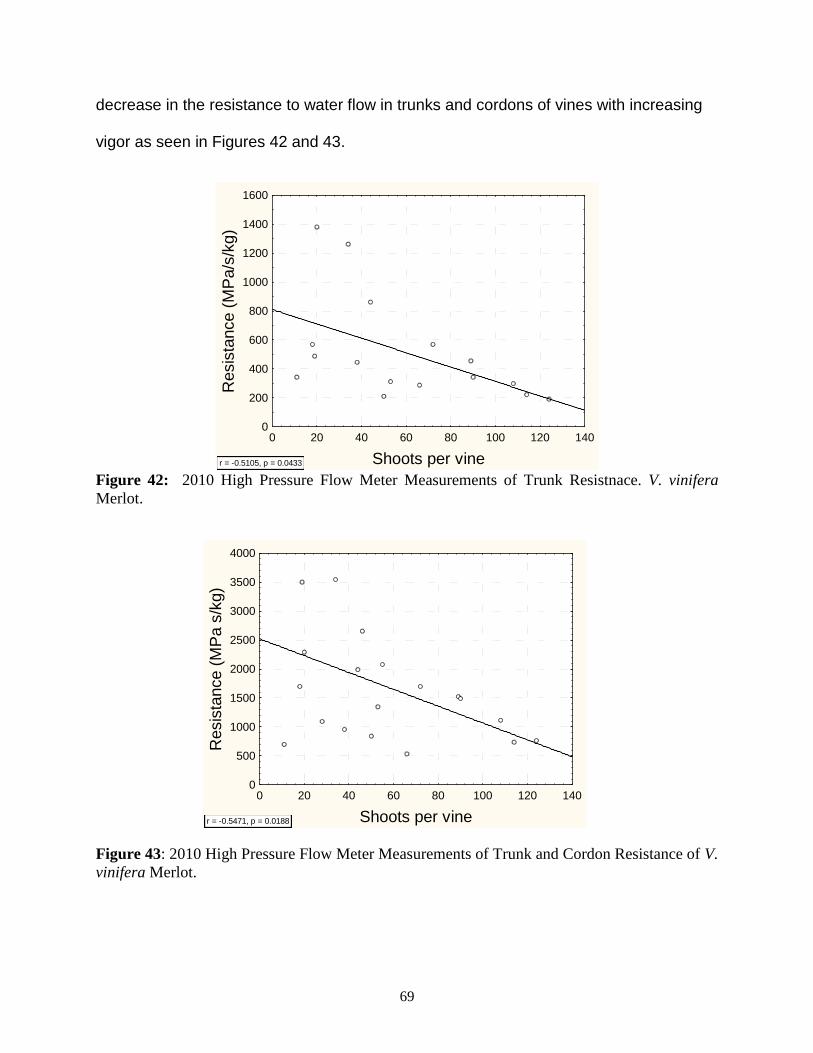
69
decrease in the resistance to water flow in trunks and cordons of vines with increasing
vigor as seen in Figures 42 and 43.
0 20 40 60 80 100 120 140
Shoots per vine
0
200
400
600
800
1000
1200
1400
1600
Resis
tance (
MP
a/s
/kg)
r = -0.5105, p = 0.0433 Figure 42: 2010 High Pressure Flow Meter Measurements of Trunk Resistnace. V. vinifera
Merlot.
0 20 40 60 80 100 120 140
Shoots per vine
0
500
1000
1500
2000
2500
3000
3500
4000
Resis
tance (
MP
a s
/kg)
r = -0.5471, p = 0.0188
Figure 43: 2010 High Pressure Flow Meter Measurements of Trunk and Cordon Resistance of V.
vinifera Merlot.
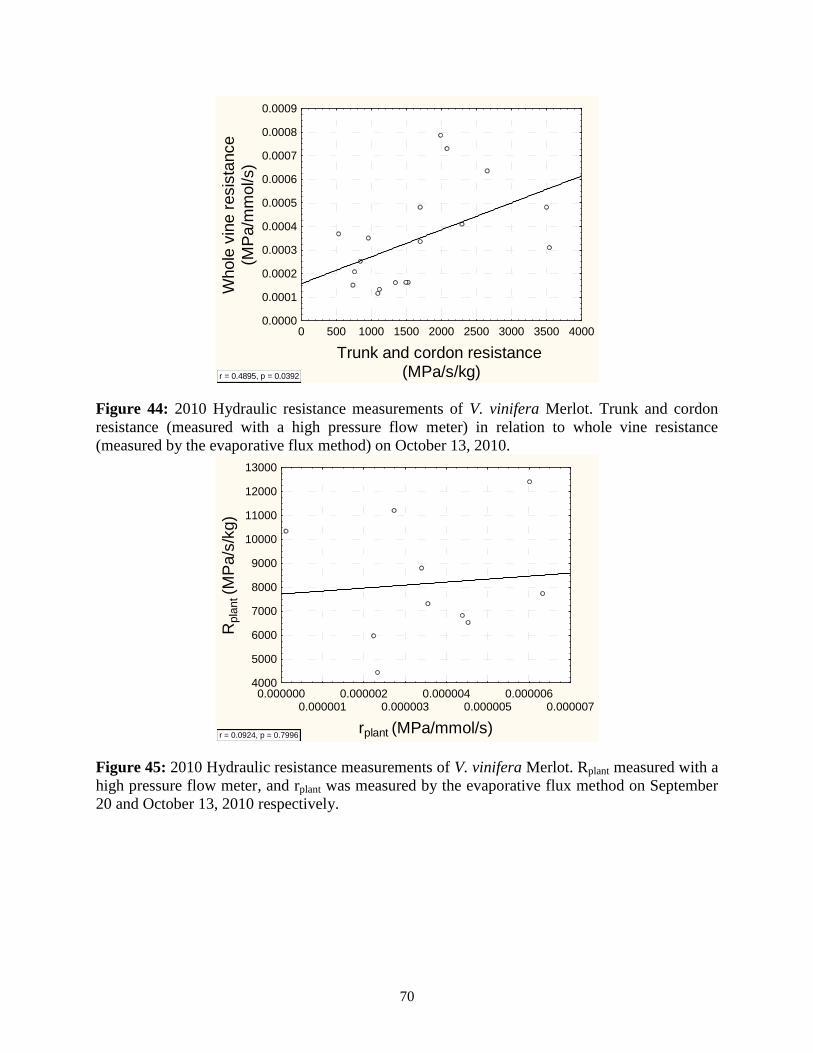
70
0 500 1000 1500 2000 2500 3000 3500 4000
Trunk and cordon resistance (MPa/s/kg)
0.0000
0.0001
0.0002
0.0003
0.0004
0.0005
0.0006
0.0007
0.0008
0.0009
Whole
vin
e r
esis
tance
(MP
a/m
mol/s)
r = 0.4895, p = 0.0392
Figure 44: 2010 Hydraulic resistance measurements of V. vinifera Merlot. Trunk and cordon
resistance (measured with a high pressure flow meter) in relation to whole vine resistance
(measured by the evaporative flux method) on October 13, 2010.
0.0000000.000001
0.0000020.000003
0.0000040.000005
0.0000060.000007
rplant (MPa/mmol/s)
4000
5000
6000
7000
8000
9000
10000
11000
12000
13000
Rpla
nt (M
Pa/s
/kg)
r = 0.0924, p = 0.7996
Figure 45: 2010 Hydraulic resistance measurements of V. vinifera Merlot. Rplant measured with a
high pressure flow meter, and rplant was measured by the evaporative flux method on September
20 and October 13, 2010 respectively.

71
0 500 1000 1500 2000 2500 3000 3500
rabove ground (MPa/s/kg)
1000
2000
3000
4000
5000
6000
7000
8000
r root (M
Pa/s
/kg)
r = 0.4550, p = 0.1864
Figure 46: 2010 Above ground and root hydraulic resistance measurements of V. vinifera
Merlot. Resistance was measured with a high pressure flow meter, on September 20, 2010.
Figure 44 showed that there was a positive relationship between the evaporative
flux method and the high pressure flow meter methods for measuring trunk and cordon
resistance. There were no significant differences between whole vine resistances
measured by the HPFM (rroot+ rabove ground), and above ground and root resistances as
seen in Figures 45 and 46.
Yield Components and Fruit Composition
During the 2009 growing season, 100 berries from each vine were randomly
selected and used for berry analysis. Yield was determined in the filed at time of
harvest; each vine was picked into separate containers and then weighed.

72
Table 7: 2009 and 2010 Harvest yield components of V. vinifera Merlot. Values are means
based on designated vine groups, letters signify statistical differences between means based on
Duncan’s multiple range tests.
Year Vine
group Shoots per
vine Clusters per
vine Mean cluster weight (g)
Yield (t/ha)
Berries per cluster
2009
A 48 59a 101 11.86
a -
B 56 61a 94 11.52
a -
C 63 67a 102 13.35
a -
D 82 84b 108 16.70
b -
p-value 0.001 0.762 0.019 -
2010
A 23 28a 90
a 3.95a 104
a
B 42 50b 82
a 6.57a 96
a
C 61 64b 53
b 6.57a 67
b
D 95 99c 51
b 9.48b 61
b
p-value 0.000 0.010 0.001 0.005
As seen in Table 7, during the 2009 growing season there were no statistically
significant differences between cluster weights due to differences in vigor. The number
of berries per cluster was not measured in 2009. During 2010, the differences between
cluster weights based on differences on vigor due to differing numbers of shoots per
vine were significant, where the vines with fewer shoots had heavier clusters than those
with more shoots per vine. In addition, yield (t/ha) increased as the number of shoots
and clusters per vine increased, while the overall number of berries per cluster
decreased.

73
Table 8: 2009 and 2010 Harvest fruit composition of V. vinifera Merlot. Values are means
based on designated vine group; letters signify statistical differences between means based on
Duncan’s multiple range tests.
Year Vine group Soluble solids (Brix) pH Titratable acidity (g/L) Color (520 nm)
2009
A 22.18 3.65 4.64 0.83
B 23.07 3.56 5.10 0.77
C 23.01 3.59 4.96 0.82
D 22.69 3.55 4.85 0.66
p-value 0.856 0.787 0.532 0.612
2010
A 27.50a 3.49 6.63 0.89
ab
B 25.83b 3.48 6.26 1.07
b
C 25.26b 3.50 5.95 0.93
ab
D 24.67b 3.49 5.93 0.82
a
p-value 0.000 0.997 0.142 0.047
As seen in Table 8 during the 2009 growing season, there was no statistical
difference between fruit composition based on vine size. The percent of soluble solids
from vines within group A was significantly higher than from vine with more shoots per
vine. pH and titratable acidity values were similar for all treatments and while there were
differences between the color concentrations, there was no pattern.
During the 2009 growing season, as seen in Figure 47, there was no significant
difference between the number of shoots per vine and mean cluster weights. The
number of shoots per vine had a statistically significant (p > 0.05) correlation with yield,
showing that as the number of shoots increased the tonnes (t) per hectare (ha) of fruit
increased as seen in Figure 48. The relationship between soluble solids and shoots per
vine was not significant, as was the case for pH, titratable acidity, and juice color.

74
0 20 40 60 80 100 120 140
Number of shoots
0
20
40
60
80
100
120
140
160
180
200
Avera
ge c
luste
r w
eig
ht
(g)
2009: r = 0.0110, p = 0.9465
2010: r = -0.5106, p = 0.0011
2009
2010
Figure 47: 2009 and 2010 Average cluster weight in relation to the number of shoots per vine of
V. vinifera.
0 20 40 60 80 100 120 140
Number of shoots
0
2
4
6
8
10
12
14
16
18
20
22
24
26
Yie
ld (
t/ha)
2009: r = 0.2558, p = 0.1112
2010: r = 0.5695, p = 0.0002
2009
2010
Figure 48: 2009 and 2010 Harvest vine yield (t/ha) in relation to the number of shoots per vine
of V. vinifera Merlot

75
0 20 40 60 80 100 120 140
Number of shoots
16
18
20
22
24
26
28
30
Solu
ble
solid
s (
Bri
x)
2009: r = 0.2255, p = 0.1674
2010: r = -0.5789, p = 0.0001
2009
2010
Figure 49: 2009 and 2010 Harvest soluble solids in relation to the number of shoots per vine of
V. vinifera Merlot.
Within the 2010 growing season, in which deficit irrigation began after berry set,
mean cluster weight decreased with increasing shoot number per vine, while yield
increased with increasing shoot numbers (p< 0.05) as seen in figures 47 and 48.
Soluble solids, as seen in Figure 49, showed to be statistically dependent on the
number of shoots per vine and decreased as the number of shoots per vine increased,
while the number of shoots appeared to have little effect on the pH, TA, and color of the
berry juice (data not shown). At harvest leaf area and yield were positively correlated in
2010.

76
0 20 40 60 80 100 120 140
Shoots per vine
0
10
20
30
40
50
60
70
Yie
ld:P
runin
g w
eig
ht
r = 0.6710, p = 0.00009
Figure 50: 2010 Yield to pruning weight ratio in relation to the number of shoots per Vine.
Yield and pruning weights were measured in grams, using V. vinifera Merlot.
Yield to pruning weight ratios were calculated for the 2010 yield and pruning
data. The yield to pruning ratio increased as the number of shoots increased as see in
Figure 50.
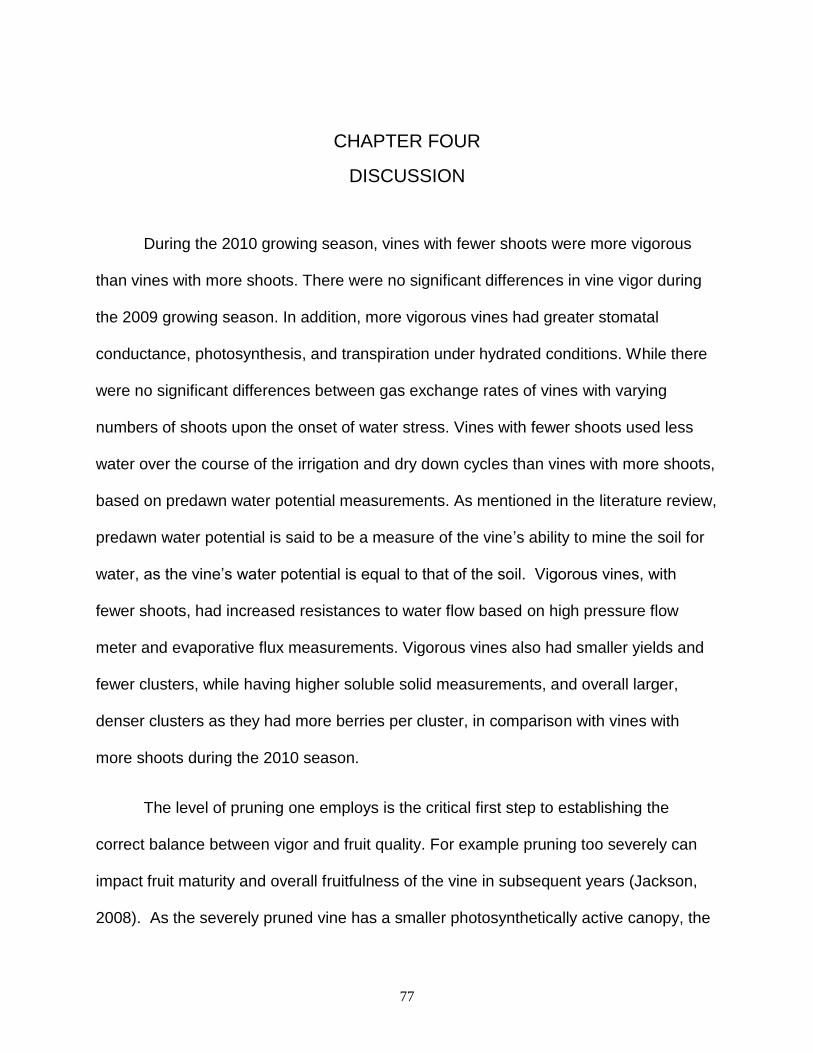
77
CHAPTER FOUR
DISCUSSION
During the 2010 growing season, vines with fewer shoots were more vigorous
than vines with more shoots. There were no significant differences in vine vigor during
the 2009 growing season. In addition, more vigorous vines had greater stomatal
conductance, photosynthesis, and transpiration under hydrated conditions. While there
were no significant differences between gas exchange rates of vines with varying
numbers of shoots upon the onset of water stress. Vines with fewer shoots used less
water over the course of the irrigation and dry down cycles than vines with more shoots,
based on predawn water potential measurements. As mentioned in the literature review,
predawn water potential is said to be a measure of the vine’s ability to mine the soil for
water, as the vine’s water potential is equal to that of the soil. Vigorous vines, with
fewer shoots, had increased resistances to water flow based on high pressure flow
meter and evaporative flux measurements. Vigorous vines also had smaller yields and
fewer clusters, while having higher soluble solid measurements, and overall larger,
denser clusters as they had more berries per cluster, in comparison with vines with
more shoots during the 2010 season.
The level of pruning one employs is the critical first step to establishing the
correct balance between vigor and fruit quality. For example pruning too severely can
impact fruit maturity and overall fruitfulness of the vine in subsequent years (Jackson,
2008). As the severely pruned vine has a smaller photosynthetically active canopy, the

78
vine would have fewer carbohydrate reserves stored within the vine’s trunk and roots.
The carbohydrate reserves provide the necessary carbohydrates for vine growth the
following season before the leaves are photosynthetically active. Excessive shoot
growth due to an abundance of water and fertilizer has also been associated with poor
fruit set and poor fruit bud initiation for the following season (Hamman and Dami, 2000).
Therefore, in order to produce healthy vines and—more importantly for the wine
industry—quality fruit, discovering the ideal degree of pruning each year is necessary.
In arid eastern Washington, vigor is usually controlled by regulated deficit irrigation in
which vine growth is slowed as the apical meristem, the growing tip of the shoot, dies
from water stress; preventing new growth of the primary shoot (Tarara et al., 2005).
Finding the ideal pruning degree in winter and irrigation frequency during the growing
season can help in establishing high quality fruit without the intensive labor needed to
shoot thin or hedge the following spring.
During the 2009 growing season, the grapevines underwent repeated dry
down cycles beginning in August, after the start of veraison until harvest in the second
week of October. Based on shoot measurements, there were no significant differences
between shoot lengths of vines with varying numbers of shoots. In addition there were
no statistical differences between shoot length, the number of nodes and laterals, lateral
length, and the total number of leaves in relation to the number of shoots per vine at
harvest time (ranging from 48 to 110 shoots per vine). Therefore, the onset of regulated
deficit irrigation after veraison had no effect on shoot growth, and there were no
treatment differences based on the number of shoots per vine.
79
This lack of significant difference between treatments may have been due to the
late onset of deficit irrigation or if the range of shoot numbers was too small to show
extremes in vigor differences. During the 2010 growing season, deficit irrigation began
after fruit set and vines were winter pruned to encompass a range of 10 to 124 shoots
per vine. At bloom, vines were statistically similar on the basis of shoot length, and the
number of nodes, laterals, and lateral leaves. The same shoots, measured at veraison,
showed statistical differences between shoot lengths of vines with varying shoot
numbers. In addition, vines with in group A, with a mean of 23 shoots per vine had more
nodes, laterals, lateral leaves, and total leaves than vines with more shoots. As seen in
Table 4, at bloom vines with more shoots had larger leaf areas. Interestingly, the
canopy leaf areas of the vines by harvest time were similar. This was possibly due to
having too much variation to be significant, as the leaf area of each vine was dependent
on the sample shoots selected at the beginning of the season. There was little shoot
growth between veraison and harvest, because water was withheld after fruit set in
order to kill the apical meristems of each shoot. Lateral shoot and leaf growth was
stopped as well at that time, due to water deficits have a stronger effect on lateral
growth than on the primary shoots (Williams and Matthews, 1990).
The differences in shoot growth at veraison, based on differing shoot numbers,
may have been due to the presence of inflorescences and subsequent berry set
providing a sink response limiting vigor of higher cropped vines (those with more
shoots). As all shoots had one cluster, vines with more clusters may have suffered from
water stress earlier than vines with fewer clusters. The clusters may have drawn water
from the shoots, leading to reduced shoot growth therefore having a stronger sink
80
response limiting growth. Another explanation may be that vines with more shoots suffer
from a nutrient deficiency sooner than vines with more shoots early in the season, prior
to bloom, leading to shorter shoots and smaller, lighter clusters.
The lack of statistical difference between the number and mean weight of canes
at the time of pruning in March 2011, may have been due to the fact that while vines
with more shoots had on average fewer canes larger than the diameter of a pencil,
there were more, smaller canes in vines with more shoots causing them to have similar
cane numbers with vines with fewer shoots. As mentioned before, canes were classified
as shoots having a diameter greater than 7 mm (the mean diameter of a number 2
pencil) as not all shoots grew to be large enough to count as canes there are fewer
canes per vine than shoots during both years.
Gas exchange was measured from sunrise to sunset during both growing
seasons to test if differences in vigor of vines with varying shoot numbers were caused
by differences in gas exchange rates measured as stomatal conductance,
photosynthesis, and transpiration. Over the course of the dry-down cycle, gas exchange
peaked three hours after sunrise and then steadily declined as the temperature
increased and water availability decreased. In both growing seasons, there were no
significant differences between gas exchange rates of vines with varying shoot
numbers. Stomatal conductance is said to be more sensitive to changes in water
supply, such as the onset of water stress, than water potential as stomatal mechanisms
are important in avoiding dehydration and in controlling water balance within leaves
(Sivilotti et al., 2005). Sack and Holbrook (2006) report that bundle sheath cells may be
a ―control center‖ for leaf water transport where temperature and light are perceived. In
81
addition to temperature, the amount of humidity around the leaf has a direct effect on
the plant’s ability to transpire and grow. Humidity depends on air temperature, as
increasing air temperature causes an increase in the vapor pressure deficit, causing a
decline in stomatal conductance to control the amount of water lost via transpiration.
Thus, an increase in humidity effectively reduces transpiration, as transpiration is
dependent on the water potential differences between the inside and outside of the leaf
(Keller, 2010). While there was a statistically significant relationship between water
potential and gas exchange, there was very little difference between water potentials of
vines with varying degrees of vigor. In addition, as the percent soil water decreased the
grapevines quickly responded with decreases in leaf and stem water potentials over the
course of the season. Based on water potential and gas exchange data, Merlot is an
anisohydric grape variety, as anisohydric cultivars have decreasing leaf water potentials
with decreasing soil water availability or increasing atmospheric water demand (Lovisolo
et al., 2010; Schultz, 2003). Perhaps this anisohydric nature of Merlot allowed the vines
to perceive the onset of water stress early, causing them to reduce their gas exchange
rates uniformly throughout the field plot as each vine received the same amount of
irrigation. Anisohydric cultivars are said to be ―pessimistic‖, in that upon the onset of
water stress they begin to conserve water by closing their stomata before the severity
increases. Thus, limiting growth as the closure of the stomata results in respiration,
limiting the available photosynthates which would have gone towards shoot and berry
growth.
Another theory as to why there were no apparent statistical differences between
exchange rates and water potentials between vines of varying degrees of vigor may be

82
based on the whole vine’s hydraulic resistance. Plants are able to adjust their water
transport capacity under different water supply conditions based on the whole plant
hydraulic resistance. The whole plant hydraulic resistance is composed of partial
resistances, such as root, trunk and shoot resistances, comprising the plant’s hydraulic
architecture. For example, the grapevine’s trunk has a lower hydraulic resistance than
its shoots, as the trunk must conduct water to every shoot and leaf. In addition,
sustained water stress reduces total plant growth and size by affecting the plant’s
height, biomass, and leaf area, and in turn reducing the plant’s hydraulic resistance
(Maseda and Fernandez, 2006).
Based on the evaporative flux method, whole vine hydraulic resistance to water flow
was greatest in vines with higher vigor and therefore fewer shoots per vine. More
vigorous vines had smaller leaf canopies and longer shoots. Rplant was measured using
the evaporative flux method originally on October 13, 2010; then again on August 4,
2010 to make sure that the pattern of reducing resistance with increasing shoots was
consistent. Interestingly, HPFM data measured on a per shoot basis indicated that as
the length of the shoots and its diameter increased the resistance to water flow
decreased. This decrease in resistance may be due to larger vessel diameters, allowing
for a greater flow of water through the xylem conduits within the shoot as wider pipes
would allow for less resistance. For example, the flow of water through a pipe is
accelerated by the flow of gravity, slowed by the frictional resistance due to the bends
and connections within a system of piping, and the speed of the flow reduced with
decreasing pipe size (Cosgrove, 1906). In addition, the resistance to water flow within
the shoots decreased when leaves were removed, as the length of the pathway was
83
reduced. In agreement with the evaporative flux method data, the HPFM showed that
the trunks and cordons of more vigorous vines with larger leaf areas had a greater
resistance to water flow than less vigorous vines.
The results from both the high pressure flow meter and evaporative flux method
were contrary to what was expected and shown in the literature for other plants. The
hydraulic limitation hypothesis was established for forest trees, such as Ponderosa Pine
(Pinus ponderosa), in that growth was limited by increased resistance with increasing
hydraulic path length, increased gravitational potential opposing the ascent of water,
and maintenance of a minimum water potential within the leaves. Therefore, the older
and larger a tree, the earlier the leaves’ stomata will close during the day in order to
sustain the regulation of leaf water status or leaf water potential (Ryan and Yoder,
1997). As all of the Merlot vines within this experiment were the same age and were
trained similarly prior to 2009, they should have similar hydraulic conductances as the
root trunk and cordon lengths and diameters were similar. In addition, as vines with
fewer shoots had longer shoots, there may have been an increased gravitational
potential opposing the ascent of water increasing the resistance, as expressed in the
results. In addition, at higher resistances air bubbles are more likely to form in the
xylem, further increasing hydraulic tension within the xylem, and associated with
increased hydraulic conductance (Ryan and Yoder, 1997; Blackman et al., 2009).
Perhaps the growth of high vigor vines with fewer, longer shoots was reduced, based on
the hydraulic limitation hypothesis, as they were shown to have higher resistances to
water flow. This hydraulic limitation could prevent the vines from growing beyond what
they are capable of bearing based on the level of water stress and nutrient availability.

84
This may have a relationship with canopy size at the end of the season, where vines
with fewer shoots had more leaves and vines with more shoots had fewer leaves per
shoot, allowing for similar overall canopy size.
The hydraulic limitation hypothesis assumes that photosynthesis (i.e., carbon
supply) limits growth, but growth is usually more sensitive to water stress than is
photosynthesis (Ryan et al., 2006). At higher stress levels, shoot hydraulic conductivity
was further reduced by formation of vessel embolisms. In addition, reduced xylem
development in grapevines subjected to moderate water stress may contribute to the
control of water flow and to a reduction in vulnerability to xylem embolism (Lovisolo and
Schubert, 1998) Vines with more shoots had shorter, thinner shoots, possibly having
reduced development of xylem vessels, thus reducing their vulnerability to xylem
embolisms upon the onset of water stress while reducing their hydraulic conductivity.
The larger leaf area of lightly pruned vines (vines with more shoots) allowed for
increased light interception early in the season than vines with fewer shoots and a
smaller leaf canopy. In addition the greater canopy would allow the vine to have higher
overall rates of transpiration, thus increasing their vulnerability to water stress (Lasko
and Dunst, 1999; Keller et al., 2004; Keller and Mills, 2005). The increase in vine
transpiration may be the cause of their reduced hydraulic resistance as the vine would
have to increase the size of their xylem vessels to accommodate the need for increased
water transportation throughout the vine to allow for the larger canopy’s transpiration.
The impact of reproduction on vegetative growth can be attributed to competition
for carbohydrates between floral and leaf primordia in the dormant or breaking bud,
85
accounting for the smaller leaves and internodes (Greer and Weston, 2010). Therefore,
vines without clusters would have increased vegetative growth. In addition, there would
be reduced sink strength, as the vines could continue to spend their photosynthetic
resources towards increased shoot growth. Although clusters don’t become strong
sinks until the onset of veraison and the onset of ripening, this competition shouldn’t be
enough to limit vegetative growth early in the season. The lack of difference in the
canopy sizes of vines with or without clusters supports the idea that early season
vegetative growth, prior to the berries becoming strong sinks at veraison, is not the main
factor limiting the vigor of vines with more shoots and clusters.
Yield and fruit composition, during the 2009 growing season, showed that there
were no statistical differences in relation to the number of shoots per vine, except that
yield was greater in vines with more shoots. Deficit irrigation, as applied post veraison,
and vigor level had no effect on berry growth, allowing for uniform ripening throughout
the block. Pre-veraison water stress was said to induce a greater reduction of shoot and
berry growth and a more rapid limitation of net photosynthesis and stomatal
conductance as compared to post-veraison water stress (Poni et al., 1993). Due to this
conclusion by Poni et al., the vines were deficit irrigated after berry set until harvest for
the 2010 growing season.
The 2010 growing season showed significant differences between both yield and
berry composition of vines with varying numbers of shoots. Cluster weight and the
number of berries per cluster were greater in more vigorous vines, while yield was
greater in less vigorous vines, as there were more clusters and shoots (1 cluster per
shoot).Vine water stress is said to reduce berry size and yield especially when the

86
stress occurs pre-veraison (Shellie, 2006). In addition, Shellie (2006) shows that the
yield of Merlot was reduced up to 48% under deficit irrigation, which was associated
with smaller berries, lower cluster weight, and fewer clusters per vine. Sugar and color,
were said to be dependent on the available active leaf surface during the period of
veraison and harvest (Candolfi-Vasconcelos and Koblet, 1990). Therefore, more
vigorous vines with greater leaf areas per shoot would have greater concentrations of
sugar (soluble solids) and color. As the meristems were killed after berry set, vigorous
growth did not out compete the ripening clusters as described by Keller and Tarara
(2010). Soluble solids and titratable acidity were both higher in more vigorous vines,
which had fewer shoots per vine, while there was no statistical difference between pH
and color in relation to the number of shoots per vine. It is well accepted that as the
berry ripens, sugars will increase and organic acids (Malic acid especially) are
metabolized (Keller, 2010; Jackson, 2008). Therefore, it’s interesting that while vigorous
vines had increased soluble solids in comparison to less vigorous vines, that they also
had higher total acids, as measured by titratable acidity, as vigor is often correlated with
reduced grape acidity and higher pH due to shading (Jackson, 1998).
The yield to pruning weight ratio was calculated based on the balance between
vigor and fruit growth on the number of shoots per vine during the 2010 growing
season. Vines with 20 to 40 shoots fell within the ideal 5 to 10 yield to pruning weight
ratio. Vines with 40 shoots and above are associated with delayed ripening and over-
cropping, as seen with decreased soluble solids measurements and mean cluster
weight. While only two vines had a yield to pruning weight ratio less than 5, these vines

87
would be associated with having low yields, as seen in Table 5 and 6, and high shoot
vigor.
Practical Recommendations and Implications:
I would suggest pruning Merlot grapevines to 20 to 40 buds in Eastern
Washington, based on the yield to pruning weight ratio in a 1.8 m spacing between
vines and 2.7 m spacing between rows to ensure adequate leaf area to ripen fruit,
reduce water stress, and to produce riper grapes. Different climates and regions will
require different irrigation regimes, vine spacing, and bud numbers depending on
various factors such as the planted grapevine’s varietal growth habit, soil conditions
(sandy soils require more water than clay), and the amount of precipitation and growing
degree days. In addition, vines with more shoots should be irrigated more frequently or
with more water to maintain the same leaf water status as vines with fewer shoots and
establish canopy size and crop yield uniformity within the vineyard. Regulated deficit
irrigation should begin after fruit set, prior to veraison, to reduce yield and berry size. In
addition, prior to veraison, a water deficit should be applied until the meristematic
regions of the shoots are dead to control vigor. As well as reducing yield, berry size, and
excess vigor regulated deficit irrigation can be used for improving wine quality, reducing
shoot growth and leaf area, and optimizing the balance between canopy and fruit.

88
Conclusions
Based on the aforementioned results and analysis, the hypothesis that the
inverse relationship between shoot number and vigor may be caused by a hydraulic
limitation to water transport was shown to be invalid, as the vine’s resistance to water
flow was higher in vines with fewer shoots (i.e., more vigorous), and lower in vines with
more shoots. Despite there being a greater resistance to water flow through vines with
fewer shoots, the vulnerability of vines to water stress, as seen in Figure 36A, increased
with increasing shoot number, possibly due having a higher vine transpiration pull early
in the season resulting in a decreased hydraulic resistance. As there were no growth or
vigor differences before the onset of bloom, the presence of inflorescences and then
fruit may in fact have an effect on vine vigor prior to veraison when fruit are said to
become strong carbohydrate sinks. Vineyards of high yields are said to demonstrate a
balance between shoot and fruit production, as an indication that photosynthates are
partitioned appropriately between shoot and fruit production (Smart et al., 1990). In
addition, soil water availability interacts with crop load to effect stomatal conductance
and gas exchange by decreasing root water potential, resulting in reduced stomatal
conductance (Noar et al., 1997).
Future Research
As there was no difference in canopy leaf areas prior to pre-veraison, the
presence of ripening fruit may have an effect on vegetative growth. To test this new
hypothesis I would recommend pruning vines to the same bud and shoot number

89
ranges in the previous study, while removing inflorescences before bloom, after bloom,
at fruit set, and at the onset of veraison to see when fruit begins to have an active
influence on grapevine vigor based on vines with varying shoot numbers.
As the hydraulic limitation hypothesis states that differences in hydraulic
resistances are due to the age and size of the plant, it would be interesting to study how
vine age and trellis systems affect grapevine vigor. I would propose measuring gas
exchange and water potentials (to measure the evaporative flux), as well as canopy size
and height, and the hydraulic resistance of vine portions using the high pressure flow
meter system. The devigorating effect of some trellis systems may be caused by a
difference in hydraulic resistances.
In addition to testing the different hydraulic resistances of vines with differing
ages and trellis systems, the difference between the hydraulic resistances of isohydric
and anisohydric varieties could provide more information on the mechanism of the how
each type perceives water stress, beyond their abscisic acid affinity.
90
REFERENCES
Blackman, C.J., T.J. Brodribb, and G.J. Jordon. 2009. Leaf hydraulics and drought stress: response, recovery and survivorship in four woody temperate plant species. Plant Cell Environ. 32:1584-1595.
Blum, A. 2008. Plant Stress: Coping with plant environmental stress is the foundation of sustainable agriculture. Viewed 14 April 2010 <http://plantstress.com>.
Bray, E.A. 1997. Plant responces to water deficit. Trends in Plant Science: Reviews 2.2: 48-54.
Boyer, J.S., W.K. Silk. 2004. Hydraulics of Plant Growth. Functional Plant Biology. 31: 761-733.
Candolfi-Vasconcelos, M.C., and W. Koblet. 1990. Yield, fruit quality, bud fertility and starch reserves of the wood as a function of leaf removal in V. vinifera - Evidence of compensation and stress recovering. Vitis. 29:199-221.
Canny, M.J. 1998. Applications of the compenstating pressure theory of water transport. Am. J. Bot. 85.7: 897-909.
Choné, X., C. Van Leeuwen, D. Dubourdieu, and J.P. Gaudillère. 2001. Stem water potential is a sensitive indicator of grapevine water status. Annuals of Botany. 87: 477-483.
Coombe, B.G. 1987. Distribution of solutes within the developing grape berry in relation to its morphology. Am. J.Enol. Vitic. 38: 120-127
Coombe, B.G. 1995. Adoption of a System for Identifying Grapevine Growth Stages. Aust. J. Grape Wine Res. 1: 100-110
Cosgrove, J.J. 1906. Principles and Practices of Plumbing. Standard Sanatary Mfg. Co. Pittsburg, PA.
Downton, W.J.S, B.R. Loveys, and W.J.R. Grant. 1988. Stomatal closure fully accounts for the inhibition of photosynthesis by abscisic acid. New Phytol. 108: 263-266.
Hacke, U.G., V. Stiller, J.S. Sperry, J. Pittermann, K.A. McCulloh. 2001. Cavitation fatigue: Embolism and refilling cycles can weaken the cavitation resistance of xylem. Plant Physiol. 125: 779-786.
Hamman, R.A., and I.E. Dami. 2000. Effects of irrigation on wine grape growth and fruit quality. Hort Technol. 10:1: 162-168
Holbrook, N.M. and M.A. Zwieniecki. 1999. Embolism repair and xylem tension: Do we need a miracle? Plant Physiol. 120:7-10.
Holbrook, N.M., E.T. Aherns, M.J. Burns, and M.A. Zwieniecki. 2001. In vivo observation of cavitation and embolism repair using magnetic resonance imaging. Plant Physiol. 126: 27-31.
91
Hunter, J.J., and C.G Volschenk. 2001. Effect of altered canopy:root volume ratio on grapevine growth compensation. S. Afr. J. Enol. Vitic. 22: 27-30.
Hsiao, T.C. 1973. Plant responses to water stress. Ann. Rev. Plant Physiol. 24: 519-570.
Iland, P., A. Ewart, A. Markides, J. Sitters, and N. Bruer. 2000. Determination of Titratable Acidity. In Techniques for Chemical Analysis and Quality Monitoring During Winemaking. p.76. Patrick Iland Wine Promotions. Athelstone, South Australia.
Jackson, R.S. 2008. Wine Science: Principles and Applications. Third Edition.Elsevier, Burlington, Massachusetts.
Keller, M. 2010. The Science of Grapevines: Anatomy and Physiology. San Diego, CA: Academic Press
Keller, M. and L.J. Mills. 2005. Recovery of Merlot vines from winter injury: a matter of bud number? Proc. XIV International Symposium 'Groupe d'Etude des Systemes de Conduite de la Vigne'. Geisenhiem, Germany. 74-79.
Keller, M., L.J. Mills, R.L. Wample, and S.E. Spayd. 2004. Crop load management in Concord grapes using different pruning techniques. Am. J. Enol. Vitic. 56: 91-103.
Lambers, H., F.S. Chapin, and T.L. Pons. Plant Physiological Ecology. New York: Springer-Verlag, 1988.
Lasko, A.N. and R.M. Dunst. 1999. Responces to drought of balanced-prunned and minimally-prunned "Concord" grapevines. Acta Hort. 493: 103-107.
Lovisolo, C. and A. Shubert. 1998. Effects of water stress on vessel size and xylem hydraulic conductivity in Vitis vinifera L. J. Exp. Bot. 49.321: 693-700.
Lovisolo, C., I. Perrone, A. Carra, A. Ferrandino, J. Flexas, H. Medrano, and A. Schubert. 2010. Drought-induced changes in development and function of grapevine (Vitis spp.) organs and in their hydraulic and non-hydraulic interactions at the whole-plant level: a physiological and molecular update. Functional Plant Biology, 37:98-116. Maseda, P.H. and R.J. Fernandez. 2006 Stay wet or else: Three ways in which plants can adjust hydraulically to their environment. J. Exp. Bot. 56:15: 3963-3977. Matthews, M.A., M.M. Anderson, H.R. Schultz. 1987. Phenological and growth responses to early and late season water deficiency in Cabernet Franc. Vitis. 26: 147-160 Mills, L.J., J.C. Ferguson, and M. Keller. 2006. Cold-Hardiness Evaluation of Grapevine Buds and Cane Tissues. Am. J. Enol. Vitic. 57(2): 194-200 Morrison, J. 1991. Bud Development in V. vinifera L. Botanical Gazette. 152(3): 304-315.

92
Mullins M. G., A.Bouquet, and L.E. Williams. 2003. Biology of the grapevine. Cambridge University press, Cambridge, United Kingdom. Naor, A. and R.L Wample. 1994: Gas exchange and water relations of field-grown Concord (Vitis labruscana Bailey) grapevines. Am. J. Enol. Vitic. 45: 333-337. Noar, A, Y. Gal, and B. Bravado. 1997. Crop load affects assimilation rate, stomatal conductance, stem water potential and water relations of field-grown Sauvignon Blanc grapevines. J. Exp. Bot. 48(314): 1675-1680. Pratt, C. 1974. Vegetative Anatomy of Cultivated Grapes—A Review. Am. J. Enol. Vitic. 25(3): 131-150
Poni, S., A.N. Lasko, J.R. Turner, and R.E. Melious. 1993. The effects of pre-and post-veraison water stress in growht and physiology of potted Pinot Noir grapevines at varying crop levels. Vitis. 32: 207-214
Raven, P.H., R.F. Evert and S.E. Eichhorn. Biology of Plants. 7th Edition. New York: W.H. Freeman and Company, 2005.
Ryan, M.G. and B.J Yoder. 1997. Hydraulic limits to tree height and tree growth. Bioscience 47: 235-242.
Ryan, M.G., N. Phillips and B.J. Bond. 2006. The hydraulic limitation hypothesis revisited. Plant Cell Environ. 29: 367-381.
Sack, L. and N.M. Holbrook. 2006. Leaf Hydraulics. Annu. Rev. Plant Biol. 57: 361-381.
Schultz, H.R. and M.A. Mattews. 1988. Resistance to water transport in shoots of Vitis vinifera L. in relation to growth at low water potential. Plant Physiol. 88: 718-724.
Schultz, H.R. 2003. Differences in hydraulic architecture account for near-ioshydric and anisohydric behavior in two field grown Vitis vinifera L. cultivars during drought. Plant Cell Environ. 26: 1393-1405.
Shaozhong, K., W. Shib, and J. Zhang. 2000. An improved water-use efficiency for maize grown under regulated deficit irrigation. Field Crops Research. 67.3: 207-214.
Shellie, K.C. 2006. Vine and berry response of Merlot (Vitis vinifera L.) to differential water stress. Am. J. Enol. Vitic. 57(4):514-518
Sivilotti, P., C. Bonetto, M. Paladin, and E. Peterlunger. 2005. Effect of soil moisture availability on Merlot: From leaf water potential to grape composition. Am. J. Enol. Vitic. 56: 9-18
Smart, R.E. 1985. Principles of grapevine canopy microclimate manipulations with implications for yield and quality. A review. Am. J. Enol. Vitic. 36: 230-239.

93
Smart, R.E., I.M. Gravett, B.M. Fisher, and J.K. Dick. 1990 Canopy management to improve grape yield and wine quality- principles and practices. S. Afr. J. Enol. Vitic. 11:3-17.
Sperry, J.S., U.G. Hacke, R. Oren, and J.P. Comstock. 2002. Water deficits and hydraulic limits to leaf water supply. Plant Cell Environ. 25: 251-263.
Stewart, W. 1994. Grapevine Structure and Function: Morphology and Phenology. Certificate in Food Processing (WINE) Viticulture. Murry Institute of Technical and Further Education, Barossa Valley Campus, Nurioopta, South Australia.
Tarara, J.M, J.E. Perez Peńa, and M. Keller. 2005. Using whole-vine photosynthesis to understand the effects of water deficit on premium wine grapes. Acta Hort. 689: 301-307.
Tsuda M., M.T. Tyree. 1997. Whole-plant hydraulic resistance and vulnerability segmentation in Acer saccharinum. Tree Physiol. 17. 351-357.
Tyree, M.T., S. Patińo, J. Bennink, and J. Alexander. 1995. Dynamic measurements of root hydraulic conductance using a high-pressure flow meter in the laboratory and field. J. Exp. Bot. 46(282): 83-94.
Wan, J., R. Griffiths, J. Ying, P. McCourt, and Y. Huang. 2009. Development of Drough-Tolerant Canola (Brassica napus L.) through Genetic Modulation of ABA-mediated Stomatal Responces. Crop Science. 49: 1539-1554.
Watson, J. 1999. Washington Viticulture-The Basics. Growing Grapes in Eastern Washington: Proceedings from the 1998 Washington State University Shortcourse for Establishing a Vineyard and Producing Grapes. Good Fruit Grower. Yakima, Washington.
Williams, L.E., and M.A. Matthews. 1990. Grapevines. In: Irrigation of Agricultural Crops (B.A. Stewart and D.R. Neilson, eds.), pp. 1019-1055. Agronomy Series Monograph No. 30, American Society of Agronomy, Madison, WI.

94
APPENDIX
BBCH system for identifying grapevine growth stages modified from Eichhorn and Lorenz
(1977) by B.G. Coombe (1995).