Embed Size (px)
Citation preview

THE RELATIONSHIP BETWEEN PARENTS` EDUCATION LEVEL AND
STUDENTS`MOTIVATION TOWARD STUDENTS` INTEREST
IN PURSUING THEIR STUDY TO HIGHER EDUCATION
UNDERGRADUATE THESIS
This undergraduate thesis is submitted in partial fulfillment of the requirements to
obtain the degree of Bachelor of Education in Faculty of Economics
Yogyakarta State University
By:
Narendra Edi Putranto
09418244011
ACCOUNTING EDUCATION DEPARTMENT
FACULTY OF ECONOMICS
YOGYAKARTA STATE UNIVERSITY
2013

ii
THE RELATIONSHIP BETWEEN PARENTS` EDUCATION LEVEL AND
STUDENTS` MOTIVATION TOWARD STUDENTS` INTEREST
IN PURSUING THEIR STUDY TO HIGHER EDUCATION
Undergraduate Thesis
By:
Narendra Edi Putranto
09418244011
This undergraduate thesis had been approved and validated on March 15, 2013
To be examined by the Team of Undergraduate Thesis Examination
Accounting Education Study Program
Accounting Education Department Faculty of Economics
Yogyakarta State University
Approved by:
Supervisor,
Abdullah Taman, M.Si., Ak
NIP. 19630624 199001 1 001

iii
VALIDATION
The undergraduate thesis entitled:
“THE RELATIONSHIP BETWEEN PARENTS` EDUCATION LEVEL
AND STUDENTS` MOTIVATION TOWARD STUDENTS` INTEREST
IN PURSUING THEIR STUDY TO HIGHER EDUCATION”
By:
Narendra Edi Putranto
NIM 09418244011
Had been defended in front of the Examiner Team on April 12, 2013 and had
been successfully passed
THE EXAMINER TEAM
Name Position Signature Date
Dhyah Setyorini, M.Si, Ak
Chairman of
Examiner &
Examiner
………………….. ………..
Abdullah Taman, M.Si., Akt
Co-Examiner &
Secretary
………………….. ………..
Annisa Ratna Sari, MS.,Ed
Main Examiner
…………………..
………..
Yogyakarta, April , 2013
Faculty of Economics,
Yogyakarta State University
Dean,
Dr. Sugiharsono, M.Si
NIP. 19550328 198303 1 002

iv
DECLARATION OF AUTHENTICITY
I, the undersigned,
Name : Narendra Edi Putranto
Student ID : 09418244011
Study Program : Accounting Education
Faculty : Economics
Undergraduate thesis Title : THE RELATIONSHIP BETWEEN
PARENTS` EDUCATION LEVEL AND
STUDENTS` MOTIVATION TOWARD
STUDENTS` INTEREST IN PURSUING
THEIR STUDY TO HIGHER
EDUCATION
Hereby declare that this undergraduate thesis is my own original work. According
to my knowledge, there is no work or opinion written or published by other,
except as reference or citation by following the prevalent procedure of scientific
writing.
Yogyakarta, March 13, 2013
Author,
Narendra Edi Putranto
NIM. 09418244011

v
MOTTO
“Maka sesungguhnya dibalik kesusahan ada kemudahan”
(QS: Al-Insyiroh 94; 5)
“Kelembutan dan kebaikan bukanlah tanda-tanda kelemahan dan putus asa, tetapi adalah penjelmaan
sebuah kekuatan”
(Kahlil Gibran)
“Sesuatu yang terbaik di masa depan hanya muncul sekali dalam satu hari”
(Abraham Lincoln)
“Allah dulu, Allah lagi, Allah terus”
(Yusuf Mansyur)

vi
ACKNOWLEDGEMENT:
1. My greatest parents in the world, Tulus Kiswidagda and Murningah who
always take care of me and give me the best, who always remember me in
every prayer. Without both of you I would be nothing.
2. My grand parents, Kasih Jauhari, Wakidjan, and Sukiswati who always
give encouragement to finish this undergraduate thesis.
3. My sisters, Galuh Pramita Ayu and Farah Azzah Fadila for making my life
more colorful, you two are the best.
4. Ninda Okta Winggani who always support me, and always stay beside me.
5. My friends Shelvy, Dani, Firman, all of Jakawar 70 members for being
such nice friends to me, and help me when i needed.
6. All parties who cannot be mentioned individually.

vii
THE RELATIONSHIP BETWEEN PARENTS` EDUCATION LEVEL AND
STUDENTS` MOTIVATION TOWARD STUDENTS` INTEREST
IN PURSUING THEIR STUDY TO HIGHER EDUCATION
Oleh:
Narendra Edi Putranto
09418244011
ABSTRAK
Penelitian ini merupakan penelitian ex-post facto yang bertujuan untuk
mengetahui Hubungan antara Tingkat Pendidikan Orangtua dan Motivasi Siswa
terhadap Minat Siswa untuk Melanjutkan Studi ke Perguruan Tinggi. Subjek
penelitian adalah seluruh siswa kelas XI IPS SMA N 1 Bukateja pada tahun ajaran
2012/2013 yang berjumlah 126 siswa.
Teknik pengumpulan data menggunakan angket untuk variabel Tingkat
Pendidikan Orangtua, Motivasi Siswa, dan Minat siswa untuk Melanjutkan Studi
ke Perguruan Tinggi. Ketiga kuesioner tersebut telah diuji validitas dan
reliabilitasnya. Uji prasyarat analisis menggunakan uji linearitas, dan uji
multikolinearitas.
Pengujian hipotesis pertama dan kedua menggunakan korelasi sederhana,
sedangkan pengujian hipotesis ketiga menggunakan korelasi ganda. Hasil
penelitian menunjukkan bahwa: (1) terdapat pengaruh positif dan signifikan
antara Tingkat Pendidikan Orangtua terhadap Minat siswa untuk Melanjutkan
Studi ke Perguruan Tinggi, dibuktikan dengan rx1y sebesar 0,428 (rx1y sebesar
0,428 > rtabel 5% sebesar 0,176), (2) terdapat pengaruh positif dan signifikan
antara Motivasi Siswa terhadap Minat siswa untuk Melanjutkan Studi ke
Perguruan Tinggi, rx2y sebesar 0,544 (rx2y sebesar 0,544 > r tabel 5% sebesar 0,176),
(3) terdapat pengaruh positif dan signifikan antara Tingkat Pendidikan Orangtua
dan Motivasi Siswa secara bersama-sama terhadap Minat Siswa untuk
Melanjutkan Studi ke Perguruan Tinggi, dibuktikan dengan korelasi ganda (R)
0,640, koefisien determinasi sebesar (R)2
0,410 dan Fhitung sebesar 42,713
(Fhitung sebesar 42,713 > Ftabel 5% of 3,09).
Kata kunci: Tingkat Pendidikan Orang Tua, Motivasi Siswa, Minat Siswa
Melanjutkan Studi ke Perguruan Tinggi

viii
THE RELATIONSHIP BETWEEN PARENTS` EDUCATION LEVEL AND
STUDENTS` MOTIVATION TOWARD STUDENTS` INTEREST
IN PURSUING THEIR STUDY TO HIGHER EDUCATION
By:
Narendra Edi Putranto
09418244011
ABSTRACT
This research is an ex-post facto research. The purpose of this research is
to determine The Relationship between Parents` Education Level and Students`
Motivation toward Students` Interest in Pursuing Their Study to Higher
Education. The subject of this research are all of the students in Grade XI Social
Science in Academic Year of 2012/2013 that consist of 126 students.
Data collection techniques used questionnaires to generate Parents`
Education Level, Students` Motivation, and Students` Interest in Pursuing Their
Study to Higher Education. Those questionnaires have been tested, for validity
and reliability, before proceed to linearity test, and multicollinearity test.
The first and second hypothesis testing using simple regression, while the
third hypothesis testing using multiple regression. The results showed that: (1)
there is a positive and significant effect between Parents` Education Level
towards Students` Interest in Pursuing Their Study to Higher Education, proved
by rx1y of 0,428 (rx1y of 0,428 > r table 5% of 0,176), (2) there is a positive and
significant effect between Students` Motivation towards Students` Interest in
Pursuing Their Study to Higher Education, proved by rx2y of 0,544 (rx2y of 0,544 >
r table 5% of 0,176), (3) there is a positive and significant effect between Parents`
Education Level and Students` Motivation together toward Students` Interest in
Pursuing Their Study to Higher Education, proved by multiple correlation (R)
0,640, coefficient of determination (R)2
0,410 and Fcalc equal to 42,713 (Fcalc of
42,713 > Ftable 5% of 3,09).
Keywords: Parents` Education Level, Students` Motivation, Students` Interest in
Pursuing Their Study to Higher Education

ix
FOREWORD
First of all, I would like to thank Allah the Almighty for all the bless,
mercy and guidance. Thus the Undergraduate Thesis entitled “The Relationship
between Parents` Education Level and Students` Motivation toward Students`
Interest in Pursuing Their Study to Higher Education” can be finished. I realize
that had not been possible without people help. Therefore, I would like to express
my deepest gratitude to the following:
1. Prof. Dr. Rochmat Wahab, M.Pd., MA., Rector of Yogyakarta State
University.
2. Dr. Sugiharsono, M.Si., Dean of Faculty of Economics Yogyakarta State
University.
3. Soekirno, M,Si, Ph.D, The Head of Accounting Education Department
Yogyakarta State University.
4. Abdullah Taman, M.Si., Ak, my supervisor who had been patiently and
kindly supervised me and supported me during the research.
5. Annisa Ratna Sari, MS. Ed, my supervisor for the beneficial critics and
suggestions.
6. Members of SMA N 1 Bukateja and SMA N 2 Purbalingga who have given
permission to conduct research.
7. Students of SMA N 1 Bukateja and SMA N 2 Purbalingga who have been
willing to take the time to provide assistance.
8. International Class of Accounting Education Generation for the support.
9. My beloved friends, Accounting Education 2009 family.

x
10. All parties who cannot be mentioned individually but had provided me all
their supports and assistances during the research process.
May God gives the best for all the people mentioned above. Finally, I hope
that this work will be useful for the readers.
Yogyakarta, March 12, 2013
Author,
Narendra Edi Putranto
NIM. 09418244011

xi
TABLE OF CONTENTS
COVER .................................................................................................. i
APPROVAL............................................................................................ ii
VALIDATION........................................................................................ iii
DECLARATION OF AUTHENTICITY............................................. iv
MOTTO.................................................................................................... v
ACKNOWLEDGEMENT...................................................................... vi
ABSTRACT............................................................................................. vii
FOREWORD........................................................................................... ix
TABLE OF CONTENTS ....................................................................... xi
LIST OF TABLES................................................................................... xv
LIST OF FIGURES................................................................................. xvii
LIST OF APPENDICES......................................................................... xviii
CHAPTER I. INTRODUCTION............................................................ 1
A. Background......................................................................... 1
B. Problem Identification......................................................... 5
C. Problem Restriction............................................................. 5
D. Problem Formulation ......................................................... 6
E. Research Objectives ............................................................ 6
F. Research Benefits................................................................. 7

xii
CHAPTER II. LITERATURE REVIEW AND HYPOTHESIS
FORMULATION....................................................... 8
A. Literature Review............................................................. 8
1. Students` Interest in Pursuing Their Study
to Higher Education.................................................... 8
a. Definition of Students` Interest in Pursuing
Their Study to Higher Education........................... 8
b. Factors that Affect Students` Interest
in pursuing Their Study to Higher Education....... 10
c. Indicators of Students` Interest in pursuing Their
Study to Higher Education..................................... 11
2. Students` Motivation.................................................... 12
a. Definition of Students` Motivation........................ 12
b. Factors Affecting Students` Motivation.................. 14
c. How to Develop Students` Motivation................... 14
d. Indicators of Students` Motivation.......................... 16
3. Parents Education Level................................................ 17
B. Relevant Researches............................................................ 20
C. Research Framework ........................................................... 24
D. Research Paradigm.............................................................. 26
E. Research Hypothesis ........................................................... 27
CHAPTER III. RESEARCH METHODS............................................ 28
A. Place and Time Research.................................................... 28

xiii
B. Research Design.................................................................. 28
C. Research Variables................................................................ 28
D. Operational Definition of Variables..................................... 29
E. Population............................................................................ 30
F. Data Collection Technique.................................................. 31
G. Data Collection Instruments................................................ 32
H. Validity and Reliability Test................................................ 34
I. Data Analysis Techniques................................................... 36
CHAPTER IV. RESEARCH RESULT AND DISCUSSION............... 43
A. Research Result................................................................... 43
1. General Data Description .............................................. 43
2. Specific Data Description ............................................. 45
B. Prerequisite Test Analysis.................................................... 58
1. Linearity Test................................................................. 58
2. Multicollinearity Test..................................................... 60
C. Hypothesis Testing............................................................... 61
1. First Hypothesis Test..................................................... 61
2. Second Hypothesis Test ................................................ 62
3. Third Hypothesis Test.................................................... 63
D. Research Result Discussion................................................. 65
E. Limitations of the Research................................................. 70
CHAPTER V. CONCLUSION AND SUGGESTIONS....................... 71
A. Conclusion............................................................................ 71

xiv
B. Research Result Implications.............................................. 72
C. Suggestions.......................................................................... 73
REFERENCES........................................................................................ 74
APPENDICES.......................................................................................... 76

xv
LIST OF TABLES
1. Research Population...................................................................... 31
2. Score of Parents` Education Level................................................ 32
3. Indicator of Parents` Education Level Instrument........................ 33
4. Alternative Answers Score............................................................ 33
5. Indicator of Students` Motivation Instrument.............................. 33
6. Indicator of Students` Interest in Pursuing Their Study
to Higher Education Instrument.................................................... 34
7. Correlation Coefficient Interpretation Guidelines......................... 36
8. Categories of variables.................................................................. 38
9. Research Subjects.......................................................................... 45
10. Frequency Distribution of Students` Interest in Pursuing Their
Study to Higher Education Variable................................... 47
11. Identification of Students` Interest in Pursuing Their Study
to Higher Education Tendency..................................................... 49
12. Students` Interest in Pursuing Their Study to
Higher Education Category........................................................... 49
13. Frequency Distribution of Parents` Education Level Variable... 52
14. Identification of Parents` Education Level Tendency................. 53
15. Parents` Education Level Category.............................................. 53
16. Frequency Distribution of Students` Motivation Variable.......... 56
17. Identification of Students` Motivation Tendency....................... 57

xvi
18. Students` Motivation Category...................................................... 58
19. Linearity Test Result Summary..................................................... 59
20. Multicollinearity Test Result Summary........................................ 61
21. Product Moment Correlation Result Summary............................. 61
22. Multiple Correlation Result Summary.......................................... 64
23. Multiple Correlation of F test Result............................................ 64

xvii
LIST OF FIGURES
1. Relationship among Variables...................................................... 26
2. Students` Interest in Pursuing Their Study to Higher Education
Histogram..................................................................................... 48
3. Pie Chart of Students` Interest in Pursuing Their Study to
Higher EducationTendency.......................................................... 50
4. Parents` Education Level Histogram............................................ 52
5. Pie Chart of Parents` Education Level Tendency.......................... 54
6. Students` Motivation Histogram................................................... 56
7. Pie Chart of Students` Motivation Tendency............................... . 58
8. Relationship among Variables....................................................... 65

xviii
LIST OF APPENDICES
Appendix 1 Research Instrument............................................................ 77
a. Research Instrument Testing............................................... 78
b. Research Instrument............................................................ 85
Appendix 2 Research Instrument Testing Analysis................................ 91
a. Research Instrument Testing Data Table............................ 92
b. Validity and Reliability test SPSS Output.......................... 98
Appendix 3 Research Data...................................................................... 107
a. Research Instrument Data Table.......................................... 108
b. Primary Data Tabulation...................................................... 113
c. Research Data SPSS Output................................................. 118
Appendix 4 Research Permission............................................................. 131
a. Research Permission Letter.................................................. 132

1
CHAPTER I
INTRODUCTION
A. Background
Education in the globalization era is an important aspect and become
the government’s concern. Education is needed to be improved because
competition in getting job is getting hard, not only competing with local
people but also foreigners.Many people sign up to get a job, but most of
them are rejected because they cannot fulfill the criterias required by the
company.
People who have good abilities in adaptation will survive, because they
have higher educational backgrounds and broad-mind. People with limited
education and skill will be difficult to develop. It is supported by the fact
from Suara Pembaruan (April, 2011) that 75 milion employees do not have
enough ability and capability to fill out the job.
The quality of education in Indonesia must be equated with
thedeveloped countries, so Indonesia can produce good human resources that
can be absorbed quickly by companies` demand. It can be happen if they are
supported by good education.
Under Act No. 20 of 2003 on National Education System of article 18,
paragraph 3, which stated that secondary education held in Indonesia consists
of SMA, MA, SMK, and MAK. The objectives between SMA, MA and
SMK, MAK are different. Senior High School and MA graduates are
designed to pursue further studies, Higher Education, while vocational and

2
MAK graduates are designed to work directly after completing their
study. But in fact there are also many high school graduates have to work
after completing their education. Their low level of skill and knowledge
affect their career and salary they get.
In the last few years high school graduates can still get jobs, but a few
years later, high school graduates will have difficulties if they only rely on
their high school diplomas to apply for a job. This is due to the increasing
requirements demanded by the firms.If the jobs are available, they would
only for lower-level employees of a company.
Therefore, high school graduates are expected to pursue their studies to
Higher Education to improve the ability to compete in the real world. It is
suitable with Act No. 20 of 2003 article 19, paragraph 1, which stated that
higher education is the level after secondary education without being
followed by the description of the high school graduates, MA, vocational, or
MAK. It shows that every student of secondary education has the right to
pursue their education to a higher level of education.
Continuing study to Higher Education comes from a high interest to
develop themselves. According to Muhibbin Syah (2011: 152), “Minat
berarti kecenderungan dan kegairahan yang tinggi atau keinginan yang
besar terhadap sesuatu.” The interests of this research are affected by
internal and external factors. Internal factors are factors derived from
themselves, one of them is motivation to achieve something better. According

3
to Ngalim Purwanto (2007: 71) stated that, “Motivasi adalah suatu usaha
yang disadari untuk mempengaruhi tingkah laku seseorang agar ia tergerak
hatinya untuk bertindak melakukan sesuatu.” The external factors are factors
that are not come from themselves. Ngalim Purwanto mentioned that (2010:
102) the factors from outside individuals including families, teachers and the
school`s environment, and communities.
The interest of students in pursuing their study to Higher Education can
be influenced by several factors, one of them is the Students` Motivation.
Based on Djaali (2008: 107) “Motivasi Berprestasi bukan sekadar dorongan
untuk berbuat, tetapi mengacu kepada suatu ukuran keberhasilan
berdasarkan penilaian terhadap tugas yang dikerjakan
sesorang.” Motivation of the students can be seen from the lack of feedback
when learning activities are conducted. They do not to take the initiative to
ask questions and discuss the material enthusiasticly. Lack of students`
motivation in learning will certainly affect the overall students` achievement.
The other factor that affect the interest of students in pursuing study to
Higher Education is Parents Education Level. Ngalim Purwanto stated that
(2010: 104) “Ada keluarga yang terdiri dari ayah-ibu yang terpelajar dan
ada pula yang kurang terpelajar. Ada keluarga yang mempunyai cita-cita
tinggi bagi anak-anaknya, ada pula yang biasa saja.”The variations of
Parents Education Level is affecting the interest of high school students to
pursue their study to Higher Education. The role of parents at home is as role
4
models, shaping the way of student’s mindset to get the students`
decision. Each of parents` education level will distinguish each students in
making the decision. The parents with higher education will certainly
encourage their children to pursue their studies and give guidance in
determining a choice. It will be different if the parents have low education
levels. Theywouldthink that it is better for their children to get a job after
completing the secondary education.
After researcher conducted observation in SMA N 1 Bukateja, it is found
that there were symptoms of a lack of Students` Motivation,some students are
not well motivated when the lesson was conducted and cannot answer the
question given by the teacher. The other occurence was some of students are
not serious, they prefered chatting with friends than paying attention to the
teacher's explanation.
The other indication that arise besides Students` Education is Parents
Education Level. Researcher conducted some questions to the student who
picked up randomly, the variations of parents education level provide
different answers, some student answered that after graduation from
Secondary Education is enough to find a job, but there is also some student
answered that when graduating from Higher Education is enough to find a
job.
Based on the background above, the researcher is interested in
conducting research entitled "The Relationship between Parents` Education

5
Level and Students` Motivation toward Students` Interest in Pursuing Their
Study to Higher Education".
B. Problem Identification
Based on the background above, so it can be identified that the problems
are as follows:
1. The level of Parents` Education of each student affects the way students
think about pursuing their studies to Higher Education.
2. The Lack of Students` Motivation in learning activity on student Grade XI
Social Science SMA N 1 Bukateja.
3. The responsibility of some students in learning still low it is known from
some of students who do not pay attention to the teacher.
C. Problem Restriction
Based on the problem identification mentioned above, it is known that
the Interest in Pursuing Study to Higher Education are influenced by many
factors. Due to the wide range of issues, it is important to limit research`s
topics. Thus the issues to be studied, can be more focused and specified. The
problems are limited into two factors; they are the Parents` Education Level
and Students` Motivation.Researcher choose Students` Motivation because
this factor should be encourage the students to achieve the best result in every
subject, while Parents` Education Level is believed will affect the Students`
Interest in Pursuing Their Study to Higher Education.

6
D. Problem Formulation
In this research, the formulations of the problems are presented as follows:
1. Is there a positive relationship between Parents` Education Level towards
Interest of the Grade XI Social Science SMA N 1 Bukateja in Pursuing
Their Study to Higher Education in Academic Year of 2012/2013?
2. Is there a positive relationship between Students` Motivation towards
Interest of the Grade XI Social Science SMA N 1 Bukateja in Pursuing
Their Study to Higher Education in Academic Year of 2012/2013?
3. Is there a positive relationship between Parents` Education Level and
Students` Motivation together toward Interest of the Grade XI Social
Science SMA N 1 Bukateja in Pursuing Their Study to Higher Education
in Academic Year of 2012/2013?
E. Research Objectives
Based on the problem formulation above, the purposes of this study are
to determine:
1. The Relationship between Parents Education Level towards
Students`Interest in Pursuing Their Study to Higher Education.
2. The Relationship between Students` Motivation towards Students` Interest
in Pursuing Their Study to Higher Education.
3. The Relationship between Parents` Education Level and Students`
Motivation toward Students` Interest in Pursuing Their Study to Higher
Education.

7
F. Research Benefits
The results from this study are expected to provide benefits:
1. Theoretical Benefits
This research can be used to enhance the literatures as a reference and
as a research materials for similar consideration.
2. Practical Benefits
a. For Researcher
This study can add knowledge and perception about the factors
influencing the interests of the students to pursue their studies to Higher
Education.
b. For Schools
1. This study can be use to direct and advice their students in
determining their choices after graduating from high school.
2. This study might motivate the students to pursue their studies to
Higher Education.

8
CHAPTER II
LITERATURE REVIEW AND HYPOTHESIS FORMULATION
A. Literature Review
1. Students` Interest in Pursuing Their Study to Higher Education
a. Definition of Students` Interest in Pursuing Their Study to Higher
Education
Muhibbin Syah stated (2011: 152), “Minat berarti
kecenderungan dan kegairahan yang tinggi atau keinginan yang besar
terhadap sesuatu.” Interest will arise when people feel happy, excited
and high spirited to something. Interest usually comes from the inside
without any enforcement from outside.
Djaali stated that (2012: 121), “Minat pada dasarnya adalah
penerimaan akan suatu hubungan antara diri sendiri dengan sesuatu
di luar diri. Semakin kuat atau dekat hubungan tersebut, semakin
besar minatnya.” The intensity to do some activities tend to increase
when the interest is high.
According to Slameto (2010: 57):
Minat adalah kecenderungan yang tetap untuk memperhatikan
dan mengenang beberapa kegiatan. Kegiatan yang diamati
seseorang, diperhatikan secara terus menerus yang disertai
dengan rasa senang. Jadi berbeda dengan perhatian, karena
perhatian sifatnya sementara (tidak dalam waktu yang lama)
dan belum tentu diikuti dengan perasaan senang, sedangkan
minat selalu diikuti dengan perasaan senang dan dari situ
diperoleh kepuasan.
Based on the experts` statements above, it can be concluded that
interest is a feeling which grows from inside of the human being when

9
they are happy and enthusiastic in something. Students who are
interested in Higher Education will encourage himself to pursue their
study to Higher Education. The students will give his best effort to
achieve it.
Pursuing study to Higher Education is an advanced study of
secondary education to higher education.
According to Fuad Ihsan (2003: 23), pendidikan tinggi diartikan
sebagai pendidikan yang mempersiapkan peserta didik untuk
menjadi anggota masyarakat yang memiliki tingkat kemampuan
tinggi yang bersifat akademik dan atau profesional sehingga
dapat menerapkan, mengembangkan dan /atau menciptakan
ilmu pengetahuan, teknologi dan seni dalam rangka
pembangunan nasional dan meningkatkan kesejahteraan
manusia.
Students who pursue their study to Higher Education are
expected to improve their academic skills and employment
oportunities. The interest in pursuing study affects the students to have
more attention to the Higher Education they will try to enter. Interest
in Pursuing Their Study to Higher Education will drive the students
with a sense of excitement to choose Higher Education as an advance
of secondary education. Interest will raise peoples` pleasure when they
do some activities related to their interest and then followed by
seriousness.
According to the explanation above it can be concluded that
Students` Interest in Pursuing Their Study to Higher Education is the
interest of students in Pursuing study to Higher Education that grows

10
conciously within the students. The Interests affects students to give
more attention to the Higher Education they want to enter.
b. Factors that Affect Students` Interest in pursuing Their Study to
Higher Education
Interest could not grow suddenly without self-development
process. Students self development process can be done through
learning process. In this research interest is related to students`
activity in countinuing their study, then the factors that affect
Students` Interest in Pursuing Study to Higher Education is equated
with the factors that affect learning.
According to Muhibbin Syah (2011: 145-156)
1) Faktor Internal (faktor dari dalam siswa), yakni
keadaan/kondisi jasmani dan rohani siswa. Faktor ini
meliputi aspek, yakni:
a) Aspek fisiologis (yang bersifat jasmaniah)
b) Aspek psikologis (yang bersifat rohaniah)
2) Faktor Eksternal (faktor dari luar siswa), yakni kondisi
lingkungan di sekitar siswa. Faktor ini meliputi:
a) Lingkungan sosial
b) Lingkungan nonsosial
3) Faktor Pendekatan Belajar, dapat dipahami sebagai segala
cara atau strategi yang digunakan siswa dalam menunjang
keefektifan dan efisiensi proses pembelajaran materi tertentu.
Ngalim Purwanto also mentioned that (2010: 102)
1) Faktor yang ada pada diri organisme itu sendiri yang kita
sebut faktor individual, dan.
2) Faktor yang ada di luar individu yang kita sebut faktor
sosial, antara lain adalah faktor keluarga, guru dan cara
mengajarnya, alat yang dipergunakan dalam belajar
mengajar, lingkungan dan kesempatan yang tersedia.

11
From the explanation of the experts above, it can be concluded
that there are two factors that affect the Students` Interest in Pursuing
Study to Higher Education. They are internal factors and external
factors. Internal factors consist of physiological and psychological
aspect, while external factors consist of family, school environment,
and friends in a community.
c. Indicators of Students` Interest in Pursuing Their Study to Higher
Education
Slameto mentioned that (2010: 180) “Minat adalah suatu rasa
lebih suka dan rasa ketertarikan pada suatu hal atau aktivitas, tanpa
ada yang menyuruh.” The existence of happiness, interests and
willingness will affect students` interest in pursuing their study to
Higher Education.
Based on Djaali (2010: 121) “Minat dapat diekspresikan
melalui pernyataan yang menunjukan bahwa siswa lebih menyukai
suatu hal daripada hal lainnya, dapat pula dimanifestasikn melalui
partisipasi dalam suatu aktivitas.” Students who have interests in
pursuing study to Higher Education will choose the university that suit
to him. They will try the best as they can, and they hope to be
accepted in Higher Education.
Djaali also stated that (2010: 121), “Minat berhubungan dengan
gaya gerak yang mendorong seseorang untuk menghadapi atau
berurusan dengan orang, benda, kegiatan, pengalaman yang

12
dirangsang oleh kegiatan itu sendiri.” Students who have chosen
something they are interest in, it will encourage them to do the best.
The existence of happiness, interests, willingness, hope,
encouragement, and suitability can be concluded as the indicators of
the Interest Pursuing Their Studies to Higher Education. Students who
feel the way described, considered to have a high interest in pursuing
the study to Higher Education.
2. Students` Motivation
a. Definition of Students` Motivation
Motive derived from the Latin is movere that can be interpreted
as move. Related to Motivation P. Houston (1985: 132) stated that
“You will not rehearse and store the information in this text unless
you are motivated to do so. A rat will not learn to climb over a barrier
unless it has a reason for doing so, such as escape from shock or the
need for food located on the far side of the barrier.” Based on Ngalim
Purwanto "Yang dimaksud dengan motif ialah segala sesuatu yang
mendorong seseorang untuk bertindak melakukan sesuatu" (2007:
60).
Definition of motivation also explained by Sumadi Suryabrata
(2004: 70) “keadaan dalam pribadi orang yang mendorong individu
untuk melakukan aktivitas-aktivitas tertentu guna mencapai sesuatu
tujuan.” Slameto also stated that (2010: 170) “Motivasi dirumuskan
sebagai suatu proses yang menentukan tingkatan kegiatan, intensitas,

13
konsistensi, serta arah umum dari tingkah laku manusia...” . Someone
who has the motivation in something tends to be interested in it, and
will make every effort to get it.
From some expert opinions above can be concluded that
motivation is the spirit that comes from within a person to do
something that interested him and achieving something that becomes
the goal. The higher motivation within someone will influence the
goals to be achieved.
Nana Syaodih stated that (2004: 70) “Motivasi Berprestasi
adalah motivasi untuk berkompetisi baik dengan dirinya atau dengan
orang lain dalam mencapai prestasi yang tertinggi.” This competitive
activity is positive thing that can encourage students to always
maintain their performance.
Based on Djaali (2008: 107) Motivasi Berprestasi dapat
diartikan dorongan untuk mengerjakan suatu tugas dengan
sebaik-baiknya berdasarkan standar keunggulan. Motivasi
Berprestasi bukan sekadar dorongan untuk berbuat, tetapi
mengacu kepada suatu ukuran keberhasilan berdasarkan
penilaian terhadap tugas yang dikerjakan sesorang.
Thus from the opinions of experts above, it can be concluded
that students` motivation is an encouragement arise within the
students to do as well as possible and compete to achieve higher
results in many subjects than the others.

14
b. Factors Affecting Students` Motivation
Slameto stated that (2010: 26) there are three factors affecting
the Students` Motivation:
1. Dorongan kognitif
Termasuk dalam golongan kognitif adalah kebutuhan untuk
mengetahui, untuk mengerti, dan memecahkan masalah.
Dorongan kognitif timbul di dalam proses interaksi antara
siswa dengan tugas atau masalah.
2. Harga diri
Ada siswa tertentu yang tekun belajar melaksanakan tugas-
tugasnya bukan terutama untuk memperoleh pengetahuan
atau kecakapan, melainkan untuk memperoleh status dan
harga diri.
3. Kebutuhan berafiliasi
Kebutuhan berafiliasi sukar dipisahkan dari harga diri. Ada
siswa yang berusaha menguasai bahan pelajaran atau
belajar giat untuk memperoleh pembenaran/penerimaan dari
teman-temannya atau dari orang lain yang dapat
memberikan status kepadanya. Siswa senang jika orang lain
menunjukan pembenaran terhadap dirinya, oleh karena itu ia
giat belajar.
Based on the explanation from the expert above, it can be
concluded that the students` motivation affected by three factors, they
are cognitive encouragement, self esteem, affiliation need.
c. How to Develop Students` Motivation
Students` motivation can be seen by the effort done by the
students to do as well as possible in achieving the learning
objectives. In this case a person has the drive to get the results as
expected and to avoid failure.
The importance of Students` Motivation in relation to the
Interest in Pursuing Their Study to Higher Education need to be

15
developed. Sardiman AM (2006: 92-95) stated that, there are
strategies to develop this Students` Motivation, i.e:
1. Memberi angka
Angka dalam hal ini adalah sebagai simbol dari hasil
aktivitas belajar siswa.
2. Hadiah
Dalam dunia pendidikan hadiah bisa dijadikan sebagai alat
motivasi.
3. Kompetisi
Kompetisi adalah bentuk persaingan, dapat digunakan
sebagai alat motivasi untuk mendorong siswa agar mereka
bersemangat dalam belajar.
4. Ego-involvement
Menumbuhkan kesadaran kepada anak didik agar merasakan
pentingnya tugas dan menerima sebagai suatu tantangan
sehingga bekerja keras dengan mempertaruhkan harga diri.
5. Memberi ulangan
Ulangan bisa dijadikan alat motivasi bila dilakukan secara
akurat dengan teknik dan strategi yang sistematis dan
terencana.
6. Mengetahui hasil
Mengetahui hasil belajar bisa dijadikan sebagai alat
motivasi karena dengan mengetahui hasil anak didik
terdorong untuk belajar lebih giat.
7. Pujian
Pujian yang diungkapkan pada waktu yang tepat dapat
dijadikan sebagai alat motivasi.
8. Hukuman
Meskipun hukuman menjadi reinforcement yang negatif,
tetapi bila dilakukan dengan tepat dan bijak merupakan alat
motivasi yang baik dan efektif.
9. Hasrat untuk belajar
Hasrat untuk belajar berarti pada diri anak didik itu memang
ada motivasi untuk belajar. Sehingga sudah barang tentu
hasilnya akan lebih baik pada anak didik yang tidak
berhasrat untuk belajar.
10. Minat
Minat merupakan alat evaluasi yang utama yang dapat
membangkitkan kegairahan belajar anak didik dalam
rentang waktu tertentu.
11. Tujuan yang diakui
Rumusan tujuan yang diakui dan diterima dengan baik oleh
anak didik merupakan alat motivasi yang sangat penting.
Sebab dengan memahami tujuan yang harus dicapai,

16
dirasakan anak sangat berguna dan menguntungkan
sehingga menimbulkan gairah untuk terus belajar.
Based on the explanation from expert above, it can be concluded
that the strategies to develop students` motivation consist of give
score to students, present, competition, ego involvement, give some
tests, reveal the score, give compliment to students, give punishment
to students, desire to learn, interests, and goals to be achieved can
develop Students` Motivation because they know what they want and
they will try to achieve it.
d. Indicators of Students` Motivation
Based on Djaali (2008:109-110) written that a person who has
high Motivation tends to have these characteristics below:
1) Menyukai situasi atau tugas yang menuntut tanggung jawab
pribadi atas hasil-hasilnya dan bukan atas dasar untung-
untungan, nasib, atau kebetulan.
2) Memilih tujuan yang realistis tetapi menantang dari tujuan
yang terlalu mudah dicapai atau terlalu besar resikonya.
3) Mencari situasi atau pekerjaan dimana ia memperoleh
umpan balik dengan segera dan nyata untuk menentukan
baik atau tidaknya hasil pekerjaannya.
4) Senang bekerja sendiri dan bersaing untuk mengungguli
orang lain.
5) Mampu menangguhkan pemuasan keinginannya demi masa
depan yang lebih baik.
6) Tidak tergugah untuk sekadar mendapatkan uang, status,
atau keuntungan lainnya, ia akan mencarinya apabila hal-
hal tersebut merupakan lambang prestasi, suatu ukuran
keberhasilan.
Based on the explanation from expert above, it can be concluded
that Motivation is tendency in students to do some activities as best as

17
they could in learning activities with the aim that high achievement
can be achieved.
Students who have those indicators above can be categorized as
motivated students, because they always try to find out new thing,
responsible to the assessment, eager to compete, high willingness in
learning, not easy to get satisfied, and do the assessment individually.
From the explanation above could be set as indicators of Students`
Motivation.
3. Parents Education Level
According to Fuad Ihsan (2003: 5) education can be described as
follows:
1) Suatu proses pertumbuhan yang menyesuaikan dengan
lingkungan;
2) Suatu pengarahan dan bimbingan yang diberikan kepada anak
dalam pertumbuhannya;
3) Suatu usaha sadar untuk menciptakan suatu keadaan atau
situasi tertentu yang dikehendaki oleh masyarakat;
4) Suatu pembentukan kepribadian dan kemampuan anak dalam
menuju kedewasaan.
Education can be concluded as process to adapt to the environment
with a conscious effort to create a better state, and the formation of
personality and ability to get certain maturity stage. Education of children
should be considered by their parents because they can give some
suggestions and guidance.
The role of parents at home is as role model, shaping the way of
students` mindset to get the students` decision. This is in accordance with

18
Ngalim Purwanto`s (2010: 104) statement:
“Ada keluarga yang terdiri dari ayah-ibu yang terpelajar dan ada
pula yang kurang terpelajar. Ada keluarga yang mempunyai cita-
cita tinggi bagi anak-anaknya, ada pula yang biasa saja. Suasana
dan keadaan keluarga yang bermacam-macam itu mau tidak mau
turut menentukan bagaimana dan sampai di mana belajar dialami
dan dicapai oleh anak-anak.”
Each level of education taken by parents will distinguish each
students decision to pursue their study to Higher Education.
Levels of education in Indonesia can be classified into primary
education, secondary education, and higher education. Fuad Ihsan stated
that (2003: 18) “Tingkat atau jenjang pendidikan adalah tahap pendidikan
yang berkelanjutkan yang ditetapkan berdasarkan tingkat perkembangan
peserta didik, tingkat kerumitan bahan pengajaran dan cara menyajikan
bahan pengajaran.” It can be concluded that levels of education is a
continous phase which is in development based on the level of ability of
students and usually begins at the stage of primary education.
Pendidikan dasar merupakan jenjang pendidikan yang melandasi
jenjang pendidikan menengah. Pendidikan dasar berbentuk Sekolah
Dasar (SD) dan Madrasah Ibtidaiyah (MI) atau bentuk lain yang
sederajat serta Sekolah Menengah Pertama (SMP) dan Madrasah
Tsanawiyah (MTs), atau bentuk lain yang sederajat. (Undang-
undang No. 20 Tahun 2003 Pasal 17 ayat 1 dan 2 about Sistem
Pendidikan Nasional)
Based on Fuad Ihsan (2003: 22) “Pendidikan dasar adalah
pendidikan yang memberikan pengetahuan dan keterampilan,
menumbuhkan sikap dasar yang diperlukan dalam masyarakat, serta
mempersiapkan peserta didik untuk mengikuti pendidikan menengah.”

19
Based on explanation from the expert above, it can be concluded
that primary education is a level of education which provides basic
knowledge and skills and prepare its students to enter the Secondary
Education.
Pendidikan menengah merupakan lanjutan pendidikan dasar.
Pendidikan menengah terdiri atas pendidikan menengah umum dan
pendidikan menengah kejuruan. Pendidikan menengah berbentuk
Sekolah Menengah Atas (SMA), Madrasah Aliyah (MA), Sekolah
Menengah Kejuruan (SMK), dan Madrasah Aliyah Kejuruan (MAK),
atau bentuk lain yang sederajat. (Undang-undang No. 20 Tahun
2003 Pasal 18 ayat 1, 2 and 3 about Sistem Pendidikan Nasional)
According to Fuad Ihsan (2003: 23) “Pendidikan menengah adalah
pendidikan yang mempersiapkan peserta didik menjadi anggota
masyarakat yang memiliki kemampuan mengadakan hubungan
timbal-balik dengan lingkungan sosial budaya, dan alam sekitar,
serta dapat mengembangkan kemampuan lebih lanjut dalam dunia
kerja atau pendidikan tinggi.”
Based on explanation above, it can be concluded that Secondary
education is an advanced level of primary education. Secondary education
conducted in Indonesia consist of senior high school and vocational
school. In this level, students are prepared to enter the Higher Education.
Pendidikan tinggi adalah pendidikan yang mempersiapkan peserta
didik untuk menjadi anggota masyarakat yang memiliki tingkat
kemampuan tinggi yang bersifat akademik dan atau profesional
sehingga dapat menerapkan, mengembangkan dan/atau
menciptakan ilmu pengetahuan, teknologi dan seni dalam rangka
pembangunan nasional dan meningkatkan kesejahteraan manusia.
Based on Fuad Ihsan (2003: 23)
Pendidikan tinggi merupakan jenjang pendidikan setelah pendidikan
menengah yang mencakup program pendidikan diploma, sarjana,
magister, spesialis, dan doktor yang diselenggarakan oleh
perguruan tinggi. Pendidikan tinggi diselenggarakan dengan sistem
terbuka. (Undang-undang No. 20 Tahun 2003 Pasal 18 ayat 1 dan 2
about Sistem Pendidikan Nasional)

20
Based on explanation above, it can be concluded that higher
education is an advanced level of secondary education. In this level,
students are equipped with the knowledges and skills so that they can
participate in national development.
The meaning of Parents Education Level is the level of education
that have been taken by parents through formal education organized by
schools and Higher Educations. It is consist of SD, SMP,
SMA/MA/SMK/MAK, D1, D2, D3, S1, S2, S3.
B. Relevant Researches
1. The research, entitled "Hubungan Tingkat Pendidikan Orang Tua dan
Prestasi Belajar Siswa Dengan Minat Siswa Melanjutkan Studi ke
Perguruan Tinggi pada Siswa Kelas XI SMA Negeri 1 Kalasan Tahun
Ajaran 2011/2012" by Esti Setya Rini was conducted in 2012. This
research showed that there was positive and significant correlations
between Parents Education Level towards Interest of Students in
Pursuing Their Study to Higher Education in Grade XI in SMA Negeri 1
Kalasan in Academic Year of 2011/2012. Based on the data obtained
correlation coefficient rx1y of 0.388 (rx1y of 0.388 > rtable 5% of
0.195). Furthermore, there was a positive and significant correlation
between Learning Achievement towards the Interest Students in Pursuing
Study of the Higher Education in Grade XI at SMA Negeri 1 Kalasan in
Academic Year of 2011/2012 were indicated by the correlation
coefficient rx2y of 0,618 (rx2y of 0.618 > rtable 5% of 0.195). Finally, there

21
was a positive and significant correlation between the Parents Education
Level and Learning Achievement together towards Interest in Pursuing
Study in Grade XI SMA Negeri Kalasan 1 in Academic Year of
2011/2012. Based on the analysis, obtain the correlation coefficient (R)
0.683, coefficient of determination (R)2 at 0.457 and Fcalc at 48.152
(Fcalc by 48, 152 > Ftable 5% of 4.82). The similarity in a research
conducted by Esti Setya Rini was Parents Education Level variable with
Interests in Pursuing Study to Higher Education. Meanwhile, differences
in the research held by Esti Setya Rini with research conducted by the
researchers was variable X2 (Learning Achievement) and the research
place was in SMA Negeri 1 Kalasan, whereas in this research the
variable X2 Students` Motivation, the research place in SMA N 1
Bukateja.
2. The research, entitled "Hubungan antara Motivasi Berprestasi, Status
Sosial Ekonomi Orang Tua dan Lingkungan Teman Sebaya dengan
Minat Melanjutkan Studi ke Perguruan Tinggi pada Siswa Kelas XI
Jurusan IPS MAN Yogyakarta II Tahun Ajaran 2009/2010" by Agustin
Mursinandi was conducted in 2010. The research shows that there was
positive and significant correlations between Achievement Motivation
towards Interest Pursuing Study to Higher Education in Grade XI Social
Science MAN Yogyakarta II in Academic Year of 2009/2010. Based on
the data obtained correlation coefficient rx1y of 0.589 (rx1y of 0.589 >
r table 5% of 0.220). Then compared the Socioeconomic Status of Parents

22
towards Interests in Pursuing Their Study to Higher Education in Grade
XI Social Science MAN Yogyakarta II Academic Year of 2009/2010
showed there was a positive and significant correlation coefficient
indicated by rx2y of 0.358 (rx2y of 0.358 > r table 5% of
0.220). Furthermore, there was a positive and significant correlation
between the Interest Environmental Peers towards Interests in Pursuing
Study to Higher Education on Students Grade XI Social Science MAN
Yogyakarta II Academic Year of 2009/2010. Based on the data obtained
correlation coefficient rx3y of 0.603 (rx3y of 0.603 > rtable 5% of 0.220).
Finally, there was a positive and significant correlation between
Achievement Motivation, Socioeconomic Status of Parents and Peers
Environment together towards the Interests of Pursuing Study to Higher
Education in Grade XI Social Science MAN Yogyakarta II in Academic
Year of 2009/2010. Based on the correlation coefficient (R) 0.734,
coefficient of determination (R)2
0.539 and Fcalc equal to 28.418
(Fcalc amounted to 28.418 > Ftable 5% of 2.72). The similarity in a
research conducted by Agustin Mursinandi was Students` Motivation
variable with Interests in Pursuing Their Study to Higher
Education. Meanwhile, differences in the research by Agustin
Mursinandi with a research conducted by researcher was Socioeconomic
Status of Parents and Peers environment variable, where research was
conducted MAN Yogyakarta II, whereas in this research the Variable is
Parents Education Level, research place in SMA N 1 Bukateja.

23
3. The research, entitled "Hubungan Antara Motivasi Berprestasi, Status
Sosial Ekonomi Orang Tua dan Lingkungan Teman Sebaya Dengan
Minat Melanjutkan Studi ke Perguruan Tinggi pada Siswa Kelas XII
Program Keahlian Akuntansi SMK YPKK 1 Sleman Tahun Ajaran
2007/2008" by Candra Efrida Kurniawati was conducted in 2008. This
research showed that there was positive and significant correlations
between Achievement Motivation with interest in Pursuing Studies to
Higher Educationin Grade XII Accounting Expertise Program SMK
YPKK 1 Sleman Academic Year of 2007/2008, it was indicated by the
correlation coefficient rx1y of 0.292 (rx1y of 0.292 > rtable 5% of
0.202). Furthermore, there was a positive and significant correlation
between Socioeconomic Status of Parents towards Interests in Pursuing
Study to Higher Education in Grade XII Accounting Expertise Program
SMK YPKK 1 Sleman Academic Year of 2007/2008 are indicated by the
correlation coefficient rx2y of 0.221 (rx2y of 0.6221 > rtable 5% of
0.202). Next, there was a positive and significant correlation between the
Peer Environment towards Interests in Pursuing Study to Higher
Education in Grade XII Accounting Expertise Program SMK YPKK 1
Sleman in Academic Year of 2007/2008. Based on the analysis of the
correlation coefficient obtained rx3y of 0.213 (rx3y of 0.213 > rtable 5% is
0.202). Finally there was a positive and significant relationship between
Achievement Motivation, Socioeconomic Status of Parents and Peers
Environment together with interest in Pursuing Study to Higher

24
Education in Grade XII Accounting Expertise Program SMK YPKK 1
Sleman Academic Year of 2007/2008. Based on the data obtained (R) of
0.399, the coefficient of determination (R)2 at 0.159 and Fcalc equal
to 5.629 (Fcalc of 5.629 > Ftable 5% of 0.271).
C. Research Framework
1. Relationship between Parents` Education Level towards Students`
Interests in Pursuing Their Study to Higher Education.
There are formal education and non-formal education held in
Indonesia. Formal education is education organized officially by the
school, including kindergarten, elementary school, Junior High School,
Senior High School or Vocational School, until the University level. While
the non-formal education is the education gained from training or courses
on specific fields.
The interest of a child can be influenced by Parents` Education
Level, it can not be denied the role of parents in guiding and directing the
children in creating the mindset of the children's interest. It is assumed that
the higher education have been taken from their parents, will make the
perspectives and ways of looking at a matter of being more open and more
focused, which is expected to provide assistance to their children by
providing guidance on the children to pursue their studies to Higher
Education according to their ability and interests.

25
2. Relationship between Students` Motivation towards Students` Interests in
Pursuing Their Study to Higher Education.
Students` motivation is high willingness within students to be better
and try to achieve the highest result. Students` Motivation is one of factor
that affect the Interest in Pursuing Study to Higher Education.
Every students has different Motivation. Students with high
Motivation have expectation to success in the future, they will never be
satisfied just stop at a certain point, they will tend to pursue their study
after completing study in high school or vocational school to the higher
level because they eager to compete, doing assignment and have realistic
purposes. It can be happen if the students pursue their study to higher
education, so high Motivation has role in affecting the Students` Interest in
Pursuing Study to Higher Education.
3. Relationship between Parents` Education Level and Students` Motivation
toward Students` Interests in Pursuing Their Study to Higher Education.
There are many factors that might impact Interest in Pursuing
Studies to Higher Education. Among the factors that influence it there are
Parents Education Level and Students` Motivation. As already described
above, the high and low level of education of parents will play a role in
providing advice and guidance to their children to pursue their studies to
Higher Education level.
The high of students motivation will make them do their best in
learning, because mastering knowledge and practicing skills are the

26
target. They tend to be thirsty for knowledge and want to pursue their
education to a higher level, in this case is from High School to University.
The level of parents` education could affect the perspective of
parents to guide their children to continue improving their science and also
supported from children ability and has high achievement motivation. It
will be able to encourage students to pursue their studies to Higher
Education. Every parents expect their children to go beyond the level of
education that has been taken by them and get a better job in the future.
Hence, they would encourage their children to pursue their
studies. However, if the parents do not support their children because of
their low level of education and the low of motivation from the children,
they will tend to get low interest to pursue their studies to Higher
Education.
D. Research Paradigm
Based on the framework above, the research paradigm can be described
as follows:
Figure 1. Relationship among Variables
X1 = Parents` Education Level Variable
X2 = Students` Motivation Variable

27
Y = Students` Interest in Pursuing Their Study to Higher
EducationVariable
= Relationship between Parents` Education Level and Students`
Motivation together toward Students` Interest in Pursuing Their
Study to Higher Education.
= Relationship between the Parents` Education Level partially
towards Students` Interest in Pursuing Their Study to Higher
Education.
Relationship between Students` Motivation partially towards
Students` Interest in Pursuing Their Study to Higher Education.
E. Research Hypothesis
From the description of the theory and framework, it can be proposed
hypotheses to be tested in this research are:
1. There is a positive relationship between Parents` Education Level
towards Students` Interest in Pursuing Their Study to Higher Education.
2. There is a positive relationship between Students` Motivation towards
Students` Interest in Pursuing Their Study to Higher Education.
3. There is a positive relationship between Parents` Education Level and
Students` Motivation together toward Students` Interest in Pursuing
Their Study to Higher Education.

28
CHAPTER III
RESEARCH METHODS
A. Place and Time Research
The research was conducted in SMA Negeri 1 Bukateja which is located
at Purwandaru Street, Bukateja, Purbalingga, Central Java, while the data
collection was conducted in March 1-2, 2013.
B. Research Design
This research is a causal comparative research. According Suharsimi
Arikunto (2000: 329), “Penelitian kausal komparatif adalah penelitian yang
mencoba mengetahui perbedaan hubungan sebab-akibat yang ada pada dua
kelompok atau lebih.” This research is an ex-post facto research because it is
done to find out the phenomenon that already happen and reveal the real
condition without any direct intervention from the researcher. This research
used a quantitative approach. The data then being studied and analyzed in the
form of statistical analysis.
C. Research Variables
Research variable is an object that has a variation between an object with
another object (Sugiyono, 2010: 60). In this research, there are two variables,
i.e. independent variable and dependent variable.
The independent variable is a variable that is not bound and led the
dependent variable. While the dependent variable is a variable that is bound
or affected by the independent variable. They are:

29
1. The Independent Variables in this research are a Parents` Education
Level, noted as X1 and Students` Motivation noted as X2
2. The Dependent Variable in this research is Students` Interest in Pursuing
Study to higher Education noted as Y.
D. Operational Definition of Variables
To reduce the occurrence of errors in the interpretation of the variables
used in this research, the researcher make restriction on the definition of each
variables as follows:
1. Students` Interest in Pursuing Their Study to Higher Education
Interest is the high tend and the great desire in something. Students`
Interest in Pursuing Studies to Higher Education is a great willingness of
the student which encouraged him to pursue education after Secondary
Education, that is Higher Education. Interest to pursue studies arises
because there is a great desire to improve academic knowledge and skills.
The indicator of Interest in Pursuing Studies to Higher Education are the
existence of feelings such as happiness, interests, willingness, hope,
encouragement, and suitability. Interest in Pursuing Studies to Higher
Education can be seen by measuring the opinions given by the
respondents.
2. Parents` Education Level
Parents` education level is the level of education that has been taken
by the parents through formal education, started from Elementary School,
Junior High School, Senior High School or Vocational School up to

30
University level. The data of Parents` Education Level can be obtained by
using a questionnaire. The assumption is that higher education levels taken
by parents affect the way in guiding and directing children in terms of
education, whether after the graduation they will work or pursue their
studies to Higher Education. The indicators of this variable are the levels
of education taken by the Parents.
3. Students` Motivation
Motivation stated by Mc Donald (in Oemar Hamalik, 2011) is an
energy changing within the person characterized by affective arousal and
anticipatory goal reaction. Related to Students` Motivation is the energy
changing in student characterized by the rise of the reaction to reach a
particular target in the process of learning. This energy changing are
indicated by the needs to know new thing, responsible to the assessment,
eager to compete, high willingness in learning, not easy to get satisfaction
with the result, and do the assessment individually.
E. Population
The population in this research are all students in Grade XI Social
Science SMA Negeri 1 Bukateja in Academic Year of 2012/2013. Arikunto
state that (2010: 130) ”Populasi adalah keseluruhan subjek penelitian. Jika
seseorang ingin meneliti semua elemen yang ada dalam wilayah penelitian,
maka penelitiannya merupakan penelitian populasi atau studi populasi”.
Grade XI Social Science SMA Negeri 1 Bukateja consist of 126 students and
they divided into 4 classes.

31
Table 1. Research Population
Source: Primary data 2013
F. Data Collection Technique
1. Interview
technique of interview is used to obtain information about students related
to their parents` jobs, and their support to the children to continue their
studies to Higher Education.
2. Questionnaire
Techniques used in this research is Questionnaire. Based on
Sugiyono (2010: 199), “Kuesioner merupakan teknik pengumpulan data
yang dilakukan dengan cara memberi seperangkat pertanyaan atau
pernyataan tertulis kepada responden untuk dijawabnya.” Questionnaire
that used in this research was closed questionnaire, the answer choices are
included in the questionnaire in order to facilitate students in their
assessments. Technique of collecting data to obtain informations about
the Interest of the Grade XI Social Science SMA N 1 Bukateja in
Pursuing Their Study to Higher Education in Academic Year of 2012 /
2013, Parents Education Level of the Grade XI Social Science SMA N 1
Bukateja Academic Year of 2012/2013, and Students` Motivation of the
No Class Population
1 XI IPS 1 32
2 XI IPS 2 30
3 XI IPS 3 32
4 XI IPS 4 32
126Total

32
Grade XI Social Science SMA N 1 Bukateja Academic Year of
2012/2013 used a questionnaire.
G. Data Collection Instruments
1. Questionnaire
There are three research instruments, i.e the instruments to determine
the Parents` Education Level, Students` Motivation and Interest in
Pursuing Study to Higher Education.
The numbers of score below, indicates the score of education level
have been through by the parents, when parents of students do not finish
in a certain level of education, then the level of education used for this
research is the level of education have been passed. The score used in
this research is the score of father`s and mother`s education level of the
student summed. To find the Parents Education Level variable use this
scoring guidelines:
Table 2. Score of Parents` Education Level
Adapted from Nurkosim S2 thesis (2012).
NoParents` Education
Level
Primary
Education
Secondary
Education
Higher
EducationScore
1 SD/MI Primary - - 2
2 SMP/MTs Primary - - 3
3 SMA/SMK - Secondary - 4
4 D1 - - Higher 5
5 D2 - - Higher 6
6 D3 - - Higher 7
7 S1 - - Higher 8
8 S2 - - Higher 9
9 S3 - - Higher 10
33
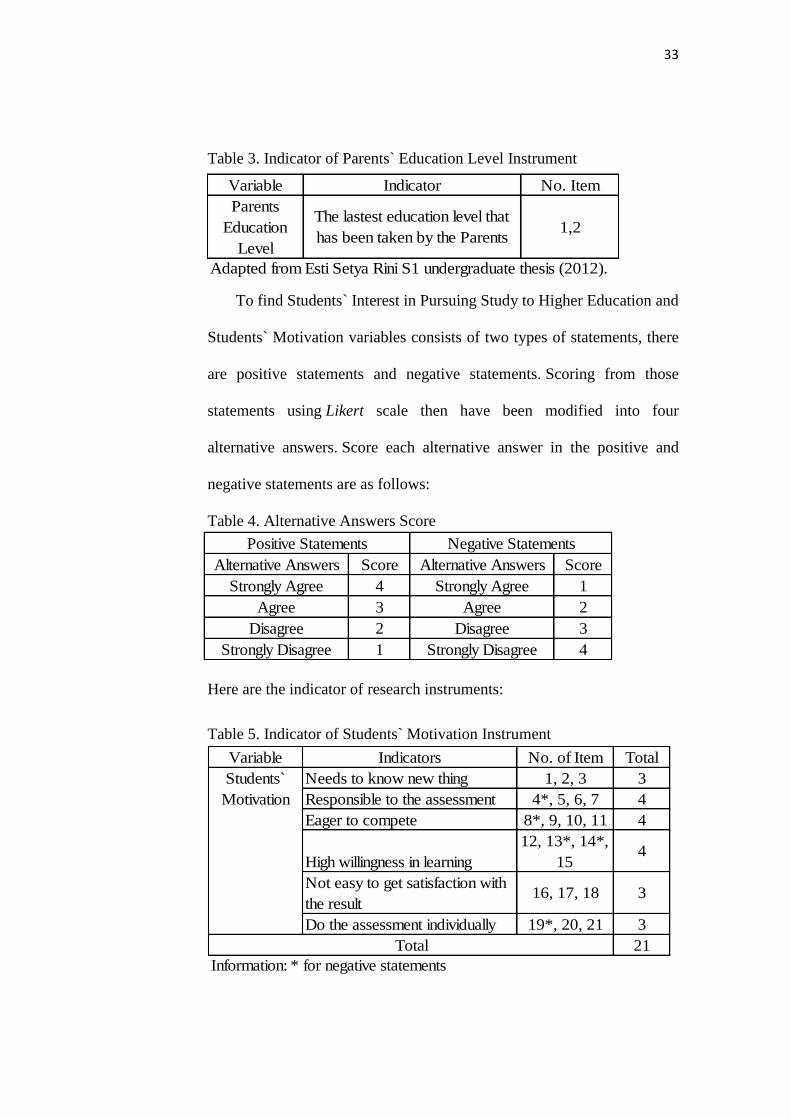
Table 3. Indicator of Parents` Education Level Instrument
To find Students` Interest in Pursuing Study to Higher Education and
Students` Motivation variables consists of two types of statements, there
are positive statements and negative statements. Scoring from those
statements using Likert scale then have been modified into four
alternative answers. Score each alternative answer in the positive and
negative statements are as follows:
Table 4. Alternative Answers Score
Here are the indicator of research instruments:
Table 5. Indicator of Students` Motivation Instrument
Alternative Answers Score Alternative Answers Score
Strongly Agree 4 Strongly Agree 1
Agree 3 Agree 2
Disagree 2 Disagree 3
Strongly Disagree 1 Strongly Disagree 4
Positive Statements Negative Statements
Variable Indicator No. Item
Parents
Education
Level
The lastest education level that
has been taken by the Parents1,2
Adapted from Esti Setya Rini S1 undergraduate thesis (2012).
Variable Indicators No. of Item Total
Needs to know new thing 1, 2, 3 3
Responsible to the assessment 4*, 5, 6, 7 4
Eager to compete 8*, 9, 10, 11 4
High willingness in learning
12, 13*, 14*,
154
Not easy to get satisfaction with
the result16, 17, 18 3
Do the assessment individually 19*, 20, 21 3
21
Information: * for negative statements
Students`
Motivation
Total

34
Table 6. Indicator of Students` Interest in Pursuing Their Study to Higher
Education Instrument.
H. Validity and Reliability Test
Before the instrument used, it will be tested first in order to obtain a good
instrument. The test instrument was conducted in Grade XI Social Science
SMA Negeri 2 Purbalingga academic year of 2012/2013, consists of 32
students. The reason researcher choose that school because both of school are
favourite in Purbalingga and located in the same residence. Both of school
judged by Parents` Education Level and Students` Motivation are almost the
same.
a. Validity Test
Validity test is a measurement that shows the level of the thruthness
from the instruments. This validity test using the formula developed by
Pearson that known as product moment correlation. Here is the formula
of product moment:
–
√
Variable Indicators No. of Item Total
Happiness 1, 2, 3 3
Interests 4, 5*, 6* 3
Willingness 7, 8 2
Hope 9, 10, 11 3
Encouragement 12, 13, 14 3
Suitability 15, 16 2
16Total
Adapted from Agustin Mursinandi S1 undergraduate thesis (2010).
Interest in
Pursuing
Study to
Higher
Education

35
Keterangan:
r xy = koefisien korelasi
N = Jumlah subyek
ΣXY = Jumlah perkalian skor butir dan skor total
Σ X = Jumlah skor butir
Σ Y = Jumlah skor total
Σ X 2 = Jumlah kuadrat dari skor butir
Σ Y 2 = Jumlah kuadrat dari skor total
(Suharsimi Arikunto, 2010 : 213)
In this research, correlations were calculated using SPSS Statistics
18.0 for Windows. The statement state is valid if rcalc is greater than
rtable that the significance level of 5%. The statement state disqualified if
rcalc is less than rtable.
b. Reliability Test
After testing the validity of the instrument, and then conducted test
on the reliability of the instrument using Cronbach Alfa techniques. The
formula used is Alfa formula:
(
) (
)
Keterangan:
r11 = Reliabilitas instrumen
k = Banyaknya butir pertanyaan
= Jumlah varians butir
= Varians total
(Suharsimi Arikunto, 2010: 239)
After the test is done, it can be seen the high and low reliability
coefficient. Furthermore, interpreting the results of the testing instrument
using the following guidelines:

36
Table 7. Correlation Coefficient Interpretation Guidelines
(Sugiyono, 2010: 257)
From the guidelines for interpretation of correlation coefficients
above, it can be concluded that the questionnaire state is reliable if its
reliability level has a minimum score of 0.60.
I. Data Analysis Techniques
1. Data Description
a. Constructing a frequency distribution table based on the Sugiyono
(2007: 35-37), as follows:
1) Calculating Class Interval (Sturges Formula)
K = 1 +3.3 log. n
Keterangan:
K = Jumlah Kelas interval
n = Jumlah data observasi
log = logaritma
2) Calculating Data Range
Data Range = (Maximum Score –Minimum Score)
3) Calculating the Length of Class Interval
Length of the Class
b. Presenting the data in the form of a bar graph and tables.
Interval Koefisien Tingkat Hubungan
Sangat Rendah
Rendah
Sedang
Kuat
Sangat Kuat0,80 - 1,000
0,40 - 0,599
0,60 - 0,799
0,20 - 0,399
0,00 - 0,199

37
c. Calculating Central Tendency, which includes: Mean (M), Median
(Me) and the modus (Mo).
1) Mean is the average value. The formula for calculating the data that
has been compiled in a frequency distribution is:
Keterangan:
Me = Mean
Σfi = Jumlah data
Fixi = produk perkalian antara fi pada tiap interval data dengan
kelas (xi). Tanda kelas xi adalah rata-rata dari batas bawah
dan batas pada setiap interval data.
(Sugiyono, 2007: 54)
2) The median is a value limit 50% of the frequency distribution of
the upper and the lower.
*
+
Keterangan:
Md = Median
b = Batas bawah, di mana median akan terdekat
n = Banyak data
p = Panjang kelas interval
F = Jumlah semua frekuensi sebelum kelas median
f = Frekuensi kelas median
(Sugiyono, 2007: 53)
3) Modus is the value that has the highest frequency in the
distribution.
*
+
Keterangan:
Mo = Modus
b = Batas kelas interval dengan frekuensi terbanyak
p = Panjang kelas interval dengan frekuensi terbanyak

38
b1 = Frekuensi kelas modus dikurangi kelas terdekat
sebelumnya
b2 = Frekuensi kelas modus dikurangi kelas terdekat
berikutnya
(Sugiyono, 2007: 52)
d. Counting the variability with calculating the standard deviation using
the formula:
√
Keterangan:
S = Standar deviasi
n = Jumlah data
xi - x = Simpangan
(Sugiyono, 2007: 58)
Further description is categorized scores of each variable. Then
scores are divided into three categories. Categorization is based on
Mean ideal (Mi) and Standard Deviation ideal (SDi). Mi and SDi
formula is as follows:
Mi = ½ (Xmax + Xmin)
SDi = 1/6 (Xmax - Xmin)
Categories of variables are as follows:
Table. 8 Categories of variables
(Saifuddin Azwar, 2011: 109)
Rentang Nilai (Skor) Kategori
X < (Mi - 1.SDi) Rendah
(Mi - 1.SDi) ≤ (Mi + 1.SDi) Sedang
(Mi + 1.SDi) ≤ X Tinggi

39
2. Prerequisite Test Analysis
Before performing data analysis, first it is conducted a prerequisite test
analysis. Each prerequisite test analysis are described below:
a. Linearity Test
Linearity test performed to determine whether the independent
variables with the dependent variable has linear relation or
not. Linearity test in this research using the following formula:
e e
es
Keterangan:
Freg = harga untuk garis regresi
RKreg = rerata kuadrat
RKres = rerata kuadrat residu
(Sutrisno Hadi, 2004: 13)
In this research the researchers used SPSS Statistics 18.0 for
Windows for help calculating linearity test by looking at the p-
value Deviation from linierity. The p-value ≥ 0.05 the independent
variable (X) with the dependent variable (Y) state as linear and if
the p-value ≤ 0.05, it means the variable is not linear.
b. Multicollinearity Test
In a test of multicollinearity between variables X demands that
there should not be a very high correlation. If the rcalc ≥ 0.800, the
research can not continue and must use other parameters. The
parameters are for non-linear regression. In calculating
multicollinearity using product moment correlation formula,
researcher calculate the correlation between variables X.

40
–
√
Keterangan:
r xy = koefisien korelasi
N = Jumlah subyek
ΣXY = Jumlah perkalian skor butir dan skor total
Σ X = Jumlah skor butir
Σ Y = Jumlah skor total
Σ X 2 = Jumlah kuadrat dari skor butir
Σ Y 2 = Jumlah kuadrat dari skor total
(Suharsimi Arikunto, 2010 : 213)
3. Hypothesis Test
a. Simple Correlation Analysis
This analysis is used to measure the relationship between the
Parents Education Level towards Interest in Pursuing Study to Higher
Education (hypothesis 1), determine the relationship between the
Students` Motivation towards Interest in Pursuing Study to Higher
Education (hypothesis 2). Researcher use Product Moment correlation
analytical techniques of the Pearson with the following formula:
–
√
Keterangan:
r xy = koefisien korelasi
N = Jumlah subyek
ΣXY = Jumlah perkalian skor butir dan skor total
Σ X = Jumlah skor butir
Σ Y = Jumlah skor total
Σ X 2 = Jumlah kuadrat dari skor butir
Σ Y 2 = Jumlah kuadrat dari skor total
(Suharsimi Arikunto, 2010 : 213)

41
To test the significance of the correlation coefficient the price of
rcalc compared to rtable with a significance level of 5%, if r calc ≥
from rtable, the correlation between the variables X and Y are
significant, but if the rcalc < of r table, the correlation between variables
X and Y are not significant.
b. Multiple Correlation Analysis
This analysis is used to test the third hypothesis, using multiple
correlation analysis with two predictors. The formula used is as
follows:
1) Multiple Correlation Coefficient
√
Keterangan:
Ryx1x2 = Korelasi antara variabel X1 dengan X2 secara bersama-
sama dengan Y
Ryx1 = Korelasi Product moment antara X1 dengan Y
Ryx2 = Korelasi Product moment antara X2 dengan Y
Rx1x2 = Korelasi Product moment antara X1 dengan X2
(Sugiyono, 2007: 233)
2) Testing the Doubles Correlation Significance with F Test
⁄
⁄
Keterangan:
R = Koefisien korelasi ganda
k = Jumlah variabel independen
n = jumlah anggota sampel
(Sugiyono, 2007: 235)

42
Price of Fcalc compared to the Ftable with dk numerator = k, and df
denominator = (n - k - 1). With a significance level of 5%, if the Fcalc ≥
or equal to Ftable then significant, while if Fcalc ≤ table then it is not
significant.

43
BAB IV
RESEARCH RESULT AND DISCUSSION
A. Research Result
1. General Data Description
SMA N 1 Bukateja is one of senior high schools that located in
Purbalingga city, it is located in Purwandaru Street, zip code 53382, phone
number (0286) 476186. SMA N 1 Bukateja conduct two department there
are Social Science and Natural Science.
a. Physical Potential
SMA N 1 Bukateja located in an area of 14.878 m2 and the building
5490 m2. Infrastructure administration section is responsible for the
physical condition of the school. SMA N 1 Bukateja has 24 classrooms
consist of 9 classrooms for grade X, 6 classrooms for grade XI, for
Natural Science there are 2 classrooms, and for Social Science there are 4
classrooms, while for grade XII there are 9 classrooms, 4 classrooms for
Natural Science, and 4 classrooms for Social Science.
There are a lot of rooms available in SMA N 1 Bukateja except
those used as classroom such as; 1 Headmaster room, 1 Teacher room, 1
Administration room, 1 Curriculum room, 1 Library, 1 Praying room, 1
Counseling room, 1 Meeting room, 5 Canteen, 1 Medical room, 1
Security room, 6 Parking lots, 1 OSIS room, 24 Rest rooms. There are 6
rooms that consist of Biology, Physics, Chemical, Bahasa and 2
Computer laboratories.

44
b. Student Potential
SMA N 1 Bukateja consisted of 770 students that distributed to 293
students for grade X, 199 students for grade XI, and 278 students for
grade XII.
SMA N 1 Bukateja are conducted a lot of extracurriculars to
support and develop the academic skills and nonacademic skills of the
students. The extracurriculars that held in this school are such as PMR,
PKS, dance class, music class, English club, volleyball, basketball,
Indonesian literature, athletics, pencak silat and many other.
c. Teacher Potential
There are 49 teachers in SMA N 1 Bukateja, 96 % of the teachers
have been graduated in bachelor degree (S1), and only the Headmaster
that have been graduated in master degree (S2). The teachers that have
been certified consist of 36 teacher or 73 % from the total of the teachers
in SMA N 1 Bukateja.
SMA N 1 Bukateja cannot recruit employees themselves, as stated
on the Act on teachers and lecturers. Hiring employees or teachers should
be done through the selection and recruitment held by the government.
d. Employee Potential
Employees that hired in SMA N 1 Bukateja are employees who
uses decree of the Government in the recruitment. The minimum
requirement for the employees are should graduate from Junior High
School (SMP).

45
The employees hired in SMA N 1 Bukateja should fulfil these
criterias such as responsible in job, obeying the rules, honesty, teamwork,
loyalty, etc.
2. Specific Data Description
To order to examine the effect of independent variables on the
dependent variable, in this section are presented the data descriptions of
each variable based on the data obtained in the field. The data was collected
in March 2, 2013. The subject of this research are all students of grade XI
Social Science SMA N 1 Bukateja academic year of 2012/2013 that consist
of 126 student. The subject of this research are described in table form
below:
Table 9. Research Subjects
Source: Primary data 2013
The data that acquired in the school presented in the form of
description from the data of each variables, they are independent variable
and dependent variable. In this research the data was collected using
questionnaire to measure the Parents` Education Level, Students`
Motivation, and Students` Interest in Pursuing Their Study to Higher
Education. In the questionnaire that used in this research consist of 33
statements that already tested for validity and reliability.
No IndikatorTotal skor
Penilaian
persentase
(%)
1kemudahan dalam penyampaian
materi40 12,05
2Adanya solusi atas keterbatasan
dalam pembelajaran51 15,36
3Terdapat variasi dalam
pembelajaran164 49,39
4Penilaian diri (self assessment)
oleh siswa38 11,45
5Tercapaianya prinsip pembelajaran
tuntas (mastery learning)39 11,75
332 100Jumlah
No Class Students
1 XI IPS 1 32
2 XI IPS 2 30
3 XI IPS 3 32
4 XI IPS 4 32
126Total

46
Analysis of the data from this research include Mean, Median,
Modus, Deviation Standard, Distribution Frequency Table, Graphs, and
Category Table of Tendency of each variables.
a. Students` Interest in Pursuing Their Study to Higher Education
The data of Students` Interest in Pursuing Their Study to Higher
Education variable obtained from questionnaire that consist of 14
statements. The highest score is 56 and the lowest score is 31. After the
data were analyzed using SPSS Statistics 18.0 For Windows Mean
obtained by 46,83; Median obtained by 48,00; Modus obtained by 51;
and Deviation Standard obtained by 5,820.
Frequency distribution of Students` Interest in Pursuing Their
Study to Higher Education variable can be obtained by using these steps:
1) Calculating Class Interval
Determining the class interval use formula by Sturges that is
class interval = 1 + 3,3 log n, which n are the total respondents.
Class Interval = 1 + 3,3 log n
= 1 + 3,3 log 126
= 1 + 3,3 (2,100370545)
= 1 + 6,931222799
= 7,931222799 rounded to 8
2) Calculating Data Range
Data Range = (Maximum Score –Minimum Score)

47
= 56 – 31
= 25
3) Calculating Length of the Class
Length of the Class
= 3,125 rounded to 4
Frequency Distribution of Students` Interest in Pursuing Their
Study to Higher Education variable can be seen in the table below:
Table 10. Frequency Distribution of Students` Interest in Pursuing Their
Study to Higher Education Variable
No Interval
Class
Absolute
Frequency
Relative
Frequency
(%)
Absolute
Cumulative
Frequency
Cumulative
Frequency
(%)
1. 31 – 34 5 3,97 5 3,97
2. 35 – 38 6 4,76 11 8,73
3. 39 – 42 15 11,91 26 20,64
4. 43 – 46 34 26,98 60 47,62
5. 47 – 50 20 15,87 80 63,49
6. 51 – 54 42 33,33 122 96,82
7. 55 – 58 4 3,18 126 100
8. 59 – 62 0 0 0 0
Total 126 100 126 100
Source: Primary data 2013
Based on the frequency distribution table of Students` Interest in
Pursuing Their Study to Higher Education variable above can be
described as follows:

48
Source: Primary data 2013
Figure 2. Students` Interest in Pursuing Their Study to Higher Education
Histogram.
According to the data above can be created distributions tendency
of Students` Interest in Pursuing Their Study to Higher Education
variable that start with calculating the ideal Mean (Mi) and ideal
Standard Deviation (SDi). Students` Interest in Pursuing Their Study to
Higher Education measured by 14 statements with scale 1 to 4. Based on
those 14 statements, the highest score is (14 x 4) = 56 and the lowest
score is (14 x 1) = 14. Based on those data obtained that ideal Mean (Mi)
and the ideal Deviation Standard (SDi) calculated as follow:
Mi =
(ideal highest score + ideal lowest score)
Mi =
(56 + 14)
Mi =
(70)
Mi =
SDi =
(ideal highest score - ideal lowest score)
SDi =
(56 – 14)

49
SDi =
(42)
SDi =
According to the data above the tendency of the Students` Interest
in Pursuing Their Study to Higher Education can be seen in the table
below:
Table 11. Identification of Students` Interest in Pursuing Their Study to
Higher Education Tendency
Source: primary data 2013
Table 12. Students` Interest in Pursuing Their Study to Higher Education
Category
Source: primary data 2013
According to the table above, it can be seen that the Students`
Interest in Pursuing Their Study to Higher Education in grade XI Social
Science SMA N 1 Bukateja at high category consist of 100 students
(79,40%), at medium category consist of 26 students (20,6%), and at low
category consist of 0 student (0%).
The tendency of Students` Interest in Pursuing Their Study to
Higher Education variable presented in Pie Chart form as follow:
No Formula Calculation Score Range Categories
1 X < (Mi - 1.SDi) X < 28 14 - 27,9 Low
2(Mi - 1.SDi) ≤ X
< (Mi + 1.SDi)28 ≤ X < 42 28 - 41,9 Medium
3 (Mi + 1.SDi) ≤ X 42 ≤ X 42 - 56 High
No Score Range f % Categories
1 14 - 27,9 0 0,00 Low
2 28 - 41,9 26 20,64 Medium
3 42 - 56 100 79,36 High

50
Source: Primary data 2013
Figure 3. Pie Chart of Students` Interest in Pursuing Their Study to
Higher Education Tendency.
b. Parents` Education Level Variable
The data of Parents` Education Level were obtained from the
questionnaire. It has 20 for the highest score and 4 is for the lowest score.
Based on the data of Parents` Education Level variable, it showed that
the highest score is 17 of the highest possible score achieved by 20, and
the lowest score is 4 of the lowest possible score achieved by 4. The
results of analysis using SPSS Statistics 18.0 For Windows program show
that the Mean obtained by 8,82; Median obtained by 8,00; Modus
obtained by 8,00; and Deviation Standard (SD) obtained by 3,467.
The frequency distribution of Parents` Education Level can be
obtained by using these steps:

51
1) Calculating Class Interval
Determining the class interval use formula by Sturges that is
class interval = 1 + 3,3 log n, which n are the total respondents.
Class Interval = 1 + 3,3 log n
= 1 + 3,3 log 126
= 1 + 3,3 (2,100370545)
= 1 + 6,931222799
= 7,931222799 rounded to 8
2) Calculating Data Range
Data Range = (Maximum Score – Minimum Score)
= 17 – 4
= 13
3) Calculating Length of the Class
Length of the Class
= 1,625 rounded to 2
Frequency Distribution of Parents` Education Level variable can be
seen in the table below:

52
Table 13. Frequency Distribution of Parents` Education Level Variable
No Interval
Class
Absolute
Frequency
Relative
Frequency
(%)
Absolute
Cumulative
Frequency
Cumulative
Frequency
(%)
1. 4 – 5 16 12,70 16 12,70
2. 6 – 7 40 31,75 56 44,45
3. 8 – 9 26 20,63 82 65,08
4. 10 – 11 14 11,11 96 76,19
5. 12 – 13 15 11,90 111 88,09
6. 14 – 15 6 4,77 117 92,86
7. 16 – 17 9 7,14 126 100
8. 18 – 19 0 0 0 0
Total 126 100 126 100
Source: Primary Data 2013
Based on the frequency distribution table of Parents` Education
Level variable above can be described as follows:
Source: Primary Data 2013
Figure 4. Parents` Education Level Histogram.
According to the data above can be created distributions tendency
of Parents` Education Level variable that start with calculating the ideal
Mean (Mi) and ideal Standard Deviation (SDi). Parents` Education Level
measured by 2 statements with scale 2 to 10. Based on those statements,

53
the highest score is 20 and the lowest score is 4. Based on those data
obtained that ideal Mean (Mi) and the ideal Deviation Standard (SDi)
calculated as follows:
Mi =
(ideal highest score + ideal lowest score)
Mi =
(20 + 4)
Mi =
(24)
Mi =
SDi =
(ideal highest score - ideal lowest score)
SDi =
(20 – 4)
SDi =
(16)
SDi =
Based on data above the tendency of Parents` Education Level can
be seen in the table below:
Table 14. Identification of Parents` Education Level Tendency
Source: Primary Data 2013
Table 15. Parents` Education Level Category
Source: Primary Data 2013
No Formula Calculation Score Range Categories
1 X < (Mi - 1.SDi) X < 9,33 4 - 9,33 Low
2(Mi - 1.SDi) ≤ X
< (Mi + 1.SDi)9,34 ≤ X < 14,67 9,34 - 14,67 Medium
3 (Mi + 1.SDi) ≤ X 14,68 ≤ X 14,68 - 20 High
No Score Range f % Categories
1 4 - 9,33 82 65,08 Low
2 9,34 - 14,67 35 27,78 Medium
3 14,68 - 20 9 7,14 High

54
According to the table above, it can be seen that Parents` Education
Level in grade XI Social Science SMA N 1 Bukateja at high category
consist of 9 students (7,14%), at medium category consist of 35 students
(27,78%), and at low category consist of 82 student (62,08%).
The tendency of Parents` Education Level variable presented in Pie
Chart form as follow:
Source: Primary Data 2013
Figure 5. Pie Chart of Parents` Education Level Tendency.
c. Students` Motivation Variable
The data of Students` Motivation obtained from questionnaire that
consist of 17 statements using Likert scale that consist of 4 alternative
answers, which is 4 for the highest score and 1 for lowest score. Based on
the data of Students` Motivation variable, it shows that the highest score
is 65 of the highest possible score achieved by (4 × 17) = 68, and the
lowest score is 35 of the lowest possible score achieved by (1 × 17) = 17.
The results of analysis using SPSS Statistics 18.0 For Windows program
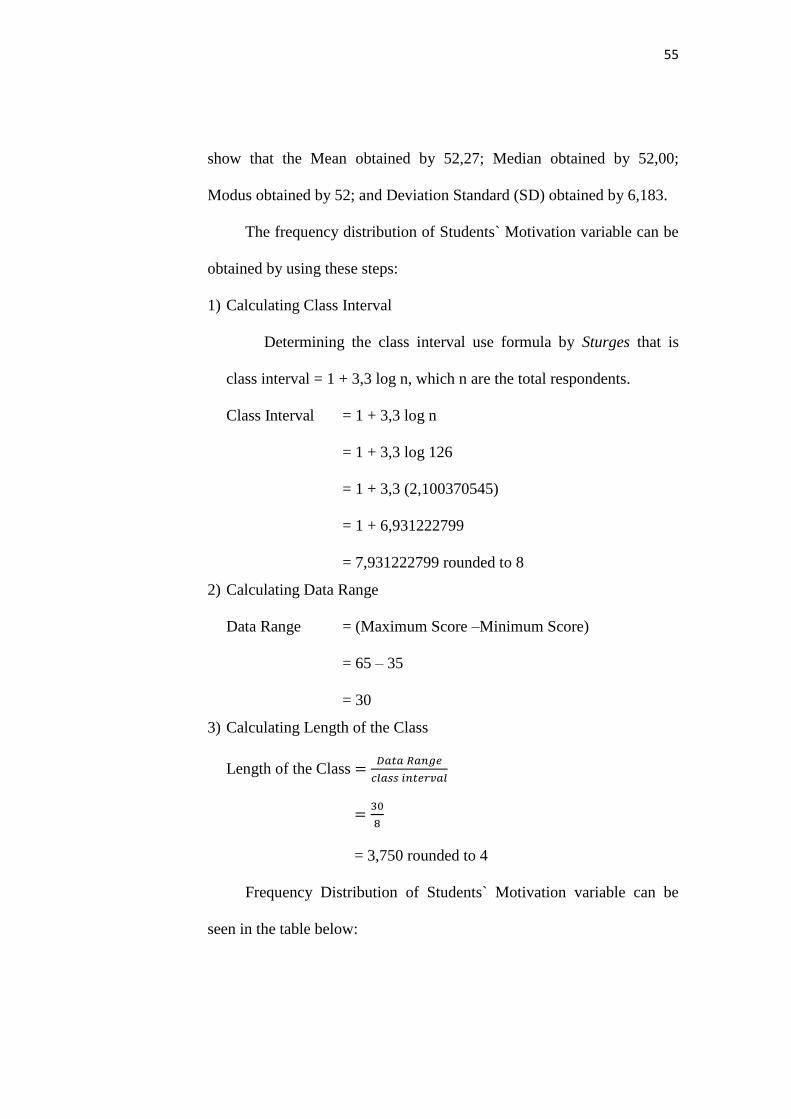
55
show that the Mean obtained by 52,27; Median obtained by 52,00;
Modus obtained by 52; and Deviation Standard (SD) obtained by 6,183.
The frequency distribution of Students` Motivation variable can be
obtained by using these steps:
1) Calculating Class Interval
Determining the class interval use formula by Sturges that is
class interval = 1 + 3,3 log n, which n are the total respondents.
Class Interval = 1 + 3,3 log n
= 1 + 3,3 log 126
= 1 + 3,3 (2,100370545)
= 1 + 6,931222799
= 7,931222799 rounded to 8
2) Calculating Data Range
Data Range = (Maximum Score –Minimum Score)
= 65 – 35
= 30
3) Calculating Length of the Class
Length of the Class
= 3,750 rounded to 4
Frequency Distribution of Students` Motivation variable can be
seen in the table below:

56
Table 16. Frequency Distribution of Students` Motivation Variable
No Interval
Class
Absolute
Frequency
Relative
Frequency
(%)
Absolute
Cumulative
Frequency
Cumulative
Frequency
(%)
1. 35 – 38 5 3,97 5 3,97
2. 39 – 42 3 2,38 8 6,35
3. 43 – 46 13 10,32 21 16,67
4. 47 – 50 19 15,08 40 31,75
5. 51 – 54 38 30,16 78 61,91
6. 55 – 58 28 22,22 106 84,13
7. 59 – 62 17 13,49 123 97,62
8. 63 – 66 3 2,38 126 100
Total 126 100 126 100
Source: Primary Data 2013
Based on the frequency distribution table of Students` Motivation
variable above can be described as follows:
Source: Primary Data 2013
Figure 6. Students` Motivation Histogram.
According to the data above can be created distributions tendency
of Students` Motivation variable that start with calculating the ideal
Mean (Mi) and ideal Standard Deviation (SDi). Students` Motivation
measured by 17 statements with scale 1 to 4. Based on those 17

57
statements, the highest score is (17 x 4) = 68 and the lowest score is (17 x
1) = 17. Based on those data obtained that ideal Mean (Mi) and the ideal
Deviation Standard (SDi) calculated as follow:
Mi =
(ideal highest score + ideal lowest score)
Mi =
(68 + 17)
Mi =
(85)
Mi =
SDi =
(ideal highest score - ideal lowest score)
SDi =
(68 – 17)
SDi =
(51)
SDi =
Based on data above the tendency of Students` Motivation can be
seen in the table below:
Table 17. Identification of Students` Motivation Tendency
Source: Primary Data 2013
No. Formula Calculation Score Range Categories
1 X < (Mi - 1.SDi) X < 34 17 - 33,9 Low
2(Mi - 1.SDi) ≤ X
< (Mi + 1.SDi)34 ≤ X < 51 34 - 50,9 Medium
3 (Mi + 1.SDi) ≤ X 51 ≤ X 51 - 68 High

58
Table 18. Students` Motivation Category
Source: Primary Data 2013
According to the table above, it can be seen that Students`
Motivation of the Grade XI Social Science SMA N 1 Bukateja at high
category consist of 85 students (67,49%), at medium category consist of
41 students (32,54%), and at low category consist of 0 student (0%).
The tendency of Students` Motivation variable presented in Pie
Chart form as follow:
Source: Primary Data 2013
Figure 7. Pie Chart of Students` Motivation Tendency.
B. Prerequisite Test Analysis
1. Linearity Test
Linearity test performed to determine whether the independent
variables with the dependent variable has linear relation or not. In this
No. Score Range f % Categories
1 17 - 33,9 0 0 Low
2 34 - 50,9 41 32,54 Medium
3 51 - 68 85 67,46 High

59
research the researcher used SPSS Statistics 18.0 for Windows for
calculating linearity test by looking at the p-value Deviation from
linearity. The variable state as linear if the Fcalc less than Ftable.
Based on the analysis of data, coefficients of Fcalc ≤ Ftable for the
variables X1 towards Y is 0,567 ≤ 2.45, while for the variable X2 towards Y
is 0.754 ≤ 1.76 this data are obtained from the coefficient F on Deviation
from Linearity that listed in the ANOVA table of the output generated with
SPSS Statistics 18.0 for Windows.
Based on those results, the relation between independent variables
with the dependent variable (all) showed a linear, so the linear correlation
can proceed. For more details linearity test results can be seen in the
following table:
Table 19. Linearity Test Result Summary
No
Variable
Df Fcalc Ftable p-value Conclusion Depen
dent
Indepen
dent
1. X1 Y 113:11 0,567 2,45 0,852 Linear
2. X2 Y 98:26 0,754 1,76 0,792 Linear
Source: Primary Data 2013
Conclusion:
1. Linearity test data of Parents` Education Level (X1) towards Students`
Interests in Pursuing Their Study to Higher Education (Y). The results
of the analysis showed Fcalc coefficient of 0,567 is smaller than Ftable
that is equal to 2,45, and the p-value of 0,852 is greater than 0,05.

60
Thus, data of Parents` Education Level (X1) has linearity correlation
towards Students` Interest in Pursuing Their Study to higher
Education (Y).
2. Linearity test data of Students` Motivation (X2) towards Students`
Interests in Pursuing Their Study to Higher Education (Y). The results
of the analysis showed Fcalc coefficient of 0,754 is smaller than Ftable
that is equal to 1,76, and the p-value of 0,792 is greater than 0,05.
Thus, data of Students` Motivation (X2) has linearity correlation
towards Students` Interest in Pursuing Their Study to higher
Education (Y).
2. Multicollinearity Test
Multicollinearity test is used for testing the assumptions in multiple
correlation analysis. Multicollinearity assumption states that the
independent variable must be free from the high correlation between the
independent variables, if there is a high correlation between the independent
variables the relationship between the independent variables on the
dependent variable is disrupted so that the correlation model is not valid.
According to the results of multicollinearity test conducted with SPSS
Statistics 18.0 For Windows is known that the rx1x2 = 0,176 is less than
0.800, so it can be concluded that there is no multicollinearity because inter
correlation among variables less than 0.800. Multicollinearity test results
can be seen briefly in the following table:

61
Table 20. Multicollinearity Test Result Summary
Variable X1 X2 Conclusion
X1 1 0,176 there is no
multicollinearity X2 0,176 1
Source: Primary Data 2013
C. Hypothesis Testing
The analysis technique used to test the first and second hypothesis in this
research using the technique Product Moment of Pearson with see the value of
rcalc in the data processing using SPSS Statistics 18.0 For Windows. In this
research used basis for decision making that is if rcalc is positive then it can be
concluded that there is a positive relationship between the independent
variables towards dependent variable while third hypothesis using tests of
significance using F test and multiple correlation analysis technique that the
purpose is to determine the relationship between two independent variables
together toward dependent variables. The results explanation of hypothesis
testing in this study are as follows:
Table 21. Product Moment Correlation Result Summary
Variable rcalc rtable Significance Explanation
X1 – Y 0,428 0,176 0,000 Positive and significant
X2 – Y 0,544 0,176 0,000 Positive and significant
Source: Primary Data 2013
a. First hypothesis Test
First Hypothesis stated that “there is a positive and significant
relationship between Parents` Education Level towards Students` Interest in
Pursuing Their Study to Higher Education”. Basis for decision making using
the correlation coefficient (rx1y) between Parents` Education Level variable

62
(X1) towards Students` Interests in Pursuing Their Study to Higher
Education (Y), if the rcalc is positive then there is a positive relationship
between the independent variables with the dependent variable. To test the
significance of the relationship is comparing the value of rcalc toward rtable at
5% significance level, if rcalc value greater than or equal to rtable the
relationship is significant and vice versa.
Based on calculations by Product Moment analysis using SPSS
Statistics 18.0 for Windows is obtained the correlation coefficient (rx1y)
between Parents` Education Level variable (X1) towards Students` Interests
in Pursuing Their Study to Higher Education (Y) equal to 0,428. To
determine the relationship is significant or not is to compare the value of rcalc
toward rtable at significance level of 5% and n = 126 is equal to 0.176. The
results of the correlation coefficient (rx1y) showed that rcalc greater than rtable
(0,428 > 0,176), the results of this research indicate that there is a positive
relationship and significant between Parents` Education Level towards
Students` Interest in Pursuing Their Study to Higher Education in Grade XI
Social Science SMA N 1 Bukateja in Academic Year of 2012/2013, so first
hypothesis can be accepted.
b. Second Hypothesis Test
Second Hypothesis stated that “there is a positive and significant
relationship between Students` Motivation towards Students` Interests in
Pursuing Their Study to Higher Education”. Basis for decision making using
the correlation coefficient (rx2y) between Students` Motivation (X2) towards

63
Students` Interests in Pursuing Their Study to Higher Education (Y), if the
rcalc is positive then there is a positive relationship between the independent
variables with the dependent variable. Testing the significance of the
relationship is comparing the value of rcalc toward rtable at 5% significance
level, if rcalc value greater than or equal to rtable the relationship is significant
and vice versa.
Based on calculations by Product Moment analysis using SPSS
Statistics 18.0 for Windows is obtained the correlation coefficient (rx2y)
between Students` Motivation variable (X2) towards Students` Interest in
Pursuing Their Study to Higher Education (Y) equal to 0,544. To determine
the relationship is significant or not is to compare the value of rcalc toward
rtable at significance level of 5% and n = 126 is equal to 0,176. The results of
the correlation coefficient (rx2y) showed that rcalc greater than rtable (0,544 >
0,176), the results of this research indicate that there is a positive
relationship and significant between Students` Motivation towards Students`
Interest in Pursuing Their Study to Higher Education in Grade XI Social
Science SMA N 1 Bukateja in Academic Year of 2012/2013, so second
hypothesis can be accepted.
c. Third Hypothesis Test
Third Hypothesis stated that “there is a positive and significant
relationship between Parents` Education Level and Students` Motivation
together toward Students` Interest in Pursuing Their Study to Higher
Education”. To test this hypothesis was conducted by multiple correlation

64
analysis with SPSS 18.0 for Windows. Summary of results of multiple
correlation analysis can be seen in the following table:
Table 22. Multiple Correlation Result Summary
Source: Primary Data 2013
Table 23. Multiple Correlation of F test Result
Model Df F Sig. Information
Regression 2 42,713 0,000
Positive and significant Residual 123
Total 125
Source: Primary Data 2013
The results of the analysis showed that the coefficient (Ry) of 0,640
with a positive direction. This means there is a positive relationship between
Parents` Education Level (X1) and Students` Motivation (X2) together
toward Students` Interest in Pursuing Their Study to Higher Education (Y).
Determining the significance of multiple correlation using F test.
Significance testing is used to determine the significance of the correlation
Parents` Education Level (X1) and Students` Motivation (X2) together
toward Students` Interest in Pursuing Their Study to Higher Education (Y).
This basis of decision making is if Fcalc is greater than Ftable at significance
level of 5% and a significance value smaller than a predetermined level of
0,05 means independent variables are significant toward the dependent
variable.
R R
square
Adjusted R
squared Information
0,640 0,410 0,400 Positive and significant

65
Based on the calculations the F value of 42,713 and Fcalc significance
value of 0,000, when compared with the Ftable value of 3,09, then the value
of Fcalc > Ftable (42,713 > 3,09) and Fcalc significance value less than 0,05
(0,000 < 0,05). From these tests, it can be concluded that there is a positive
and significant relationship between Parents` Education Level (X1) and
Students` Motivation (X2) together toward Students` Interest in Pursuing
Their Study to Higher Education (Y). So third hypothesis can be accepted.
D. Research Result Discussion
The summary of this research can be seen from the following figure:
Figure 8. Relationship among Variables
X1 = Parents` Education Level Variable
X2 = Students` Motivation Variable
Y = Students` Interest in Pursuing Their Study to Higher Education Variable
= Relationship between Parents` Education Level and Students` Motivation
together toward Students` Interest in Pursuing Their Study to Higher
Education.
= Relationship between Parents` Education Level partially towards
Students` Interest in Pursuing Their Study to Higher Education.
Relationship between Students` Motivation partially towards
Students` Interest in Pursuing Their Study to Higher Education.
rx2y= 0,544
Ry(1,2)= 0,640
rx1y= 0,428

66
1. Relationship between Parents` Education Level towards Students`
Interests in Pursuing Their Study to Higher Education.
The result shows that there is a positive and significant relationship
between Parents` Education Level towards Students` Interests in Pursuing
Their Study to Higher Education. It is proved by the results of simple
correlation analysis obtained the correlation coefficient (Rx1y) of 0,428 and
rtable with n = 126 in significance level of 5% is 0,176 it is indicating that
rcalc positive and greater than rtable (0,428 > 0,176). Based on the explanation
above it can be concluded that the Parents` Education Level variable
towards Students` Interest in Pursuing Their Study to Higher Education has
a positive and significant relationship. Thus it can be said that if the higher
Parents` Education Level, the higher Interest in Pursuing Their Study to
Higher Education. This is consistent with the framework of this research
which is high Parents` Education Level will raise the high Students` Interest
in Pursuing Their Study to Higher Education. This result of this research is
consistent with the theory from Muhibbin Syah (2011: 145-156)
1) Faktor Internal (faktor dari dalam siswa), yakni keadaan/kondisi
jasmani dan rohani siswa. Faktor ini meliputi aspek, yakni:
a) Aspek fisiologis (yang bersifat jasmaniah)
b) Aspek psikologis (yang bersifat rohaniah)
2) Faktor Eksternal (faktor dari luar siswa), yakni kondisi lingkungan
di sekitar siswa. Faktor ini meliputi:
a) Lingkungan sosial
b) Lingkungan nonsosial
3) Faktor Pendekatan Belajar, dapat dipahami sebagai segala cara
atau strategi yang digunakan siswa dalam menunjang keefektifan
dan efisiensi proses pembelajaran materi tertentu.

67
It can be said that the way parents educate their children based on the
educational experience they have been through has relationship towards
children’s interest in learning, which is in this research is students` interest
in pursuing their study to Higher Education.
These results are supported by Esti Setya Rini study (2012) that got
the conclusion that there is a positive relationship between Parents`
Education Level towards Students` Interest in Pursuing Their Study to
Higher Education. Thus it can be concluded that the higher Parents`
Education Level, the higher Students` Interest in Pursuing Their Study to
Higher Education.
2. Relationship between Students` Motivation towards Students` Interests
in Pursuing Their Study to Higher Education.
The result shows that there is a positive and significant relationship
between Students` Motivation towards Students` Interest in Pursuing Their
Study to Higher Education. it is proved by the results of simple correlation
analysis obtained the correlation coefficient (Rx2y) of 0,544 and rtable with n
= 126 the significance level of 5% is 0,176 indicating that rcalc positive and
greater than rtable (0,544 > 0,176). Based on the explanation above it can be
concluded that Students` Motivation towards Students` Interest in Pursuing
Their Study to Higher Education has a positive and significant relationship.
Thus it can be said that if the higher Students` Motivation, the higher
Students` Interest in Pursuing Their Study to Higher Education. This is
consistent with the framework of this research which is high Students`

68
Motivation will raise the high Students` Interest in Pursuing Their Study to
Higher Education. This result of this research is consistent with the theory
from Slameto (2010: 26) there are three factors affect the Students`
Motivation:
1. Dorongan kognitif
Termasuk dalam golongan kognitif adalah kebutuhan untuk
mengetahui, untuk mengerti, dan memecahkan masalah. Dorongan
kognitif timbul di dalam proses interaksi antara siswa dengan
tugas atau masalah.
2. Harga diri
Ada siswa tertentu yang tekun belajar melaksanakan tugas-
tugasnya bukan terutama untuk memperoleh pengetahuan atau
kecakapan, melainkan untuk memperoleh status dan harga diri.
3. Kebutuhan berafiliasi
Kebutuhan berafiliasi sukar dipisahkan dari harga diri. Ada siswa
yang berusaha menguasai bahan pelajaran atau belajar giat untuk
memperoleh pembenaran/penerimaan dari teman-temannya atau
dari orang lain yang dapat memberikan status kepadanya. Siswa
senang jika orang lain menunjukan pembenaran terhadap dirinya,
oleh karena itu ia giat belajar.
It can be said that the Students` Motivation has relationship toward
Students` Interest in Pursuing Their Study to Higher Education which
Students` Motivation is influenced by three main factors; cognitive
encouragement, self-esteem and need for affiliation.
This is supported by Mursinandi Agustin (2010) and Chandra Efrida
Kurniawati study (2008) that got the conclusion that there is a positive
relationship between Students` Motivation towards Students` Interest in
Pursuing Their Study to Higher Education. It can be concluded that the
higher Students` Motivation, the higher Students` Interest in Pursuing Their
Study to Higher Education.

69
3. Relationship between Parents` Education Level and Students`
Motivation together toward Students` Interests in Pursuing Their
Study to Higher Education.
The result of the analysis of the third hypothesis testing shows that
there is a positive and significant relationship between Parents` Education
Level and Students` Motivation together toward Students` Interest in
Pursuing Their Study to higher Education indicated by the correlation
coefficient (Ry1,2) of 0.640 and Fcalc obtained by 42.713 while Ftable on
significance level of 5% obtained by 3,09. This shows the value of (Ry1,2) is
positive and Fcalc greater than Ftable so it can be concluded that there is a
positive and significant relationship between the Parents` Education Level
(X1) and Students` Motivation (X2) together toward Students` Interest in
Pursuing Their Study to Higher Education (Y). It can be concluded that the
higher the Parents` Education Level and Students` Motivation, the higher
Students` Interest in pursuing Their Study to Higher Education.
One of factors that affect the Students` Interest in Pursuing Their
Study to Higher Education is Parents` Education Level. Parents` have
important role in guiding the children in creating the mindset of the
children's interest to pursuing their study to Higher Education. The other
factors that affect the Students` Interest in Pursuing Their Study to Higher
Education is Students` Motivation. Students with High Motivation will not
stop at certain point, he will try to be the best in any subject and compete his
friends to pursuing the study to Higher Education. In this research shows

70
that Students` Interest in Pursuing Their Study to Higher Education is high
categorized.
This research in accordance with literature review and research
framework in this research and it is proven that Parents` Education Level
and Students` Motivation could be set as basis for measuring the Students`
Interest in Pursuing Their Study to Higher Education. In addition, from the
analysis also obtained value of R square 0,410 which means that 41,0%
Students` Interest in Pursuing Their Study to Higher Education have
relationship toward Parents` Education Level and Students` Motivation.
E. Limitations of the Research
This Research was conducted well, but it still have some limitedness such as:
1. Factors that have been taken to find out the Relationship of Students`
Interest in Pursuing Their Study to Higher Education there are only 2
variables, they are: Parents` Education Level, Students` Motivation
whereas there are more factors also can affect the Students` Interest in
Pursuing Their Study to Higher Education.
2. This research have been done well by researcher in purpose to acquired the
results of the research based on the real condition of the student, but
researchers cannot guarantee that students who become research subjects
completed the questionnaire in accordance with their actual conditions.
3. The data from schools is not supported by documentation, most of them are
delivered orally by administration staff based on school’s archieves

71
CHAPTER V
CONCLUSION AND SUGGESTIONS
A. Conclusion
Based on the results of this research can be concluded that:
a. There is a positive and significant relationship between Parents Education
Level towards Interest of the Grade XI Social Science SMA N 1 Bukateja in
Pursuing Their Study to Higher Education in Academic Year of 2012/2013.
It is shown by the correlation coefisient rx1y 0,428 (rx1y obtained by 0,428 >
rtable 5% obtained by 0,176).
b. There is a positive and significant relationship between Students`
Motivation towards Interest of the Grade XI Social Science SMA N 1
Bukateja in Pursuing Their Study to Higher Education in Academic Year of
2012/2013. It is shown by the correlation coefisient rx2y 0,544 (rx2y obtained
by 0,544 > rtable 5% obtained by 0,176).
c. There is a positive and significant relationship between Parents Education
Level and Students` Motivation together toward Interest of the Grade XI
Social Science SMA N 1 Bukateja in Pursuing Their Study to Higher
Education in Academic Year of 2012/2013. It is shown by the correlation
coefisient (R) obtained by 0,640, coefisient determenation (R2) obtained by
0,410, and Fcalc obtained by 42,713 (Fcalc obtained by 42,713 > Ftable 5%
obtained by 3,09).

72
B. Research Result Implications
1. It have been tested that there is a positive and significant relationship
between Parents` Education Level towards Students` Interest in Pursuing
Their Study to Higher Education. It shows that the higher Parents`
Education Level the more Students` Interest in Pursuing Their Study to
Higher Education.
2. It have been tested that there is a positive and significant relationship
between Students` Motivation towards Students` Interest in Pursuing Their
Study to Higher Education. It shows that the higher Students` Motivation
the more Students` Interest in Pursuing Their Study to Higher Education.
3. It have been tested that there is a positive and significant relationship
between Parents Education Level and Students` Motivation toward
Students` Interest in Pursuing Their Study to Higher Education. It shows
that the higher Parents Education Level the more Interest of Student in
Pursuing Their Study to Higher Education. This also applies to Students`
Motivation, the higher Students` Motivation the more Students` Interest in
Pursuing Their Study to Higher Education.

73
C. Suggestions
1. Suggestion for Teacher
Teachers are expected to give motivation to the students such as
reading a book when there is spare time, do the assignment on time and
students can participate in the competitions both in academic and
nonacademic, so it makes students more confident and motivated to compete
positively.
2. Suggestion for the Students
Students are expected to improve their motivation and interests
pursuing their study to Higher Education although their Parents` Education
Level is low.
3. Suggestion for the Next Reseacher
This research provide information about Parents` Education Level and
Students` Motivation factors have relationship toward Students` Interest in
Pursuing Their Study to Higher Education. Interest in Pursuing Their Study
to higher Education is not only have relationship toward Parents Education
Level and Students` Motivation Education, but also have relationship
toward other factors.

74
REFERENCES
Agustin Mursinandi. (2010). “Hubungan antara Motivasi Berprestasi, Status
Sosial Ekonomi Orang Tua dan Lingkungan Teman Sebaya dengan Minat
Melanjutkan Studi ke Perguruan Tinggi pada Siswa Kelas XI Jurusan IPS
MAN Yogyakarta II Tahun Ajaran 2009/2010". Skripsi. Yogyakarta: FE
UNY.
Candra Efrida Kurniawati. (2008). "Antara Motivasi Berprestasi, Status Sosial
Ekonomi Orang Tua dan Lingkungan Teman Sebaya Dengan Minat
Melanjutkan Studi ke Perguruan Tinggi pada Siswa Kelas XII Program
Keahlian Akuntansi SMK YPKK 1 Sleman Tahun Ajaran 2007/2008".
Skripsi. Yogyakarta: FE UNY.
Depdiknas. (2003). Undang-Undang Republik Indonesia Nomor 20 Tahun 2003
tentang Sistem Pendidikan Nasional. Jakarta: Depdiknas.
Djaali. (2012). Psikologi Pendidikan. Jakarta: PT. Bumi Aksara.
Esti Setya Rini. (2012). "Hubungan Tingkat Pendidikan Orang Tua dan Prestasi
Belajar Siswa Dengan Minat Siswa Melanjutkan Studi ke Perguruan Tinggi
pada Siswa Kelas XI SMA Negeri 1 Kalasan Tahun Ajaran 2011/2012".
Skripsi. Yogyakarta: FE UNY.
Fuad Ihsan. (2003). Dasar-dasar Kependidikan. Jakarta: PT. Rineka Cipta.
John P. Houston. (1985). Motivation. New York: Collier Macmillan Canada, Inc.
Muhibbin Syah. (2011). Psikologi Belajar. Jakarta: PT. Raja Grafindo Persada.
Nana Syaodih. (2004). Landasan Psikologi Proses Pendidikan. Bandung: PT.
Remaja Rosdakarya.
Ngalim Purwanto. (2010). Psikologi Pendidikan. Bandung: PT. Remaja
Rosdakarya.
Nurkosim. (2012). “Pengaruh Tingkat Pendidikan dan Tingkat Pendapatan
Orang Tua terhadap Prestasi Belajar Mata Pelajaran Ekonomi Siswa Kelas
X SMA Negeri 1 Kedungwaru Kabupaten Tulungagung Tahun Pelajaran
2011/2012”. Tesis. Malang: PIPS Universitas Kanjuruhan Malang.
Oemar Hamalik. (2011). Kurikulum dan Pembelajaran. Jakarta: Bumi Aksara.
Saifuddin Azwar. (2011). Penyusunan Skala Psikologi. Yogyakarta: Pustaka
Pelajar.

75
Sardiman AM. (2006). Interaksi dan Motivasi Belajar Mengajar. Jakarta: PT.
Raja Grafindo Persada.
Slameto. (2010). Belajar dan Faktor-faktor yang Mempengaruhi. Jakarta: PT.
Rineka Cipta.
Suara Pembaruan. (2011). Tingkatkan Kualitas Pekerja. Retrieved February 11,
2013, from : http://www.suarapembaruan.com/tajukrencana/tingkatkan-
kualitas-pekerja/5173
Sugiyono. (2007). Statistik untuk Penelitian. Bandung: CV Alfabeta.
_______. (2010). Metode Penelitian Pendidikan Pendekatan Kuantitatif,
Kualitatif, dan R&D. Bandung: CV Alfabeta.
Suharsimi Arikunto. (2000). Manajemen Penelitian. Jakarta: PT. Rineka Cipta.
_______________. (2010). Prosedur Penelitian Suatu Pendekatan Praktik.
Jakarta: PT. Rineka Cipta.
Sumadi Suryabrata. (2004). Psikologi Pendidikan. Jakarta: PT. Raja Grafindo
Persada.
Sutrisno Hadi. (2004). Analisis Regresi. Yogyakarta: Andi Offset.

76

77
APPENDIX 1
Research Instrument
a. Research Instrument Testing
b. Research Instrument

78
Research Instrument
Testing

79
Kepada
Yth. Siswa Kelas XI IPS 1
SMA N 2 Purbalingga
Assalamualaikum wr. wb.
Di sela-sela kesibukan Adik-adik belajar, perkenankanlah saya meminta kesediaan
Adik-adik untuk meluangkan waktu sebentar guna mengisi angket ini. Angket ini
digunakan untuk mengumpulkan data bagi penelitian saya yang berjudul:
“Relationship between Parents Education Level and Students Achievement
Motivation toward Interest of the Grade XI Social Science SMA N 1
Bukateja in Pursuing Their Study to Higher Education in Academic
Year of 2012/2013”
Berkenaan dengan hal tersebut, saya memohon bantuan Adik-adik untuk
memberikan jawaban atas pernyataan-pernyataan yang tertera dalam angket uji
coba istrumen ini. Angket ini bukan merupakan tes, sehingga tidak ada jawaban
yang benar maupun yang salah. Jawaban yang Adik-adik berikan tidak akan
mempengaruhi nilai atau nama baik Adik-adik di sekolah.
Atas bantuan Adik-adik, saya ucapkan terima kasih. Semoga Tuhan Yang Maha
Esa memberikan imbalan yang sesuai dengan budi baik Adik-adik.
Wassalamualaikum wr. wb.
Peneliti,
Narendra Edi Putranto

80
ANGKET UJI COBA PENELITIAN
Petunjuk Pengisian Angket
1. Tuliskan terlebih dahulu nama, kelas, dan nomor absen pada tempat yang
telah disediakan.
2. Pada angket ini terdapat 39 pernyataan. Pertimbangkan setiap pernyataan
dalam kaitannya dengan mata pelajaran Akuntansi Keuangan. Berilah
jawaban yang benar-benar cocok dengan pilihanmu.
3. Pertimbangkan setiap pernyataan secara terpisah dan tentukan kebenarannya.
Jawaban jangan dipengaruhi oleh jawaban dari penyataan lain.
4. Jawablah semua pernyataan dengan memilih salah satu dari empat alternatif
jawaban di bawah ini dengan memberikan tanda centang (√)
SS = Sangat Setuju TS = Tidak Setuju
S = Setuju STS = Sangat Tidak Setuju
Identitas Responden
Nama : ........................................
Kelas : ........................................
No. Absen : ........................................
1. Angket Minat Melanjutkan Studi ke Perguruan Tinggi
No Pernyataan alternatif jawaban
SS S TS STS
1 Saya merasa bersemangat ketika membicarakan
Perguruan Tinggi dengan teman-teman sekolah
2 Saya merasa senang ketika orang tua saya
membicarakan tentang Perguruan Tinggi yang saya
minati
3 Saya mencari semua infromasi tentang Perguruan
Tinggi dan Jurusan yang saya minati
4
Saya merasa tertarik untuk melanjutkan studi ke
Perguruan Tinggi, karena lingkungan saya
mendukung
5 Saya tidak tertarik melanjutkan studi ke Perguruan
Tinggi karena membutuhkan dana yang besar

81
6 Saya tidak tertarik untuk melanjutkan studi ke
Perguruan Tinggi karena saya sudah mendapatkan
pekerjaan
7 Saya berkeinginan untuk melanjutkan studi ke
Perguruan Tinggi setelah lulus SMA
8 Saya Melanjutkan studi ke Perguruan Tinggi supaya
saya tidak menjadi pengangguran
9 Saat di Perguruan Tinggi saya berharap bisa terus
mengembangkan ilmu dan kemampuan saya
10 Saya berharap dapat lulus dari sekolah dengan nilai
yang sempurna
11 Saya melanjutkan studi ke Perguruan Tinggi agar
saya bisa mendapatkan pekerjaan yang saya ingin
12 Saya yakin dapat diterima di Perguruan Tinggi yang
saya inginkan karena percaya dengan kemampuan
yang saya miliki
13 Orang Tua saya selalu memotivasi saya agar
melanjutkan studi ke jenjang Perguruan Tinggi
14 Karena kemauan yang kuat dari dalam diri, keluarga
selalu mendorong saya untuk bisa masuk ke
Perguruan Tiggi yang saya inginkan
15 Melanjutkan studi ke Perguruan Tinggi sesuai
dengan cita-cita saya sejak kecil
16 Kemauan saya untuk melanjutkan studi ke Perguruan
Tinggi sesuai dengan keinginan Orang Tua saya
2. Angket Motivasi Berprestasi Siswa
No Pernyataan alternatif jawaban
SS S TS STS
1 Saya sudah belajar terlebih dahulu di rumah sebelum
materi diajarkan oleh guru saat pembelajaran
2 Saya meluangkan waktu untuk membaca buku
setiap hari di rumah
3 Saya bertanya pada guru apabila ada materi yang
masih belum saya kuasai
4 Pada saat ulangan saya sudah mempersiapkan
contekan mengenai materi yang diujikan
5 Saya mencoba menyelesaikan tugas dengan
kemampuan yang saya miliki

82
6 Ketika ada PR saya berusaha untuk
menyelesaikannya dan mengumpulkan tepat waktu
7 Saya tidak suka menunda-nunda apa yang bisa saya
kerjakan hari ini
8 saya tidak suka ketika dipilih sekolah untuk menjadi
wakil dalam perlombaan mata pelajaran
9 Saya menyukai penugasan yang susah sehingga
menantang saya untuk bisa menyelesaikannya
10 Saya berani menghadapi risiko karena saya yakin
pada kemampuan diri sendiri
11 Jika ada penugasan ataupun ulangan saya berusaha
untuk menjadi yang terbaik di kelas
12 Saya fokus terhadap materi ketika saya belajar di
rumah
13 Jika kondisi rumah ramai saya tidak akan terganggu
karena saya berkonsentrasi pada materi
14 Daripada untuk belajar waktu yang saya habiskan
lebih banyak untuk bersantai-santai
15 saya menggali informasi mengenai materi pelajaran,
baik menggunakan buku ataupun teknologi internet
16 Saya tidak cepat puas terhadap prestasi yang sudah
dicapai
17 Saya bersemangat untuk menjadi lebih baik lagi
dalam segala hal
18 Saya tidak puas ketika saya mendapatkan nilai yang
tidak sesuai dengan harapan
19 Ketika ada PR atau penugasan saya menunggu
pekerjaan teman untuk saya contek
20
Saya lebih suka menyelesaikan tugas sendiri
daripada mengerjakan bersama-sama namun tidak
fokus
21
Sepulang sekolah saya langsung mengerjakan
penugasan yang diberikan oleh guru tanpa menunda-
nunda sampai batas tugas dikumpulkan

83
1. Angket Tingkat Pendidikan Orang Tua
Keterangan:
Berikan tanda (O) pada tingkat pendidikan terakhir Ayah dan Ibu Adik-adik
1. Tingkat Pendidikan Terakhir Ayah anda:
a. Tamat SD
b. Tidak Tamat SD, Sampai dengan kelas . . . .
c. Tamat SMP
d. Tidak Tamat SMP, Sampai dengan kelas . . . .
e. Tamat SMA
f. Tidak Tamat SMA, Sampai dengan kelas . . . .
g. Tamat DI
h. Tidak Tamat DI, Sampai dengan semester . . . .
i. Tamat DII
j. Tidak Tamat DII, Sampai dengan semester . . . .
k. Tamat DIII
l. Tidak Tamat DIII, Sampai dengan semester . . . .
m. Tamat S1
n. Tidak Tamat S1, Sampai dengan semester . . . .
o. Tamat S2
p. Tidak Tamat S2, Sampai dengan semester . . . .
q. Tamat S3
r. Tidak Tamat S3, Sampai dengan semester . . . .
2. Tingkat Pendidikan Terakhir Ibu anda:
a. Tamat SD
b. Tidak Tamat SD, Sampai dengan kelas . . . .
c. Tamat SMP
d. Tidak Tamat SMP, Sampai dengan kelas . . . .
e. Tamat SMA
f. Tidak Tamat SMA, Sampai dengan kelas . . . .
g. Tamat DI

84
h. Tidak Tamat DI, Sampai dengan semester . . . .
i. Tamat DII
j. Tidak Tamat DII, Sampai dengan semester . . . .
k. Tamat DIII
l. Tidak Tamat DIII, Sampai dengan semester . . . .
m. Tamat S1
n. Tidak Tamat S1, Sampai dengan semester . . . .
o. Tamat S2
p. Tidak Tamat S2, Sampai dengan semester . . . .
q. Tamat S3
r. Tidak Tamat S3, Sampai dengan semester . . . .
***** Terima Kasih *****

85
RESEARCH
INSTRUMENT

86
Kepada
Yth. Siswa Kelas XI IPS
SMA N 1 Bukateja
Assalamualaikum wr. wb.
Di sela-sela kesibukan Adik-adik belajar, perkenankanlah saya meminta kesediaan
Adik-adik untuk meluangkan waktu sebentar guna mengisi angket ini. Angket ini
digunakan untuk mengumpulkan data bagi penelitian saya yang berjudul:
“Relationship between Parents Education Level and Students Achievement
Motivation toward Interest of the Grade XI Social Science SMA N 1
Bukateja in Pursuing Their Study to Higher Education in Academic
Year of 2012/2013”
Berkenaan dengan hal tersebut, saya memohon bantuan Adik-adik untuk
memberikan jawaban atas pernyataan-pernyataan yang tertera dalam angket
penelititan ini. Angket ini bukan merupakan tes, sehingga tidak ada jawaban yang
benar maupun yang salah. Jawaban yang Adik-adik berikan tidak akan
mempengaruhi nilai atau nama baik Adik-adik di sekolah.
Atas bantuan Adik-adik, saya ucapkan terima kasih. Semoga Tuhan Yang Maha
Esa memberikan imbalan yang sesuai dengan budi baik Adik-adik.
Wassalamualaikum wr. wb.
Peneliti,
Narendra Edi Putranto

87
ANGKET PENELITIAN
Petunjuk Pengisian Angket
1. Tuliskan terlebih dahulu nama, kelas, dan nomor absen pada tempat yang
telah disediakan.
2. Pada angket ini terdapat 33 pernyataan. Pertimbangkan setiap pernyataan
dalam kaitannya dengan mata pelajaran Akuntansi Keuangan. Berilah
jawaban yang benar-benar cocok dengan pilihanmu.
3. Pertimbangkan setiap pernyataan secara terpisah dan tentukan kebenarannya.
Jawaban jangan dipengaruhi oleh jawaban dari penyataan lain.
4. Jawablah semua pernyataan dengan memilih salah satu dari empat alternatif
jawaban di bawah ini dengan memberikan tanda centang (√)
SS = Sangat Setuju TS = Tidak Setuju
S = Setuju STS = Sangat Tidak Setuju
Identitas Responden
Nama : ........................................
Kelas : ........................................
No. Absen : ........................................
2. Angket Minat Melanjutkan Studi ke Perguruan Tinggi
No Pernyataan alternatif jawaban
SS S TS STS
1 Saya merasa bersemangat ketika membicarakan
Perguruan Tinggi dengan teman-teman sekolah
2
Saya merasa senang ketika orang tua saya
membicarakan tentang Perguruan Tinggi yang saya
minati
3 Saya mencari semua infromasi tentang Perguruan
Tinggi dan Jurusan yang saya minati
4
Saya merasa tertarik untuk melanjutkan studi ke
Perguruan Tinggi, karena lingkungan saya
mendukung
5 Saya tidak tertarik melanjutkan studi ke Perguruan
Tinggi karena membutuhkan dana yang besar
6 Saya tidak tertarik untuk melanjutkan studi ke
Perguruan Tinggi karena saya sudah mendapatkan

88
pekerjaan
7 Saya berkeinginan untuk melanjutkan studi ke
Perguruan Tinggi setelah lulus SMA
8 Saya Melanjutkan studi ke Perguruan Tinggi supaya
saya tidak menjadi pengangguran
9 Saat di Perguruan Tinggi saya berharap bisa terus
mengembangkan ilmu dan kemampuan saya
10 Saya melanjutkan studi ke Perguruan Tinggi agar
saya bisa mendapatkan pekerjaan yang saya ingin
11
Saya yakin dapat diterima di Perguruan Tinggi yang
saya inginkan karena percaya dengan kemampuan
yang saya miliki
12 Orang Tua saya selalu memotivasi saya agar
melanjutkan studi ke jenjang Perguruan Tinggi
13
Karena kemauan yang kuat dari dalam diri, keluarga
selalu mendorong saya untuk bisa masuk ke
Perguruan Tiggi yang saya inginkan
14 Melanjutkan studi ke Perguruan Tinggi sesuai
dengan cita-cita saya sejak kecil
3. Angket Motivasi Berprestasi Siswa
No Pernyataan alternatif jawaban
SS S TS STS
1
Saya sudah belajar terlebih dahulu di rumah
sebelum materi diajarkan oleh guru saat
pembelajaran
2 Saya meluangkan waktu untuk membaca buku
setiap hari di rumah
3 Saya bertanya pada guru apabila ada materi yang
masih belum saya kuasai
4 Pada saat ulangan saya sudah mempersiapkan
contekan mengenai materi yang diujikan
5 Saya mencoba menyelesaikan tugas dengan
kemampuan yang saya miliki
6 Ketika ada PR saya berusaha untuk
menyelesaikannya dan mengumpulkan tepat waktu
7 Saya tidak suka menunda-nunda apa yang bisa saya
kerjakan hari ini
8 saya tidak suka ketika dipilih sekolah untuk
menjadi wakil dalam perlombaan mata pelajaran

89
9 Jika ada penugasan ataupun ulangan saya berusaha
untuk menjadi yang terbaik di kelas
10 Daripada untuk belajar waktu yang saya habiskan
lebih banyak untuk bersantai-santai
11 saya menggali informasi mengenai materi pelajaran,
baik menggunakan buku ataupun teknologi internet
12 Saya tidak cepat puas terhadap prestasi yang sudah
dicapai
13 Saya bersemangat untuk menjadi lebih baik lagi
dalam segala hal
14 Saya tidak puas ketika saya mendapatkan nilai yang
tidak sesuai dengan harapan
15 Ketika ada PR atau penugasan saya menunggu
pekerjaan teman untuk saya contek
16
Saya lebih suka menyelesaikan tugas sendiri
daripada mengerjakan bersama-sama namun tidak
fokus
17
Sepulang sekolah saya langsung mengerjakan
penugasan yang diberikan oleh guru tanpa
menunda-nunda sampai batas tugas dikumpulkan
4. Angket Tingkat Pendidikan Orang Tua
Keterangan:
Berikan tanda (O) pada tingkat pendidikan terakhir Ayah dan Ibu Adik-adik
2. Tingkat Pendidikan Terakhir Ayah anda:
a. Tamat SD
b. Tidak Tamat SD, Sampai dengan kelas . . . .
c. Tamat SMP
d. Tidak Tamat SMP, Sampai dengan kelas . . . .
e. Tamat SMA
f. Tidak Tamat SMA, Sampai dengan kelas . . . .
g. Tamat DI
h. Tidak Tamat DI, Sampai dengan semester . . . .
i. Tamat DII
j. Tidak Tamat DII, Sampai dengan semester . . . .

90
k. Tamat DIII
l. Tidak Tamat DIII, Sampai dengan semester . . . .
m. Tamat S1
n. Tidak Tamat S1, Sampai dengan semester . . . .
o. Tamat S2
p. Tidak Tamat S2, Sampai dengan semester . . . .
q. Tamat S3
r. Tidak Tamat S3, Sampai dengan semester . . . .
3. Tingkat Pendidikan Terakhir Ibu anda:
a. Tamat SD
b. Tidak Tamat SD, Sampai dengan kelas . . . .
c. Tamat SMP
d. Tidak Tamat SMP, Sampai dengan kelas . . . .
e. Tamat SMA
f. Tidak Tamat SMA, Sampai dengan kelas . . . .
g. Tamat DI
h. Tidak Tamat DI, Sampai dengan semester . . . .
i. Tamat DII
j. Tidak Tamat DII, Sampai dengan semester . . . .
k. Tamat DIII
l. Tidak Tamat DIII, Sampai dengan semester . . . .
m. Tamat S1
n. Tidak Tamat S1, Sampai dengan semester . . . .
o. Tamat S2
p. Tidak Tamat S2, Sampai dengan semester . . . .
q. Tamat S3
r. Tidak Tamat S3, Sampai dengan semester . . . .
***** Terima Kasih *****

91
APPENDIX 2
Research Instrument Testing
Analysis
a. Research Instrument Testing
Data Table
b. Validity and Reliability Test
SPSS Output

92
Research
Instrument Testing
Data Table

93
A. TABLE OF RESEARCH INSTRUMENT TESTING SMA N 2 PURBALINGGA RESULT DATA
1. Table of Interest in Pursuing Study to Higher Education Variable Research Instrument Testing
No Score item
Total Score 1 2 3 4 5 6 7 8 9 10 11 12 13 14 15 16
1 4 4 4 4 2 4 4 4 4 4 4 4 4 4 4 3 61
2 3 4 3 3 3 4 4 3 4 4 3 3 3 3 3 2 52
3 3 3 3 4 4 4 4 1 4 4 3 3 4 4 4 4 56
4 4 4 4 4 4 3 4 4 4 4 4 3 4 3 2 2 57
5 3 3 4 3 3 3 4 4 4 4 4 3 3 3 4 3 55
6 3 3 4 3 3 3 4 3 4 4 4 4 3 3 3 2 53
7 4 4 3 3 3 3 4 3 3 4 3 3 3 3 3 3 52
8 4 4 4 3 3 3 4 2 4 4 4 3 4 3 4 2 55
9 2 2 4 3 2 4 3 2 4 4 3 2 3 2 2 3 45
10 3 4 3 3 3 3 4 4 4 4 3 3 3 4 3 2 53

94
11 4 4 4 3 3 3 3 3 3 4 4 3 3 4 2 3 53
12 4 4 3 3 3 3 3 3 4 4 3 3 4 3 3 1 51
13 3 3 2 3 3 3 3 3 4 3 4 2 2 2 2 2 44
14 4 3 4 3 3 4 4 4 4 4 4 3 3 3 4 2 56
15 3 3 3 3 3 3 3 3 3 4 4 3 3 3 3 3 50
16 3 4 3 4 4 4 4 4 4 4 4 3 4 3 3 4 59
17 3 3 3 3 2 3 3 3 3 3 3 4 3 3 3 3 48
18 3 4 3 2 4 3 3 4 3 4 4 3 3 3 2 2 50
19 3 3 2 3 3 3 3 3 3 4 3 3 3 3 2 3 47
20 4 4 3 3 4 4 4 2 4 4 3 3 2 3 4 2 53
21 3 4 4 4 4 4 4 4 3 4 4 4 4 4 4 1 59
22 3 4 3 3 3 3 3 4 3 4 4 3 3 3 3 3 52
23 3 4 3 3 3 3 4 4 4 4 3 3 3 3 3 2 52
24 4 4 3 2 3 3 4 3 4 3 4 3 3 3 3 4 53
25 3 4 4 4 4 4 4 4 4 4 4 3 3 3 3 4 59
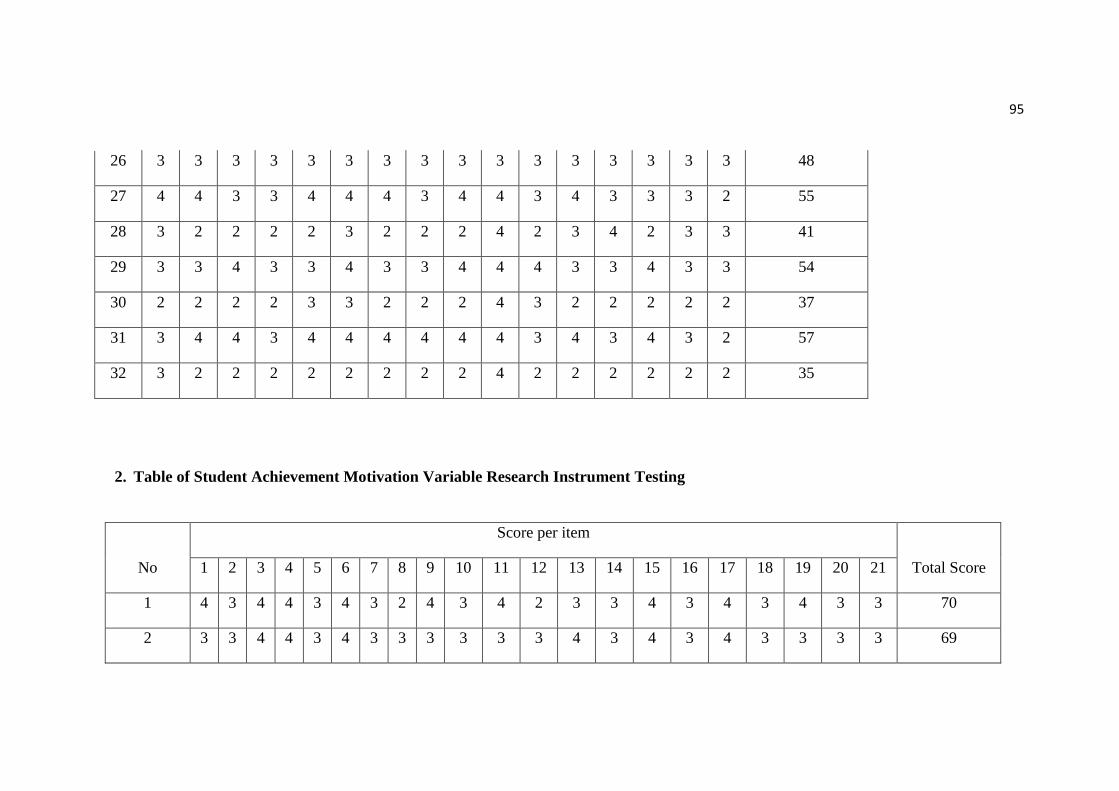
95
26 3 3 3 3 3 3 3 3 3 3 3 3 3 3 3 3 48
27 4 4 3 3 4 4 4 3 4 4 3 4 3 3 3 2 55
28 3 2 2 2 2 3 2 2 2 4 2 3 4 2 3 3 41
29 3 3 4 3 3 4 3 3 4 4 4 3 3 4 3 3 54
30 2 2 2 2 3 3 2 2 2 4 3 2 2 2 2 2 37
31 3 4 4 3 4 4 4 4 4 4 3 4 3 4 3 2 57
32 3 2 2 2 2 2 2 2 2 4 2 2 2 2 2 2 35
2. Table of Student Achievement Motivation Variable Research Instrument Testing
No
Score per item
Total Score 1 2 3 4 5 6 7 8 9 10 11 12 13 14 15 16 17 18 19 20 21
1 4 3 4 4 3 4 3 2 4 3 4 2 3 3 4 3 4 3 4 3 3 70
2 3 3 4 4 3 4 3 3 3 3 3 3 4 3 4 3 4 3 3 3 3 69

96
3 3 3 3 2 3 3 3 3 3 3 3 4 3 3 3 2 3 3 3 2 3 61
4 4 3 4 3 3 4 3 4 4 4 4 3 3 4 4 1 4 3 4 1 3 70
5 3 3 3 2 2 3 2 2 2 3 3 4 3 2 3 2 3 2 3 2 2 54
6 3 3 4 4 3 4 3 3 4 4 3 3 3 3 4 2 4 3 4 2 3 69
7 4 3 4 3 3 4 3 4 4 3 4 3 3 4 4 2 4 3 3 2 3 70
8 4 3 4 3 3 4 3 3 3 4 4 3 4 3 4 4 4 3 3 4 3 73
9 2 3 3 3 3 3 2 3 4 3 2 2 3 3 3 1 4 2 3 1 3 56
10 3 3 3 4 3 3 3 3 3 3 3 3 3 3 3 3 4 3 4 3 3 66
11 4 3 4 2 3 4 3 2 4 4 3 4 3 2 4 2 4 3 3 2 3 66
12 4 3 3 4 2 3 3 4 4 3 4 3 4 4 3 3 4 3 3 3 2 69
13 3 2 3 3 2 3 2 2 3 3 3 4 3 2 3 3 3 2 2 3 2 56
14 4 2 4 4 3 4 4 3 4 4 4 3 3 3 4 2 4 4 3 3 3 72
15 3 3 4 3 2 4 4 1 4 3 3 2 4 1 4 3 3 4 4 3 2 64
16 3 3 4 3 3 4 3 3 3 3 3 3 3 3 4 3 3 3 3 3 3 66
17 3 3 3 3 3 3 3 3 4 3 3 4 3 3 3 3 3 3 3 3 3 65

97
18 3 3 3 4 3 3 3 3 3 2 3 3 2 4 3 4 4 3 4 4 3 67
19 3 2 3 3 2 3 2 2 4 3 3 2 3 2 2 2 3 2 2 2 2 52
20 4 3 4 4 3 4 3 4 3 3 4 4 3 4 4 3 4 3 4 3 3 74
21 3 3 3 4 3 3 3 4 3 3 3 4 4 4 3 3 4 3 4 3 3 70
22 3 3 3 3 3 3 3 3 4 3 3 3 3 3 3 3 3 2 3 3 3 63
23 3 3 3 4 2 3 4 4 3 3 3 4 3 4 3 2 4 4 4 2 2 67
24 4 4 3 3 2 3 4 3 4 3 4 4 4 3 3 4 4 4 3 4 2 72
25 3 3 4 4 3 4 3 4 3 3 3 3 3 4 4 4 4 3 4 4 3 73
26 3 3 4 4 3 4 4 4 3 4 3 3 3 4 4 3 4 4 4 3 3 74
27 4 3 3 3 3 3 3 3 3 3 4 3 4 3 3 3 4 3 3 3 3 67
28 3 2 3 3 3 3 2 3 4 4 3 2 4 3 3 2 4 2 4 2 3 62
29 3 3 3 3 3 3 3 3 3 3 3 4 2 3 3 3 3 3 4 3 3 64
30 2 2 4 3 2 4 3 3 3 3 2 2 3 3 4 3 3 3 3 3 2 60
31 3 3 4 4 3 4 4 4 2 3 3 4 4 4 4 4 4 4 4 4 3 76
32 3 3 3 3 2 3 3 2 3 3 3 2 4 2 3 2 3 3 3 2 2 57

98
Validity and
Reliability Test
SPSS Output

99
VALIDITY TEST
1. VALIDITY TEST OF INTEREST IN PURSUING THEIR STUDY TO
HIGHER EDUCATION VARIABLE (Y)
Correlations
skortotal
VAR00001
Pearson Correlation .474**
Sig. (2-tailed) .006
N 32
VAR00002
Pearson Correlation .755**
Sig. (2-tailed) .000
N 32
VAR00003
Pearson Correlation .738**
Sig. (2-tailed) .000
N 32
VAR00004
Pearson Correlation .741**
Sig. (2-tailed) .000
N 32
VAR00005
Pearson Correlation .548**
Sig. (2-tailed) .001
N 32
VAR00006
Pearson Correlation .612**
Sig. (2-tailed) .000
N 32
VAR00007
Pearson Correlation .863**
Sig. (2-tailed) .000
N 32
VAR00008
Pearson Correlation .542**
Sig. (2-tailed) .001
N 32
VAR00009
Pearson Correlation .703**
Sig. (2-tailed) .000
N 32
VAR00010
Pearson Correlation .212
Sig. (2-tailed) .243
N 32
VAR00011 Pearson Correlation .608**

100
Sig. (2-tailed) .000
N 32
VAR00012
Pearson Correlation .644**
Sig. (2-tailed) .000
N 32
VAR00013
Pearson Correlation .551**
Sig. (2-tailed) .001
N 32
VAR00014
Pearson Correlation .749**
Sig. (2-tailed) .000
N 32
VAR00015
Pearson Correlation .598**
Sig. (2-tailed) .000
N 32
VAR00016
Pearson Correlation .137
Sig. (2-tailed) .455
N 32
skortotal
Pearson Correlation 1
Sig. (2-tailed)
N 32

101
2. VALIDITY TEST OF STUDENT ACHIEVEMENT MOTIVATION
VARIABLE (X2)
Correlations
skortotal
VAR00001
Pearson Correlation .532**
Sig. (2-tailed) .002
N 32
VAR00002
Pearson Correlation .420*
Sig. (2-tailed) .017
N 32
VAR00003
Pearson Correlation .561**
Sig. (2-tailed) .001
N 32
VAR00004
Pearson Correlation .596**
Sig. (2-tailed) .000
N 32
VAR00005
Pearson Correlation .493**
Sig. (2-tailed) .004
N 32
VAR00006
Pearson Correlation .561**
Sig. (2-tailed) .001
N 32
VAR00007
Pearson Correlation .686**
Sig. (2-tailed) .000
N 32
VAR00008
Pearson Correlation .621**
Sig. (2-tailed) .000
N 32
VAR00009
Pearson Correlation -.023
Sig. (2-tailed) .899
N 32
VAR00010
Pearson Correlation .248
Sig. (2-tailed) .171
N 32
VAR00011 Pearson Correlation .548
**
Sig. (2-tailed) .001

102
N 32
VAR00012
Pearson Correlation .273
Sig. (2-tailed) .130
N 32
VAR00013
Pearson Correlation .177
Sig. (2-tailed) .331
N 32
VAR00014
Pearson Correlation .657**
Sig. (2-tailed) .000
N 32
VAR00015
Pearson Correlation .633**
Sig. (2-tailed) .000
N 32
VAR00016
Pearson Correlation .468**
Sig. (2-tailed) .007
N 32
VAR00017
Pearson Correlation .693**
Sig. (2-tailed) .000
N 32
VAR00018
Pearson Correlation .681**
Sig. (2-tailed) .000
N 32
VAR00019
Pearson Correlation .554**
Sig. (2-tailed) .001
N 32
VAR00020
Pearson Correlation .511**
Sig. (2-tailed) .003
N 32
VAR00021
Pearson Correlation .493**
Sig. (2-tailed) .004
N 32
skortotal
Pearson Correlation 1
Sig. (2-tailed)
N 32

103
RELIABILITY TEST
1. RELIABILITY TEST OF INTEREST IN PURSUING THEIR STUDY
TO HIGHER EDUCATION VARIABLE (Y)
Reliability
Scale: ALL VARIABLES
Case Processing Summary
N %
Cases
Valid 32 100.0
Excludeda 0 .0
Total 32 100.0
a. Listwise deletion based on all variables in the
procedure.
Reliability Statistics
Cronbach's Alpha N of Items
.897 14
Item-Total Statistics
Scale Mean if
Item Deleted
Scale Variance if
Item Deleted
Corrected Item-
Total Correlation
Cronbach's Alpha
if Item Deleted
VAR00001 41.9375 32.641 .422 .896
VAR00002 41.7500 29.548 .726 .884
VAR00003 41.9688 29.967 .678 .886
VAR00004 42.1563 30.910 .672 .887
VAR00005 42.0625 31.738 .475 .895
VAR00006 41.8438 32.136 .529 .893
VAR00007 41.7188 29.176 .838 .879
VAR00008 42.0625 30.770 .459 .898

104
VAR00009 41.6563 30.426 .652 .887
VAR00011 41.7500 31.613 .533 .892
VAR00012 42.1250 31.532 .608 .890
VAR00013 42.0625 32.190 .455 .895
VAR00014 42.1250 30.565 .695 .886
VAR00015 42.2188 31.209 .517 .893

105
2. RELIABILITY TEST OF STUDENT ACHIEVEMENT MOTIVATION
VARIABLE (X2)
Reliability
Scale: ALL VARIABLES
Case Processing Summary
N %
Cases
Valid 32 100.0
Excludeda 0 .0
Total 32 100.0
a. Listwise deletion based on all variables in the
procedure.
Reliability Statistics
Cronbach's Alpha N of Items
.871 17
Item-Total Statistics
Scale Mean if
Item Deleted
Scale Variance if
Item Deleted
Corrected Item-
Total Correlation
Cronbach's Alpha
if Item Deleted
VAR00001 49.8750 32.306 .380 .868
VAR00002 50.2500 33.226 .345 .869
VAR00003 49.6563 31.910 .509 .863
VAR00004 49.8125 30.544 .579 .860
VAR00005 50.4063 32.572 .441 .866
VAR00006 49.6563 31.910 .509 .863
VAR00007 50.0938 30.668 .616 .859
VAR00008 50.0938 29.894 .535 .862
VAR00011 49.9063 32.152 .418 .867
VAR00014 50.0313 29.322 .613 .858

106
VAR00015 49.6875 31.125 .578 .860
VAR00016 50.4063 30.765 .406 .870
VAR00017 49.4688 31.483 .621 .860
VAR00018 50.1250 30.500 .610 .859
VAR00019 49.7500 31.161 .522 .862
VAR00020 50.3750 30.435 .451 .867
VAR00021 50.4063 32.572 .441 .866

107
APPENDIX 3
RESEARCH DATA
a. Research Instrument Data Table
b. Primary Data Tabulation
c. Research Data SPSS Output

108
Research Instrument
Data Table

109
Father Mother Tot 1 2 3 4 5 6 7 8 9 10 11 12 13 14 15 16 17 Tot 1 2 3 4 5 6 7 8 9 10 11 12 13 14 Tot
1 4 4 8 2 3 4 4 4 4 3 4 4 4 3 4 4 4 4 3 3 61 4 4 4 4 4 4 4 3 4 4 4 4 4 3 54
2 7 4 11 3 2 4 3 4 3 4 2 4 3 3 3 4 4 3 4 3 56 3 3 3 4 3 4 4 4 4 4 4 3 4 4 51
3 8 7 15 3 2 4 3 4 4 4 4 4 4 4 4 4 4 3 4 3 62 4 4 4 2 4 4 4 4 4 4 4 3 3 4 52
4 8 4 12 2 3 3 2 4 3 4 4 3 3 3 3 4 4 2 2 2 51 4 4 3 3 4 3 3 3 3 4 3 3 3 3 46
5 8 8 16 3 3 3 2 4 3 4 3 4 2 3 4 3 4 2 3 2 52 4 4 3 3 4 3 3 2 3 4 2 4 4 2 45
6 3 3 6 2 2 3 4 4 4 3 3 3 3 3 4 4 4 3 2 2 53 4 4 4 4 3 3 4 4 4 4 3 4 4 4 53
7 4 4 8 3 4 4 2 4 3 4 3 4 3 4 3 4 3 3 3 2 56 4 4 4 3 3 4 4 4 4 4 3 4 4 4 53
8 3 3 6 3 3 3 3 3 3 3 3 3 3 3 3 3 4 3 3 3 52 4 3 3 3 3 3 4 3 4 3 3 4 3 3 46
9 7 4 11 2 2 2 2 2 3 3 1 2 1 3 3 3 3 1 1 1 35 2 2 2 2 2 2 2 3 3 3 2 3 2 2 32
10 2 4 6 3 2 2 2 4 3 3 2 3 3 3 4 4 4 2 2 3 49 4 4 3 3 2 3 3 4 3 4 2 3 3 3 44
11 4 2 6 3 4 4 3 4 4 4 3 4 4 3 4 4 3 3 3 3 60 3 4 3 3 1 3 2 4 4 4 3 2 3 4 43
12 2 3 5 3 3 3 3 3 3 3 3 3 2 3 3 4 4 3 2 3 51 3 3 3 3 3 3 3 3 3 3 3 3 4 3 43
13 8 3 11 3 4 4 3 3 4 4 3 4 3 4 3 4 3 3 3 3 58 4 4 4 3 3 3 3 3 3 3 4 4 4 3 48
14 3 4 7 2 2 3 4 4 3 2 3 4 2 3 3 4 4 3 4 2 52 4 3 2 3 4 4 4 3 4 4 3 4 3 3 48
15 2 2 4 3 2 2 2 4 3 2 3 3 2 2 3 3 3 3 3 2 45 3 3 2 3 3 3 3 3 3 3 3 3 3 3 41
16 8 7 15 3 2 4 3 4 4 4 4 4 4 4 4 4 4 3 4 3 62 4 4 4 2 4 4 4 4 4 4 4 3 3 4 52
17 3 8 11 2 3 3 2 4 3 3 2 4 3 3 4 4 4 2 3 2 51 4 3 3 4 4 4 4 4 4 4 3 3 3 3 50
18 4 9 13 2 2 3 2 4 3 2 4 4 1 4 4 4 3 1 4 1 48 2 4 4 4 4 4 4 4 4 4 4 4 4 4 54
19 4 4 8 3 4 4 3 3 3 3 3 4 4 3 3 4 4 3 2 3 56 4 4 4 3 2 3 3 4 4 4 4 4 4 4 51
20 4 4 8 2 4 3 4 4 4 4 3 4 3 3 4 4 4 3 3 2 58 4 4 4 3 4 4 4 3 4 4 3 3 3 4 51
21 4 7 11 2 3 3 3 4 4 3 3 4 2 3 3 4 3 3 3 3 53 4 4 4 4 3 3 4 3 4 4 4 3 4 4 52
22 4 8 12 2 3 3 3 3 4 4 3 3 2 3 4 3 4 3 2 3 52 3 3 3 4 4 3 4 4 3 4 3 4 3 4 49
23 4 4 8 3 2 2 4 3 3 3 1 2 2 3 3 2 3 2 3 2 43 3 3 3 3 3 4 4 4 4 4 3 4 4 3 49
24 2 3 5 2 3 2 3 4 2 2 2 2 2 2 4 4 3 1 1 2 41 2 4 2 3 4 3 3 4 4 4 2 3 3 3 44
25 4 8 12 2 2 3 3 4 3 4 3 3 2 3 2 3 4 3 2 2 48 3 3 3 3 4 3 4 4 3 4 3 3 3 2 45
26 4 4 8 3 3 4 2 3 4 2 3 3 3 3 3 3 3 4 3 3 52 2 3 2 2 3 3 2 2 2 2 2 3 3 2 33
27 8 8 16 3 2 2 3 4 2 3 3 3 2 3 3 2 4 2 3 3 47 4 4 3 3 3 3 4 3 4 3 4 3 3 3 47
28 4 4 8 3 2 4 3 3 4 4 3 4 2 4 4 4 4 3 3 2 56 4 4 3 4 3 3 4 4 4 4 4 4 4 4 53
29 9 8 17 2 3 4 2 4 4 4 4 4 3 3 4 4 3 3 2 2 55 4 4 4 4 4 4 4 4 4 4 4 4 4 4 56
30 4 4 8 3 3 4 4 3 4 3 3 3 3 3 4 4 4 4 3 2 57 3 3 3 3 4 4 4 4 4 4 3 3 3 3 48
31 8 8 16 3 3 3 4 4 4 3 3 3 3 4 3 4 4 3 3 3 57 4 4 3 3 4 4 4 4 4 4 3 3 3 4 51
32 3 3 6 2 2 3 3 3 2 3 2 3 2 3 4 4 3 2 3 2 46 2 2 3 2 4 4 4 3 4 3 3 4 4 3 45
33 4 8 12 2 2 4 3 2 3 3 3 4 1 4 1 4 4 4 3 2 49 4 4 2 4 4 4 4 4 4 4 4 4 4 4 54
34 2 3 5 2 2 3 4 3 2 2 3 3 2 3 3 3 3 3 2 2 45 3 4 2 3 3 3 3 3 3 3 2 3 3 2 40
Parents` Education Level
QuestionnaireNoStudents` Achievement Motivation Questionnaire Interest in Pursuing Study to Higher Education Questionnaire

110
35 8 4 12 2 3 2 4 4 3 4 3 4 4 3 4 4 4 3 1 3 55 3 4 4 4 4 4 4 4 4 4 3 4 4 4 54
36 8 3 11 4 3 4 3 4 3 3 3 4 4 3 4 4 4 3 3 3 59 4 4 3 3 3 3 4 4 4 3 2 3 3 3 46
37 2 3 5 2 3 4 2 3 3 3 2 3 2 4 4 3 4 2 2 3 49 4 3 3 4 4 4 3 3 4 4 4 3 3 3 49
38 8 7 15 2 2 3 2 3 3 3 2 3 2 3 3 3 3 2 2 2 43 3 3 3 3 3 3 3 3 3 3 3 3 3 3 42
39 4 4 8 2 3 3 2 2 2 3 2 3 3 3 3 3 3 3 2 3 45 2 2 3 3 3 3 3 3 3 3 3 3 3 2 39
40 7 8 15 3 3 4 4 4 4 3 4 4 3 3 3 4 4 4 4 3 61 4 4 3 4 4 4 4 4 4 4 4 4 4 4 55
41 2 3 5 4 2 3 3 4 4 3 3 3 3 3 4 3 4 3 3 3 55 4 3 3 3 3 3 4 4 3 3 2 3 3 2 43
42 8 5 13 4 3 3 4 4 4 4 2 4 3 3 3 4 4 3 2 3 57 4 4 3 4 4 4 4 4 4 4 3 4 3 3 52
43 7 4 11 2 2 3 2 2 2 2 2 2 4 1 4 2 4 1 1 1 37 3 4 3 2 2 3 3 4 3 4 1 3 3 2 40
44 4 4 8 3 2 4 4 3 3 4 3 4 4 3 3 4 4 4 3 3 58 4 4 4 4 3 3 4 3 4 4 3 3 3 4 50
45 4 4 8 3 2 3 4 3 2 3 3 2 3 3 2 3 2 2 2 2 44 3 3 3 3 3 3 3 4 4 3 3 3 4 4 46
46 4 3 7 3 2 3 2 4 3 3 3 4 3 3 3 3 4 3 3 3 52 3 4 3 3 3 3 3 3 3 3 4 3 3 3 44
47 4 3 7 3 2 4 2 2 3 2 3 4 4 4 3 4 4 3 3 1 51 4 4 4 3 4 3 4 4 4 4 3 4 4 3 52
48 2 2 4 3 2 3 3 4 3 4 2 3 2 2 3 4 3 2 3 2 48 3 4 3 4 3 3 4 4 3 4 3 4 4 3 49
49 3 3 6 2 2 3 2 3 2 3 3 3 2 2 2 3 1 1 2 2 38 4 4 3 4 4 3 4 4 3 4 3 3 2 3 48
50 4 2 6 2 3 3 4 3 3 4 3 4 4 3 3 4 4 3 3 3 56 3 3 3 2 3 3 3 2 4 3 3 2 2 4 40
51 2 2 4 3 2 4 3 4 3 4 2 4 2 2 4 4 4 1 2 2 50 2 2 2 2 2 3 4 3 4 4 2 2 2 2 36
52 2 2 4 3 3 3 4 4 4 3 3 3 3 4 3 4 4 4 3 3 58 4 3 3 3 3 3 4 3 3 3 3 3 3 4 45
53 7 4 11 4 3 4 4 4 4 4 4 4 4 4 4 4 1 4 4 4 64 4 4 4 4 3 4 3 3 4 4 4 4 4 4 53
54 8 3 11 3 3 4 4 4 4 3 3 4 4 4 3 4 4 4 2 2 59 4 4 3 4 3 4 4 3 4 4 3 4 3 4 51
55 8 8 16 2 2 3 4 4 3 3 4 3 2 2 3 4 4 2 4 2 51 4 4 3 4 4 4 4 4 4 4 4 3 3 3 52
56 3 4 7 3 3 3 3 3 3 4 2 3 4 4 4 4 4 4 3 3 57 4 4 3 4 4 4 4 4 4 4 3 4 4 4 54
57 4 4 8 3 2 4 2 4 3 4 3 3 2 3 3 4 4 2 2 3 51 3 3 3 2 3 3 3 3 3 3 3 3 3 3 41
58 4 3 7 3 3 4 4 4 4 3 3 4 4 3 4 4 2 4 4 3 60 4 4 3 4 4 4 4 3 4 4 4 3 3 3 51
59 8 8 16 3 1 3 4 4 4 3 3 4 3 3 3 4 4 4 4 2 56 3 3 4 4 4 4 4 4 4 4 4 4 3 4 53
60 2 4 6 3 3 3 4 4 4 3 3 3 3 4 4 4 4 4 3 3 59 4 4 3 3 4 3 4 3 3 3 3 3 3 2 45
61 3 3 6 1 2 4 4 3 3 3 1 3 1 2 4 4 4 3 4 1 47 2 4 3 2 4 4 3 1 3 4 4 3 3 1 41
62 4 4 8 3 2 3 4 3 3 2 4 4 3 3 3 4 4 3 2 2 52 3 3 3 3 3 3 3 3 4 4 3 3 2 4 44
63 3 3 6 3 2 3 3 3 3 3 2 4 3 3 3 4 3 3 4 3 52 4 3 3 3 3 3 4 3 3 4 4 3 4 3 47
64 2 2 4 2 3 3 3 3 3 3 3 3 3 3 4 3 4 3 3 4 53 3 4 3 2 3 3 4 3 3 4 3 3 3 3 44
65 4 8 12 2 3 4 3 3 3 4 2 4 4 3 4 4 4 4 4 3 58 3 4 3 4 4 3 4 4 4 4 3 3 3 3 49
66 8 7 15 3 3 4 4 4 4 3 3 4 4 4 3 4 4 4 2 3 60 4 4 4 3 4 4 4 4 4 4 3 4 3 4 53
67 8 8 16 3 3 3 4 4 3 3 4 4 4 4 4 4 4 3 4 3 61 4 4 4 4 4 4 4 4 4 4 3 3 3 3 52
68 2 3 5 2 2 3 4 3 3 4 3 3 3 3 4 4 4 3 2 3 53 3 3 3 3 3 3 4 4 1 4 3 3 4 4 45
69 4 4 8 3 3 4 3 3 4 4 3 3 4 4 3 4 4 4 4 3 60 4 4 3 3 4 4 4 3 4 4 3 4 4 4 52
70 3 3 6 2 2 3 4 4 4 4 4 3 2 3 2 4 4 4 4 3 56 3 4 3 4 4 4 4 3 4 4 3 3 3 3 49

111
71 8 7 15 3 3 2 4 3 3 2 3 4 2 3 3 3 4 3 3 2 50 4 3 3 3 3 4 4 3 3 3 3 3 3 3 45
72 3 4 7 2 3 2 3 3 3 3 2 3 3 2 3 3 3 2 2 2 44 2 3 3 3 2 3 3 3 3 3 2 2 2 2 36
73 4 4 8 3 3 4 3 3 3 2 3 3 3 3 4 3 3 3 3 2 51 3 2 3 4 3 3 3 4 3 3 3 3 3 3 43
74 4 3 7 2 2 4 4 4 4 2 3 4 2 3 3 4 4 3 4 3 55 4 4 4 3 3 3 4 4 4 4 3 3 3 3 49
75 7 4 11 2 3 4 3 3 4 4 3 4 4 3 3 3 3 3 2 3 54 4 4 3 4 4 4 4 4 4 4 3 4 4 4 54
76 7 2 9 3 3 4 4 4 4 4 4 4 4 3 4 4 4 4 3 3 63 4 4 3 3 3 4 4 4 4 4 4 3 3 4 51
77 3 3 6 3 3 3 3 3 3 3 3 3 3 3 4 3 4 3 3 3 53 3 4 3 3 3 3 3 4 3 3 3 3 3 3 44
78 6 4 10 3 3 4 4 4 4 4 4 4 4 3 4 4 4 4 4 4 65 4 4 4 4 3 4 4 4 4 4 4 3 4 4 54
79 4 4 8 2 2 3 3 4 4 3 3 4 2 2 2 3 3 3 3 3 49 3 3 3 3 3 3 3 3 3 3 3 3 3 3 42
80 3 3 6 2 2 3 3 3 2 2 2 3 2 2 3 4 4 2 2 2 43 2 3 2 2 2 2 3 3 3 3 2 2 2 2 33
81 4 3 7 3 3 4 4 4 4 3 3 4 4 4 4 4 4 4 2 3 61 4 4 3 4 4 4 4 4 4 4 3 3 3 4 52
82 4 3 7 3 3 3 3 3 3 3 3 4 3 3 3 4 3 3 3 2 52 3 4 3 3 3 3 3 4 3 3 3 3 3 41
83 4 4 8 3 3 4 4 4 4 4 4 4 4 3 4 3 4 4 3 3 62 4 3 4 4 4 4 4 4 4 4 4 4 4 4 55
84 4 3 7 3 3 4 3 4 3 3 3 3 2 4 4 4 4 2 2 3 54 4 4 4 3 3 3 4 3 4 4 3 4 3 4 50
85 3 4 7 2 2 2 3 3 3 2 2 3 2 2 3 4 3 2 2 2 42 3 3 2 2 3 3 3 3 3 3 2 3 3 2 38
86 3 4 7 3 2 4 3 3 2 3 4 4 4 3 4 3 4 3 2 2 53 4 4 3 4 4 4 4 4 4 4 4 3 3 2 51
87 2 2 4 2 2 3 4 3 4 4 3 4 3 2 4 4 4 3 2 3 54 3 3 2 3 3 3 4 3 4 4 3 4 3 4 46
88 4 3 7 2 2 2 3 2 3 3 3 2 3 2 3 2 3 2 2 2 41 3 3 2 3 3 3 3 3 3 3 2 3 3 3 40
89 4 3 7 2 2 3 4 3 2 3 4 4 2 3 4 3 3 2 1 2 47 3 4 3 4 3 3 3 2 4 3 3 3 2 3 43
90 4 4 8 2 3 4 3 3 4 4 3 4 4 3 4 4 4 3 2 3 57 3 4 3 4 4 3 4 4 4 4 3 3 3 4 50
91 8 4 12 2 2 4 3 4 4 2 3 4 2 3 3 4 4 3 3 2 52 4 4 3 4 3 3 4 4 4 4 3 4 4 4 52
92 2 4 6 3 3 4 4 4 4 4 3 4 3 3 4 4 4 4 4 3 62 3 3 3 3 3 3 4 3 4 3 4 3 3 4 46
93 4 3 7 3 2 3 3 3 4 3 3 3 3 3 2 3 3 2 3 2 48 3 3 3 3 3 3 3 4 3 3 3 3 3 3 43
94 3 4 7 2 2 3 4 4 3 3 3 4 3 3 2 4 4 2 2 3 51 3 3 2 1 3 4 3 4 3 4 3 4 4 3 44
95 4 4 8 3 3 4 3 3 3 2 4 3 3 3 2 4 4 2 4 2 52 2 2 2 3 2 1 2 2 3 3 4 3 3 1 33
96 3 3 6 3 3 3 1 4 4 4 3 4 3 4 4 4 4 3 4 3 58 2 3 2 2 3 3 2 3 3 2 3 2 3 2 35
97 2 3 5 3 3 4 3 3 3 4 2 4 2 3 4 4 3 3 3 4 55 3 3 3 3 2 3 2 2 3 3 4 4 4 4 43
98 3 3 6 3 3 3 3 3 3 3 3 3 3 3 3 3 3 2 2 2 48 2 3 3 3 3 3 3 3 1 3 3 3 3 3 39
99 8 3 11 2 3 4 3 3 4 3 2 3 2 3 3 3 4 3 2 3 50 4 3 3 4 3 3 3 4 4 3 3 3 4 4 48
100 8 4 12 3 3 3 4 4 4 3 4 3 3 3 4 4 4 3 2 1 55 3 4 3 4 4 4 4 4 4 4 3 3 3 4 51
101 4 4 8 3 3 4 4 3 3 4 3 3 4 3 4 4 4 4 3 3 59 3 4 3 4 4 4 4 1 3 3 3 4 3 3 46
102 2 2 4 2 1 4 4 1 1 4 4 4 2 2 4 4 4 1 1 1 44 1 1 1 3 1 2 4 4 4 4 1 2 2 1 31
103 3 3 6 2 3 3 4 4 4 3 1 4 4 4 3 4 4 3 3 1 54 4 4 3 3 4 4 4 3 4 4 4 3 3 4 51
104 8 8 16 2 2 2 1 4 4 4 4 3 3 3 3 4 4 4 1 1 49 4 4 4 4 4 4 4 4 4 4 3 4 4 4 55
105 6 4 10 2 2 4 4 4 4 2 3 4 2 2 4 4 4 3 2 2 52 4 4 3 3 4 4 4 2 4 4 4 4 4 3 51
106 9 8 17 3 3 3 4 3 3 3 4 3 2 3 3 3 3 3 3 2 51 3 4 4 4 4 4 4 4 4 4 3 3 3 3 51
107 4 3 7 3 3 3 3 3 3 3 3 3 3 3 3 3 3 3 3 3 51 3 3 3 3 3 3 3 3 3 3 3 3 3 3 42

112
108 8 4 12 2 3 3 4 3 4 2 4 4 3 3 3 4 3 4 3 2 54 4 4 3 4 4 4 4 3 4 3 4 4 4 3 52
109 4 7 11 3 2 4 4 3 2 4 3 4 4 4 4 4 4 4 1 1 55 4 4 4 4 3 2 4 3 4 4 3 3 4 4 50
110 7 2 9 2 2 3 2 3 2 3 2 2 2 2 2 2 3 2 2 2 38 2 2 3 2 3 4 3 3 3 3 3 2 2 3 38
111 4 4 8 2 2 3 4 4 4 2 2 4 2 4 3 3 2 2 2 2 47 4 4 3 2 3 2 2 3 3 3 2 3 3 3 40
112 3 4 7 3 4 4 3 3 3 3 3 3 4 4 2 4 3 3 4 3 56 3 3 3 3 3 3 3 4 4 4 3 3 3 3 45
113 8 4 12 2 2 4 4 4 4 3 4 4 4 3 4 3 4 4 4 2 59 4 4 4 4 4 4 4 4 4 4 3 3 3 4 53
114 4 3 7 2 2 3 3 3 3 3 3 3 2 3 3 3 3 2 2 2 45 4 4 4 4 4 3 4 4 4 4 3 4 4 4 54
115 3 3 6 2 3 4 4 4 4 3 2 4 3 4 3 4 2 4 3 2 55 3 3 3 3 4 4 4 4 4 4 3 3 4 3 49
116 3 3 6 2 3 3 4 3 3 2 4 4 2 3 4 4 1 3 4 2 51 4 4 3 4 4 3 4 4 4 4 3 3 3 3 50
117 4 3 7 3 2 3 1 3 2 3 3 4 1 3 4 2 3 1 4 2 44 4 4 4 4 1 4 4 4 4 4 4 4 4 4 53
118 2 2 4 3 3 3 4 3 3 2 2 4 3 3 3 4 2 2 2 2 48 3 3 3 3 3 3 3 3 3 3 3 3 4 3 43
119 4 4 8 2 2 3 4 3 3 4 3 4 2 3 4 4 4 2 4 2 53 4 4 4 3 2 3 4 4 4 4 3 4 4 4 51
120 4 8 12 2 3 4 3 3 3 3 4 4 3 3 3 3 3 3 3 2 52 3 3 3 3 3 3 3 3 3 3 3 3 3 3 42
121 2 2 4 3 3 3 3 2 2 3 2 3 2 2 3 3 3 2 2 2 43 3 3 2 2 3 3 3 2 3 2 2 2 2 3 35
122 8 4 12 2 1 3 1 3 2 2 2 3 1 3 3 3 3 1 3 2 38 3 3 3 4 4 3 1 4 3 3 3 3 3 3 43
123 4 4 8 2 3 3 4 4 3 3 4 4 3 3 4 4 4 3 3 2 56 4 4 4 4 3 3 4 4 4 4 4 4 4 4 54
124 4 4 8 3 3 4 3 4 3 3 3 3 3 3 4 3 4 2 2 2 52 3 3 3 2 3 3 4 4 4 4 3 3 3 3 45
125 8 4 12 4 3 3 3 4 4 3 3 4 3 4 4 3 3 3 2 3 56 4 4 4 3 4 4 4 4 4 4 3 3 3 4 52
126 3 3 6 3 2 3 4 3 3 3 3 3 3 3 3 3 3 4 2 1 49 3 3 3 3 4 4 4 3 3 3 3 3 3 2 44
Tot 581 530 1111 32
5
32
4
41
7
40
4
43
0
40
9
39
6
37
1
43
9
35
7
38
6
42
3
45
3
44
5
35
9
34
4
30
4
65
86
42
5
44
1
39
1
40
6
41
5
42
2
44
8
43
2
45
0
45
5
39
2
41
0
40
9
40
4
59
00

113
Primary Data
Tabulation

114
Parents` Education Level
(X1)
Students` Achievement
Education
(X2)
Interest in Pursuing
Study to Higher
Education
(Y)
1 8 61 54
2 11 56 51
3 15 62 52
4 12 51 46
5 16 52 45
6 6 53 53
7 8 56 53
8 6 52 46
9 11 35 32
10 6 49 44
11 6 60 43
12 5 51 43
13 11 58 48
14 7 52 48
15 4 45 41
16 15 62 52
17 11 51 50
18 13 48 54
19 8 56 51
20 8 58 51
21 11 53 52
22 12 52 49
23 8 43 49
24 5 41 44
25 12 48 45
26 8 52 33
27 16 47 47
28 8 56 53
29 17 55 56
30 8 57 48
31 16 57 51
32 6 46 45
33 12 49 54
34 5 45 40
35 12 55 54
36 11 59 46
37 5 49 49
No
Questionnaire Data

115
38 15 43 42
39 8 45 39
40 15 61 55
41 5 55 43
42 13 57 52
43 11 37 40
44 8 58 50
45 8 44 46
46 7 52 44
47 7 51 52
48 4 48 49
49 6 38 48
50 6 56 40
51 4 50 36
52 4 58 45
53 11 64 53
54 11 59 51
55 16 51 52
56 7 57 54
57 8 51 41
58 7 60 51
59 16 56 53
60 6 59 45
61 6 47 41
62 8 52 44
63 6 52 47
64 4 53 44
65 12 58 49
66 15 60 53
67 16 61 52
68 5 53 45
69 8 60 52
70 6 56 49
71 15 50 45
72 7 44 36
73 8 51 43
74 7 55 49
75 11 54 54
76 9 63 51
77 6 53 44
78 10 65 54
79 8 49 42
80 6 43 33

116
81 7 61 52
82 7 52 41
83 8 62 55
84 7 54 50
85 7 42 38
86 7 53 51
87 4 54 46
88 7 41 40
89 7 47 43
90 8 57 50
91 12 52 52
92 6 62 46
93 7 48 43
94 7 51 44
95 8 52 33
96 6 58 35
97 5 55 43
98 6 48 39
99 11 50 48
100 12 55 51
101 8 59 46
102 4 44 31
103 6 54 51
104 16 49 55
105 10 52 51
106 17 51 51
107 7 51 42
108 12 54 52
109 11 55 50
110 9 38 38
111 8 47 40
112 7 56 45
113 12 59 53
114 7 45 54
115 6 55 49
116 6 51 50
117 7 44 53
118 4 48 43
119 8 53 51
120 12 52 42

117
121 4 43 35
122 12 38 43
123 8 56 54
124 8 52 45
125 12 56 52
126 6 49 44
Total 1111 6586 5900

118
Research Data SPSS
Output

119
DESCRIPTIVES
Statistics
Parents`_Educa
tion_Level
Students`_Achi
evement_Educa
tion
Interest_in_Pur
suing_Study_to
_Higher_Educat
ion
N Valid 126 126 126
Missing 0 0 0
Mean 8,82 52,27 46,83
Std. Error of Mean ,309 ,551 ,518
Median 8,00 52,00 48,00
Mode 8 52 51
Std. Deviation 3,467 6,183 5,820
Variance 12,022 38,231 33,873
Range 13 30 25
Minimum 4 35 31
Maximum 17 65 56
Sum 1111 6586 5900

120
Frequency Table
Parents`_Education_Level
Frequency Percent Valid Percent
Cumulative
Percent
Valid 4 9 7,1 7,1 7,1
5 7 5,6 5,6 12,7
6 20 15,9 15,9 28,6
7 20 15,9 15,9 44,4
8 24 19,0 19,0 63,5
9 2 1,6 1,6 65,1
10 2 1,6 1,6 66,7
11 12 9,5 9,5 76,2
12 13 10,3 10,3 86,5
13 2 1,6 1,6 88,1
15 6 4,8 4,8 92,9
16 7 5,6 5,6 98,4
17 2 1,6 1,6 100,0
Total 126 100,0 100,0
Students`_Achievement_Education
Frequency Percent Valid Percent
Cumulative
Percent
Valid 35 1 ,8 ,8 ,8
37 1 ,8 ,8 1,6
38 3 2,4 2,4 4,0
41 2 1,6 1,6 5,6
42 1 ,8 ,8 6,3
43 4 3,2 3,2 9,5
44 4 3,2 3,2 12,7
45 4 3,2 3,2 15,9
46 1 ,8 ,8 16,7
47 4 3,2 3,2 19,8
48 6 4,8 4,8 24,6
49 6 4,8 4,8 29,4
50 3 2,4 2,4 31,7
51 11 8,7 8,7 40,5

121
52 14 11,1 11,1 51,6
53 7 5,6 5,6 57,1
54 5 4,0 4,0 61,1
55 8 6,3 6,3 67,5
56 10 7,9 7,9 75,4
57 5 4,0 4,0 79,4
58 6 4,8 4,8 84,1
59 5 4,0 4,0 88,1
60 4 3,2 3,2 91,3
61 4 3,2 3,2 94,4
62 4 3,2 3,2 97,6
63 1 ,8 ,8 98,4
64 1 ,8 ,8 99,2
65 1 ,8 ,8 100,0
Total 126 100,0 100,0
Interest_in_Pursuing_Study_to_Higher_Education
Frequency Percent Valid Percent
Cumulative
Percent
Valid 31 1 ,8 ,8 ,8
32 1 ,8 ,8 1,6
33 3 2,4 2,4 4,0
35 2 1,6 1,6 5,6
36 2 1,6 1,6 7,1
38 2 1,6 1,6 8,7
39 2 1,6 1,6 10,3
40 5 4,0 4,0 14,3
41 4 3,2 3,2 17,5
42 4 3,2 3,2 20,6
43 9 7,1 7,1 27,8
44 8 6,3 6,3 34,1
45 9 7,1 7,1 41,3
46 7 5,6 5,6 46,8
47 2 1,6 1,6 48,4
48 5 4,0 4,0 52,4
49 8 6,3 6,3 58,7
50 6 4,8 4,8 63,5

122
51 13 10,3 10,3 73,8
52 12 9,5 9,5 83,3
53 8 6,3 6,3 89,7
54 9 7,1 7,1 96,8
55 3 2,4 2,4 99,2
56 1 ,8 ,8 100,0
Total 126 100,0 100,0

123
Test of Linearity
Case Processing Summary
Cases
Included Excluded Total
N Percent N Percent N Percent
Interest_in_Pursuing_Study_t
o_Higher_Education *
Parents`_Education_Level
126 100,0% 0 ,0% 126 100,0%
Report
Interest_in_Pursuing_Study_to_Higher_Education
Parents`_Education_Level Mean N Std. Deviation
4 41,11 9 5,904
5 43,86 7 2,734
6 44,60 20 5,113
7 46,50 20 5,577
8 46,79 24 6,345
9 44,50 2 9,192
10 52,50 2 2,121
11 47,92 12 6,230
12 49,38 13 4,134
13 53,00 2 1,414
15 49,83 6 5,115
16 50,71 7 3,498
17 53,50 2 3,536
Total 46,83 126 5,820

124
ANOVA Table
Sum of
Squares df
Mean
Square F Sig.
Interest_in_Pursuin
g_Study_to_Higher_
Education *
Parents`_Education
_Level
Between
Groups
(Combined) 956,899 12 79,742 2,749 ,003
Linearity 776,128 1 776,128 26,761 ,000
Deviation from
Linearity
180,771 11 16,434 ,567 ,852
Within Groups 3277,260 113 29,002
Total 4234,159 125
Measures of Association
R R Squared Eta Eta Squared
Interest_in_Pursuing_Study_to
Higher_Education *
Parents`_Education_Level
,428 ,183 ,475 ,226

125
Case Processing Summary
Cases
Included Excluded Total
N Percent N Percent N Percent
Interest in Pursuing Their Study
to Higher Education * Students`
Achievement Motivation
126 100.0% 0 0.0% 126 100.0%
Report
Interest in Pursuing Their Study to Higher Education
Student Achievement Motivation Mean N Std. Deviation
35 32.00 1 .
37 40.00 1 .
38 43.00 3 5.000
41 42.00 2 2.828
42 38.00 1 .
43 39.75 4 7.274
44 41.50 4 9.883
45 43.50 4 7.047
46 45.00 1 .
47 42.75 4 3.096
48 45.50 6 5.282
49 48.00 6 5.550
50 43.00 3 6.245
51 46.73 11 4.315
52 44.29 14 5.703
53 48.57 7 4.036
54 50.60 5 2.966
55 49.38 8 4.627
56 50.10 10 4.408
57 51.00 5 2.236
58 46.33 6 5.922
59 48.20 5 3.564
60 49.75 4 4.573
61 53.25 4 1.500
62 51.25 4 3.775
63 51.00 1 .
64 53.00 1 .
65 54.00 1 .
Total 46.83 126 5.820

126
ANOVA Table
Sum of
Squares
df Mean
Square
F Sig.
Interest in Pursuing
Their Study to Higher
Education * Student
Achievement Motivation
Between
Groups
(Combined) 1750.047 27 64.817 2.557 .000
Linearity 1252.923 1 1252.923 49.429 .000
Deviation
from Linearity
497.125 26 19.120 .754 .792
Within Groups 2484.112 98 25.348
Total 4234.159 125
Measures of Association
R R Squared Eta Eta Squared
Interest in Pursuing Their Study to Higher
Education * Student Achievement Motivation
.544 .296 .643 .413

127
Test of Collinearity
Correlations
Parents`_Education
_Level
Students`_Achievem
ent_Education
Parents`_Education_Level Pearson Correlation 1 ,176*
Sig. (2-tailed) ,048
N 126 126
Students`_Achievement_Education Pearson Correlation ,176* 1
Sig. (2-tailed) ,048
N 126 126
*. Correlation is significant at the 0.05 level (2-tailed).

128
Simple Correlation 1 Test
Variables Entered/Removedb
Model Variables Entered Variables Removed Method
dimension0
1 Parents`_Education_Levela . Enter
a. All requested variables entered.
b. Dependent Variable:
Interest_in_Pursuing_Study_to_Higher_Education
Model Summary
Model R R Square Adjusted R Square Std. Error of the Estimate
dimension0
1 ,428a ,183 ,177 5,281
a. Predictors: (Constant), Parents`_Education_Level
ANOVAb
Model Sum of Squares df Mean Square F Sig.
1 Regression 776,128 1 776,128 27,831 ,000a
Residual 3458,031 124 27,887
Total 4234,159 125
a. Predictors: (Constant), Parents`_Education_Level
b. Dependent Variable: Interest_in_Pursuing_Study_to_Higher_Education
Coefficientsa
Model
Unstandardized Coefficients
Standardized
Coefficients
t Sig. B Std. Error Beta
1 (Constant) 40,489 1,290 31,387 ,000
Parents`_Education_Level ,719 ,136 ,428 5,275 ,000
a. Dependent Variable: Interest_in_Pursuing_Study_to_Higher_Education

129
Simple Correlation 2 Test
Variables Entered/Removeda
Model Variables Entered Variables
Removed
Method
1
Student
Achievement
Motivationb
. Enter
a. Dependent Variable: Interest in Pursuing Their Study to
Higher Education
b. All requested variables entered.
Model Summary
Model R R Square Adjusted R
Square
Std. Error of the
Estimate
1 .544a .296 .290 4.903
a. Predictors: (Constant), Student Achievement Motivation
ANOVAa
Model Sum of Squares df Mean Square F Sig.
1
Regression 1252.923 1 1252.923 52.113 .000b
Residual 2981.236 124 24.042
Total 4234.159 125
a. Dependent Variable: Interest in Pursuing Their Study to Higher Education
b. Predictors: (Constant), Student Achievement Motivation
Coefficientsa
Model Unstandardized Coefficients Standardized
Coefficients
t Sig.
B Std. Error Beta
1 (Constant) 20.061 3.733 5.374 .000
Student Achievement Motivation .512 .071 .544 7.219 .000
a. Dependent Variable: Interest in Pursuing Their Study to Higher Education

130
Multiple Correlation Test
Variables Entered/Removedb
Model
Variables Entered
Variables
Removed Method
dimension0
1 Students`_Achievement_Education,
Parents`_Education_Levela
. Enter
a. All requested variables entered.
b. Dependent Variable:
Interest_in_Pursuing_Study_to_Higher_Education
Model Summary
Model R R Square Adjusted R Square Std. Error of the Estimate
dimension0
1 ,640a ,410 ,400 4,507
a. Predictors: (Constant), Students`_Achievement_Education, Parents`_Education_Level
ANOVAb
Model Sum of Squares df Mean Square F Sig.
1 Regression 1735,413 2 867,706 42,713 ,000a
Residual 2498,746 123 20,315
Total 4234,159 125
a. Predictors: (Constant), Students`_Achievement_Education, Parents`_Education_Level
b. Dependent Variable: Interest_in_Pursuing_Study_to_Higher_Education
Coefficientsa
Model
Unstandardized Coefficients
Standardized
Coefficients
t Sig. B Std. Error Beta
1 (Constant) 17,959 3,459 5,193 ,000
Parents`_Education_Level ,576 ,118 ,343 4,873 ,000
Students`_Achievement_Ed
ucation
,455 ,066 ,484 6,872 ,000
a. Dependent Variable: Interest_in_Pursuing_Study_to_Higher_Education

131
APPENDIX 4
Research
Permission

132
Research
Permission
Letter
133
134

135