Embed Size (px)
Citation preview
The Relationship Between Institutional Factors and Economic Success of Countries
Elvis Rambanapasi
Quinnipiac University
The purpose of this study is to identify a set of institutional factors that may be considered as critical for the economic success of a broad range of countries. Using data from the United Nations, Transparency International, Political Risk Services, Geert Hofstede, and the U.S. Central Intelligence Agency this study identified five variables that explained approximately 70% of the variance in the economic status of 65 countries. These variables included, individualism, corruption, gender inequality, political stability, and women’s tertiary education with the measure of economic status identified as GDP /cap/ppp. Results, limitations, implications and suggested future research are discussed. INTRODUCTION
Sustainable economic success is an issue of great concern among all nations; big and small. Many
economic gatherings such as the World Economic Forum take place with an aim of coming up with ideas that might help in combating economic decline and promote economic growth and success for the betterment of people’s lives. There are many institutional factors, by different experts in the field of economics and business, that are said to greatly affect economic development but there is little consensus regarding the “best factors” for a given country. Hence different governments are forced to adapt those factors that they think might work for them. This has led to varying economic growth rates since not all applications derived from these many theoretical approaches have the same effect on an economy.
The result is that while some countries appear to have a sustainable economic prosperity, others appear “stuck” at the bottom of the economic pyramid. While few, if any, economists and business people would argue that any single approach is the best for all countries, there is clearly a need to continue the effort of identifying key factors that appear to explain the success of the majority of countries.
Therefore the overall objective of this study is to identify the set of institutional factors that may be considered as critical for the economic success of a broad range of countries. These ‘factors’ can then be used by governments, businesses, academics and individuals as they strategize ways to promote economic success. The role of women in this study is also of particular importance as studies have suggested the critical role of women in economic development.
When one considers the potential economic variables identified by the World Bank, the United Nations, the Heritage Foundation, and a host of other organizations, the candidates for potential “key institutional factors of economic success” are indeed large. This study uses a review of these sources combined with scholarly articles to identify a limited number of economic categories including culture, formal institutions and human development with a specific emphasis on the role of women. Using a broad range of secondary data sources, a total of 25 variables were examined with five variables being chosen to
72 Journal of Applied Business and Economics vol. 13(4) 2012
represent each of the major categories chosen for this study. These variables can be generally labeled as “political stability,” “corruption,” “culture,” “gender equality” and “women tertiary education”. The dependent variable chosen for this study was gross domestic product per capita using purchasing power parity (GDP/cap/ppp).
The following sections of this paper briefly reviews each of these variables, the methodology used, the results, and finally a discussion of the results including limitations of the study and suggestions for future research. INSTITUTIONAL THEORY According to Baumol (1990), institutions can be perceived as “the rules of the game” for a society and include two general classifications. Scott (2001) labels the first of these classifications as “formal institutions” which he considers to be the regulative which includes the rules within a society such as legal systems and government regulations. The second classification consists of what Scott calls “informal institutions” which consist of normative and cognitive constraints that result in a society’s code of conduct. Literature suggests that both of these classifications can impact economic success of nations (Williamson, 2009; Beck & Laeven, 2006; Hofstede, 2001). This study includes both classifications of institutions with culture representing informal institutions, and political stability, corruption, gender inequality and women’s tertiary education representing formal institutions. ECONOMIC SUCCESS Economic success is an issue of great concern among economists and the ordinary citizen walking down the street. Besides the national pride that comes with a successful economy, economic development has a major impact on the daily lives of the people that populate an economy. The standard of living for people who live in a country with a higher GDP/cap/ppp, is generally expected to be higher than that of those who live in a country with a lower GDP/cap/ppp. GDP is a preferable measurement of economic success as compared to other measurements, such as Gross National Product (GNP), because it focuses on production from within a country, hence offering a more logical and fairer comparison of several countries. Countries with a bigger population are generally expected to have higher GDP hence measuring GDP per capita (per person) averages out the GDP for a fair comparison. Using Purchasing Power Parity (ppp) instead of just GDP/cap adjusts for the effects of price differences in different economies. Therefore it is believed that this is an acceptable measure of the economic success of a country. POLITICAL STABILITY The economic impact of political stability on GDP is seen in many ways including the reluctance of foreign and local investors to invest in a country that is politically insecure. For example, Batra and Scully (1979) suggest that economic development is retarded when a country’s terms of trade are deteriorating. Such deterioration may occur when a country’s terms of trade do not allow investors enough room to make their own decisions. In addition most employers would agree that they must be allowed a chance to hire whom they deem qualified for a job and also be allowed room to make profit since that is the main reason they are in business. Imposing huge taxes on companies might end up countering the effort to bring development since investors would look for other potential countries that might have more favorable tax obligations, e.g. Ukraine’s economic growth performance over the period 1992–2004 has been one of the worst among transition economies partially because of onerous taxes (Beck & Laeven, 2006). Another example might include the issue of ownership which can impact economic success since foreign investors would want to have a sense of ownership on their investment. Taking for example, in Zimbabwe the government now demands a 51 percent local ownership on all
Journal of Applied Business and Economics vol. 13(4) 2012 73
mining activities. This may lead to foreign investors not wanting to invest in Zimbabwe’s mining industry since they won’t have the majority of shares as compared to local investors, hence their decisions may be vetoed by those of the locals. So countries should be very careful when they chart their strategies of handling business. Therefore, because political stability is believed to have an impact on economic success, I then hypothesized that:
Hypothesis 1 (H1): Political stability, as measured by the Political Risk Index (PRI) will significantly impact the GDP of countries.
CORRUPTION
According to Denis (2001), corruption can be defined in a very simple language as: “Giving something to someone with power so that he will abuse his power and act favoring the giver”. Such an act includes, but is not limited to, bribery, nepotism, misappropriation of funds, misapplication of funds, abuse of power and strategic spending.
It has been suggested that corruption is a phenomenon that is pervasive in all polities, but the dimension and intensity vary from country to country and from one polity to another (Idakwoji, 2010).
Agbakoba (2003) has argued that, wisdom is a thing that is essential to everyone, but is hardly possessed by many. Wisdom is required for good administration and it presupposes knowledge of good and evil, and the knowledge of essence of things. Agbakoba observes that today in Nigeria everyone who has corruptly enriched him/herself and has “bull-dozed” his/her way into the leadership positions now claims to have the “wisdom” to lead and tries to legitimize his/her value system. Therefore, every society or state is tied in some way to the individual leadership of that state.
A leader, therefore, is a “mirror” whose behavior – good or bad – influences the behavior of the followers and whose values also influence the values of the entire society (Idakwoji, 2010). According to Idakwoji (2010) the behavior of a leader, which may be seen to include government officials, influences the behavior of society. Bishop and Hydoski (2009) claim that a major fraud or corruption can set off a chain reaction resulting in serious corporate harm or failure which can in turn injure the economy of a nation. For example much of Africa suffers a great deal of economic underdevelopment. This, to some extent, can be attributed to the corruption that is embedded in the political economy of Africa. Various forms of corruption are intrinsically linked to the way power is exercised. Harsch (1993) suggests that ruling elites in regimes with limited legitimacy regard corruption purely in terms of political functionality and as a source of patronage which will strengthen their political power. The more these elites are able to privatize state resources, the more they can distribute favors and create a base of consensus for their privileged position.
An article by the World Bank titled Silent and Lethal (anonymous, 2010) argues that such control of the state creates an environment conducive to misconduct by frontline service providers such as government employees. The scheme of insiders profiting from biased rules in the system is mirrored in society. Police exert their influence to extract benefits from the disorganized mass of road users; doctors do not show up in public facilities and instead provide services privately; teachers do not show up in classes since they have a second job and their impunity is guaranteed by their superiors in exchange for other favors, and so forth (World Bank). It follows that corruption becomes an unavoidable element of daily life for most citizens and it diffuses throughout the economy; more big-time corruption begets corruption at the frontlines of service delivery, which in turn supports big-time corruption, creating formidable challenges to governance and accountability interventions. Consequently, because of the evidence of corruption impacting economic success, I hypothesized that:
Hypothesis 2 (H2): Corruption as measured by Corruptions Perceptions Index (CPI) will significantly impact the GDP of countries.
74 Journal of Applied Business and Economics vol. 13(4) 2012
GENDER INEQUALITY
Fatima and Sultana (2009) suggested that female participation in an economy is of particular importance for modern day economic success and that women’s full integration into the economy is a desirable goal for equity and efficiency considerations. The equity aspect means that labor market participation of women will improve their relative economic position in a society. Such equity will increase overall economic efficiency and improve development potential. Economists have explored the causes of gender inequalities that persist over time and across countries, integrating research methods and findings from a variety of disciplines including sociology, anthropology, and psychology in order to understand the mechanisms that contribute to the embeddedness and persistence of an unequal gender system. This research agenda found out that gender inequality affects development and growth, and is itself endogenous – that is, macroeconomic policies and the pace of growth influence the degree of gender equality (Seguino, 2008). Also gender equality is one of the United Nations’ (UN) Millennium Development Goals (MDGs). According to Buvinic, Andrew Morrison, Waafas, and Mirja Sjöblom (2008) gender equality is seen as a “catalyst” for realization of poverty reduction and sustainable economic growth.
A recent OECD (2011) publication pointed out that, “Gender equality strengthens long-term economic development.” Hence from seeing the supported effects of gender inequality on an economy, I hypothesized that:
Hypothesis 3 (H3): Gender Inequality as measured by the Gender Inequality Index (GII) will have a significant inverse impact on the GDP of countries.
CULTURE
Geert Hofstede (2001) defined it as "the collective programming of the mind distinguishing the members of one group or category of people from another". The "category" can refer to nations, regions within or across nations, ethnicities, religions, occupations, organizations, or the genders.
There is much debate as to whether or not the culture of a certain people affects the economic performance of its country (Franke, Hofstede, & Bond, 1991; Hofstede, 2001; House, Hanges, Javidan, Dorfman, and Gupta, 2004; Papamarcos & Watson, 2006). Researchers on this subject have come out with different results pertaining to this issue, but a strong case has been made that culture impacts economic performance. Papamarcos and Watson (2006) found that, “when it comes to economic growth, not all cultures are created equal.” Certain cultural beliefs and values of a people could enhance or hamper their economic development.
There have been several attempts to establish a cause-and-effect relationship between culture and economic performance. Franke et al. (1991) studied how cultural variables could affect a nation’s economic performance including Hofstede’s dimensions and found individualism to be negatively related to economic performance. Papamarcos and Watson (2006) found that individualism had the highest positive correlation with economic development. House et al. (2004) observed that a number of researchers have found individualism to have a positive relationship with economic development. Hofstede (2001) on the other hand has suggested that economic development may actually increase the presence of individualism in a country.
Engle et al. (2011) have argued that societal conditioning shaped by culture largely determines the economic behavior of its citizens including the attitudes towards educational activity leading to innovation and economic opportunities, and even the orientation towards the acceptance of societal change resulting from economic development. Based upon the work of Papamarcos and Watson (2006) and House et al. (2004) the next hypothesis is;
Hypothesis 4 (H4): The cultural dimension of Individuality will have a significant positive impact on the GDP of countries.
Journal of Applied Business and Economics vol. 13(4) 2012 75
WOMEN’S TERTIARY EDUCATION
Researchers found that education is “imperative” for national economic development (Azam & Ahmed, 2010) with education being found to be positively associated with the probability of self employment (Cowling & Taylor, 2001). Furthermore researchers found that economic activity increases directly with the increasing level of educational attainment (Dolinski, Caputo, Pasuarty, & Quazi, 1993). Since female literacy is linked to fertility, child health, and economic opportunities for women, investing in women’s education is crucial for transforming economic growth into positive development outcomes (Summers, 1994). In addition, female education can increase productivity of women at home (Becker, 1975; 1985) or in the workplace (Schultz, 1960). In the past thirty years, developing countries have invested significant resources to expand female schooling (Hill & King, 1993; Herz & Sperling, 2004).
According to Khorasgani (2008), tertiary education results in highly qualified graduates and responsible citizens who are able to meet the needs of a society, including economic development. Khorasgani found that tertiary education had a positive effect on economic growth. Kobeisi (2010) found that female education in particular resulted in higher levels of entrepreneurial activity which in turn contributes greatly to any country’s economic growth. Consequently, from noticing the impact of women tertiary education on an economy, I hypothesized that:
Hypothesis 5 (H5): Women Tertiary Education will significantly impact the GDP of countries.
METHODOLOGY
I obtained data from reliable sources such as the United Nations, World Bank, Transparency International and the Heritage Foundation and formatted to allow for analysis. Using the research literature as a guide I identified 25 variables that had accessible data sources and analyses were completed using SPSS and Excel.
Of these 25 variables, 20 variables explained very little of the dependent variable (economic performance as measured by GDP/cap/ppp) hence they were discarded and 5 variables that offered more explanation were left. These five variables are; culture, corruption, political risk, gender inequality and female tertiary education.
The dependent variable was GDP/cap/ppp obtained from the CIA World Factbook (2010). The following are definitions of each of the independent variables and their data sources. Culture according to Geert Hofstede (2001) is defined as "the collective programming of the mind distinguishing the members of one group or category of people from another". Hofstede identified five potential cultural dimensions including: masculinity/femininity; individualism/collectivism; power distance; uncertainty avoidance; and long-term orientation. Of these five dimensions my analysis found only individualism to be significant at p<0.05. Individualism/collectivism is the degree to which individuals are integrated into groups versus the individual. A high individualism usually reflects an emphasis on self and the immediate family more so than on extended family and society which is identified as collectivism. These data were obtained from Geert Hoftede’s cultural dimensions website (Itim International, 2011).
Corruption, according to Transparency International is defined as, “the abuse of entrusted power for private gain”. This definition encompasses corrupt practices in both the public and private sectors. The Corruption Perceptions Index (2010) ranks countries according to the perception of corruption in the public sector. The Corruption Perceptions Index (CPI) is an aggregate indicator that combines different sources of information about corruption, making it possible to compare countries. The 2010 CPI draws on different assessments and business opinion surveys carried out by independent and reputable institutions. It captures information about the administrative and political aspects of corruption. Broadly speaking, the surveys and assessments used to compile the index include questions relating to bribery of public
76 Journal of Applied Business and Economics vol. 13(4) 2012
officials, kickbacks in public procurement, embezzlement of public funds, and questions that probe the strength and effectiveness of public sector anti-corruption efforts.
Political stability according to the Political Risk Services is calculated by using 17 risk components, 12 with an 18-month forecast horizon and five with a five-year forecast horizon. The result is known as the Political Risk Index. The 18-month risk components in the PRS Risk Yearbook (2010) are: Political/Societal turmoil, Restrictions on equity, Restrictions on local operations, Taxation discrimination, Repatriation restrictions, Exchange controls, Tariff barriers, Nontariff barriers, Payment delays, Expansionary economic policies, Labor costs, and Foreign debt. The five-year risk components are: Political/Societal turmoil, Investment restrictions, Restrictions on foreign trade, Domestic economic problems, and International economic problems.
The Gender Inequality Index is a composite measure reflecting inequality in achievements between women and men in three dimensions: reproductive health, empowerment (including secondary and higher education attainment) and women’s participation in the work force. It varies between zero (when women and men fare equally) and one (when men or women tend to be unequal in all dimensions).
Women tertiary education is the percentage of women enrolled in tertiary education. A few time periods were examined to see if a potential lag effect could be identified. It was found that a 10 year lag appear to have the most significant impact. Such a lag would make sense as a more significant increase in economic impact might be expected 10 years after education is completed rather than either an immediate impact or one from a 5 year time period. This resulted in the United Nation’s Gender Inequality Index (2000) data being used. RESULTS
Table 1 shows the correlations among the independent variables and also their respective individual correlations with the dependent variable (GDP/cap/ppp). All the correlations are significant with p<0.001. As can be seen from the table, the correlations between the independent variables and the dependent variable range from a high of 84.3% correlation between gender inequality and GDP, to a low of 69.2% correlation between political stability and GDP. The relationship on gender inequality is a negative because the greater the gender inequality the lower the GDP and vice versa. Amongst the independent variables the highest correlation is between corruption and political risk (72.4% correlation), which is very reasonable considering that these 2 types of formal institutions both greatly involve the legal system and government. The least correlation is between women tertiary education and political risk (51.1% correlation). These are all relatively high correlations. Multi-collinearity was checked and all the Variance Inflationary Factors (VIF) were below 5.00; the highest was on gender inequality which was 3.46. Levine, Stephan, Krehbiel & Berenson (2005) indicate that VIF scores below 5 suggest an acceptable level for regression analysis. These results are based on the analysis of 53 countries that had data on all the variables, and the correlations suggest the hypotheses to be true.
Tables 2 and 3 show the results of the regressions analysis, first with a different number of countries (Table 2) and then with the same set of countries (Table 3). In both tables all the variables were significant. In table 2, individuality had 77 observations and had an R-Square (R-sq.) of 0.35 that is 35% of the variance in GDP of these countries was explained by individuality. Also on this analysis of Hofstede’s cultural dimensions, power distance had a p-value of 0.053 and R-Sq. of 0.03 hence it was not used since only a significance level of p<0.05 was acceptable. After regressing gender inequality (Table 2), 29% of the variance in GDP was explained by gender inequality and there were 137 observations. It is also of essence to note that for the bottom 69 countries ranked according to GDP 37% of the variance was explained by gender inequality implying that only less than 20% variance of the top half was explained by gender inequality. This observation means that gender inequality has more effect on relatively poor countries as compared to richer ones.
Journal of Applied Business and Economics vol. 13(4) 2012 77
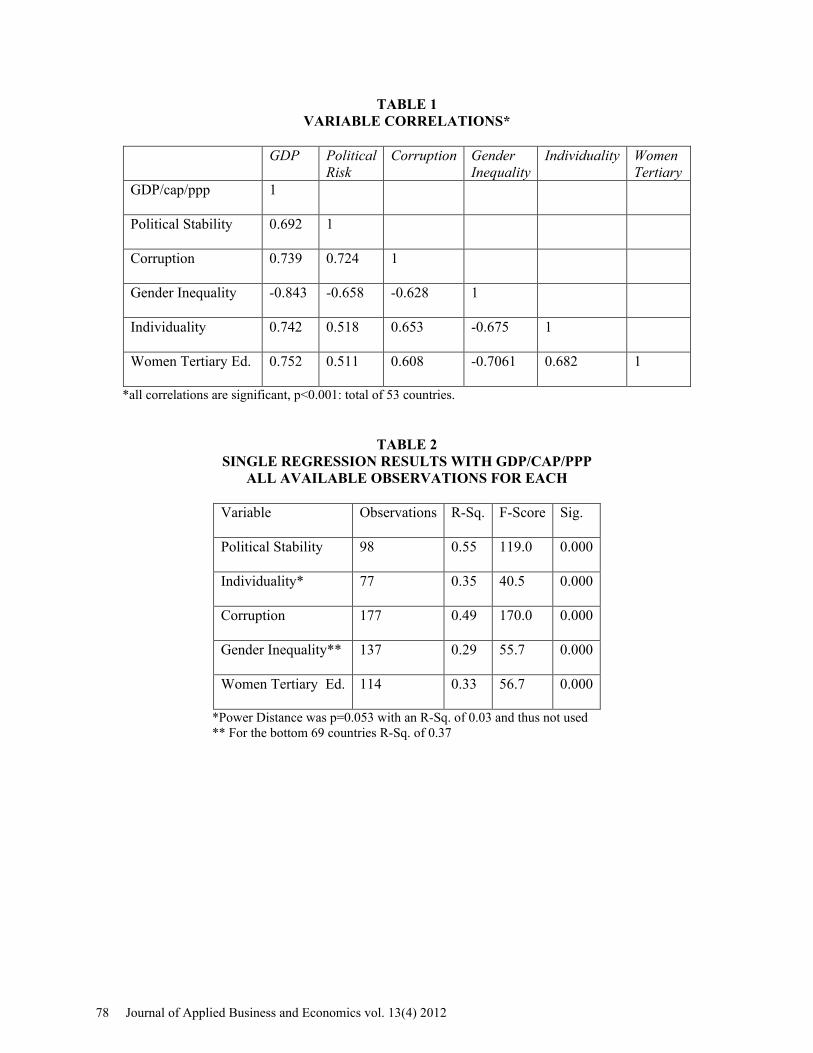
TABLE 1 VARIABLE CORRELATIONS*
GDP Political
Risk Corruption Gender
Inequality Individuality Women
Tertiary GDP/cap/ppp 1
Political Stability 0.692 1
Corruption 0.739 0.724 1
Gender Inequality -0.843 -0.658 -0.628 1
Individuality 0.742 0.518 0.653 -0.675 1
Women Tertiary Ed. 0.752 0.511 0.608 -0.7061 0.682 1
*all correlations are significant, p<0.001: total of 53 countries.
TABLE 2 SINGLE REGRESSION RESULTS WITH GDP/CAP/PPP
ALL AVAILABLE OBSERVATIONS FOR EACH
Variable Observations R-Sq. F-Score Sig.
Political Stability 98 0.55 119.0 0.000
Individuality* 77 0.35 40.5 0.000
Corruption 177 0.49 170.0 0.000
Gender Inequality** 137 0.29 55.7 0.000
Women Tertiary Ed. 114 0.33 56.7 0.000
*Power Distance was p=0.053 with an R-Sq. of 0.03 and thus not used ** For the bottom 69 countries R-Sq. of 0.37
78 Journal of Applied Business and Economics vol. 13(4) 2012
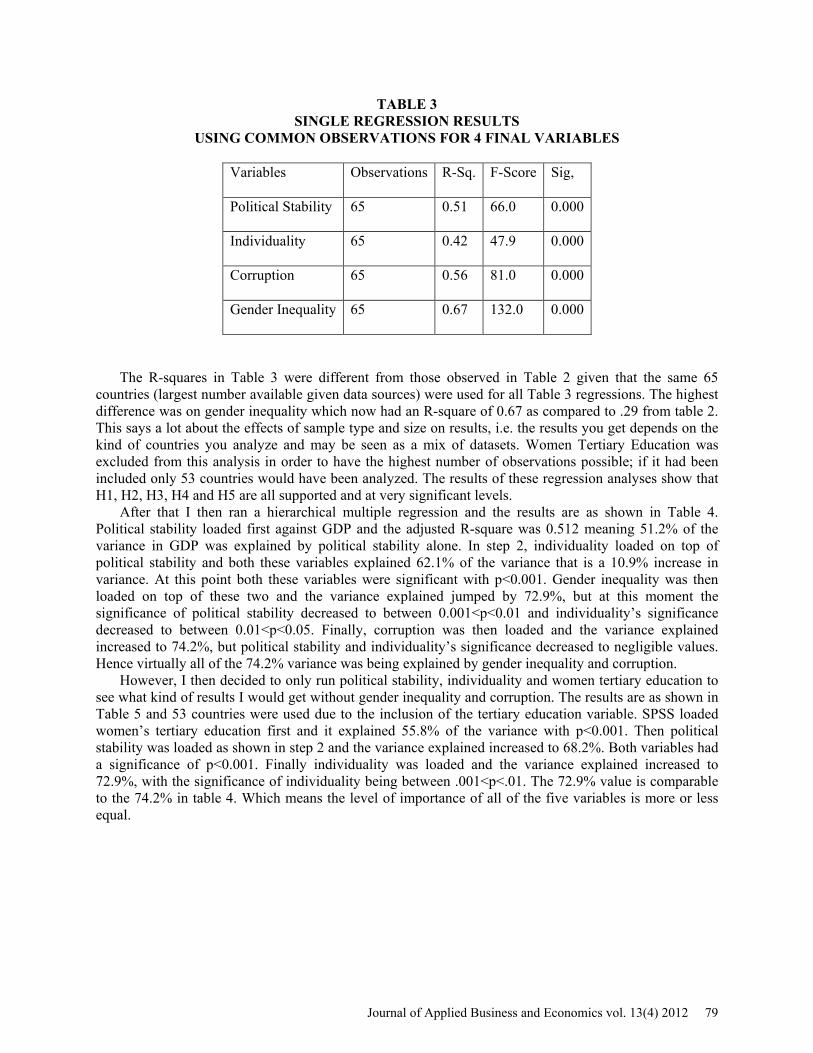
TABLE 3 SINGLE REGRESSION RESULTS
USING COMMON OBSERVATIONS FOR 4 FINAL VARIABLES
Variables Observations R-Sq. F-Score Sig,
Political Stability 65 0.51 66.0 0.000
Individuality 65 0.42 47.9 0.000
Corruption 65 0.56 81.0 0.000
Gender Inequality 65 0.67 132.0 0.000
The R-squares in Table 3 were different from those observed in Table 2 given that the same 65 countries (largest number available given data sources) were used for all Table 3 regressions. The highest difference was on gender inequality which now had an R-square of 0.67 as compared to .29 from table 2. This says a lot about the effects of sample type and size on results, i.e. the results you get depends on the kind of countries you analyze and may be seen as a mix of datasets. Women Tertiary Education was excluded from this analysis in order to have the highest number of observations possible; if it had been included only 53 countries would have been analyzed. The results of these regression analyses show that H1, H2, H3, H4 and H5 are all supported and at very significant levels.
After that I then ran a hierarchical multiple regression and the results are as shown in Table 4. Political stability loaded first against GDP and the adjusted R-square was 0.512 meaning 51.2% of the variance in GDP was explained by political stability alone. In step 2, individuality loaded on top of political stability and both these variables explained 62.1% of the variance that is a 10.9% increase in variance. At this point both these variables were significant with p<0.001. Gender inequality was then loaded on top of these two and the variance explained jumped by 72.9%, but at this moment the significance of political stability decreased to between 0.001<p<0.01 and individuality’s significance decreased to between 0.01<p<0.05. Finally, corruption was then loaded and the variance explained increased to 74.2%, but political stability and individuality’s significance decreased to negligible values. Hence virtually all of the 74.2% variance was being explained by gender inequality and corruption.
However, I then decided to only run political stability, individuality and women tertiary education to see what kind of results I would get without gender inequality and corruption. The results are as shown in Table 5 and 53 countries were used due to the inclusion of the tertiary education variable. SPSS loaded women’s tertiary education first and it explained 55.8% of the variance with p<0.001. Then political stability was loaded as shown in step 2 and the variance explained increased to 68.2%. Both variables had a significance of p<0.001. Finally individuality was loaded and the variance explained increased to 72.9%, with the significance of individuality being between .001<p<.01. The 72.9% value is comparable to the 74.2% in table 4. Which means the level of importance of all of the five variables is more or less equal.
Journal of Applied Business and Economics vol. 13(4) 2012 79
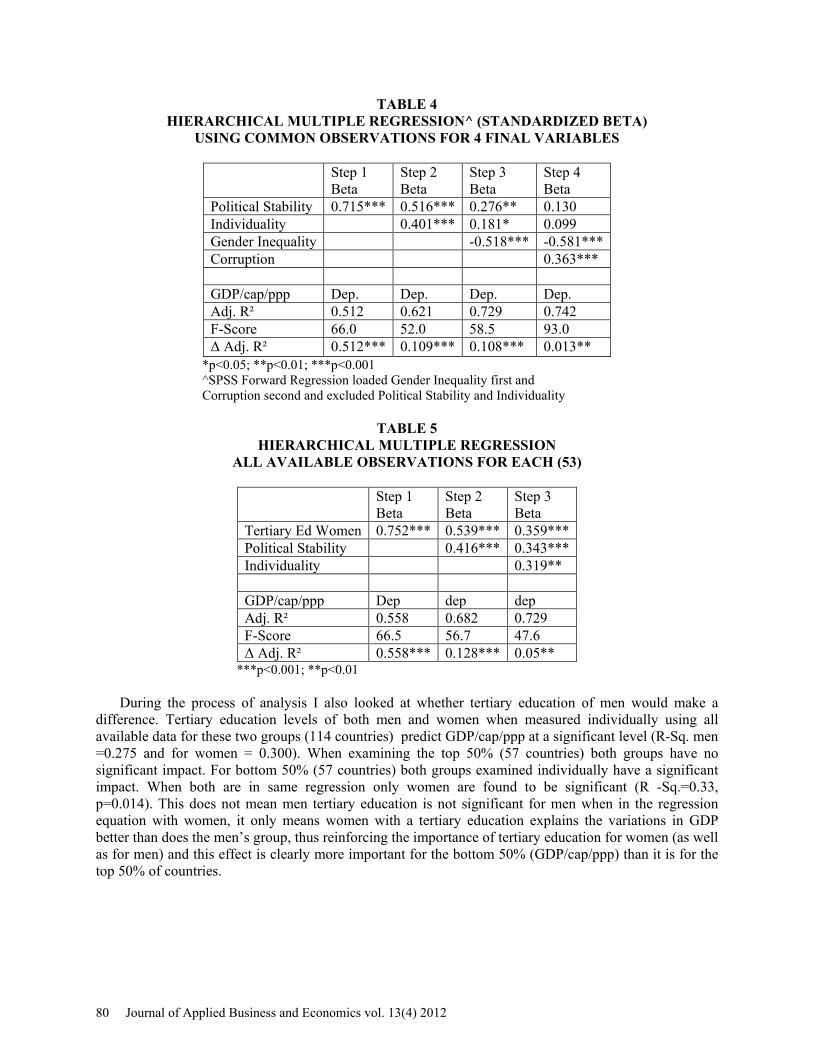
TABLE 4 HIERARCHICAL MULTIPLE REGRESSION^ (STANDARDIZED BETA)
USING COMMON OBSERVATIONS FOR 4 FINAL VARIABLES
*p<0.05; **p<0.01; ***p<0.001 ^SPSS Forward Regression loaded Gender Inequality first and Corruption second and excluded Political Stability and Individuality
TABLE 5 HIERARCHICAL MULTIPLE REGRESSION
ALL AVAILABLE OBSERVATIONS FOR EACH (53)
Step 1 Beta
Step 2 Beta
Step 3 Beta
Tertiary Ed Women 0.752*** 0.539*** 0.359*** Political Stability 0.416*** 0.343*** Individuality 0.319** GDP/cap/ppp Dep dep dep Adj. R² 0.558 0.682 0.729 F-Score 66.5 56.7 47.6 Δ Adj. R² 0.558*** 0.128*** 0.05**
***p<0.001; **p<0.01
During the process of analysis I also looked at whether tertiary education of men would make a difference. Tertiary education levels of both men and women when measured individually using all available data for these two groups (114 countries) predict GDP/cap/ppp at a significant level (R-Sq. men =0.275 and for women = 0.300). When examining the top 50% (57 countries) both groups have no significant impact. For bottom 50% (57 countries) both groups examined individually have a significant impact. When both are in same regression only women are found to be significant (R -Sq.=0.33, p=0.014). This does not mean men tertiary education is not significant for men when in the regression equation with women, it only means women with a tertiary education explains the variations in GDP better than does the men’s group, thus reinforcing the importance of tertiary education for women (as well as for men) and this effect is clearly more important for the bottom 50% (GDP/cap/ppp) than it is for the top 50% of countries.
Step 1 Beta
Step 2 Beta
Step 3 Beta
Step 4 Beta
Political Stability 0.715*** 0.516*** 0.276** 0.130 Individuality 0.401*** 0.181* 0.099 Gender Inequality -0.518*** -0.581*** Corruption 0.363*** GDP/cap/ppp Dep. Dep. Dep. Dep. Adj. R² 0.512 0.621 0.729 0.742 F-Score 66.0 52.0 58.5 93.0 Δ Adj. R² 0.512*** 0.109*** 0.108*** 0.013**
80 Journal of Applied Business and Economics vol. 13(4) 2012
DISCUSSION
Literature suggests many institutional factors to affect the economic success of countries, but countries continue to make little or no progress as far as economic success is concerned. As a result there is little consensus in the literature as to what institutional factors should be considered as important. Hence the objective of this study was to identify the set of institutional factors that may be considered as critical for the economic success of a broad range of countries. The results of the relationship between political stability and GDP/cap/ppp support the first hypothesis (H1): Political stability, as measured by the Political Risk Index (PRI) will significantly impact the GDP of countries. This means that the greater the political stability in a country the greater the GDP. The factors that come into the calculation of the PRI are of significant importance. These factors include; Political/Societal turmoil; Restrictions on equity; Restrictions on local operations; Taxation discrimination; Repatriation restrictions; Exchange controls; Tariff barriers; Nontariff barriers; Payment delays; Expansionary economic policies; Labor costs; Foreign debt; Political/Societal turmoil; Investment restrictions; Restrictions on foreign trade; Domestic economic problems and International economic problems. Therefore governments should look to see that these factors are closely monitored in order to have meaningful development. As can be seen most of these factors are informal institutions hence their operation can be regulated by the government and the legal system.
This study’s outcome also supports the third hypothesis (H2): Corruption as measured by the Corruption Perceptions Index (CPI) will significantly impact the GDP of countries. The results indicate that a more corrupt society will have a lower level of economic success, compared to one that is relatively less corrupt. According to Transparency International, corruption can be defined as the abuse of entrusted power for private gain. The surveys and assessments used to compile the CPI include questions relating to bribery of public officials, kickbacks in public procurement, embezzlement of public funds, and questions that probe the strength and effectiveness of public sector anti-corruption efforts. Hence when governments are attempting to improve economic performance they need to examine and if necessary work to eliminate corruption among public officials. In doing so they will also be sending a message to all citizens that corruption is not acceptable.
Hypothesis 3 (H3): Gender inequality as measured by the Gender Inequality Index (GII) will have a significant inverse impact on GDP, is also supported by the results of this study. There is an inverse relationship between gender inequality and GDP, meaning that the higher the gender inequality the lower the GDP. This observation may be explained by the fact that gender inequality may result in the most qualified personnel not occupying positions because of sexual discrimination. This leads to mismanagement and low efficiency in business, hence affecting economic success. Even in decision making, meaningful ideas from the suppressed gender may not be accepted resulting in potentially effective ideas being overlooked. The results also support the fourth hypothesis (H4): The cultural dimension of Individuality will have a significant positive impact on the GDP of countries. The results show that a more individualist society tends to have a higher GDP than a more collectivist society. A very good example is the three countries that have the highest individuality scores (IDV scores); United Kingdom, United States and Australia (89, 90 and 91 respectively). The economies of these countries are relatively stable as compared to other countries with low IDV scores, e.g. Guatemala which has a score of 6. Hence individualism which then comes with self reliance is very good for economic success. These results also support the fifth hypothesis (H5): Women’s tertiary education will significantly impact the GDP of countries. Diversity is a key ingredient in today’s business. The education of women at the tertiary level and their ultimate occupation of high end jobs will mean a diversified leadership and management in a given company, hence potentially better leadership that can sustain a business in modern day economies. The competitiveness of these companies and their good performance will mean a successful economy in the countries they operate in. The results of this study especially the correlation analysis and the two hierarchical regressions indicate that these variables are highly inter-related suggesting that by impacting one or two and not
Journal of Applied Business and Economics vol. 13(4) 2012 81
addressing the others, or allowing the others to get worse may show little in way of results. This would suggest that all five of these variables need to be addressed in unison and that in doing so they would work together to positively impact economic performance. This interpretation would need to be addressed by future research. However, caution must be exercised when interpreting these results because there are several limitations to this study, e.g. sample size and nature of relationships between the variables such as whether or not economic development results in increased individualism as suggested by Hofstede (2001) or the reverse as suggested by Papamarcos and Watson (2006), or a circular relationship where one reinforces the other. This study was based on availability of data; hence the countries that are used in this study are those that had the necessary data available. For the most part these countries were the relatively richer ones thereby leaving the poorest countries in the world unanalyzed because they did not have data available for analysis, for example, the 65 country sample did not have any countries below US$1,500 GDP/cap/ppp. Also the inter-relationships as seen in the multiple regressions may make the interpretation of the results difficult. Despite these limitations the results have important implications for government, industry and academia. This research can assist governments in their effort achieve economic success. It will be of interest to all politicians and policy makers faced with the challenge of retooling their economies in a time of globalization and market shift. Businesses can also make use of these findings as they look into places where they can invest their capital when the host economy must have sustainable economic success (selection criteria). Other future researchers should consider including these five variables as they develop economic success models for developed and developing countries. ACKNOWLEDGEMENT I would like to thank Quinnipiac University's QUIPS-RS for their research support and Professor Robert Engle for his guidance in doing this research. REFERENCES Agbakoba, J.C.A. (2003). Philosophical Issues in Development, Enugu: Fourth Dimension Publishers. Anonymous. (2010). Silent and lethal: How quiet corruption undermines Africa's development. African Development Indicators 1 Jan. 2010: ABI/INFORM Global, ProQuest. Web. 26 May 2011. Azam, M., & Ahmed, A. (2010). The role of human capital in economic development: Evidence from Pakistan: 1961-200. Interdisciplinary Journal of Contemporary Research in Business, 2(4): 220-233. Batra, R & Scully, W. (1971). Trade and Development. Econometrica. 39(4): 341-342. Baumol, W. (1990). Entrepreneurship: productive, unproductive, and destructive. Journal of Political Economy, 98(3): 893-919. Beck, T & Laeven, L. (2006). Institution Building and Growth in Transition Economies. Journal Economic Growth, 11: 157-186. Becker, G. (1975). Human Capital, National Bureau of Economic Research. Chicago: University of Chicago Press. Becker, G. (1985). Human capital, effort, and the sexual division of labor. Journal of Labor Economics, 3: S33-S58.
82 Journal of Applied Business and Economics vol. 13(4) 2012
Bishop, T.J. & Hydoski, F.E. (2009). Corporate Resiliency: Managing the Growing Risk of Fraud and Corruption. New Jersey: John Wiley & Sons. Buvinic, M., Andrew Morrison, A., Waafas, O., & Mirja Sjöblom, eds. (2008). Equality for Women: Where Do We Stand on the Millennium Development Goals? Washington, D.C.: The World Bank. Cowling, M., & Taylor, M. (2001). Entrepreneurial women and men: Two different species? Small Business Economics, 16(3):167-175. Denis, O. (2001). Leadership Governance and Corruption, a Note for the International conference on Leadership held at Abuja. Dolinski, A., Caputo R., Pasuarty K., & Quazi, H. (1993). The effect of education on business ownership: a longitudinal study of women. Entrepreneurial Theory and Practice, 18(1): 43-53. Engle, R., Schlaegel, C., and Dimitriadi, N. (2011). The relationship of new business ventures and formal institutions: A multinational study, International Business: Research, Teaching, and Practice,5(2), 2-21. Fatima, A. & Sultana, H. (2009). Tracing Out the U-Shape Relationship between Female Labor Force Participation Rate and Economic Development for Pakistan, International Journal of Economics, 36: 182-198. Franke, R.H., Hofstede, G. & Bond, M.H. (1991). Cultural roots of economic performance: a research note. Strategic Management Journal, 12: 165-73. Harsch, E. (1993). Accumulators and Democrats: Challenging State Corruption in Africa. Journal of Modern African Studies 31(1): 31–48. Herz, B., & Sperling, G.B. (2004). What Works in Girls’ Education: Evidence from the Developing World. New York. Council on Foreign Relations. Hill, M. A., & King, E. M. (1999). “Women's Education in Developing Countries: An Overview” in E. M. King & M. A. Hill (eds.), Women's Education in Developing Countries, The Johns Hopkins University Press. Hofstede, Geert. (2001). Culture’s Consequences: Comparing Values, Behaviors, Institutions, and Organizations across Nations. California: Sage Publications Inc. House, R., Hanges, P., Javidan, M., Dorfman, P., and Gupta, V. (2004). Culture, Leadership, and Organizations: The GLOBE Study of 62 Societies, California: Sage Publications Inc. Idakwoji, S.P. (2010). Leadership, Corruption and Development, Canadian Social Science, 6(6): 173-179. Itim International. (2011). Geert Hofstede Cultural Dimensions. http://www.geert-hofstede.com. Accessed, May 2011. Khorasgani, M. (2008). Higher education development and growth in Iran, Education. Business and Society; Contemporary Middle Eastern Issues, 1(3): 162. Kobeissi N. (2010). Gender Factors and Female Entrepreneurship: International Evidence and Policy
Journal of Applied Business and Economics vol. 13(4) 2012 83
Implications. Journal of International Entrepreneurship, 8: 1-35. Levine, D. M., Stephan, D., Krehbiel, T.C., & Berenson, M.L. (2005). Statistics for Managers Using Microsoft Excel, New Jersey: Pearson Education. OECD Observer. (2011). OECD http://www.oecdobserver.org. Accessed June, 2011 Papamarcos, S.D., & Watson, G.W. (2006). Culture’s Consequences for Economic Growth: An Empirical Examination of Culture, Freedom, and National Market Performance. Journal of Global Business and Technology, 2(1): 48-57. Political Risk Services Group Inc. (2011). Political Risk Index. http://www.PRSgroup.com Accessed July, 2011. Schultz, T. W. (1960). Capital formation by education. The Journal of Political Economy, 68: 571-583. Scott, W. (2001). Institutions and organizations, 2nd ed. California: Sage Publications Inc. Seguino, S. (2008). Micro-Macro Linkages between Gender, Development, and Growth: Implications for the Caribbean Region. Journal of Eastern Caribbean Studies, 33(4): 1-35. Summers, L. (1994). Investing in All the People: Educating Women in Developing Countries, EDI Working Papers (No. 45). The World Bank. Transparency International. (2010). Corruption Perceptions Index. http://www.transparency.org. Accessed May, 2011 United Nation’s Gender Inequality Index. (2008). http://hdr.undp.org/en/media/HDR_2010_EN_Table4_reprint.pdf. Accessed April, 2011 United Nation’s Tertiary Education, (2000). http://data.un.org/Data.aspx?q=tertiary+education+ratio&d=GenderStat&f=inID%3a68. Accessed May, 2011 Williamson, C. (2009). Informal Institutions Rule: Institutional Arrangements and Economic Performance. Public Choice, 139(3): 371-387.
84 Journal of Applied Business and Economics vol. 13(4) 2012