Embed Size (px)
Citation preview
i
INSTITUTIONAL FACTORS INFLUENCING PUPILS’
PERFORMANCE IN KENYA CERTIFICATE OF PRIMARY
EDUCATION IN PUBLIC PRIMARY SCHOOLS IN NAIVASHA
CENTRAL DIVISION, KENYA
Kabui Samuel Kirunu
A Research Report in Partial Fulfilment of the Requirement for
the Degree of Master of Education in Educational Administration
University of Nairobi
2013
ii
DECLARATION
This research report is my original work and has not been presented for a
degree in any other University.
_________________________
Kabui Samuel Kirunu
E55/66630/2010
This research report has been submitted for examination with our approval as
the University supervisors.
___________________________
Edward N. Kanori
Lecturer
Department of educational Administration and planning
University of Nairobi
____________________________
Dr. Ursulla A. Okoth
Lecturer
Department of Educational Administration and Planning
University of Nairobi
iii
DEDICATION
I dedicate this work to my wife Mary Kirunu, my two sons Wilson Kabui and
Victor Davis Mwangi and my two daughters Susan Wairimu and Christine
Serah Wangari.
iv
ACKNOWLEDGEMENTS
My gratitude and most sincere thanks go to the following people and
institutions for their kind assistance and patience without which the study
would not have been successful. First I would like to thank University of
Nairobi which facilitated my completion of both coursework and research
work. Secondly I would like to thank my supervisors Dr.Ursulla Okoth and
Mr. E. Kanori who worked beyond their call of duty to ensure that the research
project was completed satisfactory. Their guidance, professional advice and
constructive criticism that resulted in this report. Similarly, the chairman Dr.
Grace Nyaga and lecturers in the department of Administration and Planning
who prepared the framework upon which this work was built. Their
experience and commitment made the course to be highly successful.
I feel greatly indebted to the DEO Naivasha and the head teachers, teachers
and standard eight pupils of public primary schools in Naivasha Central
Division for their co-operation and participation in the study. May I register
my special appreciation to my dear wife Mary Kirunu for her financial and
moral support, my sons Wilson Kabui and Victor Davis Mwangi and
daughters Susan Wairimu and Christine Serah Wangari for their prayers,
encouragement and understanding when I had to be away from them when
they dearly needed me. You showed me great love and offered me
encouragement during the whole process of the research. I love you all.
v
Also I register my warm and heartfelt gratitude to my parents Wilson Kabui
and Susan Wairimu who supported me financially and had never missed a
word of encouragement to me. Also to my brothers Peter Wachuma and Josiah
Thuku for their endless support towards my course. Deep appreciation is also
expressed to James Maina who assisted in typing and printing my document.
Above all I thank God through whose grace I was able to realize this long
cherished dream.
vi
TABLE OF CONTENTS
Content Page
Title Page…………………………………………………………….. i
Declaration…………………………………………………………… ii
Dedication ................................................................................................. iii
Acknowledgement ................................................................................... iv
Table of Content……………………………………………………… vi
List of Tables ...................................................................................... x
List of Figures……………………………………………………….. xi
Abbreviations and Acronyms……………………………………….. xii
Abstract ................................................................................................... xiii
CHAPTER ONE
INTRODUCTION
1.1 Background to the Study…………………………..…… ........... 1
1.2 Statement of the Problem………………………….………......... 5
1.3 Purpose of the Study……………………………………………. 6
1.4 Objectives of the Study…………………………………………. 6
1.5 Research Questions…………………………………………… 6
1.6 Significance of the Study……………………………………… 7
1.7 Limitations of the Study………………………………………… 7
1.8 Delimitations of the Study…………………………………… 8
1.9 Basic Assumptions…………………………………………… 8
1.10 Definitions of Operational Terms…………………………… 8
1.11 Organization of the Study…………………………………… 10
vii
CHAPTER TWO
LITERATURE REVIEW
2.1 Introduction ……………………………………………………. 11
2.2 Teacher-pupil ratio and Academic Performance........................ 12
2.3 Teaching /Learning Resources and Academic Performance............. 13
2.4 Frequent Internal Assessment and Academic Performance............ 14
2.5 Physical Resources and Academic Performance.............................. 14
2.6. Literature Review Summary ……………………………… 16
2.7. Theoretical Framework................................................................... 17
2.8. Conceptual Framework…………………………………………. 18
CHAPTER THREE
RESEARCH METHODOLOGY
3.1 Introduction……………………………………………….. 20
3.2 Research Design……………………………………………. 20
3.3 Target Population…………………………………………….. 20
3.4 Sample Size and Sampling Procedure ……………………… 21
3.5 Research Instruments………………………………………… 22
3.6 Instrument Validity………………………………………… 23
3.7 Instrument Reliability ………………………………………… 24
3.8 Data Collection Procedures………………………………… 25
3.9 Data Analysis Techniques……………………………………. 26
viii
CHAPTER FOUR
DATA ANALYSIS, INTERPRETATION AND DISCUSSION
4.1 Introduction...................................................................................... 27
4.2 Questionnaire Completion Rate...................................................... 27
4.3 Demographic Information of the Respondents.................... 28
4.3.1 Demographic Information of Head teachers ................... 28
4.3.2Demographic Information of Teachers................................. 33
4.3.3Demographic Information of Pupils....................................... 36
4.4 Information about K.C.P.E 2012 Performance and Enrolment of
Candidates in 2013. ................................................................................ 39
4.4.1 Information About Schools’ KCPE Performance............................ 39
4.4.2 Information About Schools’ KCPE Enrolment in 2013................ 40
4.5 Findings of the Study....................................................................... 41
4.5.1 How does Teacher-Pupil Ratio Influence KCPE Performance? .... 41
4.5.2 How does Pupil-Book Ratio Influence Performance of the
Learner in KCPE Examinations? ................................................ 44
4.5.3 How does Frequent Internal Assessment Influence Performance
of KCPE among Learners?.......................................................... 47
4.5.4 How do Physical Resources Influence Performance of Learners
in KCPE Examination? ................................................................ 49
ix
CHAPTER FIVE
SUMMARY, CONCLUSIONS AND RECOMMENDATIONS
5.1 Introduction................................................................................... 51
5.2 Summary of the Study................................................................... 51
5.3 Research Findings....................................................................... 53
5.4 Conclusion.......................................................................................... 55
5.5 Recommendations.............................................................................. 56
5.6 Suggestions for Further Research ..................................................... 57
REFERENCES ....................................................................................... 59
APPENDICES......................................................................................... 63
Appendix A: Introduction Letter....................................................... 63
Appendix B: Head teacher’s Questionnaire ........................................... 64
Appendix C: Class teacher’s Questionnaire.......................................... 69
Appendix D: Pupils Questionnaire ...................................................... 74
Appendix E: Research Authorization ............................................. 78
Appendix F: Research Authorization from D.E.O.......................... 79
Appendix G: Research Authorization from D.C................................ 80
Appendix H: Research Permit ................................................................ 81
x
LIST OF TABLES
Table Page
Table 3.1 Distribution of target population in Naivasha Central Division. 22
Table 4.1 Age of headteachers............................................................ 29
Table 4.2 Professional qualification of head teachers.............................. 30
Table 4.3 Number of streams in standard 8............................................... 32
Table 4.4 Distribution of teachers by age .................................................. 34
Table 4.5 Duration of time as primary school teachers................................ 36
Table 4.6 Pupils by gender.......................................................................... 37
Table 4.7 Distribution of marks in the previous exam done.................. 38
Table 4.8 KCPE Means of six public primary schools in Naivasha
Central Division........................................................................ 39
Table 4.9 Schools candidature in 2013 ................................................ 40
Table 4.10 Teacher- pupil ratio in 2013............................................... 42
Table 4.11 Comparison of comfort ratio between heads and class
teachers................................................................................... 43
Table 4.12 Distribution of pupil – book ratio .......................................... 45
Table 4.13 Frequency of assessing pupils................................................. 47
Table 4.14 Source of assessment tests........................................................ 48
xi
LIST OF FIGURES
Figure Page
Figure2.1 Conceptual Framework......................................................... 18
Figure 4.1 Distribution of head teachers by gender........................ 28
Figure 4.2 Experience of head teachers................................................... 31
Figure 4.3 Distribution of teachers by gender......................................... 33
Figure 4.4 Teachers distribution by professional qualifications .............. 35
xii
ABBREVIATIONS AND ACRONYMS
ATS Approved Teacher Status
DEOs District Education Office
EFA Education for all
FPE Free Primary Education
KCPE Kenya Certificate of Primary Education
KNEC Kenya National Examination Council
MDGs Millennium Development Goals
MOEST Ministry of Education Science and Technology
NARC National Alliance Rainbow Coalition
PTA Parents Teachers Association
SES Social Economic Status
SMC School Management Committee
TSC Teachers Service Commission
UNDP United Nations Development Programme
UNESCO United Nation Education Scientific and Cultural Organization
UPE Universal Primary Education
xiii
ABSTRACT
The purpose of this study was to investigate the factors influencing the performance of KCPE in public primary schools in Naivasha Central Division Naivasha District.The study was guided by four objectives which included establishing the extent to which teacher- pupil ratio influences performance, examining the extent to which pupil–book ratio influences learners performance, determining the extent to which frequent internal assessment influences performance of learners and lastly examining how physical resources influence performance of learners. The research developed research questions to gather information in order to meet the objectives of the study. Related literature to the study was reviewed. The study was based on the ex- post factor research design focusing on public primary schools head teachers, teachers and pupils in Naivasha Central Division. The target population comprised of all the head teachers, teachers and pupils in all the 29 public primary schools in Naivasha Central Division. Data were collected by use of self administered questionnaires and data analyzed based on descriptive statistical method. A pilot study was conducted to test the reliability of the measuring instrument and was found suitable. The study findings revealed that various types of factors in institutions that influenced performance of learners in national examinations included teacher- pupil ratio, pupil-book ratio, frequent internal assessment and physical resources such as libraries. The findings established that most schools in the study area are highly populated hence affecting the teacher- pupil ratio and pupil-book ratio which remained a concern of the head teachers and teachers is the area. It also came out that in almost all schools in the study area administer frequent internal assessments as a way of assisting and evaluating both the teachers and the learners’ progress in syllabus coverage and in education attainment. Based on the findings it was found that only a small percentage of the public primary schools in the area have physical resources such as libraries which can help improve performance of learners in national examinations. Most of the head teachers and teachers gave their opinion that the number of pupils attended to by one teacher affects pupils’ performance either positively or negatively. The larger the class, the more demanding the class is and individual needs and interests of learners’ especially slow ones are not adequately attended to. Smaller classes are comfortable to handle with teacher- pupil ratio of between 1:30 and 1:40 per class. Head teachers and teachers gave their opinion about pupil-book ratio. Most of them agreed that there is a direct relationship between access to learning materials and performance of learners. The more a learner is exposed to books
xiv
the more the learner acquires more information hence improved learning outcomes. This was so to library resources where most of the heads and teachers termed it as a base and a rich environment for knowledge acquisition and exposure to information leading to improved learning outcomes. Lastly the study concluded that frequent continuous assessment to pupils is one formative way of evaluating learners and teachers use it to impart exam answering skills to learners and also as a way of exposing learners to answering questions as the pupils /candidates wait to be summative evaluated during national examination. Thus frequent internal assessment is common to all public primary schools in the study area. It was therefore concluded that the level at which each of the head teachers and teachers is able to cope with the challenges in his / her school concerning those institutional factors that influence pupils performance in national examinations in public primary schools is reflected in the performance index of that school. Taking the limitations and delimitations of the study the researcher made the following suggestions for further study; that a research should be carried out to investigate the effect of teacher-pupil ratio in relation to slow learners; a research should be done on the role of government policy in ordering textbooks by schools instructional materials select committee; and a research should be done to establish the relationship between head teacher’s training and its effect on pupils’ performance in national examinations. The major recommendations were that alternative ways of dealing with shortage of teachers, and pupil-book ratio should be sort by both the schools and the government. Head teachers should look for quality and relevant assessment tests that will add quality to their pupils. Schools should not ignore the importance of library resources and should therefore have library lessons in the main timetable. Lastly, TSC should basically recruit teachers to cater for staff establishment.
1
CHAPTER ONE
INTRODUCTION
1.1 Background to the Study
Education is the cornerstone of development in any given society in the world.
Communities that have recorded progress lay their success to a vibrant system
of education. Education in itself is an effective weapon against ignorance,
poverty and diseases which are the root causes of restlessness throughout the
world (Chetalam, 2004).
The goal of primary education is to provide access to quality education to all
children of primary school going age on an equitable basis thus meeting the
goal of Education for All (E F A) at this level (Ministry of Education, 2001).
Education, therefore, aims to provide a foundation for social and economic
development. Children need education that will secure their social and
economic wellbeing; an education that will be a true engine of social
transformation, and enabling each individual student to realize his or her
potential and live in dignity (Chetalam, 2004).
UNESCO, (2000) notes that education is important in social and economic
development hence it is a basic right for every child without discrimination.
Education is therefore a foundation to human development and is critical to
broad based economic growth. However, these aims may not be adequately
realized due to the influence of institutional factors such as teacher-pupil ratio,
pupil-book ratio, frequent internal assessment, and library resources that
2
influence performance of education in Kenyan public primary schools.
Classes with too many pupils are often disrupting to education and many
students in a class results in a diverse field of students, with varying degrees of
learning ability. Consequently, the class will spend time for less academic
pupils to assimilate the information, when that time could be better spent
progressing through the curriculum (Blatchford & Paul, 2011).
According to Schmitt and Lose (2012) on the relationship between teacher-
pupil ratio and literacy learning outcomes in America, postulates that the trend
analysis indicates that there is a reduction of literacy performance as group
size increases. Therefore, the findings focused on how best to achieve
optimum literacy outcomes for all learners in a timely manner and based on
their individual needs. Smaller classes benefit all pupils because of individual
attention from teachers. Pupils in large classes drift off task because of too
much instruction from the teacher to the whole class instead of individual
attention and low-attaining pupils are most affected (Blatchford & Paul, 2011).
In Pakstan, Arshad (2009) affirms that there is much variation and
misallocation in teacher-pupil ratio, class size and per student expenditure
among schools which leads to the wastage of resources and lower level of
academic achievement. Therefore, reduction in student teacher ratio, class size
and addition in per student’s expenditure may lead to the effective use of
school resource inputs and produce higher level of academic achievement.
Schools are seriously lacking in teaching and learning resources and this is one
3
factor which has been hindering quality of education in primary schools.
According to the 2006 National Assessment Survey report in Zambia, the
majority of the pupils shared textbooks between 3 and 4 pupils. The ideal
pupil-book ratio of two pupils per textbook remains a distant target in majority
of schools (Daily Mail March 11, 2013).
In Malawi, after introduction of free primary education in 1994 found a rapid
increase in enrolment which brought about an unprecedented stress on the
existing resources in the sector. Pupil-teacher ratios, pupil-classroom
ratios,pupil-textbook ratios and most other educational indicators reached
unacceptable levels hence affecting performance of education (Demis, 2005).
In Kenya, as a result high enrolment after introduction of FPE in 2003 and
provision of free learning resources, one method that was adapted by the
government to cater for teacher pupil ratio was to hire low paid local
contracted teachers to supplement government- salaried teachers (Duflo &
Dupas, 2007) However, the resulting overcrowding of pupils in schools as
well as the influx of new students poses challenges to policy makers up to
date.
Learning is driven by what teachers and pupils do in classrooms. Teachers
have to manage complicated and demanding situations, channelling the
personal, emotional and social pressures amongst a group of youngsters in
order to help them to learn and to become better learners’ in future through
4
frequent internal assessments. (Black & William, 1998).Therefore, standard is
raised if teachers can tackle this task more effectively.
Bundy (2006) asserts that school libraries and public libraries should be
pivotal to the 21st century educational experience and the bases for a positive
attitude by young people towards information skills development, lifelong
learning and enhancing their life chances. He notes that if it is right that
schools should be maintained by the whole community for the well being of
the whole, it is right also that library should be so maintained.
The aim of having library services in school is not only to provide a rich
learning environment in terms of an appropriate range of resources but also in
terms of developing the learning skills of pupils (Dorothy & Caroline, 2001).
Therefore a more fundamental need for such understanding relates to the
future planning of effective library in support of the curriculum.
The policy on Free Primary Education (FPE) introduced in Kenya in 2003 by
National Alliance Rainbow Coalition (NARC) government aimed to improve
participation, progression and completion rates (Chuck, 2009). Education for
all (EFA) conference held in Dakar Senegal in April 2000 stated that
performance in primary education fell below the desired levels. According to
the conference large classes, inadequate educational materials, un-prepared
teachers, inadequate training of teachers and poor running of institutions has
contributed to primary education performance falling below expectations.
5
Learners in Naivasha Central Division, Naivasha District experience similar
factors that influence their performance in KCPE. Such factors as diverse
socioeconomic background of the learners, and parental education affect
pupils’ performance. In addition schools from Naivasha Central Zone have
been performing better in KCPE examinations in the last five years than those
from Maraigushu Zone (D.E.Os Office Naivasha). However, the neighbouring
Maiella zone tend to do better than Central zone and Maraigushu zones despite
having the same teachers and facilities, hence the need for the study. In
addition Chetalam (2004) recommends that a research should be done to
establish why some of the primary schools constantly do better than others
during KCPE examinations.
1.2 Statement of the Problem
According to the Government of Kenya (2006) the policy objectives on
education include ensuring that all children, especially the girls, those in
difficult circumstances and those from marginalized or vulnerable group had
access to free and compulsory primary education by 2010.
The introduction of Free Primary Education (FPE) in 2003 has caused an
increase in enrolment of pupils joining the schools in Kenya. Studies that have
been carried out on factors affecting performance of education in public
primary schools reveal that social economic factors, parental education,
student factors and environmental factors have a positive influence to
6
academic performance. However, this study examined the extent to which
institutional factors influence performance of KCPE in public primary schools
in Naivasha Central Division, Kenya.
1.3 Purpose of the Study
The purpose of the study was to investigate the factors influencing the
performance of KCPE in public primary schools in Naivasha Central Division,
Naivasha District.
1.4 Objectives of the Study
The study aimed at achieving the following objectives:
i. Establish the extent to which teacher–pupil ratio influences
performanceof pupils in KCPE
ii. Examine the extent to which pupil-book ratio influences learners
performance in KCPE
iii. Determine the extent to which frequent internal assessment influences
performance of learners in KCPE
iv. Examine how physical resources influence performance of learners in
KCPE
1.5 Research Questions
From the foregoing objectives, the study sort to answer the following research
questions based on the problem statement and the stated objectives.
i. How does teacher-pupil ratio influence student’s K C P E performance?
7
ii. How does pupil-book ratio influence performance of the learner in
KCPE examinations?
iii. How does frequent internal assessment influence performance of KCPE
among learners?
iv. How do physical resources influence performance of learners in KCPE
examinations?
1.6 Significance of the Study
The findings would provide variable information to the Ministry of Education
(MoE). The MoE may use the findings to influence education in the country.
The findings may be used by the head teachers to influence educational
outcomes. Also the findings may be used in teacher training institutions to
provide the trainees with a bearing on what should be done to enhance
performance of learners who come from different backgrounds. The findings
may also stimulate interest of parents, sponsors and local leaders on realization
of their impact on performance of learners in national examinations.
1.7 Limitations of the Study
The factors the study sort to examine were not limited to the study area only.
The study would not be able to control the attitudes of the respondents because
of the manifestations that may have already occurred. According to Ndwiga
(2001) respondents at times give socially acceptable answers in order to avoid
offending the researcher.
8
1.8 Delimitations of the Study
The study was conducted in Naivasha Central Division, Naivasha District
and only in public primary school that were sampled. The area has twelve
private primary schools that were not sampled which would otherwise give a
clear comparison in performance between public primary schools and private
primary schools. In addition to this, most of the schools are found within the
escarpments, a condition which is quite unique and different from other
neighbouring districts.
1.9 Basic Assumptions of the Study
In this study the researcher had the following basic assumptions;
i. That the KCPE examination results would be an accurate and reliable
measure of performance and good results are acceptable and satisfying to all
stakeholders.
ii. All schools had access to the same teaching and learning resources.
Therefore, KCPE result should indicate a normal distribution curve in
performance if all the stakeholders are involved in providing necessary
learning environment which is conducive and which leads to good
performance of national examinations.
9
1.10 Definition of Significant terms
Assessment refers to the process by which the quality of an individual work or
performance is judged.
Frequent internal assessment refers to all those activities especially tests
undertaken by teachers and their pupils in assessing themselves in order to
provide a feedback.
Institution refers to the schools where pupils learn from.
Institutional factors refer to school attributes which influence performance of
learners.
Influence refers to the ability of something to have an effect over something
else so that a change is seen or felt.
Library resources refer to all those learning materials within the library that
provide necessary information to both teachers and learners.
Performance refers to the student’s academic attainment in the Kenya
Certificate of Education (KCPE) examination. It is graded from the lowest E
to the highest A.
Pupil-book ratio refers to the number of pupils sharing a text book in class
for example 1:3
Teacher-pupil ratio refers to the number of pupils one teacher should attend
to for effective learning for example 1:40
10
1.11 Organization of the Study
The study is organized into five chapters. Chapter one consists of background
to the study, statement of the problem, purpose of the study, objectives of the
study, research questions, significance of the study, justification of the study
area, limitations, delimitations, basic assumptions of the study and definitions
of significant terms as used in the study.
Chapter two comprises the literature review under subheadings: extent to
which teacher-pupil ratio influences academic performance; extent to which
teaching-learning resources affects learner’s academic performance; the extent
to which frequent internal assessment affects academic performance; how
physical resources influences academic performance ; theoretical and
conceptual frameworks to the study. Chapter three consists of the research
methodology which is divided into the following areas; research design, target
population, sample and sampling procedure, research instruments, validity of
the research instruments, data collection procedures and data analysis
techniques.
Chapter four comprises data analysis, interpretation and discussion of the
findings while Chapter five consists of the summary of the study, research
findings, conclusions, recommendations and suggestions for further research.
11
CHAPTER TWO
LITERATURE REVIEW
2.1 Introduction In Kenya primary education currently lasts eight years and is offered to
children ranging from 6 years of age. It is meant to equip the youth with
relevant knowledge, skills and expertise to enable them play effective and
production roles in the country. The ministry of education attempts to achieve
this goal through developing and reviewing curriculum materials, providing
teachers and organizing regular supervision of schools. Whereas some primary
schools provide academic activities that lead to effective learning and sound
academic achievement by students others do not (Republic of Kenya, 1992).
Primary education marks the end of formal education for many children due to
limited opportunities for secondary education. The primary school curriculum
has continually been evaluated by KNEC to ascertain its relevance and quality
through examinations. Since KCPE examinations are used as selection criteria
for determining who joins the next level, they are quite competitive.
This chapter reviewed relevant literature under the following subheadings:
extent to which teacher-pupil ratio influences academic performance; extent to
which pupil-book ratio influences learner’s academic performance, also the
extent to which frequent internal assessment influences pupils’ academic
performance and how library resources influences academic performance of
learners. The section also comprises summary of the literature review,
theoretical and the conceptual frameworks for the study.
12
2.2. Teacher-pupil ratio and academic performance
School’s structure, which is measured by class and school size is a school
characteristic thought to affect students outcomes. Several researchers
have hypothesized that smaller school size which is often associated with
more personal attention , more opportunities for involvement, less anonymity
for students, and a more caring academic environment, leads to positive
behavioural and academic outcomes for students (Endya, 2007).
Research reviews have found that smaller classes benefit all pupils because of
individual attentions from teachers while pupils in large classes drift off task
because of too much instruction from the teacher to the whole class instead of
individual attention and low attaining students are most affected. Under lower,
teacher-pupil ratios, pupils spend more time in active academic responses and
academic engaged time; teachers more often check for student understanding
and provide greater task relevance, more feedback and more adaptive
instruction. (Thurlow, 1989).
Examination performance is a multi-dimensional factor which have in the past
caught the attention of different researchers. The factors that influence
performance in different geographical areas are the same but it is the
manipulation of these factors that influence performance either positively or
negatively (Chelimo, 2005). The teacher- pupil ratio greatly influences the
teaching profession and hence performance. Schools with low teacher–pupil
13
ratio greatly give individual attention to the pupils and there is an increased
interaction which enables the learners to be motivated (Chelimo, 2005).
2.3 Teaching-learning resources and academic performance
Factors that have contributed to poor performance in schools include high
teacher attrition, wide pupil-teacher ratio and pupil–book ratio as well as poor
classroom usage (Daily Mail, March 11 2013) The Government of Kenya has
tried to subsidize the cost of education by providing Free Primary Education
(FPE). The policy on FPE introduced in Kenya in 2003 aimed at improving
participation, progression and completion rates by providing free tuition and
text books (Chuck, 2009).
The environment, teaching and learning resources and the personal
characteristics of learners play an important role in their academic success.
The school personnel, members of the families and communities provide help
and support to students for the quality of their academic performance (Farooq,
2011).Thus families provide their children with extra learning materials in
order to substitute for what they get in schools hence reducing pupil-book
ratio. In addition student’s effort towards educational achievement or
attainment is characterized by the level of school attachment, environment and
commitment displayed by students.
14
2.4 Frequent internal assessment and academic performance
Measuring the effect of the effort that students devote to education is
important in that such effort contributes to their educational achievement and
attainment. A number of researchers have shown that the amount of effort that
students put into their schooling affects their academic outcomes (Endya,
2007). Assessment is the process by which the quality of an individual’s work
or performance is judged. In schools, assessment of learning is usually carried
out by teachers on the basis of impressions gained as they observe their pupils
at work or by various kinds of tests given periodically. When practiced as an
on-going process, such assessment is known as continuous assessment.
Reasons for assessing pupils is to test how much is known about something
supposedly learned, expose weaknesses in learning, and monitor teaching. It is
also meant to maintain standards, motivate teachers and pupils, measure
specific abilities for example reading, and discriminate between children of
different ability. Assessments classify children, and predict the suitability of
individual children for particular courses or careers. Thus educational testing
provides factual information about children’s abilities and performance. It also
enables for meaningful comparisons and classifications to be made ( Farrant,
1980).
2.5. Physical resources and academic performance
Empirical studies reveal that physical resources such as libraries give sound
academic performance and actively support the teaching/learning processes
15
(Mnyero, 2007). Big schools with less facilities leads to overcrowding.
Therefore a well used library has a positive impact on teaching/ learning
despite the fact that the teaching/ learning process concentration is more on
passing.
A Survey carried out in Australia confirms that they receive high use of library
services from primary and secondary school students in particular including
home schooled children. Libraries provide a wide range of services and
resources to support students including professional reference assistance,
internet access, on line homework tutoring, special collections, study spaces
and homework centre and clubs (Bundy, 2006). Therefore, libraries and
schools are on a par with each other in terms of what both learners and
teachers are trying to accomplish which is to better educate the society and
thus a library is an innovator and should play an integral and active role in
that effort in every community.
Support for teaching and learning is at the heart of most academic library
mission statements yet, never has it been more important for libraries to
demonstrate evidence of this support. Libraries need efficient, methods for
connecting students’ use of the library with the learning outcomes that matter
most schools and parents. Library/learning resources must be in reasonable
proportion to the needs to be served, but numbers alone are no assurance of
excellence. Of more importance are the quality, accessibility, availability and
delivery of resources on site and elsewhere, their relevance to the institution’s
16
current programmes, and the degree to which they are actually used
(Rodrigquez, 2012) The school library is central to learning and plays a key
role as a place for encouraging innovation, curiosity and problem solving
School libraries make a difference to students understanding and achievement
and provide support for teaching and learning throughout the school. The
school library provides a model for inquiry learning and building knowledge
and confidence in seeking and processing information. It is a fundamental
resource for supporting students learning and a key support for teaching staff.
It reflects and encourages collaborative learning and sharing of ideas hence
school libraries are places for learning and thinking and play a key role in
supporting and developing enjoyment of reading and acquisition of multiple
literacy skills (National library of New Zealand, 2013). Thus, the school
library provides information and ideas that are fundamental to functioning
successfully in today’s information and knowledge based society. Hence the
school library equips students with lifelong learning skills and develops the
imagination, enabling them to live as responsible citizens.
2.6 Summary of the Literature Review
This section has dealt with the various factors that influence examination
performance not only in Kenya but also in other parts of the world as has been
asserted by Thurlow(1989), Chelimo (2005) and Endya (2007). Four
categories of factors have been examined namely those related to teacher-pupil
ratio, which determines class size; researches on appropriate pupil-book ratio;
17
frequent internal assessment for provision of feedback and library resources
which are vital in schools in order to enhance achievement and how they
influences performance.
2.6 Theoretical Framework
This research has adapted systems theory. The proponents of systems theory
were Whitehead and Bertalanffy ( 1925-1926) and they adapted systems
theory approach in their work . A system is described as a complex of
interacting components together with the relationship among them that permit
the identification of a boundary but maintaining the process. A school is a
system and a system consists of various components or subsystems which
must function together for the system to work. Therefore, to enable teachers’
effective networking, working in interdependent ways that contribute to the
overall development of the school community will require an organizational
form and set of operational principles that makes that possible.
The school environment has attempted to pinpoint the effects that have
revealed significant and consistent relationship with variables defining teacher
performance. These important teachers characteristic include discipline
methods, and control on emphasis on active instruction, an open and friendly
atmosphere, well defined goals, higher expectations for achievement and an
emphasis on overcoming feelings of futility and fatalism.
18
Institutional factors have effect on children’s achievement even when the
influence of background factors such as social class and family size have been
taken into account. A child’s home has particularly strong impact on school
readiness. However, for success and attainment of educational goals, such
factors as teacher-pupil ratio, which determines class size, appropriate pupil-
book ratio, and continuous assessment for provision of feedback and library
resources are vital in schools in order to enhance achievement.
2.7 Conceptual Framework
A conceptual framework shows the relationship between the independent and
dependent variables. Further it shows any other factor that may have any
effect of the two variables. The conceptual framework of the study below
represents the interrelationship between independent and dependent variables
in the study that influence pupils’ performance in KCPE.
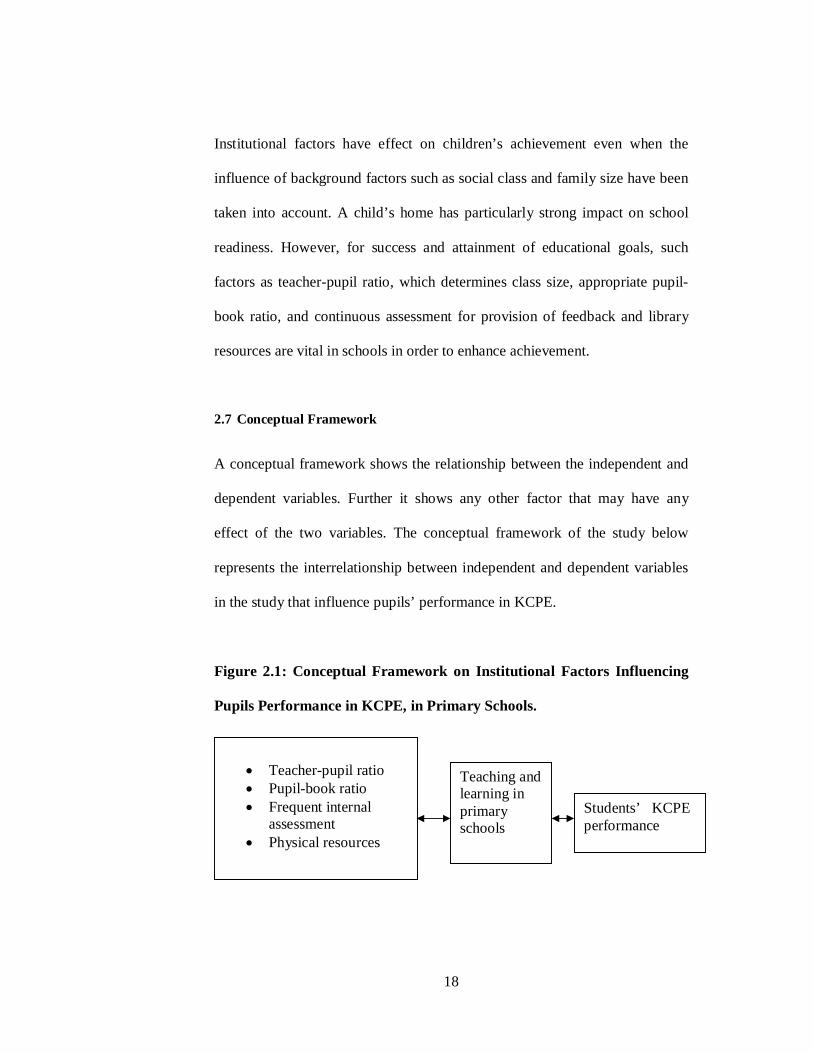
Figure 2.1: Conceptual Framework on Institutional Factors Influencing
Pupils Performance in KCPE, in Primary Schools.
Teacher-pupil ratio Pupil-book ratio Frequent internal
assessment Physical resources
Teaching and learning in primary schools
Students’ KCPE performance
19
The Conceptual frame work shows relationship between institutional factors
(Independent variable) process and pupils’ performance in KCPE examination
(dependent variable)
From the figure the independent variables determine academic performance in
KCPE examinations. They include; teacher-pupil ratio, pupil-book ratio,
frequent internal assessment and physical resources. This therefore implies
that performance in national examination is dependent on the independent
variables. However these are not the only variables that influence performance
but they are the ones that formed the basis of research for this study.
20
CHAPTER THREE
RESEARCH METHODOLOGY
3.1 Introduction
This section has dealt with the description of the methods that would be used
to carry out the study. It is divided into eight sections. These are research
design, target population, sample size and sampling procedure, research
instruments, instrument validity, instrument reliability, data collection
procedures and data analysis techniques.
3.2 Research Design
A research design is a logical and valuable way of looking at the world (Borg
and Gall, 1996). In this study, the researcher used an ex-post facto research
design. Ex-post facto research design is a method of testing out possible
antecedents of events that have happened and cannot, therefore, be engineered
or manipulated by the investigator (Cohen and Manion, 1994). An ex-post
facto design was selected because the researcher would rely on past records of
events and processes as they had occurred. In this particular case, the
dependent variable which is the KCPE performance has already occurred such
that the factors influencing its performance cannot be manipulated.
3.3 Target Population
The target population of a study is defined as all the members of a real or
hypothetical set of people events or objects to which the investigator wishes to
generalize the results of the research study (Borg and Gall, 1996). According
21
to the district education office Naivasha, Naivasha Central Division is
composed of two administrative zones namely Central Zone and Maraigushu
Zone. Central Zone consists of 13 Public schools while Maraigushu Zone has
16 Public schools. The study targeted 29 headteachers, 53 standard eight class
teachers and 2301 standard eight pupils in the two zones.
3.4 Sample Size and Sampling Procedure
A sample is a small group selected for testing (Sommer, 1986). Sampling is a
research technique used for selecting a given number of subjects from a target
population as a representative of that population (Borg and Gall, 1996). The
correct sample size depends upon the purpose of the study and the nature of
the population under scrutiny (Cohen and Manion, 1994). Two schools were
used for pilot study, one from each zone, while one boy’s boarding school was
exempted.
Mugenda and Mugenda (1999) suggest that a sample size of 30% of the target
population is representative enough to allow for generalizations to be made.
30% of 11schools in Central zone were sampled. Also 30% of 15 schools in
Maraigushu zone were sampled. Each sampled school received a questionnaire
for the head teacher, for standard eight class teachers and questionnaires for
standard eight pupils.Table 3.1 shows distribution of schools in Naivasha
central division
22
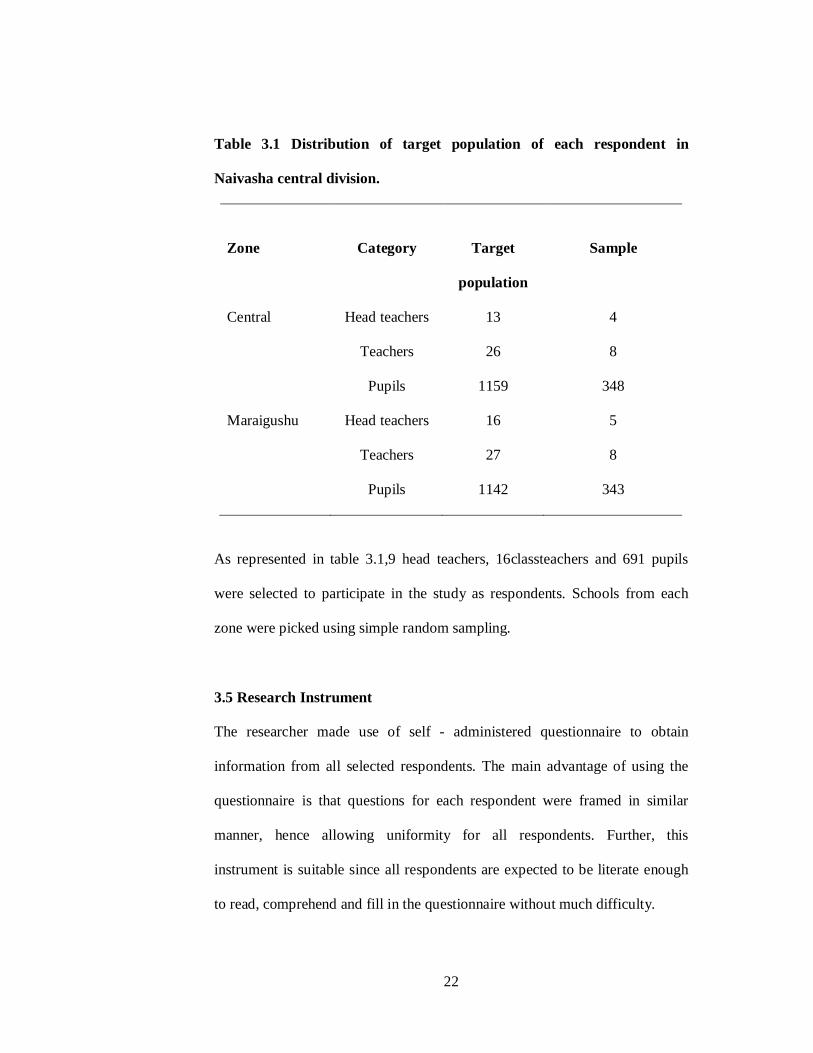
Table 3.1 Distribution of target population of each respondent in
Naivasha central division.
Zone
Category
Target
population
Sample
Central
Maraigushu
Head teachers
Teachers
Pupils
Head teachers
Teachers
Pupils
13
26
1159
16
27
1142
4
8
348
5
8
343
As represented in table 3.1,9 head teachers, 16classteachers and 691 pupils
were selected to participate in the study as respondents. Schools from each
zone were picked using simple random sampling.
3.5 Research Instrument
The researcher made use of self - administered questionnaire to obtain
information from all selected respondents. The main advantage of using the
questionnaire is that questions for each respondent were framed in similar
manner, hence allowing uniformity for all respondents. Further, this
instrument is suitable since all respondents are expected to be literate enough
to read, comprehend and fill in the questionnaire without much difficulty.
23
Head teachers questionnaire had two sections. Section A contained items on
demographic details of the respondents which included their age, gender and
professional background information while section B contained question
related to the objectives of the study. Class teacher’s questionnaire also had
two sections. Section A contained items on demographic details of the
respondents which included their age, gender and professional background
information while section B contained questions related to the objectives of
the study. The pupil’s questionnaire also had two sections. Section A
contained items on demographic details of the respondents which include their
age, gender and background information while section B contained questions
related to the objectives of the study. The questionnaires had structured
questions in section A where the respondents expressed their perceptions
towards each if the items by ticking only one response and in section B both
closed items where the respondent were required to choose between Yes and
No answers and open questions where the respondent provided an answer and
then an opinion on the questions asked.
3.6 Instrument Validity
Validity is the accuracy and meaningfulness of inferences, which are based on
the research results. It is the degree to which results obtained from the analysis
of the data actually represent the phenomenon under study (Mugenda &
Mugenda, 1999). To test validity of the instrument, the questionnaires were
pre-tested before the research had commenced. Pre-testing was carried out
through piloting using members of two schools in Naivasha Central Division.
24
[∑x2 – (∑x)2/N] [∑y2 – ∑y)2/N
The aim of this exercise was to evaluate the content validity, clarity of test
items and suitability of language used in instrument and the feasibility of the
study (Mulusa, 1990).
3.7 Instruments Reliability
Reliability refers to precision, consistency and accuracy of the research
instrument. It is therefore the degree of consistency that the instrument
demonstrates (Best and Khan, 1998). The test cannot be valid if it is not
reliable. The split half technique was used to establish the coefficient of
internal consistency of the research instrument (Nachmias and Nachmias,
1996). This method involves splitting the items in the questionnaire into two
halves – odd and even items. Here, scores on the odd-numbered items are
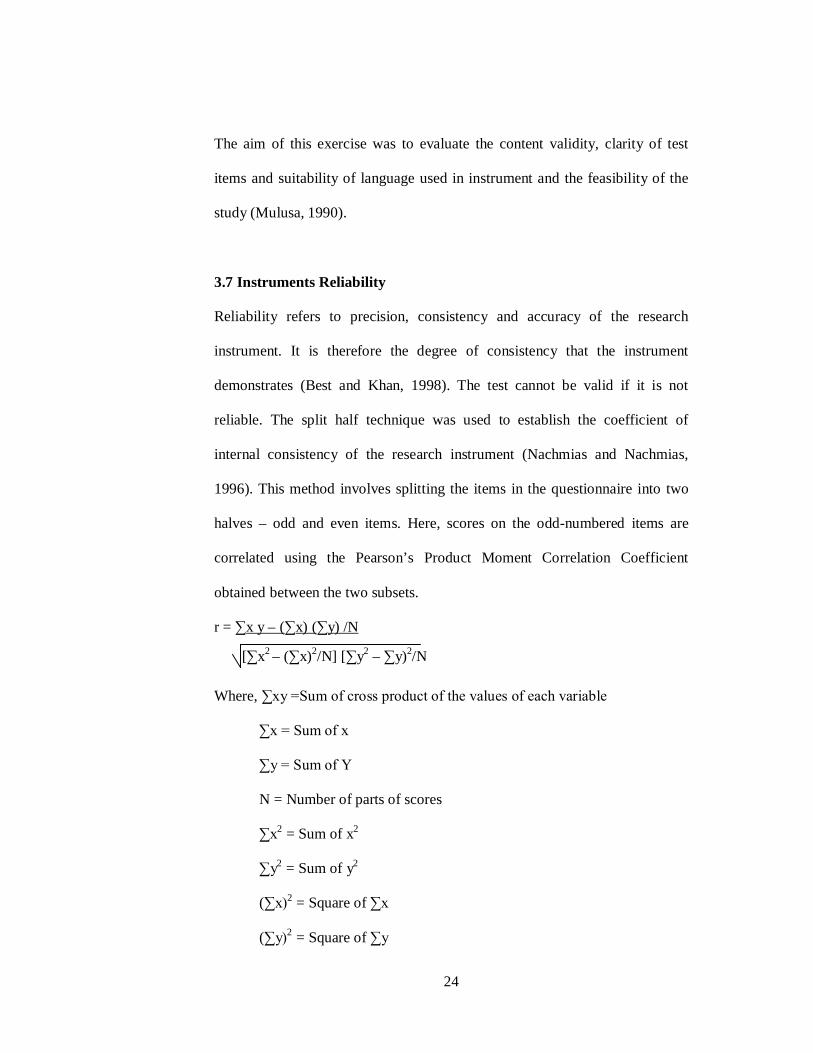
correlated using the Pearson’s Product Moment Correlation Coefficient
obtained between the two subsets.
r = ∑x y – (∑x) (∑y) /N
Where, ∑xy =Sum of cross product of the values of each variable
∑x = Sum of x
∑y = Sum of Y
N = Number of parts of scores
∑x2 = Sum of x2
∑y2 = Sum of y2
(∑x)2 = Square of ∑x
(∑y)2 = Square of ∑y
25
1 + r
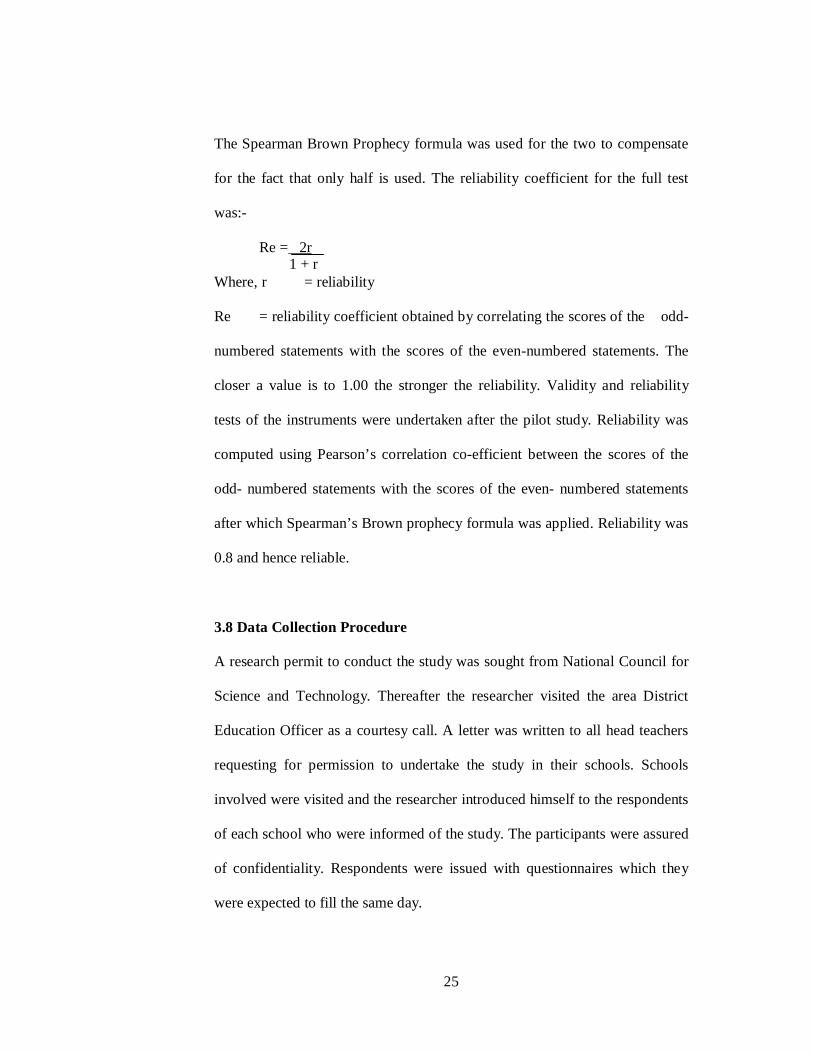
The Spearman Brown Prophecy formula was used for the two to compensate
for the fact that only half is used. The reliability coefficient for the full test
was:-
Re = 2r
Where, r = reliability
Re = reliability coefficient obtained by correlating the scores of the odd-
numbered statements with the scores of the even-numbered statements. The
closer a value is to 1.00 the stronger the reliability. Validity and reliability
tests of the instruments were undertaken after the pilot study. Reliability was
computed using Pearson’s correlation co-efficient between the scores of the
odd- numbered statements with the scores of the even- numbered statements
after which Spearman’s Brown prophecy formula was applied. Reliability was
0.8 and hence reliable.
3.8 Data Collection Procedure
A research permit to conduct the study was sought from National Council for
Science and Technology. Thereafter the researcher visited the area District
Education Officer as a courtesy call. A letter was written to all head teachers
requesting for permission to undertake the study in their schools. Schools
involved were visited and the researcher introduced himself to the respondents
of each school who were informed of the study. The participants were assured
of confidentiality. Respondents were issued with questionnaires which they
were expected to fill the same day.
26
3.9 Data Analysis Techniques
The researcher first edited the data to inspect for completeness, accuracy of
information and uniformity of information obtained. Then the items were
classified, scored and totalled. Descriptive statistics such as percentage and
frequency distribution tables were used to analyze the data. The results were
reported through detailed descriptions and use of appropriate tables and
figures. The analysis was based on the research questions that had been
formulated at the beginning of the study.
27
CHAPTER FOUR
DATA ANALYSIS, INTERPRETATION AND DISCUSSION
4.1 Introduction
This chapter focuses on data analysis and interpretation of research findings.
The section starts with response rate, demographic information then
presentations on the research questions. Research questions were; how does
teacher-pupil ratio influence student’s K C P E performance; how does pupil-
book ratio influence performance of the learner in KCPE examinations; how
does frequent internal assessment influence performance of KCPE among
learners and how physical resources influence performance of learners in
KCPE examinations do.
4.2 Questionnaire Completion Rate
The instruments were administered through personal visits paid to the school
by the researcher. Questionnaire completion rate is the proportion of the
sample that participated as intended in all the research procedures. Out of the 9
head teachers sampled 8 (88.8%) returned the questionnaires. Out of the 16
sampled teachers 14 (87.5%) returned the questionnaire and out of 691 pupils
600(86.8%) returned the questionnaire. This percentage returned rate was
above the recommended 80% by Mmaduakonam (1998) and hence deemed
adequate for the study.
28
87.50%,
12.50%
Male
Female
4.3 Demographic Information of the Respondents
This section covers the demographic information of the respondents namely
the head teachers, teachers and pupils.
4.3.1 Demographic Information of Head teachers
Demographic information of the head teachers was based on their gender, age,
experience and professional qualifications.
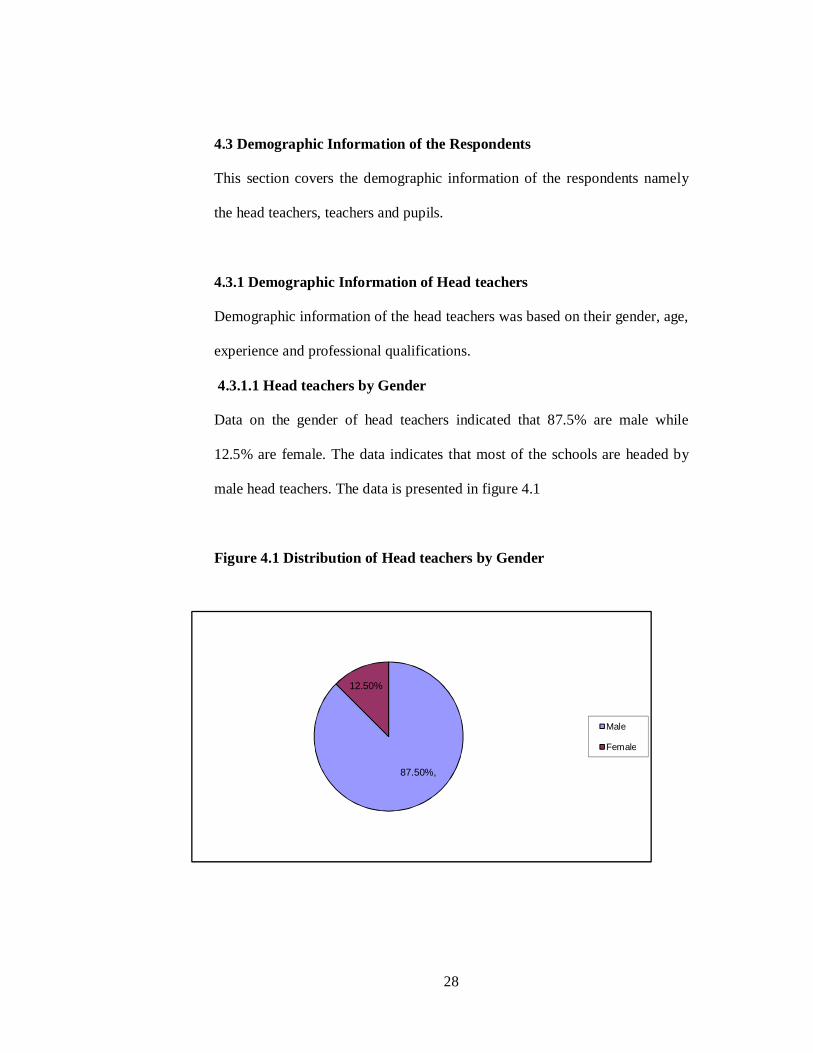
4.3.1.1 Head teachers by Gender
Data on the gender of head teachers indicated that 87.5% are male while
12.5% are female. The data indicates that most of the schools are headed by
male head teachers. The data is presented in figure 4.1
Figure 4.1 Distribution of Head teachers by Gender
29
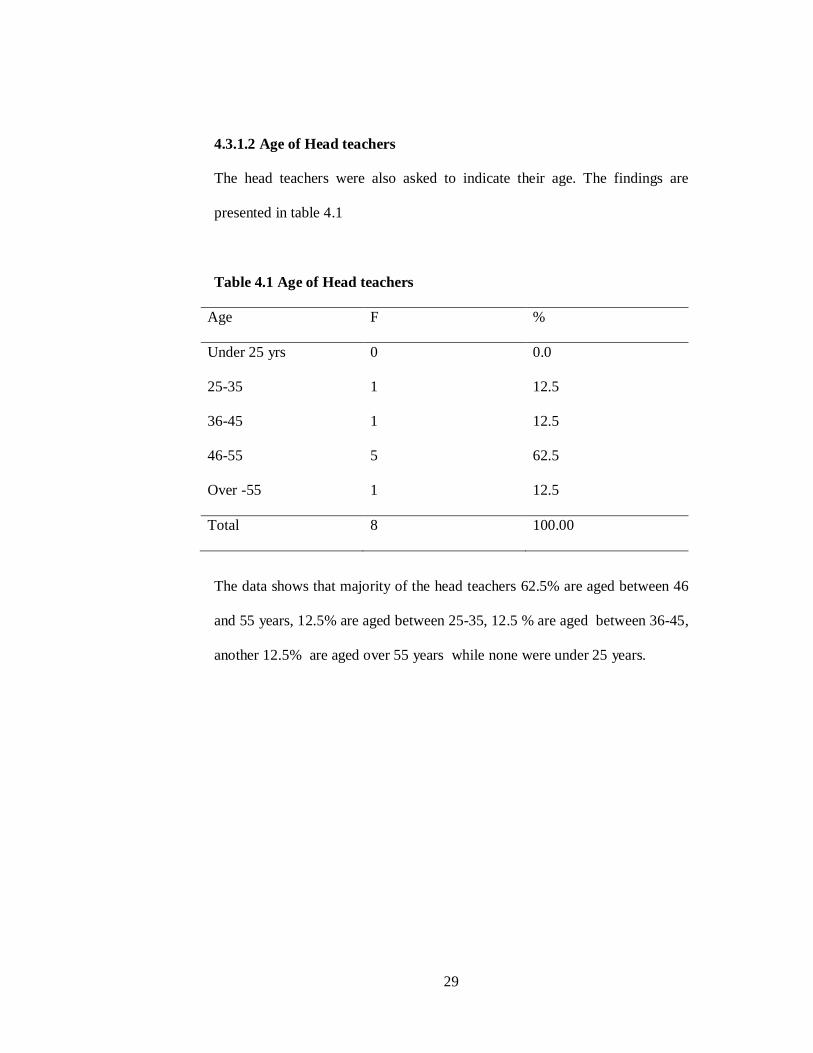
4.3.1.2 Age of Head teachers
The head teachers were also asked to indicate their age. The findings are
presented in table 4.1
Table 4.1 Age of Head teachers
Age F %
Under 25 yrs 0 0.0
25-35 1 12.5
36-45 1 12.5
46-55 5 62.5
Over -55 1 12.5
Total 8 100.00
The data shows that majority of the head teachers 62.5% are aged between 46
and 55 years, 12.5% are aged between 25-35, 12.5 % are aged between 36-45,
another 12.5% are aged over 55 years while none were under 25 years.
30
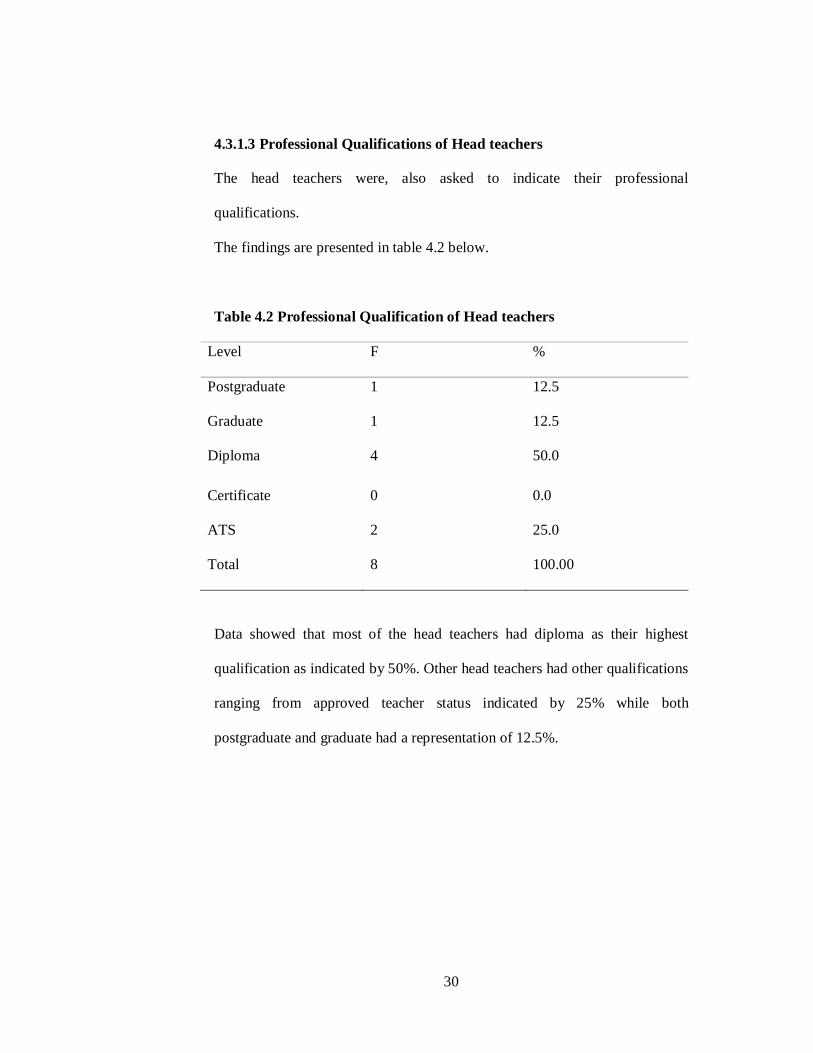
4.3.1.3 Professional Qualifications of Head teachers
The head teachers were, also asked to indicate their professional
qualifications.
The findings are presented in table 4.2 below.
Table 4.2 Professional Qualification of Head teachers
Level F %
Postgraduate 1 12.5
Graduate 1 12.5
Diploma 4 50.0
Certificate 0 0.0
ATS 2 25.0
Total 8 100.00
Data showed that most of the head teachers had diploma as their highest
qualification as indicated by 50%. Other head teachers had other qualifications
ranging from approved teacher status indicated by 25% while both
postgraduate and graduate had a representation of 12.5%.
31
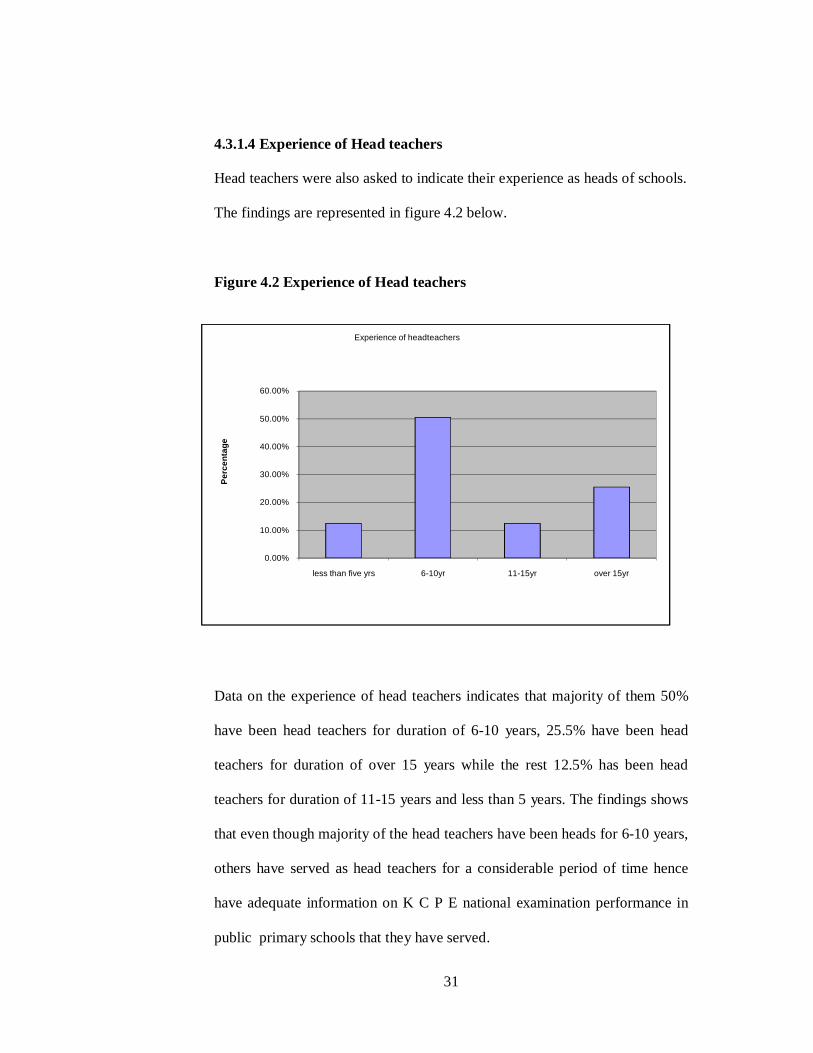
4.3.1.4 Experience of Head teachers
Head teachers were also asked to indicate their experience as heads of schools.
The findings are represented in figure 4.2 below.
Figure 4.2 Experience of Head teachers
Data on the experience of head teachers indicates that majority of them 50%
have been head teachers for duration of 6-10 years, 25.5% have been head
teachers for duration of over 15 years while the rest 12.5% has been head
teachers for duration of 11-15 years and less than 5 years. The findings shows
that even though majority of the head teachers have been heads for 6-10 years,
others have served as head teachers for a considerable period of time hence
have adequate information on K C P E national examination performance in
public primary schools that they have served.
0.00%
10.00%
20.00%
30.00%
40.00%
50.00%
60.00%
less than five yrs 6-10yr 11-15yr over 15yr
Perc
enta
ge
Experience of headteachers
32
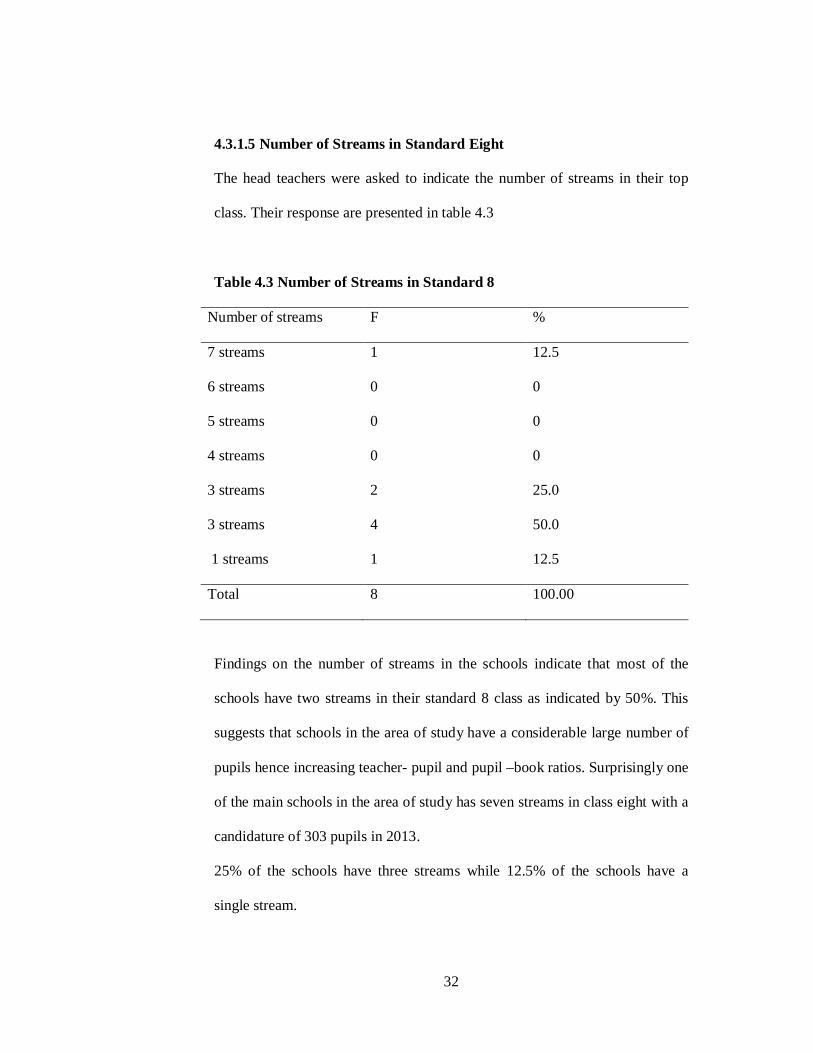
4.3.1.5 Number of Streams in Standard Eight
The head teachers were asked to indicate the number of streams in their top
class. Their response are presented in table 4.3
Table 4.3 Number of Streams in Standard 8
Number of streams F %
7 streams 1 12.5
6 streams 0 0
5 streams 0 0
4 streams 0 0
3 streams 2 25.0
3 streams 4 50.0
1 streams 1 12.5
Total 8 100.00
Findings on the number of streams in the schools indicate that most of the
schools have two streams in their standard 8 class as indicated by 50%. This
suggests that schools in the area of study have a considerable large number of
pupils hence increasing teacher- pupil and pupil –book ratios. Surprisingly one
of the main schools in the area of study has seven streams in class eight with a
candidature of 303 pupils in 2013.
25% of the schools have three streams while 12.5% of the schools have a
single stream.
33
4.3.2 Demographic Information of Teachers
The demographic information of teachers was based on gender, age,
professional qualifications and work experience or the duration of time that
one has been a primary school teacher.
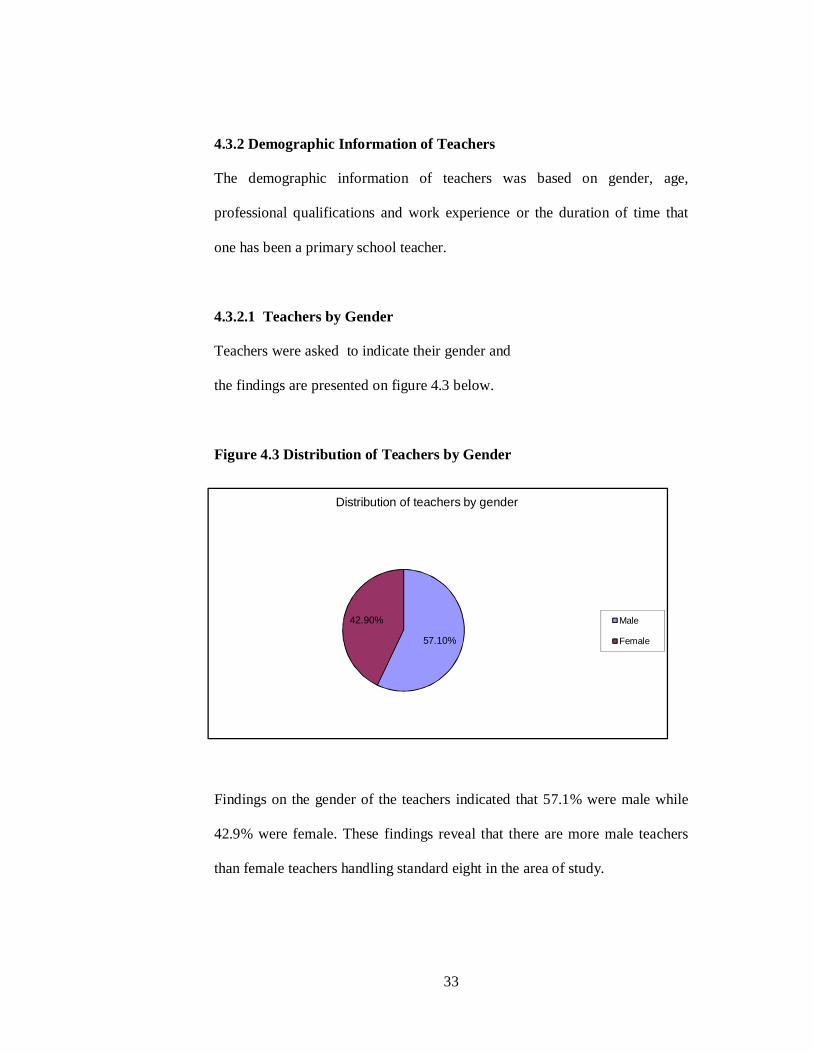
4.3.2.1 Teachers by Gender
Teachers were asked to indicate their gender and
the findings are presented on figure 4.3 below.
Figure 4.3 Distribution of Teachers by Gender
Findings on the gender of the teachers indicated that 57.1% were male while
42.9% were female. These findings reveal that there are more male teachers
than female teachers handling standard eight in the area of study.
57.10%
42.90%
Distribution of teachers by gender
Male
Female
34
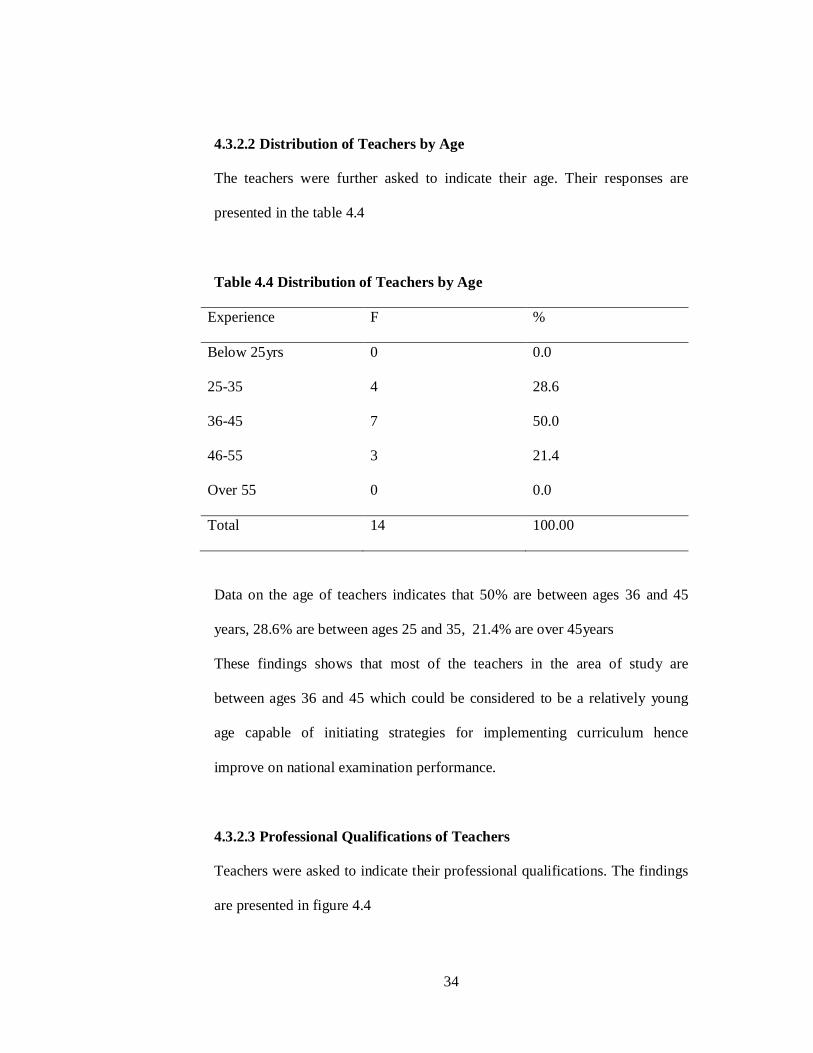
4.3.2.2 Distribution of Teachers by Age
The teachers were further asked to indicate their age. Their responses are
presented in the table 4.4
Table 4.4 Distribution of Teachers by Age
Experience F %
Below 25yrs 0 0.0
25-35 4 28.6
36-45 7 50.0
46-55 3 21.4
Over 55 0 0.0
Total 14 100.00
Data on the age of teachers indicates that 50% are between ages 36 and 45
years, 28.6% are between ages 25 and 35, 21.4% are over 45years
These findings shows that most of the teachers in the area of study are
between ages 36 and 45 which could be considered to be a relatively young
age capable of initiating strategies for implementing curriculum hence
improve on national examination performance.
4.3.2.3 Professional Qualifications of Teachers
Teachers were asked to indicate their professional qualifications. The findings
are presented in figure 4.4
35
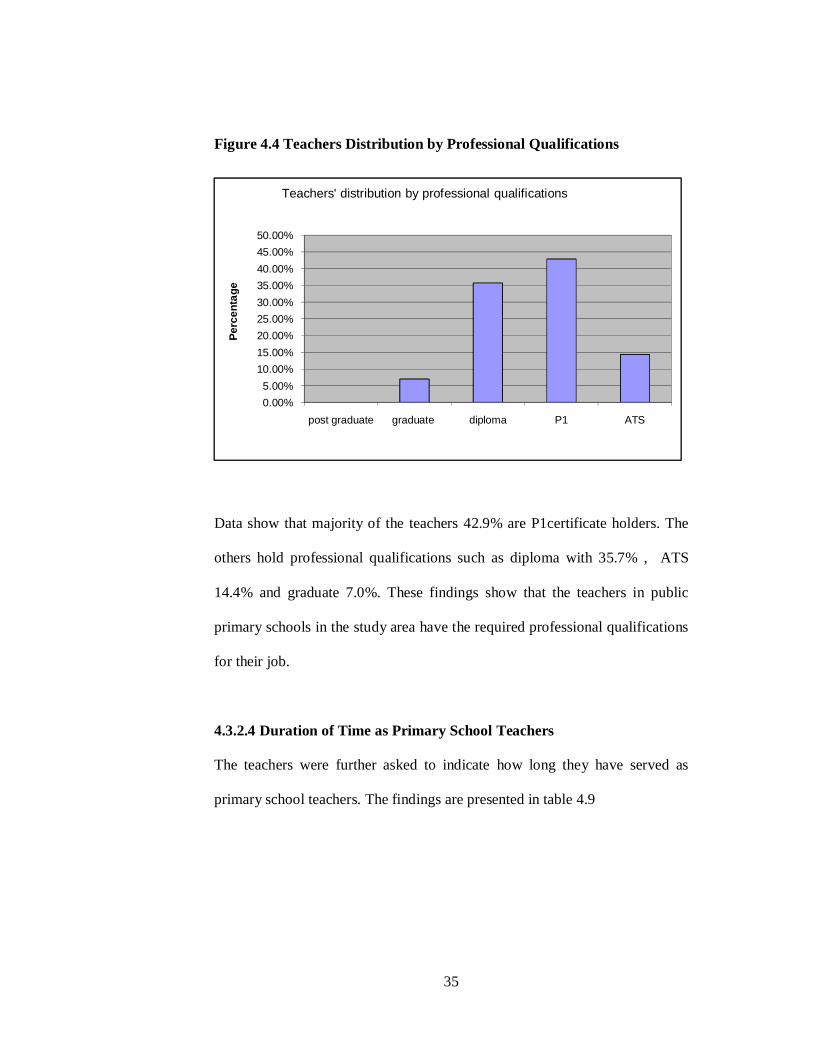
Figure 4.4 Teachers Distribution by Professional Qualifications
Data show that majority of the teachers 42.9% are P1certificate holders. The
others hold professional qualifications such as diploma with 35.7% , ATS
14.4% and graduate 7.0%. These findings show that the teachers in public
primary schools in the study area have the required professional qualifications
for their job.
4.3.2.4 Duration of Time as Primary School Teachers
The teachers were further asked to indicate how long they have served as
primary school teachers. The findings are presented in table 4.9
0.00%5.00%
10.00%15.00%20.00%25.00%30.00%35.00%40.00%45.00%50.00%
post graduate graduate diploma P1 ATS
Perc
enta
ge
Teachers' distribution by professional qualifications
36
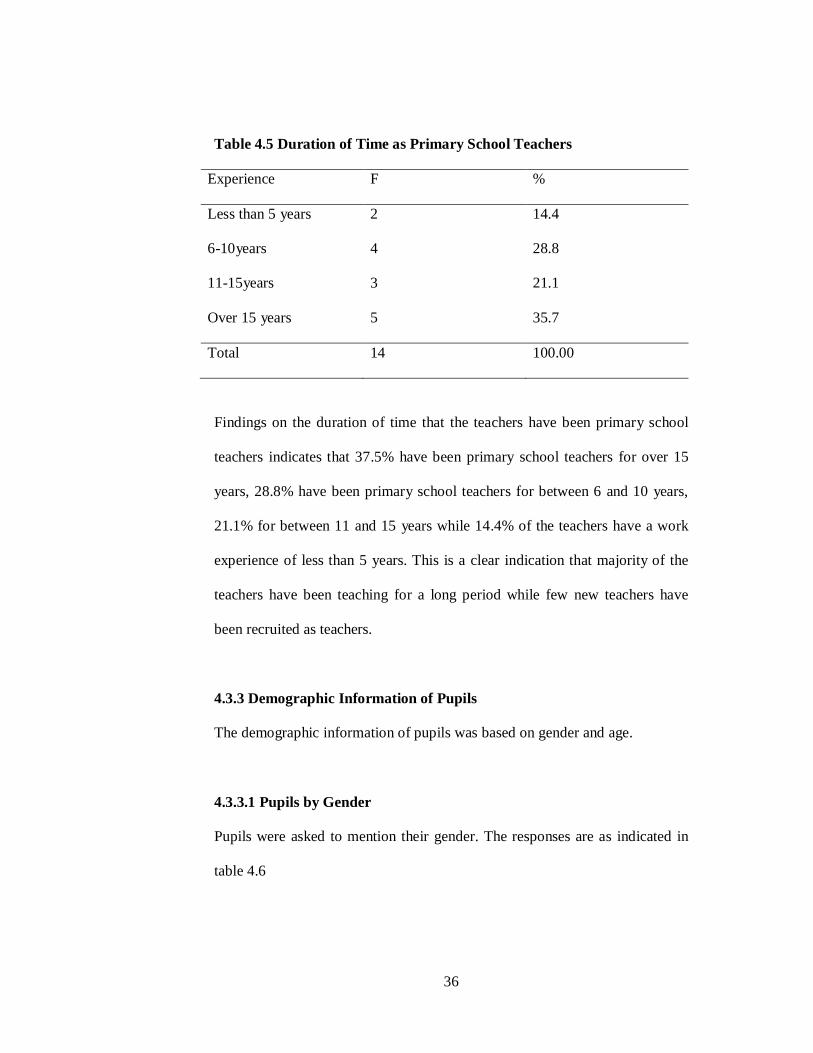
Table 4.5 Duration of Time as Primary School Teachers
Experience F %
Less than 5 years 2 14.4
6-10years 4 28.8
11-15years 3 21.1
Over 15 years 5 35.7
Total 14 100.00
Findings on the duration of time that the teachers have been primary school
teachers indicates that 37.5% have been primary school teachers for over 15
years, 28.8% have been primary school teachers for between 6 and 10 years,
21.1% for between 11 and 15 years while 14.4% of the teachers have a work
experience of less than 5 years. This is a clear indication that majority of the
teachers have been teaching for a long period while few new teachers have
been recruited as teachers.
4.3.3 Demographic Information of Pupils
The demographic information of pupils was based on gender and age.
4.3.3.1 Pupils by Gender
Pupils were asked to mention their gender. The responses are as indicated in
table 4.6
37
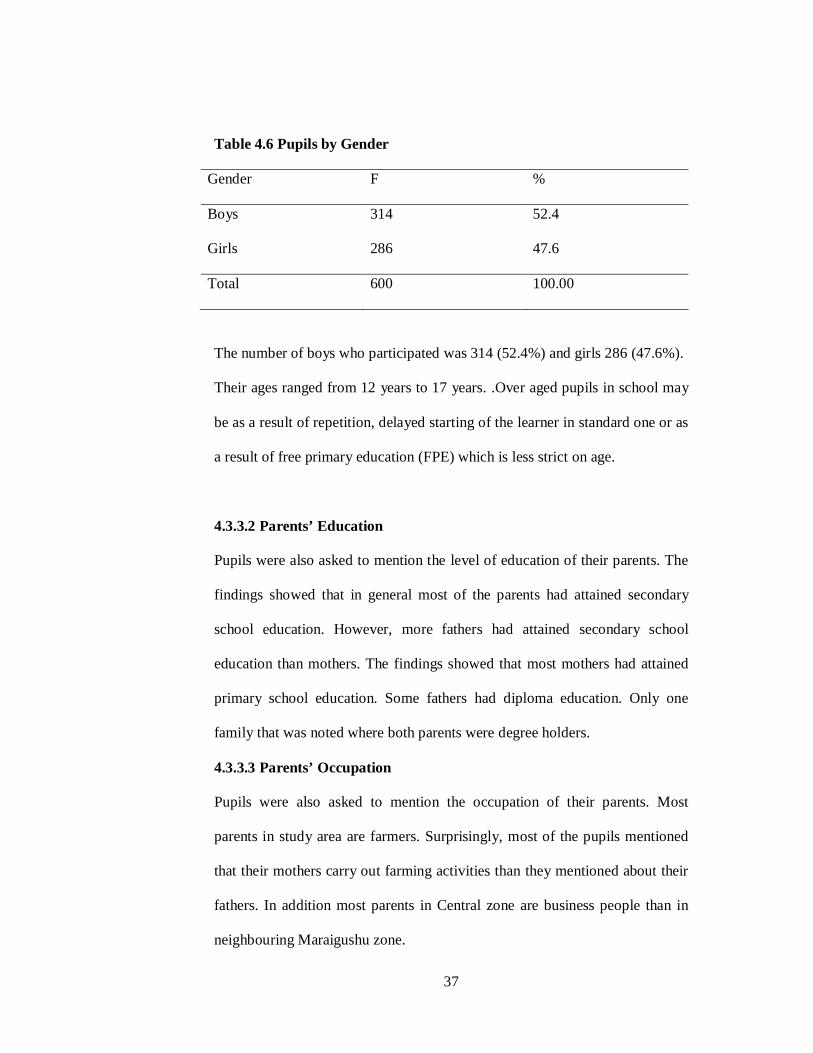
Table 4.6 Pupils by Gender
Gender F %
Boys 314 52.4
Girls 286 47.6
Total 600 100.00
The number of boys who participated was 314 (52.4%) and girls 286 (47.6%).
Their ages ranged from 12 years to 17 years. .Over aged pupils in school may
be as a result of repetition, delayed starting of the learner in standard one or as
a result of free primary education (FPE) which is less strict on age.
4.3.3.2 Parents’ Education
Pupils were also asked to mention the level of education of their parents. The
findings showed that in general most of the parents had attained secondary
school education. However, more fathers had attained secondary school
education than mothers. The findings showed that most mothers had attained
primary school education. Some fathers had diploma education. Only one
family that was noted where both parents were degree holders.
4.3.3.3 Parents’ Occupation
Pupils were also asked to mention the occupation of their parents. Most
parents in study area are farmers. Surprisingly, most of the pupils mentioned
that their mothers carry out farming activities than they mentioned about their
fathers. In addition most parents in Central zone are business people than in
neighbouring Maraigushu zone.
38
4.3.3.4 Marks in the Previous Exam Done
When asked to mention about the marks they got in their last exams,. Table
4.7 shows distribution of marks by pupils in the last exam that they did.
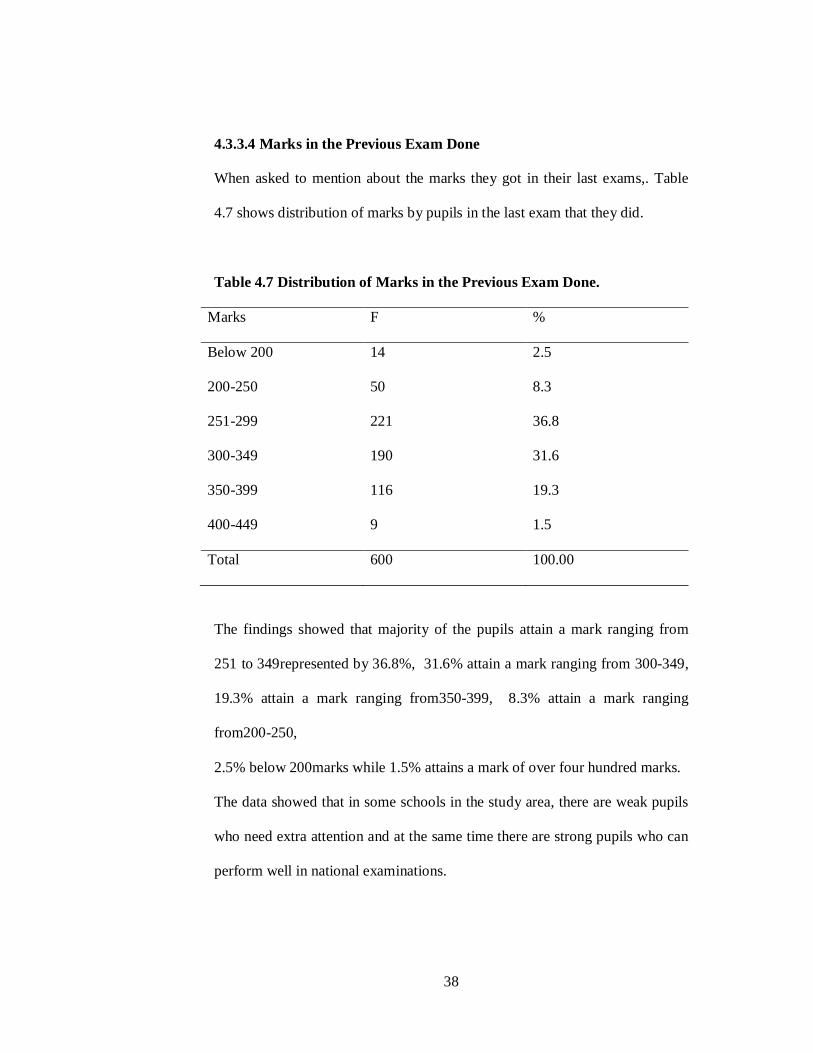
Table 4.7 Distribution of Marks in the Previous Exam Done.
Marks F %
Below 200 14 2.5
200-250 50 8.3
251-299 221 36.8
300-349 190 31.6
350-399 116 19.3
400-449 9 1.5
Total 600 100.00
The findings showed that majority of the pupils attain a mark ranging from
251 to 349represented by 36.8%, 31.6% attain a mark ranging from 300-349,
19.3% attain a mark ranging from350-399, 8.3% attain a mark ranging
from200-250,
2.5% below 200marks while 1.5% attains a mark of over four hundred marks.
The data showed that in some schools in the study area, there are weak pupils
who need extra attention and at the same time there are strong pupils who can
perform well in national examinations.
39
4.4 Information about K.C.P.E 2012 Performance and Enrolment of
Candidates in 2013.
This section aimed at finding out how different public primary schools
performed in KCPE 2012 and the current enrolment of candidates who will sit
for KCPE in 2013.
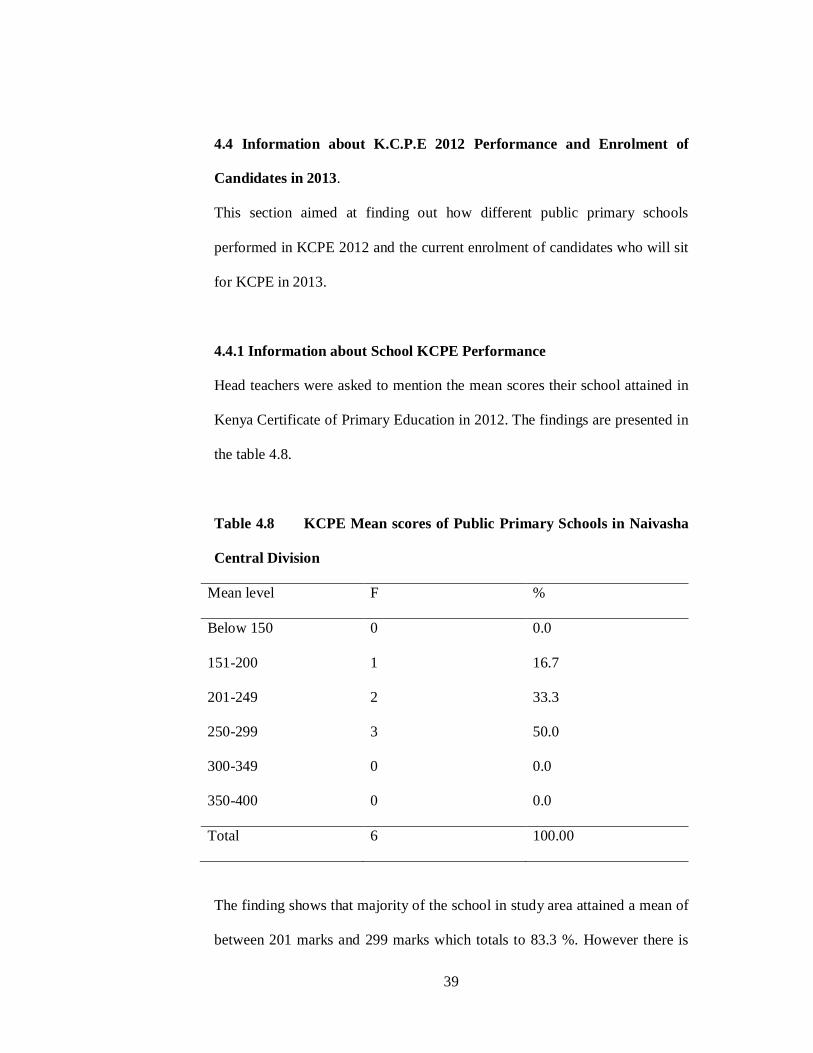
4.4.1 Information about School KCPE Performance
Head teachers were asked to mention the mean scores their school attained in
Kenya Certificate of Primary Education in 2012. The findings are presented in
the table 4.8.
Table 4.8 KCPE Mean scores of Public Primary Schools in Naivasha
Central Division
Mean level F %
Below 150 0 0.0
151-200 1 16.7
201-249 2 33.3
250-299 3 50.0
300-349 0 0.0
350-400 0 0.0
Total 6 100.00
The finding shows that majority of the school in study area attained a mean of
between 201 marks and 299 marks which totals to 83.3 %. However there is
40
still an indication that there are some few schools that did not attain a mean of
over 200 marks in the study area as indicated by 16.7%. The findings also
showed that rarely have the public schools in the study area attained a mean
300% and over in national examinations.
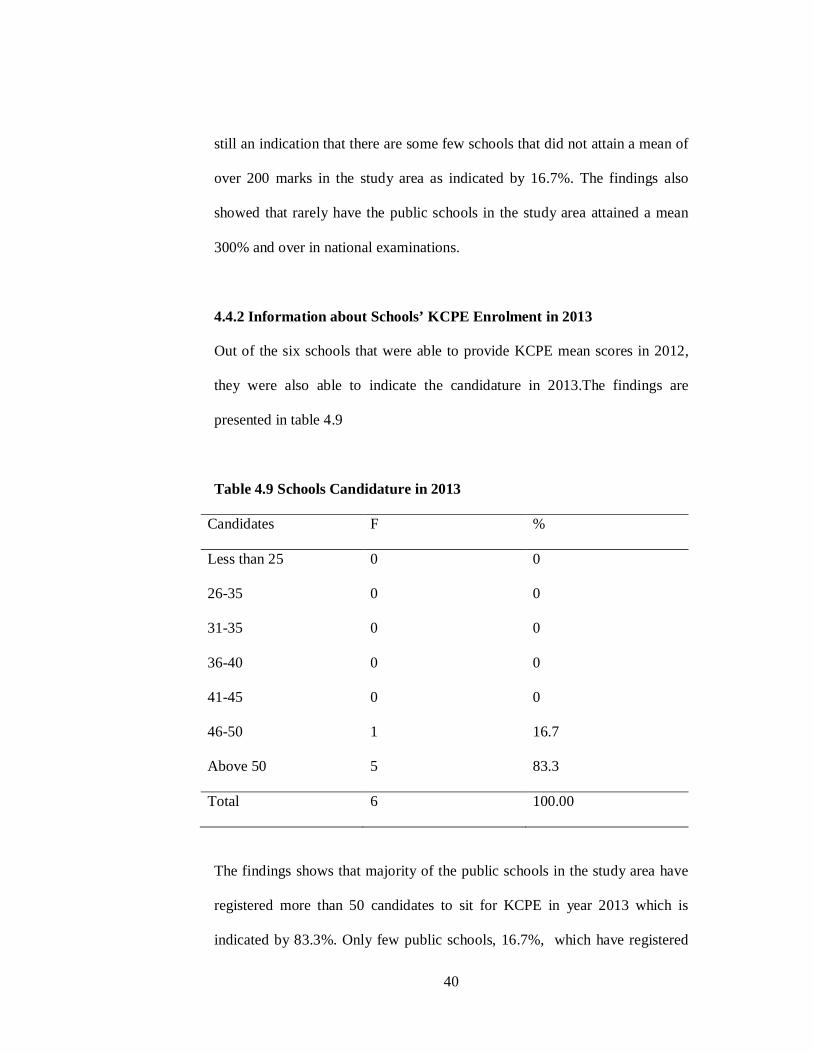
4.4.2 Information about Schools’ KCPE Enrolment in 2013
Out of the six schools that were able to provide KCPE mean scores in 2012,
they were also able to indicate the candidature in 2013.The findings are
presented in table 4.9
Table 4.9 Schools Candidature in 2013
Candidates F %
Less than 25 0 0
26-35 0 0
31-35 0 0
36-40 0 0
41-45 0 0
46-50 1 16.7
Above 50 5 83.3
Total 6 100.00
The findings shows that majority of the public schools in the study area have
registered more than 50 candidates to sit for KCPE in year 2013 which is
indicated by 83.3%. Only few public schools, 16.7%, which have registered
41
below 50 candidates to sit for KCPE 2013. This is an indication that most of
the schools in the study area have large standard eight classes.
4.5 Findings of the Study
Data presented in this section was as a result of analyzing the research
questions which were set to help attain research objectives. Four objectives
were set and the first one aimed at establishing the extent to which teacher-
pupil ratio influences performance of pupils in national examinations. The
second objective aimed at examining the extent to which pupil-book ratio
influence learners’ performance in national examination and the third
objective aimed at determining the extent to which frequent internal
assessment influences performance of learners in national examination while
the fourth objective aimed at examining how physical resources influence
performance of learners in examinations.
From these objectives the research questions are restated and evidence linked
to their testing is presented in the subsections that follow.
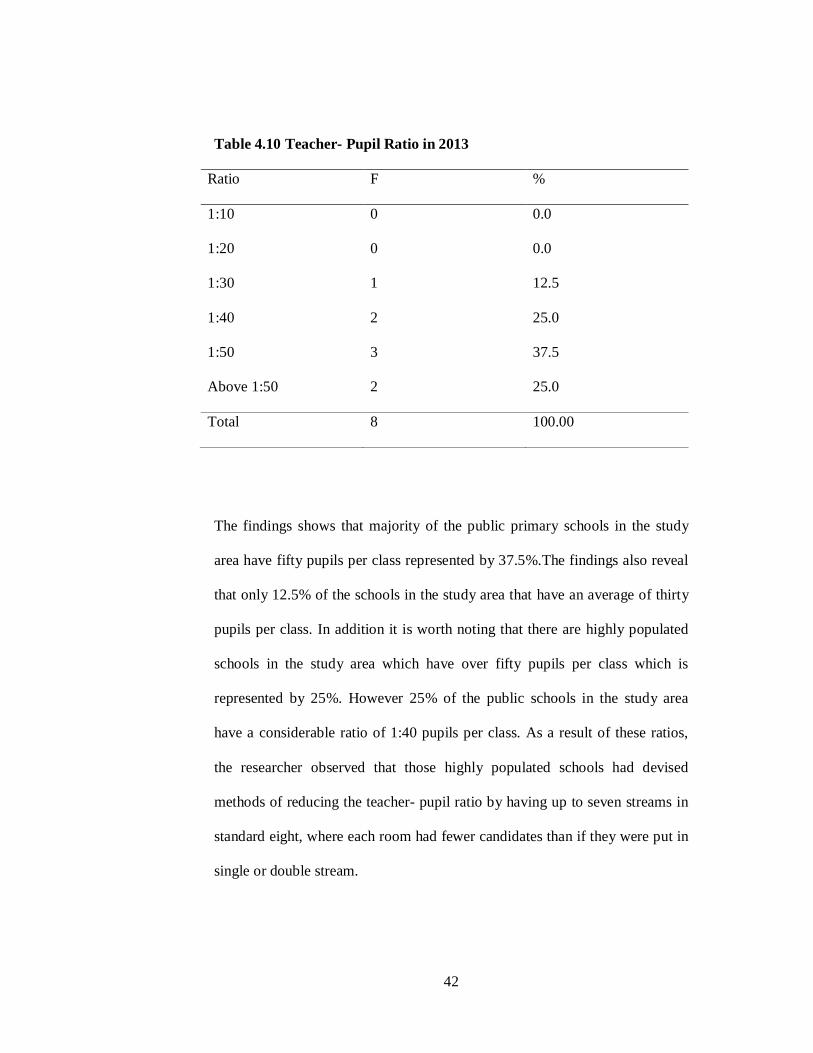
4.5.1 How does Teacher- Pupil Ratio Influence Students KCPE
Performance?
Head teachers were asked to indicate the teacher -pupil ratio in their schools.
Table 4.10 indicates what public primary schools in the study area are having
as teacher- pupil ratio as was provided by head teachers.
42
Table 4.10 Teacher- Pupil Ratio in 2013
Ratio F %
1:10 0 0.0
1:20 0 0.0
1:30 1 12.5
1:40 2 25.0
1:50 3 37.5
Above 1:50 2 25.0
Total 8 100.00
The findings shows that majority of the public primary schools in the study
area have fifty pupils per class represented by 37.5%.The findings also reveal
that only 12.5% of the schools in the study area that have an average of thirty
pupils per class. In addition it is worth noting that there are highly populated
schools in the study area which have over fifty pupils per class which is
represented by 25%. However 25% of the public schools in the study area
have a considerable ratio of 1:40 pupils per class. As a result of these ratios,
the researcher observed that those highly populated schools had devised
methods of reducing the teacher- pupil ratio by having up to seven streams in
standard eight, where each room had fewer candidates than if they were put in
single or double stream.
43
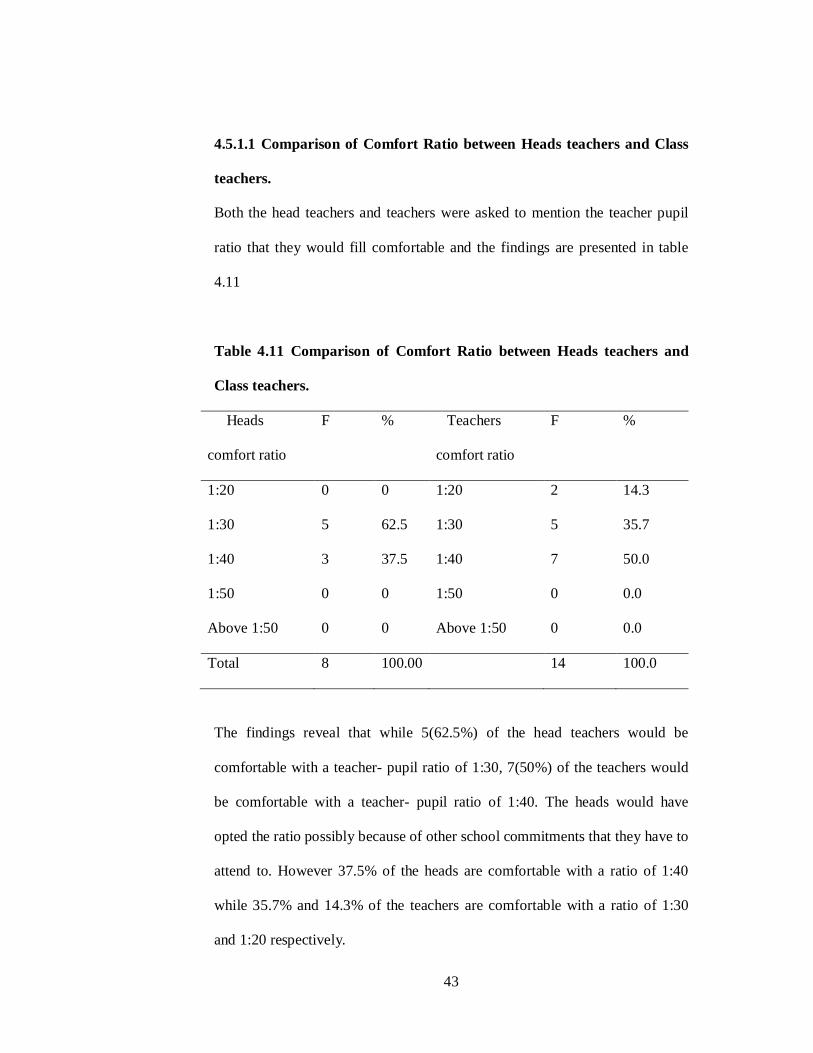
4.5.1.1 Comparison of Comfort Ratio between Heads teachers and Class
teachers.
Both the head teachers and teachers were asked to mention the teacher pupil
ratio that they would fill comfortable and the findings are presented in table
4.11
Table 4.11 Comparison of Comfort Ratio between Heads teachers and
Class teachers.
Heads
comfort ratio
F % Teachers
comfort ratio
F %
1:20 0 0 1:20 2 14.3
1:30 5 62.5 1:30 5 35.7
1:40 3 37.5 1:40 7 50.0
1:50 0 0 1:50 0 0.0
Above 1:50 0 0 Above 1:50 0 0.0
Total 8 100.00 14 100.0
The findings reveal that while 5(62.5%) of the head teachers would be
comfortable with a teacher- pupil ratio of 1:30, 7(50%) of the teachers would
be comfortable with a teacher- pupil ratio of 1:40. The heads would have
opted the ratio possibly because of other school commitments that they have to
attend to. However 37.5% of the heads are comfortable with a ratio of 1:40
while 35.7% and 14.3% of the teachers are comfortable with a ratio of 1:30
and 1:20 respectively.
44
Both heads and class teachers were asked to give their opinions on whether
teacher-pupil ratio influences pupils’ performance in national examinations.
The responses given indicated that 95.5% of the respondents agreed to the
item and gave reasons to their response as that a class of too many pupils is
not well attended and that slow learners tend to be left behind .In addition the
responses given mentioned that in small classes it is possible to reach every
child’s needs. One of the respondents stated that, “This is because teacher-
pupil contacts during the lesson matters a lot. The lesser number of pupils in a
class, the easier the work of the teacher. The teacher will be able to reach
every pupil.” The remaining 4.5% of the respondents did not give their
opinion towards whether teacher-pupil ratio influences performance of
learners in national examinations or not.
4.5.2 How does Pupil-Book Ratio Influence Performance of the Learner in
KCPE Examinations?
Head teachers were asked to indicate how pupil-book ratio is in their schools.
Table 4.12 shows distribution of pupil-book ratio in schools in the study area.
Scale used for the ratio: 1. 1:1 2. 1:2 3. 1: 3 4. 1:4 5. 1:5
6. 1:6
45
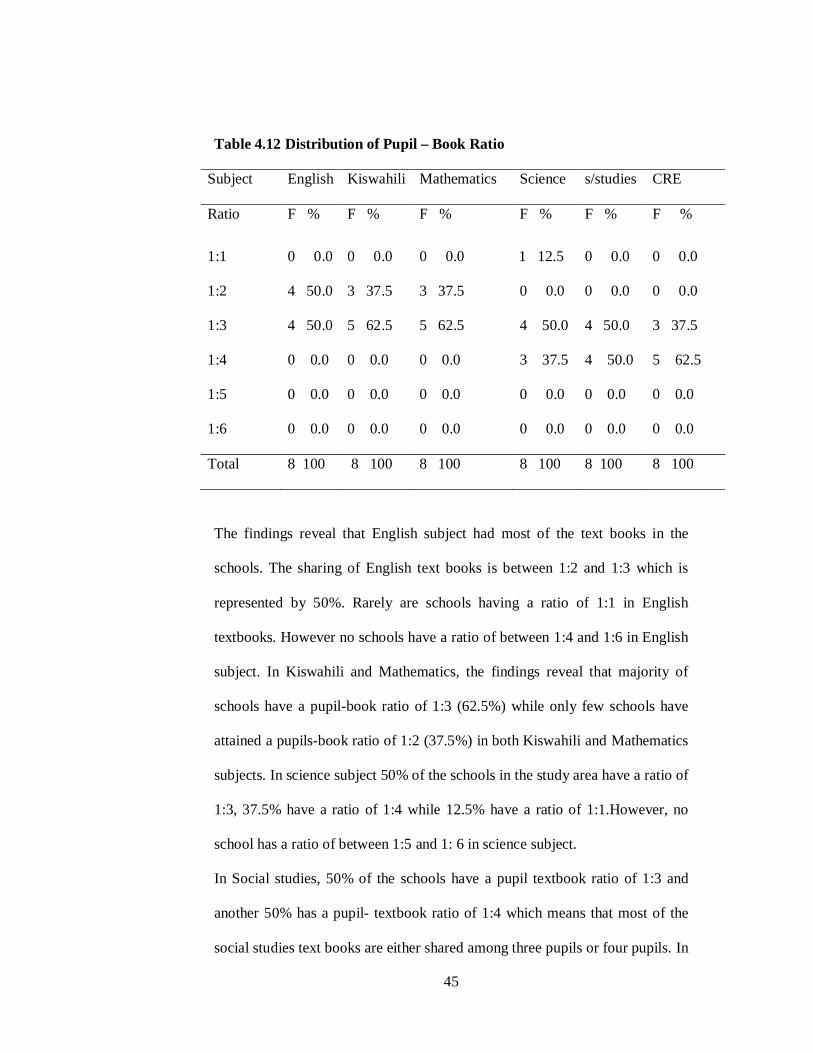
Table 4.12 Distribution of Pupil – Book Ratio
Subject English Kiswahili Mathematics Science s/studies CRE
Ratio F % F % F % F % F % F %
1:1 0 0.0 0 0.0 0 0.0 1 1 12.5 0 0.0 0 0.0
1:2 4 50.0 3 37.5 3 37.5 0 0.0 0 0.0 0 0.0
1:3 4 50.0 5 62.5 5 62.5 4 50.0 4 50.0 3 37.5
1:4 0 0.0 0 0.0 0 0.0 3 37.5 4 50.0 5 62.5
1:5 0 0.0 0 0.0 0 0.0 0 0.0 0 0.0 0 0.0
1:6 0 0.0 0 0.0 0 0.0 0 0.0 0 0.0 0 0.0
Total 8 100 8 100 8 100 8 100 8 100 8 100
The findings reveal that English subject had most of the text books in the
schools. The sharing of English text books is between 1:2 and 1:3 which is
represented by 50%. Rarely are schools having a ratio of 1:1 in English
textbooks. However no schools have a ratio of between 1:4 and 1:6 in English
subject. In Kiswahili and Mathematics, the findings reveal that majority of
schools have a pupil-book ratio of 1:3 (62.5%) while only few schools have
attained a pupils-book ratio of 1:2 (37.5%) in both Kiswahili and Mathematics
subjects. In science subject 50% of the schools in the study area have a ratio of
1:3, 37.5% have a ratio of 1:4 while 12.5% have a ratio of 1:1.However, no
school has a ratio of between 1:5 and 1: 6 in science subject.
In Social studies, 50% of the schools have a pupil textbook ratio of 1:3 and
another 50% has a pupil- textbook ratio of 1:4 which means that most of the
social studies text books are either shared among three pupils or four pupils. In
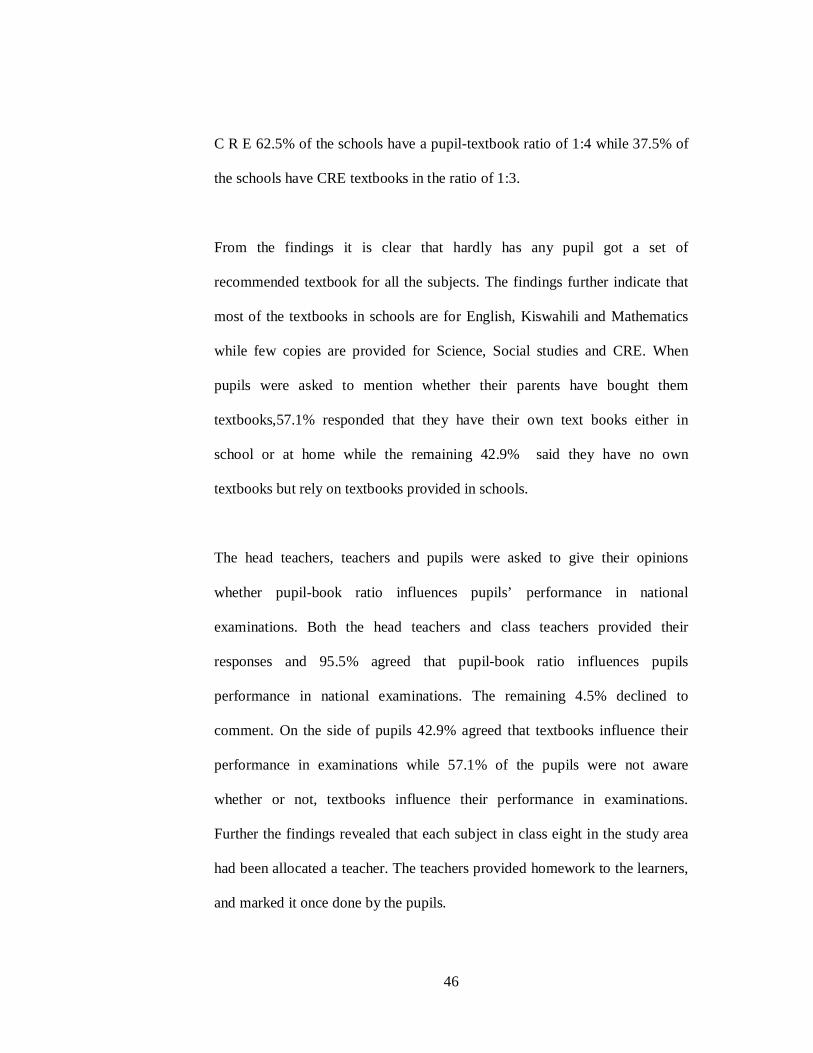
46
C R E 62.5% of the schools have a pupil-textbook ratio of 1:4 while 37.5% of
the schools have CRE textbooks in the ratio of 1:3.
From the findings it is clear that hardly has any pupil got a set of
recommended textbook for all the subjects. The findings further indicate that
most of the textbooks in schools are for English, Kiswahili and Mathematics
while few copies are provided for Science, Social studies and CRE. When
pupils were asked to mention whether their parents have bought them
textbooks,57.1% responded that they have their own text books either in
school or at home while the remaining 42.9% said they have no own
textbooks but rely on textbooks provided in schools.
The head teachers, teachers and pupils were asked to give their opinions
whether pupil-book ratio influences pupils’ performance in national
examinations. Both the head teachers and class teachers provided their
responses and 95.5% agreed that pupil-book ratio influences pupils
performance in national examinations. The remaining 4.5% declined to
comment. On the side of pupils 42.9% agreed that textbooks influence their
performance in examinations while 57.1% of the pupils were not aware
whether or not, textbooks influence their performance in examinations.
Further the findings revealed that each subject in class eight in the study area
had been allocated a teacher. The teachers provided homework to the learners,
and marked it once done by the pupils.
47
4.5.3 How does Frequent Internal Assessment Influence Performance of
KCPE among Learners?
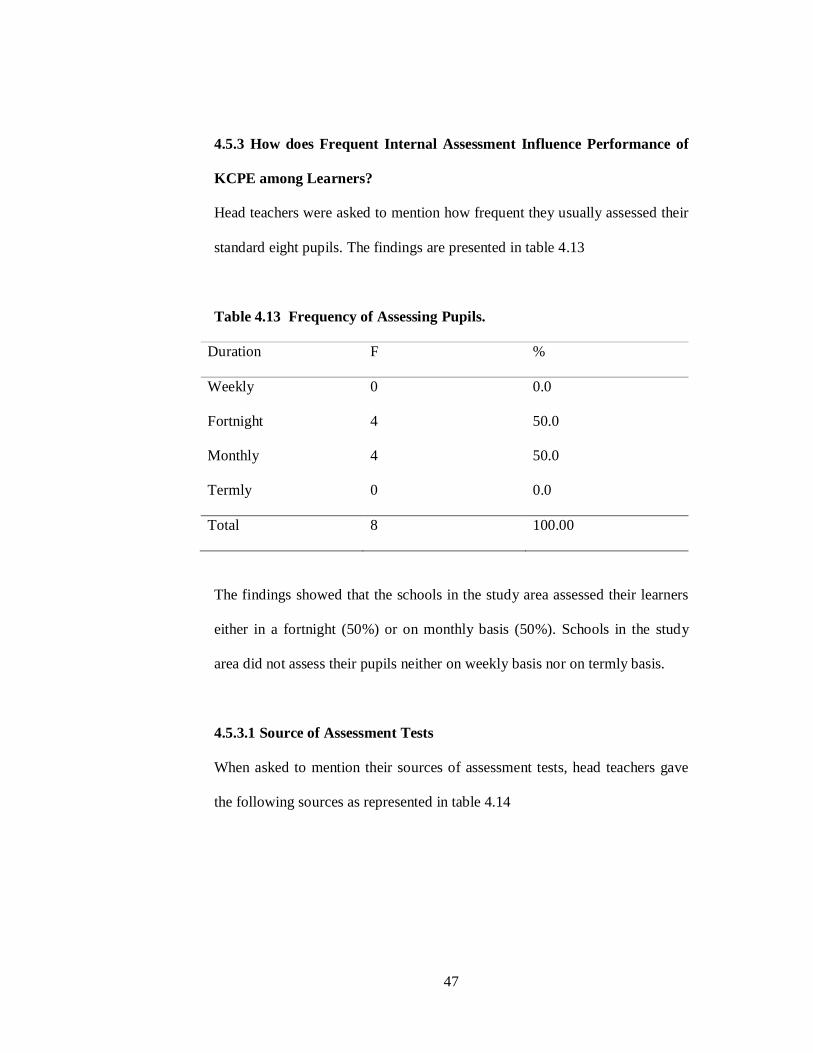
Head teachers were asked to mention how frequent they usually assessed their
standard eight pupils. The findings are presented in table 4.13
Table 4.13 Frequency of Assessing Pupils.
Duration F %
Weekly 0 0.0
Fortnight 4 50.0
Monthly 4 50.0
Termly 0 0.0
Total 8 100.00
The findings showed that the schools in the study area assessed their learners
either in a fortnight (50%) or on monthly basis (50%). Schools in the study
area did not assess their pupils neither on weekly basis nor on termly basis.
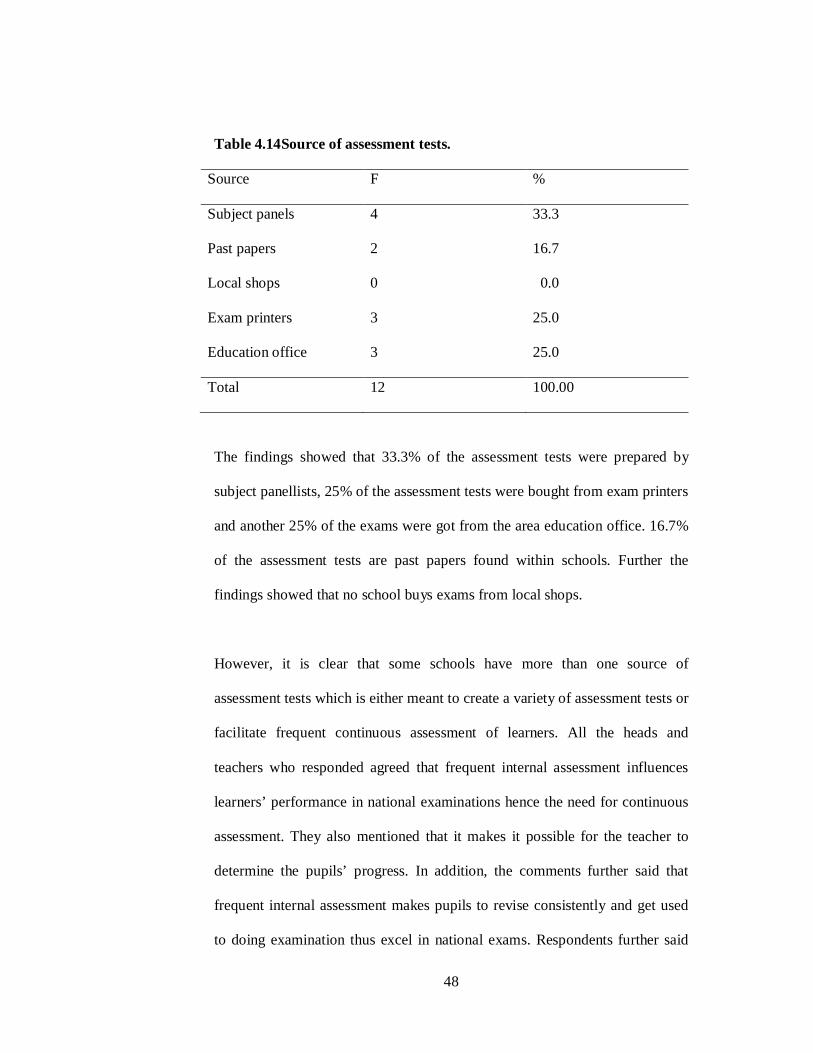
4.5.3.1 Source of Assessment Tests
When asked to mention their sources of assessment tests, head teachers gave
the following sources as represented in table 4.14
48
Table 4.14Source of assessment tests.
Source F %
Subject panels 4 33.3
Past papers 2 16.7
Local shops 0 0.0
Exam printers 3 25.0
Education office 3 25.0
Total 12 100.00
The findings showed that 33.3% of the assessment tests were prepared by
subject panellists, 25% of the assessment tests were bought from exam printers
and another 25% of the exams were got from the area education office. 16.7%
of the assessment tests are past papers found within schools. Further the
findings showed that no school buys exams from local shops.
However, it is clear that some schools have more than one source of
assessment tests which is either meant to create a variety of assessment tests or
facilitate frequent continuous assessment of learners. All the heads and
teachers who responded agreed that frequent internal assessment influences
learners’ performance in national examinations hence the need for continuous
assessment. They also mentioned that it makes it possible for the teacher to
determine the pupils’ progress. In addition, the comments further said that
frequent internal assessment makes pupils to revise consistently and get used
to doing examination thus excel in national exams. Respondents further said
49
that assessment makes it possible for the teacher and the learner to follow the
performance. This feedback makes each one of them to put in more effort and
that frequent internal assessment create an atmosphere of competition and
serves as a measuring rod to syllabus coverage, achievement of objectives and
evaluation of teaching methods which leads to improvement where affected.
Pupils were also asked to comment about frequent internal assessment. 100%
of the pupils agreed that they do assessment tests in their schools either twice
in a term namely midterm exam and end term exam, thrice in a term or even
more than thrice in a term. They agreed that after every assessment test done
follows provision of results of exams and revision of the same. When asked
whether continuous assessments tests influences their performance and
attainment of marks, 28.6% agreed that continuous assessment influences their
performance in exams while 71.6% are not aware whether frequent continuous
assessment influences their performance or not.
4.5.4 How do Physical Resources Influence Performance of Learners in
KCPE Examination?
On these research question, the researcher asked questions about library
resources in public primary schools in the study area. The findings revealed
that of all those schools visited, there was no library within the school
compound. As a result, schools within the study area did not have a teacher
librarian hence difficult to plan for library lessons.
50
Despite lacking library resource within public primary schools in the study
area, they have few supplementary leaders (story books for learners). Of the
available supplementary readers 33.3% of the pupils are allowed to borrow
reading materials while the rest 67.7% do not borrow supplementary reading
materials. The findings revealed that there is hardly any library lesson in the
main timetable, though only few schools have lessons for library in their main
timetable. The findings further revealed that 16.7% of the schools have
enough reference books while 83.3% of the schools in the study area do not
have enough reference books. When asked to comment about library resources
and performance, 83.3% of the heads and class teachers agreed that library
resources influences performance of pupils in national examinations but
16.7% declined to comment. 47.6% of the pupils agreed that library resources
influence their performance in examinations while 52.4% of the pupils are not
aware whether library resources influence their performance in examinations
or not.
51
CHAPTER FIVE
SUMMARY, CONCLUSIONS AND RECOMMENDATIONS
5.1 Introduction.
This section focuses on summary of the study, conclusions, recommendations
and suggestions for further research.
5.2 Summary of the Study
The purpose of this study was to focus on the factors that influence the
performance of the Kenya certificate of primary education in public primary
schools in Naivasha Central Division, Naivasha District. The specific
objectives of this study were to establish the extent to which teacher - pupil
ratio influences pupils performance and also to examine the extent to which
pupil –book ratio influences learners performance. The study also aimed at
determining the extent to which frequent internal assessment influences
performance of learners and lastly, the study examined how physical resources
influence performance of learners in national examinations.
The study intended to find out whether teacher-pupil ratio, pupil-book ratio,
frequent internal assessment and physical resources such as libraries are some
of the factors in public primary schools that influence performance of learners
in national examination. Performance of a school depends on how the head
teacher plans, organizes and coordinates the activities of the school as well as
motivating his /her teachers.
52
The head teachers need to improve on their management skills in order to
uplift achievement standards of schools even with limited resources in their
schools. Being innovative and making maximum use of locally available
resources can be a solution to some of the challenges that hamper performance
of pupils in national examinations.
In order to arrive to these findings from the study, research questions were
postulated. Literature review relevant to this study provided the basic
guidelines providing the necessary background for the study. It covered
institutional factors that influence pupils’ performance in national
examinations and other studies relevant to the research. The research design
used was ex.-post factor. It involves studies that investigate possible cause and
effect by observing an existing condition and searching back in time for
plausible causal factors. Cohen and Manion (1994) defined ex- post facto
research as a method of testing out possible antecedents of events that have
happened and cannot, therefore, be engineered or manipulated by the
investigator.
Random sampling was used to select respondent from a population of about 29
head teachers, 53 teachers and 2301 pupils. The sample consisted of 9 head
teachers, 16 teachers and 691 pupils. A sample of 30% of each category of
respondents was selected as is suggested by Mugenda and Mugenda (1999).
Random sampling was used in selecting schools, teachers and pupils as
respondents from each school. Questionnaires for head teachers, teachers and
53
pupils were developed and used to gather pertinent information from the
respondents.
The questionnaires had two sections. Section A on demographic data and
section B and questions related to the research questions. Once the data was
collected, analysis was done using frequencies, percentages tables and graphs.
The questions asked involved Yes and No answers and a provision of an
opinion / suggestions to the responses chosen at the end of every section of
research questions. Validity and reliability tests of the instruments were
undertaken after the pilot study. Reliability was computed using Pearson’s
correlation co-efficient between the scores of the odd- numbered statements
with the scores of the even- numbered statements after which Spearman’s
Brown prophecy formula was applied reliability was applied. Reliability was
0.8 and hence reliable. Descriptive statistics such as frequencies, percentages,
frequency distribution tables and graphs were used to describe data collected
during the research. Explanation of analysis using percentages and frequencies
has been provided after every table.
5.3 Research Findings
The findings showed that only few new teachers are being recruited because
only 14.4% of the teachers who responded have worked for less than five
years. Thus the findings revealed that the teacher-pupil ratio continues to be
high due to less teachers being recruited whereby if enough teachers were
54
recruited in schools would reduce the teacher-pupil ratio to a more easily
manageable ratio.
The findings also showed that most schools in the study area have not yet
attained a pupil-book ratio of 1:2 but majority of the schools have a pupil –
book ratio of 1:3. Thus according to the opinions of the respondents, the
findings revealed that it makes it difficult for both teachers and pupils to
attend to homework effectively due to shortage of textbooks. To solve the
problem of textbooks the findings revealed that parents in the study area
provide their children with textbooks. In this study about 57.1% of the pupils
who responded said that their parents had bought them textbooks which they
used either in school or at home. Thus, parents’ involvement in buying
textbooks for their children can be termed as an alternative way to the problem
of pupil-book ratio in the study area.
The findings showed that frequent internal assessment is a major boost to good
performance in national examinations. The rate at which frequent continuous
assessment is carried out in schools in the study area showed that most of the
pupils in standard eight are either assessed within a fortnight or on monthly
basis and usually do an average of three assessment tests per term.
It also showed that pupils usually got a feedback of the exams that they had
done, revised with their teachers and made a progress of their performance as
the teachers monitored their learners as well as ensuring syllabus coverage.
55
The study showed that library resources in public primary schools in the study
area were very much inadequate. Only few schools which had entered a
library lesson in their main timetable. Reading and reference materials were
found inadequate in most of the schools in the study area. The findings
therefore showed that if enough supplementary reading materials were
provided to schools in the study area they would possibly experience
improved quality of teaching and learning in their schools and hence improved
performance of pupils in national examination.
5.4 Conclusion
Based on the research questions it was concluded that various factors which to
a great extent include teacher-pupil ratio, pupil-book ratio, frequent internal
assessment and physical resources are factors that influence pupils’
performance in KCPE national examinations in public primary schools in
Naivasha central division, Naivasha district.
Most of the head teachers and teachers gave their opinion that the number of
pupils attended to by one teacher affects pupils’ performance either positively
or negatively. The larger the class, the more demanding the class is and
individual needs and interests of learners’ especially slow ones are not
adequately attended to. Smaller classes are comfortable to handle with
teacher- pupil ratio of between 1:30 and 1:40 per class.
56
Head teachers and teachers also gave their opinion about pupil-book ratio.
Most of them agreed that there is a direct relationship between access to
learning materials and performance of learners. The more a learner is exposed
to books the more the learner acquires more information hence improved
learning outcomes. This was so to library resources where most of the heads
and teachers termed it as a base and a rich environment for knowledge
acquisition and exposure to information leading to improved learning
outcomes. Lastly the study concluded that frequent continuous assessment to
pupils is one formative way of evaluating learners and teachers use it to impart
exam answering skills to learners and also as a way of exposing learners to
answering questions as the pupils /candidates wait to be summatively
evaluated during national examination. Thus frequent internal assessment is
common to all public primary schools in the study area.
5.5 Recommendations
Based on the findings it is recommended that there should be alternative ways
of dealing with shortage of teachers such as recruiting PTA teachers to ease
burden on already existing teachers in schools. Head teachers should work
hand in hand with school managing committees (SMC) in order for them to
take care of PTA teachers by providing their wages. Head teachers and SMC
should look for alternative ways of reducing pupil-book ratio by either
involving parents in buying supplementary books, purchasing recommended
textbooks by the government through the most current orange book as well as
57
maintain the already existing text books in stores. Schools should device ways
and means of recovering lost or damaged books by pupils.
Heads teahers should look for quality and relevant assessment tests that will
yield to their pupils as expected and those that will finally lead to academic
excellence. This will eventually help improve the overall performance of
Naivasha district in national examinations. Schools should not ignore the
importance of library resources and should therefore have library lessons
within their main timetable which would otherwise help to great extent slow
learners as they get exposed to a variety of reading and learning materials with
the assistance of a teacher librarian. The Ministry of Education should ensure
funding of FPE is done in time so that schools can budget for teaching and
learning resources. These resources can help reduce shortage of books in
schools hence reduction of pupil-book ratio. It should also ensure that schools
have libraries which are a source of knowledge to learners. Lastly, Teachers
Service Commission should basically recruit and register teachers. The
commission should be actively engaged in teacher appraisal and training. This
would be a motivator for teachers to join and remain in the profession.
5.6 Suggestions for Further Research
Taking the limitations and delimitations of the study the researcher makes the
following suggestions for further research:
i. The effect of teacher-pupil ratio in relation to slow learners
58
ii. An investigation on the role of government policy in ordering
textbooks by schools instructional materials select committee.
iii. Relationship between head teacher’s training and its effect on pupils’
performance in national examinations.
59
REFERENCES
Allan, B. (2006). Supporting Students: The Educational Contribution of
Australia’s Public Libraries.
Arshad, D. M. (2009). Mis-allocation of Student- Teacher Ratio, Class Size and
per Student Expenditure; an issue of Resource Management.
Best, J. N. & Khan, J.W. (1989). Research in Education: New Delhi: Prentice
Hall of India, Private Limited.
Blatchford, P& Bassett, P. (2011). Examining the effect of class size on,
classroom engagement and teacher pupil interaction: learning and
instruction.
Black, P & William, D. (1998). Inside the Classroom Assessment Black Box:
Raising Standards through Class Room Assessment; Department of
Education and Professional Studies.
Borg, W.B. & Gall, M.D (1996) Education Research. An Introduction. 6TH
Edition Newyork Longman.
Card, D. & Alan, B. (1996). School Quality and the Return to Education; The
Effect of School Resources on Students’ Achievement and Adult Success:
Washington OC. Brooking institution.
Cohen. L & Manion, L. (1994).Research Methods in Education Forth Edition; London and New York; Groom Helm Press.
60
Chelimo, W. K. (2005). A Comparative Study of the KCPE Performance
between the Rowland and Highland Areas of Baringo North in
Rift valley Province of Kenya.
Chetalam, S. J. (2004). Factors Affecting Performance in Kenya Certificate
of Primary Education in Kabarnet Division of Baringo District.
Chuck, A. (2009). Disparities in the System; The Effects of Free Primary
Education (FPE) on the Quality of Education in Nairobi’s Public
Schools.
Duflo, E; Dupas, P & Michael, K. (2007). Peer effects, Pupils – Teacher Ratios
and Teacher Incentives in Kenya ; Introduction of FPE in Kenya.
Endya, B.Stewart. (2007). School Structural Characteristics Students’ Effort
Peer Association and Parental Involvement :The Influence of
School and Individuals Level Factors on Academic Achievement :
SAGE Publications.
Farrant, J. S. (1980) Principles and Practices of Education; Second Edition;
New York; Longman Group UK Ltd.
Farooq, M.S. (2011). Factors Affecting Students Quality of Academic
Performance : A case of Secondary School Level Project.
Friberg, H.J. (1999). Measuring Improving and Sustaining Healthy
Learning Environment .Philadelphia; Falmer Press.
61
International Association for School Librarianship (IASL) 2012 Conference.
School’s libraries makes a difference to student’s achievement.
Kunje, D. (2005). An investigation into Relationship between Educational
inputs and rates of Achievement at the Basic Education Level in the
South Western Educational Division in Malawi.
Machila, K.N. (2004). Universal Primary Education (UPE) in
Kenya : Factors Affecting its Effective Implementation –A Case
study of Taveta Division ,Taita Taveta District.
Mc Vitalis, O.D. (2011). The Influence of School Factors on Performance
in Kenya Certificate of Primary Education Examination in non
Formal schools in Kibera Division , Kenya.
Mnyero, J. (2007). The Impact of School Libraries on the Teaching and
Learning Process. Tangata city council Tanzania case study of
sampled primary schools.
Mugenda ,O.M &Mugenda, A.G. (1999). Research Methods: Quantitative
and Qualitative Approaches .Nairobi: ACTS press.
Ministry of Education, Science and Technology (2003). Free Primary
Education Every Child in School .Nairobi; MOEST.
62
Nachmias, C.F.. & Maclmias, D.(1996). Research Methods in Social Sciences.
5th Edition. London: Amold.
Nicholas, J. D. & White J. (2001). Impact of Peer Networks on
Achievements of High School. Algebra students Journal of
Educational research.
.
Rodrigquez, D. (2012). In the Library with the Lead Pipe : United.States
Schwartz, R.M; Schmitt, M.C. & Lose, M.K. (2012). The Elementary School
Journal;Effects of Teacher-Student Ratio in Response to Intervention
Approaches.
UNDP (2003). Human Development Report, 2003, UN.
UNESCO (2004). Education For All : The Quality Imperative EFA Global
Monitoring Report 2005.Paris :UNESCO.
UNESCO (2009). Education For All : Overcoming Inequality why
Governance Matters Efa Global Monitoring Report 2009; Paris:
UNESCO.
63
APPENDICES
APPENDIX A:
INTRODUCTION LETTER
Kabui S. Kirunu
P.O.Box117
North Kinangop
The Head teacher/Class teacher/ Std 8 Pupils
REF: REQUEST FOR ASSISTANCE ON FILLING RESEARCH
QUESTIONNAIRES
I am a student at Nairobi University doing a Masters Degree in Educational
Planning and Administration. I am carrying out an academic research on
institutional factors influencing performance of Kenya Certificate of Primary
Education in public primary schools in Naivasha central division, Naivasha
district. Congratulations for being chosen to participate. All the information
will be for purpose of academics only and identity of respondents will not be
disclosed.
Your assistance and cooperation will be greatly appreciated.
Thank you in advance for your assistance.
Yours faithfully,
Kabui Samuel.
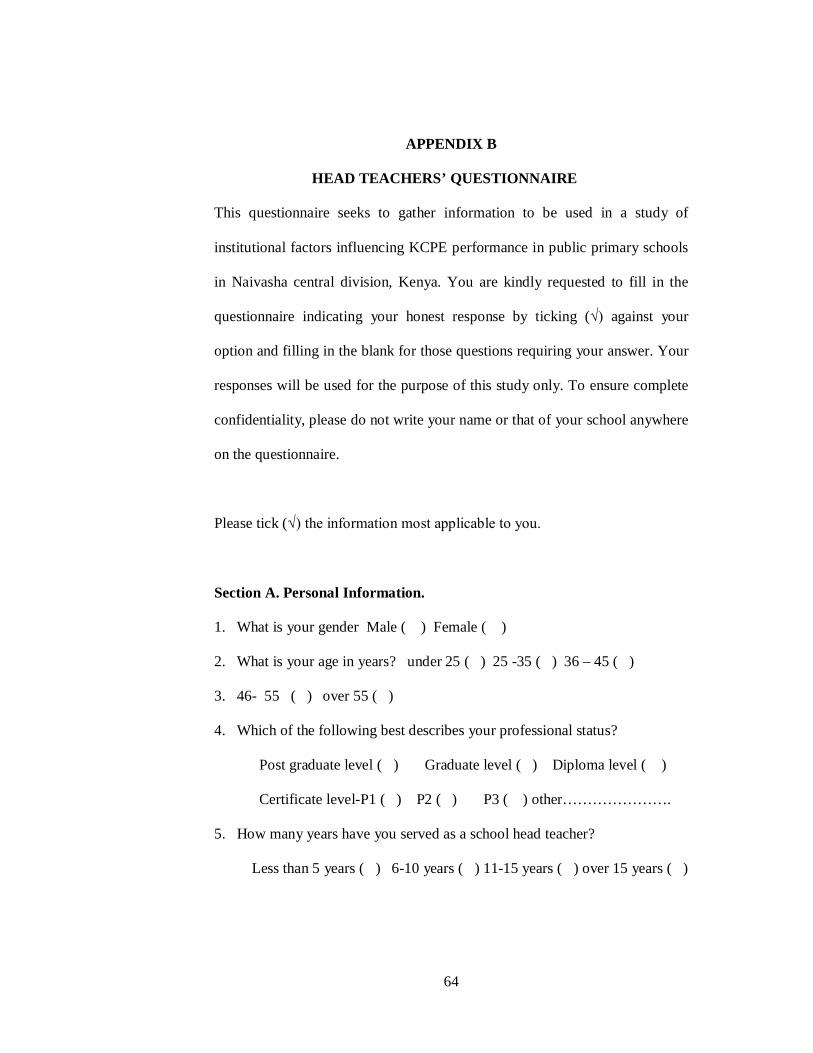
64
APPENDIX B
HEAD TEACHERS’ QUESTIONNAIRE
This questionnaire seeks to gather information to be used in a study of
institutional factors influencing KCPE performance in public primary schools
in Naivasha central division, Kenya. You are kindly requested to fill in the
questionnaire indicating your honest response by ticking (√) against your
option and filling in the blank for those questions requiring your answer. Your
responses will be used for the purpose of this study only. To ensure complete
confidentiality, please do not write your name or that of your school anywhere
on the questionnaire.
Please tick (√) the information most applicable to you.
Section A. Personal Information.
1. What is your gender Male ( ) Female ( )
2. What is your age in years? under 25 ( ) 25 -35 ( ) 36 – 45 ( )
3. 46- 55 ( ) over 55 ( )
4. Which of the following best describes your professional status?
Post graduate level ( ) Graduate level ( ) Diploma level ( )
Certificate level-P1 ( ) P2 ( ) P3 ( ) other………………….
5. How many years have you served as a school head teacher?
Less than 5 years ( ) 6-10 years ( ) 11-15 years ( ) over 15 years ( )
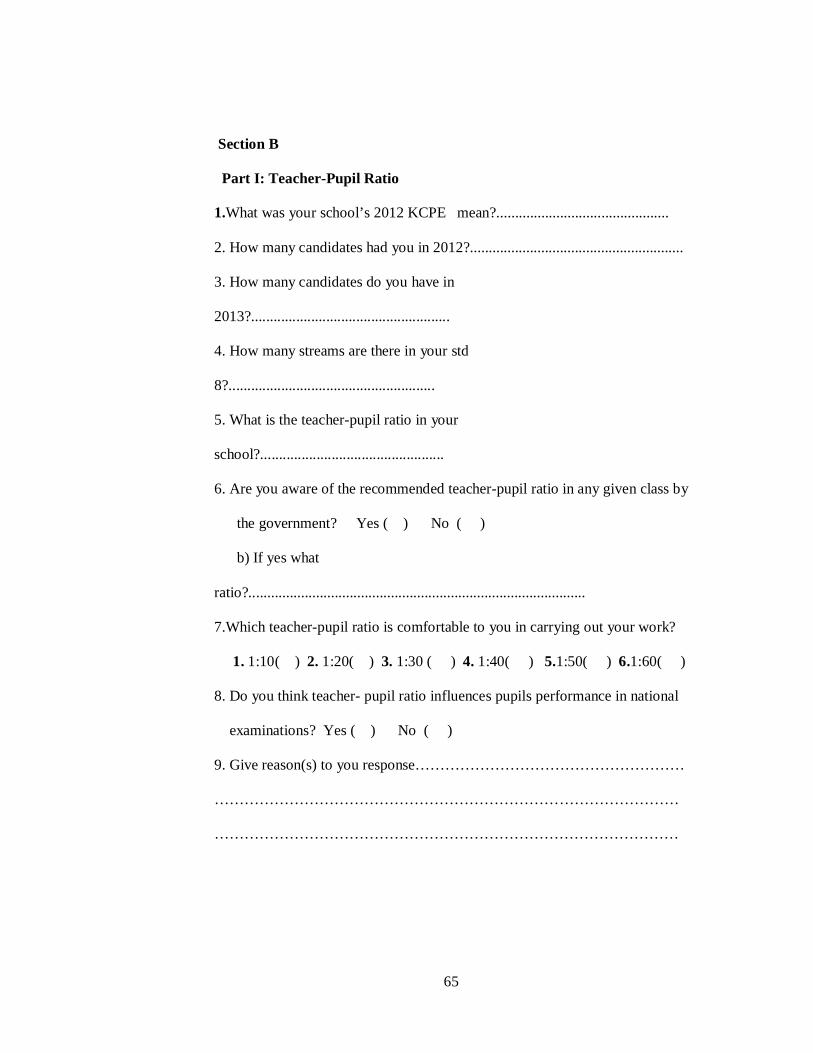
65
Section B
Part I: Teacher-Pupil Ratio
1.What was your school’s 2012 KCPE mean?..............................................
2. How many candidates had you in 2012?.........................................................
3. How many candidates do you have in
2013?.....................................................
4. How many streams are there in your std
8?.......................................................
5. What is the teacher-pupil ratio in your
school?.................................................
6. Are you aware of the recommended teacher-pupil ratio in any given class by
the government? Yes ( ) No ( )
b) If yes what
ratio?..........................................................................................
7.Which teacher-pupil ratio is comfortable to you in carrying out your work?
1. 1:10( ) 2. 1:20( ) 3. 1:30 ( ) 4. 1:40( ) 5.1:50( ) 6.1:60( )
8. Do you think teacher- pupil ratio influences pupils performance in national
examinations? Yes ( ) No ( )
9. Give reason(s) to you response………………………………………………
…………………………………………………………………………………
…………………………………………………………………………………
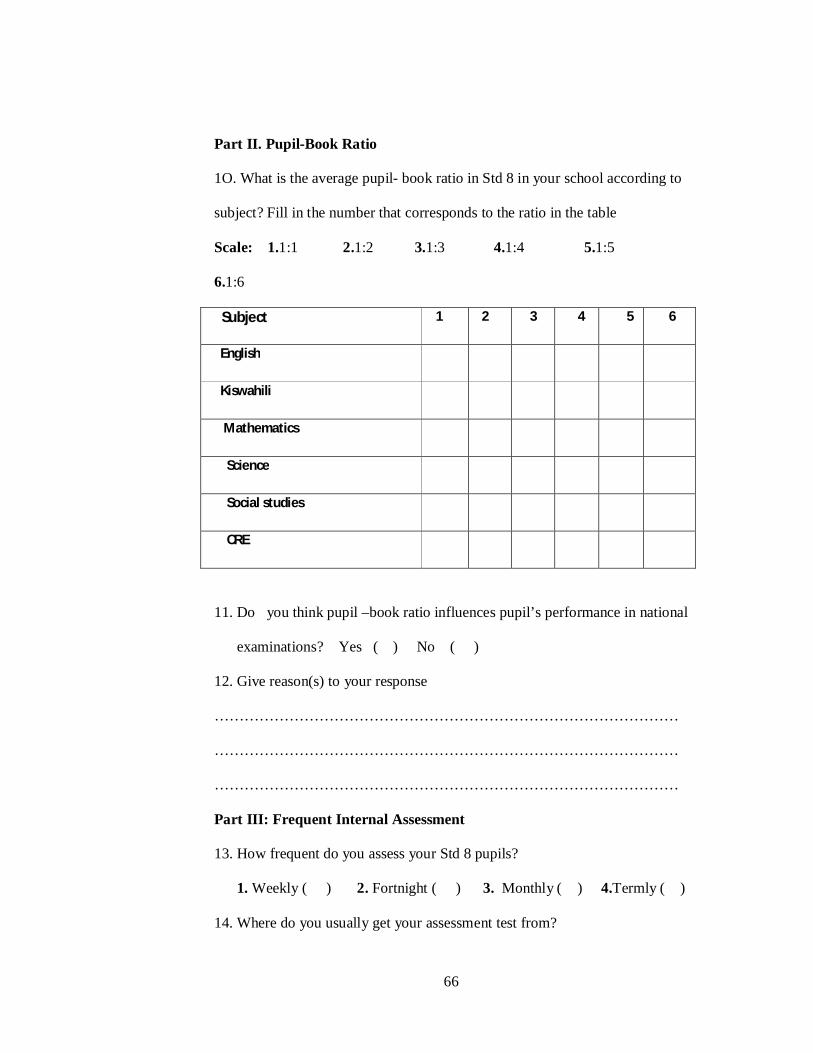
66
Part II. Pupil-Book Ratio
1O. What is the average pupil- book ratio in Std 8 in your school according to
subject? Fill in the number that corresponds to the ratio in the table
Scale: 1.1:1 2.1:2 3.1:3 4.1:4 5.1:5
6.1:6
Subject 1 2 3 4 5 6
English
Kiswahili
Mathematics
Science
Social studies
CRE
11. Do you think pupil –book ratio influences pupil’s performance in national
examinations? Yes ( ) No ( )
12. Give reason(s) to your response
…………………………………………………………………………………
…………………………………………………………………………………
…………………………………………………………………………………
Part III: Frequent Internal Assessment
13. How frequent do you assess your Std 8 pupils?
1. Weekly ( ) 2. Fortnight ( ) 3. Monthly ( ) 4.Termly ( )
14. Where do you usually get your assessment test from?
67
1. Subject panels ( ) 2. Past papers ( ) 3. Local shops ( )
4. Exam printers ( ) 5. Education office ( )
15. Is internal assessment important to learners? Yes ( ) No ( )
16. Do you think frequent internal assessment influences pupils performance
in national examinations? Yes ( ) No ( )
17. Give reason(s) to your response…………………………………………
……………………………………………………………………………
……………………………………………………………................……
Part IV: Library Resources
18.Do you have a library in your school?
Yes ( ) No ( )
19.Do you have enough supplementary leaders in your school?
Yes ( ) No ( )
20.Do you have a teacher librarian in your school?
Yes ( ) No ( )
21.Do you have time schedule for library classes
Yes ( ) No ( )
22.Do you have sufficient reference books in your school library?
Yes ( ) No ( )
68
23.Do you think library resources influences pupils performance in national
examination?
Yes ( ) No ( )
24. Give a reason to your response.
…………………………………………………………………………
…………………………………………………………………………
Thank you very much for your cooperation.
69
APPENDIX C
CLASS TEACHER’S QUESTIONNAIRE
This questionnaire seeks to gather information to be used in a study of
institutional factors influencing KCPE performance in public primary schools
in Naivasha central division, Kenya. You are kindly requested to fill in the
questionnaire indicating your honest response by ticking (√) against your
option and filling in the blank for those questions requiring your answer.
Your responses will be used for the purpose of this study only. To ensure
complete confidentiality, please do not write your name or that of your school
anywhere on the questionnaire.
Please tick (√) the information most applicable to you.
Section A.
Personal Information.
1. What is your gender Male ( ) Female ( )
2. What is your age in years? under 25 ( ) 25 -35 ( ) 36 – 45 ( )
3. 46- 55 ( ) over 55 ( )
4. Which of the following best describes your professional status?
Post graduate level ( ) Graduate level ( ) Diploma level ( )
Certificate level-P1 ( ) P2 ( ) P3 ( ) other………………….
5. How many years have you served as a teacher?
Less than 5 years ( ) 6-10 years ( ) 11-15 years ( ) over 15 years ( )
70
Section B
Part I: Teacher-Pupil Ratio
1.What was your school’s 2012 KCPE mean?................................................
2. How many candidates had you in 2012?.....................................................
3. How many candidates do you have in 2013?............................................
4. How many streams are there in your std 8?..............................................
5. What is the teacher-pupil ratio in your school?..........................................
6. Are you aware of the recommended teacher-pupil ratio in any given class by
the government? Yes ( ) No ( )
b) If yes what ratio?..........................................................................
7. Which teacher-pupil ratio is comfortable to you in carrying out your work?
1. 1:10( ) 2. 1:20 ( ) 3. 1:30 ( ) 4. 1:40 ( ) 5.1:50 ( )
6.1:60( )
8. Do you think teacher- pupil ratio influences pupils performance in national
examinations? Yes ( ) No ( )
9. Give reason(s) to you response………………………………………………
…………………………………………………………………………………
………………………………………………………………………………
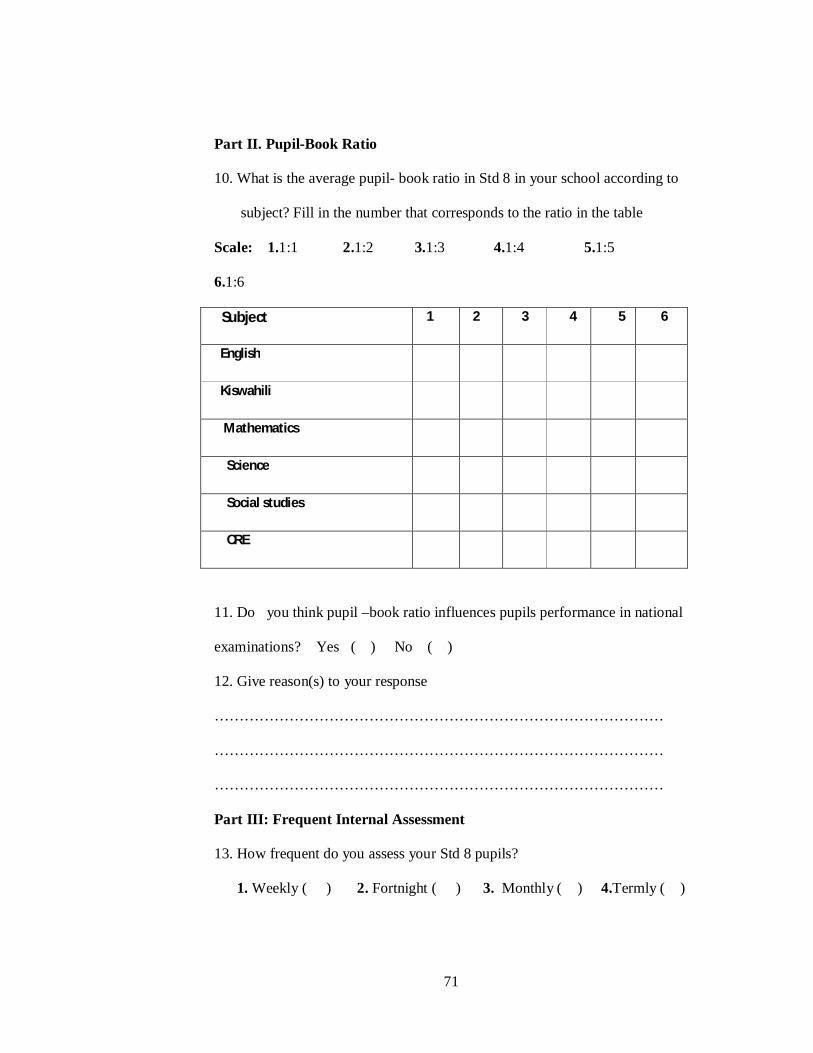
71
Part II. Pupil-Book Ratio
10. What is the average pupil- book ratio in Std 8 in your school according to
subject? Fill in the number that corresponds to the ratio in the table
Scale: 1.1:1 2.1:2 3.1:3 4.1:4 5.1:5
6.1:6
Subject 1 2 3 4 5 6
English
Kiswahili
Mathematics
Science
Social studies
CRE
11. Do you think pupil –book ratio influences pupils performance in national
examinations? Yes ( ) No ( )
12. Give reason(s) to your response
………………………………………………………………………………
………………………………………………………………………………
………………………………………………………………………………
Part III: Frequent Internal Assessment
13. How frequent do you assess your Std 8 pupils?
1. Weekly ( ) 2. Fortnight ( ) 3. Monthly ( ) 4.Termly ( )
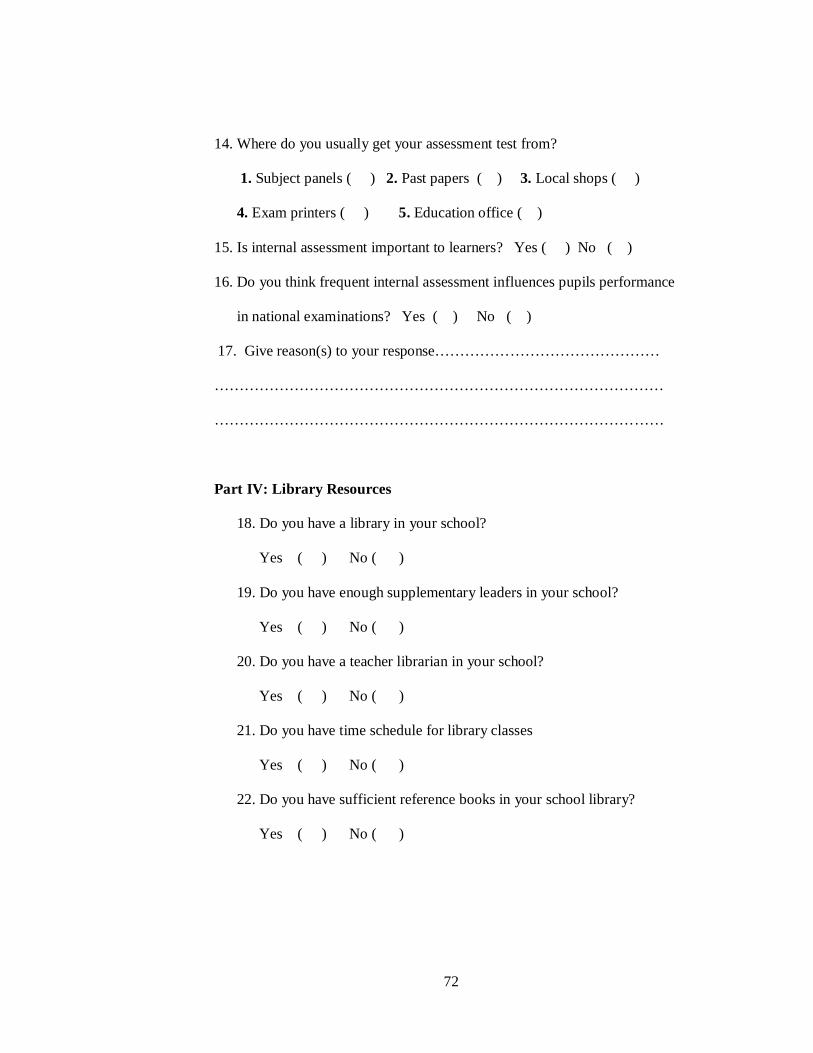
72
14. Where do you usually get your assessment test from?
1. Subject panels ( ) 2. Past papers ( ) 3. Local shops ( )
4. Exam printers ( ) 5. Education office ( )
15. Is internal assessment important to learners? Yes ( ) No ( )
16. Do you think frequent internal assessment influences pupils performance
in national examinations? Yes ( ) No ( )
17. Give reason(s) to your response………………………………………
………………………………………………………………………………
………………………………………………………………………………
Part IV: Library Resources
18. Do you have a library in your school?
Yes ( ) No ( )
19. Do you have enough supplementary leaders in your school?
Yes ( ) No ( )
20. Do you have a teacher librarian in your school?
Yes ( ) No ( )
21. Do you have time schedule for library classes
Yes ( ) No ( )
22. Do you have sufficient reference books in your school library?
Yes ( ) No ( )
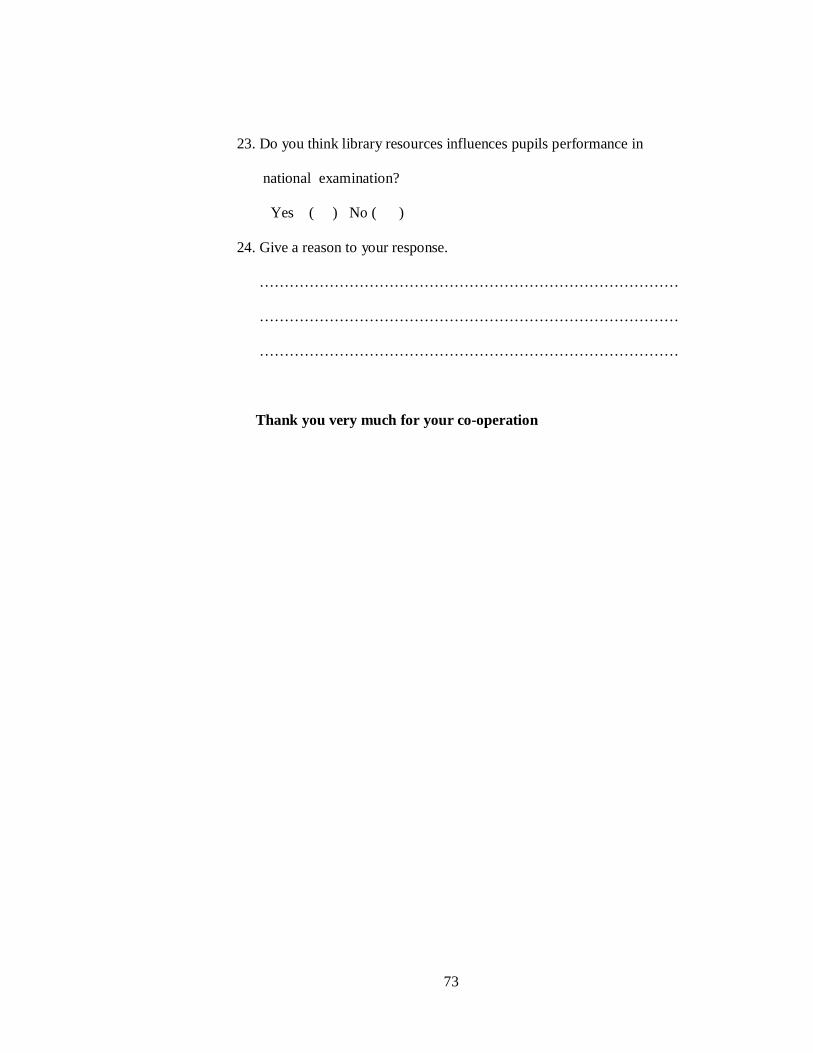
73
23. Do you think library resources influences pupils performance in
national examination?
Yes ( ) No ( )
24. Give a reason to your response.
…………………………………………………………………………
…………………………………………………………………………
…………………………………………………………………………
Thank you very much for your co-operation
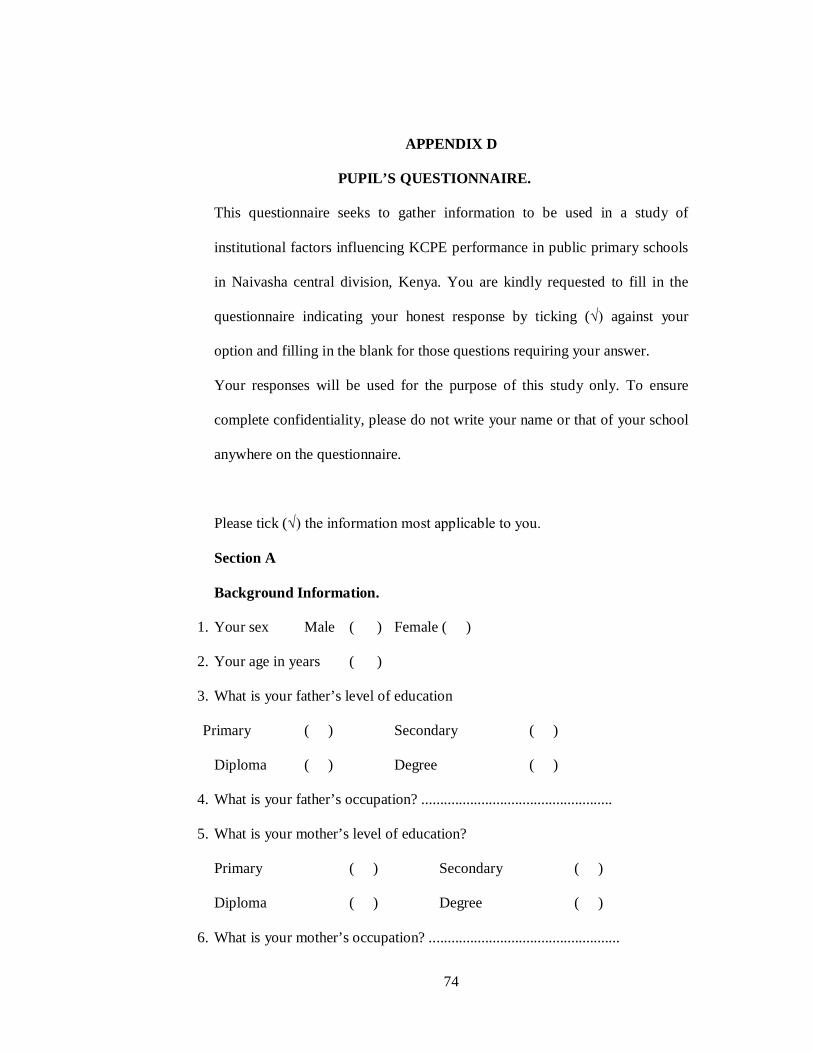
74
APPENDIX D
PUPIL’S QUESTIONNAIRE.
This questionnaire seeks to gather information to be used in a study of
institutional factors influencing KCPE performance in public primary schools
in Naivasha central division, Kenya. You are kindly requested to fill in the
questionnaire indicating your honest response by ticking (√) against your
option and filling in the blank for those questions requiring your answer.
Your responses will be used for the purpose of this study only. To ensure
complete confidentiality, please do not write your name or that of your school
anywhere on the questionnaire.
Please tick (√) the information most applicable to you.
Section A
Background Information.
1. Your sex Male ( ) Female ( )
2. Your age in years ( )
3. What is your father’s level of education
Primary ( ) Secondary ( )
Diploma ( ) Degree ( )
4. What is your father’s occupation? ...................................................
5. What is your mother’s level of education?
Primary ( ) Secondary ( )
Diploma ( ) Degree ( )
6. What is your mother’s occupation? ...................................................
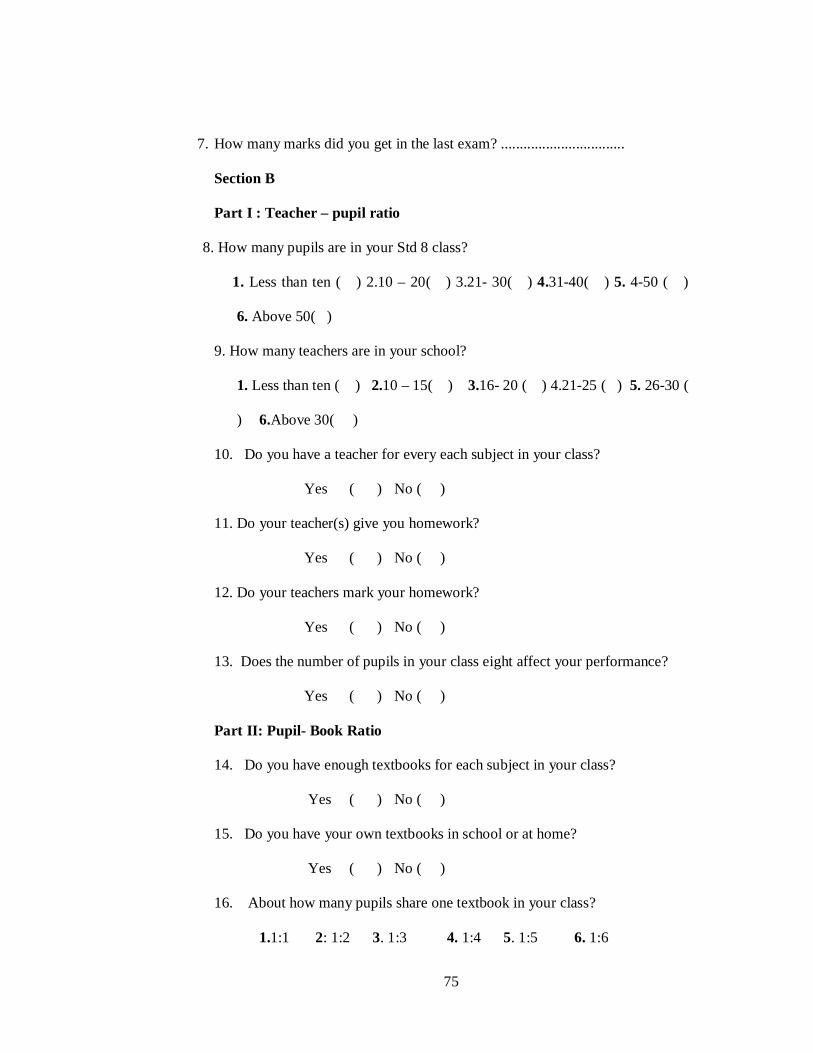
75
7. How many marks did you get in the last exam? .................................
Section B
Part I : Teacher – pupil ratio
8. How many pupils are in your Std 8 class?
1. Less than ten ( ) 2.10 – 20( ) 3.21- 30( ) 4.31-40( ) 5. 4-50 ( )
6. Above 50( )
9. How many teachers are in your school?
1. Less than ten ( ) 2.10 – 15( ) 3.16- 20 ( ) 4.21-25 ( ) 5. 26-30 (
) 6.Above 30( )
10. Do you have a teacher for every each subject in your class?
Yes ( ) No ( )
11. Do your teacher(s) give you homework?
Yes ( ) No ( )
12. Do your teachers mark your homework?
Yes ( ) No ( )
13. Does the number of pupils in your class eight affect your performance?
Yes ( ) No ( )
Part II: Pupil- Book Ratio
14. Do you have enough textbooks for each subject in your class?
Yes ( ) No ( )
15. Do you have your own textbooks in school or at home?
Yes ( ) No ( )
16. About how many pupils share one textbook in your class?
1.1:1 2: 1:2 3. 1:3 4. 1:4 5. 1:5 6. 1:6
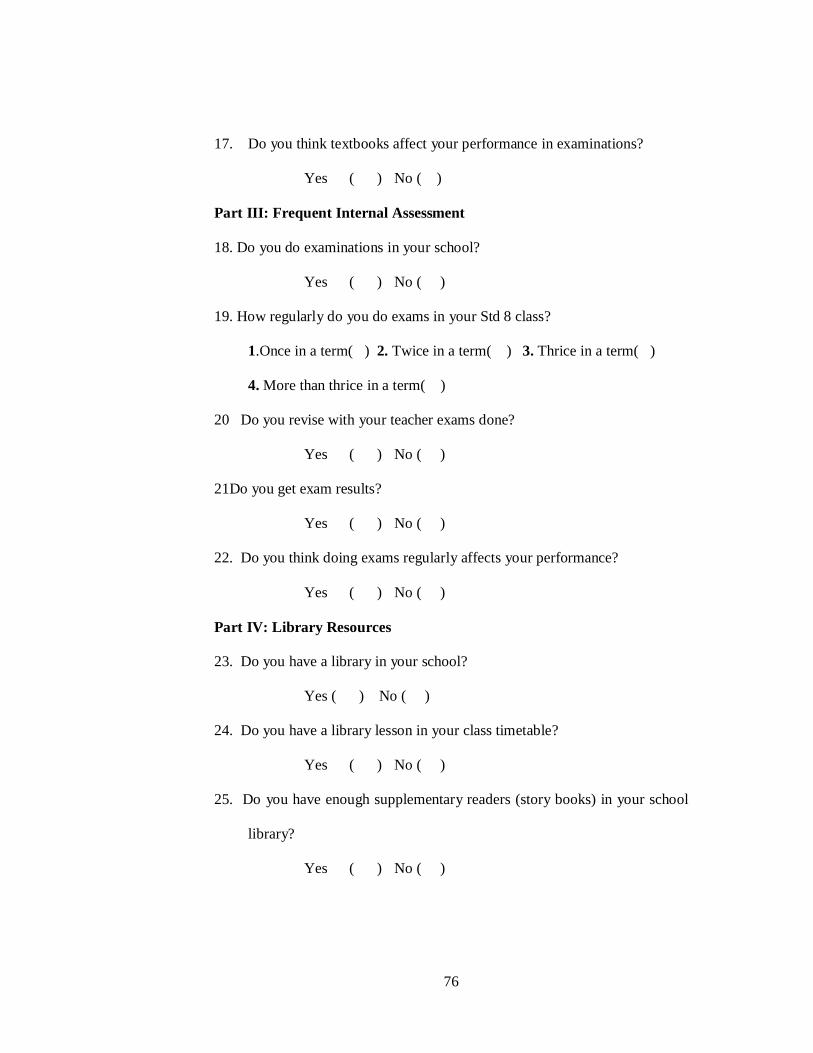
76
17. Do you think textbooks affect your performance in examinations?
Yes ( ) No ( )
Part III: Frequent Internal Assessment
18. Do you do examinations in your school?
Yes ( ) No ( )
19. How regularly do you do exams in your Std 8 class?
1.Once in a term( ) 2. Twice in a term( ) 3. Thrice in a term( )
4. More than thrice in a term( )
20 Do you revise with your teacher exams done?
Yes ( ) No ( )
21Do you get exam results?
Yes ( ) No ( )
22. Do you think doing exams regularly affects your performance?
Yes ( ) No ( )
Part IV: Library Resources
23. Do you have a library in your school?
Yes ( ) No ( )
24. Do you have a library lesson in your class timetable?
Yes ( ) No ( )
25. Do you have enough supplementary readers (story books) in your school
library?
Yes ( ) No ( )
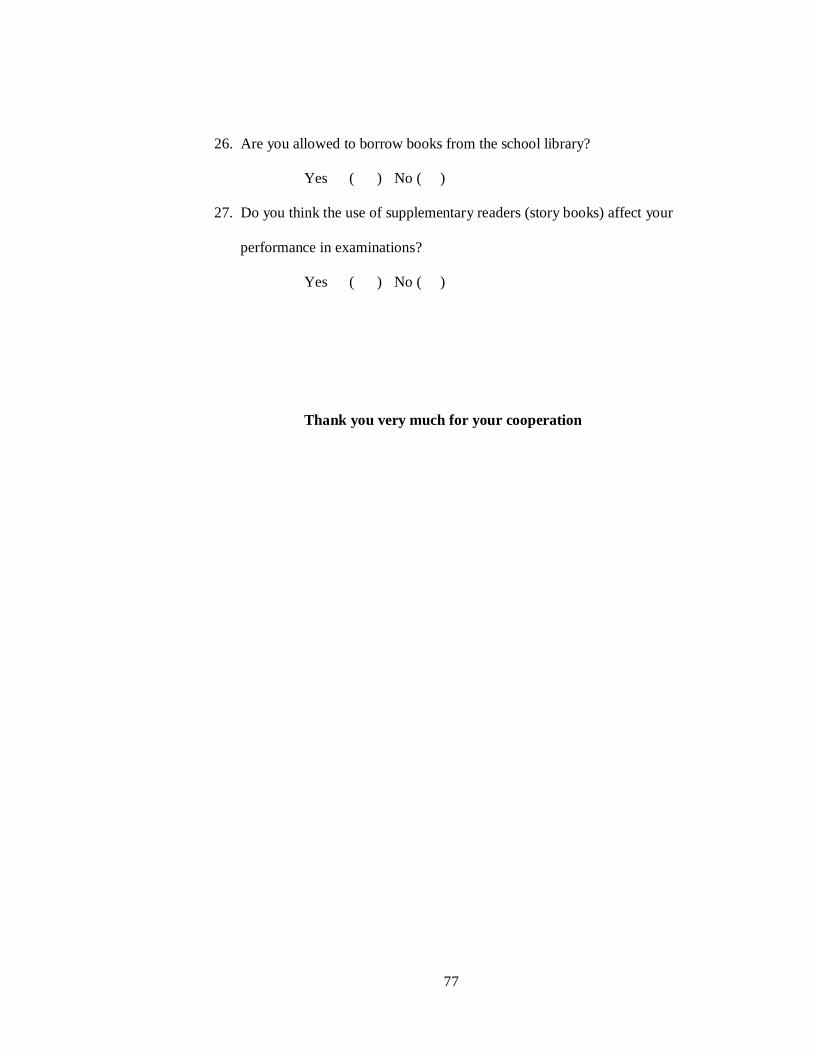
77
26. Are you allowed to borrow books from the school library?
Yes ( ) No ( )
27. Do you think the use of supplementary readers (story books) affect your
performance in examinations?
Yes ( ) No ( )
Thank you very much for your cooperation
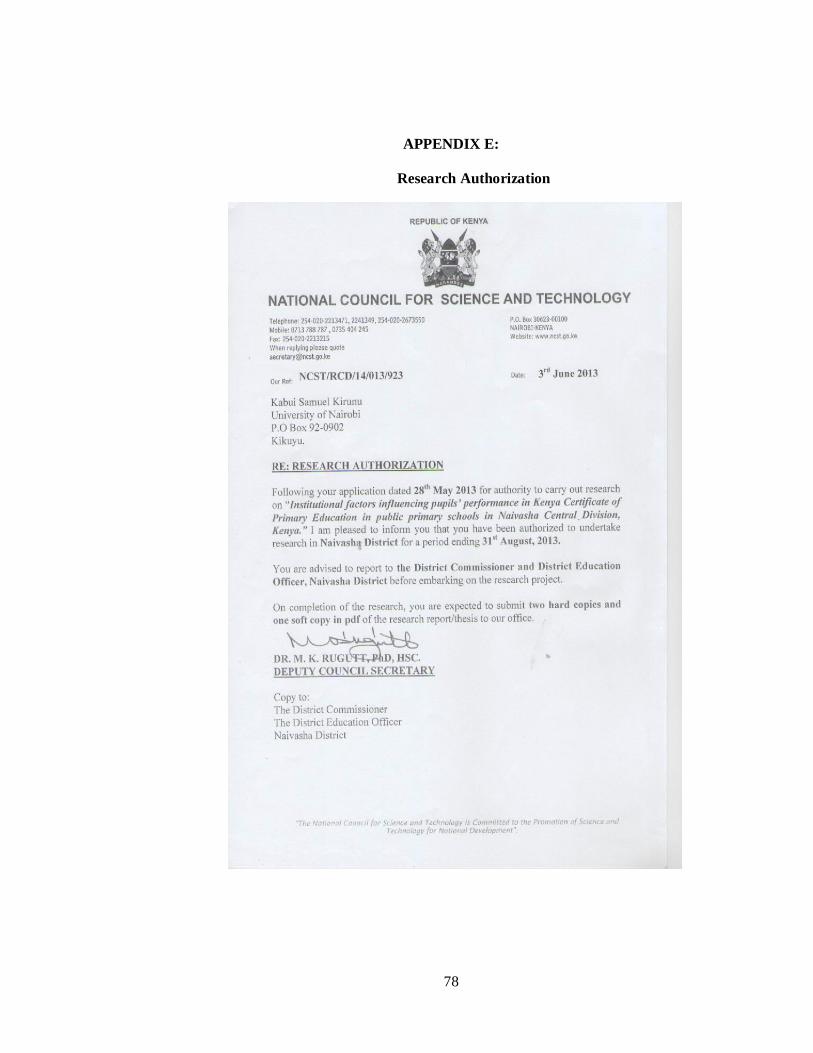
78
APPENDIX E:
Research Authorization
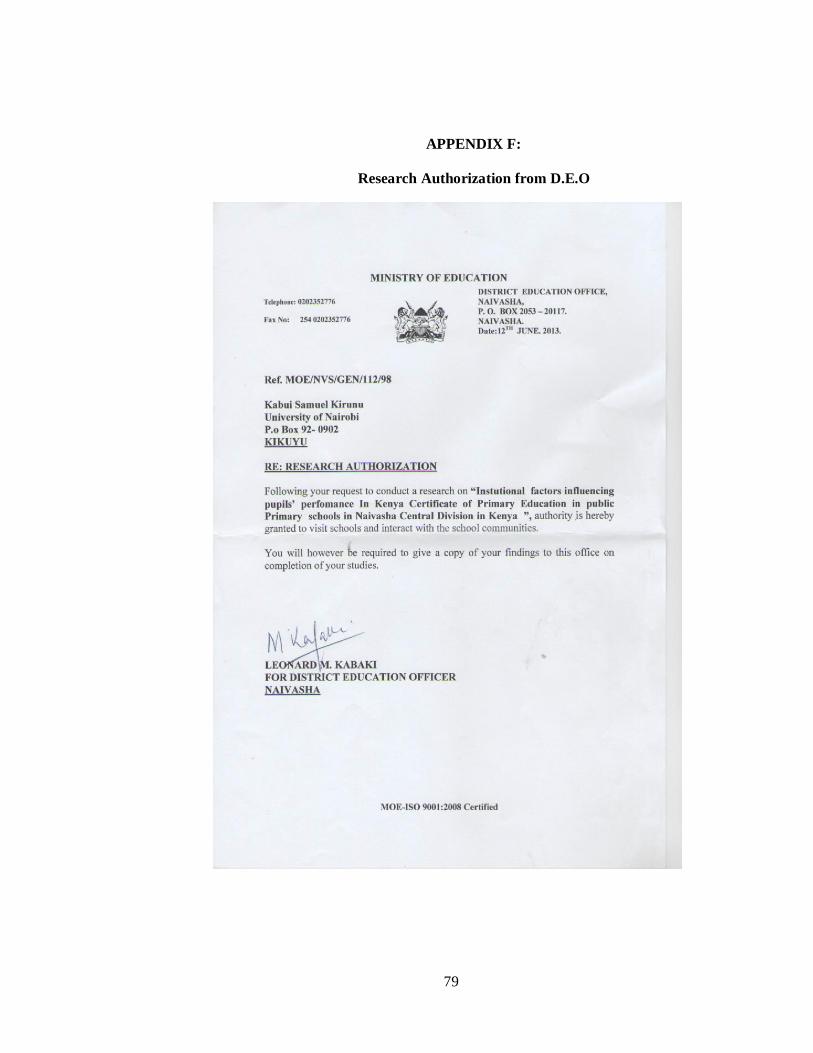
79
APPENDIX F:
Research Authorization from D.E.O
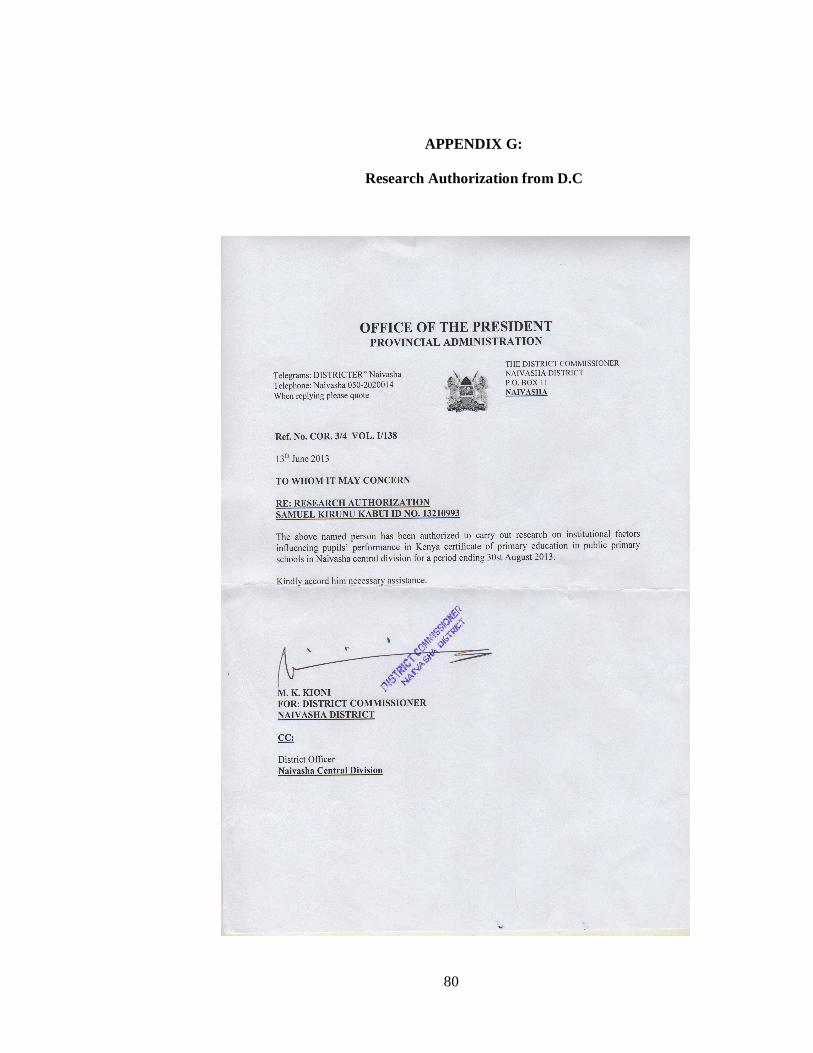
80
APPENDIX G:
Research Authorization from D.C
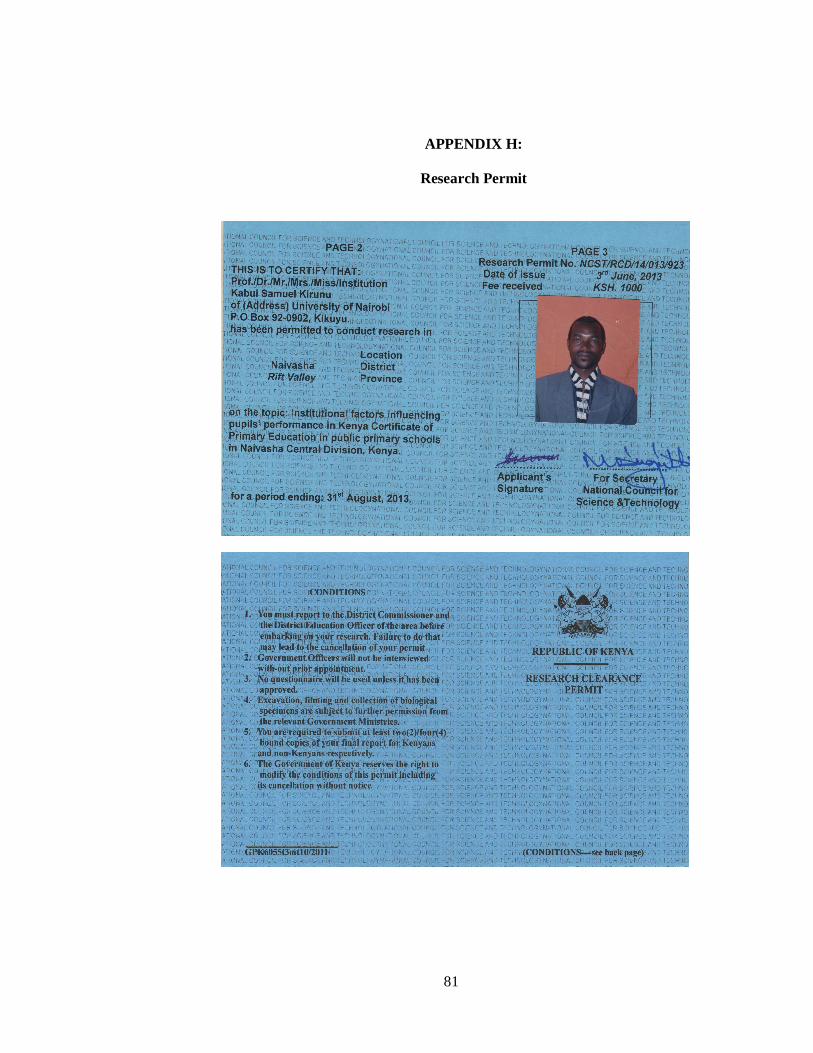
81
APPENDIX H:
Research Permit