Embed Size (px)
Citation preview

The recycling rate of atmospheric moisture over the past two decades (1988–2009)
This article has been downloaded from IOPscience. Please scroll down to see the full text article.
2011 Environ. Res. Lett. 6 034018
(http://iopscience.iop.org/1748-9326/6/3/034018)
Download details:
IP Address: 131.215.64.114
The article was downloaded on 15/08/2012 at 23:59
Please note that terms and conditions apply.
View the table of contents for this issue, or go to the journal homepage for more
Home Search Collections Journals About Contact us My IOPscience
IOP PUBLISHING ENVIRONMENTAL RESEARCH LETTERS
Environ. Res. Lett. 6 (2011) 034018 (6pp) doi:10.1088/1748-9326/6/3/034018
The recycling rate of atmospheric moistureover the past two decades (1988–2009)Liming Li1, Xun Jiang1, Moustafa T Chahine2, Edward T Olsen2,Eric J Fetzer2, Luke Chen2 and Yuk L Yung3,4
1 Department of Earth and Atmospheric Sciences, University of Houston, USA2 Science Division, Jet Propulsion Laboratory, California Institute of Technology, USA3 Division of Geological and Planetary Sciences, California Institute of Technology, Pasadena,USA
E-mail: [email protected]
Received 11 April 2011Accepted for publication 21 July 2011Published 17 August 2011Online at stacks.iop.org/ERL/6/034018
AbstractNumerical models predict that the recycling rate of atmospheric moisture decreases with time atthe global scale, in response to global warming. A recent observational study (Wentz et al 2007Science 317 233–5) did not agree with the results from numerical models. Here, we examinethe recycling rate by using the latest data sets for precipitation and water vapor, and suggest aconsistent view of the global recycling rate of atmospheric moisture between numerical modelsand observations. Our analyses show that the recycling rate of atmospheric moisture has alsodecreased over the global oceans during the past two decades. In addition, we find differenttemporal variations of the recycling rate in different regions when exploring the spatial patternof the recycling rate. In particular, the recycling rate has increased in the high-precipitationregion around the equator (i.e., the intertropical convergence zone) and decreased in thelow-precipitation region located either side of the equator over the past two decades. Furtherexploration suggests that the temporal variation of precipitation is stronger than that of watervapor, which results in the positive trend of the recycling rate in the high-precipitation regionand the negative trend of the recycling rate in the low-precipitation region.
Keywords: precipitation, water vapor, recycling rate, hydrological cycle
1. Introduction
The hydrological cycle, which involves the atmosphere,surface and biosphere, has enormous impact on human activity.The atmospheric branch of the hydrological cycle, in whichwater vapor leaves the surface by evaporation and returns tothe surface by precipitation, is a crucial component of weatherand climate.
Besides the effects of regional meteorology (Ye and Fetzer2009), the temporal variation of the total mass of water vaporin the global atmosphere is related to atmospheric temperatureby the Clausius–Clapeyron equation under the approximationthat the relative humidity in the atmosphere stays constant.Different datasets display qualitatively consistent increasing
4 Author to whom any correspondence should be addressed.
trends in the total mass of water vapor in the global atmosphere(Trenberth et al 2005, Wentz et al 2007, Santer et al 2007).Such increasing trends in water vapor are also simulated inthe numerical models (Bosilovich et al 2005, Held and Soden2006) even though the mechanism of how water vapor affectsclimate change is still not very clear (Held and Soden 2006,Ingram 2010).
On the other hand, precipitation, which is controlled bythe atmospheric circulation and cloud microphysics, is morecomplicated. Consequently, there is no simple relationshipbetween precipitation and temperature at the global scaleeven though surface temperature is correlated with localprecipitation (Trenberth and Shea 2005, Adler et al 2008) andprecipitation extremes (Allan and Soden 2008, Liu et al 2009).Large discrepancies in the linear trend of global precipitation
1748-9326/11/034018+06$33.00 © 2011 IOP Publishing Ltd Printed in the UK1
Environ. Res. Lett. 6 (2011) 034018 L Li et al
exist among different studies (Allen and Ingram 2002, Adleret al 2003, Trenberth et al 2003, Held and Soden 2006, Gu et al2007, Stephens and Ellis 2008, Adler et al 2008, Liepert andPrevidi 2009, Trenberth 2011, Zhou 2011). A recent letter byWentz et al (2007) suggests that the increasing trend with timewas roughly the same for global precipitation (1.4 ± 0.5% perdecade) and total water vapor (1.2 ± 0.5% per decade) duringthe period 1987–2006.
The study by Wentz et al (2007) implies that the recyclingrate of atmospheric moisture, which is defined as the ratioof precipitation to column water vapor, remained constant orintensified with time. From the perspective of atmosphericradiative imbalance, it is possible that global precipitation isincreasing at a rate of 1.4% per decade (Liepert and Previdi2009). However, most other observational studies (Adler et al2003, Gu et al 2007, Adler et al 2008) and climate models(Allen and Ingram 2002, Held and Soden 2006, Stephensand Ellis 2008) suggest that global precipitation is increasing(∼0.2–0.7% per decade) more slowly than in the total massof water vapor (∼1.4–1.5% per decade) in response to globalwarming. In this study, we revisit the temporal variation ofwater vapor and precipitation based on the latest version ofglobal data sets with emphasis on the variation of the recyclingrate of atmospheric moisture that accompanies global warmingduring the past two decades (1988–2009).
2. Methodology and data
A useful method of estimating the intensity of the hydrologicalcycle in the global atmosphere is to use some simpleparameters, which include recycling rate (Chahine et al 1997),residence time (Chahine et al 1992, Trenberth 1998), and anon-dimensional ratio between the precipitation sensitivity andthe water vapor sensitivity (Stephens and Ellis 2008). Thepurpose of these parameters is to compare the increasing ratesbetween the total water vapor and precipitation. Here, we usethe recycling rate of atmospheric moisture (R) (Chahine et al1997) to compare the temporal variation between column watervapor (W ) and precipitation (P).
R = P/W. (1)
So we have
ln R = ln(P/W )
⇒ d(ln R)/dt = d[ln P − ln W ]/dt
⇒ (dR/dt)/R = (dP/dt)/P − (dW/dt)/W.
(2)
Therefore, during a time period we can approximateequation (2) as below
�R/R = �P/P − �W/W (3)
where �X and X represent the change and mean value ofvariable X (i.e., R, P , and W ) during the time period. Whenthe varied percentage of precipitation (�P/P ) is larger thanthe varied percentage of column water vapor (�W/W ), wehave the ratio �R/R > 0. Otherwise, we have the ratio�R/R � 0. In physics, the parameter �R/R is the same
as another non-dimensional ratio ε = (�P/P)/(�W/W ),which is developed by Stephens and Ellis (2008). It should bementioned that the balance described in equation (3) probablydoes not hold except for the global mean where the fluxdivergence term drops out.
Equation (2) shows that the temporal variation of recyclingrate is determined by the temporal variations of precipitationand column water vapor. In this study, the latest data setsfrom the Special Sensor Microwave Imager (SSM/I) (Wentz1997, Wentz and Spencer 1998) and the Global PrecipitationClimatology Project (GPCP) (Huffman et al 2009) are utilizedto examine the temporal variations of precipitation, columnwater vapor, and recycling rate over the past two decades. Thedata set of SSM/I (V 6) has oceanic precipitation and watervapor from 1988 to 2009 with spatial resolution at 0.25◦ ×0.25◦ (latitude by longitude) (SSM/I data are provided byRemote Sensing Systems from the website: www.ssmi.com/ssmi/ssmi browse.html). The latest version of GPCP (V 2.1)has the global precipitation data from 1979 to 2009 with spatialresolution at 2.5◦ × 2.5◦ (latitude by longitude) (GPCP V 2.1data are provided by the Earth System Research Laboratoryfrom the website www.esrl.noaa.gov/psd/data/gridded/data.gpcp.html). To be consistent with the length of water vapordata from SSM/I, we only use the GPCP precipitation between1988 and 2009.
3. Results
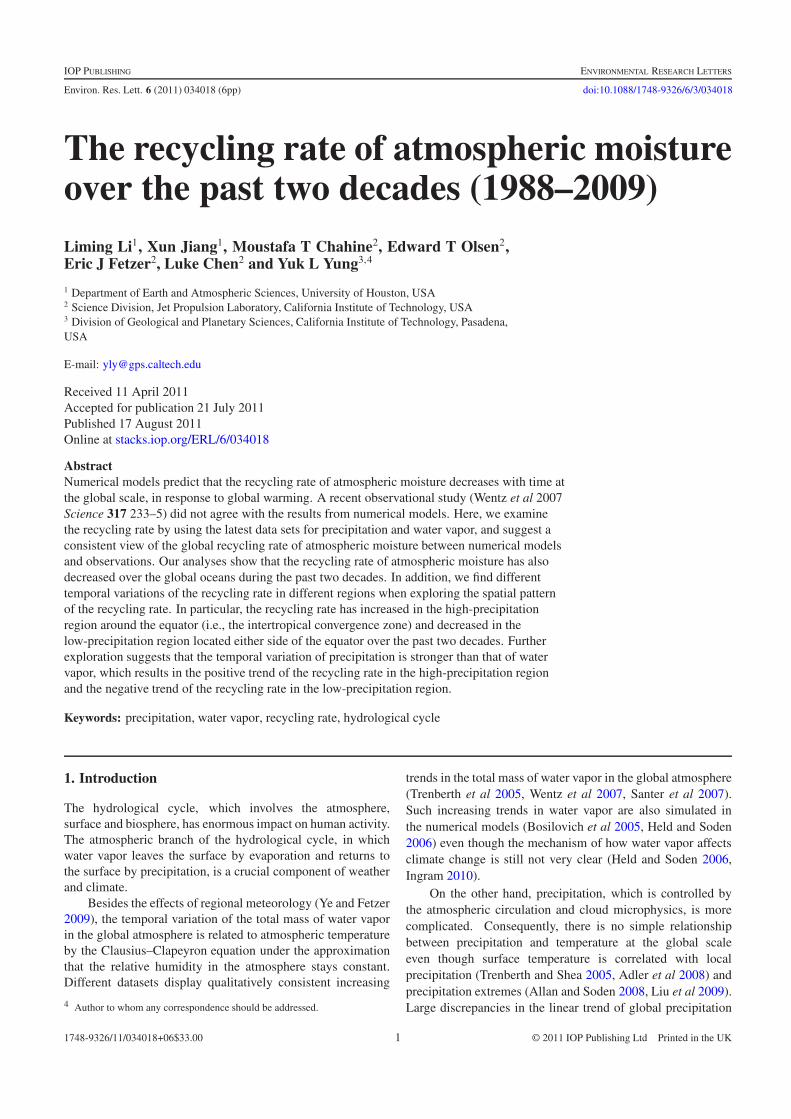
The temporal variations of precipitation and water vapor atthe global scale are shown in figure 1. Figure 1(A) showstwo time series of the temporal variations of precipitationbased on a combined global data from SSM/I and GPCP andthe global data from GPCP. The combined global data wasconstructed by combining the precipitation data over oceanfrom the SSM/I and the precipitation data over land fromGPCP. Figure 1(B) displays the temporal variation of columnwater vapor over the global oceans, which is based on theoceanic data from SSM/I. We calculate the linear trends andcorresponding uncertainties of the time series shown in figure 1by the least-squares method (Bevington and Robinson 2003).The linear trend of global precipitation is 0.08 ± 0.43% perdecade and 0.26 ± 0.41% per decade for the combined globaldata and the GPCP global data, respectively. The linear trendof column water vapor is 1.01 ± 0.39% per decade, which isbasically consistent with the value of 1.37 ± 0.72% per decadefrom a recent study (Santer et al 2007). We also calculatethe confidence level of linear trends in figure 1 (please referto the appendix), which shows that the confidence level oflinear trend in the global precipitation is less than 90% and theconfidence level of linear trend in the oceanic water vapor ismore than 95%. The weak positive trend of global precipitation(0.08 ± 0.43% per decade and 0.26 ± 0.41% per decade) ismuch smaller than the linear trend (1.4 ± 0.5% per decade) inthe previous study (Wentz et al 2007). The previous study wasalso based on a combined global data from SSM/I (ocean) andGPCP (land), but a relatively old version of GPCP (V 2) wasused (Wentz et al 2007). Our study (figure 1) is based on arecent-released version of GPCP (V 2.1) (Huffman et al 2009).
2
Environ. Res. Lett. 6 (2011) 034018 L Li et al
Figure 1. Temporal variations of global-mean precipitation andoceanic-mean water vapor. (A) Precipitation (P). (B) Column watervapor (W ). The red line in panel (A) is based on the combined globaldata from the latest version of GPCP (V 2.1) (land) and SSM/I (V 6)(ocean), and the blue line in panel (A) is based on the global datafrom the latest version of GPCP (V 2.1). Deseasonalization andlow-pass filter were applied to the time series. Seasonal cycle wasremoved by subtracting the monthly mean data. Low-pass filter wasconstructed so that only signals with periods longer than six monthswere kept.
The new dataset of GPCP has been improved by applyinga new updated climate anomaly analysis method for gaugedata (Schneider et al 2008) and several correction schemes(Huffman et al 2009). GPCP V 2.1 has better data qualityand more continuous coverage than the old version (Huffmanet al 2009). Therefore, an exploration of the temporal variationbased on the latest GPCP (V 2.1) will be more robust thanthe analyses in the previous study based on the relatively oldversion. The differences of trend between this study (figure 1)and the previous study (Wentz et al 2007) are mainly due to thedramatic drop in the rate of increase of precipitation over landbetween the old version (V 2) and the new version (V 2.1) ofthe GPCP dataset (Huffman et al 2009).
The weak positive trend with larger uncertainty inthe global precipitation suggests that the linear trend ofglobal precipitation is not statistically significant, and theprecipitation trend is smaller than the significant linear trendin the oceanic water vapor. The comparison of lineartrends between precipitation and water vapor implies that therecycling rate of global atmospheric moisture decreased withtime during the past two decades. Therefore, the linear trendsof precipitation (0.08 ± 0.43% per decade or 0.26 ± 0.41%per decade) based on the latest and improved precipitationdata are basically consistent with the estimated trends forprecipitation (∼0.2–0.7% per decade) from the numericalsimulations (Allen and Ingram 2002, Held and Soden 2006,Stephens and Ellis 2008), which reconcile the discrepancyof recycling rate of global atmospheric moisture between thestudy by Wentz et al (2007) and the other studies (Allenand Ingram 2002, Held and Soden 2006, Stephens and Ellis2008). A consistent view—the slowing in the recycling rate of
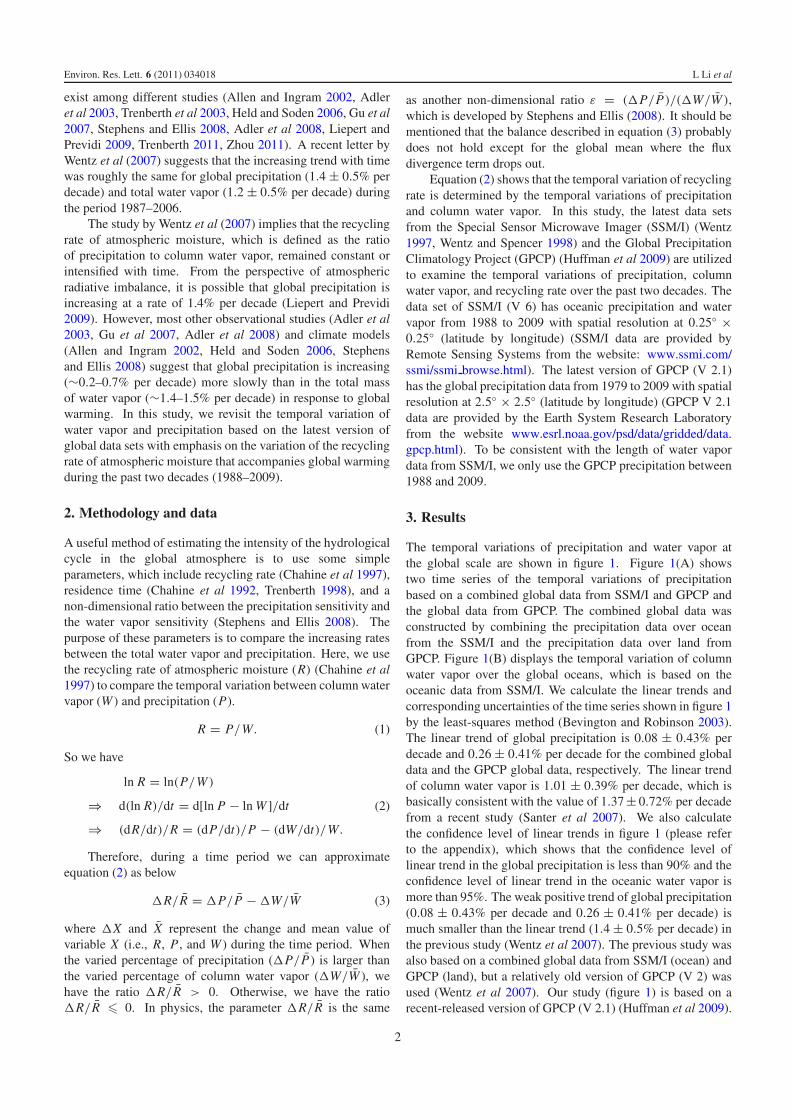
Figure 2. Temporal variations of precipitation, water vapor, andrecycling rate averaged over ocean between 60◦N and 60◦S.(A) Precipitation (P). (B) Water vapor (W ). (C) Recycling rate (R).El Nino-Southern Oscillation (ENSO) signals have been removedfrom time series by a regression method based on the Nino3.4 index.Note: the linear trend of time series is basically consistent betweenthe data with the ENSO signals and the data without the ENSOsignals. The recycling rate 1 is defined as the ratio of SSM/Iprecipitation to SSM/I water vapor, and the recycling rate 2 is definedas the ratio of GPCP precipitation to SSM/I water vapor.
global atmospheric moisture in response to global warming—now emerges. The slowing of the recycling rate of globalatmospheric moisture can be explained from the perspectiveof atmospheric energetics (Allen and Ingram 2002). Thephysics behind the slowing is complicated, which includes themodification of the tropical Walker Circulation by changingthe frequency of strong/weak updrafts (Emori and Brown2005, Vecchi and Soden 2007), suppression of the surfaceevaporation (Richter and Xie 2008), and reduction in theprecipitation efficiency by a negative feedback through cloudradiative heating (Stephens and Ellis 2008).
Due to the lack of global long-term continuous data ofwater vapor, we assume that the linear trend of global watervapor is same as that of oceanic water vapor in the abovecomparison between precipitation and water vapor. Such anassumption was also used in the previous study (Wentz et al2007). However, it is possible that the linear trend of watervapor is different between ocean and land (Simmons et al2010) so that the above assumption is not valid. Here, weconduct a strict comparison of linear trends between oceanicprecipitation and oceanic water vapor over the past two decadesin figure 2. The retrieval of water vapor and precipitationnear coasts is generally not robust due to the complicatedmeteorological situations there. Therefore, the data of watervapor and precipitation close to coasts (i.e., 1◦ latitude withincoasts) are not included in this study. The data quality in thepolar region is not very good either because there are veryfew in situ observations available to validate the satellite data.Therefore, only the data of precipitation and water vapor overocean between 60◦N–60◦S are used to discuss the recycling
3
Environ. Res. Lett. 6 (2011) 034018 L Li et al
Table 1. The linear trends of ocean-mean precipitation (P), column water vapor (W ), and recycle rate (R) shown in figure 2 (1988–2009).
Precipitation (P) Water vapor (W ) Recycling rate (R)
SSM/I GPCP SSM/I Rate 1 Rate 2 Units
Linear trend 0.13 0.33 0.97 −0.82 −0.65 %/decadeUncertainty 0.63 0.54 0.37 1.11 0.51 %/decade
rate of atmospheric moisture during the past two decades infigure 2.
Figure 2 displays the temporal variations of oceanicprecipitation, water vapor, and recycling rate. Details forthe linear trends of the time series in figure 2 are written intable 1. As shown in table 1, the positive linear trend ofoceanic precipitation is very weak with large uncertainty. Thelinear trend of oceanic water vapor between 60◦N and 60◦Sis roughly the same as the linear trend of oceanic water vaporfrom pole to pole (figures 1(B) and 2(B)). The recycling rate 1is defined as the ratio of the SSM/I precipitation to the SSM/Iwater vapor, and the recycling rate 2 is defined as the ratio ofthe GPCP precipitation to the SSM/I water vapor. From table 1,we find that the linear trend of recycling rate roughly equates tothe difference of linear trends between precipitation and watervapor, which is consistent with equation (2). The confidencelevel of linear trend in the recycling rate 1 is less than 90%,but the confidence level of linear trend in the recycling rate2 is more than 90%. The qualitatively consistent oceanicrecycling rate between the recycling rate 1 and recycling rate2 confirms that the previous conclusion based on the globalprecipitation and oceanic water vapor (figure 1): the recyclingrate of atmospheric moisture has decreased during the past twodecades.
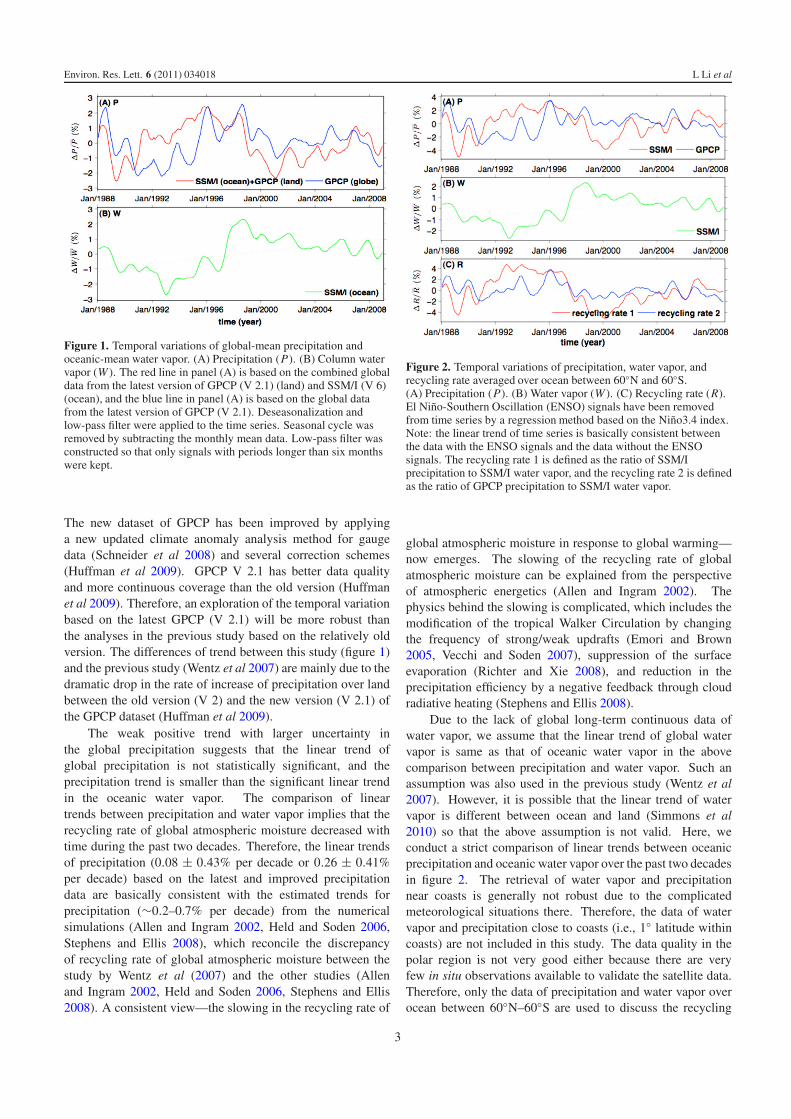
In addition to the temporal variation of recycling rateaveraging over globe and ocean, we also explore the spatialpatterns of recycling rate in response to global warming.Figure 3 shows the spatial pattern of temporal variation oftwo recycling rates (recycling rate 1 and recycling rate 2).As shown in figure 3, the two recycling rates have similarspatial patterns. The temporal variation of recycling rate ispositive in a narrow band around the equator, which is roughlythe intertropical convergence zone (ITCZ) identified by highlyreflective clouds (Waliser and Gautier 1993). Even thoughthe confidence level of the linear trend of precipitation in thenarrow band is less than 90%, the positive temporal variationsuggests that the recycling rate of atmospheric moisture hasintensified in the ITCZ during the past two decades. Therecycling rate displays strong negative temporal variation at thetwo sides of the ITCZ in the Pacific Ocean with the confidencelevel of the linear trend larger than 90%, which suggests thatthe recycling rate of atmospheric moisture has slowed down inthese areas. Besides the dominant feature in the tropical region,figure 3 also shows other positive and negative centers in therelatively high latitudes. Since the global average of recyclingrate is decreased, it implies that the negative recycling isstronger (or spatially larger) than the positive recycling rate.
The dominant feature of recycling rate in the tropicregion shown in figure 3 is very interesting. Consideringthat the recycling rate of atmospheric moisture is determined
Figure 3. Spatial pattern of temporal variation of recycling rate(�R/R) over the time period of 1988–2009. Color represents theratio of temporal variation to time mean during one decade. For eachgrid point of the global maps, the temporal variation of recycling rate(�R) over one decade is estimated by the production of linear trendand time span (one decade). Time mean value (R) is computed forthe time period of 1988–2009. (A) Recycling rate based on SSM/Iprecipitation and SSM/I water vapor. (B) Area with confidence levelof linear trend in (A) larger than 90%. (C) and (D) are the same as(A) and (B) except for the recycling rate based on GPCPprecipitation and SSM/I water vapor.
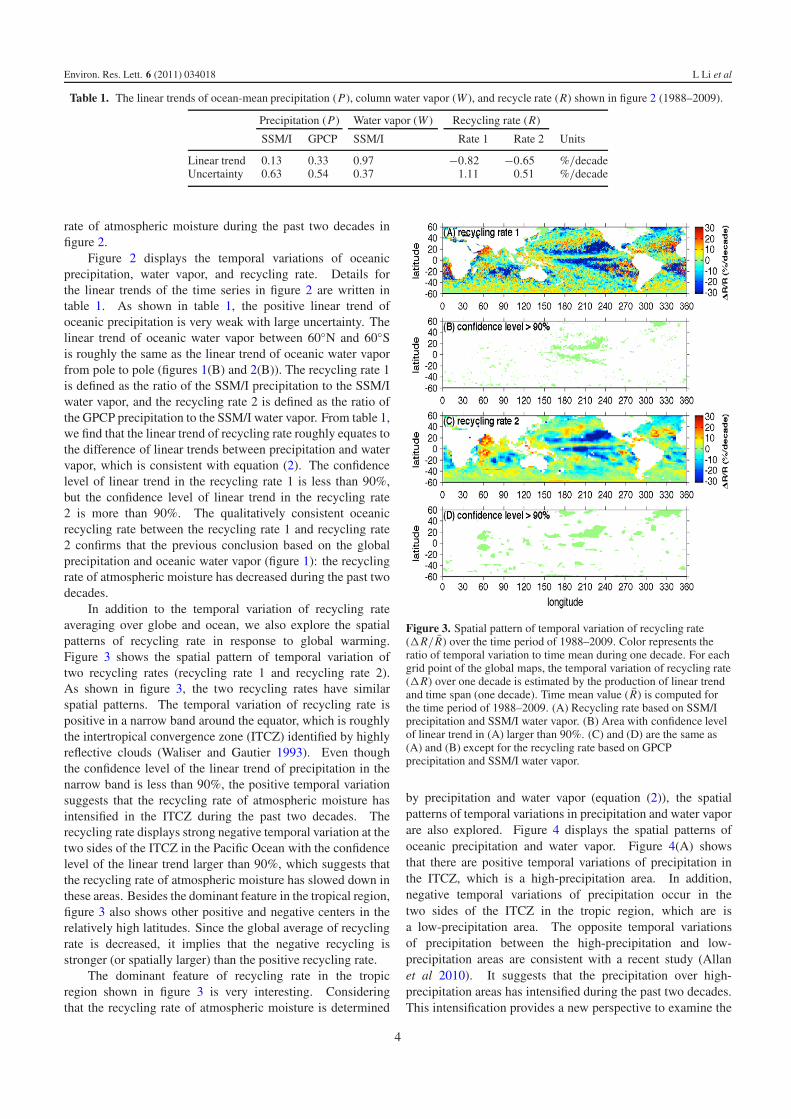
by precipitation and water vapor (equation (2)), the spatialpatterns of temporal variations in precipitation and water vaporare also explored. Figure 4 displays the spatial patterns ofoceanic precipitation and water vapor. Figure 4(A) showsthat there are positive temporal variations of precipitation inthe ITCZ, which is a high-precipitation area. In addition,negative temporal variations of precipitation occur in thetwo sides of the ITCZ in the tropic region, which are isa low-precipitation area. The opposite temporal variationsof precipitation between the high-precipitation and low-precipitation areas are consistent with a recent study (Allanet al 2010). It suggests that the precipitation over high-precipitation areas has intensified during the past two decades.This intensification provides a new perspective to examine the
4
Environ. Res. Lett. 6 (2011) 034018 L Li et al
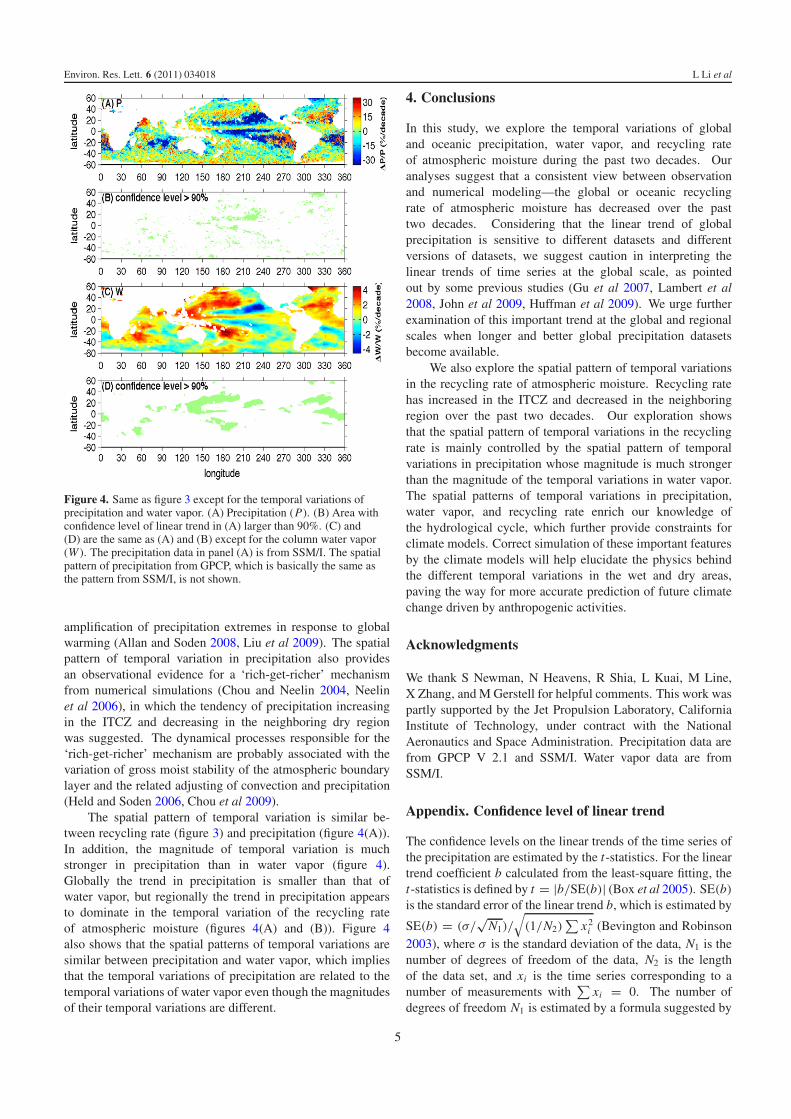
Figure 4. Same as figure 3 except for the temporal variations ofprecipitation and water vapor. (A) Precipitation (P). (B) Area withconfidence level of linear trend in (A) larger than 90%. (C) and(D) are the same as (A) and (B) except for the column water vapor(W ). The precipitation data in panel (A) is from SSM/I. The spatialpattern of precipitation from GPCP, which is basically the same asthe pattern from SSM/I, is not shown.
amplification of precipitation extremes in response to globalwarming (Allan and Soden 2008, Liu et al 2009). The spatialpattern of temporal variation in precipitation also providesan observational evidence for a ‘rich-get-richer’ mechanismfrom numerical simulations (Chou and Neelin 2004, Neelinet al 2006), in which the tendency of precipitation increasingin the ITCZ and decreasing in the neighboring dry regionwas suggested. The dynamical processes responsible for the‘rich-get-richer’ mechanism are probably associated with thevariation of gross moist stability of the atmospheric boundarylayer and the related adjusting of convection and precipitation(Held and Soden 2006, Chou et al 2009).
The spatial pattern of temporal variation is similar be-tween recycling rate (figure 3) and precipitation (figure 4(A)).In addition, the magnitude of temporal variation is muchstronger in precipitation than in water vapor (figure 4).Globally the trend in precipitation is smaller than that ofwater vapor, but regionally the trend in precipitation appearsto dominate in the temporal variation of the recycling rateof atmospheric moisture (figures 4(A) and (B)). Figure 4also shows that the spatial patterns of temporal variations aresimilar between precipitation and water vapor, which impliesthat the temporal variations of precipitation are related to thetemporal variations of water vapor even though the magnitudesof their temporal variations are different.
4. Conclusions
In this study, we explore the temporal variations of globaland oceanic precipitation, water vapor, and recycling rateof atmospheric moisture during the past two decades. Ouranalyses suggest that a consistent view between observationand numerical modeling—the global or oceanic recyclingrate of atmospheric moisture has decreased over the pasttwo decades. Considering that the linear trend of globalprecipitation is sensitive to different datasets and differentversions of datasets, we suggest caution in interpreting thelinear trends of time series at the global scale, as pointedout by some previous studies (Gu et al 2007, Lambert et al2008, John et al 2009, Huffman et al 2009). We urge furtherexamination of this important trend at the global and regionalscales when longer and better global precipitation datasetsbecome available.
We also explore the spatial pattern of temporal variationsin the recycling rate of atmospheric moisture. Recycling ratehas increased in the ITCZ and decreased in the neighboringregion over the past two decades. Our exploration showsthat the spatial pattern of temporal variations in the recyclingrate is mainly controlled by the spatial pattern of temporalvariations in precipitation whose magnitude is much strongerthan the magnitude of the temporal variations in water vapor.The spatial patterns of temporal variations in precipitation,water vapor, and recycling rate enrich our knowledge ofthe hydrological cycle, which further provide constraints forclimate models. Correct simulation of these important featuresby the climate models will help elucidate the physics behindthe different temporal variations in the wet and dry areas,paving the way for more accurate prediction of future climatechange driven by anthropogenic activities.
Acknowledgments
We thank S Newman, N Heavens, R Shia, L Kuai, M Line,X Zhang, and M Gerstell for helpful comments. This work waspartly supported by the Jet Propulsion Laboratory, CaliforniaInstitute of Technology, under contract with the NationalAeronautics and Space Administration. Precipitation data arefrom GPCP V 2.1 and SSM/I. Water vapor data are fromSSM/I.
Appendix. Confidence level of linear trend
The confidence levels on the linear trends of the time series ofthe precipitation are estimated by the t-statistics. For the lineartrend coefficient b calculated from the least-square fitting, thet-statistics is defined by t = |b/SE(b)| (Box et al 2005). SE(b)
is the standard error of the linear trend b, which is estimated by
SE(b) = (σ/√
N1)/
√(1/N2)
∑x2
i (Bevington and Robinson2003), where σ is the standard deviation of the data, N1 is thenumber of degrees of freedom of the data, N2 is the lengthof the data set, and xi is the time series corresponding to anumber of measurements with
∑xi = 0. The number of
degrees of freedom N1 is estimated by a formula suggested by
5
Environ. Res. Lett. 6 (2011) 034018 L Li et al
N1 = N2[1 − r(�x)2]/[1 + r(�x)2] (Bretherton et al 1999),where r(�x) is the autocorrelation corresponding to a lag oftime interval �x . The linear trend is statistically significantwhen t is larger than a certain value t0, which can be foundfrom the t-distribution table (Box et al 2005).
References
Adler R F et al 2003 The version-2 global precipitation climatologyproject (GPCP) monthly precipitation analysis (1979-present)J. Hydrometeorol. 4 1147–67
Adler R F, Gu G J, Wang J J, Huffman G J, Curtis S andBolvin D 2008 Relationships between global precipitation andsurface temperature on interannual and longer timescales(1979–2006) J. Geophys. Res. 113 D22104
Allan R P and Soden B J 2008 Atmospheric warming and theamplification of precipitation extremes Science 321 1481–4
Allan R P, Soden B J, John V O, Ingram W and Good P 2010 Currentchanges in tropical precipitation Environ. Res. Lett. 5 025205
Allen M R and Ingram W J 2002 Constraints on future changes inclimate and the hydrological cycle Nature 419 224–32
Bevington P R and Robinson D K 2003 Data Reduction and ErrorAnalysis for the Physical Sciences 3rd edn (New York:McGraw-Hill)
Bosilovich M G, Schubert S D and Walker G K 2005 Global changesof the water cycle intensity J. Clim. 18 1591–608
Box G E P, Hunter J S and Hunter W G 2005 Statistical forExperiments 2nd edn (New York: Wiley)
Bretherton C S, Widmann M, Dymnikov V P, Wallace J M andBlade I 1999 The effective number of spatial degrees of a timevarying field J. Clim. 12 1990–2009
Chahine M T 1992 The hydrological cycle and its influence onclimate Nature 359 373–80
Chahine M T, Haskins R and Fetzer E 1997 Observation of therecycling rate of moisture in the atmosphere: 1988–1994GEWEX 7 1–4
Chou C and Neelin J D 2004 Mechanisms of global warming impactson regional tropical precipitation J. Clim. 17 2688–701
Chou C, Neelin J D, Chen C A and Tu J Y 2009 Evaluating the‘rich-get-richer’ mechanism in tropical precipitation changeunder global warming J. Clim. 22 1982–2005
Emori S and Brown S J 2005 Dynamic and thermodynamic changesin mean and extreme precipitation under changed climateGeophys. Res. Lett. 32 L17706
Gu G J, Adler R F, Huffman G J and Curtis S 2007 Tropical rainfallvariability on interannual-to-interdecadeal and longer timescales derived from the GPCP monthly product J. Clim.20 4033–46
Held I M and Soden B J 2006 Robust responses of the hydrologicalcycle to global warming J. Clim. 19 5686–99
Huffman G J, Adler R F, Bolvin D T and Gu G J 2009 Improving theglobal precipitation record: GPCP version 2.1 Geophys. Res.Lett. 36 L17808
Ingram W 2010 A very simple model for the water vapor feedbackon climate change Q. J. R. Meteorol. Soc. 136 30–40
John V O, Allan R P and Soden B J 2009 How robust are observedand simulated precipitation responses to tropical ocean warmingGeophys. Res. Lett. 36 L14702
Lambert F H, Stine A R, Krakauer N Y and Chiang J C H 2008 Howmuch will precipitation increase with global warming EOS89 193–4
Liepert B G and Previdi M 2009 Do models and observationsdisagree on the rainfall response to global warming? J. Clim.22 3156–66
Liu S C, Fu C B, Shiu C J, Chen J P and Wu F T 2009 Temperaturedependence of global precipitation extremes Geophys. Res. Lett.36 L17702
Neelin J D, Munnich M, Su H, Meyerson J E and Holloway C E2006 Tropical drying trends in global warming models andobservations Proc. Natl Acad. Sci. 103 6110–5
Richter I and Xie S P 2008 Muted precipitation increase in globalwarming simulations: a surface evaporation perspectiveJ. Geophys. Res. 113 D24118
Santer B D et al 2007 Identification of human-induced changes inatmospheric moisture content Proc. Natl Acad. Sci.104 15248–53
Schneider U, Fuchs T, Meyer-Christoffer A and Rudolf B 2008Global Precipitation Analysis Products of the GPCC(Deutscher Wetterdienst Offenbach am Main, Germany)(available at ftp://ftp-anon.dwd.de/pub/data/gpcc/PDF/GPCC intro products 2008.pdf)
Simmons A J, Willett K M, Jones P D, Thorne P W and Dee D P2010 Low-frequency variations in surface atmospherichumidity, temperature, and precipitation: inferences fromreanalyses and monthly gridded observational data setsJ. Geophys. Res. 115 D01110
Stephens G L and Ellis T D 2008 Controls of global-meanprecipitation increases in global warming GCM experimentsJ. Clim. 21 6141–55
Trenberth K E 1998 Atmospheric moisture residence times andcycling: implications for rainfall rates and climate change Clim.Change 39 667–94
Trenberth K E 2011 Changes in precipitation with climate changeClim. Res. 47 123–38
Trenberth K E, Dai A, Rasmussen R M and Parsons D B 2003 Thechanging character of precipitation Bull. Am. Meteorol. Soc.84 1205–17
Trenberth K E, Fasullo J and Smith L 2005 Trends and variability incolumn-integrated atmospheric water vapor Clim. Dyn.24 741–58
Trenberth K E and Shea D J 2005 Relationships betweenprecipitation and surface temperature Geophys. Res. Lett.32 L14703
Vecchi G A and Soden B J 2007 Global warming and the weakeningof the tropical circulation J. Clim. 20 4316–40
Waliser D E and Gautier C 1993 A satellite-derived climatology ofthe ITCZ J. Clim. 6 2162–74
Wentz F J 1997 A well-calibrated ocean algorithm for SSM/IJ. Geophys. Res. 102 8703–18
Wentz F J, Ricciardulli L and Hilburn K 2007 How much more rainwill global warming bring? Science 317 233–5
Wentz F J and Spencer R W 1998 SSM/I rain retrievals within aunified all-weather ocean algorithm J. Atmos. Sci. 55 1613–27
Ye H and Fetzer E J 2009 Atmospheric moisture content associatedwith surface air temperatures over northern Eurasia Int. J.Climatol. 30 1463–71
Zhou Y P, Xu K M, Sud Y C and Betts A K 2011 Recent trends ofthe tropical hydrological cycle inferred from GlobalPrecipitation Climatology Project and International SatelliteCloud Climatology Project Data J. Geophys. Res. 116 D09101
6