Embed Size (px)
Citation preview
1111 OVP-8OVP-8OVP-8OVP-8
TheTheTheThe ReconstructionReconstructionReconstructionReconstruction andandandand ResearchResearchResearchResearch ProgressProgressProgressProgress ofofofof thethethethe TEXT-UTEXT-UTEXT-UTEXT-U TokamakTokamakTokamakTokamak ininininChinaChinaChinaChina
G Zhuang 1) Y Pan 1) XW Hu 1) ZJ Wang 1) YH Ding 1) M Zhang 1) L Gao 1)XQ Zhang 1) ZJ Yang 1) KX Yu 1) KW Gentle 2) H Huang 2) the J-TEXT team 1)
1) College of Electrical and Electronic Engineering Huazhong University of Science andTechnology Wuhan Hubei 430074 China
2) Fusion Research Center University of Texas at Austin Austin 78712 USA
E-mail address of the main author gezhuangmailhusteducn
AbstractAbstractAbstractAbstract The TEXT(TEXT-U) tokamak formerly built and operated by the University of Texas at Austin inUSA was dismantled and shipped to China in 2004 and renamed as the Joint TEXT (J-TEXT) tokamak Thereconstruction work which included reassembly of the machine and development of peripheral devices wascompleted in spring of 2007 Consequently the first plasma was obtained at the end of 2007 At present a typicalJ-TEXT Ohmic discharge can produce a plasma with flattop current up to 220kA and lasting for 300ms lineaveraged density above 2times1019m-3 and an electron temperature about 800eV with a toroidal magnetic field of22T A number of diagnostic devices used to facilitate the routine operation and experimental scenarios weredeveloped on the J-TEXT tokamak Hence the measurements of the electrostatic fluctuations in the edge regionand conditional analysis of the intermittent burst events near the last closed flux surface (LCFS) were undertakenThe observation and simple analysis of MHD activity and disruption events were also performed Thepreliminary experimental results and the future research plan for the J-TEXT are described in detail
1111 IntroductionIntroductionIntroductionIntroduction
In the late 1970s the University of Texas (UT) at Austin proposed to build a fusion plasmaresearch facility namely the Texas EXperimental Tokamak (TEXT)[1] which served as ageneral-purpose device designed for good experimental accessibility and routine operation forfusion experiments committed to specific objectives In the 1980s the TEXT was operated byUT at Austin and yielded fruitful results In the 1990s a major upgrade to the TEXT (TEXT-U)was planned specifically in an attempt to obtain an H-mode plasma by adding high powerelectron cyclotron waves to a divertor plasma[2] In 2004 according to the agreementbetween UT at Austin and Huazhong University of Science and Technology (HUST) thefacility was moved to China placed on the HUST campus and renamed as the Joint TEXT(J-TEXT) Thereafter the reconstruction of the tokamak began which included on-siteconstruction reassembly of the machine hardware and a flywheel motor-generator and designand manufacture of peripheral equipment All the work was completed in spring of 2007Meanwhile a few fundamental diagnostic instruments were designed manufactured and setup With support of those diagnostics the first commissioning commenced in summer of 2007The reassembled machine and all the developed peripheral systems were successfully testedand adjusted to their optimal working conditions Consequently the first plasma was obtainedat the end of 2007[3] The renewed TEXT-U tokamak will play a key role in the universitiesof China for training young scientists and promoting experimental research in basic plasmaphysics
The TEXTTEXT-UJ-TEXT is a conventional tokamak with an iron core Its nominalparameters are summarized here the major radius R=105cm the minor radius r=25-29cmwith a movable titanium-carbide coated graphite limiter the maximum toroidal field BT=3Tthe maximum plasma current Ip=400kA lasting for 400ms plasma densities ne=1-10times1019m-3
2222 OVP-8OVP-8OVP-8OVP-8
and an electron temperature Te~1keV The research program on the TEXTTEXT-U wasprincipally devoted to the study of plasma transport and turbulence[4] in particular tounderstanding the role of turbulence A survey of interior and edge turbulence characteristicshad been completed Since the machine has flexibility and good accessibility for diagnosticsdevelopment a great effort to develop advanced diagnostics devices had been made Forexample in order to identify the local transport process both adequate profile diagnostics anda unique complement of interior fluctuation diagnostics were set up such as far infrared (FIR)collective scattering heavy-ion beam probe etc
Now the J-TEXT operates in an Ohmic heating regime with a limiter The operating behaviorand limits are understandable and reasonable of the machine Using the limited diagnostictools some experimental research topics are being studied on the machine For exampleobservation of MHD activity and measurements of the electrostatic fluctuations areundertaken The preliminary results are described in the following sections
2222 ReconstructionReconstructionReconstructionReconstruction ofofofof thethethethe TEXT-UTEXT-UTEXT-UTEXT-U tokamaktokamaktokamaktokamak
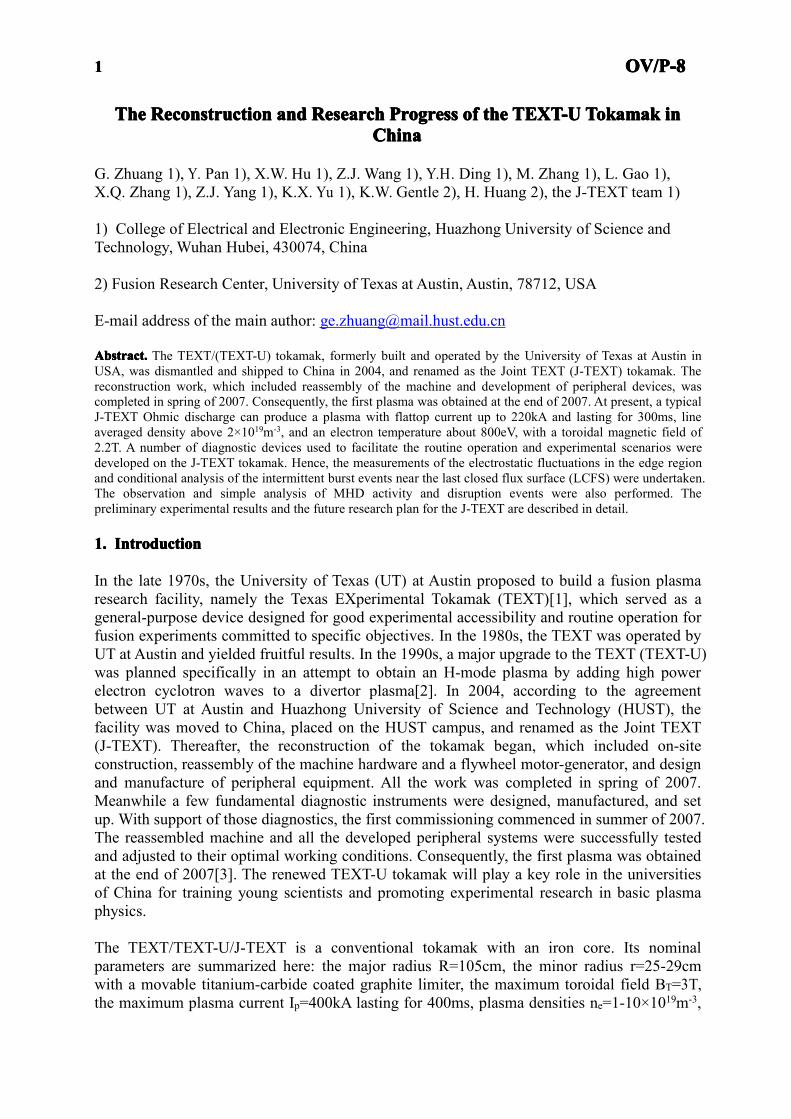
In the preceding step of reconstruction the on-site construction work on the HUST campuswhich comprises the foundations heat exchangers alterations of the old laboratory crane andso on had to be specified designed and completed for installation The reconstruction asshown in figure 1 can be divided into two major categories One was integration of theflywheel motor-generator and development of its peripheral equipment which includes watercooling system heat exchanger and oil supply system etc The other one was to assemble thetokamak This work not only includes the combination of all the hardware of the machinesuch as iron core torus field coils and their support frame and force structures but alsoinvolved design and development of new peripheral systems such as pumping stations andgas puffing systems field coil power supplies water cooling and deionized system centralcontrol system (CCS) data acquisition and management (DAQ) system a number of routinediagnostic systems and so on All the reconstruction work has completed in spring of 2007Facility hookup and preliminary operational checkout was completed in fall of 2007
Fig 1 The schematic of the reconstruction workof the J-TEXT where the red block means theassembly of the shipped hardwares (includingthe machine and the flywheel motor-generator)the blue block denotes the newly developedsystems and devices the purple block indicatesthe projects in the future plan
21212121 DesignDesignDesignDesign andandandand setupsetupsetupsetup ofofofof thethethethe vacuumvacuumvacuumvacuum systemsystemsystemsystem
The J-TEXT vessel has a total volume of 32m3 and its surface area is about 18m2 The vesselis formed in two halves joined by two keystones that included insulating breaks Most of theinner wall surface is covered by the graphite tiles Due to the sealing materials of the vesselthe design bake-out temperature is limited to 100oC The new vacuum system[5] consists oftwo pumping stations two types of discharge cleaning systems two sets of gas puffingsystems and a number of gauges Each pumping station consists of a forepump aturbo-molecular pump and a cryopump With the effective pumping speed 3m3s provided by
3333 OVP-8OVP-8OVP-8OVP-8
two running pumping stations the rough-down time from air to 10Pa is about 60min and thepump-down to 12times10-4Pa after a shot in hydrogen is less than 3 min The base pressure insidethe vessel can be lowered to 66times10-6Pa which easily satisfies the discharge requirementBoth Taylor discharge cleaning and glow discharge cleaning are used to clean theplasma-facing components inside the vessel to guarantee a good wall condition Taylordischarge cleaning works as the main cleaning tool with discharge cleaned for 12 hours eachnight and continuously on weekends The gas puffing system which consists of a containerand a piezo-electric valve controlled by feedback loop or preset waveforms for rapidmodulation is used to fill Hydrogen or other type of gas to suit the experimental needsSeveral types of gauges covering pressures ranging from atmospheric pressure to 10-7Pa arecurrently in use Vacuum conditions are continually monitored with a residual gas analyzer(RGA) during the operation
22222222 ModificiationModificiationModificiationModificiation ofofofof thethethethe fieldfieldfieldfield coilcoilcoilcoil powerpowerpowerpower suppliessuppliessuppliessupplies
Because of the grid difference between China (50Hz) and USA (60Hz) and improvedelectrical technology the previous magnet power supplies had to be extensively modifiedespecially their control systems
The toroidal field (TF) coils cooled by deionized water consist of 16 nearly round shapedcopper coils segments interlinked in series with 6 turns per segment The TF power supplyenergized by the 100MW100MJ flywheel motor-generator can drive a flat current up to120kA which generates the TF up to 225T [6] The TF coils produce a toroidal field with anaverage ripple of less than 1 with a maximum of 3 at the outer edge
Three separate coil systems are placed toroidally around the torus of J-TEXT to producedifferent types of poloidal fields (PFs) namely the Ohmic heating (OH) field the verticalfield (VF) and the horizontal field (HF) The OH coil consists of a 40-turn solenoidinductively coupled to the plasma aided by an iron-core transformer with two return legs andhas a up-limit flux of 16V∙s The OH power supply is the most complex electrical source onthe J-TEXT which comprises one rectifier circuit one pre-magnetizing circuit fourcapacitance-bank discharge circuits and an ionization capacitance discharge circuit Thesystem has the capability to provide 10kA current at 300VDC within 05s interval in the OHcoil which enables plasma currents up to 400kA The plasma equilibrium is achieved by thefunctioning of two other PFs composed of a 16-turn VF coil and a 32-turn HF coilrespectively Both coil systems are driven from the power grid at 380V The VF power supplycan drive a 10kA current at 200VDC lasting for 05s The HF power supply is able to feedforward and reverse current to the coils up to 500A in the range of plusmn150VDC which lasts for05s [7] Both VF and HF power supplies are feedback-controlled to maintain plasmaposition
23232323 DevelopmentDevelopmentDevelopmentDevelopment ofofofof thethethethe centcentcentcentralralralral controlcontrolcontrolcontrol systemsystemsystemsystem (CCS)(CCS)(CCS)(CCS)
The novel CCS system developed under a UNIX-style real-time operating system QNX is amulti-mission system that functions as a machine coordinator discharge pilot data managerand emergency response [8] The system can control all the subsystems and realize somebasic functions as follows (1) Discharge waveform design the discharge waveforms for theTF OH VF HF and gas puffing can be carefully aligned to meet the userrsquos demand (2)Timing sequence control the timing sequence may be controlled so as to permit each relevantsubsystem to engage in the process at the right time peculiarly to real-time manage all the
4444 OVP-8OVP-8OVP-8OVP-8
magnetic fields to meet the experimental requirements (3) Status cruise and safety controlthe CCS system can check the status of every sub-system at a 1kHz rate and update thesecurity information time to time If an abnormal event occurs it can immediately block thedischarge sequence and activate contingency plans to protect the subsystems (4) Post-shotservice This process can be prompted by the plasma current ramp-down and thereby alter thedischarge control to the normal waiting status The services contain system checks all thesubsystem resets shot-number update data transfer and archive etc
24242424 DevelopmentDevelopmentDevelopmentDevelopment ofofofof diagnosticdiagnosticdiagnosticdiagnostic systemsystemsystemsystemssss
Since the TEXT-U shipment did not contain any diagnostic instruments a number offundamental diagnostics had to be designed and developed to assist the first commissioningand then facilitate the daily operation in the early campaign They take the measurements of(1) Plasma current The plasma current is measured with three redundant Rogowski loopspoloidally winding around the vessel Two identical sets of printed circuit board (PCB)Rogowski coils were mounted outside the vessel at two symmetrical toroidal positions Onehandmade conventional Rogowski coil was installed inside the vessel All 3 sets of coils havean insignificant error of a few kiloamps (2) Loop voltage Three 1-turn flux loops toroidallywinding around the vessel with different locations R=446cm 493cm 106cm respectivelyare used to provide the loop voltage (3) Plasma position Four sets of PCB magneticdiagnostic coils installed inside the vacuum vessel are used for detecting the plasma radial andvertical displacements Each coordinate is determined by a pair of variable cross-sectionRogowski and saddle coils [9] (4) Averaged density A 2mm microwave interferometersystem is used for the measurement of center chord line-integrated electron density for theroutine operation and for the density feedback control A bias-tunable Gunn oscillatoroperating at 150GHz (cutoff density is 28times1020m-3) with output power of 10mW is employedas a frequency-modulated source The nominal IF of the system is 100kHz [10] (5) Hardx-ray emission Intensity of hard x-ray emission is measured by two sets of fixed scintillationcounters away from the torus viewing tangentially and radially respectively The measuredresults are used to evaluate the strength of runaway electrons (6) Residual gas An InficonRGA is installed on one pumping station to monitor the composition of filling gas (H2 D2and impurities) hence to determine the progress of discharge cleaning and detectcontamination in the vessel (7) Visible light A wide-viewing-angle visible light imagingsystem located at a tangential window is designed to monitor the visible light emission fromthe boundary region and hereby to monitor the discharge progress [11]
Since 2008 a number of other diagnostic tools have been developed mainly to satisfy theneeds of research topics such as investigation and hence comprehension of various MHDactivities turbulence and transport and so on The diagnostic systems now in use are listed asfollows (1) Multichannel FIR interferometer employs seven channels cross the J-TEXTcross-section vertically Their radial positions are r=21cm 14cm 7cm 0cm -21cm -14cm-7cm respectively The laser source is a continuous-wave HCN laser with a wavelength of337μm (cutoff density is 98times1021m-3) and an output power up to 100mW The IF frequencycan be adjusted by a rotating grating and is fixed at 10kHz Both plasma density andfluctuations can be measured (2) There are two poloidal arrays of 2D Mirnov coils mountedinside the vessel one array of 24 coils (equivalently located in a circular shape) and the otherone of 20 (in a rectangular shape) There is also one toroidal array of 16 coils installed insidethe torus All of them are used to detect external MHD activity and permit determination of(mn) of the mode (3) An X-ray pulse height Analyzer (consists of 3 Silicon shift detectors) isused to measure the soft x-ray emission spectrum to determine Te strong metallic lines and
5555 OVP-8OVP-8OVP-8OVP-8
the super-thermal electron distribution It can detect photon energies ranging from 1keV to20keV and the low energy photons will be shielded by 8μm beryllium filter Its temporalresolution is 50ms (4) Three soft X-ray photodiode arrays mounted at the same toroidallocation but different poloidal positions are used to detect soft x-rays The vertically viewingarray consists of 35 detectors which view the entire plasma cross-section The horizontallyviewing array has 2 sets of 35 detectors located plusmn15 degrees from the mid-plane The systemhas a spatial and temporal resolution of 2cm and 4μs respectively A 65μm beryllium filter isused to restrict the spectral acceptance of the cameras to 05-13keV [12] (5) Three miniaturepinhole AXUV16ELG (16 elements absolute extreme ultraviolet silicon photodiodes) arraycameras which are set at the same toroidal position but in three different poloidal places canprovide a broad viewing angle that covers the whole plasma cross section hence can measurethe total radiated power and the radiated emissive profile The layout is similar to that of softX-ray arrays Another nine AXUV10EL (10 elements) array cameras are divided into threegroups and mounted at different toroidal locations to observe the toroidal radiated powerdistribution The AXUV array has a sensitivity from 020 to 027AW for photon energies of25eV-6keV [13] (6) The spectrometer with 2400linesmm grating is used to record theemission spectrum from 200nm to 1100nm along a vertical center chord through the plasmaThe integration time of the spectrometer is adjusted to 100ms Two identical photodiodearrays (PDAs) aiming for visible-light detection with a specified front filter (center 4647nmbandwidth 3nm) is designed to record CIII line spectrum while another (center 6562nmbandwidth 3nm) is used for the Hα line This hardware can be used to measure the impuritytransport (7) Several types of Langmuir probes capable of measuring up to a few centimetersinside the limiter radius provide data on electron density and temperature the floatingpotential and fluctuations of these quantities in the boundary region [14]
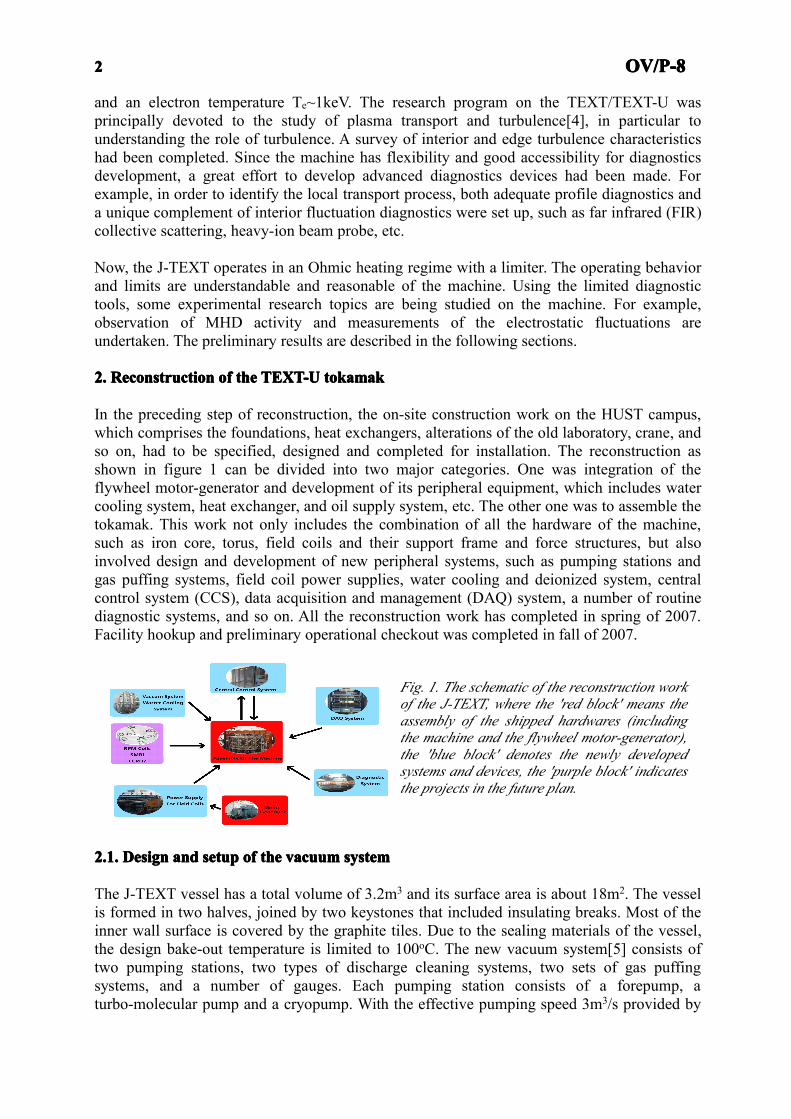
Moreover in our plan there are some important and advanced diagnostic instruments to bedeveloped for some specified research topics For example a 3-wave FIRinterferometer-polarimeter system for current density profile a multi-channel ECE forelectron temperature profile etc The layout of the J-TEXT diagnostics is illustrated in Fig 2
Fig 2 The layout of the J-TEXT diagnosticsystems where T denotes the top diagnosticwindow H the horizontal window and B thebottom window
25252525 ConstructionConstructionConstructionConstruction ofofofof thethethethe datadatadatadata acquisitionacquisitionacquisitionacquisition andandandand managementmanagementmanagementmanagement (DAQ)(DAQ)(DAQ)(DAQ) systemsystemsystemsystem
The new DAQ system formed on base of the Redhat Linux Enterprise Operating System andMDSplus database performs various functions as recording transferring writing duplicatingand accessing the measured data
In daily operation the data acquisition terminals will record measured signals and then
6666 OVP-8OVP-8OVP-8OVP-8
convert them to digital ones The Adlink DAQ2205 high-speed multi-channel data acquisitioncards with the maximum sampling rate of 50ksps at 16-bit resolution are adopted for lowfrequency signal acquisition while the British D-TACQ produced ACQ196 series with themaximum sampling rate of 500ksps at 16-bit resolution for the high-frequency signals All thedigital data is then transmited to the data server via fiber-optic Ethernet and written into theMDSplus tree Via the fiber optic interface the data server links to disk array cabinets for dataduplication and also connects to the tape library for data backup The data service functionsare built around the embedded MDSplus toolkit in the data server A series of powerfulsolutions provided by MDSplus toolkit can program archive structures model tree creationand service function design etc The MDSplus provides the friendly moduleinterface for useraccess to the data In addition the WEB server can provide the website navigation andexperimental data access as well
26262626 OperationOperationOperationOperation andandandand performanceperformanceperformanceperformance
A broad range of J-TEXT Ohmic discharge conditions in hydrogen have been cataloguedDischarges can last up to 300 ms except at the highest currents They are well controlled andreproducible One discharge takes roughly 80 ms for the current to rise and an equilibrium toestablished Then a constant plateau condition can be maintained for 300 ms thereafter Therange of readily-available plasma currents and densities for each of the toroidal fieldscommonly chosen have been studied
At present the limiter configuration of the J-TEXT tokamak is fixed at a major radiusR=105m and a minor radius a=027m Under the condition of BT=22T and gas prefillingpressure of 002Pa a typical Ohmic discharge achieved in the machine is the production ofplasma current of more than 200kA (qa~35) with a flattop duration of 250ms The Vloop
decreases from the peak ~25V to less than 2V Normally the line averaged density of suchdischarges exceeds ~2times1019m-3 while the electron temperature is near 800eV A example isdisplayed in Fig 3 which plots plasma current loop voltage x and y position density and acentral Soft X-ray channel showing sawteeth during the plateau
Fig 3 Traces of a typical Ohmicdischarge in J-TEXT (shot 10011674)where the legend Ip denotes plasmacurrent Vloop for loop voltage Xp andYp for x and y position rescpectivelyne for density and soft x-ray forintensity observed by a central SoftX-ray channel
3333 ResearchResearchResearchResearch progressprogressprogressprogress onononon thethethethe J-TEXTJ-TEXTJ-TEXTJ-TEXT
Benefiting from the diagnostic tools that have been developed experimental studies haveemphasized the types of MHD activity and disruptions that occur and fluctuation andturbulence in the plasma edge region The preliminary results from those programs aredescribed below
31313131 ObservationObservationObservationObservation andandandand analysisanalysisanalysisanalysis ofofofof thethethethe intermittentintermittentintermittentintermittent burstburstburstburst eventseventseventsevents
Many studies have shown that turbulence has a dominant influence in the edge region of the
7777 OVP-8OVP-8OVP-8OVP-8
plasma Recently investigation of the turbulence characteristics in the edge region wereundertaken in the J-TEXT especially on the intermittent burst events (IBEs) In order tounderstand the nature of the IBEs a rather comprehensive analysis was performed on theLangmuir probe signals obtained in the edge region [14]
The scenarios are carried out under the following conditions toroidal field BT=22T plasmacurrent Ip=200kA and a line-averaged electron density ne=13times1019m-3 The measurementsare made using a square probe array which consists of four carbon tips with each tip 2 mmlong and 1 mm in diameter and mounted on the top window of the tokamak The probe can bemoved radially shot-by-shot Two of the tips are operated as a double probe with a constantbias voltage of 180 V to record the ion saturation current (Is) The other two tips are spacedpoloidally to measure the floating potentials The sampling rate of the signals is 500kHz
The intermittency of the density fluctuations can be identified by the analysis of the Is signalsFig 4 shows an example of the time-varying fluctuations of Is and their corresponding PDFsat three different radial locations where the fluctuations are normalized by their standarddeviation In figure 4 the positive fluctuations are slightly more than negative ones in the Issignals near the LCFS while deep into SOL the fluctuations are dominated by much largerpositive peaks The asymmetry of the PDFs in the SOL increases with increasing radiusConditional analysis suggests that the IBEs have a significant impact on the radial transportThe fraction of the particle transport carried by the IBEs is about 10-20 around the LCFS
Fig 4 Time evolution of Is fluctuationsnormalized by their standard deviations (a cand e) and the corresponding PDFs (b d and f)at three different radial locations respectivelyThe red dotted lines indicate the amplitudes ofthe Is fluctuations equal to 25 times theirdeviation (a c and e) and the best Gaussian fitto the PDFs (b d and f)
Fig 5 Power spectrum of the Is fluctuation (a)the dependences of the skewness and kurtosis ofthe Is fluctuation with frequencies (b and c) andthe PDFs of the Is fluctuation at three differentfrequencies (d e and f) The red dotted linesindicate the best Gaussian fit to the PDFs (d eand f)
Meanwhile a conventional power spectrum of the density fluctuation is obtained by Fourieranalysis There are no obvious peaks in the spectrum shown in Fig 5(a) implying no periodicfluctuations The shape of the spectrum can be catalogued into three ranges described bypower-law dependences of S(f)propf -m as having been presented in other tokamaks Thepresence of the m=1 region gives an indication of the avalanche interactions Furthermorethe power-law dependences of the spectrum suggest the self-similar behavior of the densityfluctuation at three different ranges Figures 5(b) and 5(c) show the dependences of skewnessand kurtosis with frequencies The skewness has a maximum value near the frequency off=20kHz suggesting a maximum positive deviation at this frequency From 20kHz to 250kHzthe skewness tends to decrease with high frequency The kurtosis is increasing when the
8888 OVP-8OVP-8OVP-8OVP-8
increasing frequencies above 10kHz indicating that the intermittency of the densityfluctuation is more obvious at high frequencies In addition the PDFs of the densityfluctuations at the three different power-law regions (represented by different time scales) arenear-Gaussian positive skewed and more stretched as shown in Fig 5(d) (e) and (f)respectively which are in accordance with the skewness and kurtosis calculations
In order to investigate the dynamic characteristics between successive burst events the quiettime statistical method is performed on the Is signals The distribution of the quiet timesbetween all burst events in the system essentially reflects the statistics of the drive In theanalysis a reference level of 25 times deviation of the density fluctuation is used to measurethe quiet times between burst events The PDF of the quiet times is shown in Fig 6displaying two distinct power-law regions (P(τ)propτq-γ) with γ=105plusmn006 and γ=229plusmn018respectively The result implies the existence of correlation between burst events and possibledifferent dynamics in the two power-law regions
To improve our understanding of burst effects on transport two sets of 1-D Langmuir probearrays were used to measure the propagation of the turbulent structures in the r-θ plane Thepreliminary analysis of measured Is signals shows that the structures with higher amplitudeshave higher radial and poloidal velocities Both the radial velocity and the poloidal velocitydecrease outward along the radius as shown in Fig 7 The radial velocity approaches to thepoloidal velocity in the far SOL The details will be published elsewhere
Fig 6 Probability distribution function of thequiet times Power law fit is shown by the redsolid lines
Fig 7 The radial dependence of the radial andpoloidal velocity for different thresholds Vppoloidal velocity Vr radial velocity
32323232 PPPPreliminaryreliminaryreliminaryreliminary investigationinvestigationinvestigationinvestigation ofofofof disruptiondisruptiondisruptiondisruption eventseventseventsevents andandandand operationoperationoperationoperation regionregionregionregion
Disruptions are as important issue associated with the tokamak fusion reactors and theiroperations With the occurrence of the major disruptions large energy can be poured onto thefirst wall and divertor plates in very short time and hence may cause large damage to thedevice Moreover large electromagnetic forces induced by eddy and halo currents generatedby disruptions can also damage the vacuum vessel and in-vessel components Therefore it ismeaningful to carry out diverse disruption observations in the tokamak to accumulate relevantdata for disruption control and mitigation
In general there can be several reasons for a major disruption Some discharge exceed thetokamak operating region referred to the Hugill diagram (An example of the J-TEXT isshown in Fig 8) which can easily trigger the disruption This type of disruption can beavoided by setting plasma parameters properly Nevertheless some discharges well locatedwithin the operation region will also end in the precipitate disruptions so it is of importance
9999 OVP-8OVP-8OVP-8OVP-8
to scan the plasma conditions for the precursor analysis and damage evaluation
Fig 8 The J-TEXT Hugill diagram withtrajectories of two disruption events(J-TEXT shots 1011874 and 1011926respectivelly) where the dash dotted lineindicates the Greenwald density limit thedashed line gives the runaway dischargelimit Here the low q limit above 045 isnot shown in the plot
J-TEXT is uniquely tolerant of disruptions and ideally suited for studies of a wide range ofdisruptive behavior Low q high density MHD instability and mode locking and otherclasses of disruption In order to observe and catalogue the disruption events J-TEXT iscurrently equipped with (1) AXUV arrays for the measurement of total radiation power (2)Soft X-ray photodiode arrays for sawtooth oscillation (3) 2D Mirnov coils for mode analysisand (4) CIII and Hα for working gas and impurity flux
During the J-TEXT early campaign (before Oct 2009) some disruptions caused by high-mmode instability at very low current and density during the fast ramp-up phase could occurbut did little harm to the machine Some other disruption events caused by the uncontrollableplasma displacement are also observed Besides these cases disruptions caused by low-mMHD mode instability and mode locking are currently more common in the J-TEXToperation Under without auxiliary heating power and density modulation tools MHDinstability and locked modes could not be controlled and lead to the disruptions easily Among3500 shots (counted in the peroid of Oct 2009-June 2010) 320 shots ended with a disruptionAccording to the statistical analysis of MHD events disruptions caused by mode locking havea proportion of 24 of the disruption events while the growth and saturation of pure m=2tearing mode is another key cause of disruption and it contributes to 71 of the total valueThe remaining 5 were caused by other unidentified effects The descriptions below coverthe two identified catagories of disruption generation namely low-m MHD mode instabilityand mode locking
Fig 9 shows a typical example (J-TEXT shot 1011874) of how a disruption is triggered bymode locking The corresponding trace of this shot is also given in the Hugill diagram (asshown in Fig 8 denoted by open diamonds) In this discharge the plasma current Ip reaches200kA and the plasma density is about 2times1019m-3 during the flat-top Therefore the safetyfactor about 37 during the flat-top is far from the low-q limit while the density is also farfrom the limit All the characteristics reveal that this shot is located within the operationregion However a disruption still occurs at t=2105s The results of variable-frequencycomplex demodulation applied to Mirnov coil signals shows that a MHD mode rotates at afrequency of 2kHz and lasting for a very long time till t=209s just about 5ms before the hardX-ray signal step-up At 2095s (10ms before the current quench) the hard X-ray signalincrease may imply that the plasma confinement begins to deteriorate but other diagnosticsignals do not have any obvious changes During the period of 209-21s the mode rotationstarts to slow down gradually and completely lockes at the end The mode inferred by phaseanalysis shows it is a mn=21 tearing mode
10101010 OVP-8OVP-8OVP-8OVP-8
Fig 10 gives other example (J-TEXT shot 1011926) of a disruption invoked by the increasingand saturation of mn=21 tearing mode The trace of this shot is also given in figure 8(denoted by open circle) and confirms that the discharge stays within the operation regionBut it still undergoes a soft disruption In this discharge the plasma density is above3times1019m-3 so the mode is not easily locked due to the relatively high density Fig 10 displaysthe time evolution of diagnostic signals around the disruption Since the perturbation fieldinduces an increasing magnitude of mn=21 mode at t=2042s the plasma confinementdegrades Therefore the plasma density and intensity of Soft X-rays drop and the loopvoltage CIII Hα and XUV signals step up slightly as well which could be caused by theplasma-wall interaction Abnormality in magnetic perturbation signals is seen during the timefrom t=2042s to 2057s At t=2058s the discharge evolves into a disruption Thevariable-frequency complex demodulation analysis indicates that the MHD mode is mn=21mode rotating at a frequency of 5kHz The precursor phase in this shot is about 15ms muchlonger than the case of mode locking shown in Fig 9 For this type of disruption the currentprofile is close to the marginal stability in the pre-precursor phase so the MHD modeinstability develops
(a) (a)
(b) (b)Fig 9 The time evolution of diagnostic signalsof J-TEXT shot 1011874 ended by a disruptioncaused by locked mode (a) traces from the topto the bottom are plasma current loop voltageplasma density intensity of soft X-raysintensity of XUV CIII amplitude Hα amplitudeintensity of hard X-rays respectively (b)Mirnov pickup coil signal and the modenumber inferred by phase analysis
Fig 10 The time evolution of diagnostic signalsof J-TEXT shot 1011926 ended by a disruptioncaused by low-m MHD mode instability (a)traces from the top to the bottom are plasmacurrent loop voltage plasma density intensityof soft X-rays intensity of XUV CIII amplitudeHα amplitude intensity of hard X-raysrespectively (b) Mirnov pickup coil signal andthe mode number inferred by phase analysis
Those disruptions mentioned above occur under a normal or even higher density and
11111111 OVP-8OVP-8OVP-8OVP-8
temperature conditions For the low density discharges there is a runaway limit foundexperimentally as shown in Fig 8 At present the J-TEXT Ohmic discharges can reach aminimum density of 07times1019m-3 In the normal discharges located around the runaway limitthere are two abnormal cases observed One is that the intensity of hard X-ray emissionreceived from the radial direction increases accompanying a drop in the intensity from thetangential direction (referenced to the Ip direction) The other is that the plasma density andtemperature slightly step up accompanying a hard X-rays increase in the tangential directionThe mechanisms for both cases are not so clear more analysis is underway
Furthermore detailed studies of the disruption characteristics including current spikes andother precursors of the thermal quench various precursor mechanisms and the mechanism forthe thermal quench have been undertaken recently For example because of toroidalinsulating gaps in the vacuum vessel of J-TEXT the direct measurement of net currents in theshell is possible The evidence of net currents inferred by comparing signals from the internaland external Rogowski coils is observed in some disruption events
4444 FutureFutureFutureFuture researchresearchresearchresearch planplanplanplan
Apart from research progress already made some projects relevant to the short-term researchplan on the J-TEXT are going to launch this year (1) Three sets of supersonic molecularbeam injection (SMBI) systems with different injection angles will be set up to control theedge plasma density profile and to study the impurity transport The completed electrondensity diagnostic devices with high spatial and temporal resolution will be useful for study ofparticle transport by SMBI and the oscillating gas puff technique (2) A detailed study of theinfluence of resonant magnetic perturbations andor stochastic magnetic fields on the MHDactivity and heat and particle transport in the plasma edge region will start when theinstallation of Ergodic magnetic limiter and rotating magnetic field coils is completed (3) Ahigh resolution UV-visible spectrometer with good spatial resolution provided by a rotatingmirror will be added for measurement of impurity transport on J-TEXT (4) Two reciprocatingLangmuir probes will be mounted on the top windows of the J-TEXT They together withnumerous existing movable and fixed Langmuir probes will be manipulated flexibly for edgeturbulence studies The study will concentrate on asymmetries and coherent structures acrossthe LCFS (5) A high-power 3-wave FIR laser polarimeter-interferometer used to provide theplasma current density profile will be built [15] The measurement will enable a thoroughinvestigation into the effect of the current density and its gradient on MHD events (6) A32-channel electron cyclotron emission (ECE) radiometer with high temporal and spatialresolution will be applied for J-TEXT temperature profile measurement Its potentialapplication to the study of thermal quench and to electron thermal transport in future withmodulated ECH will be an interesting topic
5555 SummarySummarySummarySummary
The TEXT-U tokamak having been operated by the UT at Austin was dismantled andshipped to China in 2004 and renamed as the Joint TEXT (J-TEXT) In 2007 thereconstruction of the machine was completed and the first plasma was obtained Thereconstruction of the J-TEXT tokamak not only included the assembly of the vacuum chamberfield coils and iron core transformer but also involved design and manufacture of pumpingstations and gas puffing system rebuilding the field coil power supplies construction of theCCS system establishment of the DAQ system and so on Moreover a number of diagnosticsystems used to facilitate the routine operation and research scenarios were developed
12121212 OVP-8OVP-8OVP-8OVP-8
Recently the observation of MHD activity and preliminary analysis of disruption events weremade Measurements and analysis of the IBEs near the LCFS were also done Apart from thereconstruction and research progress already made some projects are going to launch thisyear which includes setup of SMBI systems resonance perturbation magnetic coilsUV-visible spectrometer 3-wave FIR polarimeter-interferometer and an ECE system Withthose extensive modulation tools and diagnostic hardware being built we will be able to carryout some thorough investigations into basic plasma physics processes In a word the machineis ready for productive research
AcknowledgementAcknowledgementAcknowledgementAcknowledgement
We are grateful to the help from the Southwestern Institute of Physics and the Institute ofPlasma Physics Chinese Academy of Science This work is supported by the National 973project of China (no 2008CB717805)
ReferencesReferencesReferencesReferences
[1] UNIVERSITY OF TEXAS AT AUSTIN Proposal for a fusion plasma research facilityFusion Research Center Austin (1976)
[2] UNIVERSITY OF TEXAS AT AUSTIN The Texas Experimental Tokamak a plasmaresearch facility DOEER54241-151 FRCR 470 Austin (1995)
[3] ZHUANG G DING YH et al Reconstruction of the TEXT-U Tokamak in ChinaPlasma Science and Technology 11 (2009) 439
[4] WESSON J Tokamaks Oxford University Press Cambridge (2004)[5] DING YH ZHUANG G et al The vacuum system of the J-TEXT tokamak Plasma
Devices and Operations 17 (2009) 207[6] ZHANG M ZHUANG G et al Design of the Control System of Toroidal Field (TF)
Power Supply for J-TEXT Tokamak Plasma Science and Technology 10 (2008) 754[7] ZHANG M ZHUANG G et al The Power Supply System for the J-TEXT Poloidal
Field Plasma Science and Technology 11 (2009) 100[8] YANG ZJ ZHUANG G et al Design and realization of the J-TEXT tokamak
central control system Fusion Engineering and Design 84 (2009) 2093[9] QIU SS ZHUANG G et al New PCB magnetic coils in the vacuum vessel of
J-TEXT tokamak for position measurement Rev Sci Instrum (inpress)[10] GAO L HU XW et al The Microwave Interferometer on J-TEXT Tokamak The
8th International Symposium on Antennas Propagation and EM Theory Kunming(2008)
[11] ZHU M ZHUANG G et al A Visible Imaging System for the Estimation ofPlasma Vertical Displacement in J-TEXT Plasma Science and Technology (in press)
[12] DING YH ZHUANG G et al Soft x-ray imaging diagnostic system on theJ-TEXT Nuclear Instruments and Methods A 606 (2009) 743
[13] ZHANG J ZHUANG G et al A new absolute extreme ultraviolet image systemdesigned for studying the radiated power of the Joint Texas Experimental Tokamakdischarges Rev Sci Instrum 81 (2010) 073509
[14] ZHU M ZHUANG G et al Intermittency of the density fluctuations and itsinfluence on the radial transport in the boundary of J-TEXT Chinese Physics B (inpress)
[15] CHEN J GAO L et al Design of a FIR three-wave polarimeter-interferometersystem for J- TEXT Tokomak Rev Sci Instrum (in press)
2222 OVP-8OVP-8OVP-8OVP-8
and an electron temperature Te~1keV The research program on the TEXTTEXT-U wasprincipally devoted to the study of plasma transport and turbulence[4] in particular tounderstanding the role of turbulence A survey of interior and edge turbulence characteristicshad been completed Since the machine has flexibility and good accessibility for diagnosticsdevelopment a great effort to develop advanced diagnostics devices had been made Forexample in order to identify the local transport process both adequate profile diagnostics anda unique complement of interior fluctuation diagnostics were set up such as far infrared (FIR)collective scattering heavy-ion beam probe etc
Now the J-TEXT operates in an Ohmic heating regime with a limiter The operating behaviorand limits are understandable and reasonable of the machine Using the limited diagnostictools some experimental research topics are being studied on the machine For exampleobservation of MHD activity and measurements of the electrostatic fluctuations areundertaken The preliminary results are described in the following sections
2222 ReconstructionReconstructionReconstructionReconstruction ofofofof thethethethe TEXT-UTEXT-UTEXT-UTEXT-U tokamaktokamaktokamaktokamak
In the preceding step of reconstruction the on-site construction work on the HUST campuswhich comprises the foundations heat exchangers alterations of the old laboratory crane andso on had to be specified designed and completed for installation The reconstruction asshown in figure 1 can be divided into two major categories One was integration of theflywheel motor-generator and development of its peripheral equipment which includes watercooling system heat exchanger and oil supply system etc The other one was to assemble thetokamak This work not only includes the combination of all the hardware of the machinesuch as iron core torus field coils and their support frame and force structures but alsoinvolved design and development of new peripheral systems such as pumping stations andgas puffing systems field coil power supplies water cooling and deionized system centralcontrol system (CCS) data acquisition and management (DAQ) system a number of routinediagnostic systems and so on All the reconstruction work has completed in spring of 2007Facility hookup and preliminary operational checkout was completed in fall of 2007
Fig 1 The schematic of the reconstruction workof the J-TEXT where the red block means theassembly of the shipped hardwares (includingthe machine and the flywheel motor-generator)the blue block denotes the newly developedsystems and devices the purple block indicatesthe projects in the future plan
21212121 DesignDesignDesignDesign andandandand setupsetupsetupsetup ofofofof thethethethe vacuumvacuumvacuumvacuum systemsystemsystemsystem
The J-TEXT vessel has a total volume of 32m3 and its surface area is about 18m2 The vesselis formed in two halves joined by two keystones that included insulating breaks Most of theinner wall surface is covered by the graphite tiles Due to the sealing materials of the vesselthe design bake-out temperature is limited to 100oC The new vacuum system[5] consists oftwo pumping stations two types of discharge cleaning systems two sets of gas puffingsystems and a number of gauges Each pumping station consists of a forepump aturbo-molecular pump and a cryopump With the effective pumping speed 3m3s provided by
3333 OVP-8OVP-8OVP-8OVP-8
two running pumping stations the rough-down time from air to 10Pa is about 60min and thepump-down to 12times10-4Pa after a shot in hydrogen is less than 3 min The base pressure insidethe vessel can be lowered to 66times10-6Pa which easily satisfies the discharge requirementBoth Taylor discharge cleaning and glow discharge cleaning are used to clean theplasma-facing components inside the vessel to guarantee a good wall condition Taylordischarge cleaning works as the main cleaning tool with discharge cleaned for 12 hours eachnight and continuously on weekends The gas puffing system which consists of a containerand a piezo-electric valve controlled by feedback loop or preset waveforms for rapidmodulation is used to fill Hydrogen or other type of gas to suit the experimental needsSeveral types of gauges covering pressures ranging from atmospheric pressure to 10-7Pa arecurrently in use Vacuum conditions are continually monitored with a residual gas analyzer(RGA) during the operation
22222222 ModificiationModificiationModificiationModificiation ofofofof thethethethe fieldfieldfieldfield coilcoilcoilcoil powerpowerpowerpower suppliessuppliessuppliessupplies
Because of the grid difference between China (50Hz) and USA (60Hz) and improvedelectrical technology the previous magnet power supplies had to be extensively modifiedespecially their control systems
The toroidal field (TF) coils cooled by deionized water consist of 16 nearly round shapedcopper coils segments interlinked in series with 6 turns per segment The TF power supplyenergized by the 100MW100MJ flywheel motor-generator can drive a flat current up to120kA which generates the TF up to 225T [6] The TF coils produce a toroidal field with anaverage ripple of less than 1 with a maximum of 3 at the outer edge
Three separate coil systems are placed toroidally around the torus of J-TEXT to producedifferent types of poloidal fields (PFs) namely the Ohmic heating (OH) field the verticalfield (VF) and the horizontal field (HF) The OH coil consists of a 40-turn solenoidinductively coupled to the plasma aided by an iron-core transformer with two return legs andhas a up-limit flux of 16V∙s The OH power supply is the most complex electrical source onthe J-TEXT which comprises one rectifier circuit one pre-magnetizing circuit fourcapacitance-bank discharge circuits and an ionization capacitance discharge circuit Thesystem has the capability to provide 10kA current at 300VDC within 05s interval in the OHcoil which enables plasma currents up to 400kA The plasma equilibrium is achieved by thefunctioning of two other PFs composed of a 16-turn VF coil and a 32-turn HF coilrespectively Both coil systems are driven from the power grid at 380V The VF power supplycan drive a 10kA current at 200VDC lasting for 05s The HF power supply is able to feedforward and reverse current to the coils up to 500A in the range of plusmn150VDC which lasts for05s [7] Both VF and HF power supplies are feedback-controlled to maintain plasmaposition
23232323 DevelopmentDevelopmentDevelopmentDevelopment ofofofof thethethethe centcentcentcentralralralral controlcontrolcontrolcontrol systemsystemsystemsystem (CCS)(CCS)(CCS)(CCS)
The novel CCS system developed under a UNIX-style real-time operating system QNX is amulti-mission system that functions as a machine coordinator discharge pilot data managerand emergency response [8] The system can control all the subsystems and realize somebasic functions as follows (1) Discharge waveform design the discharge waveforms for theTF OH VF HF and gas puffing can be carefully aligned to meet the userrsquos demand (2)Timing sequence control the timing sequence may be controlled so as to permit each relevantsubsystem to engage in the process at the right time peculiarly to real-time manage all the
4444 OVP-8OVP-8OVP-8OVP-8
magnetic fields to meet the experimental requirements (3) Status cruise and safety controlthe CCS system can check the status of every sub-system at a 1kHz rate and update thesecurity information time to time If an abnormal event occurs it can immediately block thedischarge sequence and activate contingency plans to protect the subsystems (4) Post-shotservice This process can be prompted by the plasma current ramp-down and thereby alter thedischarge control to the normal waiting status The services contain system checks all thesubsystem resets shot-number update data transfer and archive etc
24242424 DevelopmentDevelopmentDevelopmentDevelopment ofofofof diagnosticdiagnosticdiagnosticdiagnostic systemsystemsystemsystemssss
Since the TEXT-U shipment did not contain any diagnostic instruments a number offundamental diagnostics had to be designed and developed to assist the first commissioningand then facilitate the daily operation in the early campaign They take the measurements of(1) Plasma current The plasma current is measured with three redundant Rogowski loopspoloidally winding around the vessel Two identical sets of printed circuit board (PCB)Rogowski coils were mounted outside the vessel at two symmetrical toroidal positions Onehandmade conventional Rogowski coil was installed inside the vessel All 3 sets of coils havean insignificant error of a few kiloamps (2) Loop voltage Three 1-turn flux loops toroidallywinding around the vessel with different locations R=446cm 493cm 106cm respectivelyare used to provide the loop voltage (3) Plasma position Four sets of PCB magneticdiagnostic coils installed inside the vacuum vessel are used for detecting the plasma radial andvertical displacements Each coordinate is determined by a pair of variable cross-sectionRogowski and saddle coils [9] (4) Averaged density A 2mm microwave interferometersystem is used for the measurement of center chord line-integrated electron density for theroutine operation and for the density feedback control A bias-tunable Gunn oscillatoroperating at 150GHz (cutoff density is 28times1020m-3) with output power of 10mW is employedas a frequency-modulated source The nominal IF of the system is 100kHz [10] (5) Hardx-ray emission Intensity of hard x-ray emission is measured by two sets of fixed scintillationcounters away from the torus viewing tangentially and radially respectively The measuredresults are used to evaluate the strength of runaway electrons (6) Residual gas An InficonRGA is installed on one pumping station to monitor the composition of filling gas (H2 D2and impurities) hence to determine the progress of discharge cleaning and detectcontamination in the vessel (7) Visible light A wide-viewing-angle visible light imagingsystem located at a tangential window is designed to monitor the visible light emission fromthe boundary region and hereby to monitor the discharge progress [11]
Since 2008 a number of other diagnostic tools have been developed mainly to satisfy theneeds of research topics such as investigation and hence comprehension of various MHDactivities turbulence and transport and so on The diagnostic systems now in use are listed asfollows (1) Multichannel FIR interferometer employs seven channels cross the J-TEXTcross-section vertically Their radial positions are r=21cm 14cm 7cm 0cm -21cm -14cm-7cm respectively The laser source is a continuous-wave HCN laser with a wavelength of337μm (cutoff density is 98times1021m-3) and an output power up to 100mW The IF frequencycan be adjusted by a rotating grating and is fixed at 10kHz Both plasma density andfluctuations can be measured (2) There are two poloidal arrays of 2D Mirnov coils mountedinside the vessel one array of 24 coils (equivalently located in a circular shape) and the otherone of 20 (in a rectangular shape) There is also one toroidal array of 16 coils installed insidethe torus All of them are used to detect external MHD activity and permit determination of(mn) of the mode (3) An X-ray pulse height Analyzer (consists of 3 Silicon shift detectors) isused to measure the soft x-ray emission spectrum to determine Te strong metallic lines and
5555 OVP-8OVP-8OVP-8OVP-8
the super-thermal electron distribution It can detect photon energies ranging from 1keV to20keV and the low energy photons will be shielded by 8μm beryllium filter Its temporalresolution is 50ms (4) Three soft X-ray photodiode arrays mounted at the same toroidallocation but different poloidal positions are used to detect soft x-rays The vertically viewingarray consists of 35 detectors which view the entire plasma cross-section The horizontallyviewing array has 2 sets of 35 detectors located plusmn15 degrees from the mid-plane The systemhas a spatial and temporal resolution of 2cm and 4μs respectively A 65μm beryllium filter isused to restrict the spectral acceptance of the cameras to 05-13keV [12] (5) Three miniaturepinhole AXUV16ELG (16 elements absolute extreme ultraviolet silicon photodiodes) arraycameras which are set at the same toroidal position but in three different poloidal places canprovide a broad viewing angle that covers the whole plasma cross section hence can measurethe total radiated power and the radiated emissive profile The layout is similar to that of softX-ray arrays Another nine AXUV10EL (10 elements) array cameras are divided into threegroups and mounted at different toroidal locations to observe the toroidal radiated powerdistribution The AXUV array has a sensitivity from 020 to 027AW for photon energies of25eV-6keV [13] (6) The spectrometer with 2400linesmm grating is used to record theemission spectrum from 200nm to 1100nm along a vertical center chord through the plasmaThe integration time of the spectrometer is adjusted to 100ms Two identical photodiodearrays (PDAs) aiming for visible-light detection with a specified front filter (center 4647nmbandwidth 3nm) is designed to record CIII line spectrum while another (center 6562nmbandwidth 3nm) is used for the Hα line This hardware can be used to measure the impuritytransport (7) Several types of Langmuir probes capable of measuring up to a few centimetersinside the limiter radius provide data on electron density and temperature the floatingpotential and fluctuations of these quantities in the boundary region [14]
Moreover in our plan there are some important and advanced diagnostic instruments to bedeveloped for some specified research topics For example a 3-wave FIRinterferometer-polarimeter system for current density profile a multi-channel ECE forelectron temperature profile etc The layout of the J-TEXT diagnostics is illustrated in Fig 2
Fig 2 The layout of the J-TEXT diagnosticsystems where T denotes the top diagnosticwindow H the horizontal window and B thebottom window
25252525 ConstructionConstructionConstructionConstruction ofofofof thethethethe datadatadatadata acquisitionacquisitionacquisitionacquisition andandandand managementmanagementmanagementmanagement (DAQ)(DAQ)(DAQ)(DAQ) systemsystemsystemsystem
The new DAQ system formed on base of the Redhat Linux Enterprise Operating System andMDSplus database performs various functions as recording transferring writing duplicatingand accessing the measured data
In daily operation the data acquisition terminals will record measured signals and then
6666 OVP-8OVP-8OVP-8OVP-8
convert them to digital ones The Adlink DAQ2205 high-speed multi-channel data acquisitioncards with the maximum sampling rate of 50ksps at 16-bit resolution are adopted for lowfrequency signal acquisition while the British D-TACQ produced ACQ196 series with themaximum sampling rate of 500ksps at 16-bit resolution for the high-frequency signals All thedigital data is then transmited to the data server via fiber-optic Ethernet and written into theMDSplus tree Via the fiber optic interface the data server links to disk array cabinets for dataduplication and also connects to the tape library for data backup The data service functionsare built around the embedded MDSplus toolkit in the data server A series of powerfulsolutions provided by MDSplus toolkit can program archive structures model tree creationand service function design etc The MDSplus provides the friendly moduleinterface for useraccess to the data In addition the WEB server can provide the website navigation andexperimental data access as well
26262626 OperationOperationOperationOperation andandandand performanceperformanceperformanceperformance
A broad range of J-TEXT Ohmic discharge conditions in hydrogen have been cataloguedDischarges can last up to 300 ms except at the highest currents They are well controlled andreproducible One discharge takes roughly 80 ms for the current to rise and an equilibrium toestablished Then a constant plateau condition can be maintained for 300 ms thereafter Therange of readily-available plasma currents and densities for each of the toroidal fieldscommonly chosen have been studied
At present the limiter configuration of the J-TEXT tokamak is fixed at a major radiusR=105m and a minor radius a=027m Under the condition of BT=22T and gas prefillingpressure of 002Pa a typical Ohmic discharge achieved in the machine is the production ofplasma current of more than 200kA (qa~35) with a flattop duration of 250ms The Vloop
decreases from the peak ~25V to less than 2V Normally the line averaged density of suchdischarges exceeds ~2times1019m-3 while the electron temperature is near 800eV A example isdisplayed in Fig 3 which plots plasma current loop voltage x and y position density and acentral Soft X-ray channel showing sawteeth during the plateau
Fig 3 Traces of a typical Ohmicdischarge in J-TEXT (shot 10011674)where the legend Ip denotes plasmacurrent Vloop for loop voltage Xp andYp for x and y position rescpectivelyne for density and soft x-ray forintensity observed by a central SoftX-ray channel
3333 ResearchResearchResearchResearch progressprogressprogressprogress onononon thethethethe J-TEXTJ-TEXTJ-TEXTJ-TEXT
Benefiting from the diagnostic tools that have been developed experimental studies haveemphasized the types of MHD activity and disruptions that occur and fluctuation andturbulence in the plasma edge region The preliminary results from those programs aredescribed below
31313131 ObservationObservationObservationObservation andandandand analysisanalysisanalysisanalysis ofofofof thethethethe intermittentintermittentintermittentintermittent burstburstburstburst eventseventseventsevents
Many studies have shown that turbulence has a dominant influence in the edge region of the
7777 OVP-8OVP-8OVP-8OVP-8
plasma Recently investigation of the turbulence characteristics in the edge region wereundertaken in the J-TEXT especially on the intermittent burst events (IBEs) In order tounderstand the nature of the IBEs a rather comprehensive analysis was performed on theLangmuir probe signals obtained in the edge region [14]
The scenarios are carried out under the following conditions toroidal field BT=22T plasmacurrent Ip=200kA and a line-averaged electron density ne=13times1019m-3 The measurementsare made using a square probe array which consists of four carbon tips with each tip 2 mmlong and 1 mm in diameter and mounted on the top window of the tokamak The probe can bemoved radially shot-by-shot Two of the tips are operated as a double probe with a constantbias voltage of 180 V to record the ion saturation current (Is) The other two tips are spacedpoloidally to measure the floating potentials The sampling rate of the signals is 500kHz
The intermittency of the density fluctuations can be identified by the analysis of the Is signalsFig 4 shows an example of the time-varying fluctuations of Is and their corresponding PDFsat three different radial locations where the fluctuations are normalized by their standarddeviation In figure 4 the positive fluctuations are slightly more than negative ones in the Issignals near the LCFS while deep into SOL the fluctuations are dominated by much largerpositive peaks The asymmetry of the PDFs in the SOL increases with increasing radiusConditional analysis suggests that the IBEs have a significant impact on the radial transportThe fraction of the particle transport carried by the IBEs is about 10-20 around the LCFS
Fig 4 Time evolution of Is fluctuationsnormalized by their standard deviations (a cand e) and the corresponding PDFs (b d and f)at three different radial locations respectivelyThe red dotted lines indicate the amplitudes ofthe Is fluctuations equal to 25 times theirdeviation (a c and e) and the best Gaussian fitto the PDFs (b d and f)
Fig 5 Power spectrum of the Is fluctuation (a)the dependences of the skewness and kurtosis ofthe Is fluctuation with frequencies (b and c) andthe PDFs of the Is fluctuation at three differentfrequencies (d e and f) The red dotted linesindicate the best Gaussian fit to the PDFs (d eand f)
Meanwhile a conventional power spectrum of the density fluctuation is obtained by Fourieranalysis There are no obvious peaks in the spectrum shown in Fig 5(a) implying no periodicfluctuations The shape of the spectrum can be catalogued into three ranges described bypower-law dependences of S(f)propf -m as having been presented in other tokamaks Thepresence of the m=1 region gives an indication of the avalanche interactions Furthermorethe power-law dependences of the spectrum suggest the self-similar behavior of the densityfluctuation at three different ranges Figures 5(b) and 5(c) show the dependences of skewnessand kurtosis with frequencies The skewness has a maximum value near the frequency off=20kHz suggesting a maximum positive deviation at this frequency From 20kHz to 250kHzthe skewness tends to decrease with high frequency The kurtosis is increasing when the
8888 OVP-8OVP-8OVP-8OVP-8
increasing frequencies above 10kHz indicating that the intermittency of the densityfluctuation is more obvious at high frequencies In addition the PDFs of the densityfluctuations at the three different power-law regions (represented by different time scales) arenear-Gaussian positive skewed and more stretched as shown in Fig 5(d) (e) and (f)respectively which are in accordance with the skewness and kurtosis calculations
In order to investigate the dynamic characteristics between successive burst events the quiettime statistical method is performed on the Is signals The distribution of the quiet timesbetween all burst events in the system essentially reflects the statistics of the drive In theanalysis a reference level of 25 times deviation of the density fluctuation is used to measurethe quiet times between burst events The PDF of the quiet times is shown in Fig 6displaying two distinct power-law regions (P(τ)propτq-γ) with γ=105plusmn006 and γ=229plusmn018respectively The result implies the existence of correlation between burst events and possibledifferent dynamics in the two power-law regions
To improve our understanding of burst effects on transport two sets of 1-D Langmuir probearrays were used to measure the propagation of the turbulent structures in the r-θ plane Thepreliminary analysis of measured Is signals shows that the structures with higher amplitudeshave higher radial and poloidal velocities Both the radial velocity and the poloidal velocitydecrease outward along the radius as shown in Fig 7 The radial velocity approaches to thepoloidal velocity in the far SOL The details will be published elsewhere
Fig 6 Probability distribution function of thequiet times Power law fit is shown by the redsolid lines
Fig 7 The radial dependence of the radial andpoloidal velocity for different thresholds Vppoloidal velocity Vr radial velocity
32323232 PPPPreliminaryreliminaryreliminaryreliminary investigationinvestigationinvestigationinvestigation ofofofof disruptiondisruptiondisruptiondisruption eventseventseventsevents andandandand operationoperationoperationoperation regionregionregionregion
Disruptions are as important issue associated with the tokamak fusion reactors and theiroperations With the occurrence of the major disruptions large energy can be poured onto thefirst wall and divertor plates in very short time and hence may cause large damage to thedevice Moreover large electromagnetic forces induced by eddy and halo currents generatedby disruptions can also damage the vacuum vessel and in-vessel components Therefore it ismeaningful to carry out diverse disruption observations in the tokamak to accumulate relevantdata for disruption control and mitigation
In general there can be several reasons for a major disruption Some discharge exceed thetokamak operating region referred to the Hugill diagram (An example of the J-TEXT isshown in Fig 8) which can easily trigger the disruption This type of disruption can beavoided by setting plasma parameters properly Nevertheless some discharges well locatedwithin the operation region will also end in the precipitate disruptions so it is of importance
9999 OVP-8OVP-8OVP-8OVP-8
to scan the plasma conditions for the precursor analysis and damage evaluation
Fig 8 The J-TEXT Hugill diagram withtrajectories of two disruption events(J-TEXT shots 1011874 and 1011926respectivelly) where the dash dotted lineindicates the Greenwald density limit thedashed line gives the runaway dischargelimit Here the low q limit above 045 isnot shown in the plot
J-TEXT is uniquely tolerant of disruptions and ideally suited for studies of a wide range ofdisruptive behavior Low q high density MHD instability and mode locking and otherclasses of disruption In order to observe and catalogue the disruption events J-TEXT iscurrently equipped with (1) AXUV arrays for the measurement of total radiation power (2)Soft X-ray photodiode arrays for sawtooth oscillation (3) 2D Mirnov coils for mode analysisand (4) CIII and Hα for working gas and impurity flux
During the J-TEXT early campaign (before Oct 2009) some disruptions caused by high-mmode instability at very low current and density during the fast ramp-up phase could occurbut did little harm to the machine Some other disruption events caused by the uncontrollableplasma displacement are also observed Besides these cases disruptions caused by low-mMHD mode instability and mode locking are currently more common in the J-TEXToperation Under without auxiliary heating power and density modulation tools MHDinstability and locked modes could not be controlled and lead to the disruptions easily Among3500 shots (counted in the peroid of Oct 2009-June 2010) 320 shots ended with a disruptionAccording to the statistical analysis of MHD events disruptions caused by mode locking havea proportion of 24 of the disruption events while the growth and saturation of pure m=2tearing mode is another key cause of disruption and it contributes to 71 of the total valueThe remaining 5 were caused by other unidentified effects The descriptions below coverthe two identified catagories of disruption generation namely low-m MHD mode instabilityand mode locking
Fig 9 shows a typical example (J-TEXT shot 1011874) of how a disruption is triggered bymode locking The corresponding trace of this shot is also given in the Hugill diagram (asshown in Fig 8 denoted by open diamonds) In this discharge the plasma current Ip reaches200kA and the plasma density is about 2times1019m-3 during the flat-top Therefore the safetyfactor about 37 during the flat-top is far from the low-q limit while the density is also farfrom the limit All the characteristics reveal that this shot is located within the operationregion However a disruption still occurs at t=2105s The results of variable-frequencycomplex demodulation applied to Mirnov coil signals shows that a MHD mode rotates at afrequency of 2kHz and lasting for a very long time till t=209s just about 5ms before the hardX-ray signal step-up At 2095s (10ms before the current quench) the hard X-ray signalincrease may imply that the plasma confinement begins to deteriorate but other diagnosticsignals do not have any obvious changes During the period of 209-21s the mode rotationstarts to slow down gradually and completely lockes at the end The mode inferred by phaseanalysis shows it is a mn=21 tearing mode
10101010 OVP-8OVP-8OVP-8OVP-8
Fig 10 gives other example (J-TEXT shot 1011926) of a disruption invoked by the increasingand saturation of mn=21 tearing mode The trace of this shot is also given in figure 8(denoted by open circle) and confirms that the discharge stays within the operation regionBut it still undergoes a soft disruption In this discharge the plasma density is above3times1019m-3 so the mode is not easily locked due to the relatively high density Fig 10 displaysthe time evolution of diagnostic signals around the disruption Since the perturbation fieldinduces an increasing magnitude of mn=21 mode at t=2042s the plasma confinementdegrades Therefore the plasma density and intensity of Soft X-rays drop and the loopvoltage CIII Hα and XUV signals step up slightly as well which could be caused by theplasma-wall interaction Abnormality in magnetic perturbation signals is seen during the timefrom t=2042s to 2057s At t=2058s the discharge evolves into a disruption Thevariable-frequency complex demodulation analysis indicates that the MHD mode is mn=21mode rotating at a frequency of 5kHz The precursor phase in this shot is about 15ms muchlonger than the case of mode locking shown in Fig 9 For this type of disruption the currentprofile is close to the marginal stability in the pre-precursor phase so the MHD modeinstability develops
(a) (a)
(b) (b)Fig 9 The time evolution of diagnostic signalsof J-TEXT shot 1011874 ended by a disruptioncaused by locked mode (a) traces from the topto the bottom are plasma current loop voltageplasma density intensity of soft X-raysintensity of XUV CIII amplitude Hα amplitudeintensity of hard X-rays respectively (b)Mirnov pickup coil signal and the modenumber inferred by phase analysis
Fig 10 The time evolution of diagnostic signalsof J-TEXT shot 1011926 ended by a disruptioncaused by low-m MHD mode instability (a)traces from the top to the bottom are plasmacurrent loop voltage plasma density intensityof soft X-rays intensity of XUV CIII amplitudeHα amplitude intensity of hard X-raysrespectively (b) Mirnov pickup coil signal andthe mode number inferred by phase analysis
Those disruptions mentioned above occur under a normal or even higher density and
11111111 OVP-8OVP-8OVP-8OVP-8
temperature conditions For the low density discharges there is a runaway limit foundexperimentally as shown in Fig 8 At present the J-TEXT Ohmic discharges can reach aminimum density of 07times1019m-3 In the normal discharges located around the runaway limitthere are two abnormal cases observed One is that the intensity of hard X-ray emissionreceived from the radial direction increases accompanying a drop in the intensity from thetangential direction (referenced to the Ip direction) The other is that the plasma density andtemperature slightly step up accompanying a hard X-rays increase in the tangential directionThe mechanisms for both cases are not so clear more analysis is underway
Furthermore detailed studies of the disruption characteristics including current spikes andother precursors of the thermal quench various precursor mechanisms and the mechanism forthe thermal quench have been undertaken recently For example because of toroidalinsulating gaps in the vacuum vessel of J-TEXT the direct measurement of net currents in theshell is possible The evidence of net currents inferred by comparing signals from the internaland external Rogowski coils is observed in some disruption events
4444 FutureFutureFutureFuture researchresearchresearchresearch planplanplanplan
Apart from research progress already made some projects relevant to the short-term researchplan on the J-TEXT are going to launch this year (1) Three sets of supersonic molecularbeam injection (SMBI) systems with different injection angles will be set up to control theedge plasma density profile and to study the impurity transport The completed electrondensity diagnostic devices with high spatial and temporal resolution will be useful for study ofparticle transport by SMBI and the oscillating gas puff technique (2) A detailed study of theinfluence of resonant magnetic perturbations andor stochastic magnetic fields on the MHDactivity and heat and particle transport in the plasma edge region will start when theinstallation of Ergodic magnetic limiter and rotating magnetic field coils is completed (3) Ahigh resolution UV-visible spectrometer with good spatial resolution provided by a rotatingmirror will be added for measurement of impurity transport on J-TEXT (4) Two reciprocatingLangmuir probes will be mounted on the top windows of the J-TEXT They together withnumerous existing movable and fixed Langmuir probes will be manipulated flexibly for edgeturbulence studies The study will concentrate on asymmetries and coherent structures acrossthe LCFS (5) A high-power 3-wave FIR laser polarimeter-interferometer used to provide theplasma current density profile will be built [15] The measurement will enable a thoroughinvestigation into the effect of the current density and its gradient on MHD events (6) A32-channel electron cyclotron emission (ECE) radiometer with high temporal and spatialresolution will be applied for J-TEXT temperature profile measurement Its potentialapplication to the study of thermal quench and to electron thermal transport in future withmodulated ECH will be an interesting topic
5555 SummarySummarySummarySummary
The TEXT-U tokamak having been operated by the UT at Austin was dismantled andshipped to China in 2004 and renamed as the Joint TEXT (J-TEXT) In 2007 thereconstruction of the machine was completed and the first plasma was obtained Thereconstruction of the J-TEXT tokamak not only included the assembly of the vacuum chamberfield coils and iron core transformer but also involved design and manufacture of pumpingstations and gas puffing system rebuilding the field coil power supplies construction of theCCS system establishment of the DAQ system and so on Moreover a number of diagnosticsystems used to facilitate the routine operation and research scenarios were developed
12121212 OVP-8OVP-8OVP-8OVP-8
Recently the observation of MHD activity and preliminary analysis of disruption events weremade Measurements and analysis of the IBEs near the LCFS were also done Apart from thereconstruction and research progress already made some projects are going to launch thisyear which includes setup of SMBI systems resonance perturbation magnetic coilsUV-visible spectrometer 3-wave FIR polarimeter-interferometer and an ECE system Withthose extensive modulation tools and diagnostic hardware being built we will be able to carryout some thorough investigations into basic plasma physics processes In a word the machineis ready for productive research
AcknowledgementAcknowledgementAcknowledgementAcknowledgement
We are grateful to the help from the Southwestern Institute of Physics and the Institute ofPlasma Physics Chinese Academy of Science This work is supported by the National 973project of China (no 2008CB717805)
ReferencesReferencesReferencesReferences
[1] UNIVERSITY OF TEXAS AT AUSTIN Proposal for a fusion plasma research facilityFusion Research Center Austin (1976)
[2] UNIVERSITY OF TEXAS AT AUSTIN The Texas Experimental Tokamak a plasmaresearch facility DOEER54241-151 FRCR 470 Austin (1995)
[3] ZHUANG G DING YH et al Reconstruction of the TEXT-U Tokamak in ChinaPlasma Science and Technology 11 (2009) 439
[4] WESSON J Tokamaks Oxford University Press Cambridge (2004)[5] DING YH ZHUANG G et al The vacuum system of the J-TEXT tokamak Plasma
Devices and Operations 17 (2009) 207[6] ZHANG M ZHUANG G et al Design of the Control System of Toroidal Field (TF)
Power Supply for J-TEXT Tokamak Plasma Science and Technology 10 (2008) 754[7] ZHANG M ZHUANG G et al The Power Supply System for the J-TEXT Poloidal
Field Plasma Science and Technology 11 (2009) 100[8] YANG ZJ ZHUANG G et al Design and realization of the J-TEXT tokamak
central control system Fusion Engineering and Design 84 (2009) 2093[9] QIU SS ZHUANG G et al New PCB magnetic coils in the vacuum vessel of
J-TEXT tokamak for position measurement Rev Sci Instrum (inpress)[10] GAO L HU XW et al The Microwave Interferometer on J-TEXT Tokamak The
8th International Symposium on Antennas Propagation and EM Theory Kunming(2008)
[11] ZHU M ZHUANG G et al A Visible Imaging System for the Estimation ofPlasma Vertical Displacement in J-TEXT Plasma Science and Technology (in press)
[12] DING YH ZHUANG G et al Soft x-ray imaging diagnostic system on theJ-TEXT Nuclear Instruments and Methods A 606 (2009) 743
[13] ZHANG J ZHUANG G et al A new absolute extreme ultraviolet image systemdesigned for studying the radiated power of the Joint Texas Experimental Tokamakdischarges Rev Sci Instrum 81 (2010) 073509
[14] ZHU M ZHUANG G et al Intermittency of the density fluctuations and itsinfluence on the radial transport in the boundary of J-TEXT Chinese Physics B (inpress)
[15] CHEN J GAO L et al Design of a FIR three-wave polarimeter-interferometersystem for J- TEXT Tokomak Rev Sci Instrum (in press)
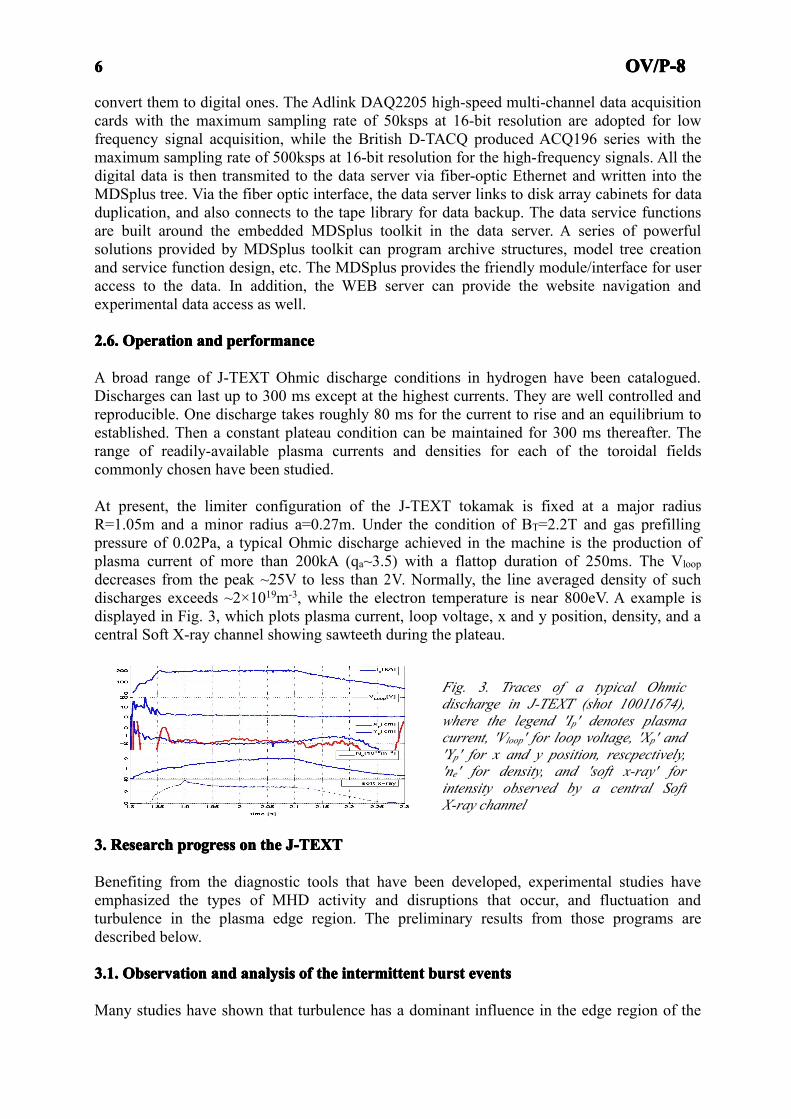
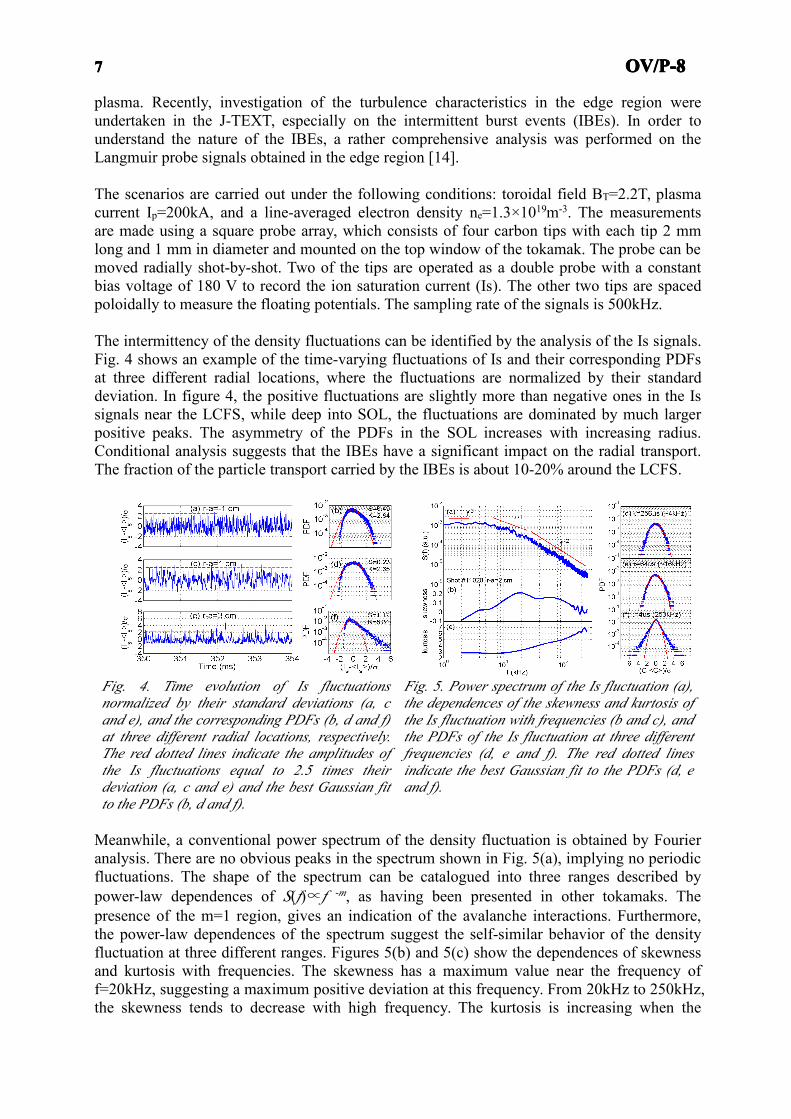
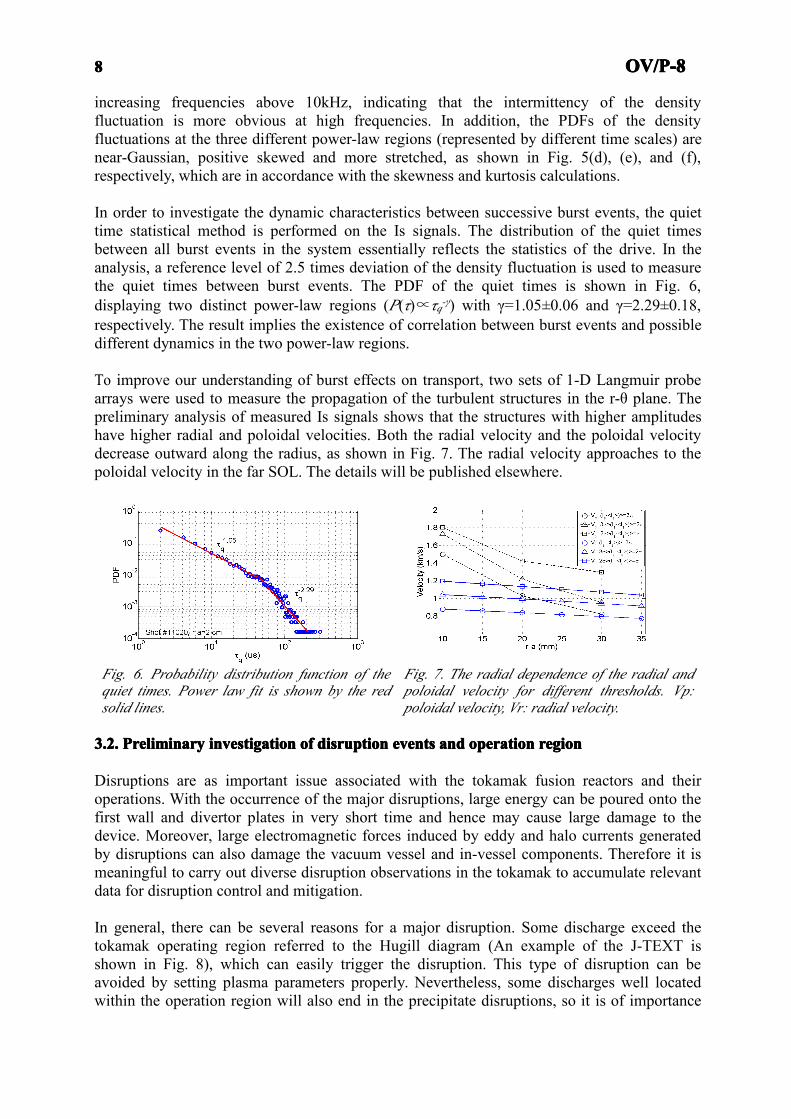
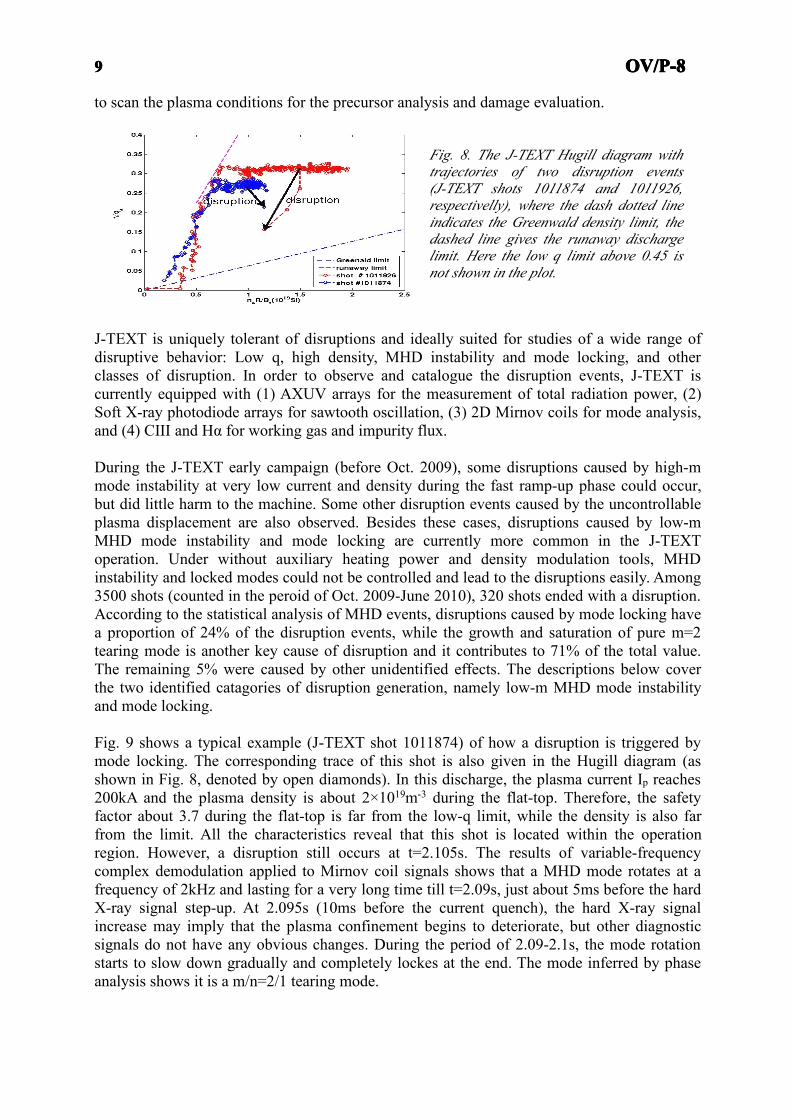
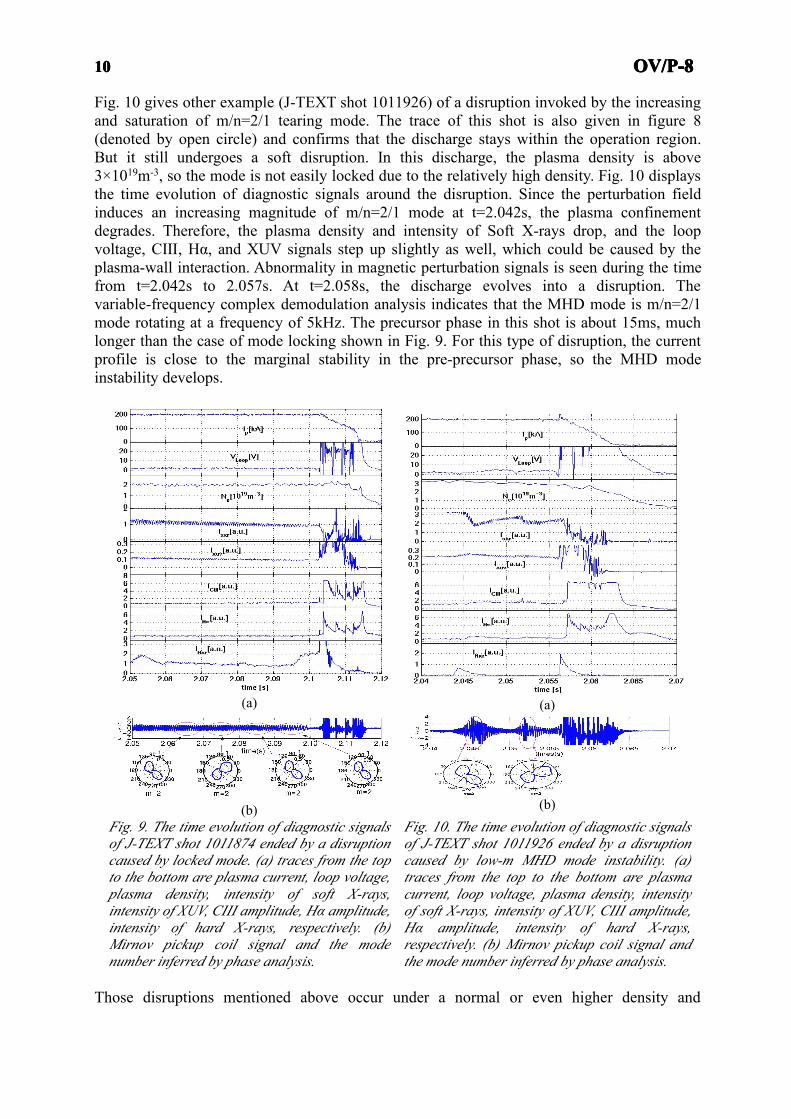
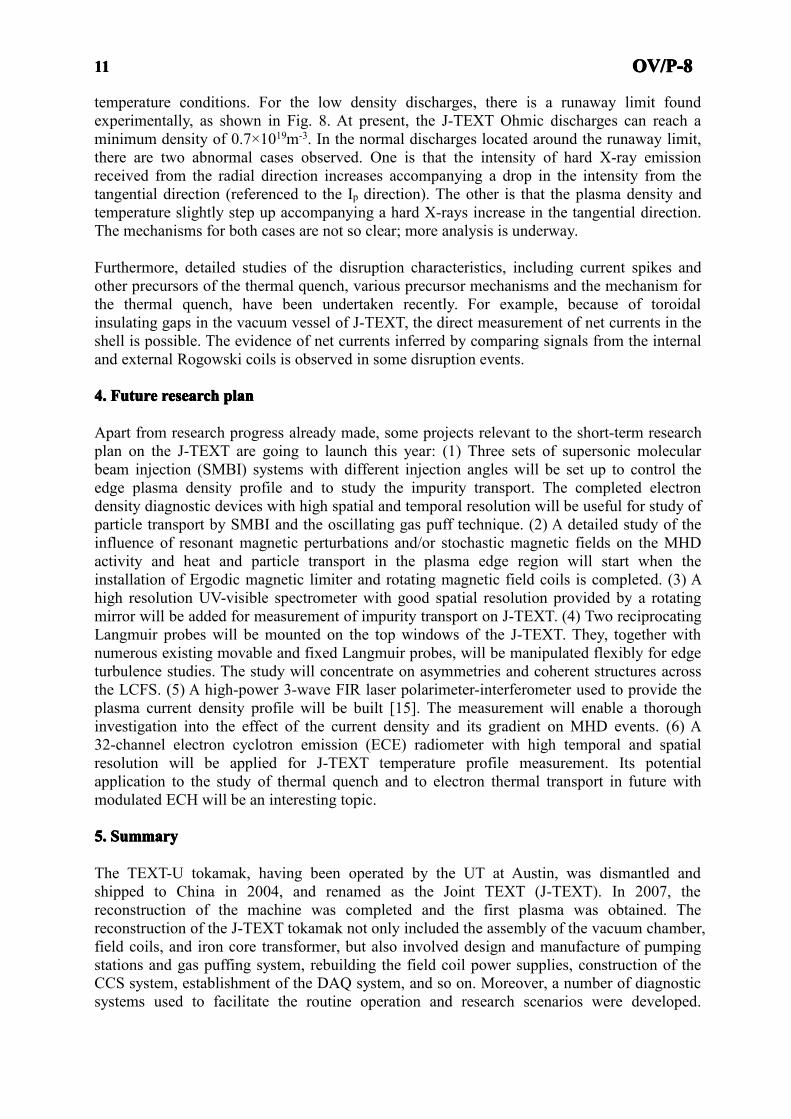