Embed Size (px)
Citation preview
The Rechargeable Battery
Market and
Main Trends 2018-2030
Director, AVICENNE ENERGY
Christophe PILLOT
May 28th, 2019
Christophe PILLOT+ 33 1 44 55 19 90
Presentation Outline• The rechargeable battery market in 2018• The Li-ion battery value chain• Li-ion battery material market• Focus on xEV batteries• Forecasts & conclusions

Christophe PILLOT+ 33 1 44 55 19 90
The Rechargeable Battery Market and Main Trends
2018 – 2030
Paris, France
May 28th, 2019
AGENDA
The market in 2018 by technology, applications & battery suppliers
Li-ion components market & value chain
xEV market in 2018
xEV forecasts up to 2030
Industrial, stationary & ESS applications 2018-2030
Rechargeable battery market forecasts up to 2030
2

Christophe PILLOT+ 33 1 44 55 19 90
The Rechargeable Battery Market and Main Trends
2018 – 2030
Paris, France
May 28th, 2019
AVICENNE ENERGY: RENOWNED TO
HAVE REALISTIC FORECASTSEV sold, in million units, worldwide, 2010 - 2020
Source : International Battery Conference, Fort Lauderdale 2007-2018 3
0
1
2
3
4
5
2010 2012 2014 2016 2018 2020
Nu
mb
er o
f EV
so
ld w
orl
dw
ide
( M
illio
n)
AAB 2012
AVICENNE 2018
ROLAND BERGER 2011
ROLAND BERGER 2012
DEUTSCHE BANK 2012
IIT (MARCH 2011)
AAB 2017
AVICENNE 2015
Christophe PILLOT+ 33 1 44 55 19 90
The Rechargeable Battery Market and Main Trends
2018 – 2030
Paris, France
May 28th, 2019
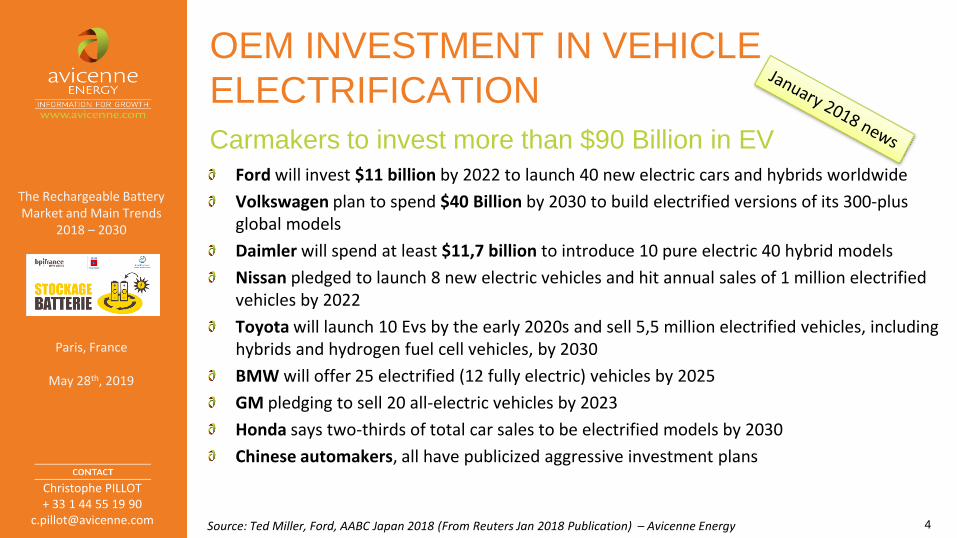
OEM INVESTMENT IN VEHICLE
ELECTRIFICATION
Ford will invest $11 billion by 2022 to launch 40 new electric cars and hybrids worldwide
Volkswagen plan to spend $40 Billion by 2030 to build electrified versions of its 300-plus global models
Daimler will spend at least $11,7 billion to introduce 10 pure electric 40 hybrid models
Nissan pledged to launch 8 new electric vehicles and hit annual sales of 1 million electrifiedvehicles by 2022
Toyota will launch 10 Evs by the early 2020s and sell 5,5 million electrified vehicles, includinghybrids and hydrogen fuel cell vehicles, by 2030
BMW will offer 25 electrified (12 fully electric) vehicles by 2025
GM pledging to sell 20 all-electric vehicles by 2023
Honda says two-thirds of total car sales to be electrified models by 2030
Chinese automakers, all have publicized aggressive investment plans
4
Carmakers to invest more than $90 Billion in EV
Source: Ted Miller, Ford, AABC Japan 2018 (From Reuters Jan 2018 Publication) – Avicenne Energy

Christophe PILLOT+ 33 1 44 55 19 90
The Rechargeable Battery Market and Main Trends
2018 – 2030
Paris, France
May 28th, 2019
CARMAKERS TO INVEST MORE THAN $300 BILLION IN EV
5Source: Reuters January 2019, Avicenne Energy
91
42
20
15
14
11
10
10
10
10
8
8
7
7
6
6
5
5
5
3,9
2,5
2,3
0,9
0,8
0,7
0,5
0,4
0,3
0,3
0 50 100
VolkswagenDaimlerHyundai
ChanganToyota
FordFiat Chrysler
NissanRenault
TeslaGM
Great Wall (China)BMWGAC
JACMahindra (India):
GeelySAIC
DongfengBYD
BAICJaguar Land Rover
Tata (India)PSA
VolvoHondaCheryFAW
Mazda

Christophe PILLOT+ 33 1 44 55 19 90
The Rechargeable Battery Market and Main Trends
2018 – 2030
Paris, France
May 28th, 2019
WORLDWIDE BATTERY MARKET
OVERVIEW
6Source: AT Kearney, Duracell, AVICENNE ENERGY 2019
(1) Non rechargeable – Source: AT Kearney, Duracell, Avicenne – Based on selling price from manufacturer to retailer
69 75 81
12,513
14
2016 2017 2018
Battery market in value (2016-2018, global, $bn, all market segments, all technologies)
Expected CAGR 18-30 (%)
+8%
~ +2-3 %
+7-9%
8288
(1)
Primary
Rechargeable
95

Christophe PILLOT+ 33 1 44 55 19 90
The Rechargeable Battery Market and Main Trends
2018 – 2030
Paris, France
May 28th, 2019
THE BATTERY MARKET IS REALLY
DYNAMIC
0
500
1000
1500
2000
2000 2018
Mill
ion
Un
its
/ ye
ar
Cellular Phones sold per Year (Million)
Li-ion
NiMH
164 MPortable PCs
155 M Tablets
0
100
200
300
400
2000 2018
Mill
ion
Un
its/
Ye
ar
Portable PC sold per Year (Million)
2,6
< 0,15
0
1
2
3
2000 2018
$/W
h
Li-ion 18650 cell price ($/Wh)
7 000
> 340 000
0
100000
200000
300000
400000
2000 2018
Ton
s
Tons of cathode active materials
Source: AVICENNE ENERGY, 2019 7

Christophe PILLOT+ 33 1 44 55 19 90
The Rechargeable Battery Market and Main Trends
2018 – 2030
Paris, France
May 28th, 2019
0
100 000
200 000
300 000
400 000
500 000
600 000
700 000
MW
h
Others (Flow battery, NAS, …)Li-ion
NiMH
NiCD
Lead Acid
0
50 000
100 000
150 000
200 000
250 000
300 000
350 000
400 000M
Wh
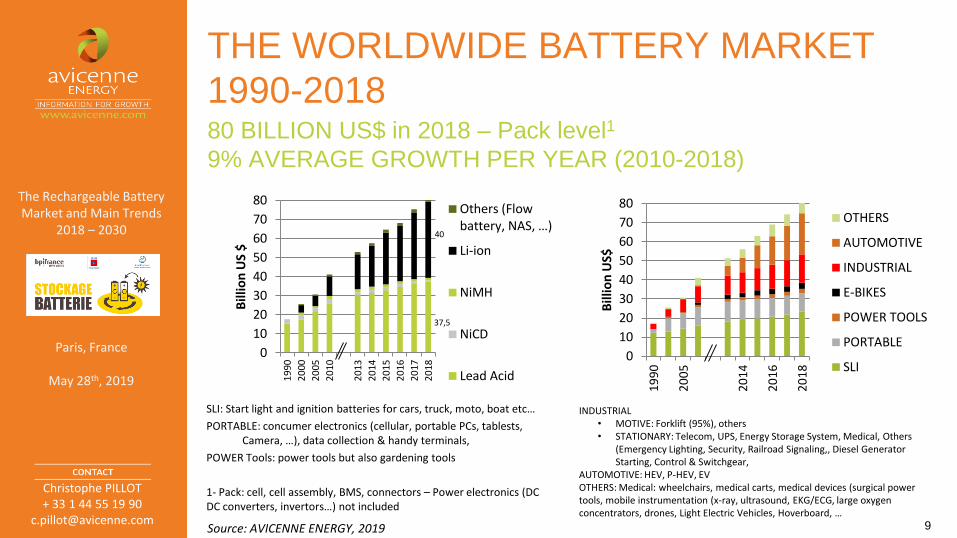
THE WORLDWIDE BATTERY MARKET
1990-2018Lithium Ion Battery: Highest growth & major part of the investments
Lead acid batteries: By far the most important market (>70% market share)
Source: AVICENNE ENERGY, 2019 8
Christophe PILLOT+ 33 1 44 55 19 90
The Rechargeable Battery Market and Main Trends
2018 – 2030
Paris, France
May 28th, 2019
THE WORLDWIDE BATTERY MARKET
1990-2018
37,5
40
0
10
20
30
40
50
60
70
80
19
90
20
00
20
05
20
10
20
13
20
14
20
15
20
16
20
17
20
18
Bill
ion
US
$
Others (Flow battery, NAS, …)
Li-ion
NiMH
NiCD
Lead Acid
80 BILLION US$ in 2018 – Pack level1
9% AVERAGE GROWTH PER YEAR (2010-2018)
0
10
20
30
40
50
60
70
80
19
90
20
05
20
14
20
16
20
18
Bill
ion
US$
OTHERS
AUTOMOTIVE
INDUSTRIAL
E-BIKES
POWER TOOLS
PORTABLE
SLI
SLI: Start light and ignition batteries for cars, truck, moto, boat etc…
PORTABLE: concumer electronics (cellular, portable PCs, tablests, Camera, …), data collection & handy terminals,
POWER Tools: power tools but also gardening tools
1- Pack: cell, cell assembly, BMS, connectors – Power electronics (DC DC converters, invertors…) not included
INDUSTRIAL• MOTIVE: Forklift (95%), others• STATIONARY: Telecom, UPS, Energy Storage System, Medical, Others
(Emergency Lighting, Security, Railroad Signaling,, Diesel Generator Starting, Control & Switchgear,
AUTOMOTIVE: HEV, P-HEV, EVOTHERS: Medical: wheelchairs, medical carts, medical devices (surgical power tools, mobile instrumentation (x-ray, ultrasound, EKG/ECG, large oxygen concentrators, drones, Light Electric Vehicles, Hoverboard, …
Source: AVICENNE ENERGY, 2019 9

Christophe PILLOT+ 33 1 44 55 19 90
The Rechargeable Battery Market and Main Trends
2018 – 2030
Paris, France
May 28th, 2019
THE WORLDWIDE BATTERY MARKET
IN 2018: US $ +80 BILLION
0
10 000
20 000
30 000
40 000
50 000
60 000
70 000
80 000
90 000EV, E-Bus
Portable
SLI
Others
ESS
UPS
Telecom
Other Motive
Forklift
Power Tools
E-Bikes
1- Pack level: Pack including cells, cells assembly, BMS, connectors – Power electronics (DC DC converters, invertors…) not included
0
2 000
4 000
6 000
8 000
10 000
12 000
14 000
16 000
18 000
Lead Acid LIB Others
Others
ESS
UPS
Telecom
Other Motive
Forklift
Power Tools
E-Bikes
US $ 27
Billion for
“other”
applications
Source: AVICENNE ENERGY, 2019 10

Christophe PILLOT+ 33 1 44 55 19 90
The Rechargeable Battery Market and Main Trends
2018 – 2030
Paris, France
May 28th, 2019
THE WORLDWIDE BATTERY MARKET
1990-2018
11Source: AVICENNE ENERGY, 2019
Lead Acid Batteries 2018
420 GWh for > US $ 37 Billion
75%
17%3%4%
1%
SLI
Industry, ESS
E-bikes
LSEV
Others
22%
20%
13%
45%
Telecom
UPS
OtherStationary, ESS
Motive
Industrial Batteries – Lead acid batteries
69 GWh for US $ 11 Billion
% In volume
% In volume
medical, marine, others…
In volume (MWh)
0
100 000
200 000
300 000
400 000
500 000
600 000
700 000
MW
h
Others (Flow battery, NAS, …)Li-ion
NiMH
NiCD
Lead Acid

Christophe PILLOT+ 33 1 44 55 19 90
The Rechargeable Battery Market and Main Trends
2018 – 2030
Paris, France
May 28th, 2019
LI-ION IN 2018 - MAIN APPLICATIONS
12
(1) Cell levelOthers: medical devices, power tools, gardening tools, e-bikes…Source: AVICENNE Energy 2019
>160 000 MWh - 31 B$ (1) CAGR 2008/2018
+24 % per year in Volume
-
20 000
40 000
60 000
80 000
100 000
120 000
140 000
160 000
180 000
200
020
01
200
220
03
200
420
05
200
620
07
200
820
09
201
020
11
201
220
13
201
420
15
201
620
17
201
8
M W
h
Li-ion Battery sales,MWh, Worldwide, 2000-2017
Others
Industrial,ESS
Auto, E-busChina
Auto, e-busExcl. China
Electronicdevices
Phones17%
Portable PC66%
Portable Electronics
17%
2000: < 2GWh
2018: 160 GWh
Electronic devices
20%
Auto, E-bus Excl. China
20%
Auto, E-bus China44%
Industrial, ESS5%
Others11%

Christophe PILLOT+ 33 1 44 55 19 90
The Rechargeable Battery Market and Main Trends
2018 – 2030
Paris, France
May 28th, 2019
LIB: THE BIGGEST PART OF THE COST
IS RAW MATERIALSRAW MATERIALS ACCOUNT FOR 60 TO 70% OF LIB CELLS BUSINESS
RAW MATERIAL COST IMPACT DRASTICALY ON THE BATTERY MAKERS PROFIT
13
Note: Average mix of cylindrical, prismatic & laminate cells
0%
10%
20%
30%
40%
50%
60%
70%
80%
90%
100%P
rod
uct
ion
co
st
LIB Cost structure for TESLA & 40 Ah EV pouch cell NMC
Depreciation
SGA, overhead
R&D
Utility
Labor
Material
Cathode cost27%
Anode cost7%
Electrolyte6%
Separator5%
Other materials
19%
Depreciation15%
Direct labor2%
Energy, utilities
5%
R&D6%
Sales & Adm3%
Warranty5%
Average cost structure of Li-ion cell
Sources: AVICENNE ENERGY 2019

Christophe PILLOT+ 33 1 44 55 19 90
The Rechargeable Battery Market and Main Trends
2018 – 2030
Paris, France
May 28th, 2019
LI-ION VALUE CHAIN – MARKET DEMAND
14
CATHODE270 OOO T in 2017
2018: 345 000 Tons
Revenues: 7,2 B$
CAGR 08/18: +13%
ANODE170 000 T in 2017
2018: 220 000 Tons
Revenues: 1,8 B$
CAGR 08/18: +19%
ELECTROLYTE145 000 T in 2017
2018: 190 000
Revenues: 2 B$
CAGR 08/18 : 25%
SEPARATOR2 000 M m² in 2017
2018: 2500 M m²
Revenues: 1,9 B$
CAGR 08/18 : 15%
CELL
MANUFACTURERS
Revenues 2018:
27 B$
Margin: < 0% (!)
ANCILLARY
Revenues: 2,6 B$
2018: 3 B$
PACK
MANUFACTURERS
Revenues 2018:
35 B$
Sources: AVICENNE ENERGY 2019
Christophe PILLOT+ 33 1 44 55 19 90
The Rechargeable Battery Market and Main Trends
2018 – 2030
Paris, France
May 28th, 2019
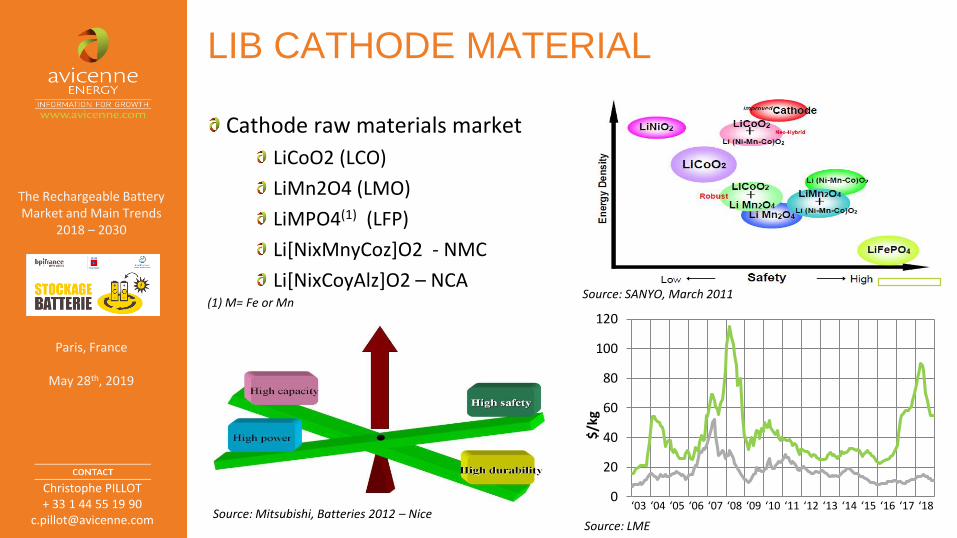
LIB CATHODE MATERIAL
Cathode raw materials market
LiCoO2 (LCO)
LiMn2O4 (LMO)
LiMPO4(1) (LFP)
Li[NixMnyCoz]O2 - NMC
Li[NixCoyAlz]O2 – NCASource: SANYO, March 2011
(1) M= Fe or Mn
Source: LMESource: Mitsubishi, Batteries 2012 – Nice
‘03 ‘04 ‘05 ‘06 ‘07 ‘08 ‘09 ‘10 ‘11 ‘12 ‘13 ‘14 ‘15 ‘16 ‘170
20
40
60
80
100
120
$/k
g
‘18

Christophe PILLOT+ 33 1 44 55 19 90
The Rechargeable Battery Market and Main Trends
2018 – 2030
Paris, France
May 28th, 2019
NEW ENTRANTS ON THE FIELD:
CATHODE ACTIVE
MATERIALS NEEDSCathode active materials for LIB in Tons, 2010-
2018 (Demand)
(…)
LEADERS:
-
50 000
100 000
150 000
200 000
250 000
300 000
350 000
400 000
20
10
20
11
20
12
20
13
20
14
20
15
20
16
20
17
20
18
Ton
sLFP
LMO
NCA
NMC
LCO
Rationales
In 2018, LCO is used in pouch cells for electronic devices: smartphones, tablets, ultra thin portable PCs
NMC is used in other electronic devices & xEV
NCA is used by 18650 & 27100 Panasonic cells in Tesla cars and as a blend with LMO in other xEV
LMO is mostly used as a blend with NMC in xEV
LFP is used in xEV, e-buses in China and for industrial applications
16
67 000
> 345 000

Christophe PILLOT+ 33 1 44 55 19 90
The Rechargeable Battery Market and Main Trends
2018 – 2030
Paris, France
May 28th, 2019
CATHODE ACTIVE MATERIAL
FORECASTS 2000-2030Cathode active materials
2000-2030 - Tons
Cathode active materials in 2018
350 000 Tons
17
ASSUMPTIONS:
Portable devices:2017-2030: +4% per year in volume
HEV: 4,3 M HEV/year in 2020, 11 M HEV in 2025 & 24 M in 2030
P-HEV: 0,8 M P-HEV/year in 2020, 2,3 M in 2025 & 5 M in 2030
EV: 2,2 M EV/year in 2020 (1,4 M in China) / 5,4 M/year in 2025 (3 M in China) 100% LIB, 12 M EV in 2030 (> 5 M in China)
Industrial, stationary & other applications 2016-2030: +15% per year in volume
Assumption: Tesla keep NCA chemistry and have a relative success (+600 000 EV sold per year in 2030 – TESLA forecast 500 000 in 2025)
LCO11%
NMC41%
NCA9%
LMO5%
LFP34%
Cathode active materials in 2030
1 670 000 Tons
LCO2%
NMC87%
NCA6%
LFP5%
0%
10%
20%
30%
40%
50%
60%
70%
80%
-
200 000
400 000
600 000
800 000
1 000 000
1 200 000
1 400 000
1 600 000
1 800 000
20
00
20
05
20
10
20
15
20
18
20
20
20
25
20
30
Ton
s
LCO NMC NCA LMO LFP China (%)
Sources: AVICENNE ENERGY 2019

Christophe PILLOT+ 33 1 44 55 19 90
The Rechargeable Battery Market and Main Trends
2018 – 2030
Paris, France
May 28th, 2019
HEV WORLDWIDE IN 2018
2,5 M HEVHEV sold per year, M units, worldwide,
2000 - 2018
Penetration of hybrids in the global sales,
2000-2018
18Source: TOYOTA, HONDA, NISSAN, FORD, GM, HYUNDAI, MERCEDES, GM, BMW, VW, PORSCHE… Compilation AVICENNE ENERGYMicro hybrid not included
0,0
0,5
1,0
1,5
2,0
2,5
3,0
20
00
20
01
20
02
20
03
20
04
20
05
20
06
20
07
20
08
20
09
20
10
20
11
20
12
20
13
20
14
20
15
20
16
20
17
20
18
Mill
ion
TOYOTA OTHERS
USA
JAPON
EUROPE0%
10%
20%
30%
20
00
20
01
20
02
20
03
20
04
20
05
20
06
20
07
20
08
20
09
20
10
20
11
20
12
20
13
20
14
20
15
20
16
20
17
20
18
Pe
ne
trat
ion
of
HEV
Growth 2017-2018: +9%From 2,3 M to 2,5 M HEV
Gazoline price impact on HEV market in
the US
0
1
2
3
4
0
200000
400000
600000
20
05
20
06
20
07
20
08
20
09
20
10
20
11
20
12
20
13
20
14
20
15
20
16
20
17
Gas
olin
e$
/ G
allo
n
HEV
sal
es p
er y
ear

Christophe PILLOT+ 33 1 44 55 19 90
The Rechargeable Battery Market and Main Trends
2018 – 2030
Paris, France
May 28th, 2019
PHEV SOLD WORLDWIDE > 535 000 IN 2018
World excl. China growth +18%
Chinese Growth + 100%
China is leading the P-HEV
market thanks to high incentives
19Source: AVICENNE ENERGY Analysis, 2019
0
100000
200000
300000
400000
500000
600000
20
10
20
11
20
12
20
13
20
14
20
15
20
16
20
17
20
18
P-H
EV (
un
its)
OTHERS
CHINA
EUROPE
US
+37%
US22%
EUROPE32%
CHINA35%
Others11%
USA (+40%)
Japan (-30%)
Europe (+25%)
China (+100%)
Others
-
20 000
40 000
60 000
80 000
100 000
120 000
140 000
160 000
180 000
200 000
2012 2013 2014 2015 2016 2017 2018
P-H
EV (
un
its)

Christophe PILLOT+ 33 1 44 55 19 90
The Rechargeable Battery Market and Main Trends
2018 – 2030
Paris, France
May 28th, 2019
0
200000
400000
600000
800000
1000000
1200000
1400000
1600000
20
10
20
11
20
12
20
13
20
14
20
15
20
16
20
17
20
18
EV (
un
its)
OTHERS
CHINA
EUROPE
US
EV SOLD WORLDWIDE> 1,4 M IN 2018World excl. China growth > 65%
Chinese Growth > 65%
China is leading the EV market
thanks to high incentives
20Source: AVICENNE ENERGY Analysis, 2019
> 65%
US17%
EUROPE16%
CHINA63%
OTHERS4%
USA (+130%)
Japan (+50%)
Europe (+30%)
China (+70%)
-
100 000
200 000
300 000
400 000
500 000
600 000
700 000
800 000
900 000
1 000 000
2012 2013 2014 2015 2016 2017 2018EV
(u
nit
s)

Christophe PILLOT+ 33 1 44 55 19 90
The Rechargeable Battery Market and Main Trends
2018 – 2030
Paris, France
May 28th, 2019
LI-ION BATTERY: MARKET SHARE IN
2018 WORLDWIDE
The worldwide Li-ion battery market
Company market share in 2018 in volume
(small cells only) 8,2 B cells
21
Others for Small cells: Chinese suppliers like Tenpower, DLG…
(1) LIB battery pack market
Source: AVICENNE ENERGY Analyses 2019
The worldwide Li-ion battery market
Company market share in 2018 in value(1)
Estimated at B$ 40 in 2018
17%
8%
15%
14%7%2%
11%
7%
12%6%
8%
9%
10%
4%
4%6%
LISHEN2%
BAK1%
AESC1%
First New Energy
3%
YUASA2%
6%
COSLIGHT1%
Microvast2%
CALB2%
A123 Wanxiang
1%
Optimum3%
Zhuoneng2%
OTHERS29%
Others Auto

Christophe PILLOT+ 33 1 44 55 19 90
The Rechargeable Battery Market and Main Trends
2018 – 2030
Paris, France
May 28th, 2019
CHINESE XEV BATTERY SHIPMENTS
22
Top 4 (CATL, BYD, GXGK, Lishen) delivered 67% of xEV batteries
Only 3-4 companies are able to order 8000 Tons of cathode
Source: IEK, ITRI, Shenzhen, May 2019
Christophe PILLOT+ 33 1 44 55 19 90
The Rechargeable Battery Market and Main Trends
2018 – 2030
Paris, France
May 28th, 2019
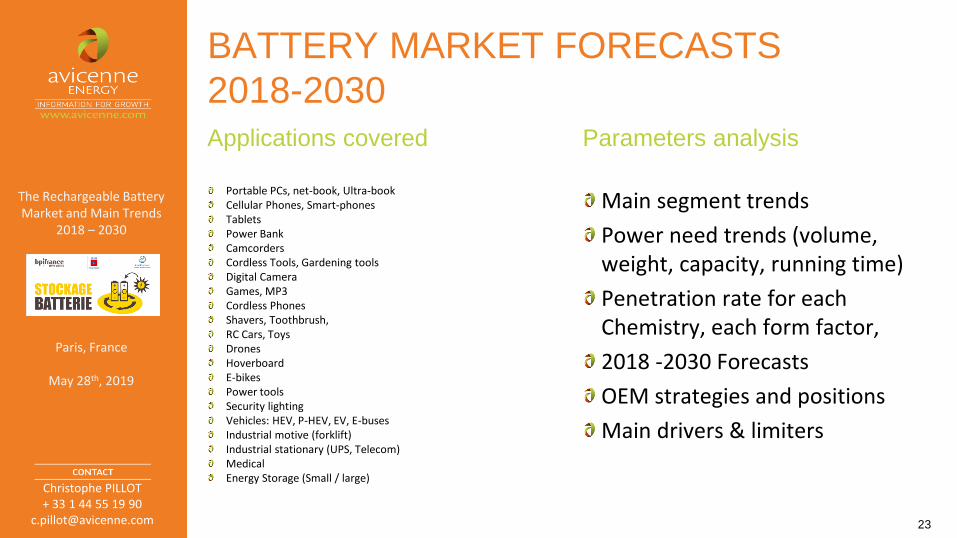
BATTERY MARKET FORECASTS
2018-2030
Portable PCs, net-book, Ultra-bookCellular Phones, Smart-phonesTabletsPower BankCamcordersCordless Tools, Gardening toolsDigital CameraGames, MP3Cordless PhonesShavers, Toothbrush, RC Cars, ToysDronesHoverboardE-bikesPower toolsSecurity lightingVehicles: HEV, P-HEV, EV, E-busesIndustrial motive (forklift)Industrial stationary (UPS, Telecom)MedicalEnergy Storage (Small / large)
Applications covered Parameters analysis
23
Main segment trends
Power need trends (volume, weight, capacity, running time)
Penetration rate for each Chemistry, each form factor,
2018 -2030 Forecasts
OEM strategies and positions
Main drivers & limiters

Christophe PILLOT+ 33 1 44 55 19 90
The Rechargeable Battery Market and Main Trends
2018 – 2030
Paris, France
May 28th, 2019
2030 LIB FORECASTS FOR PORTABLE
ELECTRONIC DEVICES2000-2030 LIB market, MWh, by
application (3C)
2000-2025 LIB market, M cells,
by form factor (3C)
24
0
1000
2000
3000
4000
5000
6000
2000 2005 2010 2015 2020 2025
M c
ells
/yea
r
Li-Pouch Li-ion Pr
Li-ion Cyl Takeshita - March 2013 (1)
(1) Source: Takeshita, Battery Japan 2013 BJ-3 conference Slide p 4Source: AVICENNE ENERGY Analyses
CAGR 17-30: + 4%
0
10000
20000
30000
40000
50000
60000
20
00
20
05
20
10
20
15
20
18
20
20
20
25
20
30
MW
h
Other PortableElectronics
Tablets
Portable PCs
Cellular Phones

Christophe PILLOT+ 33 1 44 55 19 90
The Rechargeable Battery Market and Main Trends
2018 – 2030
Paris, France
May 28th, 2019
TIME TO MARKET FOR NEW MATERIALS
IN LIB INDUSTRY
The research and development in this industry is very long and time consuming. Time to market to commercialize a new material is long. Remember that the first Li-ion battery was launched by Sony in 1991 with LCO cathode, graphite, LiPF6 electrolyte & polyolefin membrane. It was 27 years ago.LTO was invented by Matsushita in 1993 (25 years ago) Lithium iron phosphate was invented in 1995 (23 years ago). So, it takes between 10 & 20 years to commercialize a new material in the battery industry.
25

Christophe PILLOT+ 33 1 44 55 19 90
The Rechargeable Battery Market and Main Trends
2018 – 2030
Paris, France
May 28th, 2019
SAFETY ISSUES
26
Li-ion and LMP are not thermally stable what raises serious safety
concernsIn the 80’s, lithium metal batteries were put into the markets (Moli Energy). Their further development has for a long time been slow because of a low cycle efficiency and safety issues: High chemical reactivity and a low melting point enable strong chemical reactions, even explosions. In the charging-discharging process, lithium metal can form dendrite and accumulate on electrodes. The growing lithium dendrite could puncture the separator and result in an internal short circuit.Except BOLLORE, all the companies developing Li metal batteries cancelled their projectsB
ac
kg
rou
nd
Mo
bile
Li-ion batteries for mobile devices mostly used a Lithium Cobalt Oxide Cathode and liquid
electrolyte.
In case of overcharging or short-circuit (contact between anode & cathode) a chain reaction
starts -> heating & gasing -> fire (“Thermal runaway”)
In 2006, SONY had to recall millions of portable PCs for total costs of 400 million USD, more
than there profit-to-date
Au
tom
oti
ve
Air
cra
ft
Boing 787: The fire that burned near the tail of a parked Boeing 787 in Boston was caused
by an overheating Lithium ion battery pack. The battery fire could have been hot enough to
melt the carbon-fiber reinforced plastic that makes up the plane’s shell.
CONSEQUENCES: All the 787 worldwide are grounded. Considerable losses for Boing.
With new cathode chemistry, most of the automotive today on the markets experienced safety concerns: (1) BYD Taxi in China with a lithium iron phosphate cathode (2) GM Volt in the US with a LG Chemical battery using LMO cathodes (as a result of a crashed tested Chevrolet Volt caught three weeks after the testing !) (3) PRIUS P-HEV in the US (converted from HEV Prius by a local engineering company without any authorisation by Toyota)
Source: AVICENNE ENERGY

Christophe PILLOT+ 33 1 44 55 19 90
The Rechargeable Battery Market and Main Trends
2018 – 2030
Paris, France
May 28th, 2019
LI-ION BATTERY COST
2018-2025LIB cell average cost (40 Ah pouch)
(EV design ; NMC622 cathode)
LI-ION BATTERY PACK COST FOR
EV
27* For Production > 100 000 packs/year(1) Active materials only
2020 20252018
0
50
100
150
200
250
Ce
ll
Pac
k
Ce
ll
Pac
k
Ce
ll
Pac
k
$ /
kW
h
Pack Cost
CellManufacturing
Other Materials
Separator
Electrolyte
Anode
Cathode-50
0
50
100
150
200
250
300
350
400
450
2010 2018 2020 2025
$ /
kW
hMargin
Warranty
Overheads
Sales & Adm
R&D
Energy, utilities
Direct labor
Depreciation
Scraps
Others
Separator
Electrolyte
Anode (1)
Cathode (1)
Source: AVICENNE ENERGY 2019

Christophe PILLOT+ 33 1 44 55 19 90
The Rechargeable Battery Market and Main Trends
2018 – 2030
Paris, France
May 28th, 2019
0,08 0,2 0,40,9
1,5
0,30,5
0,8
2,5
6,0
0
1
2
3
4
5
6
7
8
20
10
20
15
20
18
20
20
20
25
20
30
Mill
ion
car
s
HEV, P-HEV, EV 2030 FORECASTS
28HEV: 1kWh battery / car
HEV manufactured PHEV manufactured
11,7
3,6
6,4
0,5
0,9
2,9
7,4
0
10
20
30
40
50
60
70
0
2
4
6
8
10
12
14
16
20
10
20
15
20
18
20
20
20
25
20
30
kWh
/ P
ack
Mill
ion
car
s
EV manufactured
1,1 2,2 3,45,2
14,0
29,0
0%
10%
20%
30%
40%
50%
60%
70%
80%
90%
100%
0
5
10
15
20
25
30
35
20
10
20
15
20
18
20
20
20
25
20
30
% L
i-io
n H
EV
Mill
ion
car
s
0,7
1,2
7,5
PHEV: 12 kWh battery / car
1
6,5
13,8
China
World Excl.China
World Excl.China
China
World Excl.China
Realistic Scenario
3,4
2,6
Christophe PILLOT+ 33 1 44 55 19 90
The Rechargeable Battery Market and Main Trends
2018 – 2030
Paris, France
May 28th, 2019
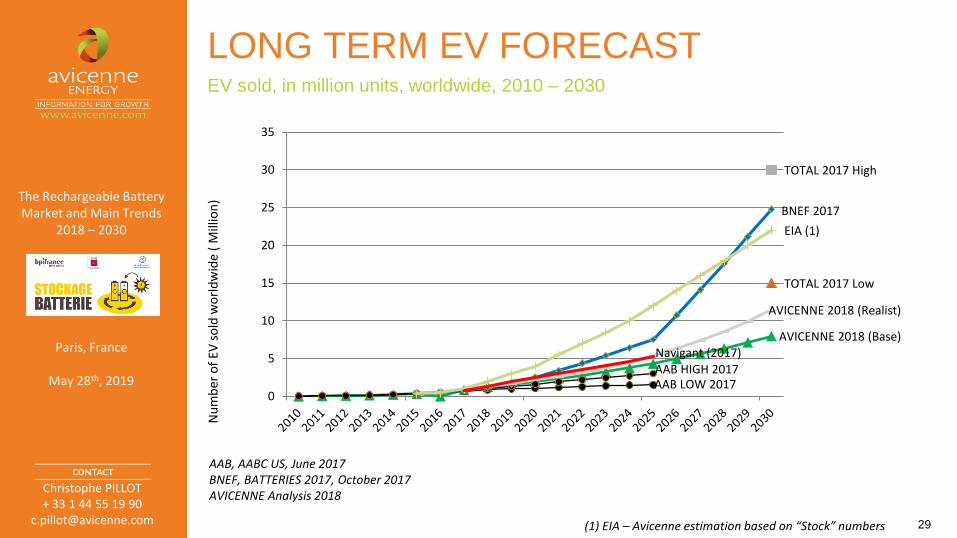
LONG TERM EV FORECAST
29(1) EIA – Avicenne estimation based on “Stock” numbers
EV sold, in million units, worldwide, 2010 – 2030
AAB, AABC US, June 2017BNEF, BATTERIES 2017, October 2017AVICENNE Analysis 2018
AVICENNE 2018 (Base)
BNEF 2017
TOTAL 2017 High
TOTAL 2017 Low
EIA (1)
AVICENNE 2018 (Realist)
Navigant (2017)
0
5
10
15
20
25
30
35
Nu
mb
er o
f EV
so
ld w
orl
dw
ide
( M
illio
n)
AAB HIGH 2017AAB LOW 2017

Christophe PILLOT+ 33 1 44 55 19 90
The Rechargeable Battery Market and Main Trends
2018 – 2030
Paris, France
May 28th, 2019
TOTAL BATTERY DEMAND FOR XEV
2030 FORECASTS
30
Li-ion for EV, HEV & P-HEV Battery
needs (MWh)
CAGR 2015-2030: +26%
0
200000
400000
600000
800000
1000000
1200000
2010 2015 2020 2025 2030
M W
h
12-48 volts SLI HEV PHEVEV EV & PHEV China E-busE-bus excl. China
Li-ion for EV, HEV & P-HEV Battery
needs (M$)
CAGR 2015-2030: +18%
-
20 000
40 000
60 000
80 000
100 000
120 000
140 000
2010 2015 2020 2025 2030
M $
12-48 volts SLI HEV PHEV
EV EV & PHEV China E-bus China
E-Bus excl. China

Christophe PILLOT+ 33 1 44 55 19 90
The Rechargeable Battery Market and Main Trends
2018 – 2030
Paris, France
May 28th, 2019
LITHIUM ION CELL PRODUCTION
31
China – 60%USA – 2%
EU -<1%
Japan – 17%
Korea – 15%
PanasonicNECMaxellPEVEYUASA
SAFTFIAMM
BOLLORE
SAMSUNGLGSKIKokam
CATLBYD
Optinum NanoHefei Guoxuan
BAKLISHEN
FARASISEVE
Wanxiang (A123)Coslight
LGSAMSUNG
PANASONIC…
LGJohnson-Controls
EnersysSAFT
…TESLA
SAMSUNGLG
Others* – 5%
Source: AVICENNE 2019
* OTHERS: Malaysia mostly
$ 5 Bn35 GWh2019
$ 562 M3-5 GWh2018
$ 5 Bn34 GWh2028
$ 360 M2-3 GWh2018
$ 5 Bn32 GWh2023
122 162
191
247 297
350
0%
20%
40%
60%
80%
100%
-
100
200
300
400
2015 2016 2017 2018 2019 2020
Pro
du
ctio
n R
atio
(%
)
Pro
d. C
apac
ity
MW
h
Production Capacity
Demand
Production Ratio
790 M$7,5 GWh2020
$ 282 M14 GWh2022
25 GWhSolid State ?2024-2025
EUROPE
European market demand
150 GWh in 2025
$ 1 Bn?

Christophe PILLOT+ 33 1 44 55 19 90
The Rechargeable Battery Market and Main Trends
2018 – 2030
Paris, France
May 28th, 2019
LI-ION BATTERY MARKET FORECASTS
32
Others: medical devices, power tools, gardening tools, e-bikes…
Source: AVICENNE Energy 2019
From 160 GWh in 2018 to >1,2 TWh CAGR 2015/2030
+20 % per year in Volume
2018: >160 GWh
2030: 1200 GWh
Electronic devices
5%
Auto, E-bus Excl. China47%
Auto, E-bus China38%
Industrial, ESS3%
Others7%
CAGR 15/30(Optimistic)
-
200 000
400 000
600 000
800 000
1 000 000
1 200 000
2000
2005
2010
2015
2020
2025
2030
M W
h
Li-ion Battery sales,MWh, Worldwide, 2000-2030
Others
Industrial, ESS
Auto, E-bus China
Auto, e-bus Excl.China
Electronic devices
14%
18%
24%
29%
4%
Electronic devices
20%
Auto, E-bus Excl. China
20%
Auto, E-bus China44%
Industrial, ESS5%
Others11%

Christophe PILLOT+ 33 1 44 55 19 90
The Rechargeable Battery Market and Main Trends
2018 – 2030
Paris, France
May 28th, 2019
TAKEAWAYS
33
Others: Automatic handling equipment, robots, forklifts, back-up, UPS, Telecom, medical devices, Residential ESS, Grid ESS, drones, Hoverboard……
Li-ion battery is driven today by Automotive: 1% of the automotive market consume 60% of the LIB
In 2012, most of the car makers (except Toyota) switch to Li-ion for HEV
P-HEV, EV and E-buses will be powered by Li-ion: 18 B$ market in 2017 - 36 B$ in 2020 & 75 B$ in 2030 with high numbers in China (2017: US$5 Billion for xEV and US$ 4 Billion for xE-Buses)
EV expectations attract large Chemical companies
New materials are needed to meet Automotive standards
HEV will account for 4% of the auto sales in 2020
P-HEV & EV for 2-3% by 2020
Micro-hybrid will achieve >50% in 2020/25
Lead acid battery will be the first market in 2025 in volume, but Li-ion market (US$ 40 Bn) will be higher than Lead acid in value in 2018 (US$ 38 Bn)
A very small EV market in the automotive world will represent a huge market for batteries
New LIB applications: UPS, Telecom, Forklift, Medical, Residential ESS, Grid ESS, hoverboard, drones: CAGR > 10% in the next 15 years
Lithium battery for other application (ESS, stationary, industrial…) will reach 10 Billion $ market at the pack level in the next 5 years
ESS market could be much more important if the price of LIB at the system level is under 150 $/kWh
RECHARGEABLE BATTERY MARKET
WORLDWIDE 2000-2025 (base scenario)
2005 2010 2015 2020 2025 2030
GW
h
Others
LIB
NiMH
NiCd
Lead Acid
2000 2005 2010 2015 2020 2025 2030Lead Acid (+5%) NiCd (-6%)NiMH (-7%) LIB for 3C (-1%)LIB for xEV (+19%) LIB for Others* (+12%)
25B$30B$
65 B$
100 B$
170 B$
210325
1000 GWh
1 500 GWh
27
8
57
(CAGR 2015-2025)
75
(Pack level)
43B$
440
Battery Market 2015-2030 - CAGR = +7% / Li-ion>+10%
725
140 B$

Christophe PILLOT+ 33 1 44 55 19 90
The Rechargeable Battery Market and Main Trends
2018 – 2030
Paris, France
May 28th, 2019
THANK YOU
Christophe PILLOT
AVICENNE ENERGY
Phone: +33 1 44 55 19 90
Mobile: + 33 6 88 82 79 49
34