Embed Size (px)
Citation preview
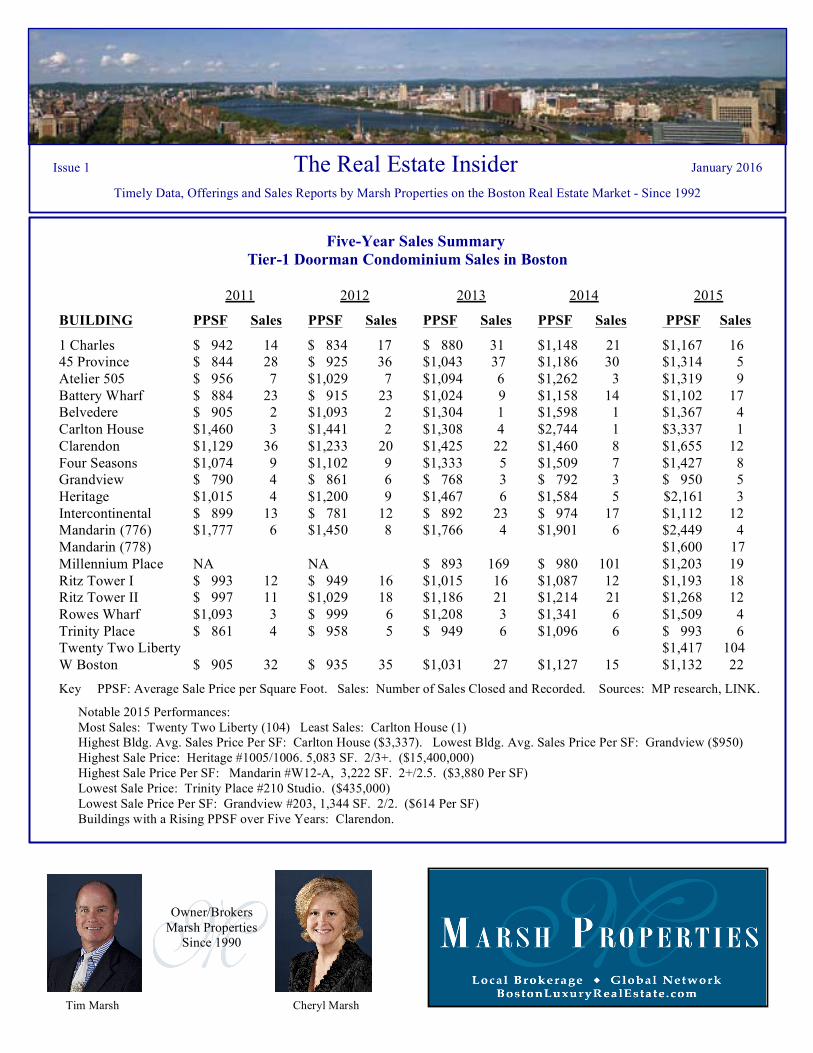
Issue 1 The Real Estate Insider January 2016 Timely Data, Offerings and Sales Reports by Marsh Properties on the Boston Real Estate Market - Since 1992
Owner/Brokers Marsh Properties
Since 1990
Tim Marsh Cheryl Marsh
Five-Year Sales Summary Tier-1 Doorman Condominium Sales in Boston
2011 2012 2013 2014 2015
BUILDING PPSF Sales PPSF Sales PPSF Sales PPSF Sales PPSF Sales
1 Charles $ 942 14 $ 834 17 $ 880 31 $1,148 21 $1,167 16 45 Province $ 844 28 $ 925 36 $1,043 37 $1,186 30 $1,314 5 Atelier 505 $ 956 7 $1,029 7 $1,094 6 $1,262 3 $1,319 9 Battery Wharf $ 884 23 $ 915 23 $1,024 9 $1,158 14 $1,102 17 Belvedere $ 905 2 $1,093 2 $1,304 1 $1,598 1 $1,367 4 Carlton House $1,460 3 $1,441 2 $1,308 4 $2,744 1 $3,337 1 Clarendon $1,129 36 $1,233 20 $1,425 22 $1,460 8 $1,655 12 Four Seasons $1,074 9 $1,102 9 $1,333 5 $1,509 7 $1,427 8 Grandview $ 790 4 $ 861 6 $ 768 3 $ 792 3 $ 950 5 Heritage $1,015 4 $1,200 9 $1,467 6 $1,584 5 $2,161 3 Intercontinental $ 899 13 $ 781 12 $ 892 23 $ 974 17 $1,112 12 Mandarin (776) $1,777 6 $1,450 8 $1,766 4 $1,901 6 $2,449 4 Mandarin (778) $1,600 17 Millennium Place NA NA $ 893 169 $ 980 101 $1,203 19 Ritz Tower I $ 993 12 $ 949 16 $1,015 16 $1,087 12 $1,193 18 Ritz Tower II $ 997 11 $1,029 18 $1,186 21 $1,214 21 $1,268 12 Rowes Wharf $1,093 3 $ 999 6 $1,208 3 $1,341 6 $1,509 4 Trinity Place $ 861 4 $ 958 5 $ 949 6 $1,096 6 $ 993 6 Twenty Two Liberty $1,417 104 W Boston $ 905 32 $ 935 35 $1,031 27 $1,127 15 $1,132 22
Key PPSF: Average Sale Price per Square Foot. Sales: Number of Sales Closed and Recorded. Sources: MP research, LINK.
Notable 2015 Performances: Most Sales: Twenty Two Liberty (104) Least Sales: Carlton House (1) Highest Bldg. Avg. Sales Price Per SF: Carlton House ($3,337). Lowest Bldg. Avg. Sales Price Per SF: Grandview ($950) Highest Sale Price: Heritage #1005/1006. 5,083 SF. 2/3+. ($15,400,000) Highest Sale Price Per SF: Mandarin #W12-A, 3,222 SF. 2+/2.5. ($3,880 Per SF) Lowest Sale Price: Trinity Place #210 Studio. ($435,000) Lowest Sale Price Per SF: Grandview #203, 1,344 SF. 2/2. ($614 Per SF) Buildings with a Rising PPSF over Five Years: Clarendon.
BostonLuxuryRealEstate.com - Your gateway to the Boston Real Estate Market From our web site you can search for any property for sale or rent by any broker in our region simply by clicking on the “MLS Property Search” tab on our home page. And remember we can show you every one of these properties, so you only have to work with one broker. Watch videos about our latest listings and each major Boston neighborhood. Learn about our services for sellers and buyers and meet our brokers. Subscribe to our Blog, find us on Facebook and Linked-In, follow us on Twitter and read the e-version of this fact-filled newsletter – The Real Estate Insider. Published since 1992, it’s full of in-depth sales and trend analysis, investment opportunities and immediate, if not advance, notice about our new listings as well as significant listings by other brokers.
NOTE: If this newsletter was passed on to and you would like us to email future issues directly to you, send your request to: [email protected] or call Tim Marsh at (C) 617-548-7145
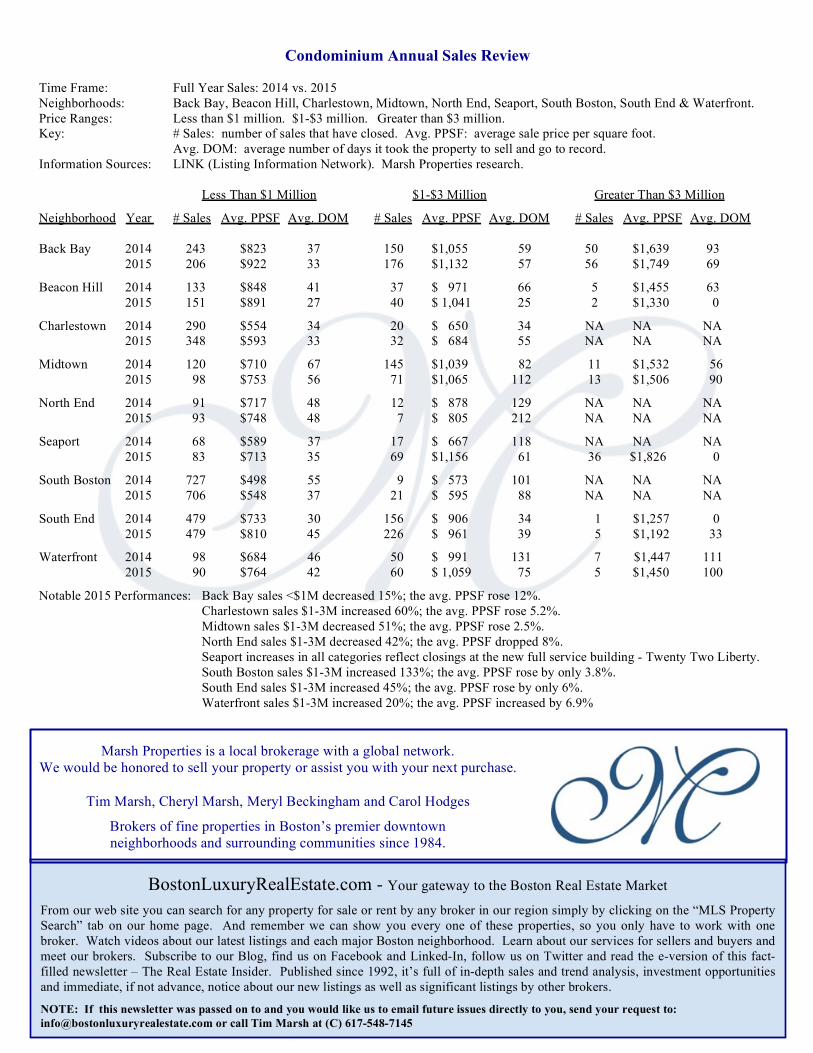
Condominium Annual Sales Review Time Frame: Full Year Sales: 2014 vs. 2015 Neighborhoods: Back Bay, Beacon Hill, Charlestown, Midtown, North End, Seaport, South Boston, South End & Waterfront. Price Ranges: Less than $1 million. $1-$3 million. Greater than $3 million. Key: # Sales: number of sales that have closed. Avg. PPSF: average sale price per square foot. Avg. DOM: average number of days it took the property to sell and go to record. Information Sources: LINK (Listing Information Network). Marsh Properties research. Less Than $1 Million $1-$3 Million Greater Than $3 Million
Neighborhood Year # Sales Avg. PPSF Avg. DOM # Sales Avg. PPSF Avg. DOM # Sales Avg. PPSF Avg. DOM Back Bay 2014 243 $823 37 150 $1,055 59 50 $1,639 93 2015 206 $922 33 176 $1,132 57 56 $1,749 69
Beacon Hill 2014 133 $848 41 37 $ 971 66 5 $1,455 63 2015 151 $891 27 40 $ 1,041 25 2 $1,330 0
Charlestown 2014 290 $554 34 20 $ 650 34 NA NA NA 2015 348 $593 33 32 $ 684 55 NA NA NA
Midtown 2014 120 $710 67 145 $1,039 82 11 $1,532 56 2015 98 $753 56 71 $1,065 112 13 $1,506 90
North End 2014 91 $717 48 12 $ 878 129 NA NA NA 2015 93 $748 48 7 $ 805 212 NA NA NA
Seaport 2014 68 $589 37 17 $ 667 118 NA NA NA 2015 83 $713 35 69 $1,156 61 36 $1,826 0
South Boston 2014 727 $498 55 9 $ 573 101 NA NA NA 2015 706 $548 37 21 $ 595 88 NA NA NA
South End 2014 479 $733 30 156 $ 906 34 1 $1,257 0 2015 479 $810 45 226 $ 961 39 5 $1,192 33
Waterfront 2014 98 $684 46 50 $ 991 131 7 $1,447 111 2015 90 $764 42 60 $ 1,059 75 5 $1,450 100
Notable 2015 Performances: Back Bay sales <$1M decreased 15%; the avg. PPSF rose 12%. Charlestown sales $1-3M increased 60%; the avg. PPSF rose 5.2%. Midtown sales $1-3M decreased 51%; the avg. PPSF rose 2.5%. North End sales $1-3M decreased 42%; the avg. PPSF dropped 8%. Seaport increases in all categories reflect closings at the new full service building - Twenty Two Liberty. South Boston sales $1-3M increased 133%; the avg. PPSF rose by only 3.8%. South End sales $1-3M increased 45%; the avg. PPSF rose by only 6%.
Waterfront sales $1-3M increased 20%; the avg. PPSF increased by 6.9%
Marsh Properties is a local brokerage with a global network. We would be honored to sell your property or assist you with your next purchase.
Tim Marsh, Cheryl Marsh, Meryl Beckingham and Carol Hodges
Brokers of fine properties in Boston’s premier downtown neighborhoods and surrounding communities since 1984.

Marsh Properties Local Brokerage w Global Network
30 Newbury St., 3rd flr., Boston, MA 02116 (B) 617-716-0240 (e-fax) 617-507-8006 Website: BostonLuxuryRealEstate.com Members: NABB, BHCA & Friends of the Public Garden Ê Principal Broker: Cheryl Marsh (email): [email protected] (C) 617-797-5781 Ê Principal Broker: Tim Marsh (email): [email protected] (C) 617-548-7145
Back Bay & Beacon Hill Single Family Home
2015 Sales Review
BACK BAY Address Sale Price Sale Price/SF Square Feet Condition Beds/Baths Outdoor Space Parking
20 Follen $3,000,000 $994 3,018 UK 3/3.5 UK UK 423 Beacon $3,375,000 $884 3,817 R 5+/4+ Garden 2-Outdoor 352 Marlborough $3,500,000 $1,051 3,331 UR 6/3 Garden 3-Outdoor 118 Marlborough $5,000,000 $1,008 4,959 UK 6/5 UK UK 244 Marlborough $5,219,000 $939 5,558 UK 4/3.5 UK UK 279 Marlborough $6,350,000 $1,333 4,765 R 4+/3+ Courtyard 2-Garage 410 Beacon $8,500,000 $933 9,107 PR 5+/5+ Roof Deck, Garden 2-G, 2-O 20 Marlborough $9,500,000 $1,257 7,558 R 6+/6+ Roof Deck, Balcony 2-G, 1-O 305 Commonwealth $10,100,000 $797 12,674 UK 8/4 UK UK 130 Commonwealth $11,600,000 $1,171 9,908 PR 5+/6+ Roof Deck 6-Outdoor
# Sales: 10 Average Sale Price: $6,614,400 Average Sale Price/SF: $1,037 Average Days On Market: 114 BEACON HILL Address Sale Price Sale Price/SF Square Feet Condition Beds/Baths Outdoor Space Parking 28-R Phillips $1,274,000 $758 1,680 R 2/2 Courtyard No 1 Strong Place $1,600,000 $1,097 1,458 R 3/2 Courtyard 1-Outdoor 24 Garden $1,665,000 $886 1,879 R 4/3.5 Garden No 42 Irving $1,717,500 $881 1,950 R 3/3+ Roof Deck No 79 Joy $1,737,000 $579 3,000 PR 4+/4.5 Roof Deck, Patio No 43 S. Russell $1,758,000 $617 2,848 UK 4+/2.5 UK No 79 W. Cedar $1,900,000 $900 2,112 PR 3/2.5 Roof Deck No 7 Willow $2,045,000 $990 2,065 AC 3/3 Roof Deck No 22 Joy $2,050,000 $763 2,688 PR 5+/3.5 Roof Deck No 4 Pinckney $2,380,000 $715 3,328 R 5+/4.5 Patio 1-Garage 50 River $2,700,000 $1,058 2,576 R 4+/3.5 Patio No 117 Pinckney $2,725,000 $1,316 2,070 R 5/4 Deck No 8 Byron $2,892,750 $1,124 2,574 UK 4/3 UK UK 55-57 Brimmer $3,100,000 $1,174 2,640 UK 2/1 UK UK 39 Hancock $3,150,000 $609 5,172 PR 4+/3.5 Garden, Patio 3-Outdoor 14 Charles River Sq. $3,300,000 $1,093 3,020 R 4/4 Roof Deck 1-Outdoor 71 Hancock $3,810,000 $856 4,449 R 4+/4 Deck, Patio No 41 Chestnut $3,877,500 $963 4,027 R 5/3+ Deck, Patio No 23 Chestnut $3,900,000 $934 4,176 PR 4/2.5 Garden No 4 Chestnut $4,274,500 $942 4,539 R 6/4+ Garden, Balcony No 75 Hancock $4,600,000 $724 6,351 R 5/5.5 Deck, Garden No 17 W. Cedar $5,195,000 $1,391 3,736 R 4/2+ Garden No 28 Mt. Vernon $6,600,000 $590 11,180 AC 10/6.5 Garden No 13 Louisburg Sq. $10,800,000 $1,954 5,258 PR 8/5.5 Roof Deck, Garden 2-Outdoor 56 Beacon $11,500,000 $1,059 10,858 R 6+/6.5 2-Decks, Garden 4-Garage # Sales: 25 Average Sale Price: $3,622,050 Average Sale Price/SF: $959 Average Days On Market: 103 Condition Key: AC (Avg Condition) UR (Unrenovated) PR (Partially Renovated) R (Renovated) UK (Unknown – private Sale) Information Sources: LINK (Listing Information Network). Marsh Properties research.