Embed Size (px)
Citation preview


THE REACTION d(p,pp)n STUDIED WITH THE
SPHERICAL DETECTOR-ARRAY BOL AT 13.25 AND 50.2 MEV
THE REACTION d(p,pp)n STUDIED WITH THE
SPHERICAL DETECTOR-ARRAÏ BOL AT 13.25 AND 50.2 HEV
ACADEMISCH PROEFSCHRIFT
TER VERKRIJGING VAN DE GRAAD VAN DOCTOR IN DE WISKUNDE EN
NATUURWETENSCHAPPEN AAN DE UNIVERSITEIT VAN AMSTERDAM, OP
GEZAG VAN DE RECTOR MAGNIFICUS DR. J. BRUYN, HOOGLERAAR
IN DE FACULTEIT DER LETTEREN, IN HET OPENBAAR TE
VERDEDIGEN IN DE AULA DER UNIVERSITEIT (TIJDELIJK IN DE
LUTHERSE KERK, INGANG SINGEL 411, HOEK SPUI) OP WOENSDAG
21 MEI 1980, DES NAMIDDAGS TE 1.30 UUR.
DOOR
GÈRARDUS JACOBUS FRANCISCUS BLOMMESTIJN
GEBOREN TE DE HOEF (UTR.)
Promotor : Professor Dr. A.H. Wapstra
Coreferent: Professor Dr. J.A. Tjon
Coreferent: Professor Dr. C. de Vries
Het onderzoek beschreven in dit proefschrift is verricht
onder begeleiding van Dr. R. van Dantzig.
The work described in this thesis is part of the research program of
the Institute for Nuclear Physics Research (IKO), made possible by
financial support from the Foundation for Fundamental Research on
Matter (FOM) and the Netherlands Organization for the Advancement of
Pure Research (ZWO).
Lay-out : T. Kingma Boltjes
Omslagontwerp: J.G.F. Blommestijn
Druk : Mathematisch Centrum
s
ISBN 90-6488-001-8

STELLINGEN
1 Het diepe interferentie-minimum in de werkzame doorsnede vande proton-deuteron breakup reactie bij E =50 MeV ligt op hetsnijpunt van een lijn, waarlangs de p-p singlet amplitude nulis, en een vlak, waarin de p-p tripiet amplitudes nul zijn.Het bestaan van deze loei kan worden verklaard uit symmetrie-overwegingen.
2 De overeenstemming tussen het experimenteel gevonden algemeneverloop van de werkzame doorsnede van de d(p,pp)n reactie bij50 en 13.25 MeV en exacte Faddeev berekeningen met lokale S-golfinteracties is beter dan vooraf verwacht kon worden.
3 De structuur van de vier-dimensionale werkzame doorsnede van dedrie-deeltjes reactie d(p,pp)n wordt beheerst door rotatie-symmetrieën om vier assen: nl. de verbindingslijnen tussen deoorsprong van het Laboratorium-systeem, het totale zwaartepunten het zwaartepunt van de twee protonen, en de lijn loodrecht ophet hierdoor gevormde vlak. Deze symmetrieën kunnen wordengerelateerd aan 7 specifieke kinematische situaties.
4 Door een onzorgvuldige behandeling van de golffunctiebasis over-schatten Suzuki et al. het effect van de stroom ten gevolge vanpion-uitwisseling op de magnetische amplitude voor electronen-vertrooiing.
T. Suzuki, H. Hyuga en A. Arima, Zeitschrift für Physik A293 (1979)5 :
5 De in ons melkwegstelsel waargenomen deuterium-abundanties kunnenniet zonder voorbehoud gebruikt worden voor de afleiding van ;kosmologische modelparameters. ft
HH. Reeves, Atoms as monitors of galactic evolution, Proceedings '£XXVI Les Houches school in theor.phys. p. 591 (American Elsevier,Hew York, 1975)
6 De conceptuele moeilijkheden van de verschillende interpretatiesvan de quantummechanica wijzen in de richting van de eenheid enabsoluutheid van het waarnemende bewustzijn.
E. Schrödinger, What is life?/Hind and matter (Cambridge ün. Press,Cambridge, 1958)E.P. Wigner, Symmetries and reflections (Indiana Un. Press, Bloomington,1967)
7 Het feit, dat men bij p+SR-experimenten in CC14 een 1002 dia-magnetisch signaal vindt, kan worden verklaard door aan te nemendat y reageert met Cl", dat gevormd wordt door de reactie vanCCI4 met door radiolyse gevormde electronen.
P.W. Percival, Radiochimica Acta 26_( 1979)1
8 Sedimentatie-snelheidsmetingen aan bio-membraan blaasjes doorBont et al., welke wijzen op een discrete - althans sterk gepiekteverdeling van de afmetingen van deze blaasjes, kunnen beter wordenverklaard uit geometrisch-structurele stabiliteitsoverwegingen danaan de hand van een door de auteur gepostuleerd selectief fusie-model .
W.S. Bont, J. Boom, H.P. Hofs en M. de Vries, Journ. Membrane Biol.36(1977)213
9 De beschrijving volgens Heisenberg van de quantummechanicavertoont een sterke gelijkenis met een Oosterse zienswijze:het eeuwig onveranderlijke Zelf (vaste toestandsvector) wordtgezien door sluiers (variabele operatoren), zoals in de schemeringeen touw voor een slang (gemeten grootheid) wordt aangezien.
Sankaräcärya, Ätmabodha (Bharati Vijayam Press, Madras, 1967)
G.J.F. BlommestijnAmsterdam, mei 1980
CONTENTS
I. INTRODUCTION 1
I I . ANALYSIS OF A p(d,pp)n BOL-EXPERIMENT AT E a = 26.5 MEV 3
1. Introduction 3
2 . Theory 4
3. Two-dimensional comparison of data with theory 6
M. Four-dimensional coordinate system 9
4.1. Quasi-two-body processes 10
4.2. Theoretical calculations as a function of cos fr and (D* 11
5. The four-dimensional approach 13
6. The RCM angular correlation patterns 15
7. Selection of the discrepancy region 16
8. Comparison of the data with theory 17
9. Kinematical interpretation of the (A-/3) RCM-structure 18
10. Conclusions 21
References 22
III. THE REACTION D(P,PP)N MEASURED WITH BOL AT E p = 50 MEV 23
1. Introduction 23
2. Experimental procedure and data-analysis 23
2.1. The BOL scattering chamber 23
2.2. Electronics and computers 24
2.3. The experiment 24
2.4. Data reduction and calibrations 25
2.5. Specific energy-correlation plots 28
2.6. Multi-dimensional analysis of the data 30
3. The interference minimum 32
3.1. Differences for various NN-potentials 32
3.2. Symmetric constant relative energy loci 35
3.3. Origin of the minimum 36
3.4. Summary 37
4. Global comparison between different theories and experiment 37
5. One-dimensional selections from the data 43
5.1. Representation 43
5.2. Quasi free scattering 45
5.3« Symmetric constant relative energy loci 48
5.4. Collinearity
6. Conclusions
6.1. Experimental conclusions
6.1. Comparisons
References
IV. THE REACTION d(p,pp)n AT E p = 50 MEV ANALYSED
IN COMPLETE THREE-BODY PHASE SPACE
1. Introduction
2. Integration over direction of p-p relative momentum
3. The data integrated over neutron-momentum
4. One-dimensional cuts
5. Conclusions
References
V. A d(p,pp)n BOL-EXPERIMENT AT E^ = 50 MEV ANALYSED
IN FOUR DIMENSIONS
1. Introduction
2. Four-dimensional representation
3. Four-dimensional data and symmetric patterns
4. Discrepancy between theory and experiment
5. Conclusions
References
SUMMARY
SAMENVATTING
DANKWOORD
4951
51
51
53
56
56
56
6566
7374
75
7576
78
84
90
91
92
94
961
, - • •
1

I. Introduction
Tao begot one
And the one, two;
Then the two begot three
And three all else
Tao Te Ching, Lao Tse
This thesis consists of four articles about proton-deuteron
breakup (p+d —> p+p+n) experiments performed with the multi-detector
system BOL. In the first article the reaction is studied with the
proton as target particle and a beam of 26.5 NeV deuterons. In the
three other articles a 50 NeV proton-beam hits a deuteron target.
With the BOL system we were able to measure two of the breakup
products, the protons, in coincidence over an exceptionally large
range of three-body final states. These final states are described
in terms of four independent variables, which we could calculate from
the energies and angles of the two detected protons.
In almost all other kinematically complete three-body breakup
experiments data are obtained only at a few angular combinations.
The experiments described here, however, involve ~700 large
solid-angle detector pairs, each pair being equivalent to
~10000 angular combinations with angular resolution of typically
1 - 2%. This was possible by utilizing the checkerboard AE detector
(developed at IK0), which is effectively subdivided into
100 "checkerboard" fields. The 0.7X10⁷ energy correlation spectra
thus obtained are not all kinematically distinct (due to rotational
symmetry) and they would contain typically one count on the average.
Therefore we summed over equivalent angle pairs and compressed the
data into -20000 four-dimensional grid-intervals.
One would like to compare these data with theoretical predictions,
that are as far as possible consistent with other data such as N-N
phase shifts, elastic nucleon-deuteron scattering and two- and
three-nucleon properties. Then these experiments might discriminate
between different off-shell extensions, three-body forces and
virtual-meson-exchange assumptions, to which any of the few-detector
experiments alone (due to incompleteness) can hardly be expected to
give clear answers. This ideal, however, is still far from being
1
reached. Although we compared the data with exact Faddeev
calculations, the local nucleon-nucleon potentials used were not very
realistic: a repulsive and an attractive Yukawa-term in S-wave only,
and without Coulomb interaction.
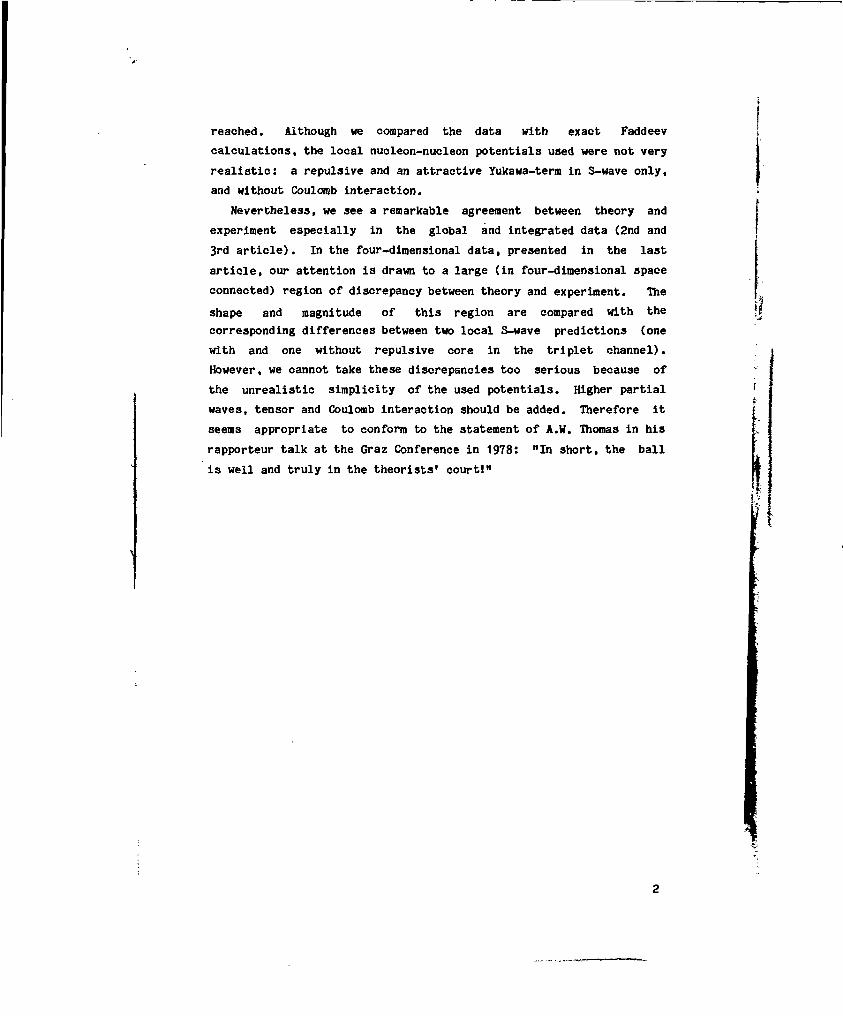
Nevertheless, we see a remarkable agreement between theory and
experiment especially in the global and integrated data (2nd and
3rd article). In the four-dimensional data, presented in the last
article, our attention is drawn to a large (in four-dimensional space
connected) region of discrepancy between theory and experiment. The
shape and magnitude of this region are compared with the
corresponding differences between two local S-wave predictions (one
with and one without repulsive core in the triplet channel).
However, we cannot take these discrepancies too serious because of
the unrealistic simplicity of the used potentials. Higher partial
waves, tensor and Coulomb interaction should be added. Therefore it
seems appropriate to conform to the statement of A.W. Thomas in his
rapporteur talk at the Graz Conference in 1978: "In short, the ball
is well and truly in the theorists' court!"

II. ANALYSIS OF A p(d,pp)n BOL-EXPERIMEMT AT E^s 26.5 MEV
1. Introduction
Some years ago, Wielinga et al. ') have observed a considerable
discrepancy between a n-d Faddeev calculation of the breakup cross
section *) using the Halfliet-Tjon (MT) I-III potential ') and the
experimental p-d breakup data at an internal energy U = 6.6 HeV
(EA= 26.5 HeV or equivalently E p = 13.25 MeV) in a particular region
of the four-dimensional three-body phase space. These data were
integrated over two kinematical variables. Even so, the difference
amounts up to 100J, while in the remaining part of the plot the
agreement between experiment and theory is within typically 20% (see
fig. 10 of ref. ). This main discrepancy region is situated near
&«. - 135° and Tpp= 2.4 MeV where &n is the centre of mass (CM)
scattering angle of the neutron and Tpp the relative energy of the
p-p pair; it is referred to as "the discrepancy region" throughout
this article.
This study ') gave clear-cut evidence for a large deviation
between n-d Faddeev calculations with simple S-wave potentials and
p-d experimental data, that could not be obviously related to the
neglect of Coulomb forces. This conclusion qualifies the somewhat
disappointing earlier consensus, that the breakup cross section in
the low energy region could be explained well even with
oversimplified nueleon-nucleon (N-N) potentials.
The above development left two main questions.
(i) How does the discrepancy depend on other independent
kinematical variables?
(ii) What is the physical explanation of the discrepancy?
In this article we try to shed some light upon these questions by
analysing part of the data in the almost full four-dimensional (40)
phase space. We use the theoretical predictions for two simple
S-wave local N-N potentials, namely MT I-III and MT I-IV. Although
these potentials are not realistic potentials, their comparison may
provide an initial guidance to the sensitivity of the 4D breakup
cross section to the N-N interaction. The amplitudes calculated by
Kloet and Tjon ; are used in these calculations. Based on the
theoretical data, we then discuss the relation between the kinematics
and the two-body dynamical effects: Final State Interaction (FSI)

and Quasi Free Scattering (QFS), in a carefully chosen kinematical
representation. Finally we present our experimental data containing
the discrepancy region in the new representation. .
The experimental results were obtained with the multidetector
system BOL, which consisted of a spherical scattering chamber with 6U
solid state E-AE detectors and associated electronics. A large
fraction of the phase space of the three-body final states in the
reaction was covered in one measurement with angular resolution of
~1 and energy resolution of -150 keV. A detailed description of the
experimental runs and data reduction is given by Wielinga et al. ).
An unbiased sample of events in the four-dimensional phase space
is obtained by calculating the Faddeev cross section using a Monte
Carlo simulation program ^ ) . An artificial set of 400.000 breakup
events was computer-generated according to phase space probability
and for each event the theoretical cross section was calculated from
the amplitudes U SP *) (S = total spin, s^ = two protons spin) using
the expressions:
da -
with m as the nucleon mass, q the relative momentum of the incoming
proton, ]? the relative momentum of the two protons, cj the relative
momentum of the neutron and the p-p pair, s the total energy and
I(p,<p=: f/M*fl* + lMif|Z+ I M ^ T . (2)
Using the particle numbering notation 1+2—> 3+1+5 for p+d—>p+p+n,
the quartet contribution then is
where 9[ is the CM scattering angle and Ty the relative energy of
particles i and j. The doublet-triplet contribution is
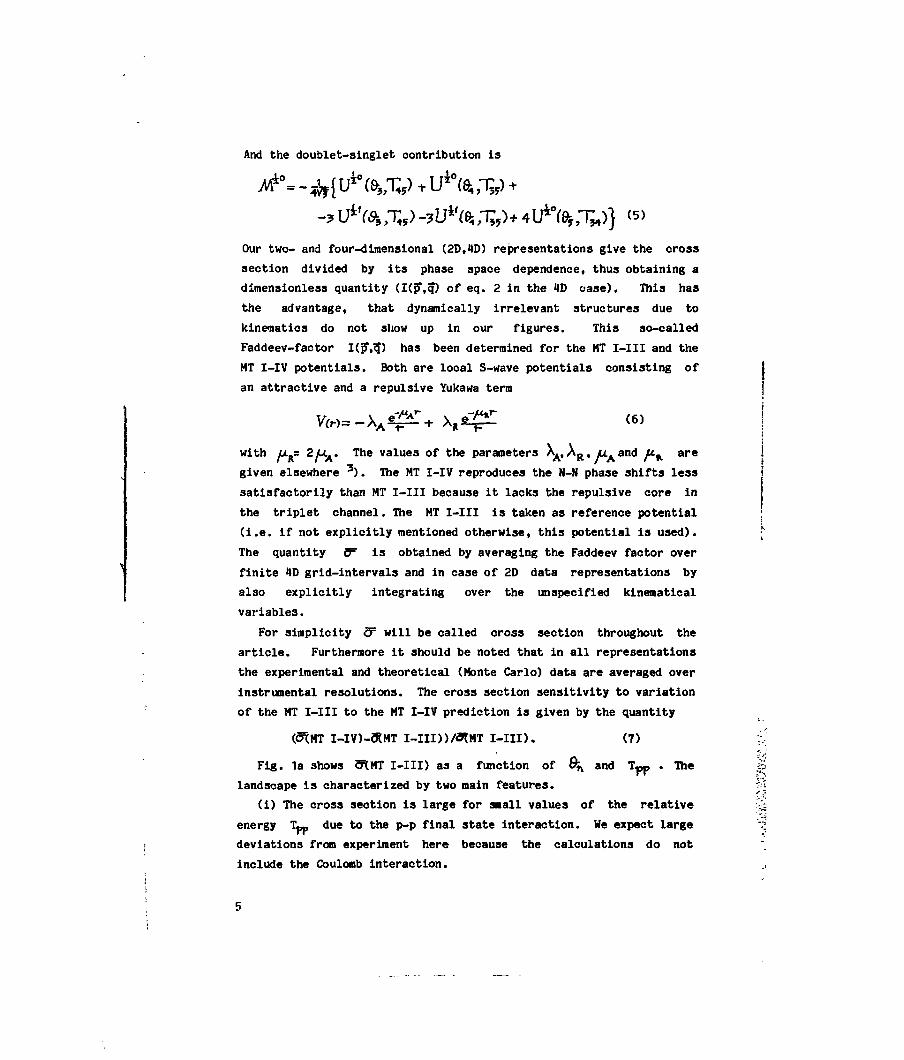
And the doublet-singlet contribution is
Our two- and four-dimensional (2D,4D) representations give the cross
section divided by its phase space dependence, thus obtaining a
dimensionless quantity (I(p*,q) of eq. 2 in the ID case). This has
the advantage, that dynamically irrelevant structures due to
kinematics do not show up in our figures. This so-called
Faddeev-factor I(p,q*) has been determined for the MT I-III and the
MT I-IV potentials. Both are local S-wave potentials consisting of
an attractive and a repulsive Yukawa term
<6' jwith yLtR= 2UA. The values of the parameters X A,A R, yU-and fJL^ are
given elsewhere 3 ) . The MT I-IV reproduces the H-N phase shifts less
satisfactorily than MT I-III because it lacks the repulsive core in
the triplet channel. The MT I-III is taken as reference potential
(i.e. if not explicitly mentioned otherwise, this potential is used).
The quantity &* is obtained by averaging the Faddeev factor over
finite 4D grid-intervals and in case of 2D data representations by
also explicitly integrating over the unspecified kinematical
variables.
For simplicity <T will be called cross section throughout the
article. Furthermore it should be noted that in all representations
the experimental and theoretical (Monte Carlo) data are averaged over
instrumental resolutions. The cross section sensitivity to variation
of the MT I-III to the MT I-IV prediction is given by the quantity
(CT?MT I-IV)-3tMT I-III))/a*MT I-III). (7)
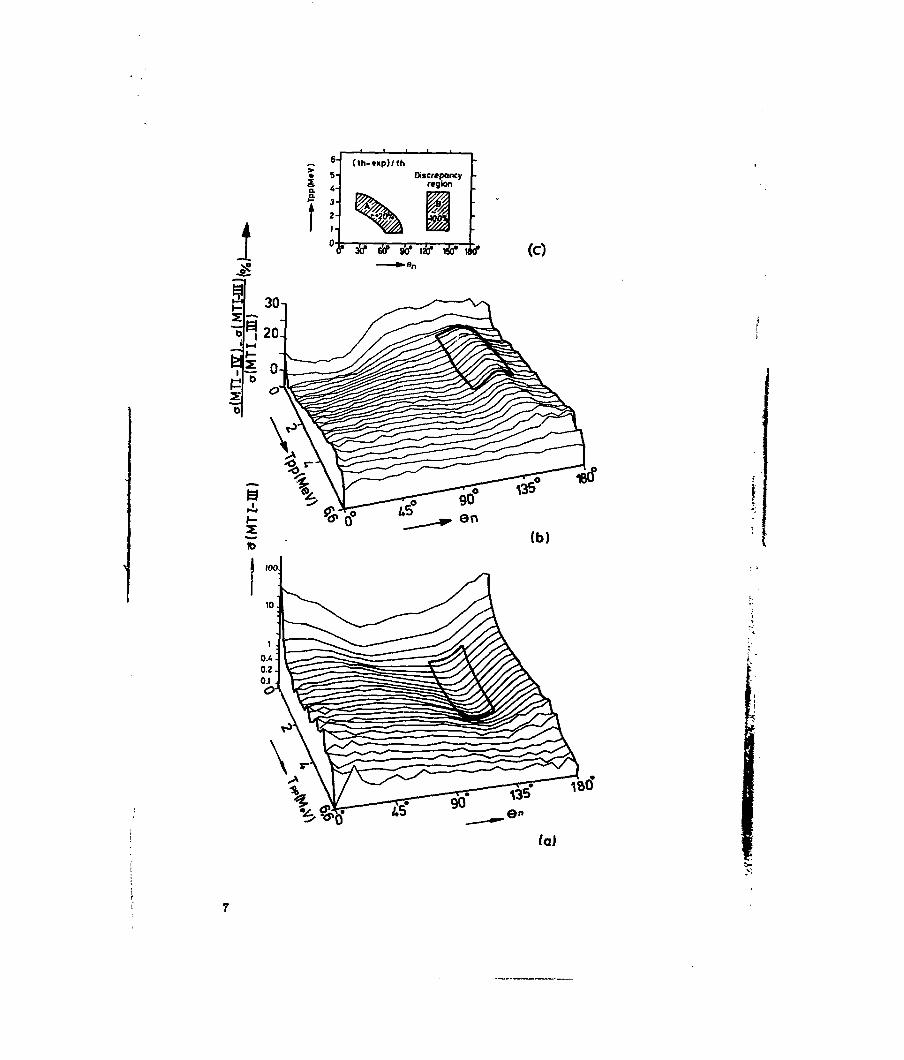
Fig. 1a shows 5(MT I-III) as a function of 8^ and T«» . The
landscape is characterized by two main features.
(i) The cross section is large for snail values of the relative
energy T ~ due to the p-p final state interaction. We expect large
deviations from experiment here because the calculations do not
include the Coulomb interaction.

(ii) The cross section reaches a pronounced minimum in a region
around £n= 135° and T^s 2.4 HeV.
In fig. 1b the sensitivity to potential variation is shown in the :
same 2D representation. Apart from high sensitivity in some parts of
the p-p (i.e. n-n) FSI-region, there are essentially two regions
where the predictions significantly deviate from each other.
(A) where the MT I-IV is 5% below MT I-III (low Tpp and 8^)
(B) where it is up to 20 J above MT I-III (overlapping with area
inside contour) j
Comparison of fig. 1a with 1b thus shows that although some •
sensitivity exists in a region of large cross section, the greatest
sensitivity to the potential in this 2D representation is found in
the low cross section region.
3. Two-dimensional comparison of data with theory
As we know ), a large relative difference between experiment and
theory has been observed in a well localized region in the 6^vs. Tpp L
space ( f^= 135°±15°, Tpp= 2.4 ±1.4 MeV) I
(a(MT I-III)-3texp))/0^MT I-III) = -100* (see fig. 1c). /
Between fig. 1a and 1c the following correlations appears to '
exist. K
(i) The main difference between experiment and theory (about ,
-100)) is in the low cross section region. f:
(ii) The difference has the opposite sign (+20)) in region A (in ir'
fig. 1c) which has a considerable overlap with a region where the
cross section is relatively large (due to p-n QFS).
Summarizing we can say that the characteristic features of the
cross section in this representation are exaggerated by the theory.
The regions where strongest sensitivity to the potential variation
can be observed (fig. 1b) coincide or at least overlap with the
regions mentioned above. The predictions of HT I-IV are larger and
slightly closer to experiment (by ~25%) than those of MT I-III.
However, recent calculations by Stolk and Tjon have shown that adding
P-waves to the interaction increases the MT I-III- as well as the
MT I-IV-result in the minimum cross section region >7).
One should bear in mind that integration over two dimensions may
have decreased the sensitivity and the discrepancy.
6
(th-«p)/th
Discrepancyregion
/a)

I *t "• **•*
Fig. 2. (above) Definition of the kinematical variables, used in ourrepresentation of the data. The CM system is defined as therighthanded coordinate frame with its origin in the centre of mass ofall three particles, the positive Z-axis in the direction of theincoming proton and the neutron moving in the X-Z plane with positiveX coordinate. The RCM system is defined as the righthandedcoordinate frame with its origin in the centre of mass of the twoidentical particles (protons for the experiment, neutrons for thetheory), the positive Z-axis in the direction of motion of thisorigin in the CM system, and the Y-axis coinciding with the one ofthe CM system.
Fig. 1. (opposite page) Isometric two-dimensional representations ofMonte Carlo (for detection sensitive regions) and experimental data(note log. scale), plotted as a function of 8^ and T^,. (a) Faddeevcross section (5s) for MT I-III, integrated over the other twokinematical variables and over the grid intervals. The contourindicates the location of the "main discrepancy region" as observedby Wielinga et a.l. and as shown in (c). (b) "Sensitivity" fordiscrimination between the MT I-III and the MT I-IV prediction,defined as (9?MT I-IV)-oKMT I-III))/S(m I-III); otherwise sane as(a), (c) Sketch of the most significant differences between MT I-IIIand experiment (discrepancy): KrtMT I-III) - ffCexp))/ 3tMT I-III).

4. Four-dimensional coordinate system
The cross section of a reaction with three particles in the final
state for given total energy is a function of four independent
variables. Each particle has three momentum vectors but the
conservation laws of energy and momentum reduce the number of
independent variables from nine to five. A further reduction to four
follows from the rotational symmetry around the beam axis.
The most direct way of representing the data, would be as a
function of the measured laboratory angles and energies. These
variables however, do not easily show the symmetries present and they
do not provide for a simple connection to intuitive concepts
regarding the dynamics of the process. Obviously, one should define
more relevant variables in the CH system.
The total energy available in the CM system to the particles ) 3,
4 and 5 is U = T-B (B being the binding energy of the deuteron) witht tab
T = Ep . The relative momenta of the particles 3, 4 and 5 for
given U are completely determined by one angle and one energy. For
these we take, for symmetry reasons, the relative energy
T-p= (p?-R,)2 /4mp of the protons in their recoiling (with respect to
the neutron) centre of mass system (the RCM system), and the angle
d- between (p*?-R,) and (p,+P4) = -Iy. Instead of Tfp, one could
have taken \ = |j (T-B-T^p) ; then the region of final state p-p
interaction would shift with T. The orientation of the CM(345) plane
(shaded in fig. 2) with respect to the direction of the incoming
particles (Pj= -Pi) *3 given by the angle <p between this plane and
the CM(125) plane, and the angle &n between pj and p* . For all
events (measured and simulated) we thus performed the transformation
to this set of variables (fig. 2).
There are three reasons for choosing the identical-particles RCM-
instead of the proton-neutron RCM-system (as in earlier work ') ).
(i) The angle and the energy of the odd particle play a special
role in the dynamics as described by eq. 5.
(ii) The ambiguity in definition of the p-n RCM-system, due to the
presence of two p-n pairs is avoided.
**) For the experiment we consider the particle numbering
p+d—» p+p+n (1+2—*• 3+4+5).
9
(iii) The influence of the Coulomb interaction, which is not
present in the calculations, may be understood better in terms of the
p-p- rather than in the p-n-RCM angular variables.
The coordinates mentioned can be arranged in two ways:
(a) In the CM-system two coordinates determine the orientation of
the plane in which the three particles fly apart ( 6 , and <p ) and
the others fix the shape of the momentum triangle (T_ and & ) in
that plane.
(b) We could measure Tft(T.pp)— spectra for different Q-n in a
single counter p(d,n)pp experiment. Each point in the T^vs &n plot
then stands for a range of kinematical situations with different
directions of the relative momentum of the two protons. Thus to
every bin in the Tppvs fi^ plot (the neutron variables) there
corresponds a two-dimensional angular correlation pattern as a
function of cos& and (p (the p-p direction).
Two a-priori symmetries in the reaction cross section appear in
the cos 9- vs <p plots.
(1) The identity of the protons gives o(& ,<P ) = cr(iT-9-,(p+ir).
(Ii) The mirror-symmetry with respect to the reaction plane,
defined by the beam and the outgoing neutron gives O"(<p) = cr(-CP).
These symmetries are used for further data reduction by only
showing o'kcfTOSO versus O^cos £T<1 in the figures (except in
fig. 5 where the whole cos9- range is given).
1.1. Quasi-two-body processes
We now consider the loci for the quasi-two-body processes in our
present coordinate system (fig. 3). The p-p final state interaction
(FSI) region is situated around T^= 0.4 MeV and covers a
three-dimensional (3D) subspace. For the p-n FSI T^= 0 and
consequently jrl
« = |U) (8)
The case T«-=0 of course corresponds to 8-= 0° and 180°, leaving a 1D
subspace: the p-n FSI angular distribution.
In quasi free scattering (QFS) the secondary particles are» o e
coplanar with the primary ones, thus (p= 0 or 180 . In case of the
p-p QFS the spectator-neutron stays at rest in the laboratory system,
10
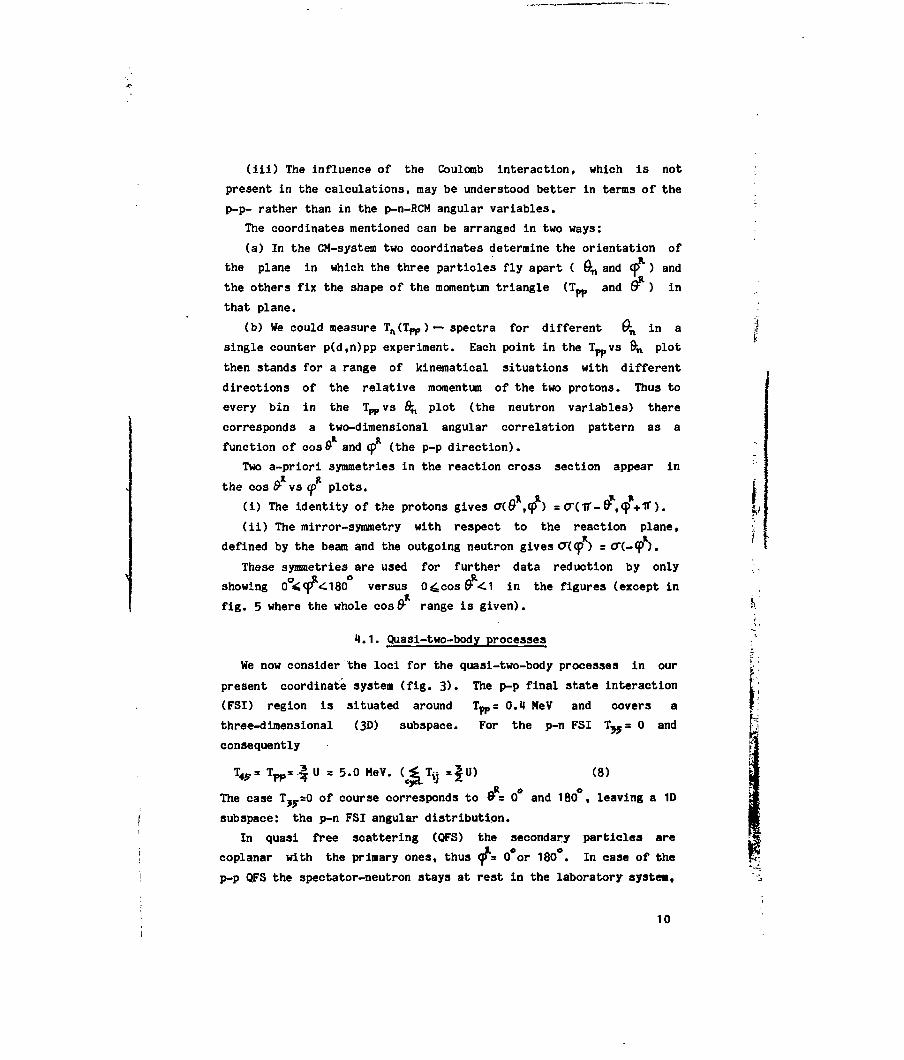
so $j,= 180 . This corresponds to
TppS^E^ - B = 4.4 MeV. (9)
The p-n QFS is located along the dashed curve in fig. 3 for <p = 0 or
180° and &• = & (fi ). This process however can only be observed
experimentally outside the main peak because the spectator-proton
leaves the target in the beam direction, where no detector is
present.
~ 5-
Q.
a.
Fig. 3. The principal locations of the quasi-two-body processes(FSI, QFS) in the $,- Tpp plot. The extreme p-n QFS condition {zeromomentum transfer) is not covered in the present experiment. Itcorresponds to a spectator proton, which escapes detection. The maindiscrepancy region is shown not to overlap with two-body regions.
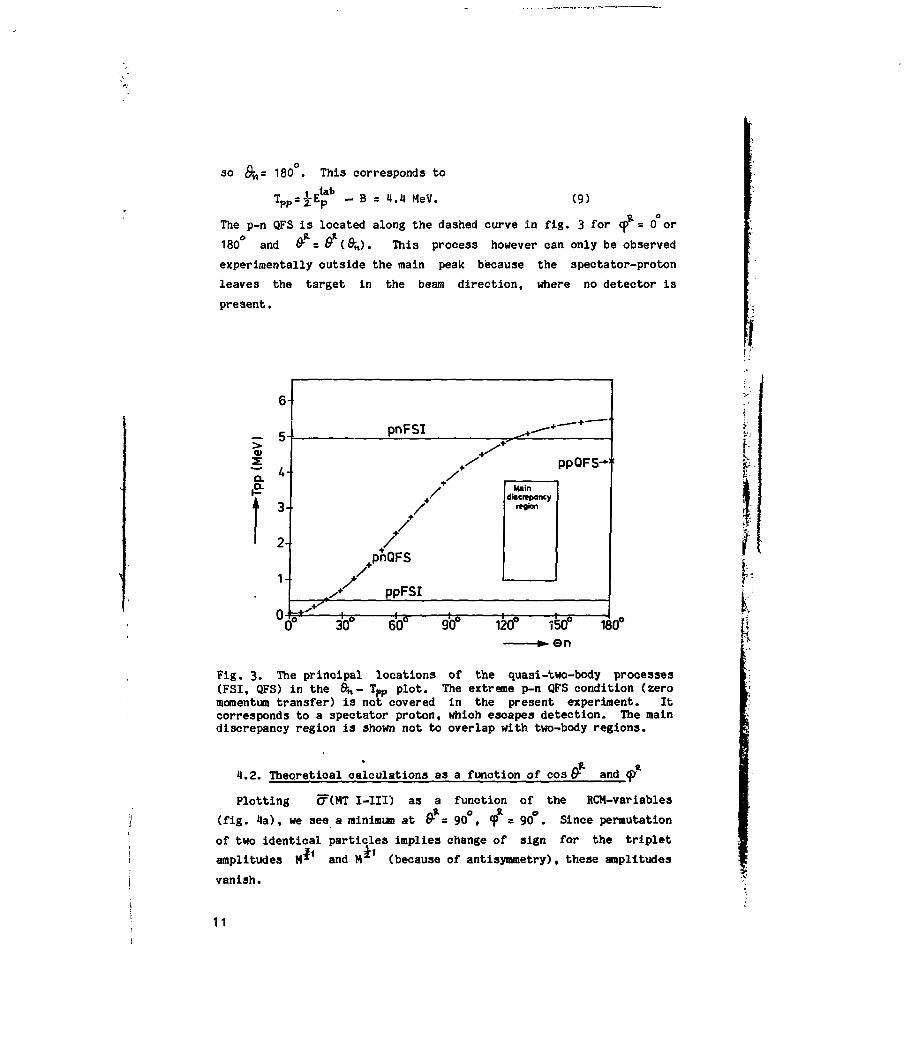
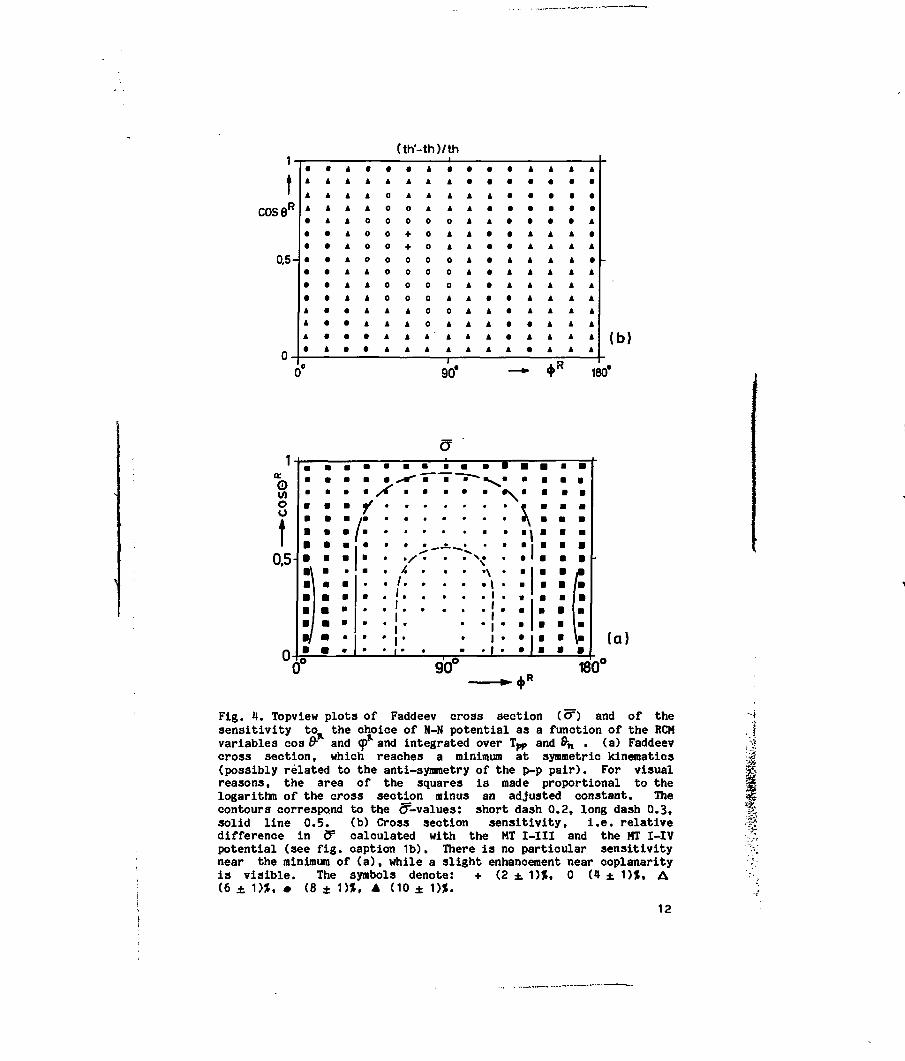
4.2. Theoretical calculations as a function of cos &• and <p
Plotting CT(MT I-III) as a function of the RCM-variables
(fig. 4a), we see a minimum at &• = 90 , 9 = 90 . Since permutation
of two identical particles implies change of sign for the triplet
amplitudes M* and M (because of antisymmetry), these amplitudes
vanish.
11
(th'-th)/th
cose"
0,5-
90*
(b)
180°
1
©wo
0.5
• . ' • . • . .
• j •
• •
90°
(a)
Fig. H. Topview plots of Faddeev cross section (<T) and of thesensitivity toR the choice of N-N potential as a function of the RCMvariables cos 9- and <jp and integrated over T^, and 9-n . (a) Faddeevcross section, which reaches a minimum at symmetric kinematics(possibly related to the anti-symmetry of the p-p pair). For visualreasons, the area of the squares is made proportional to thelogarithm of the cross section minus an adjusted constant. Thecontours correspond to the CT-values: short dash 0.2, long dash 0.3,solid line 0.5. (b) Cross section sensitivity, i.e. relativedifference in 8= calculated with the MT I-III and the MT I-IVpotential (see fig. caption 1b). There is no particular sensitivitynear the minimum of (a), while a slight enhancement near coplanarityis visible. The symbols denote: + (2 ± 1)%, 0 (4 ± 1)9, A(6 ± 1)9, • (8 ± 1)9, A (10 ± 1)9.
12
It may be noted that the 2D subspace defined by & = 90 , <p = 90°
is the subspace which contains all so-called "symmetric constant
relative energy loci" (SCREL) 8 ) : T?5= T45 and (L=B~4 , each locus
is specified by giving certain values to the relative energies),
where every individual locus -specified by Tpp- corresponds to a
1D subspace with variable 8^ .
The integrated 2D RCM-representation does not show a particular
region of sensitivity to the choice of potential except for slight
increase in sensitivity near coplanarity (see fig. 4b). The MT I-IV
is always above the MT I-III, up to 11%. A correlation between the
degree of the sensitivity and the cross section, as described above
for the 8^- Tjop representation, is not present here (no particular
sensitivity near 9- = 90 , cp r go°). Integration over fif, and Tpp
tends to reduce the sensitivity and interesting features may be
washed out. From this point of view it would be better not toft «
integrate over 3^ and T_ but to make the h- -<p plot for every
8^ , Tpp bin separately: i.e. to perform a full ID analysis.
Presently our main objective is to study the region of maximum
discrepancy (fig. 1c). Observing certain structure in the 4D space
might help to give answers to the questions formulated by Wielinga et
al. ?) and repeated in our introduction.
5. The four-dimensional approach
A convenient way of representing the 4D cross section is by means
of "a 2D array of 2D arrays". Every point in the o^ - Tpp plot
(fig. 1) gives the integrated value of all points in a corresponding
tr -<p angular correlation subspace. Instead of only giving that
integrated value, it is -apart from limitations due to detection
geometry and statistical accuracy- possible to give the whole cr -<p ~l
array corresponding to a aTpp-Afi^ interval.
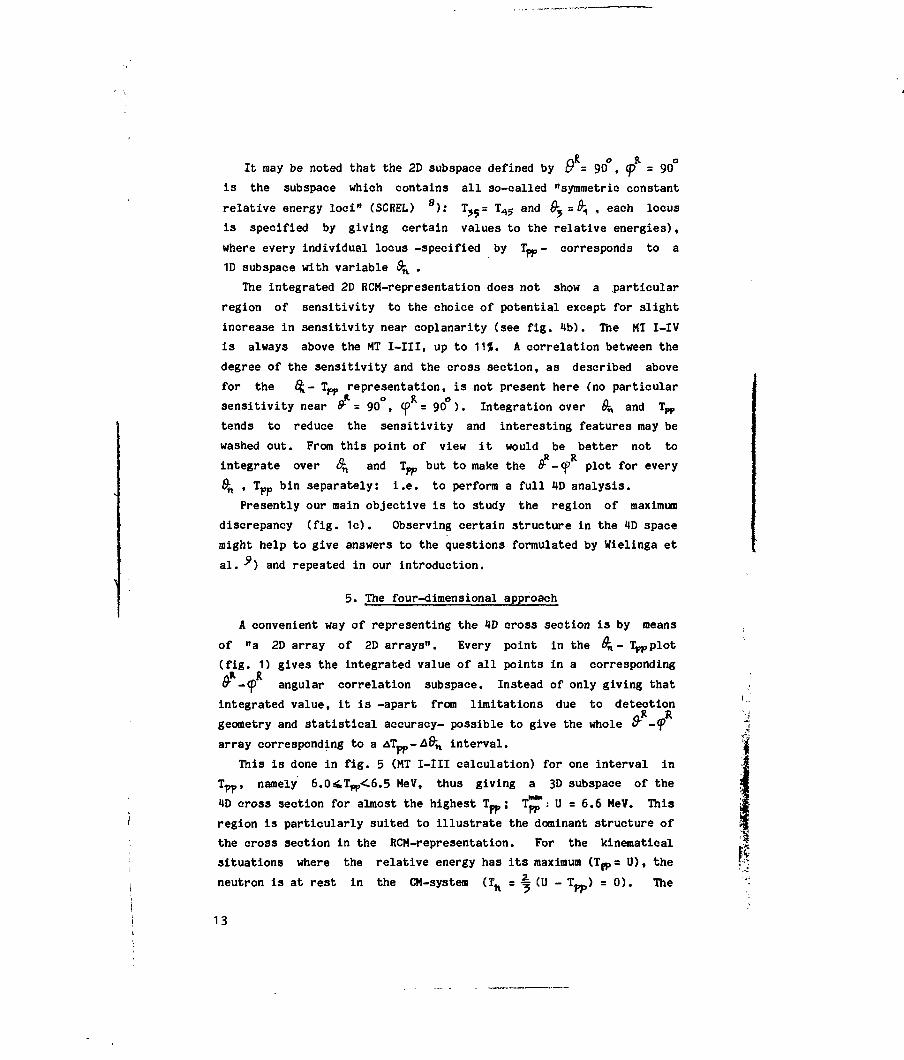
This is done in fig. 5 (MT I-III calculation) for one interval in
Tpp, namely 6.0^Tn,<6.5 MeV, thus giving a 3D subspace of the
4D cross section for almost the highest T~; TlT: U = 6.6 MeV. This
region is particularly suited to illustrate the dominant structure of $I1:
the cross section in the RCM-representation. For the kinematical •*
situations where the relative energy has its maximum (Tfp = U), the
neutron is at rest in the CM-system (Th s % (U - T^) = 0). The
13

momentum triangle is then reduced to a straight line. Together with
all other (T^ 4 0) arrangements of the particle momenta on a straight
line they form the 2D "collinearity" subspace with #-=0 leaving
two variables: 6 and T^Cthe p-n FSI angular distribution and the
"max. Tpp" space are two 1D subspaces of collinearity space) ). In
the "max. Tpp" space the cross section is invariant for rotations
around the beam axis, thus giving the observed structure of the cross
section.
i-m
6.0 < Tpp < 6.5 MeV
8
!°- i
0
_
*
0
-
0
*
-4—0
-
0
ft0° 90" 180° 0s 180 IBCf 0° 180° Cf
*o
O
-ir
*
-
-f-
*
180*
On= 0°-12* 36*-48* 84* - 96° 132* - 144° 168*- 180*
Fig. 5. Part of the chosen four-dimensional representation. TheFaddeev cross section (Cf) is sketched as a function of cos£ and <j>*for the "almost max. Tpp" bin 6.04Tpp<6.5 MeV and for a series of %_bins. In this figure cos& runs from -1(!) to +1 in order to showmost clearly the rotation symmetry of the cross section. The symbolsdenote: . 0.03, - 0.06, 0 0.16, + 0.4, « 1.3.
Fig. 5 shows that the "almost max. angular distribution has a
large cross section for forward and backward angles and has a minimum
at & = 90 . In fig. 5 this nearly rotationally symmetric
distribution is plotted in terms of RCM-coordinates. The five plots
differ in 9^ , the angle of rotation around the vertical Y-axis.
This figure merely serves as a bridge between 20 and ID
representations, fig. 4 and 6 respectively.
Almost half of the 4D representation of the calculated three-body
breakup cross section is shown in fig. 6. The 2D arrays are in the
same representation as in fig. 5, but now ooaO- ranges only from 0 to
1. The central part of the discrepancy region (fig. 1) is the
segment labelled e. Together with the arrays below and above it, it
14

reflects the gross structure of the discrepancy region in the
RCM-systetn according to the MT I-III prediction. In section 8 this
will be compared with the data but first we will study the various
patterns of fig. 6
6. The RCH angular correlation patterns
The experimental as well as the theoretical RCM-angular
correlations can in general be characterized by low order structure
with sometimes striking invariance properties. The following
patterns can be recognized:
(a) Homogeneous distributions occur for low Tpp (p-p FSI) and for
large ^ (fig. 6a, b, c, f and i).
Tpp i-m1 -
45-6 MeV
0-
3-45MeV
1.5-3MeV
n-u
0-1.5MeV
n-C
*4-
4-
+0
+++o
oo00
0
90°
4-x0
+
oo
4-ooo
o0
o0
4-00—
00
o0
o00o
0ooo
90°
oo00
00
o0
0o00
o0
oo
i
9
u
180°U i
120°
4-
0—
+
0
_
o0
oo
4-
++•+
+oo•
+o
_
oo—-
•+++4-
120°-
4-O
•
o
_
oo—-
4-t
+0
—
+
0
_
oooo
4
+4-- f
k
h
e
180°U '
150°
4-
oo
r+-
*+
+4•t-
•H*
*
*•4-Oo
—
I4-
4-
+4-4-
**
150°-
0o
—
+
4-4-
+4-
*
It4f
Oo
+
+4-4t
*if**
180'
- 150°
fCO,.*
i"
M
Fig. 6. Selected part of a ID representation of the Faddeev crosssection (<T) as a function of cos 9- and <p for 90*6 <k< 180" in 30°intervals and 0 < Tp_< 6 MeV in 1.5 MeV intervals. The meaning ofthe symbols as in fig. 5.
(b) Distributions phenomenologically invariant under a certain
rotation.(the grid-intervals of fig. 6 are too wide for a precise
verification):
15

(i) The cross section in fig. 6h is rotationally invariant
around the RCM-Z-axis (constant cross section for all <p at a given
</ ). Thus Z-RCM is a symmetry-axis and its angle with the beamo o
direction V equals 45 . Similarly for fig. 61 V- 15 . Fig. 6g
is also an example of rotational symmetry around an axis (this time
not Z-RCM) in the reaction plane (pole of the symmetry is the highp 0° frcross section point at <p = 0°, fr = 55°). This corresponds here at
9^ s 105 to an angle V= 20° of this symmetry-axis in the reaction
plane with the beam direction. Also figs. 6d shows a rotationally
symmetric pattern.
(ii) The rotational symmetry is around an axis perpendicular to
the reaction plane. Examples are fig. 6e and fig. 4a where a valley
is located around 6- = 90°, (p = 90° due to the zero M^1 and
M1 amplitudes.
(e) patterns that arise from combinations of b(i) and b(ii)
(fig. 6j and k).
In comparing theoretical and experimental RCM angular
correlations, it is observed that they agree remarkably well in most
regions of phase space. In some, however, significant differences
appear even in the qualitative appearance of the patterns.
7. Selection of the discrepancy region
The statistical accuracy of the data is not sufficient to make a
judicious 4D-comparison between the experimental and the
(theoretical) Monte Carlo sample. One may notice that
154 = 50625 bins are involved! Therefore, we chose an intermediate
type of detailed analysis near the discrepancy region. Plots in
t<""ms of coscr -<p were made, while selecting in 6{, and T p the
discrepancy region, as defined by the contour-line of fig. 1. Even
then the statistical accuracy in some intervals Acostr = ,
Acp =^ir for a discrepancy region 1<Tpp<3.75 MeV and 12o"k^< 150°
is only 40*.
In fig. 7 and fig. 8 the plots for a(MT I-III) and the
sensitivity for discrimination between MT I-III and MT I-IV are
given. As compared to the corresponding all-data plots fig. 4a and
4b, the structures have changed: the cross section still has a
minimum around (F-z 90 , <P = 90°, but the maximum has shifted. It
16

is interesting to observe a correlation between the sensitivity and
the cross section. The sensitivity is here largest (~20%) in a
region where the cross section has a maximum (region A). Furthermore
fig. 8 shows a narrow band of relatively high sensitivity around a
curve (,/S) which will be discussed in section 9.
8. Comparison of the data with theory
Former investigations1-1?) demonstrated a large discrepancy
(CT(theory) - 2f(exp.))A?( theory) of ~100% between experiment and
theory (potential Malfliet-Tjon I-III) in a small region of the
8^- Tpp plot at 8^= 135° ± 15°, and 1^= 2.U ± 1.4 MeV, even if the
data are integrated over the RCM-variables. When -on the other hand-
the data are plotted as a function of oos&- and cp (this time
integrated over fi^ and T~,)t as defined in section 3, we see in
fig. 9a that the discrepancy structure is far less pronounced than in
the 8^- T^pplot. The theory is somewhat too low in the greater part
of the plot, with the exception of a region, where it is 10% to 50%
too high.
The discrepancy thus showing up over a large part of the £r -<f>
space however is not necessarily related to the main discrepancy from
fig. 1. In order to study this, a RCM-angular correlation plot
similar to fig. 9a was made for the area in the 8 - T ,
representation: 120<8^< 150 , 1^Tpp<3.75 MeV which corresponds to
the main discrepancy region (fig. 9b). This figure reveals that the
main discrepancy projects onto a band in the cos it -<y plane.
A small region (B) in the coplanar situation has an average
discrepancy of —170%. There is also a region (A) where the
discrepancy has the opposite sign: here the theory is up to 80%
above the experiment. Figure 9b thus nicely demonstrates a
cancellation effect that has been hidden in the integrated data of
Wielinga et al. * ) . A comparison of this figure with the
theoretical cross section given in fig. 7 leads to the conclusion
that the theory is too low where the cross section is small and too
high where the cross section is relatively large: the region A in
figs. 9b and the maximum in fig. 7 tend to coincide.
The shape of the selected angular correlation patterns chosen for
maximum discrepancy, plotted in fig. 7 (theoretical cross section),
17

fig. 8 (sensitivity to changing from MT I-III to MT I-IV) and fig. 9b
(discrepancy between experiment and theory) is dominated by the
indicated region A and the locus j8 . Qualitatively, the correlation
between the cross section and the discrepancy is the same as for the
^ - Tppplots: i.e. the characteristic features of the cross
section tend to be somewhat exaggerated by the theory.
The common appearance of A and /3 in all of the three plots is
surprising and deserves further consideration.
9. Kinematical interpretation of the (A-/Q) RCH-structure
In order to interprete the (A-£) structure in the RCM-plots in as
few as possible kinematical parameters, we may consider the relation
between the spherical coordinates $• , £p and the sphere in
rectangular coordinate space, containing all possible directions ofif ©
the p-p momentum. The cos B~ - <f plot represents a so-called
"normal equivalent cylindrical projection" of that sphere.
On this sphere, the curve (3 corresponds to an equator
perpendicular to the reaction plane and the region A corresponds to a
"pole-cap" belonging to that equator. The orientation of the whole
pattern is predominantly characterized by an angle V (in the
reaction plane) of the pole-axis with the beam axis. From the
location of the narrow band (3 in fig, 8, the angle of the
symmetry-axis with respect to the RCM-Z-axis can be determined, its
value being ~42°. From the fact that the middle of the 9^ interval
of the selected region is ^=135 it follows that curve ft
corresponds to p-p relative momenta approximately perpendicular to
the beam axis and region A to momenta approximately parallel to the
beam axis ( Y&3°).
18

coseh
0.5-
Fig..7. Topview plot of Faddeev cross section (C) as a function ofcosF and cp* with selection of the interval 120°£.&il<\5(f and14.Tpp<3.75 MeV. The cross section JKMT I-III) is integrated overthe selected part of phase space. The solid contour corresponds to0.2, the dashed ones to 0.15. The dash-dotted line in the low crosssection region corresponds to the curve f of fig. 8. The area ofthe squares is chosen similar to fig. 4a (different constant).
(th-th)/th
J 0.5-
COOO
180"
Fig. 8. Sensitivity to the N-N potential. Similar to fig. 1b, butnow in the RCM system for the selected part of phase space and forthe full (4TT) detection solid angle. The curve j8 is the locus ofp-p momenta perpendicular to the beam and the region A corresponds top-p momenta parallel to the beam. The symbols denote:blank (16 ± 1)*, A (18 ± 1>*. • (20 ± 1)*, A(22 + 1)*.
\
19

(th-exp)/th
0Woo
V + -• • — * Q — — •. _ _ _ D - O^Vfi"
a « - - - D y>-<- V -- O O - V ^ O - - -_ _ _ O - / - V D - -
- - - o.-ti a - a a -• D
_ _ - v / - a o - a a ^ - *+ • • - - / D D - D D D / - O •+ + • - _ / D - - D D - / • • -+ . D _ D / _ - V - - D . ' D - - -
» — — —
B
(b)
90" 180°
(th-exp)/th
a.inoo
0.5-
— » •
+ + O\ +
o + - r
+ o - ' •4^ * * -
4- + •
+ - -
D - - - -
45" 90*
(a)135" 180*
Fig. 9. Topview plot of the difference between experimental andtheoretical cross section, as a function of cos& and <p*. Theplotted quantity i s the discrepancy (a(KT I-III)-3(exp>>/6iCMT I-III) .(a) integrated over the full solid angle covered by the BOL-geoaetry.The symbols denote: • (-40 ± 10)%, - (-20 ± 10)», . (0 + 10)S,+ (20 ± 10)1, 0 (40 ± 10)J. (b) With selection of the discrepancyregion 120o<^<150°, 1^Tpp<3.75 MeV. Region B has an averagediscrepancy of -170$. In the indicated band the p-p relative amentatend to be perpendicular to the beam. The centre of the bandcorresponds to the /9-locus in fig. 8. The symbols denote:• (-400 ± 40)%, • (-320 ± 40)«, V (-240*40)*, • (-160 ±. 40)%,- ( -80 ± 40)%, • (0 ± 40)%, + (80 i 40)%.
20

10. Conclusions
(a) In an attempt to satisfactorily exploit the intrinsically
"47pi_4D (four dimensional) proton-induced deuteron breakup data at
Ep = 13.25 MeV as measured with the multidetector system BOL, we
investigated the 4D-structure of a pronounced discrepancy between
theory and experiment. This discrepancy, reported in earlier work )
is situated in a kinematical region, far from the quasi two-body
processes (quasi free scattering and final state interaction) and it
is characterized by a deep minimum in the cross section predicted
qualitatively by Faddeev calculations using different nucleon-nucleon
potentials. (b) When comparing our data in terms of neutron angle
B^ and proton-proton relative energy Tpp with various Faddeev
predictions, we observed a kinematical correspondence between large
discrepancy, low cross section and high sensitivity to the core
region of the Malfliet-Tjon N-N potentials.
(c) When the main discrepancy region (theory too low by H00J) is
selected in T~, and $j, , the discrepancy maximum in terms of the
relative p-p momentum vector in the RCM system becomes more or less
concentrated near an equatorial plane essentially perpendicular to
the beam (discrepancy typically -120%) with a local maximum of about
-170$ when the lab. momenta are coplanar.
(d) For relative p-p momenta with small angles to the beam
direction an increased sensitivity to the N-N potential and a
secondary discrepancy of opposite sign (~80%) is observed. This
latter explains that in the two dimensions \ and T^the main
discrepancy is reduced.
(e) Because of the well localized discrepancy between theory and
experiment, it seems interesting to perform accurate measurements J
particularly dedicated to this most sensitive low cross section 4
region. The lab. variables at E ? = 13.25 MeV are: £^= 14 ± 5 •
% = 45°+ 5°, 4<p = 180° ± 10° and E, = 5.5 + 0.5 MeV. A special
experimental approach using Checkerboard- or other position-sensitive
detectors11), measuring a number of closely spaced points
simultaneously might well be necessary to adequately perform such
measurements.
21
References
1) B.J. Wielinga, J.R. Balder, G.J.F. Blommestijn, R. van Dantzig,
W.M. Kloet, J.A. Tjon and I. Slaus, Nucl. Phys. A261(1976)13 :
2) W.M. Kloet and J.A. Tjon, Nucl. Phys. A210(1973)380;
Ann. of Phys. 79(1973)407
3) R.A. Malfliet and J.A. Tjon, Nucl. Phys. A127(1969)161;
Ann. of Phys. 61(1970)125 |
4) B.J. Wielinga, Ph.D. thesis. University of Amsterdam
5) Y. Haitsma, G.J.F. Blommestijn and R. van Dantzig,
Institute for Nuclear Physics Research report IKO-KE2 (1976)
6) C. Stolk and J.A. Tjon, Phys. Rev. Lett. 39(1977)395 r
7) W.T.H. van Oers, Proc. VII Int. Conf. on few body problems ':
in nuclear and particle physics, Delhi, 1975, ed. A.N. Hitra, :.
I. Slaus, V.H. Bhasin and V.K. Gupta |
(North-Holland, Amsterdam, 1976) p. 716 I
8) J.H. Stuivenberg and R. van Wageningen, Nucl. Phys. A304(1978)141; j
see also A.M. McDonald , D.I. Bonbright, W.T.H. van Oers, f
J.W. Watson, J.G. Rogers, J.M. Cameron, J. Soukup, W.M. Kloet y:
and J.A. Tjon, Phys. Rev. Lett. 34(1975)488 [
9) B.J. Wielinga, J.R. Balder, R. van Dantzig, I. Slaus, W.M. Kloet
and J.A Tjon, Nuovo Cim. Lett. 11(1974)655
10) J.M. Lambert, P.A. Treado, R.G. Alias, L.A. Beach, R.O. Bondelid
and E.M. Diener, Phys. Rev. C13(1976)43
11) J.A. den Boer , A.M,E. Hoeberechts, W.K. Hofker,
D.P. Oosthoek, K. Mulder, L.A.Ch. Koerts, R. van Dantzig,
J.E.J. Oberski, J.H. Dieperink, E. Kok and R.F. Rumphorst,
Nucl. Instr. 92(1971)173
22

III. THE REACTION d(p,pp)n MEASURED WITH BOL AT E p = 50 MeV j
1. Introduction
A detailed understanding of the nucleon-deuteron breakup reaction
at one particular centre of mass energy requires many kinematically
complete measurements. The beam time necessary for performing such '
measurements is much reduced if they are made in parallel,
particularly if many low cross section data points are required.
This has the additional advantage that many relative normalisations
can be avoided. Parallel coincidence measurements over a large ;_'
fraction of the three-body phase space are possible by placing many I
suitable solid state detectors around the target.
In this article we report on an experiment in which the cross
section of the d(p,pp)n reaction at 50 MeV was sampled over typically
50$ of the four-dimensional kinematical phase space, using the
multidetector system BOL ' ) .
Below we sketch the experimental procedure and the data-analysis [
of the experiment. A deep interference minimum in the cross section
is studied in detail for several nucleon-nucleon potentials. Several I
spectra are shown, some of which give a global comparison between \.
experiment and theory. Other given spectra are kinematically
complete selections from the data in special regions such as quasi-
free scattering, symmetric constant relative energy loci and
collinearity. The theoretical predictions ar& based on exact
three-body Faddeev calculations z) with local S-wave ;)
isospin-independent nucleon-nucleon interactions ). ~
2. Experimental procedure and data-analysisj,
2.1. The BOL scattering chamber I.
The IKO-synchrocyclotron 4) accelerated protons to an energy of f*
50 MeV. A selected beam with a current of ~10~ nA was transported
through the beam channel ) and directed to a deuterated polyethylene
target in the spherical BOL scattering chamber ) where it was
focussed to a spot with ~2 mm diameter and an angular spread < 0.6 .
The scattering chamber contained 40 position-sensitive
detector-telescopes at a distance of 8.1 cm from the target covering
in total -9% of 41T. Thanks to the rotational symmetry around the
beam-axis, this gave a 50% sampling of the three-body final state
23
phase space. The angular range extended from 12° up to 168 .
In the BOL-setup each detector-telescope consisted of several
silicon diodes behind each other:
1. A 300 (±30) [im surface barrier AE-detector with the electrodes
on both sides divided into 10 parallel electrode strips of 1.37 mm
width. The two sets of strips being orthogonal, a position
indication grid resembling a checkerboard was obtained ?).
2. Two (or in a few cases one) 4 mm Si(Li) P.I.N. type E-detectors
with windows thinner than 30 /nm.
3- A 5 mm Si(H) detector with a 150 urn window at the rearside.
All checkerboard strips orthogonal to the beam were positioned in
accordance with a common pattern of adjacent bands having constant
polar angle i\ with respect to the beam axis (the common grid unit
being 0.97 ). Thus, data from different checkerboard combinationslb I
with the same 9^ , <% and A<p could be - added without spoiling the
angular resolution.
2.2. Electronics and computers
Each stack of detectors in a telescope has its own autonomous ,
electronic channel consisting of pulse handling electronics, logic
and analog-to-digital converters ).
Upon detection of a single particle or a coincidence (At = 70 ns)
the data (72 bits) were transferred to a PDP8 computer 9) and written
on magnetic tape. These data were: detection channel identifier
(DI), checkerboard fieldcode, energy loss (AE), total energy (Et),
multiplicity, groupmark for coincident particles, pile-up indication
and the number of missed particles due to dead time of the previous
measurements.
An EL-X8 computer (later replaced by a DEC PDP-10) was used for
on-line procedures and for the off-line data analysis. A special
high-level data processing system was developed for this purpose.
2.3. The experiment
The experiment required detection of coincident protons from the
reaction p+d—> p+p+n (notation:'1+2—» 3+4+5).
Additionally, for various checks and calibrations different
targets were positioned in the center of the scattering chamber,
24

using a remotely controlled target ladder.
In view of its complexity, the whole system was thoroughly checked
in the period just before the experimental run. Not all of the ~150
solid state detectors functioned equally well. The detectors with
the best results were placed in strategic positions.
In view of the desired accuracy in three-dimensional beam
alignment, a special technique was used, based on the detection of
kinematically overcomplete coincidences from the scattering of
protons on hydrogen and deuterium (CH2 and CDZ targets respectively).
From these, the beam parameters (direction, position and profile)
could be reconstructed on-line J o ) . In successive iterations the beam
was then correctly aligned with respect to the central axis of the
scattering chamber. The stability of the beam was shown to be
40.2 mm on the target.
During the actual data taking a CDZ foil of 1 mg/cm* wa3 used. In
addition to coincidences, several tapes were recorded on singles from
CH^-, Be- and 1wAu-targets for the calibration of the energy-scales
of the detectors and for a number of consistency tests on the data.
At the end of the run, the cyclotron was switched over to 25 MeV
deuterons (same beam settings) for getting more energy calibration
points. Finally, a 24lAm source (also mounted on the target ladder)
emitting 5.5 MeV «-particles was used to calibrate the AE-deteetors.
Summary of the run
- Energy-resolution: ~250 keV (FWHM).
- Beam spot size ~1.7 mm0.
- Count rate for coincidences (when all detectors present):
~100 event3/sec.
- Number of coincidences recorded: 2.3x10 .
- Running time: 120 hours.
2.4. Data reduction and calibrations
In a series of data reduction passes, the data were subjected to
various tests, calibrations and selections, e.g. rejection of events
with a detector-edge-, pile-up- or overflow-code, or with noise
characteristics; assignment of unambiguous position codes to
"ditch-events" (events that give signals on adjacent checkerboard
25
strips), particle identification, energy and angular calibrations.
The data were then first subjected to various consistency criteria
to trace errors of the detectors and the electronics. Most of the
procedures have been described earlier 1 1 ) . Here we restrict
ourselves to some additional remarks.
Using the ousource data, the detection efficiency was inspected
for all checkerboard fields. Later on, the relative normalisation of
the detectors for protons was also checked by studying the continuity
of the integrated breakup cross section measurements. Furthermore,
the checkerboard location codes and efficiencies were checked at high
proton energy (low AE) using the elastic scattering of protons on
gold. For a large number of pairs of checkerboard strips a
left-right asymmetry was observed (due to electronics), which was
removed in a later 3tage of the data-analysis by a local angular
smoothing over 2°. Et- and AE-spectral shapes were investigated, to
check the detectors and electronics.
Particle identification
The particle (proton) identification was performed for all
detectors separately, using the E t - AE correlation, approximated by
the Range-Energy relation R =/3E£ with <x= 1.74 and /3= 13.27 (for
protons between 5 and 50 MeV). For this purpose we defined the
following quantities:
F, = log E* - G = -i G = -Jjlog [1 - (1 - ftf}.
The first is characteristic of the particle type and approximately
independent of the proton energy. The other is used to identify
particles stopped in the AE-cell (G = 0, if E t = AE), which can only
be identified kinematically using information 'on the coincident
proton.
Variation in absolute energy scale for Et and in thickness d of
the dE-cells for different detector-telescopes enters into F, only as
a shift, which is an advantage in view of the many detectors. The
relative 4E/Et calibration factors for all detectors were obtained
from elastic p-carbon scattering as recorded in the singles runs.
Two-dimensional N(F, ,G) plots were made for all detectors, different
particle types being manifest as straight horizontal bands.
The proton band was selected on the safe side (to be sure not to
26
throw away proton-proton coincidences), removing erroneously
identified particles later on kinematical grounds by a "Q-value"
selection. Details of the procedure have been given earlier " ) .
Beam energy
Among several methods for precisely determining the energy of the
proton beam, the so-called cross-over method was chosen 1L) since it
does not depend on energy scales. This method involves plotting the
energies of the protons from two different two-body reactions as a
function of their laboratory angle 6 in a region where both curves
cross each other. The cross-over angle &c for a specific pair of
reactions is a function of only the incident particle energy.
Cross-over angles were determined at 17 detector positions for p-p
and d-p scattering with p-"C inelastic scattering to the 4,43, 7.65
and 9.63 MeV level3.
To gain statistics, the data were summed over differentlab
checkerboard fields with essentially the same df . Because of
favourable kinematics for p-p scattering, these three cases gave a
much more accurate result than the d-p data. Both sets together,
statistically weighed according to their errors, resulted in a proton
beam energy value E p = 50.2 ± 0.4 HeV.
Beam direction
The deviation of the beam direction from the central axis of the
BOL scattering chamber was determined from the differences in
cross-over angle for detectors on opposite sides of the beam. The
alignment was found to be within 0.1 mm, (i.e. of the order of the
beam instability).
Energy scales
On its way through a detection telescope, a charged particle
dissipates its total kinetic energy in portions Eo, E,, E x and E, to
the stack of Si(Li) P.I.N. cells (see section 2.1.).
Differences in the P.I.N. ceJls (charge collection efficiency,
capacity etc) as well as in the electronics (together amounting to
-5J) necessitated to write the measured total energy Et as
Et = aEo + bE, + cEz + dE? with a, b, c and d as scale factors.
Each of them is successively calibrated, using appropriate
s
energy-peaks.
Selection of the breakup process
A measurement yields five variables: the calibrated
laboratory-energies E?, E4, and angles % , ft, and a<p. Assuming a
certain three-body reaction suoh as proton-deuteron breakup, an event
is kinematically completely determined by only four independent
variables. So, one variable or combination of variables can be used
to select the reaction process. We use the three-particle Q-value or
"missing mass".
For all combinations (~700) of two detectors we made spectra of Q
for the breakup reaction. The distribution of peak positions had a
FWHM of 0.3 MeV, which was mainly due to inaccuracy in beam
alignment, energy straggling in the target etc. The selection of the
proton-deuteron breakup process was based on every combination
separately in order to apply the sharpest possible criterion.
Fig. 1 shows a typical example of a Q-value spectrum. The peak
corresponding to elastic proton-deuteron scattering was detected in
some detector pairs only. This peak is seen at Q.as1 HeV instead of
0 MeV because in the calculation of the kinematics the three-body
reaction d(p,pp)n had to be assumed instead of the appropriate
reaction d(p,p)d. Some p-p coincidences from (p,2p) scattering on
carbon and from elastic p-p scattering on hydrogen impurity in the
target were found in the background of the spectrum.
By means of limits on the calculated Q-value, events from the
above-mentioned background processes as well as accidentals could be
removed effectively.
2.5. Specific energy-correlation pilots
Detector-combinations were chosen for special studies on grounds
of: occurrence of quasi-free scattering (QFS), final state
interaction (FSI) or the interference minimum ( % - Q\ = 33°45',
A<p=129035') in the theoretical cross section, possibility for
comparison with earlier measurements, and good statistics.
Fig. 2 gives an example of a (E,, E4) plot and a E?-projection for
the same combination of detectors as in fig. 1.
Data from the detector-combination kinematically nearest to the
28

deep theoretical minimum in the cross section were analysed in
greater detail. Spectra, compared with a theoretical calculation
using the amplitudes from Kloet and Tjon A) have been given
elsewhere " ) .
5x10
All detectorcombinations
-2 -3 ' -4 -5 1
ijj
Fig. 1 Missing-energy spectrum (number of events as a function ofQ-value). The dashed line applies to a specific detector pair( 8 p = 22°, ft^s 82", A<p = 182°). The peak at - 2.5 MeV i sdue to p(p,p)p, the peak at 0.9 MeV due to d(p,p)d. The solid linegives the spectrum integrated over all detector-combinations(different scale).
29

Ixi
40-
5 10 15 20E4(MeV)
5 10 15 20E«(MeV)
200 400 600INTENSITY (cnts)
Fig. 2 Two-dimensional energy correlation spectra corresponding tothe combination in fig. 1. The printed numbers indicate an intensityscale (* means > 100). Spectrum (a) contains only one half of thedata. In (b) only events with -3.5 < Q < 1.8 MeV (see boundaries infig. 1) are accepted. The curve (c) shows the spectrum integratedover E4.
For all 700 detector-combinations (E?, E4> plots and
E,-projections were made. These were inspected for possible
background from unidentified particles, accidentals, and p-p
coincidences from carbon. An overall minimum energy limit of 0.5 MeV
was determined. In some cases (e.g. presence of background from
elastic peaks) more severe limits ranging from 1 to 10 MeV were
taken. Events with both E ? and E 4 below 7 MeV did not allow a
sufficiently reliable identification of the reaction process. These
were therefore omitted in the data as well as in the simulation
mentioned below.
2.6. Multi-dimen3ional analysis of the data
After the above mentioned data-reductions, -calibrations and
-selections the resulting data were analysed in terms of four
independent kinematical variables. The nature of these variables
will be discussed in section 5.
We represented the four-dimensional (4D) kinematical space of the
three-body final states in the form of a two-dimensional ("big"-)
array of two-dimensional sub-arrays. For this purpose, the
30
coordinates of the big-array: Tn and 9^ (the neutron centre of mass
(CM) energy and angle) are divided into 10 and 12 channels
respectively. The coordinates of the sub-arrays are the polar angle
9ff and the azimuthal angle <prf> of the protons in the RCM-system.
The polar angle 8pP is plotted as cos Sj^ to obtain a homogeneous
phase space distribution inside a subarray. Both cos8^ and fn are
divided into 15 channels. The quantity TH runs from 0 to 20 MeV with
a channel width of 2 MeV; ft, runs from o" to 180° with a channel
width of 15 . The choice of the channel widths was a compromise
between resolution and statistical accuracy.. Thanks to symmetries in
the cross section the polar angles %f and <pppOf the subarrays need
only run from 0° to 90° and from 0° to 180° respectively.
For the comparison with the theoretical calculations we used a
Monte Carlo method. Breakup events were computer-generated at random
in a properly chosen space with homogeneous phase space density
distribution and then transformed to the desired set of kinematical
variables. Each event was then provided with theoretical cross
section weight factors for several nucleon-nucleon potentials. These
weight factors were obtained from amplitudes calculated by Kloet and
Tjon z) using a Faddeev formalism suitable for local potentials. The
Monte Carlo method by itself generated the phase space density
correctly (within statistical accuracy) for the kinematical
coordinates employed. The set of theoretical data generated without
application of detection constraints was named "theory-UTT ".
In a next step the Monte Carlo events were subjected to a
selection based on the actual detection sensitivity of the BOL
detection 3ystem and software analysis, including data selections as
mentioned above. The thus obtained data-set was named "simulation";
it was based on a close imitation of the experimental conditions.
Three data sets: theory-MIT (10* events), simulation (0.7X10 ) and
experiment (0.5X10 ), were counted in four-dimensional arrays of the
above mentioned type (10x12X15X15). The detection efficiency was
accounted for by dividing the experimental array (element by element)
by the simulation array and then multiplying it with the
theory-W-array. In the absence of a reliable beam-current
integration the normalisation of the experimental data with respect
to the simulated data was defined such that the integrated p-n quasi-
I
31

free scattering peaks were equal in height for both cases. This
resulted in a normalisation, which deviates only 10% from an
extrapolation of total cross section measurements o'f Carlson '*). The
data then correspond to a total cross section of 124 mb (Carlson:
113 mb). If one, however, considers the experimental difficulty in
detecting the spectator proton (very small E^), one is inclined to
take the extrapolation more seriously than the QFS peak and scale our
data 10% down (which has not been done in the figures!). We did not
use the p-p QFS for normalisation because of the possible influence
of Coulomb interaction.
The relative differences between theory and experiment
((exp-sim)/sim) had considerable statistical errors. Therefore these
relative differences were averaged with those of the neighbouring
array-elements (in 4D: 3*- 1 - 80) using as a weight-factor the
inverse square of the absolute statistical error. Array elements
with less than 15 truly measured neighbours were left unchanged. The
final representation of the experimental data was obtained by then
multiplying the resulting array (containing averaged relative
differences) with the theory^TT array for the corresponding elements.
This procedure amounted to an interpolation of the cross section over
the channel widths, based on the theory. Since data and theory were
in reasonable agreement over a major fraction of the phase space,
this correction procedure gave - according to several tests -
reasonably reliable (within ~20%) results.
3. The interference minimum
3.1. Differences for various NH-potentials
Some years ago we observed overall agreement, except for a local
discrepancy, between Faddeev n-d calculations 1>?) and p-d data at
13.25 MeVlf>rf) and 50 MeV " ) . The data were studied in an integrated
two-dimensional representation in terms of the p-p relative energy
Tp,, and the neutron CM angle &* . (T.pp is related to the T n
earlier introduced by: T^r U^-fT*; U** being the total available
energy in the CM system). The discrepancy was found at lower energy
in a region (1 < T w < 3.75 MeV, 120°< fik<150°), where the
prediction of the local S-wave Halfliet-Tjon potential MT I-III is a
32

factor of 2 below experiment ). This discrepancy region overlaps
with the region of minimum cross section. At 50 HeV we observe
discrepancies up to a factor 4 in a region near the minimum in the
cross section 1 J ) . McDonald et al. ) have also investigated this low
cross section region at E f = 39.5 MeV and report discrepancies of a
factor 3.
In this section we study the differences in cross section for
various N-N potentials in the specific region of small cross section.
To learn more about the origin of the minimum and of the discrepancy
with the experimental data, we compare several four-dimensional
theoretical cross section surfaces near the sharp minimum.
E,.1J25 t
i»-159°
10-
rf-
10'-
»'-
16'-
tf-
Ki'
MT MilMr tinRIBtomogucft
MWOF I-m b
5 to 15 2'o 25
— . - - - -
— ~
*T ~0 1 2 3 4 5 6
E3 IMtVI E3IM*I
Fig. 3 Theoretical N-d breakup cross section at E r = 13.25 MeV (a)and 50 MeV (b) at lab-angles corresponding to the theoretical crosssection minimum, for the MT I-III potential. The cross sectionvalues at the angles corresponding to the minima for the otherpotentials are schematically indicated (Expositions not actuallycorresponding to the minima). The numbering of the particles is:p+d —*• p+p+n ~ 1+2 — > 3+1+5.
At 13.25 MeV we observe the shallow minimum of 0.3 mb/sr^-.HeV for
the MT I-III reported first by Kloet and Tjon z) (see fig. 3a, where
the exact angles are also given). The MT I-IV prediction is well
above the MT I-III. At 50 MeV the linimua is much narrower and
deeper (7.10~ mb/sr^.MeV, see fig. 3b). Such a deep minimum at
higher energy does not occur for the MT I-III potential only. For
33
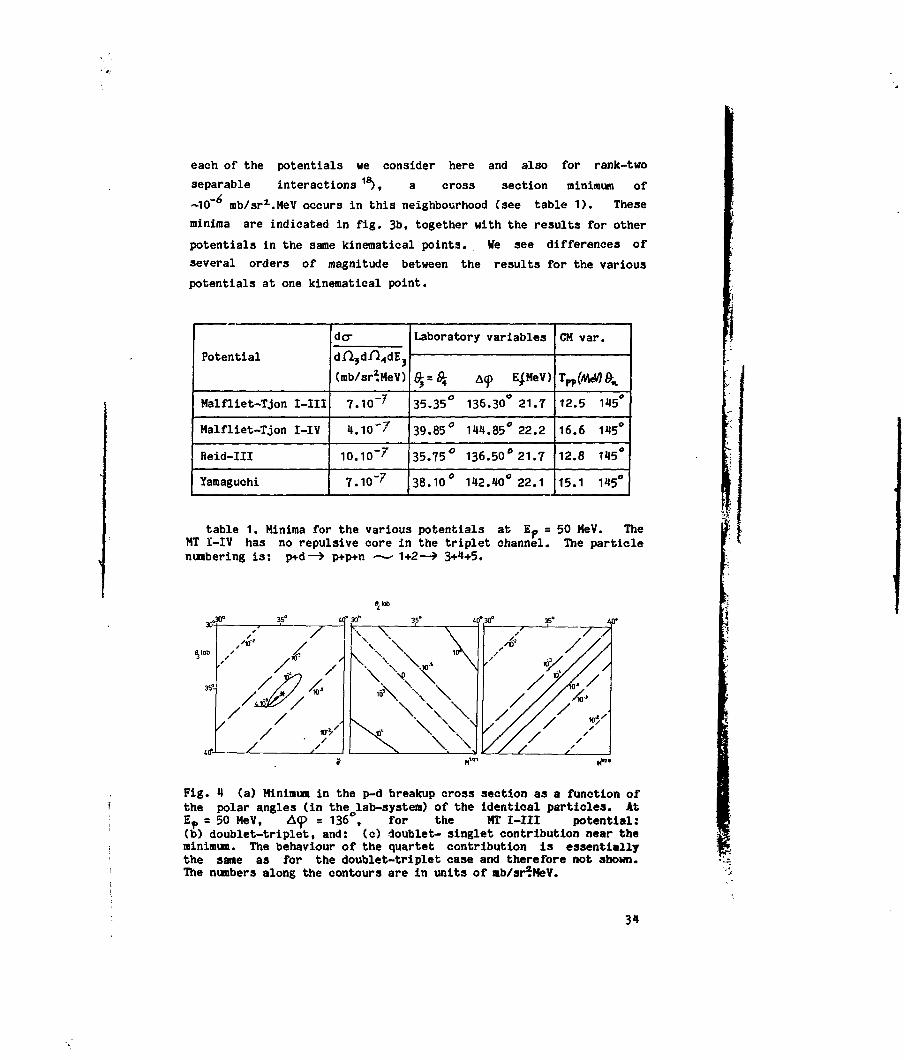
each of the potentials we consider here and also for rank-two
separable interactions 1 S ) , a cross section minimum of
-10"° mb/sri.MeV occurs in this neighbourhood (see table 1). These
minima are indicated in fig. 3b, together with the results for other
potentials in the same kinematical points. We see differences of
several orders of magnitude between the results for the various
potentials at one kinematical point.
Potential
Malfliet-Tjon
Malfliet-Tjon
Reld-III
Yaraaguehi
I-III
I-IV
do-
(mb/sr*MeV)
7.1O"7
4.10-7
10.10-7
7.10"7
Laboratory '
%
35
39
35
38
• *
.35°
.85°
.75°
.10°
variables
A<p
136
144
136
142
.30
.85
50
40
E/MeV)
° 21.7
° 22.2
°21.7
°22.1
CM
Tpp
12.
16.
12.
15.
var.
(M,
5
6
8
1
145"
145"
145"
145"
table 1. Minima for the various potentials at Ep = 50 MeV. TheMT I-IV has no repulsive core in the triplet channel. The particlenumbering is: p+d—> p+p+n ——• 1+2—> 3+4+5.
Fig. 4 (a) Minimum in the p-d breakup cross section as a function ofthe polar angles (in the lab-system) of the identical particles. AtE^ = 50 MeV, A<p = 136°, for the MT I-III potential:(b) doublet-triplet, and: (c) doublet- singlet contribution near theminimum. The behaviour of the quartet contribution is essentiallythe same as for the doublet-triplet case and therefore not shown.The numbers along the contours are in units of ab/sr?MeV.
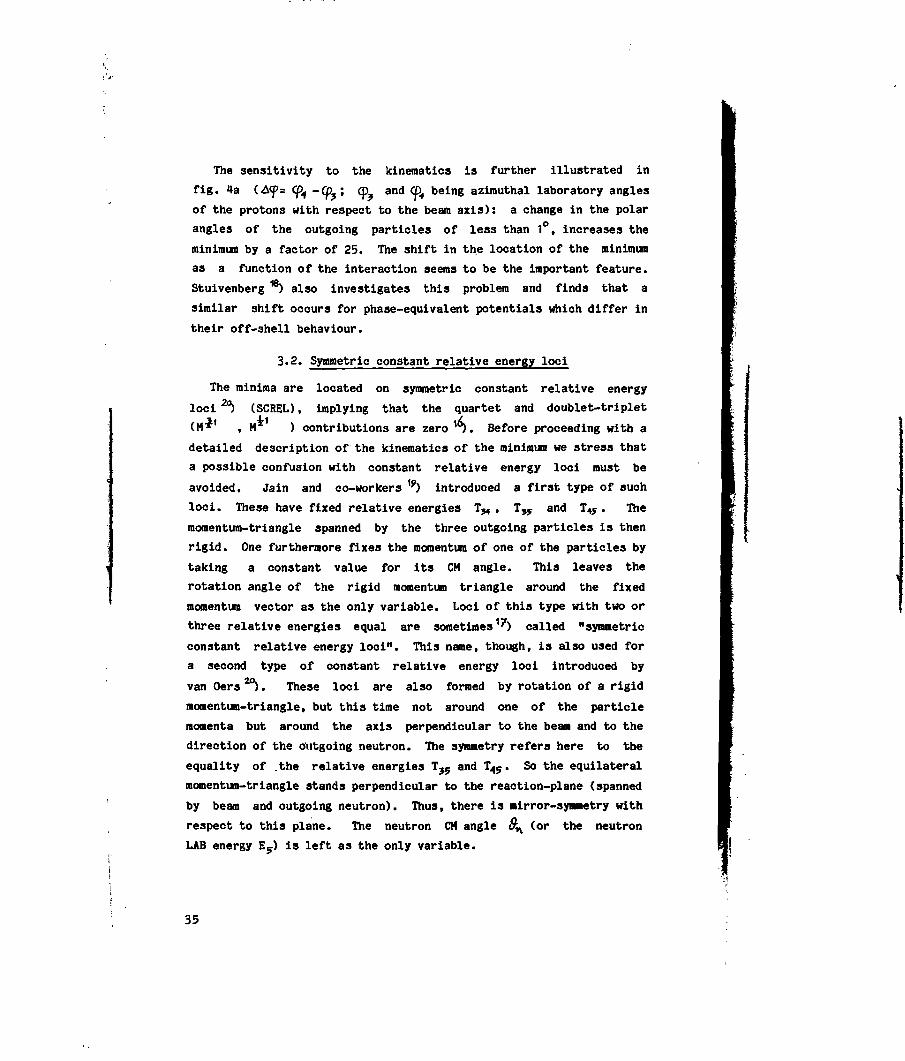
The sensitivity to the kinematics is further illustrated in
fig. 4a (A<p= Cfa -Cjp3; qp_ and (£>4 being azimuthal laboratory angles
of the protons with respect to the beam axis): a change in the polar
angles of the outgoing particles of less than 1°, increases the
minimum by a factor of 25. The shift in the location of the minimum
as a function of the interaction seems to be the important feature.
Stuivenberg w) also investigates this problem and finds that a
similar shift occurs for phase-equivalent potentials which differ in
their off-shell behaviour.
3.2. Symmetric constant relative energy loci
The minima are located on symmetric constant relative energy
loci (SCREL), implying that the quartet and doublet-triplet
(M*1 , M ) contributions are zero ™). Before proceeding with a
detailed description of the kinematics of the minimum we stress that
a possible confusion with constant relative energy loci must be
avoided. Jain and co-workers 1?> introduced a first type of such
loci. These have fixed relative energies T M , T3y and T4y. The
momentum-triangle spanned by the three outgoing particles is then
rigid. One furthermore fixes the momentum of one of the particles by
taking a constant value for its CM angle. This leaves the
rotation angle of the rigid momentum triangle around the fixed
momentum vector as the only variable. Loci of this type with two or
three relative energies equal are sometimes1'') called "symmetric
constant relative energy loci". This name, though, is also used for
a second type of constant relative energy loci introduced by
van Oers 2°). These loci are also formed by rotation of a rigid
momentum-triangle, but this time not around one of the particle
momenta but around the axis perpendicular to the beam and to the
direction of the outgoing neutron. The symmetry refers here to the
equality of .the relative energies T>5 and T^?. So the equilateral
momentum-triangle stands perpendicular to the reaction-plane (spanned
by beam and outgoing neutron). Thus, there is mirror-symmetry with
respect to this plane. The neutron CM angle # n (or the neutron
LAB energy E?) is left as the only variable.
35
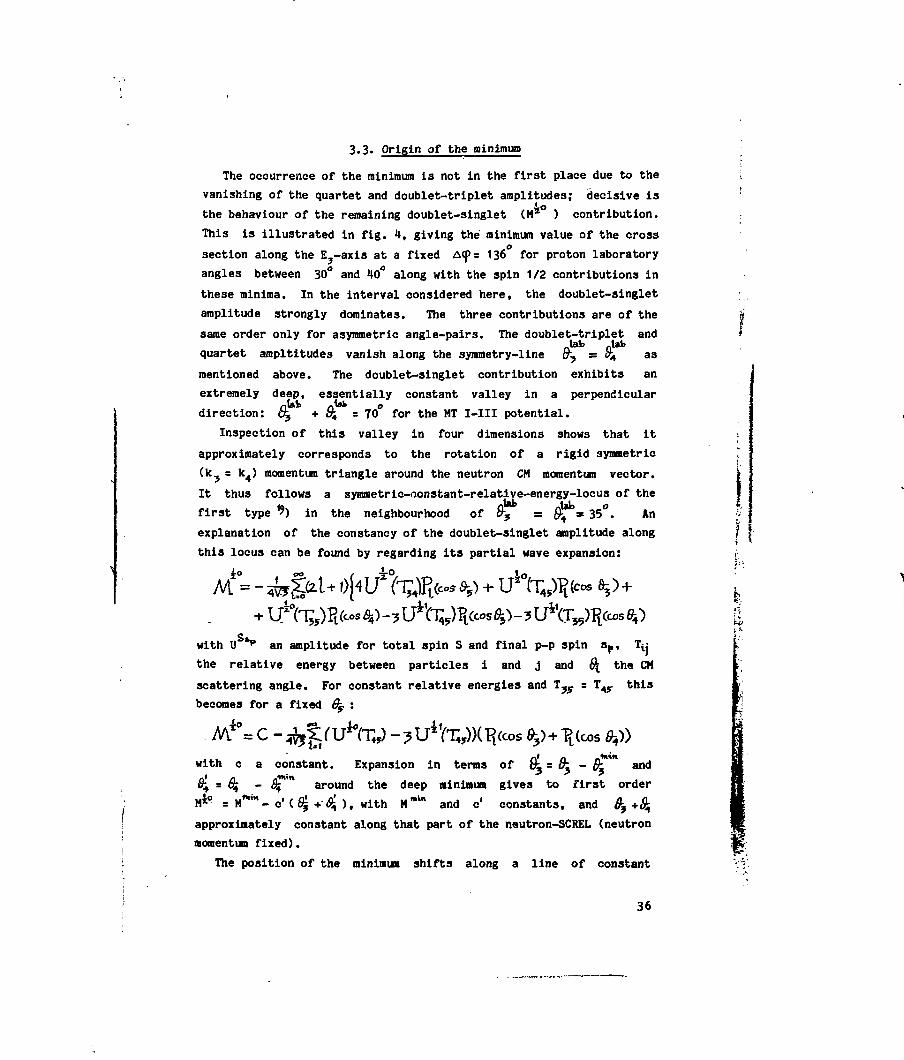
3.3. Origin of the minimum
The occurrence of the minimum is not in the first place due to the
vanishing of the quartet and doublet-triplet amplitudes; decisive is
the behaviour of the remaining doublet-singlet CM* ) contribution.
This is illustrated in fig. 4, giving the minimum value of the cross
section along the E,-axis at a fixed A<p= 136 for proton laboratory
angles between 30° and 40° along with the spin 1/2 contributions in
these minima. In the interval considered here, the doublet-singlet
amplitude strongly dominates. The three contributions are of the
same order only for asymmetric angle-pairs. The doublet-triplet andlain Jbtk
quartet arapltitudes vanish along the symmetry-line d^ s ft, asmentioned above. The doublet-singlet contribution exhibits an
extremely deep, essentially constant valley in a perpendicular
direction: 8^ + $i - 70° for the MT I-III potential.
Inspection of this valley in four dimensions shows that it
approximately corresponds to the rotation of a rigid symmetric
(k? s k4) momentum triangle around the neutron CM momentum vector.
It thus follows a symraetric-cjonstant-relative-energy-locus of the
first type % in the neighbourhood of % = $?°* 35°. An
explanation of the constancy of the doublet-singlet amplitude along
this locus can be found by regarding its partial wave expansion:
with U *•" an amplitude for total spin S and final p-p spin sp, Ttj
the relative energy between particles 1 and j and 6 the CM
scattering angle. For constant relative energies and T ? y = T4jr this
becomes for a fixed 6$ :
°= c -with9+
a constant. Expansion in terms of
around the
%= % - and
deep minimum gives to first ordermi" and c'M*° = M*""- c'(S£ + <8| ), with Mmi" and c' constants, and ^ ^
approximately constant along that part of the neutron-SCREL (neutron
momentum fixed).
The position of the minimum shifts along a line of constant
36
\\
I
&it & 145° between T ^ m =12.5 and 15 MeV for the various
potentials. There seems to be a correlation between the doublet
scattering length az and the value of T "*" in the sense that for
lower az a higher T^n is found " ) .
In calculations with separable interactions, Bruinsma ai)
demonstrated that at 22.7 MeV the inclusion of higher partial waves
and tensor forces increases the cross section in the minima on the
SCREL-loci typically by 20% at Tfp< 4 MeV and by a factor of 10 at
TppSs11 MeV. Recently Stolk and Tjon") have shown that in
particular p-wave components in the N-N force fill in the deep
minimum to a considerable extent also for the full Reid soft core
potential. The position of the minimum does not change much when
higher partial wave contributions are added.
A wide range of potentials gives a narrow region in the
four-dimensional phase space, where the cross section changes
rapidly. For S-wave calculations at 50 MeV the minimum is
essentially zero.
The precise location but not the depth of the cross section
minimum depends critically on the type of interaction.
The minimum is located at the intersection of the locus for zero
doublet-singlet amplitude (approximately following a "neutron-SCREL"
of the first type) with the plane of SCREL-loci of the second type
for vanishing quartet and doublet-triplet amplitude. The line
originates from the symmetry of the p-p singlet amplitude and the
plane from the antisymmetry of the p-p triplet amplitudes.
4. Global comparison between different theories and experiment
By making global judgements on data and theory integrated over
four dimensions, we avoid details and complications from
four-dimensional (4D) representations.
In the graphs of the next two sections (4 and 5) the cross section
is (as in the 26.5 MeV work16)) divided by its phase space
dependence. The dimensionless quantity thereby obtained (sometimes
called the Faddeev factor) is still designated as cross section and
denoted by the symbol <T (the bar stands for: divided by phase space
37

dependence and averaged over the grid-interval; see below). The
differential cross section dtris connected to the Faddeev factor
by
dC7=
where m is the nucleon mass, q^ the relative momentum of the incoming
proton, p the relative momentum of the protons, q the relative
momentum of the neutron and the p-p pair, and s the total energy.
The Faddeev factor I(p,q) is the absolute square of the breakup
amplitude, averaged over incoming spins and summed over outgoing
spins.
We consider the amount of phase space with a certain cross section
or cross-section difference relative to a reference cross section.
The whole ID phase space of three-body final states is subdivided
according to a regular lattice (4D grid or array). Then the number
of lattice cells (= array elements = grid intervals) with a certain
cross section between o° and cf+A<x is weighted with the amount of
phase space in the cell and plotted as a function of <?. Thus one
obtains a so-called cross section spectrum with channel width AO*.
To obtain an easily interpretable result one should preferably either
use kinematical variables in which the phase space density
distribution is homogeneous, or (as we did here) divide by the phase
space factor.
For reasons described earlier 1 ), we take as 4D basis the neutron
centre of mass (CM) energy Tn and the neutron CM angle 9^
complemented with the p-p recoil centre of mass (RCM) polar angles
(see next section). The phase 3pace distribution is homogeneous in
the RCM angles cos 6^ and <pfpt but not in T n and 9^. Theoretical
cross sections are.calculated using a Monte Carlo procedure covering
the full kinematical phase space. The events are weighted with the
breakup Faddeev factor, which (except for a Jacobian), is the cross
section. This Faddeev factor is calculated with the breakup
amplitudes obtained by Kloet and Tjon 4 ) , using the local S-wave
nucleon-nucleon potentials MT I-IIZ and MT I-IV ') and the R-III and
the Y-Y potential ** ) .
In fig. 5 cross section spectra are shown. The solid curve
represents the MT I-III prediction summed over full phase space
38

(4tT detection). The histogram corresponds to the reduced phase
space, covered by detectors in the BOL system.
S (Faddeev factor)
Fig. 5 Cross section 3pectra. Displayed is the percentage of phasespace occupied by a certain cross section value (in dimensionlessunits of breakup matrix element). The drawn curve shows theFaddeev-simulation (using the MT I-III potential) assuming4irdetection sensitivity; the histogram gives the same but now forthe BOL detection geometry. The points are the experimental data.Notice the log-log scale.
The cross section distributions (notice the double-logarithmic
scale) show a pronounced peak at values cr»2-2xto. This maximum is
two orders of magnitude lower than the values typical for quasi-free
scattering (QFS). This graph shows that a large fraction of the 4D
phase space is characterized by low cross section, shown earlier24)
on a linear <T-scale (fig. 5 gives the percentage of phase space
instead of the number of array elements shown in the earlier figure).
The curve and the histogram differ only little. This indicates
39

appropriate sampling of the phase space with BOL.
The data points are in reasonably good agreement with the
prediction (error bars due to statistics). Such cross section
spectra for different theoretical models differ only little. Yet one
should keep in mind that integrating over a large variety of
kinematical situations - as done here -, tends to wash out the
differences. We therefore give plots of relative differences for
data and theory (called "discrepancy") and for theoretical
predictions (called "sensitivity") for MT I-IV and MT I-III, taking
the latter as a reference. The difference between the calculations
is probably mainly due to absence of the repulsive core in the
triplet channel for MT I-IV 3 ) .
The curve and histogram of fig. 6 show the "sensitivity" spectra:
the distributions of relative differences
(a(MT I-IV)-cf(MT I-III))/<?(MT I-III).
The peak is here at a difference of ~15%. Again, the histogram
covers the phase space volume with BOL detection efficiency j£ 0 only,
while the curve covers full 4in The small difference between the
curve and the histogram emphasizes the appropriate sampling in our
experiment. The width of the sensitivity peak provides a measure for
the differences between the two potentials. An earlier study shows
that for some other potentials the sensitivity spread is of
comparable magnitude.
The data-points of fig. 6 show the "discrepancy" spectrum: the
distribution of relative differences
I-III)-3(exp))/5r(MT I-III).
The data have been smoothed over neighbouring cells to reduce
statistical uncertainties. The experimental conditions do not allow
independent absolute normalisation. Therefore a relative
normalisation-factor for the data has been chosen such that the
integrated measured p-n QFS peaks matches the corresponding integral
for the MT I-III calculation. (It is known that different Faddeev
calculations generally agree there within ~10% *)).
From fig. 6 we see that the discrepancy peak is significantly
broader than the sensitivity peak. This clearly shows that the
S-wave potentials cannot give a good prediction for the data over the

measured phase space. S-wave calculations are probably relevant at
low energy, but at 50 MeV P-wave interaction should be added. This
was, however, not yet available at the time of the analysis. In
contrast, it is likely that isospin-independence is a better
assumption at high energy than at low.
I
10
8(ft
5Q.
"5r8.
0.1
sensitivity :
Spectra of &discrepancy :
x=MTUV,4Tt efficiency!J—u x = MTJ-IV,BOL efficiency4 x= data
• •
. .11, ,}. . .:50 50 100
O(MTI-III)
Fig. 6 Spectra of relative differences between cross sections; theMT(I-III) is taken as reference potential. For the curve and thehistogram x is the MT(I-IV) potential and for the points cf(x) is themeasured cross section. The relative difference between calculationsis called sensitivity, that between calculation and experiment:discrepancy.

200
=? 100
5 °io1 -100ax
I D200
oo7i 100a
-100
a) •1-3 •30-100•4-10 #100-150.11-30 #150 <
-20%< s< 20%
* ! • • •g i s T » I
b)20%< s< 60%
u
0.2 0.4 0.6a/Omax(n-pQFS)
0.8
Fig. 7 Two dimensional plot3 of the discrepancy versus the crosssection for two sensitivity intervals. The area of the dots denotesthe number of array elements in the (8^, Tn, cpfp , cos &n)representation. The cross section is measured as a fraction of themaximum p-n quasi-free scattering peak height.
The discrepancy spectrum as a function of the cross section,
plotted in fig. 7 as a 2D correlation spectrum, shows that for high
ST the peak is centered at 0% difference While for lower cr it shifts
towards ~+30% (for -20J < sensitivity < 20J). The theory is thus too
low for low cross sections, consistent with the increase expected
when Coulomb, higher partial waves, or three-body forces are
introduced. Study of the discrepancy vs. cross section at higher

sensitivities (in fig. 7b) shows roughly the same correlation between
both quantities except for cr< O . I X ^ .
The above global comparisons between data and two theories provide
information on the typical size of discrepancy and of sensitivity to
a change in potential. In a forthcoming paper we will study actual
locations of discrepancy and of sensitivity in the phase space of
three-body final states.
The nature of the discrepancies may best be understood by studying
regions which accommodate: 1) large discrepancy as well as large
sensitivity and 2) large discrepancy and low sensitivity. A
systematic search through 4D phase space with criteria partly
determined using the global spectra is now possible. In this paper
we restrict ourselves to data and calculations in some of the more
familiar regions of phase space: the deep interference minimum,
symmetric constant relative energy loci, collinearity and both p-n
and p-p QFS regions.
5. One-dimensional selections from the data
5.1. Representation
Although the BOL-experiraents lend themselves particularly well for
a 4D analysis, we will first discuss some specially chosen (ID) cuts
through the 4D phase space. Some of these cuts overlap with the
quasi-two-body QFS processes. Others have been selected on the basis
of special kinematics, which have recently received attention in the
literature:
(i) The extremely deep and sharp interference minimum in the
theoretical cross section found by Kloet and Tjon z) in systematic
searches for differences between the MT I-III and MT I-IV
calculations.
(ii) The so-called symmetric point, where all three particles have
the same energy and symmetric angles. Both kinematical points are
located on symmetric constant relative energy loci of the second type
(see section 3).
(iii) The so-called "collinear" regions in which the particle
momenta lie on a straight line.

a)
F > R C M
\j5RCM
b)
Fig. 8 Definition of the kinematical variables, used in ourdata-representation; (a) gives the RCM variables in general; (b)shows the case 8^= 180°.
We choose for the 4D basis first the neutron coordinates: the
neutron-energy Tft and -angle Q^ in the overall CM system (this energy
T n is uniquely connected with the relative p-p energy Tfp introduced
earlier 1*) through the relation T K = (U - T^)). For the
p-p recoil centre of mass (RCM) polar angles, numerous systems are
used in the literature. We choo3e the system introduced by Cramer
and Eidson for nuclear polarisation studies ). This system has the
advantage over the system used in earlier work ^ , that its axes are
fixed with respect to the beam direction and that it is elegantly
connected with some of the kinematical and dynamical aspects of
three-body breakup reactions with two identical particles in the
final state. As shown in fig. 8a, they Jchoose the Z-axis
perpendicular to the reaction-plane (the plane spanned by the beam
and the neutron momentum). The Z-axis is positive in the upward
direction if the neutron is taken at the left-hand side looking in
the beam direction. The X-axis is parallel to the beam (positive in
the beam-direction) and the Y-axis such that the system is
righthanded. The origin of the system is the centre of mass of the
two protons. The polar angles are called Qfo and <p .
Mirror-symmetry with respect to the reaction-plane implies
)= CTC-5L) and the identity of the protons
W =<*-/«" V70*We earlier 1 ) defined the RCH-angles in a coordinate frame
oriented with its Z-axis along the momentum of the p-p CM. This has
the serious disadvantage that it depends on 6^. Three body breakup
cross sections are correlated with the direction of the beam rather
than with the direction of the recoil CM in the overall CM system.
One therefore takes the normal CM system coordinate frame also in the
RCM-sy3tem (one axis parallel to the beam, another perpendicular to
the reaction-plane). In high energy applications this choice, though
with different indications of the axes (Y - X, Z - Y) is called ^
the Gottfried-Jackson frame.
The reduced cross section, alias Faddeev factor, cr in the
figures, is the cross section cr divided by the phase space
dependence and averaged over the grid interval. This dimensionless
quantity is the absolute square of the breakup amplitude.
5.2. Quasi-free scattering
In QFS the so-called spectator particle has little interaction
with the incoming proton. The peak of p-p QFS (neutron stays at rest
in the laboratory system) corresponds to the CM variables: &n - 180
and Tn = 1/9 T ^ = 5.6 MeV (T w = 22.9 MeV). In our *D array
representation of the data, this peak is most clearly seen in a
(^P . %p > 2D subarray with 6 < T K < 8 MeV and 165° < K < 180°
(less admixture of p-n QFS and p-n FSI than in the interval
4 < T n < 6 MeV).
In fig. 9 a suitably chosen "cut" through the above mentioned
(Tn ,^L ) subarray is shown. The <p value has been limited to
168° < <f> < 180° while cos^, runs from 0 to 1. The variable frpp
is related to the quasi-elastic two-body scattering angle/3 (see
fig. 8b) by the expression cos CD 3in9i_ = cosfl, which for (p = 0TFP rr r Tfp
:
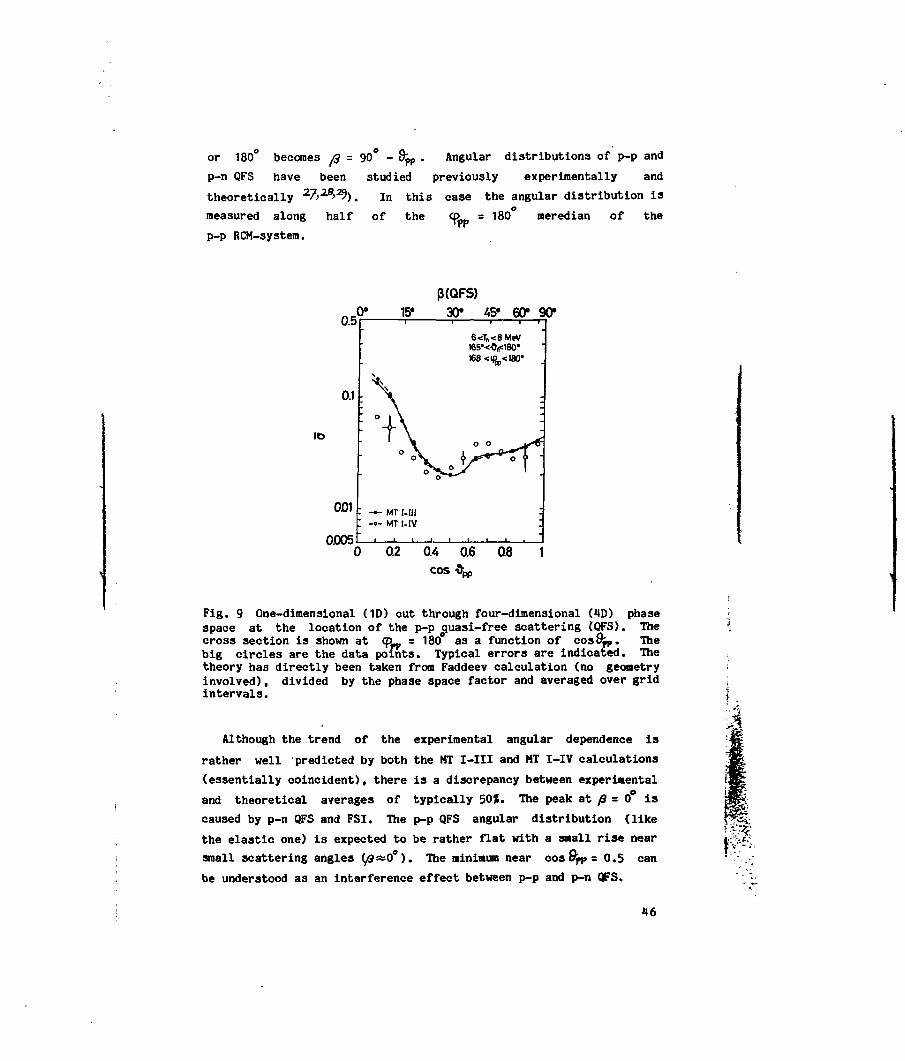
or 180° becomes ft = 90° - 8^, . Angular distributions of p-p and
p-n QFS have been studied previously experimentally and
theoretically 27>z8>29). In this case the angular distribution is
measured along half of the <f> = 180 meredian of the
p-p RCM-system.Tpp
0.5
0.1
.0*
Ib
001
0005
15#P(QFS)30* 45* 60* 90*
6<Tn<BMeV165*<-»rt«:180'168 <ip <180'
• MT [-111• MT I-1V
0.2 04 0.6cos -8-pp
0.8
Fig. 9 One-dimensional (1D) cut through four-dimensional (4D) phasespace at the location of the p-p uasi-free scattering (QFS). Thecross section is shown at cp , = 180° as a function of cos 8pp. Thebig circles are the data points. Typical errors are indicated. Thetheory has directly been taken from Faddeev calculation (no geometryinvolved), divided by the phase space factor and averaged over gridintervals.
Although the trend of the experimental angular dependence is
rather well predicted by both the MT I-III and MT I-IV calculations
(essentially coincident), there is a discrepancy between experimental
and theoretical averages of typically 50%. The peak at p = 0° is
caused by p-n QFS and FSI. The p-p QFS angular distribution (like
the elastic one) is expected to be rather flat with a small rise near
small scattering angles (/9^0°). The minimum near cos6jip = 0.5 can
be understood as an interference effect between p-p and p-n QFS.

QA?-_» 60* 75#
6 <Tn<SMeV
120«<en<135*
I | _
90*
180* 270* 360*
Fig. 10 Cut through a p-n QFS location at n , »120 . This is aso-called spiral cut according to the prescription
The p-n QFS is of course not localized in one (TK ,%.) subarray
but is distributed over a range of 6^ at a T^ which is a function of
fi^ . In the ( Ofo .<ppp) subarrays fulfilling this relation, the QFS
peak is indeed observed as a bump at the expected position.
Fig. 10 is not an n-p QFS angular distribution but depicts a
judiciously chosen spiral cut (according to the prescription
< & = 21TU-CO3 8^, )) through such a subarray together with
theoretical predictions. They show a reasonable agreement between
experiment and theory with discrepancies up to 50%. The structure in
the experimental data is somewhat less pronounced than the
theoretical prediction. A similar observation has already been made
for the 13.25 MeV data V When drawn on the unit-sphere in the
RCM-frame, these spiral cuts run from the north pole (Z-axis) to the
equator (X-Y plane) while making just one complete turn (360 ) around
the sphere. It crosses the p-n QFS peak twice: once at its tail
(<J> »150 ) and once near its centre (<p »315 ).
5.3. Symmetric constant relative energy loci
Since the work of Jain ) and Kloet z) the investigation of the
cross section along kinematical loci with fixed momentum triangle
i.e. constant relative energy loci (SCREL) has revealed discrepancies
with S-wave potentials ^tf&x*). For the second type of these loci
(see section 3) the quartet and doublet-triplet amplitudes
(M*f ,M* ) are zero 30 that only M*° contributes there.
In fig. 11 we plot data along these loci for two intervals in
Tn : 10 < Tn < 12 MeV in fig. 11a and 4 < T K < 6 MeV in fig. 11b.
The first graph contains the deep interference minimum and the most
symmetric kinematical point (indicated in the figure as M and S
respectively), where effects of three-body forces might show up (see
5.4). The second interval contains the p-p QFS peak at &K= 180 .
The loci where the M*1 and the M vanish occur in the Cramer and
Eidson RCM-system exactly at cos8^ = 1, i.e. at the Z-axis. We have
to take an interval with finite (rather large) width, however:
0.93 < cos flpp < 1 (0°< fij,p < 21°). Therefore, some contribution from
M* and Mx to these figures cannot be excluded, particularly
when one comes relatively close to QFS kinematics. To stay away fromo o
QFS, we restrict ourselves to the interval 24 < (R,- < 60 instudying the -dependence on . The momentum triangle being
fixed in these plots, fij, plays the same role as E n which is
normally used in the literature. The deep minimum as observed in our
present data (Ej, = 50 MeV) occurs at the same neutron CM angle as in
our 13.25 MeV-data, which was anticipated from theory. The quality
of fit in fig. 11a for both MT I-III and I-IV is good. In view of
earlier data") dealing with the minimum where we observed a
significant discrepancy between theory and experiment, we should keep
in mind that: the MT I-III theory had its (extremely deep) minimum
there, while here we are slightly away from that minimum, and the
present data are taken over a coarser grid. In fig. 11b, the forward
48
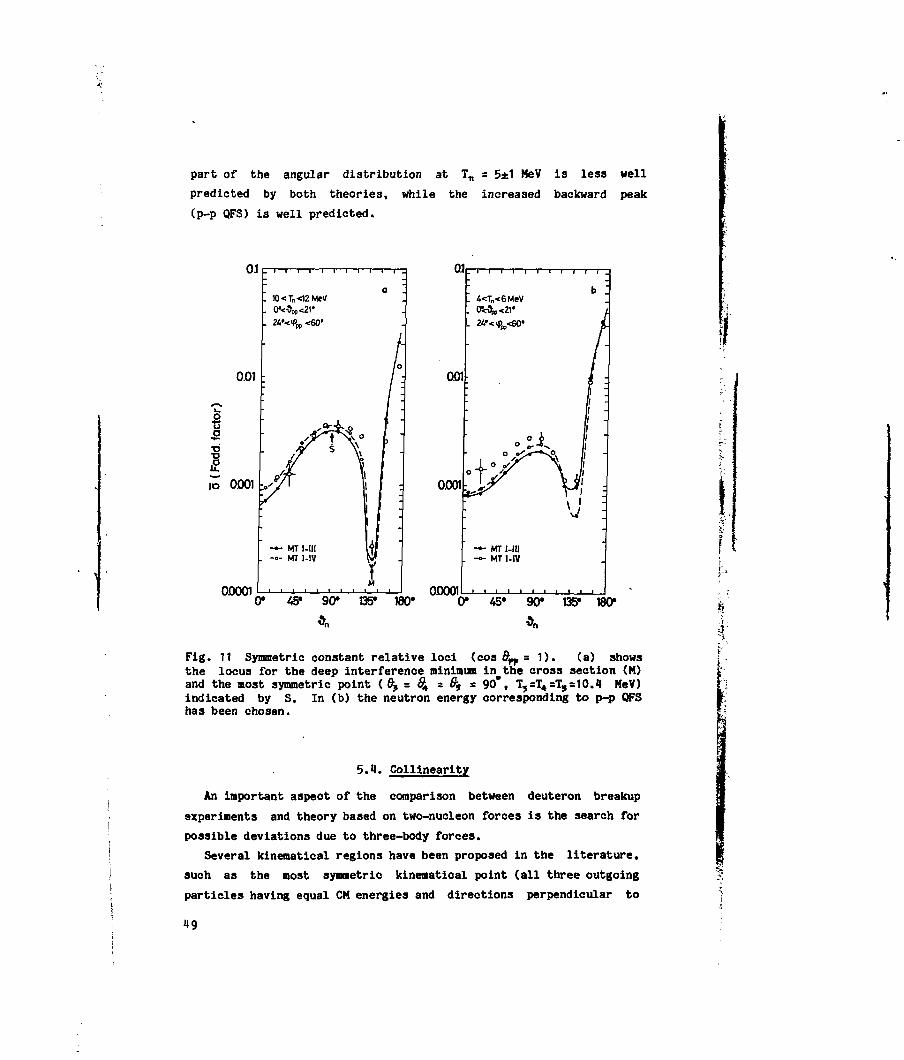
part of the angular distribution at Tn = 5±1 MeV is less well
predicted by both theories, while the increased backward peak
(p-p QFS) is well predicted.
0.1
. W<Tn<12MeV
. 0*<*w<21#
. 2<««Ppp<60>
0.01
otJ5•a
XJ
io 0001
00001
0
0.001
00001
— MT I-Hl-«- MT MV
0* 45' 90* 135* 180*
Fig. 11 Symmetric constant relative loci (cos 8^ = 1). (a) showsthe locus for the deep interference minimum in the cross section (M)and the most symmetric point ( flj = 8^ = 9-9 = 90*, T5=T4=T5=10.4 HeV)indicated by S. In (b) the neutron energy corresponding to p-p QFShas been chosen.
I
i"
5.«. Collinearity
An important aspect of the comparison between deuteron breakup
experiments and theory based on two-nucleon forces is the search for
possible deviations due to three-body forces.
Several kinematlcal regions have been proposed in the literature,
such as the most symmetric kinematical point (all three outgoing
particles having equal CM energies and directions perpendicular to

the beam-axis) ) or the most symmetric collinearity condition
(identical particles moving in the CM collinearly outward while
leaving the odd particle at rest) ).
Its
0.01
0.001
0<• 75
66
•
=-?,<2MeV•<*n<90'
i • i
•+- MT- o - MT
//o
7\
urn .i-re
'If-
:
•
0* 60* 120* 180*
Fig. 12 The cross section at collinearity. The odd particle is inthe middle; (J> is the independent variable, Tn = 0, 6^ and fipf areirrelevant. J>
The latter region has been studied by several groups *2~5°). For
pure collinearity the variation of the cros3 section with
collinearity direction ( ffi ) should be symmetric with respect to
cp = 90 . As an example the cross section along the cos 6^,-channel
with 003(9^*0.23 in the 4 - l n t e r v a l 75°< $i < 90° is given in
fig. 12. The shift of the pattern towards lower cp is due to the
width of the T^p-interval, allowing for a contribution of quasi-free
scattering. Data and Faddeev calculation are in good agreement,
except for a normalisation difference of 20-30% which is close to the
expected accuracy in absolute normalisation.

6. Conclusions
6.1. Experimental conclusions
The analysis with particle identification and Q-value selection on
the (700) detector pairs separately allowed clear separation between
the deuteron breakup process and other processes (elastic scattering,
carbon breakup etc.) (figs. 1, 2).
The three-body breakup cross section in four dimensions is
adequately sampled by the BOL system (fig. 5).
6.2. Comparisons
The data are here compared with Faddeev local potential model
theories at two widely different levels of detail: local comparisons
for the differential cross section in certain judiciously chosen
kinematical regions, and global comparisons in terms of the
percentage of phase space where a certain cross section value or
cross section difference occurs.
local comparisons
The regions studied in detail are: the deep interference minimum
(M) at a symmetric constant relative energy locus (SCREL), p-p quasi-
free scattering (QFS), p-n QFS, collinearity and the most symmetric
kinematical point (S).
The deep interference minimum is shown to be, at 50 MeV, almost a
"zero" in the theoretical cross section (7.10~Mnb/sra.MeV). The
four-dimensional structure of the cross section near the deep minimum
is strongly determined by the singlet (identical particles)
amplitude.
The theoretical position of the deep interference minimum is shown
to be remarkably sensitive to the choice of the N-N potential.
Near the deep minimum in the data (Tft a 11+1 MeV, Tp = 15 MeV) the
structure along a SCREL is well predicted by both the MT I-III and
MT I-IV model, while away from this minimum in terms of T^ a
discrepancy develops (fig. 11).
The angular dependence of p-p QFS is qualitatively well predicted
by both MT I-III and MT I-IV (nearly eonciding). Still, the observed
discrepancy seems significant in view of the overall quality of fit.
The p-n QFS is in good agreement with the MT I-III, both in shape
l
51
and in magnitude. One should keep in mind however that the data are
normalized to the full p-n QFS peak as predicted by the MT I-III
model.
Our data near collinearity and near the most symmetric point where
effects of three-body forces might be visible, do not show
significant discrepancies.
global comparisons
The MT I-III and MT I-IV prediction differ on the average ~15*
(MT I-IV being largest) with typical variations (HWHM) of ~±15X and
maximum differences of ~80!l.
The spectrum of relative differences (fig. 6) between MT I-III and
MT I-IV can be considered as a measure of the sensitivity of the
cross section to a variation of the N-N potential in the core region.
The "diserepancy"-spectrum of relative differences (fig. 6)
between experimental and MT I-III cross section reveals an average
discrepancy of ~10% (experiment being largest) a typical discrepancy
(HWHM) of ~±30X and maximum discrepancies of ~150%
The average discrepancy at low cross section - which covers a
large part of phase space (fig. 5a) - is typically 50X; in the part
of phase space that is not sensitive to variation in the core region
of the potential, the discrepancy at low cross section is less,
typically 30%, while in the core-sensitive part of phase space the
discrepancy at low cross section goes up to ~90J.
52

References
1) L.A.Ch. Koerts, K. Mulder, J.E.J. Oberski, and
R. van Oantzig, Nucl. Instr. 92(1971)157 and subsequent
articles
2) W.M. Kloet and J.A. Tjon, Nucl. Phys. A210(1973)380;
Ann. of Phys. 79(1973)407
3) R.A. Malfliet and J.A. Tjon, Nucl. Phys. A127(1969)161;
Ann. of Phys. 61(1970)425
4) W. van Genderen, Nucl. Instr. 54(1967)288
5) H. Arnold, Ph.D. thesis 1972, Univ. of Amsterdam
6) K. Mulder, Ph.D. thesis 1971, Univ. of Amsterdam
7) J.A. den Boer, A.M.E. Hoeberechts, W.K. Hofker,
D.P. Oosthoek, K. Mulder, L.A.Ch. Koerts, R. van Dantzig,
J.E.J. Oberski, J.H. Dieperink, E. Kok and R.F. Rumphorst,
Nucl. Instr. 92(1971)173
8) J.E.J. Oberski, Ph.D. thesis 1971, Univ. of Amsterdam
9) R. van Dantzig, J.E.J. Oberski, K. Mulder, L.A.Ch. Koerts,
J.E.P. de Bie, W.C.M. Biekroann, P.G. van Engen, A.J. Mars,
R.P. Meesters, M.A.A. Sonnemans and J.L. Visschers,
Nucl. Instr. 92(1971)199
10) M.A.A. Sonnemans, Ph.D. thesis 1972, Univ. of Amsterdam
11) R. van Dantzig, L.A.Ch. Koerts, J.E.J. Oberski, K. Mulder,
Th.F. de Ridder, M.A.A. Sonnemans, B.J. Wielinga,
A.D. IJpenberg, W.C.M. Biekmann, P.G. van Engen, A.J. Mars,
R.P. Meesters, J.L..C.N.M. Suys and S.J.A.M. Toenbreker,
Nucl. Instr. 92(1971)205
12) B.M. Bardin arid M.E. Rickey, Rev. Sei. Instr. 35(1964)902;
R. Smythe, Rev. Soi. Instr. 35(1964)1197
13) G.J.F. Blommestijn, Y. Haitsma, R. van Dantzig and I. Slaus,
Proc. VII Int. Conf. on few body problems in nuclear and
particle physics, Delhi, 1975, ed. A.N. Mitra, I. Slaus,
V.H. Bhasin and V.K. Gupta (North-Holland, Amsterdam, 1976)
}
53

14) R.F. Carlson, P. Doherty, D.Y. Margaziotis, I. §laus,
S.Y. Tin and W.T.H. van Oers, Nuovo Cim. Lett. 8(1973)319
15) B.J. Wielinga, J.R. Balder, G.J.F. Blommmestijn,
R. van Dantzig, W.M. Kloet, J.A. Tjon and I. âlaus,
Nucl. Phys. A261(1976)13
16) G.J.F. Blommestijn, R. van Dantzig, Y. Haitsma,
R.B.M. Mooy and I. Slaus, submitted to Nucl. Phys.;
ch. 2 of this thesis
17) A.M. McDonald, D.I. Bonbright, W.Th.H. van Oers,
J.W.Watson, J.G. Rogers, J.M. Cameron, J. Soukup,
W.M. Kloet and J.A. Tjon, Phys. Rev. Lett. 34(1975)488
18) J.H. Stuivenberg, Ph.D. thesis 1976, Free University Amsterdam;
J.H. Stuivenberg and R. van Wageningen, Nucl. Phys. A304(1978)1lH
19) M. Jain, J.G. Rogers and D.P. Saylor, Phys. Hev. Lett. 31(1973)838
20) W.Th.H. van Oers, Proc. VII Int. Conf. on few body
problems in nuclear and particle physics, Delhi, 1975,
ed. A.N. Mitra, I. Slaus, V.H. Bhasin and V.K. Gupta
(North-Holland, Amsterdam, 1976) p.746
21) J. Bruinsma, Ph.D. thesis 1976, Free University Amsterdam
22) C. Stolk and J.A. Tjon, Phys. Rev. Lett. 39(1977)395;
Nucl. Phys. A319(1979)1
23) Y. Yamaguchi and Y. Yamaguchi, Phys. Rev. 95(1954)1635
24) G.J.F. Blommestijn, R. Mooy, R. van Dantzig and I. Slaus,
Proc. VIII Int. Conf. on Few body systems and nuclear forces,
Graz, 1978, ed. H. Zingl, M. Haftel and H. Zankel
(Springer-Verlag, Berlin, 1978) p. 201
25) J.G. Cramer Jr. and W.W. Eidson, Nucl. Phys. 55(1964)593
26) K. Gottfried and J.D. Jackson, Nuovo Cim. 33(1964)309
27) M.I. Haftel, I. Slaus, D.L. Shannon, M.B. Epstein,
W.T.H. van Oers, G. Anzelon, E.L. Petersen and W. Breunlich,
Nucl. Phys. A269(1976)359
r
54
28) E.L. Petersen, M.I. Haftel, R.G. Allas, L.A. Beach,
R.O. Bondelid, P.A. Treado, J.M. Lambert, M. Jain and
J.M. Wallace, Phys. Rev. C9(1974)508
29) V.K.C. Cheng and P.G. Roos, Nucí. Phy3. A225(1974)397
30) D.I. Bonbright, A.M. McDonald, W.T.H. van Oers,
J.W. Watson, H.S. Caplan, J.M. Cameron, J.G. Rogers,
J. Soukup, W.M. Kloet, C. Stolk and J.A. Tjon,
Phys. Rev. C20(1979)879
3 D S.N. Yang, Phys. Rev. 010(1974)2067
32) J.M. Lambert, P.A. Treado, R.G. Alias, L.A. Beach,
R.O. Bondelid and E.M. Diener, Phys. Rev. C13(1976)43
33) J. Kecskeméti, T. Czibók and B. Zeitnitz,Nucl. Phys. A254(1975)110
34) T. Yuasa, H. Nakamura-Yokota and N. Fujiwara,
Suppl. Prog. Theor. Phys. 61(1977)161
35) N. Fujiwara, E. Hourany, H. Nakamura-Yokata, F. Reide
and T. Yuasa, Phys. Rev. C15(1977)4
36) J. Birchall, M.S. de Jong, M.S.A.L. Al-Ghazi, J.S.C. McKee,
W.D. Ramsay and N. Videla, Proc. VIII Int. Conf. on Few
body systems and nuclear forces, Graz, 1978, ed. H. Zingl,
M. Haftel and H. Zankel (Springer-Verlag, Berlin, 1978) p. 203;
Bull. Am. Phys. Soc. 24(1979)569
55

IV. THE REACTION d(p,pp)n AT E = 50 MEV ANALYSED
IN COMPLETE THREE BODY PHASE SPACE
1. Introduction
In an earlier publication 1) we described a proton deuteron
breakup experiment with the BOL multidetector system 2) at
Ep = 50 MeV and its analysis. All data were brought together in a
four dimensional (4D) cross section matrix, since the kinematical
phase space for three particles in the final state is four
dimensional. With the BOL detection system almost the entire phase
space has been sampled. Our particular set of four independent
kinematical variables ') describing the three-body final state phase
space is shown in insert (e) of fig. 1. The neutron energy in the
centre of mass (CM) system, Tn, is connected to the relative energy
of the two protons, Tpf) ("excitation energy" in the "diproton"
system), and (J, the total available energy in the CM system (here
U = 31 MeV) by:- Tn = -| (U-Tpp ).
We present two-dimensional (2D) plots of data and theoretical
predictions, obtained by integration over two of the four kinematical
variables. This integration is made possible by the Uff-type coverage
of our detection system. The integrated data make it easier to
evaluate and understand the complex tD-structure of the experiment.
They also provide better statistical accuracy and minimize effects of
missing detection efficiency. More fundamentally, they allow a
simplified interpretation of the data in terms of standard two-body
reaction dynamics.
Some of our comparisons between data and calculations will be
displayed in a quantitative way, using selected cuts through the 2D
cross section surfaces. Finally we summarize our conclusions based
on these 2D-integrated BOL-data.
2. Integration over direction of p-p relative momentum
In fig. 1a the theoretical p-d breakup cross section is
displayed as a function of the neutron centre of mass angle &n for
U = 31 MeV and for neutron energy (Th) values ranging from 0 to
20 MeV in intervals of ^MeV, integrated over all values of the two
other kinematical variables for full (4TT, all energies) detection.
The upper bound in T n of 20 MeV has been chosen to exclude most of
the p-p final state interaction (FSI) region 0 < T-,_< 1.2 MeV, where
56
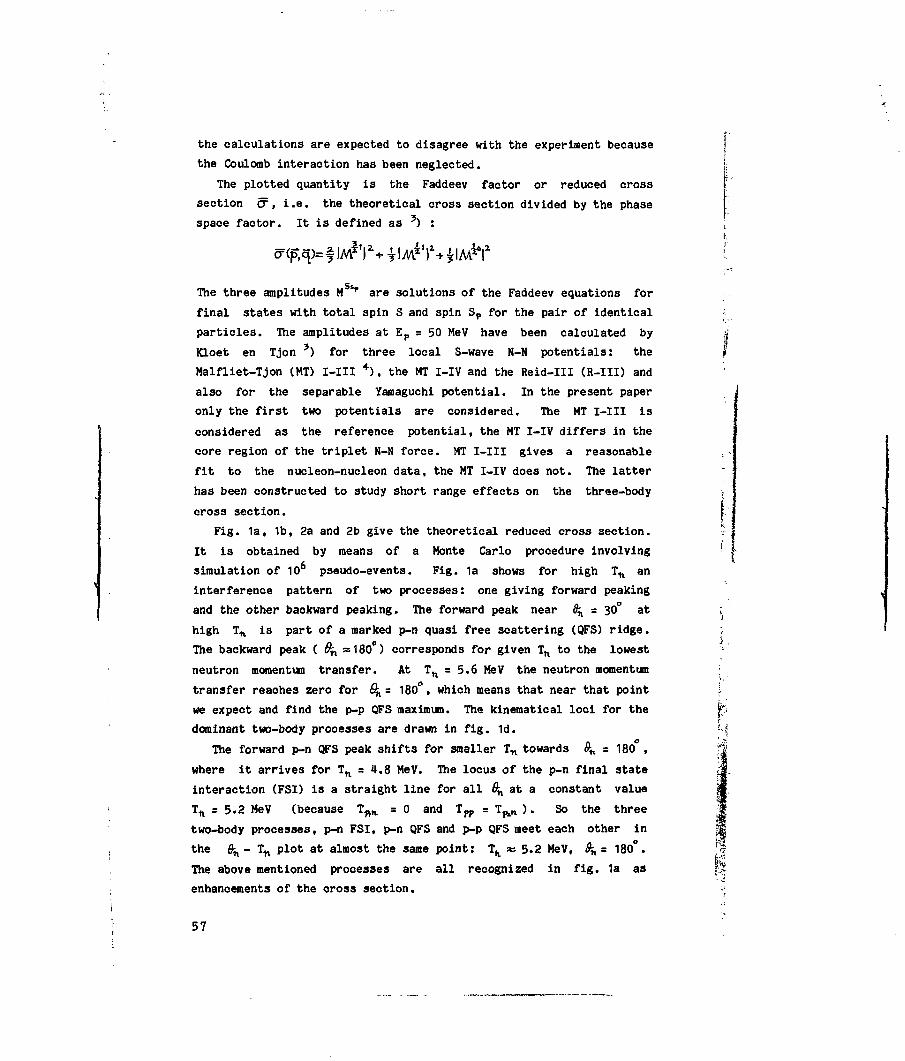
the calculations are expected to disagree with the experiment because
the Coulomb interaction has been neglected.
The plotted quantity is the Faddeev factor or reduced cross
section cr , i.e. the theoretical cross section divided by the phase
space factor. It is defined as ?) :
The three amplitudes M *r are solutions of the Faddeev equations for
final states with total spin S and spin Sp for the pair of identical
particles. The amplitudes at Ep = 50 MeV have been calculated by
Kloet en Tjon ') for three local S-wave N-N potentials: the
Malfliet-Tjon (MT) I-III 4 ) , the MT I-IV and the Reid-III (R-III) and
also for the separable Yamaguchi potential. In the present paper
only the first two potentials are considered. The MT I-III is
considered as the reference potential, the MT I-IV differs in the
core region of the triplet N-N force. MT I-III gives a reasonable
fit to the nucleon-nucleon data, the MT I-IV does not. The latter
has been constructed to study short range effects on the three-body
cross section.
Fig. 1a, 1b, 2a and 2b give the theoretical reduced cross section.
It is obtained by means of a Monte Carlo procedure involving
simulation of 10 pseudo-events. Fig. 1a shows for high 1n an
interference pattern of two processes: one giving forward peaking
and the other backward peaking. The forward peak near d-n = 30° at
high Tn is part of a marked p-n quasi free scattering (QFS) ridge.
The backward peak ( (5 ,5=180°) corresponds for given Th to the lowest
neutron momentum transfer. At T^ = 5.6 MeV the neutron momentum
transfer reaches zero for &n = 180°, which means that near that point
we expect and find the p-p QFS maximum. The kinematical loci for the
dominant two-body processes are drawn in fig. id.
The forward p-n QFS peak shifts for smaller Tn towards 8* = 180°,
where it arrives for Tn = 4.8 MeV. The locus of the p-n final state
interaction (FSI) is a straight line for all ^ at a constant value
Tft s 5.2 MeV (because Tfln. = 0 and T^, = 7^ ). So the three
two-body processes, p-n FSI, p-n QFS and p-p QFS meet each other in
the fi^ - Tn plot at almost the same point: TK * 5.2 MeV, #, = 180°.
The above mentioned processes are all recognized in fig. la as
enhancements of the cross section.
•j
Ik
57
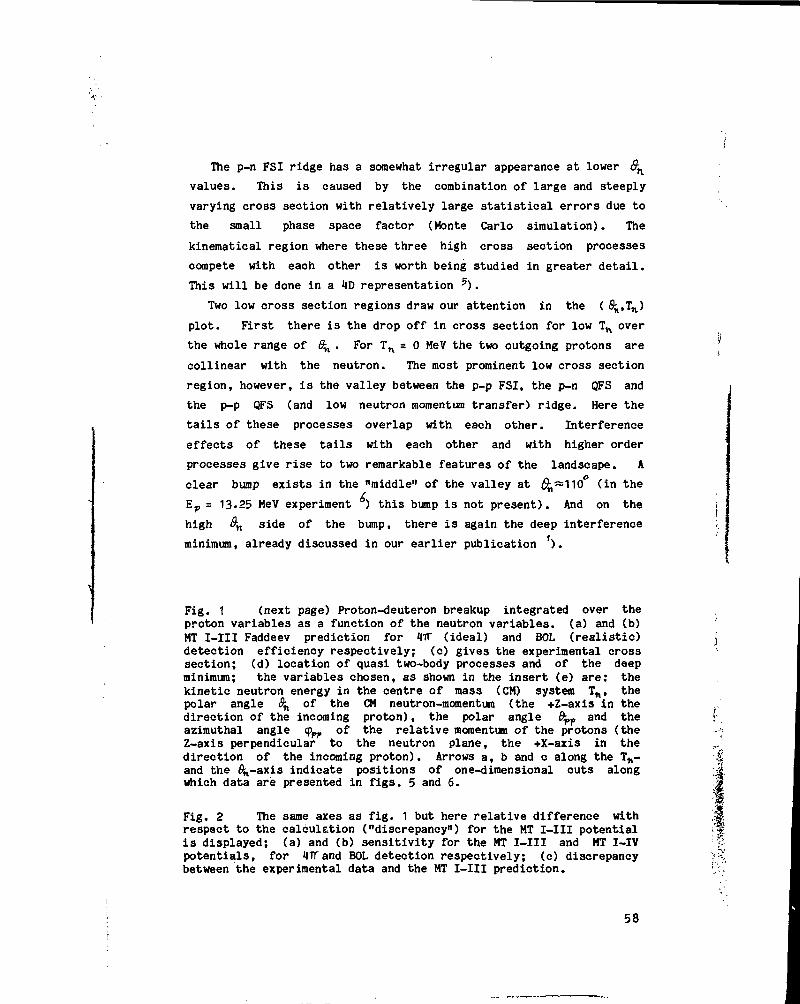
The p-n FSI ridge has a somewhat irregular appearance at lower &n
values. This is caused by the combination of large and steeply
varying cross section with relatively large statistical errors due to
the small phase space factor (Monte Carlo simulation). The
kinematical region where these three high cross section processes
compete with each other is worth being studied in greater detail.
This will be done in a 4D representation 5 ) .
Two low cross section regions draw our attention in the ( S^,TK)
plot. First there is the drop off in cross section for low Th over
the whole range of &n . For T n = 0 HeV the two outgoing protons are
collinear with the neutron. The most prominent low cross section
region, however, is the valley between the p-p FSI, the p-n QFS and
the p-p QFS (and low neutron momentum transfer) ridge. Here the
tails of these processes overlap with each other. Interference
effects of these tails with each other and with higher order
processes give rise to two remarkable features of the landscape. A
clear bump exists in the "middle" of the valley at £$,—110 (in the
E p = 13-25 MeV experiment ) this bump is not present). And on the
high 8ft side of the bump, there is again the deep interference
minimum, already discussed in our earlier publication ).
Fig. 1 (next page) Proton-deuteron breakup integrated over theproton variables as a function of the neutron variables, (a) and (b)MT I-III Faddeev prediction for HIT (ideal) and BOL (realistic)detection efficiency respectively; (c) gives the experimental crosssection; (d) location of quasi two-body processes and of the deepminimum; the variables chosen, as shown in the insert (e) are: thekinetic neutron energy in the centre of mass (CM) system Tn, thepolar angle <%, of the CM neutron-momentum (the +Z-axis in thedirection of the incoming proton), the polar angle fij,p and theazimuthal angle <p of the relative momentum of the protons (theZ-axis perpendicular to the neutron plane, the +X-axis in thedirection of the incoming proton). Arrows a, b and c along the T*-and the f^-axis indicate positions of one-dimensional cuts alongwhich data are presented in figs. 5 and 6.
Fig. 2 The same axes as fig. 1 but here relative difference withrespect to the calculation ("discrepancy") for the MT I-III potentialis displayed; (a) and (b) sensitivity for the MT I-III and MT I-IVpotentials, for 4TTand BOL detection respectively; (c) discrepancybetween the experimental data and the MT I-III prediction.
58

' ^ • • y *
. 0 V^: -t.'" "=- ,A
59

60

The minimum which is extremely deep in 4D, is somewhat filled up in
this 2D-plot due to the integration over p-p directions. Due to
their inhomogeneity, it is impossible to remove in the data all
detection efficiency effects in a model-independent way. Therefore
fig. 1b displays the theoretical MT I-III prediction for the actual
BOL detection geometry. This figure has been obtained by selecting
the (with BOL) detectable pseudo-events from the Monte Carlo sample
to build up the 2D ( #, ,Tn ) matrix which is then element by element
divided by a detection efficiency matrix and a phase space density
matrix. Three effects of the loss of detection for parts of the
phase space can be observed in fig. 1b:
1. The p-n FSI enhancement is suppressed due to some loss ofo
detection efficiency in the target plane under an angle of 45 with
the beam and broadened due to integration over the width of the
energy-bins.
2. The missing data in the low 9 , high T n corner correspond to
small energies of both protons. The events in this region can
experimentally not be identified as proton-proton coincidences and
have been removed.
3. A dip occurs in the p-n QFS ridge, caused by absorption of the
spectator-proton in the target at very small momentum.
Comparison between fig 1a and 1b teaches us to what extent the BOL
system appropriately samples this particular 2D (integrated) phase
space.
Turning now to the experimental data, fig. 1c gives the measured
breakup cross section divided by efficiency and phase space
dependence, and integrated over p-p relative momentum orientations.
The efficiency function was obtained as the ratio f /f , with
f (#^,Tn> and f4 ( fi-h,T«) as the numbers of counts from a Monte
Carlo simulation based on the Faddeev calculation for the MT I-III in
the case of experimental (f801") and ideal (f4W) detection
sensitivity. It reproduces remarkably well the main structure of the
Faddeev prediction (fig. 1b). A more detailed comparison is obtained
by looking at the differences between theory and experiment. In
fig. 2c the relative differences
i-npIs
1-TST)
61

called "discrepancy" have been plotted. The prominent peak at
Tn = 20 MeV and #h = 90° can partly be caused by the absence of
electromagnetic interaction in the calculation. We have already left
out the data for 0 MeV < Tpp < 1.2 HeV (corresponding to
20 MeV < Tn < 20.8 MeV) but the significance of the Coulomb
interaction seems to extend to higher Tpp than was expected from
earlier 13.25 MeV data. Also the discrepancy at the p-p QFS
condition ( 6 ,= 18o", TH = 5.6 MeV) might in principle arise from
Coulomb effects. Future Faddeev type calculations 7) which include
the Coulomb interaction in the breakup channel hopefully will provide
answers to these questions.
Like in the 13.25 MeV data 6 ) , another important
"discrepancy"-region is located around the kinematical situation of
the deep minimum. The structure is now more complex.
It is interesting to compare the pattern of relative differences
between data and theory with that of the differences between the two
theories:
5=(MT I-IT) -&(MT ME)
This quantity is called "sensitivity" (for discrimination between one
theory and another), in this case (MT I-III, MT I-IV) sensitivity to
the core region of the interaction. Fig 2a and b give the (fi^,TH)
sensitivity plots for 4TT and BOL-detection geometry respectively.
The Y-shaped enhancement in the sensitivity shows a resemblance with
the discrepancy enhancement near the position of the deep minimum.
It is tempting to draw as a preliminary conclusion from this
resemblance that the core region of the nucleon-nudeon interaction
in the triplet channel (where the essential difference between the
MT I-III and the MT I-IV potential is located) is related to certain
deficiencies of the MT I-III local potential prediction. However, on
the other hand the shape of the very low cross section valley itself
can also give rise to the common shape in the sensitivity and the
discrepancy, because low cross section regions are more liable to
changes due to deficiencies in the theory.
62

otth/"
0.002
O003
0.005.
0.008
0.013
0.02
0.03
0.05
Fig. 3 The three-body breakup cross section as in fig. 1 integratedover the neutron variables (Tn and 8^ ) as a function of cos 9^ andtpin the recoil-centre of mass system (see fig. 1e). ™
63

CD
0 180°
-107o - • 10°/o
10%- 20%
207o- 30%
- 50%
507o - 60%
607«- 70%
70% - 8 0 %
Fig. t Relative differences as in f i g . 2. Th, denotes MT I - I I I ;t h i denotes MT I-IV. The data are integrated over Tn and 8^ andplotted as functions of cos 6^, and <ppp .

3. The data integrated over neutron-momentum
One can reduce the 4D- to a 2D-breakup cross section also by
integrating over the neutron variables Tn and 9^ . As
coordinate-frame, the Recoil-Centre of Mass (RCM) system introduced
by Cramer and Eidson 8) is employed. In this system the origin is
the centre of mass of the two protons. The Z-axis is perpendicular
to the reaction plane defined by the momenta of the incident proton
and the outgoing neutron. The beam direction is chosen as the
X-axis.
The theoretical and the experimental daca and their difference as
a function of S^p and <pp_ , integrated over neutron-momentum
(excluding T , < 1.2t2 MeV) are shown in fig. 3 and 4. In the chosen
representation trivial symmetry in the cross section due to p-p
identity and due to mirror symmetry with respect to the reaction
plane is taken into account. The statistics is improved by adding
data for corresponding points in the four 8^,, f^ quadrants and
displaying only one of them. In fig. 3a the integrated MT I-III
Faddeev cross section, based on the calculation of Kloet and Tjon ')
is given. One observes a simple structure peaked in the reaction
plane at an angle of 150° with the incoming proton. Keeping in mind
the definition of the angles, one recognizes that the pattern has
approximately rotational symmetry and is characterized simply by a
low cross section "equatorial" band around this "pole". It reminds
us of a similar structure (band (3, pole A) which was found in the
13.25 MeV p-d breakup data ). In a forthcoming publication *) this
structure will be analyzed in some detail.
Going from fig. 3a to 3b we see that leaving out the
detection-insensitive areas in the simulation only slightly modifies
the structure, which means that also here the experimental sample is
adequate for ftr studies. Qualitatively there is agreement between
theory and experiment in fig. 3b and c respectively. In the low
cross section band, the data are larger than the theory. This (like
also fig. 1b and c) shows both the global success and the local
shortcomings of the Faddeev prediction for a simple S-wave potential.
The experimental cross sections, not being calibrated on an
absolute scale, have been scaled to the theoretical prediction
f
;>t s
65

(MT I - I I I ) , a t the p-n QFS peak near <p = 159 . &•„= 85 . The
valley at cfyp»40° in the experimental cross section is less deep
(50J increase) and shifted compared to the theory. The largest
relative difference (75*) which is essentially due to the shifted
valley occurs at w s=75 (fig. 4c), almost 35 in (0 away from the
minimum in <x. A further analysis ?) shows that this is the averaged
effect of a large discrepancy in 4D between theory and experiment.
Fig. 4a and b show, similar to fig. 2, sensitivity to the presence
of a triplet hard core in the Malfliet-Tjon potential. The largest
sensitivity is halfway between the peak and the valley of a , not far
from the most significant deviation between experiment and theory.
This suggests that the core region of the potential might be of
importance for improvement of the interaction.
4. One dimensional cuts
Although 2D plots give a complete and connected picture of a
large number of data points, they lack the clarity and accuracy of
one dimensional (1D) cuts. Locations of some of these cuts through
the ( S^,Th) and (<P ,cos$^) cross section surfaces are indicated in
fig. 1a and 3a.
Cuts parallel to the neutron energy axis and chosen at three
different backward neutron angles are given in fig. 5- While running
through regions with widely different kinematical and dynamical
features they all exhibit some significant discrepancies between
theory and experiment.
In fig. 5a (most backward &h) the MT I-III and I-IV potential
calculations agree remarkably well with each other while the data
near the p-p QFS peak are higher by about a factor 2. At Tn^18 MeV
another discrepancy appears, which may be understood as due to the
absence of Coulomb interaction in the model. It thus seems that the
Coulomb influence extends at least to 3 MeV in I—, which is twice
as far as for the 13.25 MeV data ). Also the discrepancy at the p-p
QFS region around Tn = 6 MeV may in principle be due to Coulomb
effects. The low Tn points suffer from considerable statistical
errors due to the relatively small amount of phase space present at
the edges of the (^,Tn) plot.
t..
66

IO
0.02
•PP
30 25 20 15 10 5c)
0002
interference minimum R ° P»
—MT l-III—MT I-1Vo data
0 A 8 12 16 20Tn
Fig. 5 Reduced breakup cross section integrated over flj^and qp , , asa function of the neutron CM energy for three values of the neutronCM angle frh, indicated by a, b and c in f ig . 1a. Circles areexperimental points; errors have been indicated for some of thepoints.
67
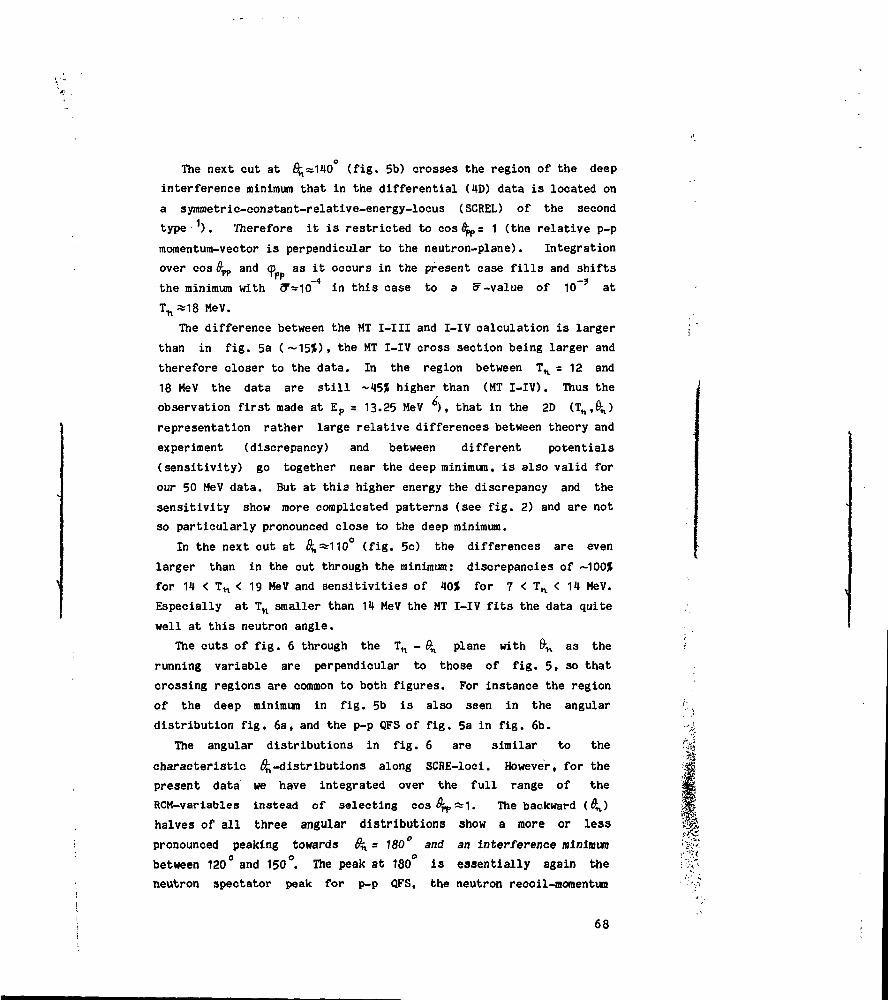
The next cut at %~140 (fig. 5b) crosses the region of the deep
interference minimum that in the differential (4D) data is located on
a symmetrie-constant-relative-energy-locus (SCREL) of the second
type-'). Therefore it is restricted to c o s ^ = 1 (the relative p-p
momentum-vector is perpendicular to the neutron-plane). Integration
over cos #j,p and cp as it occurs in the present case fills and shifts
the minimum with CT»10~ in this case to a ?-value of 10~3 at
1^*18 MeV.
The difference between the MT I-III and I-IV calculation is larger
than in fig. 5a (~15S). the MT I-IV cross section being larger and
therefore closer to the data. In the region between TK = 12 and
18 MeV the data are still ~45% higher than (MT I-IV). Thus the
observation first made at Ep s 13.25 MeV ^ ) , that in the 2D (T,,,! )
representation rather large relative differences between theory and
experiment (discrepancy) and between different potentials
(sensitivity) go together near the deep minimum, is also valid for
our 50 MeV data. But at this higher energy the discrepancy and the
sensitivity show more complicated patterns (see fig. 2) and are not
so particularly pronounced close to the deep minimum.
In the next cut at #,=110° (fig. 5c) the differences are even
larger than in the cut through the minimum: discrepancies of ~100t
for 14 < T n < 19 MeV and sensitivities of 40* for 7 < T n < 14 MeV.
Especially at Tn smaller than 14 MeV the MT I-IV fits the data quite
well at this neutron angle.
The cuts of fig. 6 through the Th - plane with 8^ as the
running variable are perpendicular to those of fig. 5, so that
crossing regions are common to both figures. For instance the region
of the deep minimum in fig. 5b is also seen in the angular
distribution fig. 6a, and the p-p QFS of fig. 5a in fig. 6b.
The angular distributions in fig. 6 are similar to the
characteristic ^-distributions along SCRE-loci. However, for the
present data we have integrated over the full range of the
RCM-variables instead of selecting cos i pSri. The backward (&^)
halves of all three angular distributions show a more or less
pronounced peaking towards &^= 180° and an interference minimum
between 120° and 150°. The peak at 180° is essentially again the
neutron spectator peak for p-p QFS, the neutron recoil-momentum
68

(i.e. momentum transfer) for a fixed Tn being lowest at 6 = 180 .
In terms of the Impulse Approximation (IA) the spectator peak is
largely dominated by the formfactor of the deuteron in momentum
space. As will be discussed seperately 5 ) , IA-considerations are
still usefull in the Faddeev-era to explain symmetries in the
ID-pattern of the QFS cross section.
At last, fig. 6c (for low 1n) shows good agreement between the
data and both theories.
The figures 7,8 and 9 show cross section data along cuts through
the diproton decay angular correlation plots in fig. 3 and 4, which
have a relatively smooth and structureless appearance. This can be
understood because low angular momenta in the p-p RCM system are
expected to dominate at Ep = 50 MeV for several quasi two body
processes (p-p FSI, p-p QFS) with large cross section. Moreover,
structure due to higher partial waves in the p-p system is more
easily washed out than low partial wave structure by the integration
over neutron direction and energy. The two body processes that
dominate the (fh,Tn)-plots do not have fixed kinematics in the
(cp,cos p)-correlations, except for the p-n QFS peak at <&,, = 150 ,
cos 8pp= 0. Nevertheless, all quasi two body (i.e. coplanar)
processes are \02ated along the line cos <S = 0 and the SCRE-loci
(important in connection with structure due to deep minima) are found
at cos &p= 1. Information on cross sections calculated with more
realistic potentials than MT, and on measurements at special
kinematics can be found in the literature 9). There it has been
indicated that higher partial waves and tensor interaction are
important improvements to the N-N potentials. Faddeev calculations
ising these new potentials will probably decrease the discrepancy
between theoretical predictions and our data.
Fig. 7 shows a cut parallel to the cos ,-axis (maximum
coplanarity at cos^s 0, minimum at 1). It has been chosen as an
example of a cut through a truely featureless landscape (the
expression, originally used for the allegedly flat region of low
cross section in the three-body -rtiase space away from the quasi
two-body processes). A remarkable aspect is the good agreement
between data and theory in this region.
•1I69

0.1
0.01
0.001
Fig. 6 Breakup cross section integrated over 9^, and tyn , as afunction of the neutron CM angle, 9^ , for three values of the neutronCM energy T^ (as indicated in fig. 1a).
70
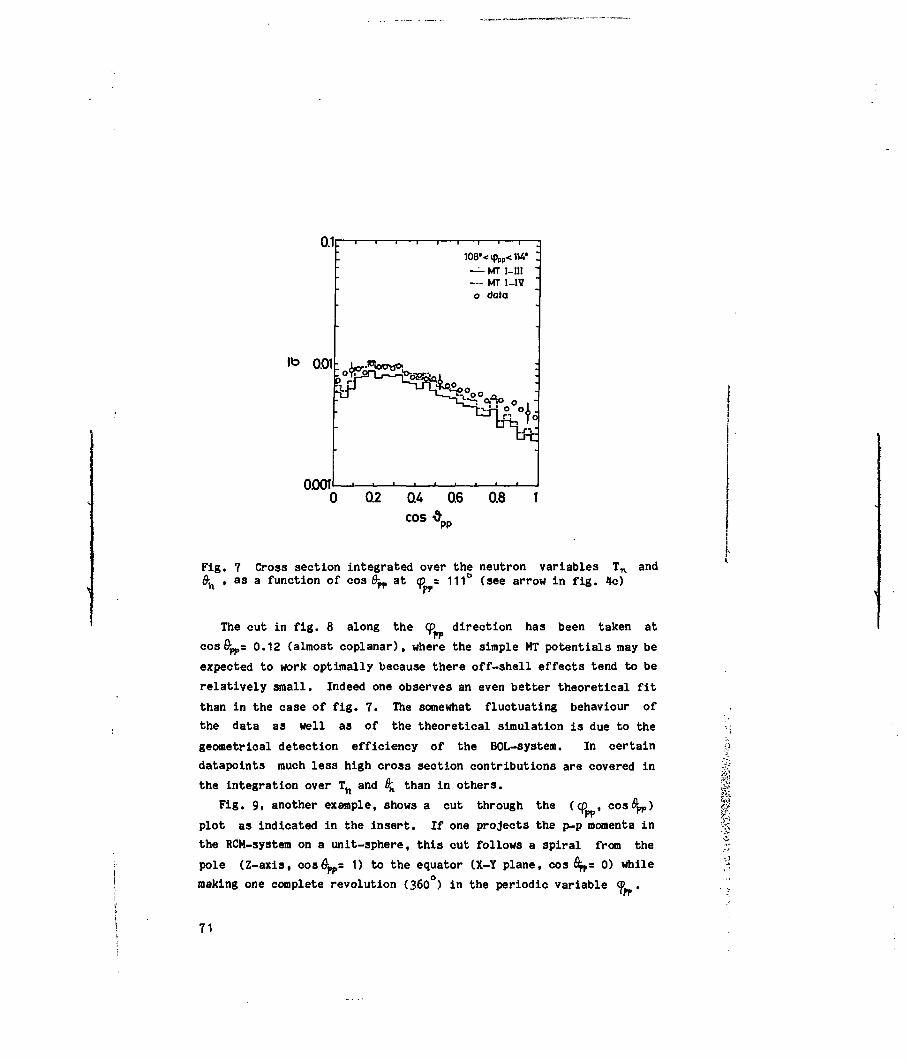
0.1
0001
— MT I—III— MT 1-IVo data
0.2 OAcos
0.6 0.8 1
pp
Fig. 7 Cross section integrated over the neutron variables T n and£H , as a function of cos 6^, at = 111 (see arrow in fig. 4c)
The cut in fig. 8 along the cp direction has been taken at
cosd^s 0.12 (almost coplanar), where the simple MT potentials may be
expected to work optimally because there off-shell effects tend to be
relatively small. Indeed one observes an even better theoretical fit
than in the case of fig. 7. The somewhat fluctuating behaviour of
the data as well as of the theoretical simulation is due to the
geometrical detection efficiency of the BOL-system. In certain
datapoints much less high cross section contributions are covered in
the integration over T n and 6^ than in others.
Fig. 9, another example, shows a cut through the (cp , cos ft-,)Tpp rr
plot as indicated in the insert. If one projects the p-p momenta in
the RCM-system on a unit-sphere, this cut follows a spiral from thepole (Z-axis, cosfyps 1) to the equator (X-Y plane, cos fi^= 0) while
making one complete revolution (360°) in the periodic variable <J> .
I
71
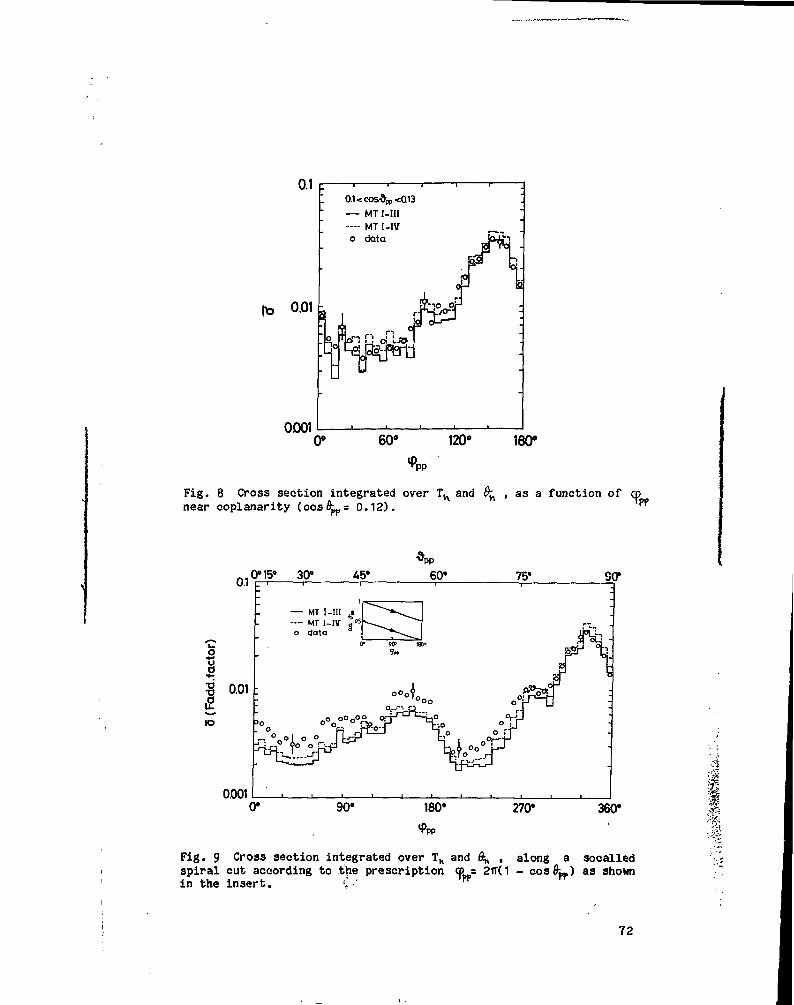
0.1c
0001
0.1<cos'&pp<0.13
— MT I-lll— MT I-IVo data
0° 60" 120° 180°
F i g . 8 Cross s e c t i o n i n t e g r a t e d over TH and ^ , a s a func t ion of qpnear coplanarity (cosnLp= 0.12).
0.1 P0°15» 30° 60*
S.ID
0.01 :
75*
0.00190* 180# 270*
SO*
o
•
:
. or-. °o°i °
1
MT I—III ,MT I-IV ',data
o FLj
i 1—
•""
i _ _
1
—1_
•JT :
• o f f
360*
Fig. 9 Cross section integrated over Th and 6* , along a socalledspiral cut according to the prescription a> = 2tr(1 - cos&_) as shownin the insert . <1 •' ^
72
This cut has been chosen because it crosses the regions of largest
discrepancy as well as the p-n QFS peak (where data and theory have
been scaled). In the noncoplanar part of the plot (0 < tt^ < 60 ,
0 < Cp < 180 ), discrepancies up to 70% occur. In the relatively
high cross section region where the spiral cut crosses the tail of
the p-n QFS (at q>= 150 ) the discrepancies still amount to ~50X.rr
These discrepancies are too large compared with the errors of ~12%,
to be remedied by a change in potential like the change from MT I-III
to MT I-IV.
5. Conclusions
The BOL detection geometry provides a valid sampling of the
three-body final state phase space at least to the extent shown in
the presented integrated figures.
The proton-deuteron breakup cross section at 50 MeV proton energy,
integrated over the two p-p RCM variables, gives a condensed
two-dimensional picture of the most prominent features of the cross
section: p-p and p-n final state interaction (FSI), p-p and p-n
quasi free scattering (QFS) and the deep interference region. The
overall structure of the cross section is qualitatively remarkably
well predicted by the calculation with both potentials.
Quantitatively, one observes some regions of discrepancy between
theory and data up to ~100)6 (the most prominent one around d^s110 ,
T^*17 MeV), while the experimental errors are typically 15*.
Only part of the relative differences between data and theory
exhibit a correlation in kinematics with corresponding differences
between the MT I-IV and the MT I-III predictions which, however, do
not give the sane fit to the N-N phase shifts. This suggests that
only part of the discrepancy is caused by particular shortcomings of
the N-N potential in the core region, where the MT I-III and I-IV
differ.
In the data integrated over neutron momentum, a rotationally
symmetric cross section pattern is observed resembling the band
(/?-locus) in the 13.25 MeV data, which indicates a common underlying
mechanism. This will be discussed in a forthcoming publication ^ ) .
A kinematical shift in the variable <p between theory and data of
the low cross section region in the angular correlation plots is
73
observed. Other potentials (including Coulomb, higher partial waves
and tensor interaction) will have to be used in the Faddeev
calculations to come to an understanding of this shift and of other
aspects of the discrepancy between theory and experiment.
References
1) G.J.F. Blommestijn, R. van Dantzig, Y. Haitsma,
R.B.M. Mooy and I. Slaus, to be submitted to Nucl. Phys.;
ch. 3 of this thesis
2) L.A.Ch. Koerts, K. Mulder, J.E.J. Oberski and
R. van Dantzig, Nucl. Instr. 92(1971)157
3) W.M. Kloet and J.A. Tjon, Nucl. Phys. A210(1973)380;
Ann. of Phys. 79(1973)^07
4) R.A. Malfliet and J.A. Tjon, Nucl. Phys. A127(1969)161;
Ann. of Phys. 61(1970)425
5) G.J.F. Blommestijn, R. van Dantzig, Y. Haitsma,
R.B.N. Mooy and I. Slaus, to be submitted to Nucl. Phys.;
ch. 5 of this thesis
6) G.J.F. Blommestijn, R. van Dantzig, Y. Haitsma,
R.B.M. Mooy and I. §laus, submitted to Nucl. Phys.;
ch. 2 of this thesis
7) E.O. Alt, W. Sandhas, H. Zankel and H. Ziegelmann,
Phys. Rev. Lett. 37(1976)1537;
E.O. Alt, W. Sandhas and H. Ziegelmann, Phys. Rev. C 17(1978)1961;
A.M. Vesselove; L.D. Faddeev; S.P. Merkuriev,
Proc. Few Particle Physics Symposium, Dubna, June 5-8, 1979,
to be published
8) J.G. Cramer Jr. and W.W. Eidson, Nucl. Phys. 55(1964)593
9) See Proc. VIII Int. Conf. on Few body systems and nuclear
forces, Graz, 1978, ed. H. Zingl, M. Haftel and H. Zankel
(Springer-Verlag, Berlin, 1978)
74

V. A d(p,pp)n BOL-EXPERIMENT AT E = 50 HeV ANALYZED IN FOUR DIMENSIONS
1. Introduction
We have studied the d(p,pp)n reaction kinematically complete with
the HIT counter arrangement BOL. In previous articles 1>2) we
presented part of our measurements at E~ = 50 MeV, and compared them
with theoretical predictions. In first instance '), the data were
analysed mainly at special kinematical conditions like quasi free
scattering and the so-called interference minimum, using cuts through
the four-dimensional (4D) cross section surface. Then, an analysis
was made z) over essentially the entire phase space, but by
integrating over pairs of kineraatical variables in order to obtain
data-representations in two dimensions. This combined the advantages
of covering the whole reaction dynamics, of retaining the full
HD-complexity and of good statistical accuracy.
In these publications theoretical Faddeev-type predictions given
by the local potential model *) were shown to agree reasonably well
with the data over the greater part of phase space. However, some
significant deviations were observed. The two local S-wave
Malfliet-Tjon potentials 4) MT I-III and MT I-IV were used which
differ in the core region. The MT I-IV potential has no core in the
triplet channel with the aim to study short range correlations. The
MT I-III and the MT I-IV potentials are not phase-equivalent:
MT I-III fits the N-N phase shifts reasonably well, the MT I-IV does
not. Both calculations neglect electromagnetic interactions. In the
present article we attempt to exploit the inherently 4D-W aspects
of our BOL-measurements. Our main purpose is to investigate in 4D:
(i) the characteristic features of the cross section and
specific symmetric patterns,
(ii) discrepancies with available theoretical predictions,
(iii) sensitivity to change in the core region of the
nucleon-nucleon potential.
The points (ii) and (iii) are here important in so far they go
beyond two-nucleon experiments. Also, we here attempt to represent
our data in such a way that comparison with future improved
potentials will be possible.I
75
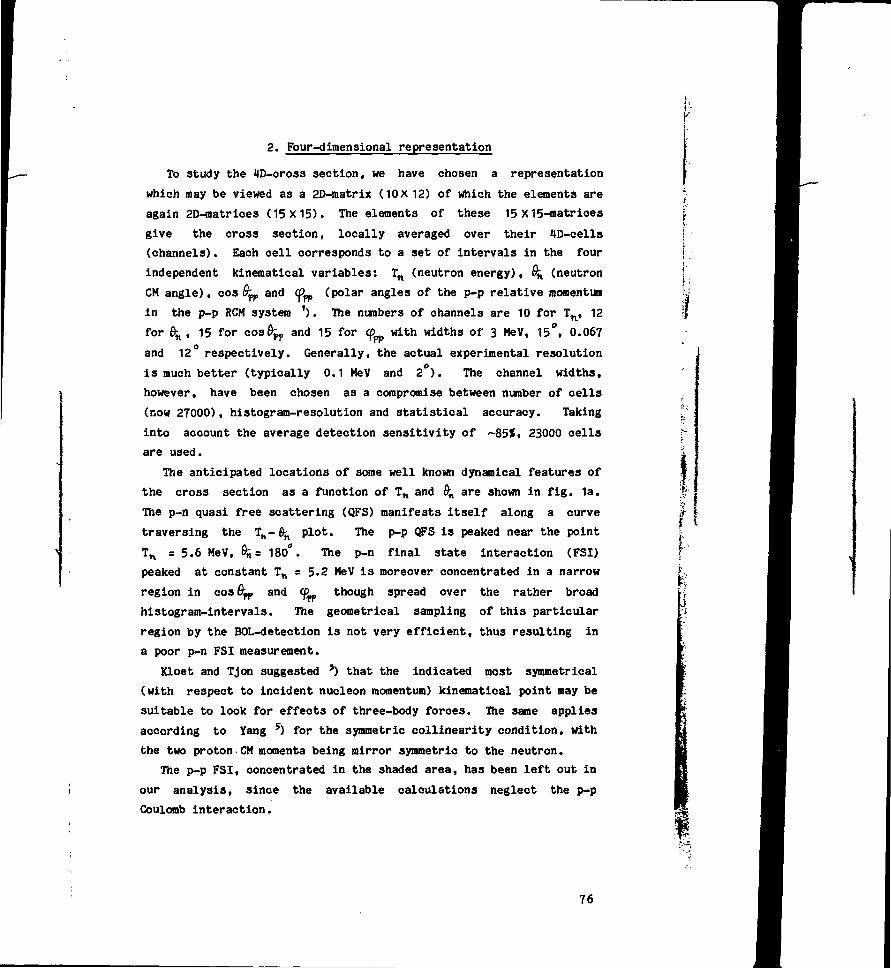
2. Four-dimensional representation
To study the ID-cross section, we have chosen a representation
which may be viewed as a 2D-matrix (10X12) of which the elements are
again 2D-matrices (15X15). The elements of these 15 X15-natrices
give the cross section, locally averaged over their 4D-eells
(channels). Each cell corresponds to a set of intervals in the four
independent kinematical variables: Tn (neutron energy), 9^ (neutron
CM angle), cos 8^, and (p , (polar angles of the p-p relative momentum
in the p-p RCM system ' ) . The numbers of channels are 10 for Tn, 12
for frn , 15 for cos^ p and 15 for cf^ with widths of 3 MeV, 15°, 0.067
and 12° respectively. Generally, the actual experimental resolution
is much better (typically 0.1 MeV and 2 ). The channel widths,
however, have been chosen as a compromise between number of cells
(now 27000), histogram-resolution and statistical accuracy. Taking
into account the average detection sensitivity of ~85>, 23000 cells
are used.
The anticipated locations of some well known dynamical features of
the cross section as a function of T n and 6 are shown in fig. 1a.
The p-n quasi free scattering (QFS) manifests itself along a curve
traversing the Th- 6$, plot. The p-p QFS is peaked near the point
T n = 5.6 MeV, % = 180°. The p-n final state interaction (FSI)
peaked at constant Tn = 5.2 MeV is moreover concentrated in a narrow
region in cos 6 , and cp though spread over the rather broad
histogram-intervals. The geometrical sampling of this particular
region by the BOL-detection is not very efficient, thus resulting in
a poor p-n FSI measurement.
Kloet and Tjon suggested *) that the indicated most symmetrical
(with respect to incident nucleon momentum) kinematical point may be
suitable to look for effects of three-body forces. The same applies
according to Yang ?) for the symmetric collinearity condition, with
the two proton CM momenta being mirror symmetric to the neutron.
The p-p FSI, concentrated in the shaded area, has been left out in
our analysis, since the available calculations neglect the p-p
Coulomb interaction.
»
76

208,20
p-n FSI
col linearity
90*
.3031,
803
180'
Fig. 1. Overview of the prominent features of the p-d breakup crosssection at E p = 50 MeV: quasi two-body processes (FSI: final stateinteraction, and QFS: quasi free scattering), collinearity, theinterference minimum for several potentials, the most symmetric pointand the symmetric-constant-relative-energy-loci (SCREL); (a) as afunction of the variables 8^ and T%; (b) as a function of 8 , and
Fig. 1b shows cross section features a3 a function of cos Su,, and
CO . The p-n QFS is concentrated near CD s 150 , cos 9^,- 0. The
p-p QFS is constant along lines which satisfy a kineraatical relation
between 8^ and <pff . Symmetric-constant-relative-energy-loci,
characterized by the p-p relative momentum vector being perpendicular
to the neutron plane, and p-n FSI are restricted to <{L= 0° and 90°
respectively.
Fig. 3 given in the above mentioned representation, shows cr
defined as the experimental cross section corrected for the BOL
detection-efficiency and divided by the phase space. This correction
was made by multiplication with the detection efficiency function
€(fif,, Tn, iSpp, <p ) obtained as follows. A Monte Carlo simulation was
made based on the Faddeev calculation for the Halfliet-Tjon
(MT I-III) local potential model ? ) . By simulating data for ideal
detection sensitivity (f*1^^, T^, 9^, (p^ )) and for the case of true
experimental limitations ( f B 0 L ( % , Tn, 9fr, q>n )), is then obtained
as the ratio f^/f801".
Since o? has been divided by the phase space factor it is a
dimensionless quantity. We call it the reduced cross section or
77
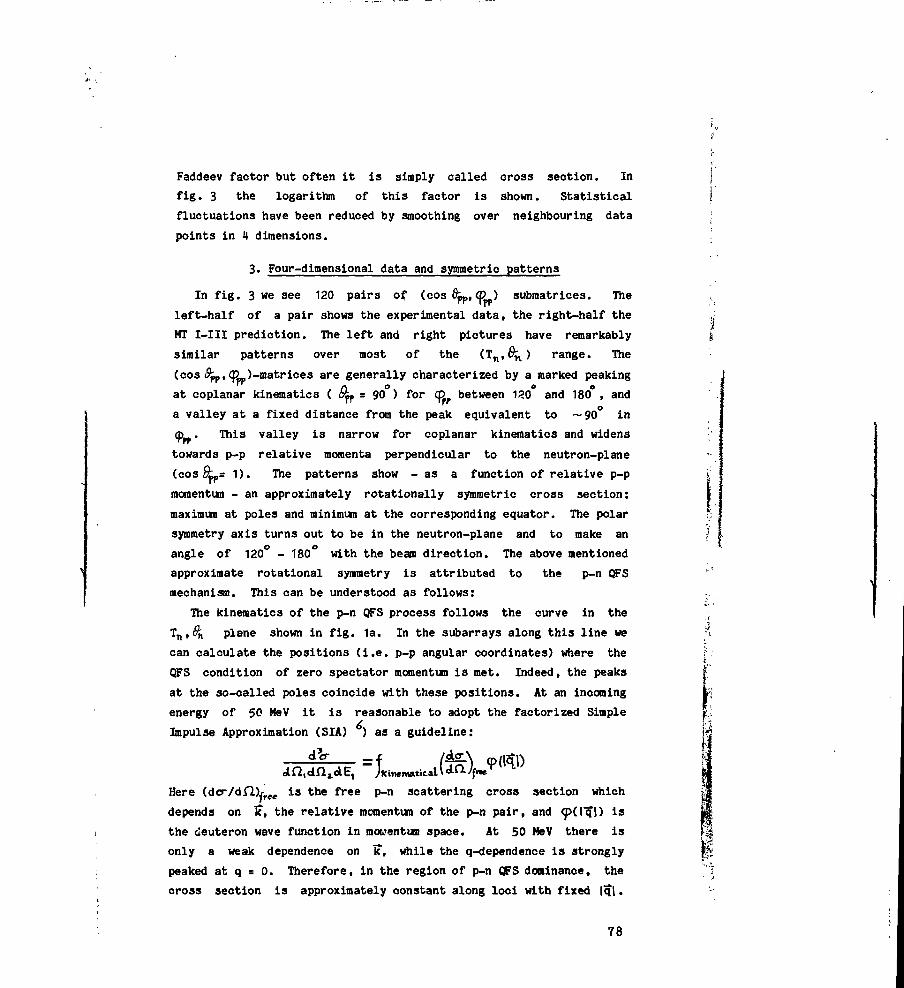
Faddeev factor but often it is simply called cross section. In
fig. 3 the logarithm of this factor is shown. Statistical
fluctuations have been reduced by smoothing over neighbouring data
points in 4 dimensions.
3. Four-dimensional data and symmetric patterns
In fig. 3 we see 120 pairs of (cos 8^,, (D ) submatrices. The
left-half of a pair shows the experimental data, the right-half the
MT I-III prediction. The left and right pictures have remarkably
similar patterns over most of the (Tn,fi^) range. The
(cos <^p,(K)f))-matrices are generally characterized by a marked peaking
at coplanar kinematics ( Q^ = 90 ) for CD. between 120 and 180°, and
a valley at a fixed distance from the peak equivalent to ~90 in
<p . This valley is narrow for coplanar kinematics and widens
towards p-p relative momenta perpendicular to the neutron-plane
(cos £L= 1). The patterns show - as a function of relative p-p
momentum - an approximately rotationally symmetric cross section:
maximum at poles and minimum at the corresponding equator. The polar
symmetry axis turns out to be in the neutron-plane and to make an
angle of 120 - 180 with the beam direction. The above mentioned
approximate rotational symmetry is attributed to the p-n QFS
mechanism. This can be understood as follows:
The kinematics of the p-n QFS process follows the curve in the
Tti, &k plane shown in fig. 1a. In the subarrays along this line we
can calculate the positions (i.e. p-p angular coordinates) where the
QFS condition of zero spectator momentum is met. Indeed, the peaks
at the so-called poles coincide with these positions. At an incoming
energy of 50 MeV it is reasonable to adopt the factorized Simple
Impulse Approximation (SIA) ) as a guideline:
Here (dcr/dfl)rree is the free p-n scattering cross section which
depends on k\ the relative momentum of the p-n pair, and <p(l"q|) is
the deuteron wave function in momentum space. At 50 MeV there is
only a weak dependence on if. while the q-dependence is strongly
peaked at q = 0. Therefore, in the region of p-n QFS dominance, the
cross section is approximately constant along loci with fixed |q|.
78
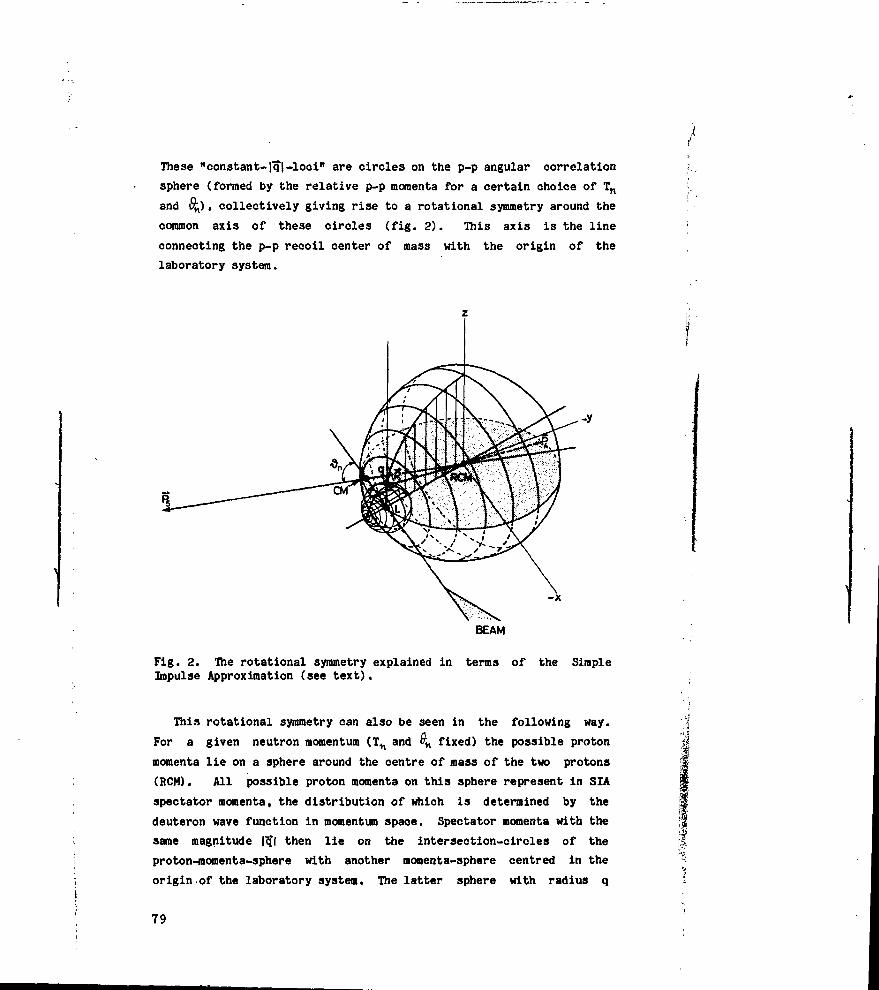
These "constant- f<f| -loci" are circles on the p-p angular correlation
sphere (formed by the relative p-p momenta for a certain choice of T n
and 6^), collectively giving rise to a rotational symmetry around the
common axis of these circles (fig. 2). This axis is the line
connecting the p-p recoil center of mass with the origin of the
laboratory system.
-x
BEAM
Fig. 2. The rotational symmetry explained in terms of the SimpleImpulse Approximation (see text).
This rotational symmetry can also be seen in the following way.
For a given neutron momentum (TH and »K fixed) the possible proton
momenta lie on a sphere around the centre of mass of the two protons
(RCM). All possible proton momenta on this sphere represent in SIA
spectator momenta, the distribution of which is determined by the
deuteron wave function in momentum space. Spectator momenta with the
same magnitude Iql then lie on the intersection-circles of the
proton-momenta-sphere with another momenta-sphere centred in the
origin of the laboratory system. The latter sphere with radius q
79
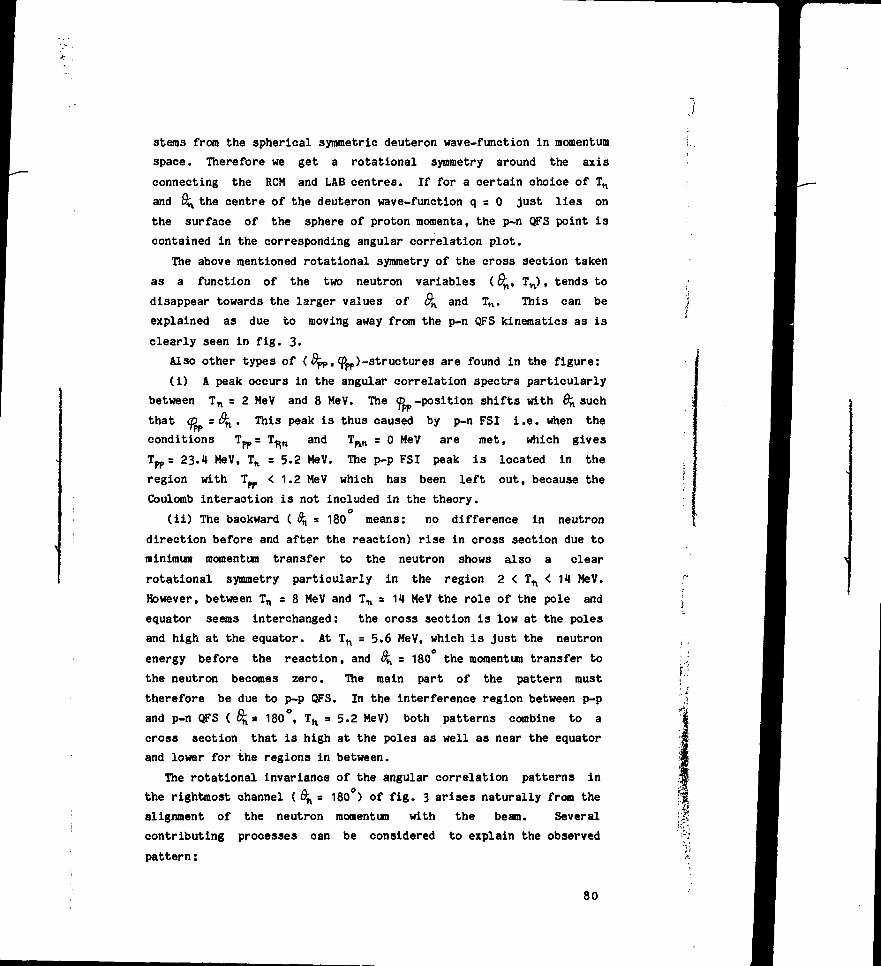
stems from the spherical symmetric deuteron wave-function in momentum
space. Therefore we get a rotational symmetry around the axis
connecting the RCM and LAB centres. If for a certain choice of Tn
and 8^ the centre of the deuteron wave-function q = 0 just lies on
the surface of the sphere of proton momenta, the p-n QFS point is
contained in the corresponding angular correlation plot.
The above mentioned rotational symmetry of the cross section taken
as a function of the two neutron variables (6 ,, T w), tends to
disappear towards the larger values of &K and TM. This can be
explained as due to moving away from the p-n QFS kinematics as is
clearly seen in fig. 3.
Also other types of (^,,1^)-structures are found in the figure:
(i) A peak occurs in the angular correlation spectra particularly
between T n = 2 MeV and 8 MeV. The © -position shifts with 9^ such
that <p - 8^ . This peak is thus caused by p-n FSI i.e. when the
conditions Tpp= T ^ and T^H = 0 MeV are met, which gives
Tpps 23.4 MeV, Tft = 5.2 MeV. The p-p FSI peak is located in the
region with T , < 1.2 MeV which has been left out, because the
Coulomb interaction is not included in the theory.
(ii) The backward ( B~n = 180 means: no difference in neutron
direction before and after the reaction) rise in cross section due to
minimum momentum transfer to the neutron shows also a clear
rotational symmetry particularly in the region 2 < Tn < 14 MeV.
However, between Tn = 8 MeV and Tn = 14 MeV the role of the pole and
equator seems interchanged: the cross section is low at the poles
and high at the equator. At Tn =5.6 MeV, which is just the neutron
energy before the reaction, and ^ = 180 the momentum transfer to
the neutron becomes zero. The main part of the pattern must
therefore be due to p-p QFS. In the interference region between p-p
and p-n QFS ( = 180°, Tn = 5.2 MeV) both patterns combine to a
cross section that is high at the poles as well as near the equator
and lower for the regions in between.
The rotational invariance of the angular correlation patterns in
the rightmost channel ( 6^ = 180 ) of fig. 3 arises naturally from the
alignment of the neutron momentum with the beam. Several
contributing processes can be considered to explain the observed
pattern:
80

p*d—• p+p+nO(exp),O(MT I—III>
ED=50MeV
oCM
ICO
CO
(O
siCM
"7
ooi
CO
(0I
ICM
CM
O
0°-15* 15»-30° 30°-45° A5'-60° 60°-75° 75°-90f
Fig. 3. Four-dimensional experimentaKleft one of a pair of 15X15submatrices) and theoretical (MT I-III) (right one of a pair) crosssection. The logarithm of the Faddeev-factor is proportional to theblack area of the symbol: 0 (0.8 - 1.6)X10~ , • (1.6 - 3.2)X 10~ ,
;
81

o
CO
to
<O
CM
q> o2 ""
CO
CO1
1
CM
CM
O
0(exp),6(MT I-III)p*d—»p+p*n Ep=50MeV
: ,'Kiii
asa
•iii:::::ii!ii; iiiiiiiii::::
iiiHiiiiiiiiil liiiiiiiiiiii
Iiii ii!l!:!!ii!:!!i
Si i i l iHr
90#-105# 105°-120° 120°-135e 135°-150° 15O°~1650 165#-180°
• (3.2 - 6.3)X 10" ,N (2.5 - 5.0)X 10~3,0 (2.0 - 4.0) X10"2
A (1.6 - 3.2) X10 -1
I (0.6 - 1.3) X10 ,II (0.5 - 1.0) X10"1,H (U.O - 8.0)X10~%B (3.2 - 6.3) X10 .
« (1.3 - 2.5)X10'M(1.0 - 2.0) X10B(0.8 - 1.6) X10
-a-I1
82

(i) the probing of the deuteron wave function by p-n QFSo o
suggests a peak at lowest possible momentum transfer: CD = 0 , 180Tfp
(see the above explanation of the rotational symmetry),
(ii) the p-p QFS, which reflects for given final-state
neutron-momentum Iqi (or energy Tn related to !«,), the corresponding
momentum component in the deuteron wave function. The free p-p cross
section predicts a peak at forward and backward scattering angle:
ffl= 0°, 180°,( i i i ) the p-n FSI, which i s maximal when the p-p relative
S o o
t - 180 , <p = 0momentum
0°p
180°
(iv) more complex rescattering contributions.
Apparently in the region 165°< 8^< 180° the interplay of the
different processes gives rise to an interference minimum at
cPpr - 0°, 180° for 8 < Tft < 14 MeV and to the more complicated
patterns for 2 < Th < 8 MeV. It is not likely that FSI and complex
rescattering terms have enough conspirative strength and coherence
(different time scales) to cancel out the QFS contributions. This
means then that the p-n and p-p QFS amplitudes, (i) and (ii)
respectively, have opposite signs in this kinematical region. At
&n = 180° the axes of rotational symmetry of both QFS processes are
aligned with the beam-direction.
Descending from frn = 180 , the patterns will change depending on
neutron energy. An interesting region is formed by the three angular
correlation arrays at 10 < Tn < 12 MeV between 9^ = 135 and
= 180° The left one (135° < &* < 150°) contains the deep
interference minimum which has here a reduced cross section of
1.2X10~4 due to the averaging over grid intervals (in
point-kinematics the cross section in-the MT I-III minimum is 7X10
at Th =12.5 MeV). The right one (165° < &n < 180°) is the clearest
example of interference between p-p QFS and p-n QFS giving rise to
high cross section at the equator and low cross section at the poles
(see above). The middle array forms the connection between both
interference minima. It shows a minimum which is on one hand clearly
K
83

the p-p QFS pole, although somewhat shifted, and which can on the
other hand be seen as the equator of the characteristic p-n QFS
pattern. In the latter role it is very asymmetric with respect to
the pole (efi*'"tor- f*f* = 15° instead of 90°) and it is deepest atn °
coplanar kinematics ( c ,= 90 ) instead of at SCREL-kinematics
( <Sp = 0°). Nevertheless the connection between the minimum in the
left and the middle array seems (also regarding the neighbouring
arrays) rather convincing.
We tend to conclude therefore that the well-known deep
interference minimum is essentially due to destructive interference
between the p-p and p-n QFS amplitudes. This explanation requires,
however, theoretical justification.
H. Discrepancy between theory and experiment
In fig. 4 we give the relative difference between theoretical and
experimental cross section, which we call discrepancy (left-half
submatrices), and the relative difference between the calculations
with the HT I-III and MT I-IV potentials, which we call sensitivity
(right-half submatrices), both in dependence of our four kinematical
variables.
The discrepancy patterns in the separate (cos Q^,, <^)-slices form
essentially bands with constant <p . They look similar to the
prominent rotational symmetry in the cross section.
Indeed, for < ;< 90° the high-discrepancy band tends to overlap
with the equatorial valley in the cross section. Around fi^= 90 ,
however, the maximum discrepancy shifts from 9n,s=60° towards <J = 0
and further (notice the periodicity of <j» ) towards ce ~150 at
backward neutron angles. Thereby it no longer coincides with the
minimum cross section region. This discrepancy at large <D ,
however, is not a high cross section - high discrepancy region. The
peak cross section here, backward 6^, high Tn, is rather low.
The high-discrepancy ( > 60)1 ) bands form together a connected
region in the 4D kinematical space concentrated above TH « 12 MeV.
The characteristic structure of this region in terms of the three
angular variables 8^, (5^ and (p can be seen in fig. H.
i
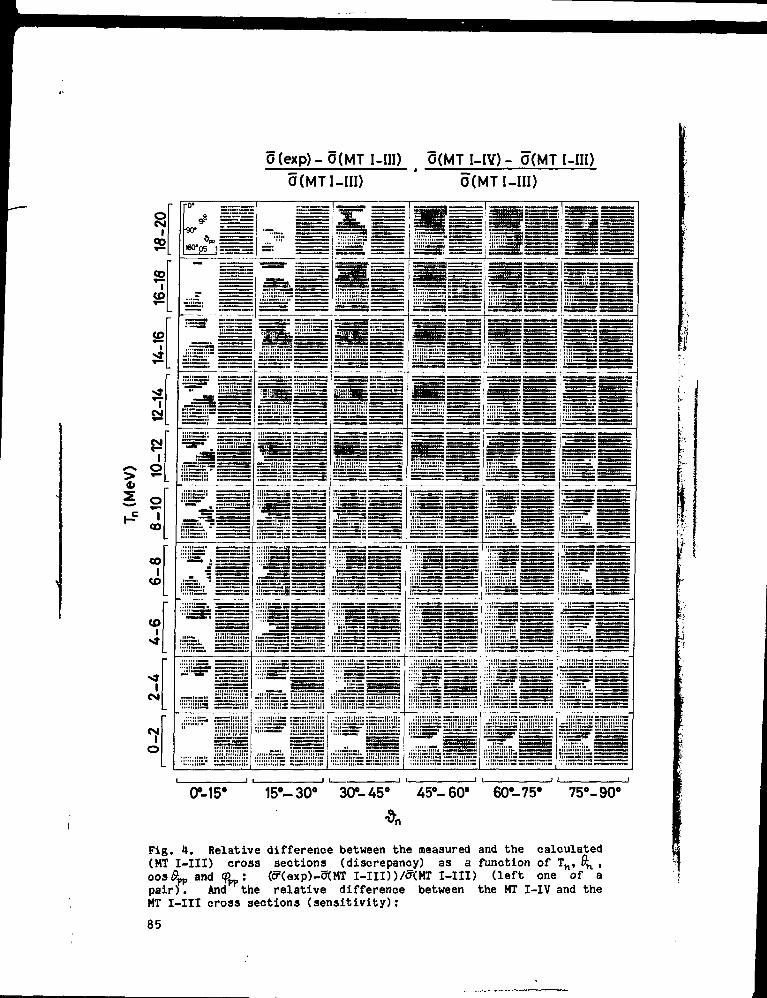
O(exp)-O(MTI-HI) O(MTI-IY)- O(MT I-IH)O(MT I-III) ' O(MTI-Hl)
»_15° 15°- 30° 30°-45° 45°- 60° 60#-75» 75°-90°
Fig. 4. Relative difference between the measured and the calculated(MT I-III) cross sections (discrepancy) as a function of Tn, 9^ ,cosiS^ and cp : (5=(exp)-0(MT I-III))/a(MT I-III) (left one of apair). And the relative difference between the MT I-IV and theMT I-III cross sections (sensitivity):
85
L

g(exp)-g(MT Mil) d(MTl-IY)-g(MTI-BI)5(MTMII) ' O(MTI-III)
90*-K>5' 105'-120* 12CT-135* 135»-150* 15CT-165' 165>-18O'
I-IV)-J5tMT I-III))/ff(MT I-III) (right one of a pair). Meaningof the symbols: • (-70±10)», . (-50±10)X, i (-30±10)X, m (-10±10)»,•• (10+10)%, It (30±10)lt, N (50±10)*, 0 (70±10)», N (90+10)*,If (110+.10)*, A (130±10)», B (150^10)*, C (170±10)» etc .
86

r(a) (b) (c)
(f (exp) discr.
I IMMN INMNHMIMIIIIII I||«I|N|||NNN• iinlllnilllllMlllltlNlllNNN«NNMMttNMMM|NM|l»«
IMMMMIUMMMMHUIINMimwRMmyiNiyMii
sens.HMMWMMMMMMMMMMM
MIMHMI I IMMI
MNHNMNNNNW
0.5 10 0.5 10 0.5
cos fp PC O S *pp COS 'PP
30°<ftn< 45° , 14 < Tn < 16 MeV
Fig. 5. Comparison of discrepancy-, experimental cross section- andsensitivity-plots as a function of cos 6L, and CD. Meaning of thesymbols as in fig. 2 and 3*
Concentrating on some specific regions of phase space, fig. 5. 6
and 7 show some 2D cos 9^, <P planes from the 4D space of fig. 3 and
4. Three neutron angles have been chosen and for every angle
separately the neutron energy at which the discrepancy is most
pronounced. The errors in the discrepancy are typically 12% - 18*.
The discrepancy is studied in correlation with the experimental
cross section and with the sensitivity (relative difference between
the NT I-III and HT I-IV calculation). The first set (fig. 5 ) . is
from the region of low-<J^ discrepancy 30° < G^ < 15°,
14 < T n < 16 MeV. The discrepancy-pattern (fig. 5b) is correlated
with the cross section (fig. 5a) in the sense that the theoretically
predicted valley is too low and the peak too high. The same is
observed for the integrated (2D) data 2 ) . The sensitivity (fig. 5c)
on the other hand, shows a totally different pattern: large relative
differences in the region between the peak and the valley, combined
with a negative value of the difference on the other side of the
peak. This reflects a difference in pattern position along the
a> -axis between the HT I-III and the HT I-IV cross sections.'FT
87

A similar sensitivity pattern has also been observed for thecorresponding integrated data 9 ) .
The lack of similarity between the discrepancy and the sensitivityon the other hand, indicates that improvement of the local S-waveHT I-III interaction is from this point of view not in particular tobe sought in the core region for S-wave interactions. At 50 HeV,contributions from P-wave and tensor-interaction are expected to beof some importance 7>8). Indications for other possible improvementsin the nucleon-nucleon interaction such as D-wave, Coulomb anddifferent off-shell behaviour can be found in the literature *).
(a) (b) (0
<f (exp) discr. sens.
HHHMNHKIIt I IHHMNHHHN | | HtMNN
180°-
75°<*n < 90° , 18 < Tn < 20MeV
Fig. 6. Same as fig. H.
The next choice for Tn and S^ (fig. 6) is 18 < T H < 20 HeV and75° < 9^ < 90°. This is the region in &n where the discrepancy
o
maximum moves over from low to high (D (via <D= 0 ) . Particularlyat this kinematics, the maxima in discrepancy (fig. 6b) andsensitivity (fig. 6c) coincide. This is not retained in thecorresponding integrated picture 2 ) . Comparison with the crosssection (fig. 6a) tells us that the discrepancy is probably partly
88

due to a shift and partly to a difference in shape between data and
theory. The shift is opposite to the shift at $;*45 and the shape
differs in that the cross section for cos cL>> 0.5 is underestimated
by the MT I-III interaction.
(a) (b) (0a' (exp) discr. sens.
90°-
180°-
• M l l t i i H I I l M111 • • • 11 i n I • •
liniiiiii• in i m ii
• • . . 11 • • in i • I••••ItlllllllllIIIIllltlllllllI IIMMHHHH|I I 11 IWMMMMMMKNMMIIII
NNHHMM||||IMMHH | |NNMMiI
m imwlliHMNMMNHHNNMNIII
Hum in mi i iii
HNIXMM IMNNIIIMMHINttNHI IfNNNNNUH
tMNHMNNlMM
IIIMMHIIMIIIIIIWIHI * I l«NMI*INttJ||MI• •IIIIwil> MM
0 0.5c o s *
I I
0
pp
05
cos
0.5
cos <%PP
135°<*n< 150°, 14 <Tn < 16 MeV
Fig. 7. Same as fig. 5.
At backward neutron angles the example 14 < T n < 16 MeV,
135°< &n < 150° has been chosen (fig. 7). The deep interference
minimum in the cross section calculated with the MT I-III potential
is located at Tn = 12.5 MeV and #, = 145° while the position of the
minimum calculated with the MT I-IV potential is at I t > 9.8 MeV and
6 = 144 . Because this is outside the Tn -range of fig. 7, a peak
is expected in the relative difference between the NT I-III and I-IV
calculation at 12 < Tn < 14 MeV. However, due to the avaraging over
grid intervals, the highest enhancement of 1005 is observed in fig. 7
(at cosii^ s 1 and (p = 60 >. He expect this enhancement indeed at
#pp =0° because the deep interference minima are located on
symmetric- constant-relative-energy-loci as shown earlier V The
minimum at = 0° cnil'ests itself in the sensitivity only at
89

a> = 60 because at other azimuthal angles the tail of the p-n QFS
peak dominates the cross section (due to the large grid intervals in
the figure).
Apart from the enhancement at 9^=0°, the pattern of large
sensitivity exhibits approximate rotational symmetry around an axis
at an angle of --140 with respect to the bean ( cp_ = 180 ) similar
as observed for the cross section (fig. 7a). The possible origin of
this symmetry (5IA) has been discussed in section 2.
Different from the 13.25 HeV data 9 ) , the maximum discrepancy
between experiment and theory for our present data at 50 MeV
(fig. 7b) is not located near a minimum in the cross section but
rather near a local cross section maximum. The main discrepancy is
also at 50 MeV coinciding with a local maximum in the sensitivity,
although it is the other discrepancy region as in the 13.25 MeV case
(region A instead of locus a in fig. 8 of ref. 2).
5. Conclusions
(i) We give in one figure a general impression of the main
structure due to the known quasi-two-body type of reaction processes
and of the interference minimum, using experimental data covering
~85* of three-body phase space (with 23000 points in four dimensions
(4D) ordered as a 2D matrix of 2D submatrices).
(ii) The structure is not washed out by the necessarily sizable
grid-intervals in 4D. The data allow quantitative (within 20$)
comparison with calculations using a Monte Carlo simulation
procedure.
(iii) The discrepancy between the theoretical MT I-III Paddeev
calculation and the experimental cross section (fig. 4) reveals the
existence in 4D of a single region of large discrepancy (> 60%)
visible in a large number of submatrices in our representation.
(iv) The MT I-III and MT I-IV predictions differ up to 40* in a
region between Tn = 10 and 20 MeV, #, = 15° and 150°, and over a
large recoil centre of mass angular range. In view of the rather
small deviations from N-N phase-equivalence of the MT I-III and the
MT I-IV potential, this amount of sensitivity is unexpectedly large.
A certain overlap is present, but the shape (and location) of
these regions in comparison with the regions of high discrepancy
90
between theory and experiment, indicate that the difference in the
core region i s not the most important cause for this discrepancy.
The absence of higher partial waves in the interaction i s probably
the primary cause.
(v) A prominent approximately rotationally symmetric pattern of
Zr i s observed over a large fraction of phase space, which i s
understood in terms of the Simple Impulse Approximation (SIA) of the
p-n quasi free scattering. This shows again the known importance of
the quasi free scattering in proton-deuteron breakup.
(vi) The deep interference minimum in the cross section seems
mainly due to destructive interference between the p-p and p-n quasi
free scattering amplitudes.
References
1. G.J.F. Blommestijn, R. van Dantzig, Y. Haitsna, R.B.M. Nooyand I . Slaus, to be submitted to Nucl. Phys.; ch. 3 of this thesis
2. G.J.F. Blommestijn, R. van Dantzig, Y. Haitsma, R.B.N. Mooy
and I. §laus, to be submitted to Hucl. Phys.; ch. 4 of this thesis
3. V.H. Kloet and J.A. Tjon, Nucl. Phys. A210(1973)380;Ann. of Phys. 79(1973)407
4. R.A. Halfliet and J.A. Tjon, Hucl. Phys. A127(1969)161;
Ann. of Phys. 61(1970)425
5. S.H. Yang, Phys. Rev. 010(1974)2067
6. A.F. Kuckes, R. Wilson and P.F. Cooper, Ann. of Phys. 15(1961)193
7. J. Bruinsma and R. van Wageningen, Nucl. Phys. A282(1977)1;P. Doleschall, Phys. Lett. 38B(1972)298;I . Koersner, L. Glsntz, A. Johansson, B. Sundqvist andP. Doleschall, Tandem Laboratory Uppsala preprint TLU 61/78
8. C Stolk and J.A. Tjon, Nucl. Phys. A295(1978)384
9. G.J.F. Blommestijn, R. van Dantzig, Y. Haitaaa, R.B.N. Nooy
and I . §laus, submitted to Nucl. Phys.; ch. 2 of this thesis
10. Proc. VIII Int. Conf. on Few body systems and nuclearforces, Graz, 1978, ed H. Zingl, M. Haftel and H. Zankel(Springer-Verlag, Berlin, 1978)
91
SUMMARY
Proton-deuteron breakup coincidence data obtained with the
BOL-system and covering a large fraction of phase space at
E p r 13.25 MeV and E-, = 50.2 HeV are compared with Faddeev
calculations using the Malfliet-Tjon (MT) I-III and I-IV S-wave
N-N potentials. Data and calculations are represented in terras of
one-, two- and four-dimensional histogram plots. Correlations are
discussed between different plots, showing the relative difference in
cross section for the MT I-III and I-IV potential (the so-called
sensitivity), the theoretical cross section itself and the
discrepancy between theory and experiment.
In Chapter II the theoretical and experimental data obtained by
Wielinga et al. have been analysed in more detail near the main
discrepancy region at E_ = 13.25 MeV and studied in terms of polar
coordinates. An approximately rotationally symmetric pattern aligned
with the beam direction is observed for the discrepancy between
theory (MT I-III) and experiment, and for the sensitivity (MT I-III,
MT I-IV). New measurements that might be particularly suitable to
test existing theoretical models as well as further theoretical
analyses of the data are suggested.
In Chapter III a description is given of the 50 MeV experiment:
Protons with an energy of 50 MeV have hit a deuterated polyethylene
target. Proton-proton coincidences were registered with 40
position-sensitive detector-telescopes. The data analysis (beam
parameters, calibrations and selections) is outlined. Faddeev cross
section calculations for some S-wave potentials are compared through
the whole phase space but especially in a deep interference minimum .
The data are compared with the calculations in quasi-free scattering
regions, along symmetric constant relative energy loci and at the
collinearity condition.
In Chapter IV proton-deuteron breakup data at E- = 50 MeV covering
most of the four-dimensional phase space, have been analysed in terns
of pairs of kinematical variables while integrating over the two
other variables. A remarkable agreement between data and Faddeev
calculations with MT potentials is observed over a great part of
phase space. Also some significant discrepancy regions (differences
up to 100%) are evident. Possible origins (e.g. core region) of
'*
92
these discrepancies are discussed.
In Chapter V the analysis of the data at Ep = 50 MeV is presented
in terms of a differential four-dimensional (4D) cross section
representation using a 2D matrix of 2D matrices. Prominent
approximately rotationally symmetric patterns are observed in the
cross section. Qualitatively, the symmetries can be understood in
terms of the simple impulse approximation. Regions of discrepancy
between data and theory in 2D sub-spaces (cuts) are shown to be
connected in a 3D (angular correlation) sub-space. Comparison with
the pattern of relative differences between the HT I-III and MT I-IV
cross sections shows no evidence for a relation between the
discrepancy region and the sensitivity to the core of the potential
(MT I-III and MT I-IV differ in the core region). Inclusion of
higher partial waves and tensor and Coulomb interactions in the
theoretical calculations is strongly recommended.
93

SAMENVATTING
Proton-proton coïncidentie? afkomstig van de reactie d(p,pp)n zijn
bij energieën van E», = 13.25 en 50.2 MeV gemeten met het BOL-systeem
over een groot gedeelte van de faseruimte. Deze meetresultaten
worden vergeleken met Faddeev berekeningen, die uitgaan van de
Malfliet-Tjon (MT) I-III en I-IV S-golf N-N potentialen.
Experimentele en berekende gegevens, weergegeven als een-, twee- en
vier-dimenslonale histogrammen, betreffen de gereduceerde werkzame
doorsnede, het relatieve verschil in werkzame doorsnede voor de I-III
en de I-IV potentiaal (aangeduid als "gevoeligheid") en de
discrepantie tussen tiieorie en experiment. Overeenkomsten tussen de
verschillende figuren worden besproken.
In hoofdstuk II worden bij 13.25 MeV de theoretische en
experimentele gegevens van Wielinga et al. in het belangrijkste
discrepantiegebied nader bestudeerd en weergegeven met behulp van
poolkoordinaten. Een patroon, dat bij benadering rotatiesymmetrisch
is rond de bundelrichting, wordt hier waargenomen voor de
discrepantie tussen theorie (I-III) en experiment, en voor de
"gevoeligheid1* (I-III, I-IV). Suggesties worden gedaan zowel voor
verdere theoretische analyse van de gegevens als ook voor nieuwe
metingen om de theoretische modellen te kunnen testen.
In hoofdstuk III wordt een beschrijving gegeven van het 50 MeV
experiment: Protonen met een energie van 50 MeV werden geschoten op
een gedeutereerd polyethyleen-target. Proton-proton coïncidenties
zijn geregistreerd met 40 plaatsgevoelige detector-telescopen. De
analyse van de gegevens (bundelparameters, ijkingen en selecties)
wordt geschetst. Faddeev berekeningen van de werkzame doorsnede voor
enkele S-golf potentialen worden vergeleken over de hele faseruimte,
maar speciaal in een diep interferentie minimum. De metingen worden
vergeleken met de berekeningen in gebieden waar quasi-vrije
verstrooiing overheerst, langs zogenaamde "lijnen van symmetrische
constante relatieve energieën" en in het gebied waar de deeltjes
impulsen op één lijn liggen.
Hoofdstuk IV toont resultaten van deuteron desintegratie door
50 MeV protonen over het grootste deel van de vier-dimensionale
ruimte. Deze zijn geanaliseerd door middel van integratie over
steeds twee kinematische variabelen. Er wordt een opmerkelijke
\i
overeenkomst waargenomen tussen de metingen en de Faddeev
berekeningen met MT potentialen over een groot deel van de
faseruimte. Ook blijken enkele significante discrepantie-gebieden
(verschillen tot 100}) aanwezig te zijn. Mogelijke oorzaken (bijv.
het binnengebied van de potentiaal) van deze discrepanties worden
besproken.
In hoofdstuk V worden de meetgegevens bij E p = 50 MeV weergegeven
in de vorm van een complete vier-dimensionale (4D) werkzame doorsnede
door gebruik te maken van een 2D matrix van 2D matrices. Opvallende,
bij benadering rotatie-symmetrische patronen zijn te zien in de
werkzame doorsnede. Kwalitatief kunnen deze symmetrieën begrepen
worden met behulp van een eenvoudige stootbenadering. Getoond wordt
dat de gebieden van discrepantie tussen experiment en theorie in de
2D matrices met elkaar verbonden zijn in een 3D hoekcorrelatie
sub-ruimte. Vergelijking met de patronen in de verschillen tussen de
NT I-III en de MT I-IV werkzame doorsneden, laat geen duidelijk
verband zien tussen het discrepantiegebied en de gevoeligheid voor
het binnengebied van de potentiaal (waar de MT I-III en de MT I-IV
verschillen). Het toevoegen van hogere partiële golven, en tensor-
en Coulombwisselwerking aan de theoretische berekeningen wordt sterk
aanbevolen.
95
DANKWOORD
Hooggeleerde promotor, Professor Hapstra, ik dank U hartelijk voor
de aandachtige begeleiding bij het tot stand komen van dit
proefschrift. De bereidheid die U toonde, door zelfs op feestdagen
mijn werk te behandelen heb ik zeer gewaardeerd.
Hooggeleerde co-referent, Professor Tjon, in het contact met U
werd ik altijd getroffen door Uw doeltreffende manier van werken.
Zonder omhaal van woorden sprak U slechts over de kern van de zaak.
Ik dank U voor deze efficiente samenwerking.
Hooggeleerde co-referent. Professor de Vries, ik dank je zeer voor
de belangstelling, die je ten allen tijde voor mijn werk toonde.
Dear Professor Ivo Slaus, I am much indebted to you by your very
helpful suggestions throughout the years that you visited IKO. I
always admired your great energy and I was often stimulated by your
sense of good humour.
Beste René van Dantzig met grote kennis van de physica en een
ongelofelijke vindingrijkheid wist je steeds alle ups en downs van
BOL tot een goed einde te brengen. Samen met de andere Bolbouwers
heb je de voorwaarde geschapen voor deze drie-deeltjes experimenten.
Beste Ynse Haitsma en Rob Mooy, jullie waren geweldige helpers in
de strijd tegen de monsters der experimentele physica. Hun
aanvoerder, de Bol-geometrie, hebben jullie geheel buiten gevecht
gesteld.
Wim Kloet, voor de Faddeev-amplitudes en de verhelderende
gesprekken, die we samen hadden dank ik je hartelijk.
Jan Waal en Jan Joosten, al zijn we dan geëindigd als "drie vrije
deeltjes in de eindtoestand", jullie aandeel in deze experimenten is
zeer groot geweest.
Leden van de voormalige kernreactiegroep en van de PIHU-groep,
jullie vormden de vruchtbare grond waarop dit weinig-deeltjes
onderzoek tot bloei kon komen.
De Cyclotrongroep en de technici, die steeds bereid waren om de
helpende hand te bieden tijdens de vele dagen en nachten van
experimenten, wil ik heel hartelijk dankzeggen.
John Bailey en Justus Koch, ik dank jullie voor de bereidheid o«
96

op het laatste moment het manuscript nog van commentaar te voorzien.
Beste Ted Kingma Boltjes, jouw nauwgezette uitwerking van mijn
manuscript is voor mij van grote waarde geweest. Het was een grote
verlichting dat jij dit werk wilde doen.
Beste Hanna, het was een vreugde jou zo adequaat met de tekeningen
voor dit proefschrift bezig te zien. Ik dank je hiervoor.
Leden van de reproductie-afdeling van het Mathematisch Centrum, ik
dank U voor de vlotte behandeling van het manuscript.
Ik wil hier ook mijn zusje Annette danken,die zich bereid
verklaarde om op zon- en vakantiedagen voor mij te werken. Ook mijn
broer Jacques die de omslag van dit proefschrift ontwierp, alsmede
mijn ouders en mijn zusje Tineke, die zich altijd zeer bezorgd on mij
toonden.
Tenslotte dank ik mijn lieve vrouw die mij bij dit werk zo goed
gesteund heeft en mijn kinderen René, Micha en Esther, voor wie ik
hoop in de toekomst meer tijd te zullen hebben.
Allen, die ik verzuimd heb te noemen, bied ik mijn welgemeende
verontschuldigingen aan.
97


![Spherical Functions and Harmonic Analysis on Free Groups* · Spherical functions and radial functions on free groups have been studied by Cartier [3,4] and Sawyer [23] in the context](https://img.pdfslide.us/doc/110x75/5fc3b8bab7fff44d1f19c77d/spherical-functions-and-harmonic-analysis-on-free-groups-spherical-functions-and.jpg)

![Solving Stiff Reaction-Diffusion Equations Using ... · Reaction diffusion models have been studied extensively since the RD theory first proposed by Turing [2] to describe the range](https://img.pdfslide.us/doc/110x75/602a72fd5df8b5738425bdf7/solving-stiff-reaction-diffusion-equations-using-reaction-diffusion-models-have.jpg)