Embed Size (px)
Citation preview
The Rankings ~ Slight category changes ~ Five SectorsCONSUMER
Apparel
Retail (+Pharmacies and Dept. Stores)
Personal Care
Luxury (High-end accessories and watches)
Cars
FOOD & DRINK
Beer
Fast Food
Soft Drinks (all non-alcoholic)
FINANCIAL INSTITITIONS
Global Banks
Regional Banks
Insurance
TECHNOLOGY
Technology
Telecoms
COMMODITIES
Oil & Gas
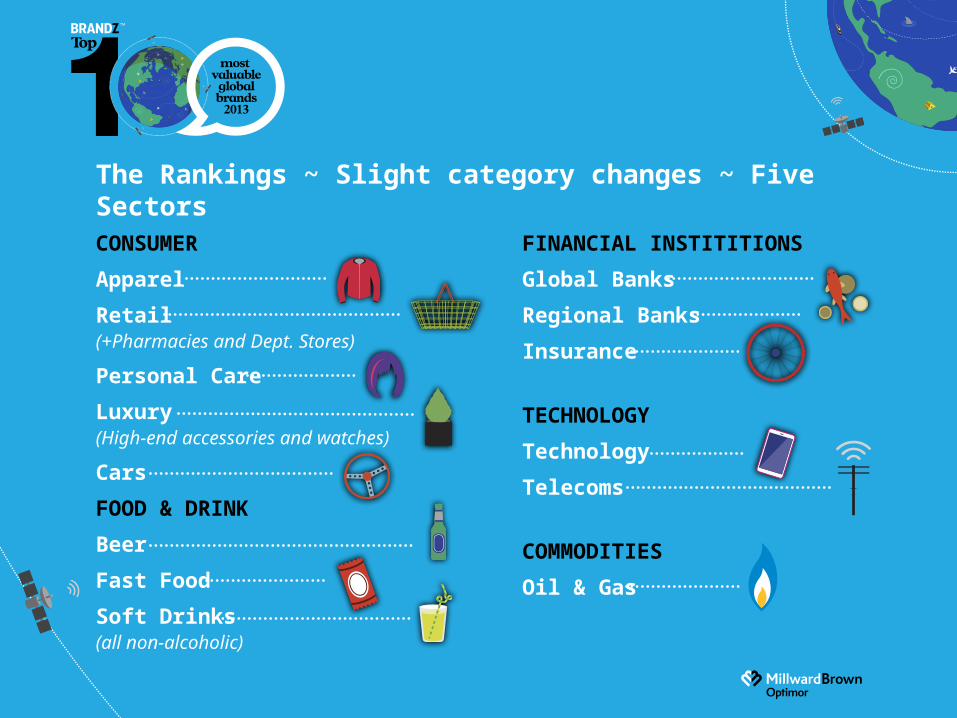
BrandZ vs Interbrand
Financial value of the brand rather than the
company
The proportion of financial value that is
attributable to the brand alone
BRANDVALUE
FinancialValue ($)
BrandContribution
(%)
KEY DIFFERENTIATOR
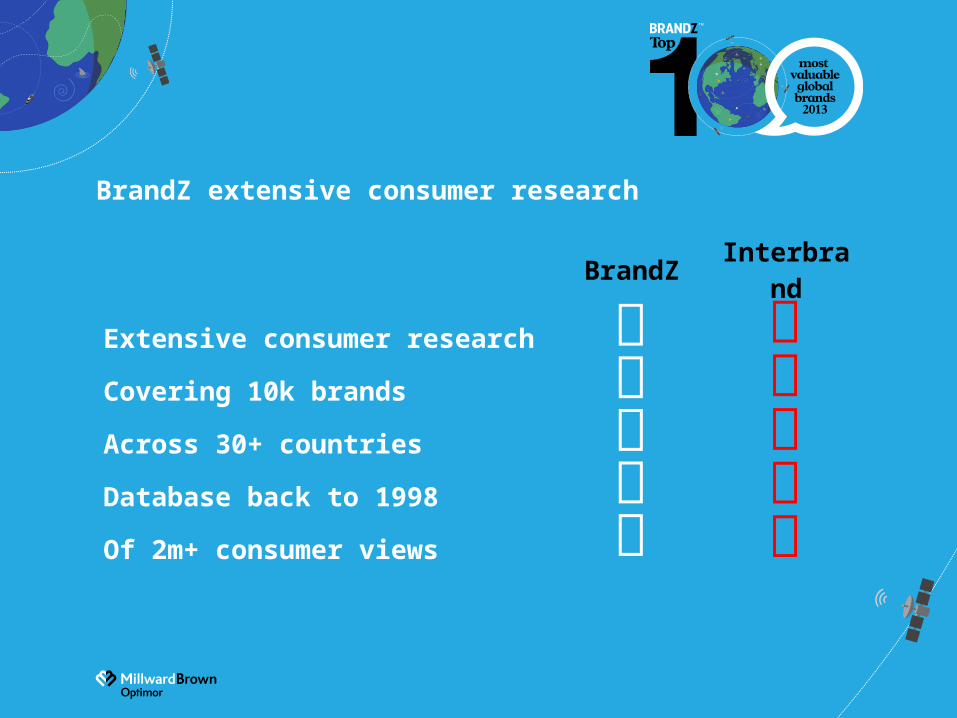
BrandZ extensive consumer research
BrandZ Interbrand
Extensive consumer research
Covering 10k brands
Across 30+ countries
Database back to 1998
Of 2m+ consumer views
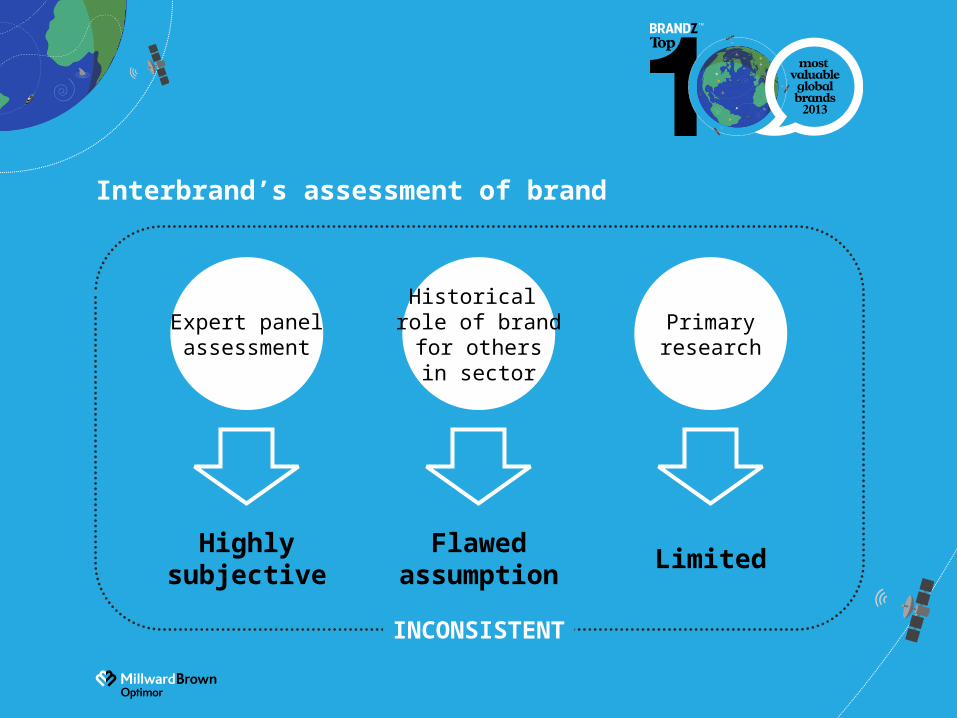
Interbrand’s assessment of brand
Expert panelassessment
Historical role of brand
for othersin sector
Primaryresearch
Highlysubjective LimitedFlawed
assumption
INCONSISTENT
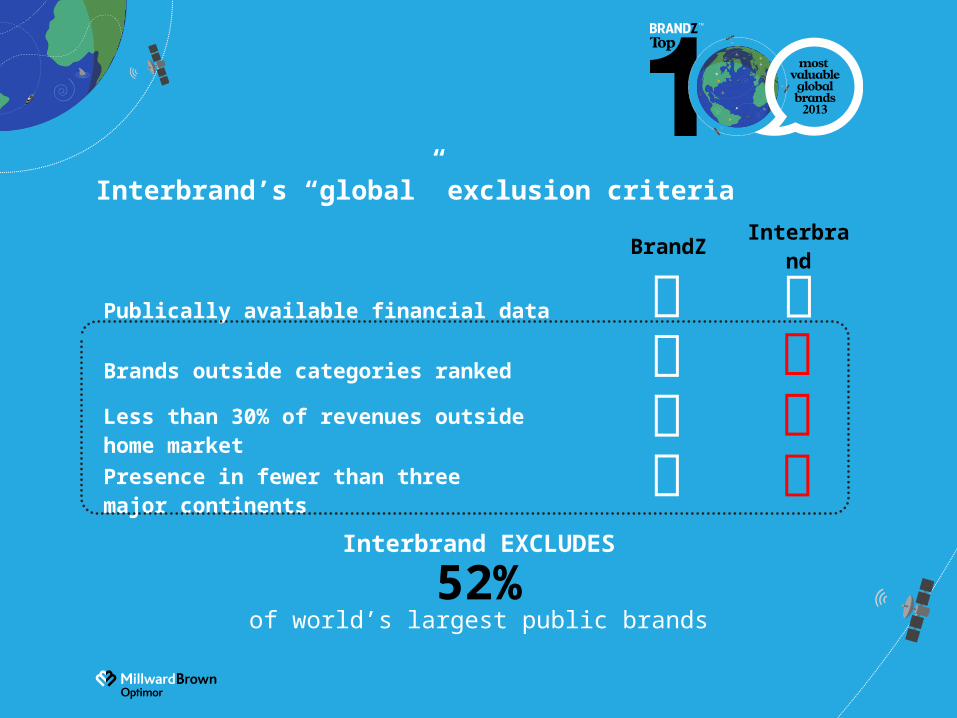
Interbrand’s “global” exclusion criteria
BrandZ Interbrand
Publically available financial data
Brands outside categories ranked
Less than 30% of revenues outside home market
Presence in fewer than three major continents
Interbrand EXCLUDES
52%of world’s largest public brands
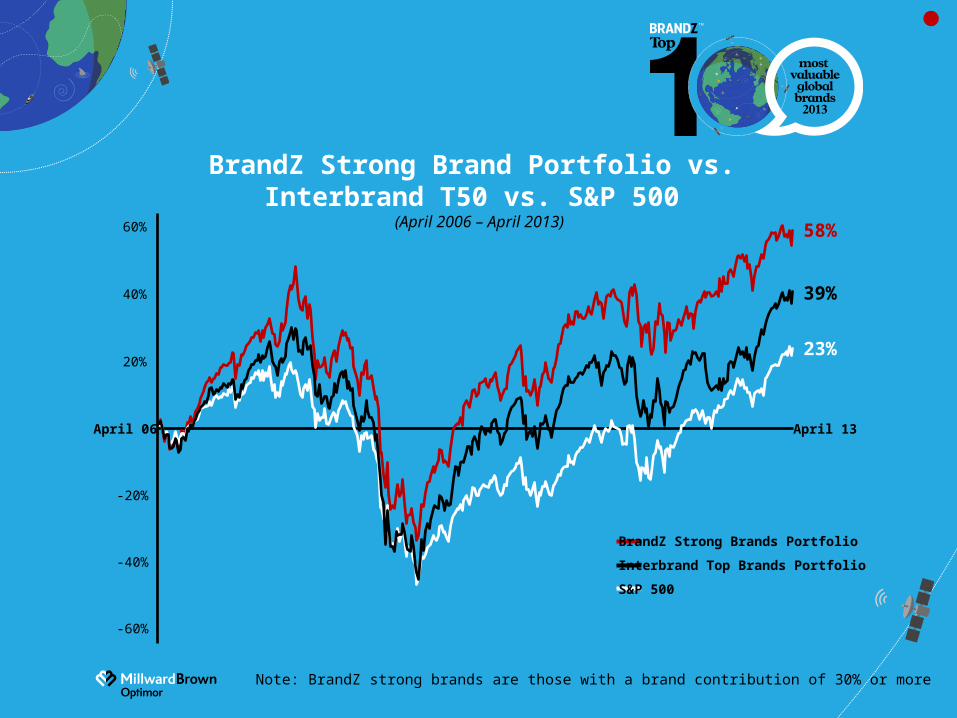
BrandZ Strong Brand Portfolio vs. Interbrand T50 vs. S&P 500
(April 2006 – April 2013)
Note: BrandZ strong brands are those with a brand contribution of 30% or more
April 13April 06
60%
40%
20%
-60%
-40%
-20%
58%
39%
23%
BrandZ Strong Brands Portfolio
Interbrand Top Brands Portfolio
S&P 500
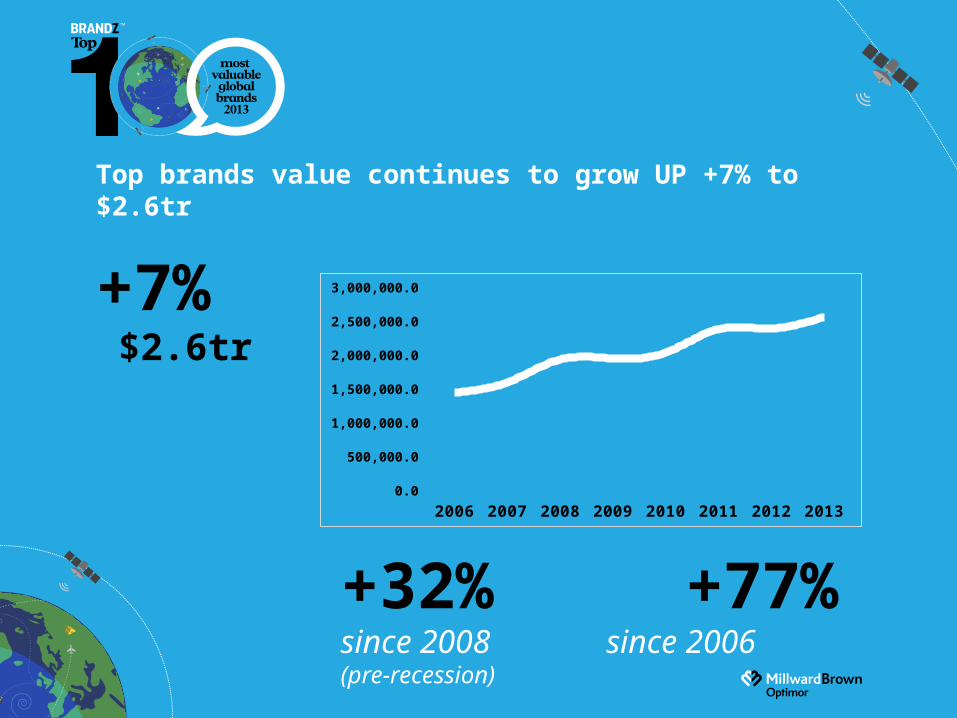
Top brands value continues to grow UP +7% to $2.6tr
+32% +77% since 2008 since 2006(pre-recession)
2006 2007 2008 2009 2010 2011 2012 20130.0
500,000.0
1,000,000.0
1,500,000.0
2,000,000.0
2,500,000.0
3,000,000.0+7% $2.6tr
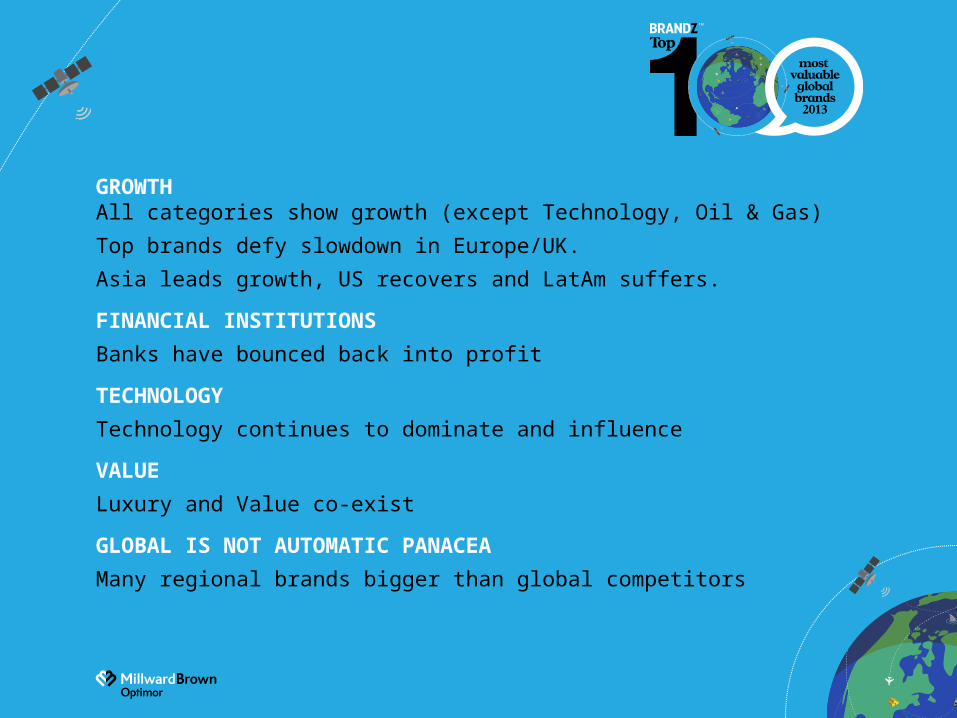
GROWTH All categories show growth (except Technology, Oil & Gas)
Top brands defy slowdown in Europe/UK.
Asia leads growth, US recovers and LatAm suffers.
FINANCIAL INSTITUTIONS
Banks have bounced back into profit
TECHNOLOGY
Technology continues to dominate and influence
VALUE
Luxury and Value co-exist
GLOBAL IS NOT AUTOMATIC PANACEA
Many regional brands bigger than global competitors
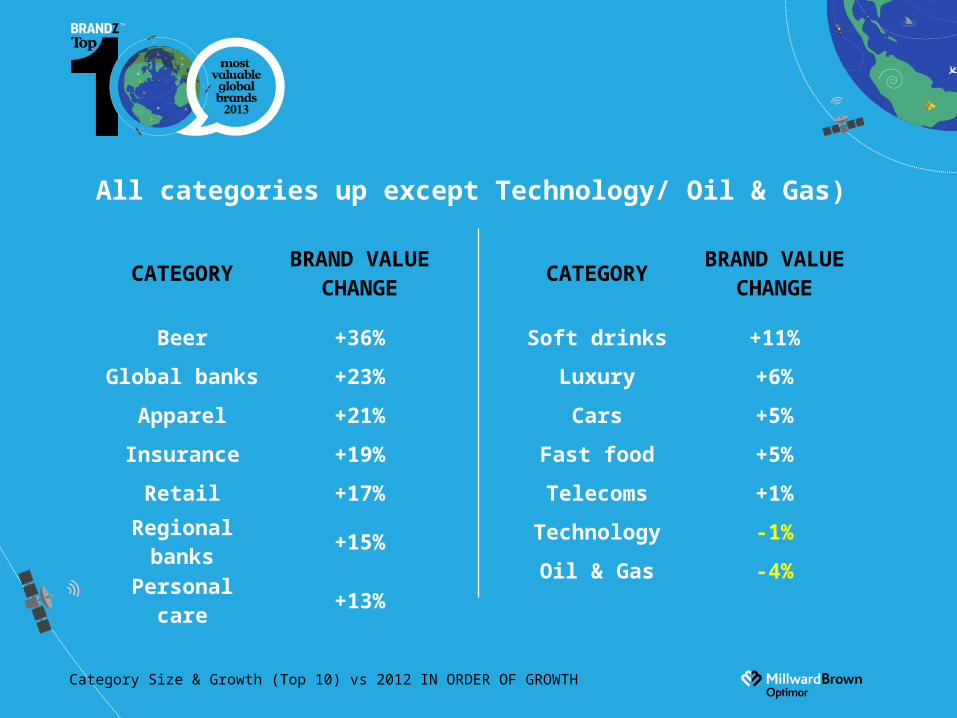
All categories up except Technology/ Oil & Gas)
CATEGORY BRAND VALUE CHANGE
Beer +36%
Global banks +23%
Apparel +21%
Insurance +19%
Retail +17%
Regional banks +15%
Personal care +13%
CATEGORY BRAND VALUE CHANGE
Soft drinks +11%
Luxury +6%
Cars +5%
Fast food +5%
Telecoms +1%
Technology -1%
Oil & Gas -4%
Category Size & Growth (Top 10) vs 2012 IN ORDER OF GROWTH
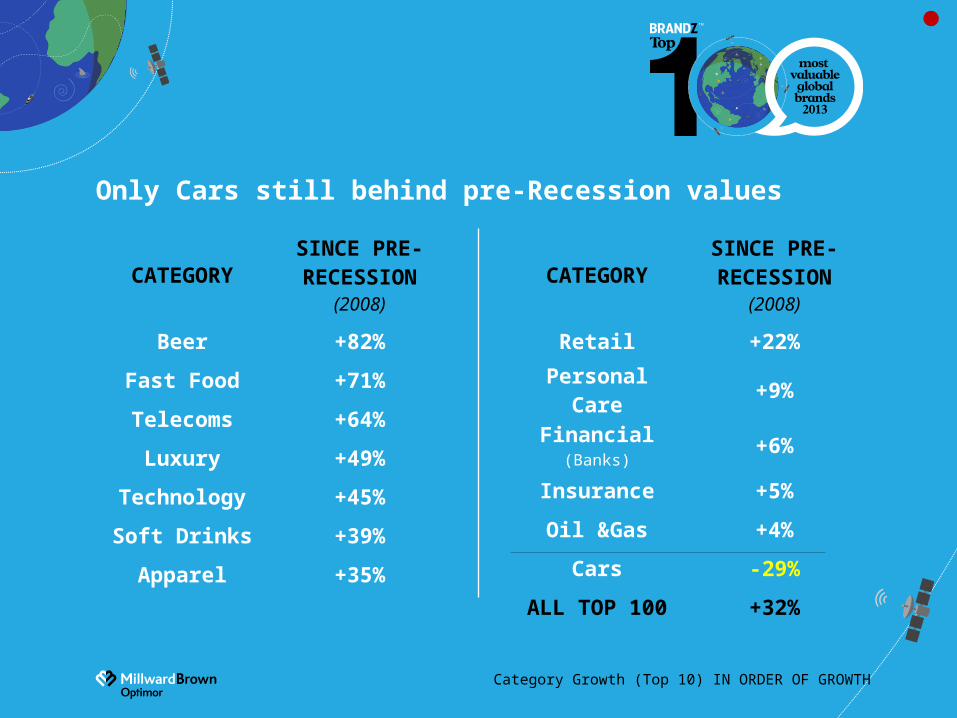
Only Cars still behind pre-Recession values
CATEGORYSINCE PRE-RECESSION
(2008)
Beer +82%
Fast Food +71%
Telecoms +64%
Luxury +49%
Technology +45%
Soft Drinks +39%
Apparel +35%
CATEGORYSINCE PRE-RECESSION
(2008)
Retail +22%
Personal Care +9%
Financial (Banks)
+6%
Insurance +5%
Oil &Gas +4%
Cars -29%
ALL TOP 100 +32%
Category Growth (Top 10) IN ORDER OF GROWTH

Rankings: Top 20 risers from Global and Category Rankings
BRAND BRAND VALUE CHANGE
Prada +63%Brahma +61%
Zara +60%Calvin Klein +52%
Tencent +52%Samsung +51%
Gucci +48%Visa +46%
The Home Depot +43%Disney +40%
BRAND BRAND VALUE CHANGE
eBay +40%Stella Artois +40%
Skol +39%Next +39%Citi +37%
Nivea +36%Heineken +36%
Commonwealth Bank of Australia +36%
Amazon +34%Barclays +34%
Banks back making profits
They may not be popular but they are
valuable infrastructure and can be profitable
exports
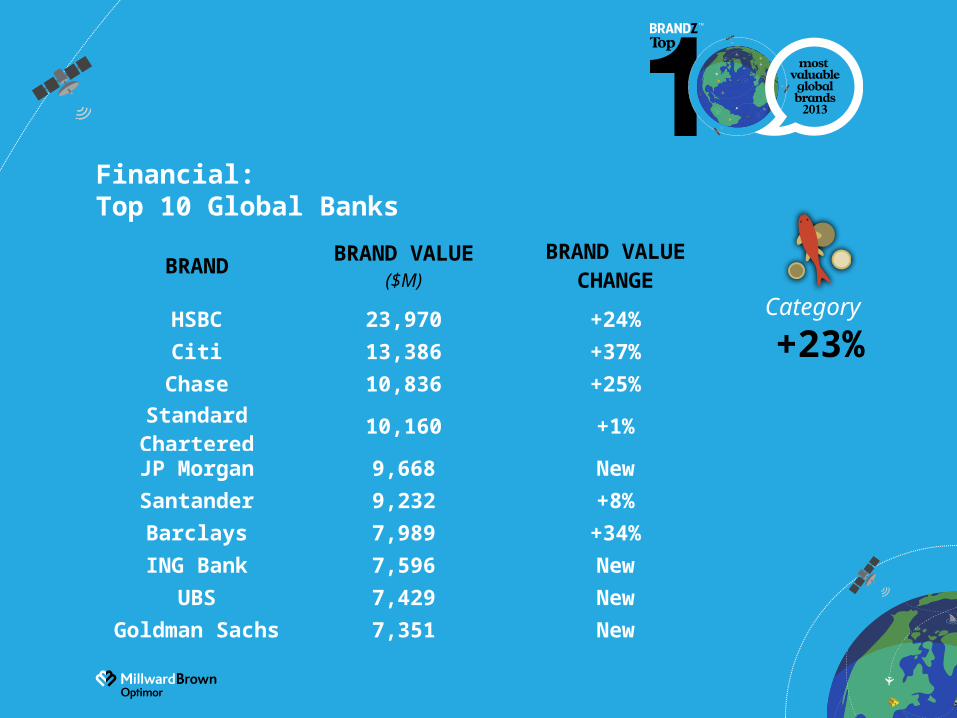
Financial: Top 10 Global Banks
Category
+23%
BRAND BRAND VALUE($M)
BRAND VALUE CHANGE
HSBC 23,970 +24%
Citi 13,386 +37%
Chase 10,836 +25%
Standard Chartered 10,160 +1%
JP Morgan 9,668 New
Santander 9,232 +8%
Barclays 7,989 +34%
ING Bank 7,596 New
UBS 7,429 New
Goldman Sachs 7,351 New
The Soft Drinks ‘share of throat’
increasingly being affected by health
concerns and threatened legislation
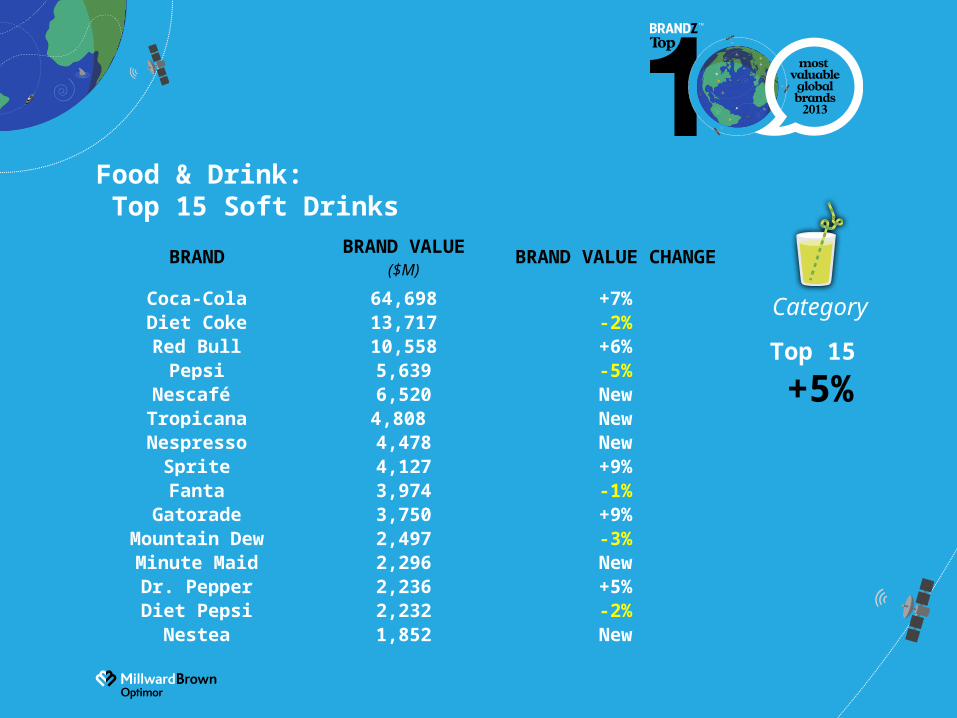
Food & Drink: Top 15 Soft Drinks
Category
Top 15
+5%
BRAND BRAND VALUE($M)
BRAND VALUE CHANGE
Coca-Cola 64,698 +7%Diet Coke 13,717 -2%Red Bull 10,558 +6%
Pepsi 5,639 -5%Nescafé 6,520 New
Tropicana 4,808 NewNespresso 4,478 New
Sprite 4,127 +9%Fanta 3,974 -1%
Gatorade 3,750 +9%Mountain Dew 2,497 -3%Minute Maid 2,296 NewDr. Pepper 2,236 +5%Diet Pepsi 2,232 -2%
Nestea 1,852 New
Volatility across Technology
category
A temporary lull in game changing innovations
US still dominates
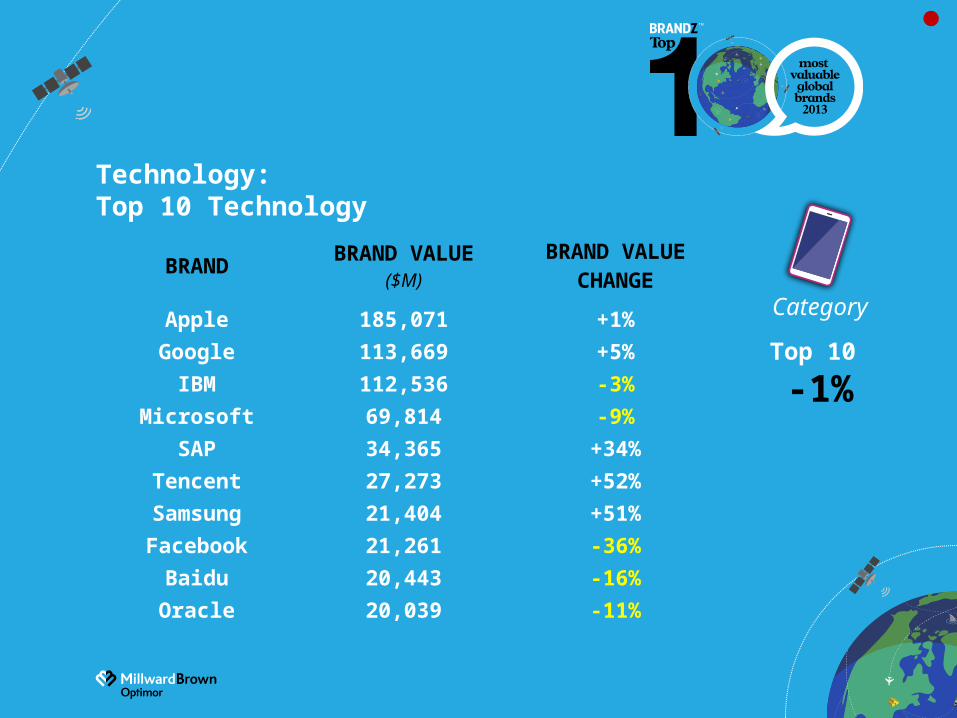
Technology: Top 10 Technology
BRAND BRAND VALUE($M)
BRAND VALUE CHANGE
Apple 185,071 +1%
Google 113,669 +5%
IBM 112,536 -3%
Microsoft 69,814 -9%
SAP 34,365 +34%
Tencent 27,273 +52%
Samsung 21,404 +51%
Facebook 21,261 -36%
Baidu 20,443 -16%
Oracle 20,039 -11%
Category
Top 10
-1%

Great T-shirt Giveaway
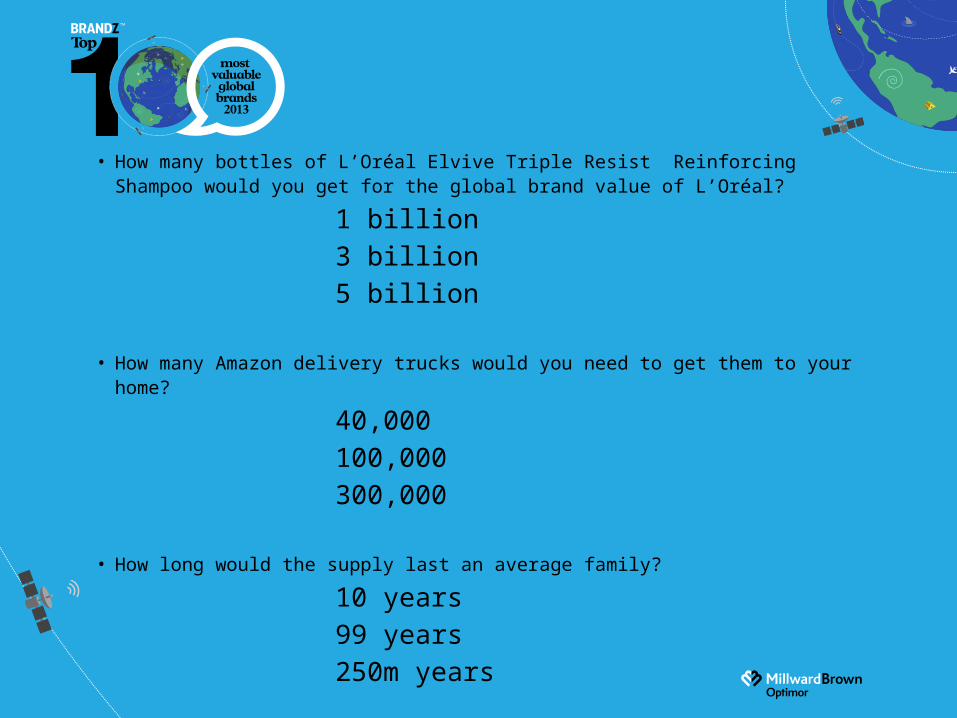
• How many bottles of L’Oréal Elvive Triple Resist Reinforcing Shampoo would you get for the global brand value of L’Oréal?
1 billion
3 billion
5 billion
• How many Amazon delivery trucks would you need to get them to your home?
40,000
100,000
300,000
• How long would the supply last an average family?
10 years
99 years
250m years
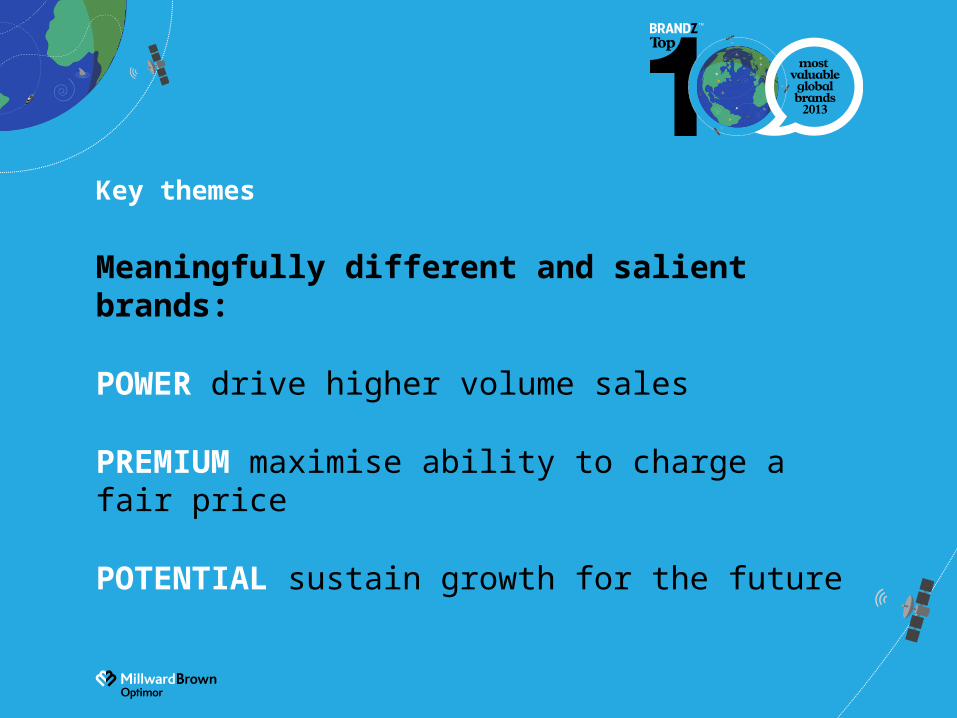
Key themes
Meaningfully different and salient brands:
POWER drive higher volume sales
PREMIUM maximise ability to charge a fair price
POTENTIAL sustain growth for the future
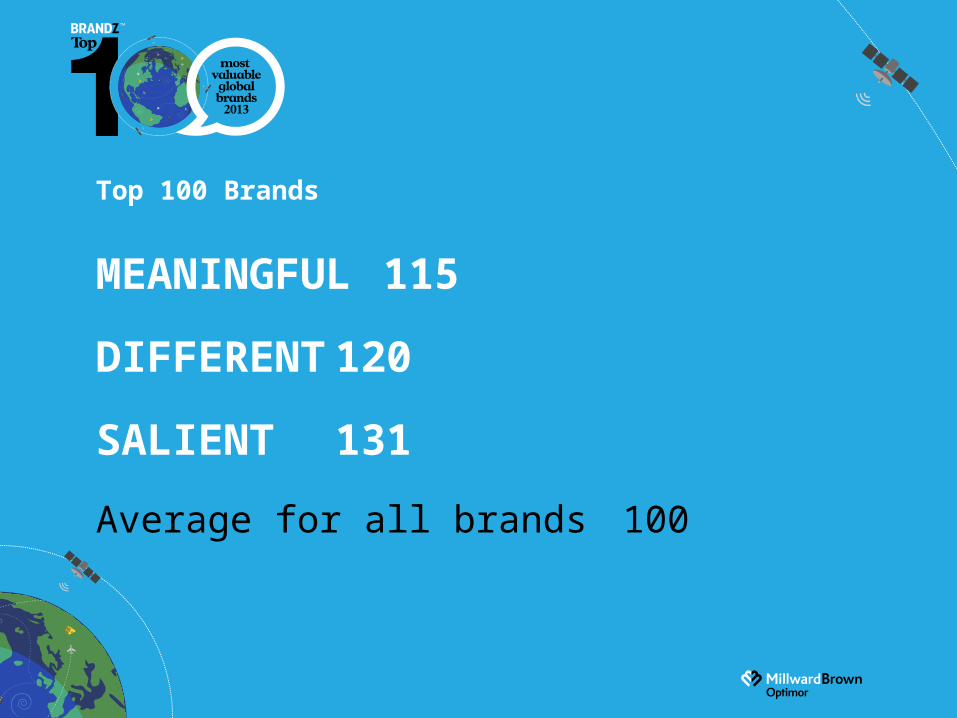
Top 100 Brands
MEANINGFUL 115
DIFFERENT 120
SALIENT 131
Average for all brands 100
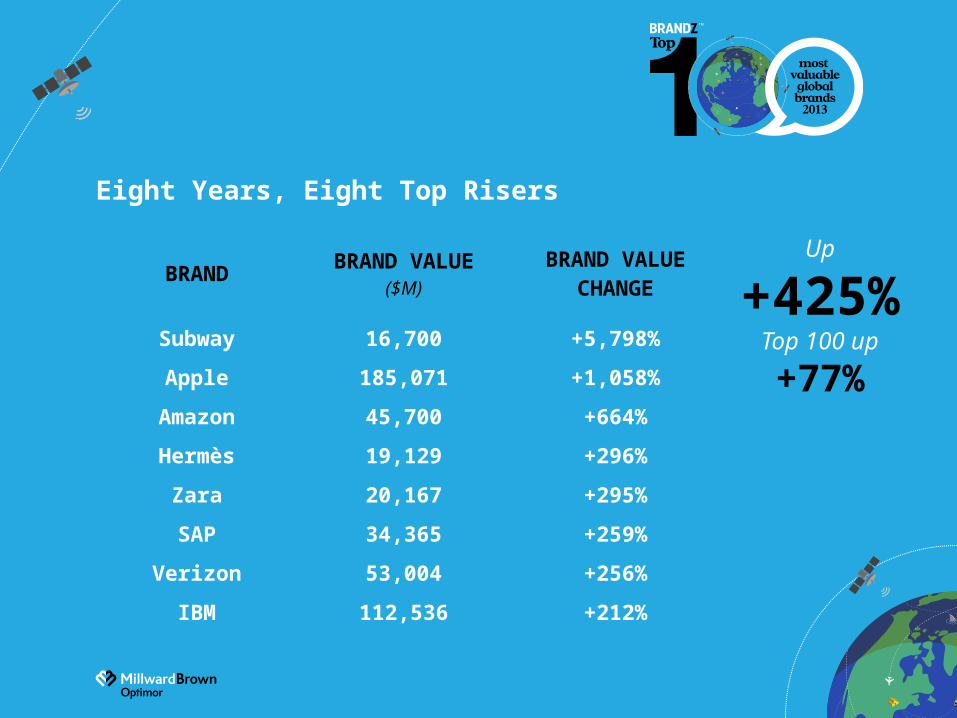
Eight Years, Eight Top Risers
BRAND BRAND VALUE($M)
BRAND VALUE CHANGE
Subway 16,700 +5,798%
Apple 185,071 +1,058%
Amazon 45,700 +664%
Hermès 19,129 +296%
Zara 20,167 +295%
SAP 34,365 +259%
Verizon 53,004 +256%
IBM 112,536 +212%
Up
+425%Top 100 up
+77%
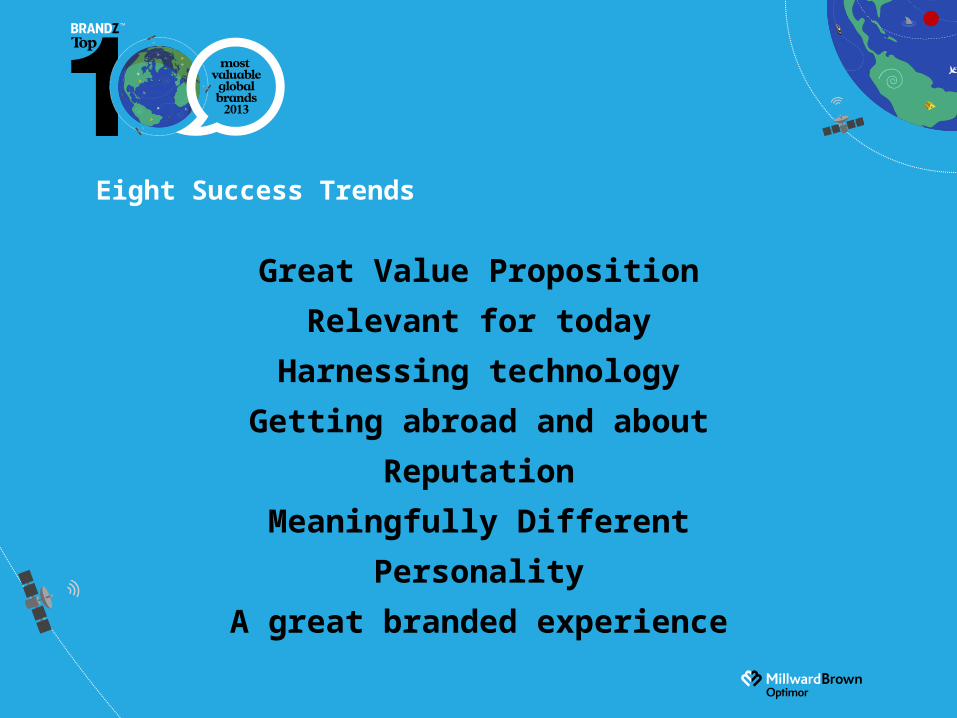
Eight Success Trends
Great Value Proposition
Relevant for today
Harnessing technology
Getting abroad and about
Reputation
Meaningfully Different
Personality
A great branded experience
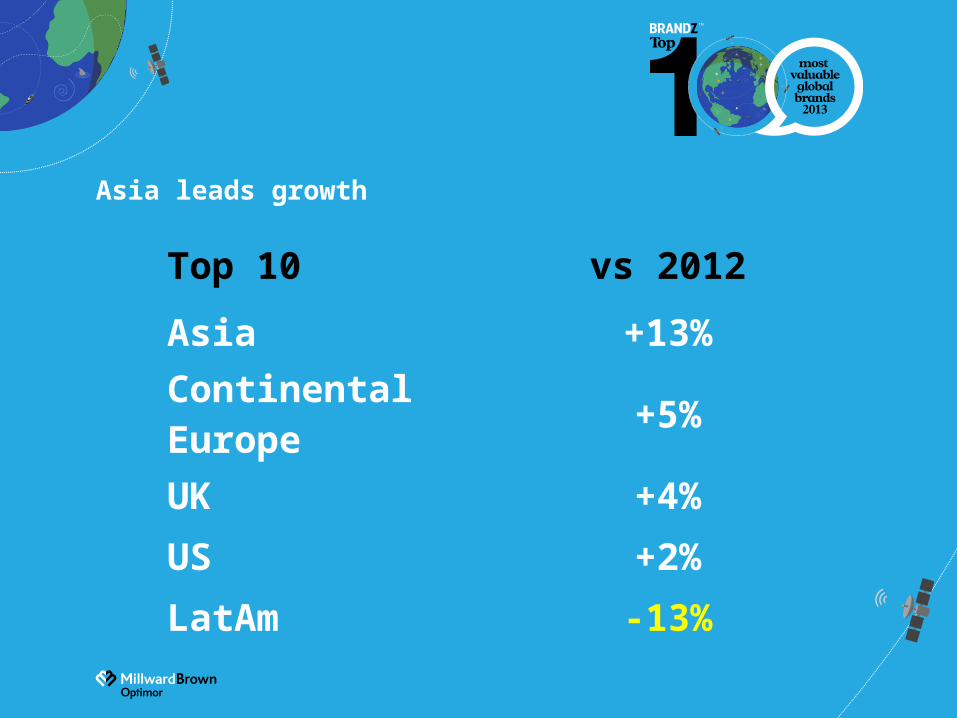
Asia leads growth
Top 10 vs 2012
Asia +13%
Continental Europe +5%
UK +4%
US +2%
LatAm -13%
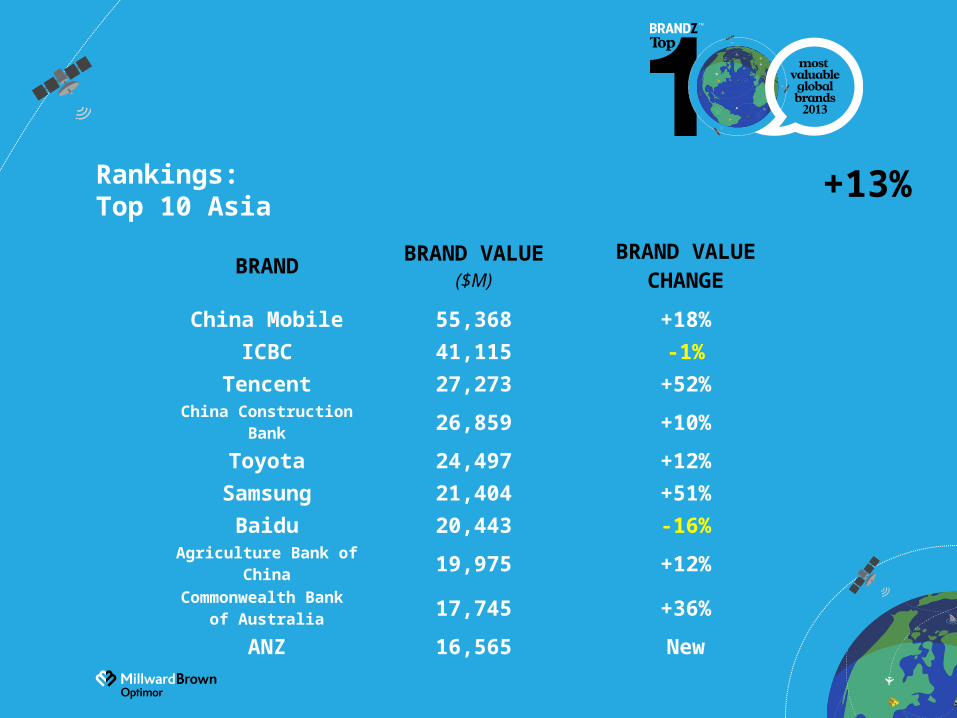
Rankings: Top 10 Asia
BRAND BRAND VALUE($M)
BRAND VALUE CHANGE
China Mobile 55,368 +18%
ICBC 41,115 -1%
Tencent 27,273 +52%China Construction Bank 26,859 +10%
Toyota 24,497 +12%
Samsung 21,404 +51%
Baidu 20,443 -16%Agriculture Bank of China 19,975 +12%
Commonwealth Bank of Australia 17,745 +36%
ANZ 16,565 New
+13%
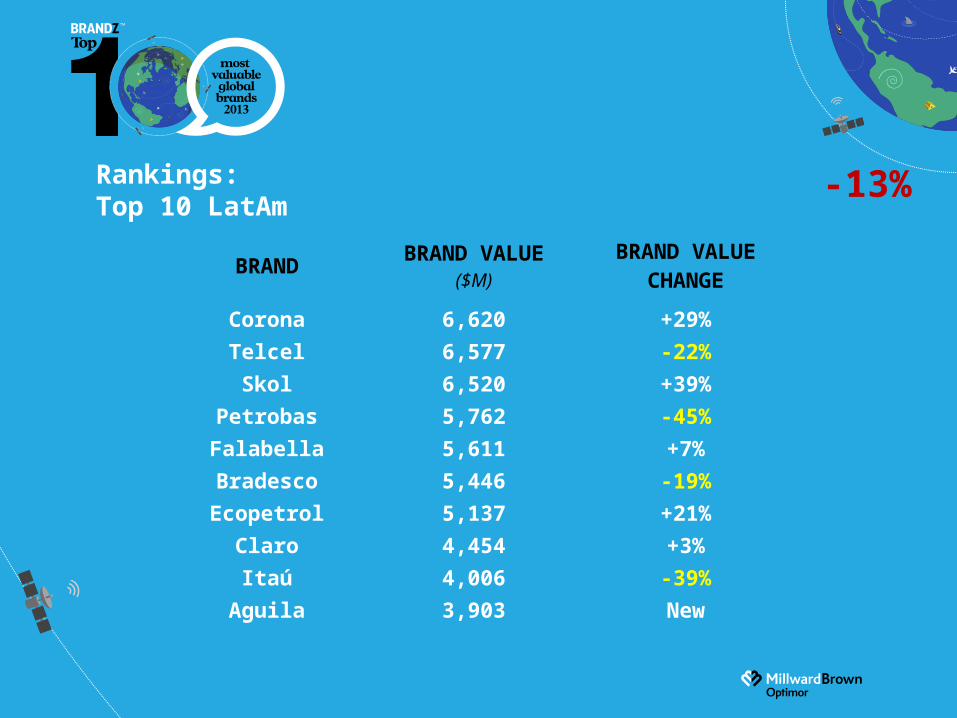
Rankings: Top 10 LatAm
BRAND BRAND VALUE($M)
BRAND VALUE CHANGE
Corona 6,620 +29%
Telcel 6,577 -22%
Skol 6,520 +39%
Petrobas 5,762 -45%
Falabella 5,611 +7%
Bradesco 5,446 -19%
Ecopetrol 5,137 +21%
Claro 4,454 +3%
Itaú 4,006 -39%
Aguila 3,903 New
-13%
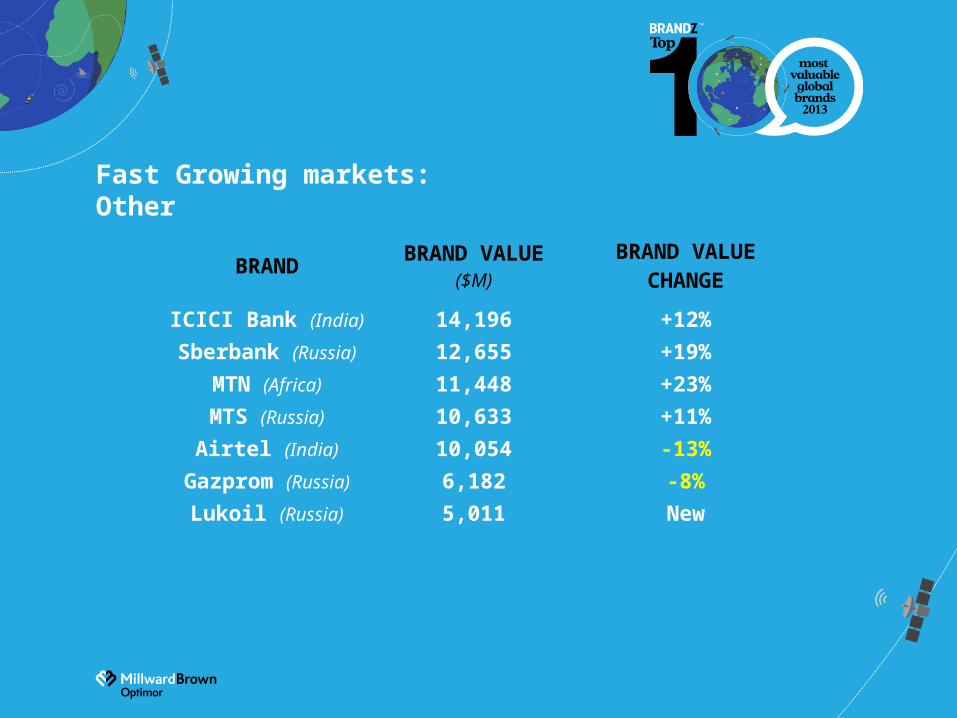
Fast Growing markets: Other
BRAND BRAND VALUE($M)
BRAND VALUE CHANGE
ICICI Bank (India) 14,196 +12%
Sberbank (Russia) 12,655 +19%
MTN (Africa) 11,448 +23%
MTS (Russia) 10,633 +11%
Airtel (India) 10,054 -13%
Gazprom (Russia) 6,182 -8%
Lukoil (Russia) 5,011 New
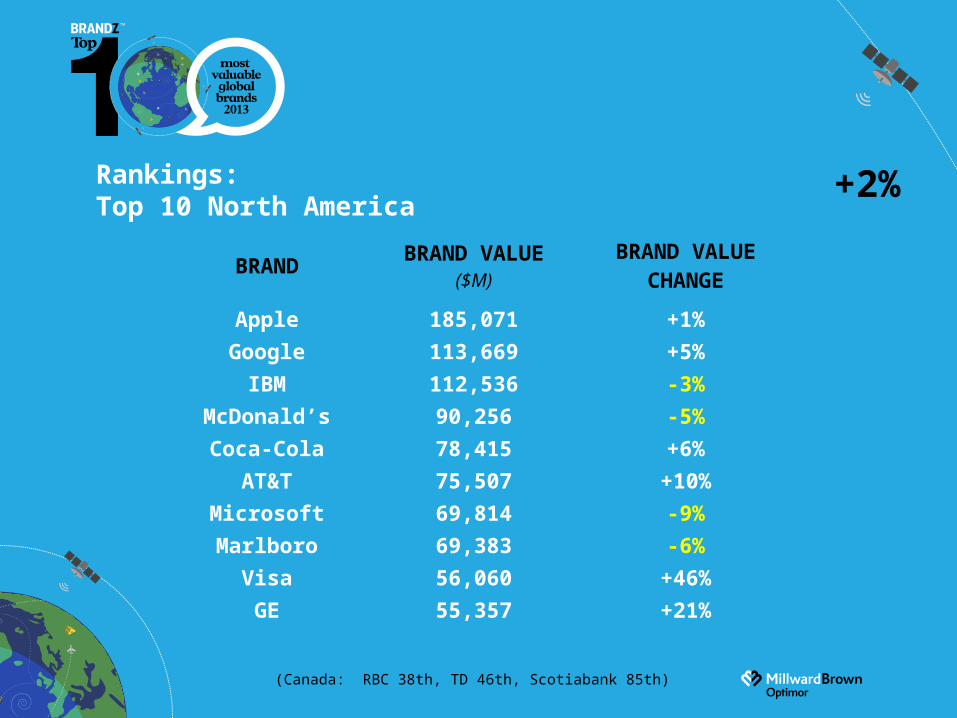
Rankings: Top 10 North America
BRAND BRAND VALUE($M)
BRAND VALUE CHANGE
Apple 185,071 +1%
Google 113,669 +5%
IBM 112,536 -3%
McDonald’s 90,256 -5%
Coca-Cola 78,415 +6%
AT&T 75,507 +10%
Microsoft 69,814 -9%
Marlboro 69,383 -6%
Visa 56,060 +46%
GE 55,357 +21%
(Canada: RBC 38th, TD 46th, Scotiabank 85th)
+2%
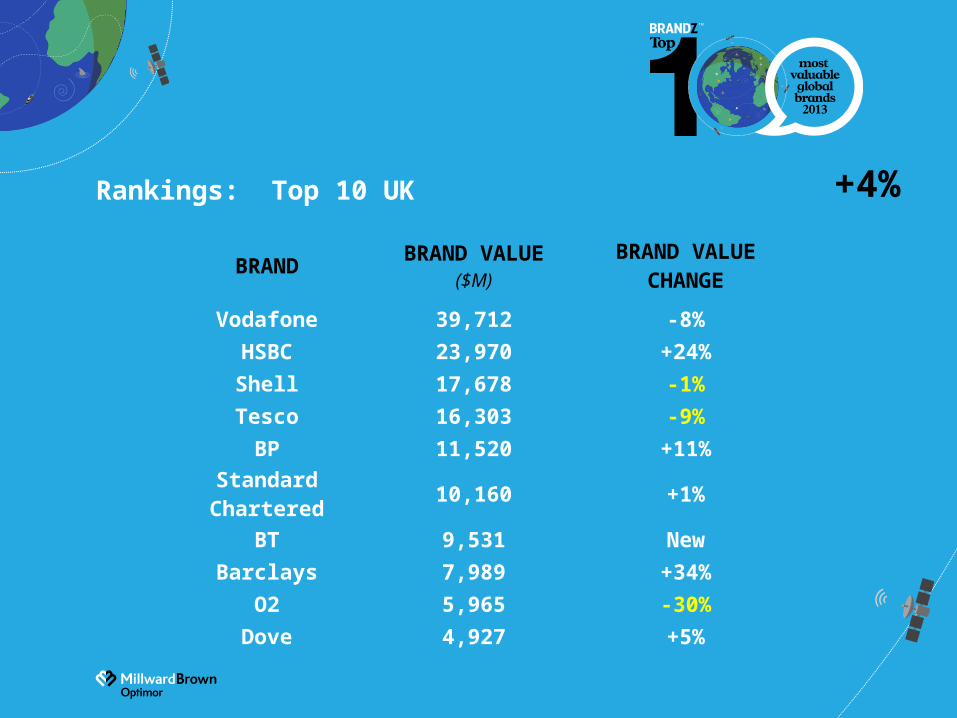
Rankings: Top 10 UK
BRAND BRAND VALUE($M)
BRAND VALUE CHANGE
Vodafone 39,712 -8%
HSBC 23,970 +24%
Shell 17,678 -1%
Tesco 16,303 -9%
BP 11,520 +11%
Standard Chartered 10,160 +1%
BT 9,531 New
Barclays 7,989 +34%
O2 5,965 -30%
Dove 4,927 +5%
+4%
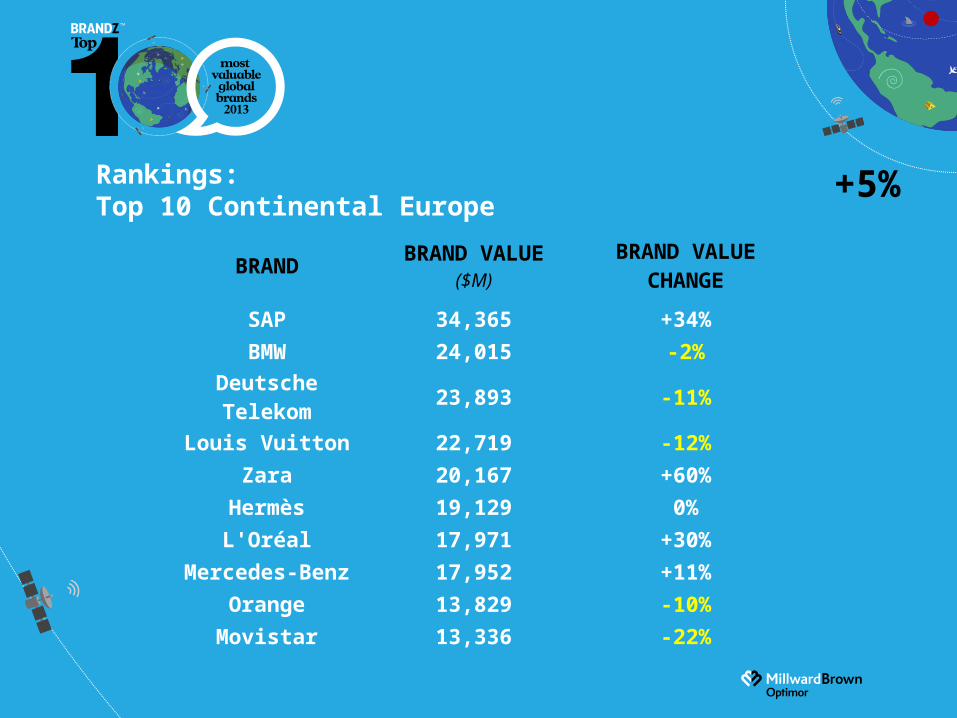
Rankings: Top 10 Continental Europe
BRAND BRAND VALUE($M)
BRAND VALUE CHANGE
SAP 34,365 +34%
BMW 24,015 -2%
Deutsche Telekom 23,893 -11%
Louis Vuitton 22,719 -12%
Zara 20,167 +60%
Hermès 19,129 0%
L'Oréal 17,971 +30%
Mercedes-Benz 17,952 +11%
Orange 13,829 -10%
Movistar 13,336 -22%
+5%
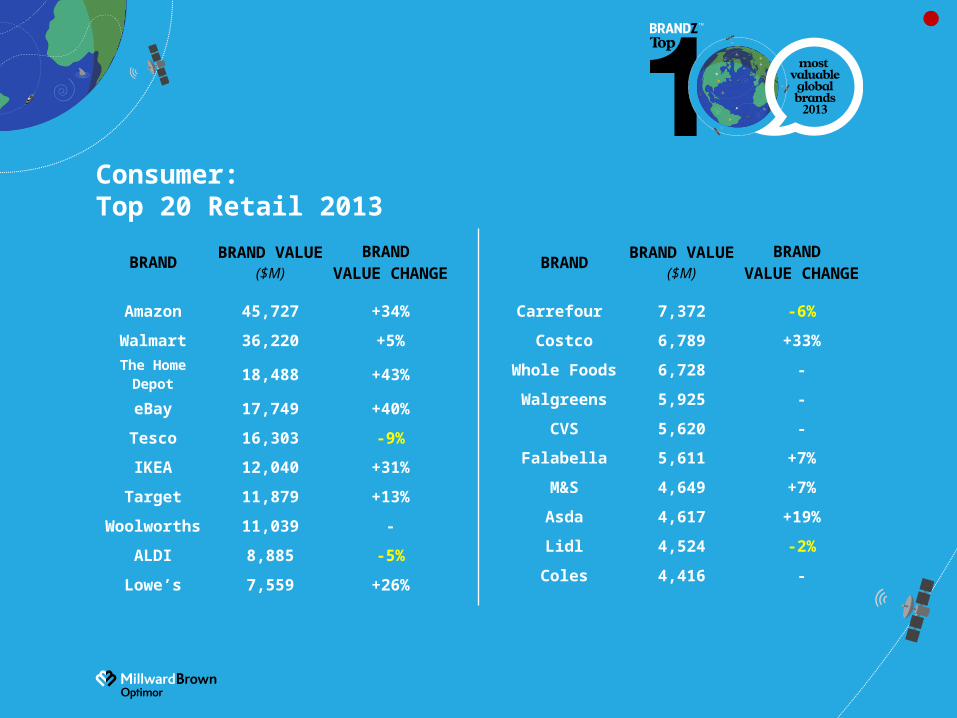
BRAND BRAND VALUE($M)
BRAND VALUE
CHANGE
Amazon 45,727 +34%
Walmart 36,220 +5%
The Home Depot 18,488 +43%
eBay 17,749 +40%
Tesco 16,303 -9%
IKEA 12,040 +31%
Target 11,879 +13%
Woolworths 11,039 -
ALDI 8,885 -5%
Lowe’s 7,559 +26%
Consumer: Top 20 Retail 2013
BRAND BRAND VALUE($M)
BRAND VALUE
CHANGE
Carrefour 7,372 -6%
Costco 6,789 +33%
Whole Foods 6,728 -
Walgreens 5,925 -
CVS 5,620 -
Falabella 5,611 +7%
M&S 4,649 +7%
Asda 4,617 +19%
Lidl 4,524 -2%
Coles 4,416 -
Key Take Aways
PURPOSE
CONSUMERS
COMMUNICATION
GROWTH
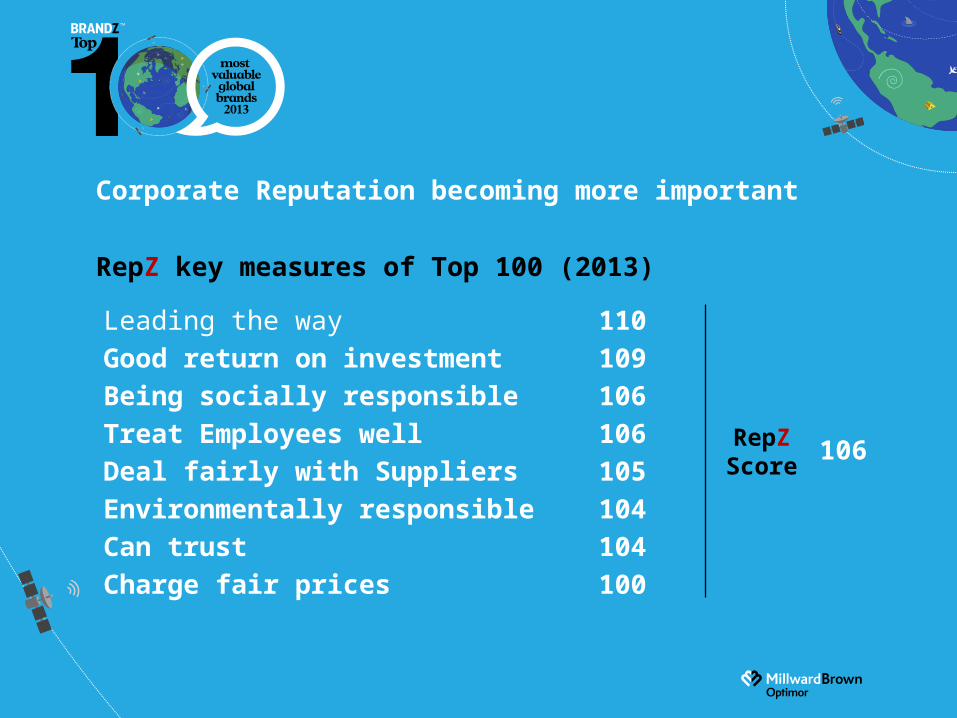
Corporate Reputation becoming more important
RepZ key measures of Top 100 (2013)
Leading the way 110Good return on investment 109Being socially responsible 106Treat Employees well 106Deal fairly with Suppliers 105Environmentally responsible 104Can trust 104Charge fair prices 100
RepZScore
106
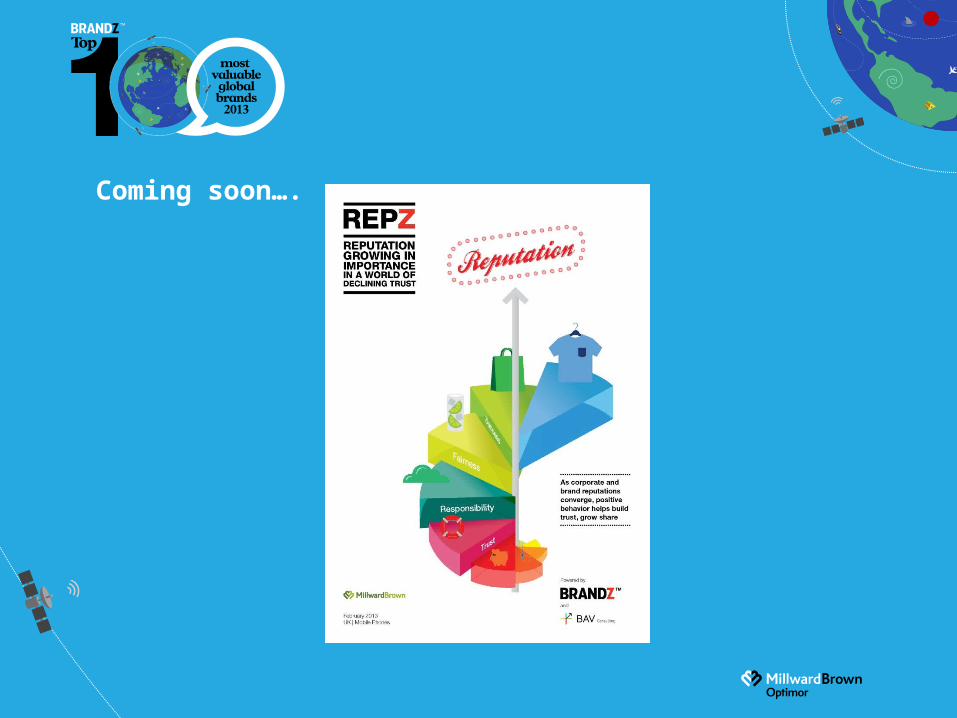
Coming soon….