Embed Size (px)
Citation preview

2 About this Industry2 Industry Definition
2 Main Activities
2 Similar Industries
2 Additional Resources
3 Industry at a Glance
4 Industry Performance4 Executive Summary
4 Key External Drivers
5 Current Performance
7 Industry Outlook
10 Industry Life Cycle
12 Products & Markets12 Supply Chain
12 Products & Services
13 Demand Determinants
14 Major Markets
15 International Trade
16 Business Locations
18 Competitive Landscape18 Market Share Concentration
18 Key Success Factors
18 Cost Structure Benchmarks
19 Basis of Competition
21 Barriers to Entry
21 Industry Globalisation
22 Major Companies22 Australian Pharmaceutical Industries
Limited
24 Sigma Pharmaceuticals Limited
25 Zuellig Healthcare Holdings Australia Pty Limited
27 Operating Conditions27 Capital Intensity
28 Technology & Systems
29 Revenue Volatility
29 Regulation & Policy
31 Industry Assistance
32 Key Statistics32 Industry Data
32 Annual Change
32 Key Ratios
33 Jargon & Glossary
IBISWorld Industry Report G525aPharmacies in AustraliaJune 2012 Arna Richardson
Healthy and wealthy: The industry maintains mature growth as competition intensifies
www.ibisworld.com.au | (03) 9655 3881 | [email protected]
www.IbISwORLd.COM.Au Pharmacies in Australia June 2012 2
The industry covers all community pharmacies involved in the sale of prescription drugs and patent medicines. The products are sourced either directly
from upstream pharmaceutical manufacturers or from pharmaceutical wholesalers. The products are then sold to the general consumer from a pharmacy.
The primary activities of this industry are
Drug retailing
Patent medicine retailing
Pharmacy retail and operation
Prescription and medicinal dispensing
Industry definition
Main Activities
Similar Industries
Additional Resources
IBISWorld writes over 500 Australian industry reports, which are updated up to four times a year. To see all reports, go to www.ibisworld.com.au
The major products and services in this industry are
General retail products
Non-prescription medicines
Prescription medicines
About this Industry
C2543 Pharmaceutical Product Manufacturing in AustraliaCompanies in this industry manufacture drugs, medicinal chemicals and other pharmaceutical products for human or veterinary use.
F4797 Pharmaceuticals wholesaling in AustraliaFirms in this industry wholesale pharmaceutical preparations.
F4798 Cosmetics and Toiletry wholesaling in AustraliaEstablishments in this industry wholesale cosmetics and toilet preparations.
For additional information on this industry
www.health.gov.au Department of Health and Ageing
www.pbs.gov.au Pharmaceutical Benefits Scheme
www.psa.org.au Pharmaceutical Society of Australia
www.guild.org.au Pharmacy Guild of Australia
www.IbISwORLd.COM.Au Pharmacies in Australia June 2012 3
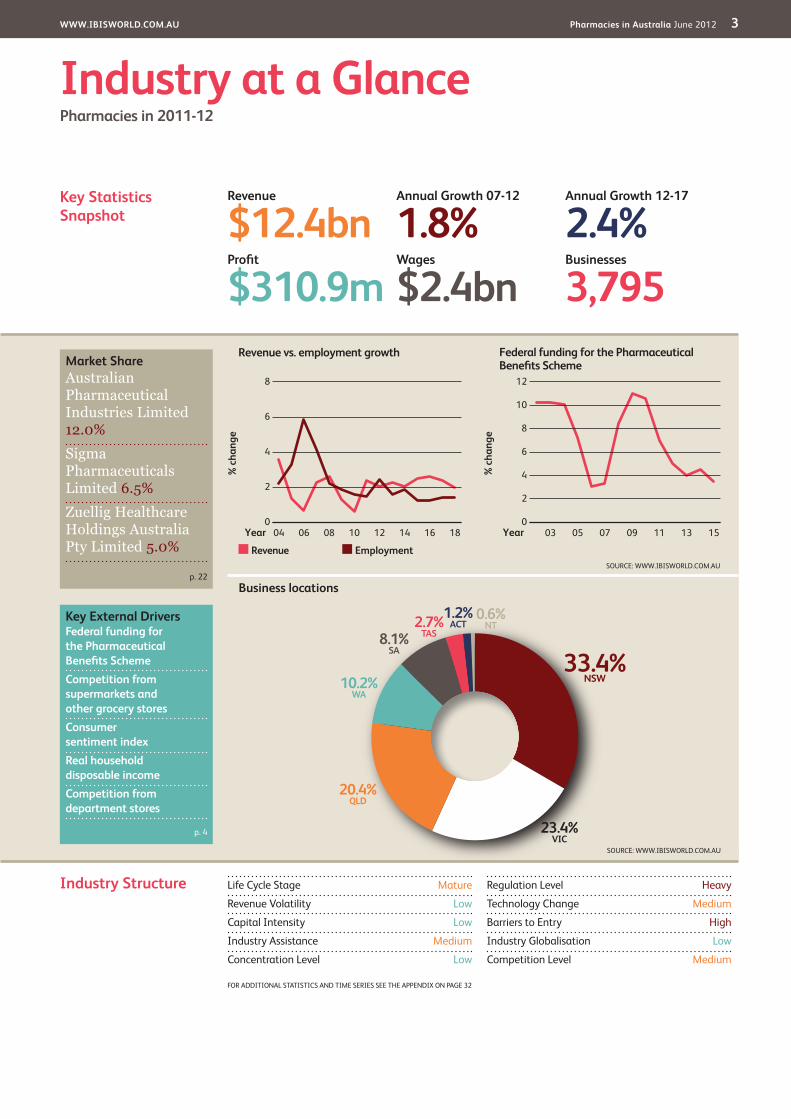
Market ShareAustralian Pharmaceutical Industries Limited 12.0%
Sigma Pharmaceuticals Limited 6.5%
Zuellig Healthcare Holdings Australia Pty Limited 5.0%
Key External driversFederal funding for the Pharmaceutical benefits SchemeCompetition from supermarkets and other grocery storesConsumer sentiment indexReal household disposable incomeCompetition from department stores
Key Statistics Snapshot
Industry at a GlancePharmacies in 2011-12
Revenue
$12.4bnProfit
$310.9mwages
$2.4bnbusinesses
3,795
Annual Growth 12-17
2.4%Annual Growth 07-12
1.8%
Industry Structure Life Cycle Stage Mature
Revenue Volatility Low
Capital Intensity Low
Industry Assistance Medium
Concentration Level Low
Regulation Level Heavy
Technology Change Medium
Barriers to Entry High
Industry Globalisation Low
Competition Level Medium
FOR ADDITIONAL STATISTICS AND TIME SERIES SEE THE APPENDIx ON PAGE 32
% c
hang
e
12
0
2
4
6
8
10
1503 05 07 09 11 13Year
Federal funding for the Pharmaceutical Benefits Scheme
SOURCE: WWW.IBISWORLD.COM.AU
% c
hang
e
8
0
2
4
6
1804 06 08 10 12 14 16Year
Revenue Employment
Revenue vs. employment growth
Business locations
33.4%NSW
2.7%TAS
23.4%VIC
1.2%ACT
0.6%NT
20.4%QLD
10.2%WA
8.1%SA
SOURCE: WWW.IBISWORLD.COM.AU
p. 22
p. 4
SOURCE: WWW.IBISWORLD.COM.AU
www.IbISwORLd.COM.Au Pharmacies in Australia June 2012 4
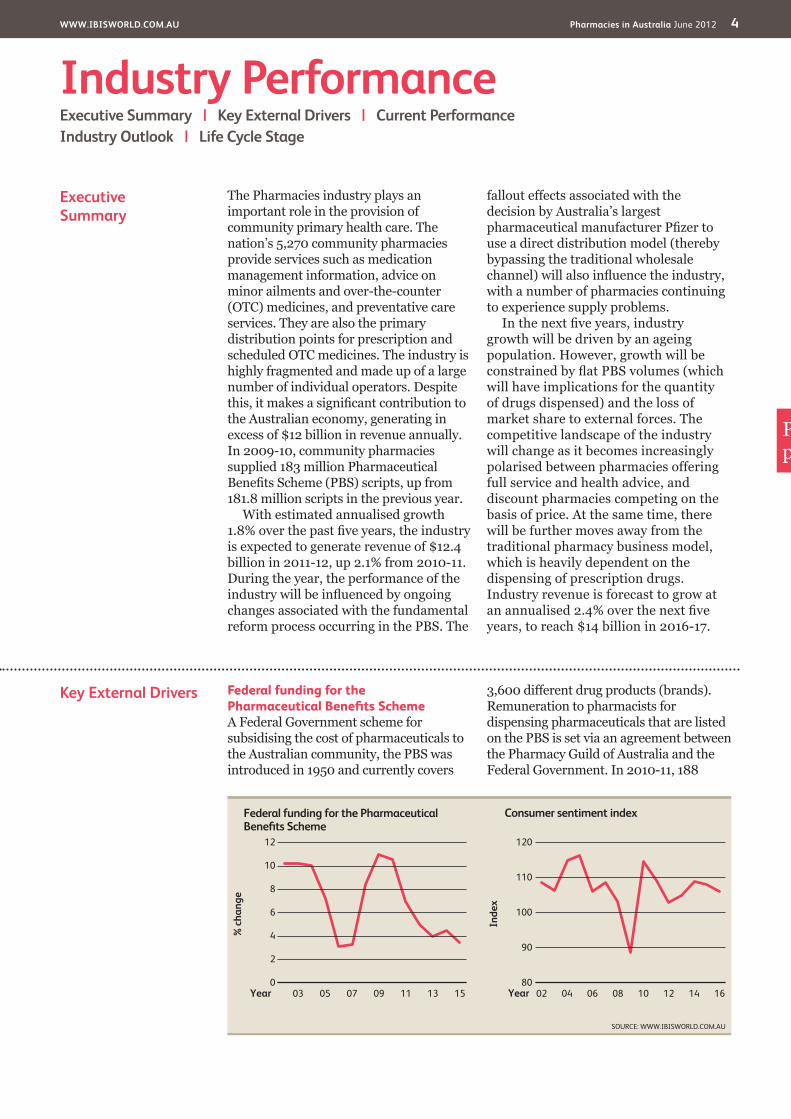
Key External drivers Federal funding for the Pharmaceutical Benefits SchemeA Federal Government scheme for subsidising the cost of pharmaceuticals to the Australian community, the PBS was introduced in 1950 and currently covers
3,600 different drug products (brands). Remuneration to pharmacists for dispensing pharmaceuticals that are listed on the PBS is set via an agreement between the Pharmacy Guild of Australia and the Federal Government. In 2010-11, 188
Executive Summary
The Pharmacies industry plays an important role in the provision of community primary health care. The nation’s 5,270 community pharmacies provide services such as medication management information, advice on minor ailments and over-the-counter (OTC) medicines, and preventative care services. They are also the primary distribution points for prescription and scheduled OTC medicines. The industry is highly fragmented and made up of a large number of individual operators. Despite this, it makes a significant contribution to the Australian economy, generating in excess of $12 billion in revenue annually. In 2009-10, community pharmacies supplied 183 million Pharmaceutical Benefits Scheme (PBS) scripts, up from 181.8 million scripts in the previous year.
With estimated annualised growth 1.8% over the past five years, the industry is expected to generate revenue of $12.4 billion in 2011-12, up 2.1% from 2010-11. During the year, the performance of the industry will be influenced by ongoing changes associated with the fundamental reform process occurring in the PBS. The
fallout effects associated with the decision by Australia’s largest pharmaceutical manufacturer Pfizer to use a direct distribution model (thereby bypassing the traditional wholesale channel) will also influence the industry, with a number of pharmacies continuing to experience supply problems.
In the next five years, industry growth will be driven by an ageing population. However, growth will be constrained by flat PBS volumes (which will have implications for the quantity of drugs dispensed) and the loss of market share to external forces. The competitive landscape of the industry will change as it becomes increasingly polarised between pharmacies offering full service and health advice, and discount pharmacies competing on the basis of price. At the same time, there will be further moves away from the traditional pharmacy business model, which is heavily dependent on the dispensing of prescription drugs. Industry revenue is forecast to grow at an annualised 2.4% over the next five years, to reach $14 billion in 2016-17.
Industry PerformanceExecutive Summary | Key External drivers | Current Performance Industry Outlook | Life Cycle Stage
Pharmacies play an important role in the provision of community primary health care
Inde
x
120
80
90
100
110
1602 04 06 08 10 12 14Year
Consumer sentiment index
SOURCE: WWW.IBISWORLD.COM.AU
% c
hang
e
12
0
2
4
6
8
10
1503 05 07 09 11 13Year
Federal funding for the Pharmaceutical Benefits Scheme

www.IbISwORLd.COM.Au Pharmacies in Australia June 2012 5
Industry Performance
Current Performance
Over the five years through 2011-12, the Pharmacies industry has derived most of its revenue from the dispensing of prescription pharmaceuticals, its traditional revenue base. This is in spite of efforts by various industry participants to provide a more total pharmacy offer in line with their changing operating environment. This offer has meant a greater emphasis on front-of-store sales, which includes not only traditional pharmacy lines but also new value added lines.
One impetus for the changing business models is the number of deep-seated challenges affecting the pharmaceutical market, including the effect of key patent expiries and the fall-out effects associated with the introduction of fundamental (and ongoing) reforms to the PBS commencing August 2007, which represent the largest shake-up to the scheme in about 60 years. These have had widespread reverberations, affecting all components of the industry. Pharmaceutical companies (whether they be manufacturers, wholesalers or retailers) are now having to adopt new business models in line with the changed
realities of the pharmaceutical marketplace. In the case of pharmacies, margins have been significantly squeezed by the mandatory price cut to a large number of PBS drugs, forcing pharmacies to diversify their revenue base away from traditional dispensing activities.
Pharmacies are also dealing with another external shock, namely the move by pharmaceutical giant Pfizer to cut wholesalers out of the supply chain as it extends its direct distribution model to directly sell its prescription pharmaceuticals to pharmacies. Part of the rationale for this move appears to lie in the ongoing PBS reforms. However, several pharmacies claim to be experiencing difficulties in ensuring that their patients receive timely access to medicines.
In 2011-12, the industry is expected to be worth $12.4 billion, compared with $11.4 billion in 2006-07. Year-on-year growth has ranged between a high of 2.6% in 2007-08 and a low of 0.6% in 2009-10. Overall, revenue is expected to grow at an annualised 1.8% over the five years through 2011-12, with growth of 2.1% in 2011-12.
Key External driverscontinued
million scripts were dispensed via the PBS.
Competition from supermarkets and other grocery storesIn the past five years, pharmacies have been under growing pressure from supermarkets and other non-pharmacy outlets that have been increasing their product ranges to encompass products previously stocked by pharmacies only, including OTC products. For example, supermarkets tend to stock substitutes for the most widely used non-scheduled chemist-only products.
Consumer sentiment indexConsumer sentiment affects how much consumers are willing to spend on discretionary items at pharmacies. In
addition, consumers are more likely to purchase generic-brand prescription medicines when sentiment is low.
Real household disposable incomeThe demand for non-essential drugs and for many of the front-of-store products sold by pharmacies (including cosmetics and toiletries) is responsive to changes in the level of real household disposable income.
Competition from department storesOver the past five years, there has been an increase in the level of competition derived from department stores that have expanded their product ranges to include various cosmetic and toiletry items and non-scheduled chemist-only products.
www.IbISwORLd.COM.Au Pharmacies in Australia June 2012 6
Industry Performance
Constrained profit margins
Pharmacies derive a considerable proportion of their net profits from prescription dispensation, with a smaller proportion derived from front-of-store operations. In the case of the former, prescription medicines have prices or margins that are set by the government via the PBS and Community Pharmacy Agreements. These have tended to fall in the past five years, particularly in the wake of the ongoing PBS reforms.
At the same time, pharmacy profitability has been affected by rising competitive pressures, particularly as the industry becomes increasingly polarised between the new discount pharmacies with their everyday low price offering and those employing the more traditional full-service model. Moves by upstream wholesalers to cut their discounts or credit terms offered to pharmacies have also had an adverse effect on profit margins.
New retail formats Over the past decade, there has been a slight increase in pharmacy numbers as existing players such as Australian Pharmaceutical Industries (owner of the Priceline Pharmacy brand) have gradually rolled out new stores. As at early 2012, there were 332 Priceline stores nationwide, of which 185 were pharmacies. Australian Pharmaceutical Industries is increasingly relying on a franchise model. Similarly, Terry White Chemists is in the process of opening new franchise stores, with its numbers increasing from 108 franchises in 2005-06 to 165 in 2010-11. In 2011-12, IBISWorld expects there to be 5,270 approved pharmacies and friendly societies, up from 4,992 in 2006-07. This has added to competitive pressures, as has
the development of new pharmacy models.There has also been the introduction of
a number of new retail formats, including niche pharmacies, larger super-chemists and discount or warehouse-style outlets. The last of these in particular has benefited from recessionary conditions and the associated effect on discretionary consumer expenditure patterns, with a growing number of consumers favouring warehouse pharmacies that promise discounted prices over the more traditional pharmacy format. In response, Priceline pharmacy has introduced a new fixed-price prescription medicine model, with nearly 60 of the most popular prescriptions priced at $5.99.
New competitive forces
Several significant changes have occurred to the industry’s operating environment, partly brought about by new internal and external competitive forces. The introduction of low-cost, warehouse-style pharmacies with aggressive pricing strategies has affected the industry internally, representing a threat to the business model of the traditional community pharmacy. The advent of online pharmacies and mail order pharmacies is another threat to the more traditional pharmacy.
Externally, the industry has faced increasing competitive pressures from
supermarkets, niche health and beauty retailers, discount department stores and general merchandise retailers including Target and Kmart. This has occurred as items that were once stocked at traditional pharmacies have become open sellers, meaning that as an increasing number of non-pharmacy outlets were able to stock such products at a more competitive price, pharmacies have found it harder to retain their OTC customer base. Similar moves by such stores to increase their associated health and beauty offerings have translated into heightened competitive pressures for other front-of-store sales.

www.IbISwORLd.COM.Au Pharmacies in Australia June 2012 7
Industry Performance
Industry Outlook
Long-term underlying economic, demographic and social trends bode well for the Pharmacies industry. In particular, an ageing population, changing community attitudes to health and skin care, various psychological motivations and ongoing product development and innovation are expected to contribute to continued industry growth. However, growth will be constrained by flat PBS volumes (which will have implications for the quantity of drugs dispensed) and the loss of market share to external forces. Overall, industry revenue is expected to grow at an annualised 2.4% over the next five years, to reach an estimated $14 billion in 2016-17. In 2012-13, revenue is forecast to grow by 2.3%.
As in the past, the regulatory nature of the industry will provide a framework for its growth profile. The continued operation of the PBS and ongoing government policies designed to cap healthcare expenditure, including cutting government subsidies of prescription pharmaceuticals, will influence the industry via the level of revenue received from dispensary sales. Within the next
few years, pharmacies will continue to be affected by the ongoing PBS reforms, which have resulted in the PBS being split into two formularies comprising F1 and F2 drugs. As per the Memorandum of Understanding reached between Medicines Australia and the government, the latest mandatory price cuts of a minimum of 23% for at least 180 F2 drugs occurred in April 2012; these are estimated to equate to a 9.0% cut in PBS revenue, with the full effects to be felt by pharmacies in one year. The new
Inclusive pharmacy offer
In an attempt to arrest the trend away from OTC sales, pharmacies have introduced new business practices to focus on front-of-store sales and provide a more total pharmacy offer. This has resulted in a review of the range and presentation of products and the implementation of new marketing and advertising strategies. The average size of a pharmacy has also increased. Concept stores such as Amcal Max offer a broad range of consumer products including non-prescription medicines, health and beauty products and lifestyle products. Similarly Terry White Chemists is seeking to derive as much as 22% of its revenue from general retail sales.
The industry has sought to build on the increasing level of professional services available via community pharmacies,
stressing the integral role they play in the general healthcare framework. Such services include the provision of drug information, medication management services, clinical interventions and preventative care services for patients with chronic conditions.
Technological developments, reflected in the greater availability of pre-packaged medicines, have had implications for the product profile of many pharmacies and the time spent by pharmacists in actually compounding drugs. Industry participants have also expanded their product ranges to include a growing number of complementary or alternative medicines. This reflects the growing focus among an increasing number of Australian consumers on a more holistic approach to their general health and wellbeing.
% c
hang
e
5
0
1
2
3
4
1804 06 08 10 12 14 16Year
Industry revenue
SOURCE: WWW.IBISWORLD.COM.AU
www.IbISwORLd.COM.Au Pharmacies in Australia June 2012 8
Industry Performance
Industry Outlookcontinued
National Health Amendment (PBS) Bill 2012 is currently before the Federal Parliament. If enacted, this will result in PBS pricing based on ex-manufacturer prices as opposed to the approved price to pharmacy.
Any further falls in PBS expenditure growth rates will have implications for participants involved in dispensing PBS prescriptions. PBS expenditure may also be affected by key patent expiries that are
due to occur over the years through 2014-15, with a record number of patent expiries expected for 2012. These products will be replaced by lower cost, generic products. This will translate into strong growth within the generics market, with growth also aided by the ongoing PBS reforms. The industry may have to contend with the effects of the carbon tax, including via higher wholesaler, rental and electricity costs.
Competition heats up The competitive landscape of the industry will change as it becomes increasingly polarised between pharmacies offering full service and health advice, and discount pharmacies competing on the basis of price. In the case of the latter, the entry of discount pharmacies has been credited with creating an extremely cost-competitive environment. At the same time, external threats will mount as supermarkets expand their share of the health and beauty market. The recurring issue of deregulation of pharmacy ownership to allow supermarkets to enter the pharmacy arena was raised yet again in early 2012. Despite calls for such moves, deregulation is not expected to occur over the next five years.
Pharmacies are expected to contend with declining margins over the next five years, caused by a combination of the fallout effects associated with PBS price disclosure and the expected growth in competitive pressure. Regulatory changes (including generic drug pricing changes and PBS reforms) and rising input costs will also exert downward pressure on industry margins. Further cuts to trading terms or higher fees charged by upstream wholesalers in the wake of Pfizer’s introduction of a exclusive distribution model may also affect margins; both Sigma and API have again cut their discounts, having already reduced their trading terms in 2011. Moreover, as at mid-2012, teething problems are still apparent with the change of model from the pharmacy point of view, with pharmacies now having to purchase all of their Pfizer PBS medicines via the
new direct supply model, which does not offer the same delivery service options as the traditional wholesalers.
Amendments to the Pharmacy Location Rules came into effect in October 2011. In theory these are designed to make it easier and less expensive to set up a new pharmacy, providing it is essentially part of a facility such as a shopping centre, large medical centre or private hospital, although at this stage there are still some issues associated with the new rules. Over the five years through 2016-17, it is estimated that an additional 295 community pharmacies will be added to the industry base, boosted in part by moves by the likes of Priceline Pharmacy and Terry White Chemists to expand their franchise base. The latter alone wants to add 135 pharmacies over the next decade.
The competitive landscape may change as upstream wholesalers refocus their operations on this particular dimension of the pharmaceutical marketplace. For example, having divested its manufacturing arm in early 2011, Sigma is now seeking to boost its front-of-store sales for the Amcal, Amcal Max and Guardian Pharmacy banner groups with a particular focus on the end consumer.
Generic drug pricing changes, PBS reforms and intensifying competition will squeeze profit margins
www.IbISwORLd.COM.Au Pharmacies in Australia June 2012 9
Industry Performance
The need for differentiation
To combat growing competitive pressures, pharmacies may seek to differentiate themselves from low-cost competitors on the basis of the value added services they provide, such as professional healthcare advice. This service in particular is considered unique to pharmacies and as such will be emphasised as a basis of competitive differentiation from rival supermarkets or other OTC retailers. Pharmacies will also seek operating efficiencies to compensate for falling margins. These developments will result in further moves away from the traditional pharmacy business model, which is heavily dependent on the dispensing of
prescription drugs. Following a move away from compounding in the past five years, compounding may gradually re-emerge as an area of specialised pharmacy practice and could provide another means of differentiation.
Continued developments in technology, including increasing use of the internet (e.g. the use of national electronic prescription platforms, e-commerce and the development of net markets) and social media platforms, will gradually change the profile of the industry. Overall, the industry is expected to remain in the mature phase of its life cycle over the five years through 2016-17.
www.IbISwORLd.COM.Au Pharmacies in Australia June 2012 10
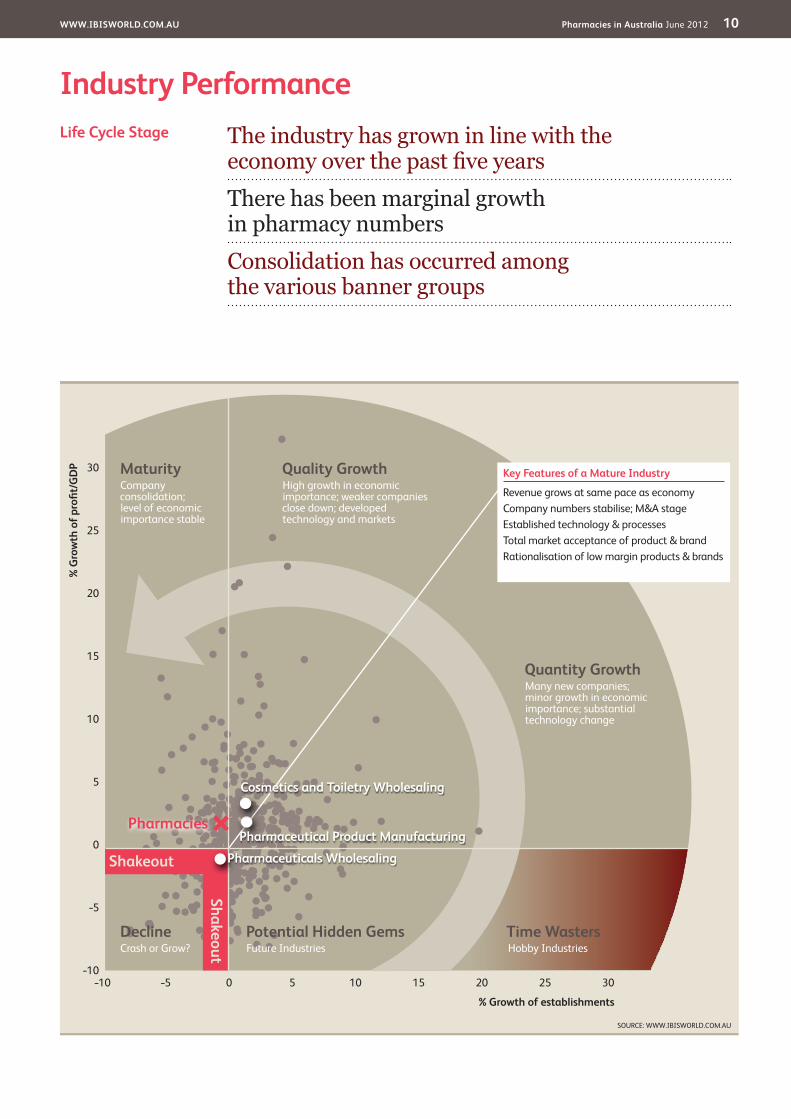
Industry PerformanceThe industry has grown in line with the economy over the past five years
There has been marginal growth in pharmacy numbers
Consolidation has occurred among the various banner groups
Life Cycle Stage
SOURCE: WWW.IBISWORLD.COM.AU
30
25
20
15
10
5
0
–5
–10–10 100 20–5 155 25 30
% G
row
th o
f pro
fi t/G
dP
% Growth of establishments
declineCrash or Grow?
Potential Hidden GemsFuture Industries
Quality GrowthHigh growth in economic importance; weaker companies close down; developed technology and markets
Time wastersHobby Industries
MaturityCompany consolidation;level of economic importance stable
Shakeout
Shakeout
Quantity GrowthMany new companies; minor growth in economic importance; substantial technology change
Key Features of a Mature Industry
Revenue grows at same pace as economyCompany numbers stabilise; M&A stageEstablished technology & processesTotal market acceptance of product & brandRationalisation of low margin products & brands
Pharmaceutical Product Manufacturing
Pharmaceuticals wholesaling
Cosmetics and Toiletry wholesaling
Pharmacies
www.IbISwORLd.COM.Au Pharmacies in Australia June 2012 11
Industry Performance
Industry Life Cycle The industry enjoyed moderate growth rates over the past five years. Helping to drive this growth has been the introduction of new products, including new pharmaceutical drugs, as well as cosmetics and toiletries products, sold as front-of-store items. A continued increase in the number of PBS products dispensed has also meant continued volume growth in terms of dispensary sales.
New technology and systems have also helped the industry achieve moderate growth. For example, an increasing reliance on pre-packaged medicines is having implications for the industry in general and the time use of pharmacists in particular. At the same time, an increasing reliance on e-commerce is changing the face of the supply chain and ultimately of the industry itself. The growing use of the Internet is also serving to change the profile of the pharmaceutical retailing industry as industry participants and external competitors alike move online. An increasing number of industry participants have established complementary online operations while others are now looking to social media platforms as another means of boosting sales.
The changing demographic profile of the Australian population is boosting demand for various products retailed by
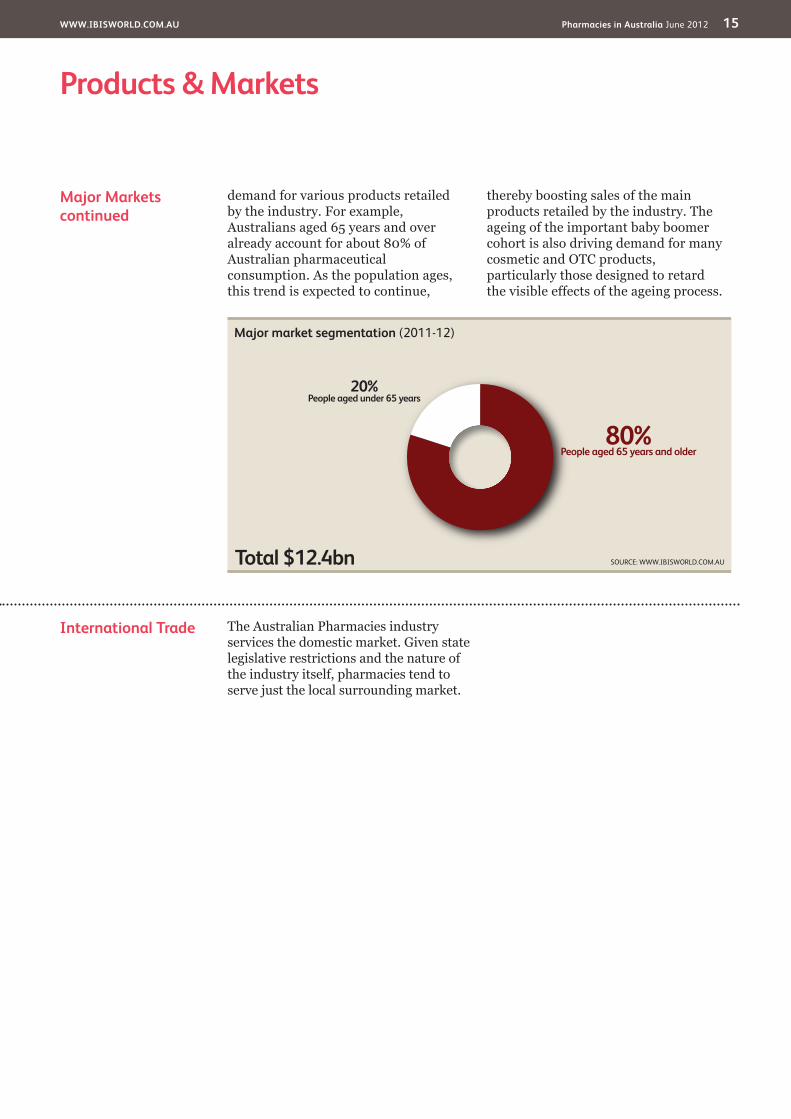
the industry. For example, Australians aged 65 years and above already account for approximately 80% of Australian pharmaceutical consumption. As the population continues to age, this trend is expected to continue, thereby boosting sales of the main product segment retailed by the industry. The ageing of the important baby boomer cohort is also driving demand for many cosmetic and OTC products, particularly those designed to retard the visible effects of the ageing process.
At the same time however, industry growth rates have been below that of the general economy as pharmacies continued to lose market share to external forces including supermarkets keen to expand their own health and beauty offerings. Ongoing changes to the PBS in line with government efforts to curb pharmaceutical expenditure levels have also cut into the industry’s revenue base. Following a bout of industry rationalisation in the early 1990s, pharmacy numbers have experienced just a slight increase over the past five years, despite several players introducing new shop formats in an attempt to arrest declining front-of-store sales. Thus, the industry is currently deemed to be in the mature phase of its current life cycle.
This industry is Mature

www.IbISwORLd.COM.Au Pharmacies in Australia June 2012 12
Products & Services There are two streams of pharmacy practice in Australia: clinical (or hospital) pharmacy and community pharmacy. According to the Australian Institute of Health and Welfare (Health expenditure Australia 2009-10. Health and welfare expenditure series no. 46), community pharmacies dispensed $11.7 billion worth of prescription pharmaceuticals in 2009-10, compared with $2.7 billion for public and private hospitals.
This report is concerned with community pharmacies, which are considered an integral part of Australia’s healthcare system. Community pharmacies provide a wide range of products and services, the most important of which is the dispensing of prescription medicines and pharmacy-only medicines (OTC drugs). According to legislation that dates back to the late 1800s, only pharmacies and hospitals are able to dispense prescription medicines. Since the start of the PBS in the 1950s (which today covers about 90% of prescription products dispensed), only pharmacies that have been granted the necessary regulatory approval can dispense PBS products. In addition, community pharmacies sell a variety of therapeutic substances and aids (including vitamins and minerals), baby
needs, beauty products, optical products, gift ware and film development services.
There are three main product categories in the industry. The largest is prescription medicines. By law, the sale of these medicines is restricted to pharmacies only and includes PBS subsidised prescriptions, unsubsidised PBS prescriptions and private prescriptions.
The industry also sells non-prescription medicines. These include products that are restricted to pharmacies but do not require a prescription, including products classified as Schedule 2 (pharmacy medicines) and Schedule 3 (pharmacist-only medicines). They also include self-medication products such as OTC, complementary and alternative medicines, including vitamins, minerals and herbal, aromatherapy and homeopathic products. Over the past decade, there has been a growing trend towards the production and use of complementary medicines.
The final category is general retail products, which includes baby products, bandaids, bandages, beauty products, cosmetics, perfumes, body care and hair care products, sun care products, general health items, film development and
KEy buyING INduSTRIES
Z9901 Consumers in Australia Households are the main market for pharmaceutical retailers.
KEy SELLING INduSTRIES
C2543 Pharmaceutical Product Manufacturing in Australia Medicinal and pharmaceutical manufacturers produce a range of drugs, medicinal chemicals and other pharmaceutical products for humans sold by pharmaceutical retailers.
C2546 Cosmetics, Perfume and Toiletries Manufacturing in Australia This industry manufactures various cosmetic and toiletry products sold by pharmacies.
F4791 Photographic Equipment wholesaling in Australia Wholesalers in this industry provide photographic equipment supplies sold as part of a front of store offering including digital prints.
F4797 Pharmaceuticals wholesaling in Australia Pharmaceutical wholesalers are a key supplier to pharmacies.
F4798 Cosmetics and Toiletry wholesaling in Australia Cosmetics and toiletry wholesalers supply a number of products to the industry.
Products & MarketsSupply Chain | Products & Services | demand determinants Major Markets | International Trade | business Locations
Supply Chain

www.IbISwORLd.COM.Au Pharmacies in Australia June 2012 13
Products & Markets
demanddeterminants
On a general basis, the demand for industry products is determined by socio-economic and demographic factors. These include general levels of disease rates (including new diseases such as heart disease and diabetes), the health of the population, government health policies, the price of pharmaceutical
products, doctors’ prescribing patterns and utilisation rates.
The age structure of the population is also an important determinant. In general, the older the population, the higher the level of demand for pharmaceutical and medicinal products. The 65 years and over age cohort already
Products & Servicescontinued
optical products. Within this segment, cosmetics and toiletries are estimated to account for about 5.0%, while baby care products are estimated to account for less than 2.0%.
As an indication of the importance of prescription medicines, Australian Institute of Health and Welfare data (Health expenditure Australia 2009-10. Health and welfare expenditure series no. 46) shows that during 2009-10, just under $10 billion was spent on pharmaceuticals for which benefits were paid, while total estimated expenditure on pharmaceuticals (excluding complementary and alternative medications and OTC medications without prescriptions) was $14.4 billion. Roughly $4.6 billion was spent on OTC medicines.
The actual sales mix varies with each pharmacy and is in part determined by its location (e.g. in a shopping centre, shopping strip or medical centre, in a city or rural area) and its size. For example,
pharmacies located in shopping strips or medical centres tend to derive a greater proportion of their sales revenue from the more traditional activities of drug dispensation, while pharmacies located in shopping centres have a greater emphasis on front-of-store retail sales. Pharmacies located in rural areas may have a more balanced sales mix. The mix also varies in line with the business model being pursued by the pharmacy and on the basis on which it has chosen to compete.
Over the past few decades, there has been a change in the product profile of the general pharmacy. While dispensary sales still account for the lion’s share of a pharmacy’s revenue base, pharmacies have begun to refocus attention on their front-of-store operations in an attempt to counteract the strong and consistent trend away from OTC sales. This has resulted in the introduction of new business practices, supported by new marketing and advertising strategies.
Products and services segmentation (2011-12)
Total $12.4bn
65%Prescription medicines
20%General retail products
15%Non-prescription medicines
SOURCE: WWW.IBISWORLD.COM.AU

www.IbISwORLd.COM.Au Pharmacies in Australia June 2012 14
Products & Markets
Major Markets Households are the predominant market for the nation’s pharmaceutical retailers. According to data from the Australian Institute of Health and Welfare (Health expenditure Australia 2009-10. Health and welfare expenditure series no. 46), Australian consumers spent $1.5 billion on PBS pharmaceuticals in 2009-10 and
over $6.0 billion on other medications (including OTC medicines and private prescriptions) and medical non-durables such as bandages and bandaids.
A key age cohort within this market is people aged 65 years and over. The changing demographic profile of the Australian population is boosting
demanddeterminantscontinued
account for over 80% of Australia’s pharmaceutical consumption, with this proportion expected to further increase. The ageing population is also increasing the demand for preventative drugs and medications that enable patients to take a more active role in sustaining their wellbeing. Thus, the ageing population phenomenon is a key growth driver.
New product introductions can also help stimulate demand. Advances in drug formulation and preparation allow for the development of new products that are more effective or have reduced side effects, thereby increasing the demand for products sold by the industry.
The price of pharmaceutical products also plays a role, in particular the distinction between patented or branded products and their cheaper generic counterparts. A gradual increase in the availability of cheaper generic items has made the industry’s products more accessible to a wider income earning spectrum and therefore increased demand. This trend is expected to continue over the next five years, in line with government policies designed to increase generic substitution rates which include the ongoing PBS changes.
Thus, government health policies will also influence demand as these in turn affect factors such as doctors’ prescribing habits, pharmaceutical availability and the price of pharmaceutical products. Of relevance within the Australian Pharmacies industry is the existence of the Pharmaceutical Benefits Scheme (PBS), which is a Commonwealth Government scheme for subsidising the cost of pharmaceuticals to the Australian community. Under the PBS, capped
co-payments and safety nets limit the cost of pharmaceuticals to consumers, with the government paying the remainder. In recent years, the scheme has increasingly focused on providing benefits to less well-off consumers. In 2010-11, the total cost of the PBS was $8.87 billion of which the Government financed 83.7%.
Consumer preferences also play a role in influencing demand patterns. Consumer preferences regarding the treatment of conditions and diseases have gradually shifted toward alternative medicines. The greater acceptance of Chinese medicine, naturopathy and other alternatives – such as changes in diet, exercise and meditation – affect the types of products demanded. At the same time, the continued conversion of various prescription drugs to over-the-counter status is also having a bearing on product profile and consumer shopping habits as some of these products can now be purchased at non-pharmacy stores.
Changes in real household disposable income will also affect the level of demand for certain products. Although medication purchases are dependent on the frequency of illnesses, some medications can be sensitive to the levels of household income, especially in the case of non-critical drugs and herbal products. Sales of other front-of-store items such as cosmetics and personal care items can also be subject to changing expenditure patterns.
The rise in external competition levels from other retailers, such as supermarkets and mail order and internet suppliers, can curb the level of demand for pharmacies.
www.IbISwORLd.COM.Au Pharmacies in Australia June 2012 15
Products & Markets
International Trade The Australian Pharmacies industry services the domestic market. Given state legislative restrictions and the nature of the industry itself, pharmacies tend to serve just the local surrounding market.
Major Marketscontinued
demand for various products retailed by the industry. For example, Australians aged 65 years and over already account for about 80% of Australian pharmaceutical consumption. As the population ages, this trend is expected to continue,
thereby boosting sales of the main products retailed by the industry. The ageing of the important baby boomer cohort is also driving demand for many cosmetic and OTC products, particularly those designed to retard the visible effects of the ageing process.
Major market segmentation (2011-12)
Total $12.4bn
80%People aged 65 years and older
20%People aged under 65 years
SOURCE: WWW.IBISWORLD.COM.AU

www.IbISwORLd.COM.Au Pharmacies in Australia June 2012 16
Products & Markets
SOURCE: WWW.IBISWORLD.COM.AU
TAS2.7
wA10.2
QLd20.4
VIC23.4
NSw33.4
NT0.6
SA8.1
ACT1.3
Establishments (%)
Cold Zone (<10) <25 <50 Hot Zone (<100) Not applicable
business Locations 2011-12

www.IbISwORLd.COM.Au Pharmacies in Australia June 2012 17
Products & Markets
business Locations The geographic distribution of the Pharmacies industry reflects the nation’s economic, social and demographic breakdown; as at June 2011, the three eastern seaboard states accounted for 77% of total approved pharmacy and friendly society numbers. This same proportion was evident five years earlier and is estimated to hold in 2011-12.
Data provided by Medicare Australia (Pharmacies and Friendly Societies, 30 June 2006 to 2011, RPC015) shows that over the five years through 2010-11, an additional 267 pharmacies were established. Of this, 99 were located in Queensland, with 56 setting up shop in Victoria. In contrast, just 36 were established in New South Wales.
In 2008-09, just over 80% of pharmacies were located in urban areas. Although the number of pharmacies in rural areas in some states has increased in the past five years, stronger growth has occurred in the urban areas, particularly with the rollout of new franchised pharmacies. In all states the average number of people per urban pharmacy is
far less than the number of people per rural pharmacy.
Friendly societies are often located in rural and regional areas, sometimes providing benefits and services to the surrounding community, which might not receive them otherwise. There are also regulations in place to limit the number and location of pharmacies.
Perc
enta
ge
40
0
10
20
30
WA
ACT
NSW N
T
QLD SA TA
S
VIC
EstablishmentsPopulation
Distribution of establishments vs. population
SOURCE: WWW.IBISWORLD.COM.AU
www.IbISwORLd.COM.Au Pharmacies in Australia June 2012 18
Cost Structure benchmarks
The profitability of an individual pharmacy can vary in line with the sales mix between prescription medicines (which have a low margin) and front-of-store sales (which have a higher margin but also attract greater competition). In the case of the former, prescription medicines have prices or margins that are set by the government via the PBS and via Community Pharmacy Agreements.
In recent years, pharmacy
profitability has been affected by rising competitive pressures and tight (if not falling) margins; this is certainly the case with dispensary gross profit margins, which have been adversely affected by the introduction of higher cost drugs as well as by the ongoing PBS reforms. Recent moves by upstream wholesalers to cut their discounts or credit terms offered to pharmacies (also in view of the ongoing PBS reforms)
Key Success Factors Superior financial management and debt managementCompanies should ensure that effective cash flow management controls are in place.
Production of goods currently favoured by the marketThe product mix needs to be appropriate for the target market; the products stocked are perceived as offering value for money.
Experienced work forceThe quality of staff needs to be high to ensure quality customer service.
Attractive product presentationThe store layout and display of stock
must encourage customers to purchase and reinforce the company image.
Proximity to key marketsThe store needs to be located where there is a high volume of passing traffic and preferably near a medical practitioner or a medical centre.
Membership of joint marketing or distribution operationsA key success factor for companies in this industry is having an association or affiliation with a buying group or chain.
Ability to control stock on handCompanies need to ensure adequate stock controls are in place in order to reduce inventory costs and increase stock turns.
Market Share Concentration
The industry is highly fragmented, primarily as a result of state and territory legislation that restricts pharmacy ownership; only qualified pharmacists (and not incorporated entities) can own pharmacies. In addition, the number of pharmacies that can be owned by a pharmacist is generally limited. Even the large pharmaceutical wholesalers that own the retail banners under which roughly one-third of all pharmacies trade do not own the pharmacies themselves. Thus in one sense, the industry tends to be dominated by individual operators.
In view of the changing competitive environment, several pharmacies have
chosen to be part of banner groups, which are essentially marketing groups offering branded advertising and promotional support services. Alternatively, pharmacies may be part of a buying group in a move designed to obtain higher percentage discounts for high-volume purchases. Even a number of independent pharmacies have aligned forces and are part of buying groups; for example, IPAG (Independent Pharmacists of Australia Group) and Pharmacy Alliance have 800 members between them. As it stands today, truly independent pharmacies account for just 20% of pharmacy numbers.
Competitive LandscapeMarket Share Concentration | Key Success Factors | Cost Structure benchmarks basis of Competition | barriers to Entry | Industry Globalisation
Level Concentration in this industry is Low
IBISWorld identifies 250 Key Success Factors for a business. The most important for this industry are:

www.IbISwORLd.COM.Au Pharmacies in Australia June 2012 19
Competitive Landscape
basis of Competition To some degree the nature of the industry’s operating and regulatory environment limits competition within the Australian pharmacies industry. Under legislation, which dates back to the late 1800s, only pharmacies and hospitals are able to dispense prescription medicines. In addition, since the start of the Pharmaceutical Benefits Scheme (PBS), which commenced in the 1950s and today covers about 80% of prescription products dispensed (which covers 760 medicines available in 1,960 forms and 3,950 brands), it is only those pharmacies that have been granted the necessary
regulatory approval that can compete in this market. In addition, there are restrictions on where dispensing pharmacies may locate for PBS purposes (Pharmacy Location Rules).
Moreover, pharmacies are cushioned from competition on certain product lines. Chemist-only (CO) refers to the practice of manufacturers or wholesalers that supply branded non-scheduled pharmaceutical and other health and beauty lines only through pharmacies. This has served to partially protect pharmacies from external competition as supermarkets and mass merchandisers
Cost Structure benchmarkscontinued
have also had an adverse effect.As is typical of most wholesale and
retail industries, purchases are the largest expense for the industry, representing approximately two-thirds of industry sales. The next largest individual expense is wages and salaries (including the proprietor’s), which are estimated to account for about 19% of revenue. This in
part reflects the high skill base of the industry’s labour force.
Rental costs are also a significant (and increasing) expense, particularly for pharmacies located in prime locations and in large shopping malls who tend to pay considerably higher rents relative to those located in rural areas or in street strip locations with lower footfalls.
Sector vs. Industry Costs
■ Profi t■ Rent■ utilities■ depreciation■ Other■ wages■ Purchases
Average costs of all industries in
sector (2011-12)Industry costs
(2011-12)
0
20
40
60
Perc
enta
ge o
f rev
enue
80
100 4.8
71.2
10.57.71.2 0.93.7
2.5
67.0
19.0
4.5 1.06.0
SOURCE: WWW.IBISWORLD.COM.AU
Level & Trend Competition in this industry is Medium and the trend is Increasing

www.IbISwORLd.COM.Au Pharmacies in Australia June 2012 20
Competitive Landscape
basis of Competitioncontinued
have been unable to break into the dispensing end of the pharmaceutical market. In addition under regulatory legislation, ownership of pharmacies is limited to pharmacists who in turn are only allowed to own a limited number of pharmacies.
Much of the income earned by the pharmacies is derived from government-funded remuneration and the fixed retail prices of products dispensed under the PBS. This means that there is limited competition within this particular product segment, which is estimated to account for as much as 70% of sales in some instances, depending on the business model employed.
Thus, the price competition that does occur between pharmacies predominantly revolves around non-prescription items and front-of-store products such as cosmetics, toiletries, baby needs and film development services. The exceptions are the pharmacy discounters which include the likes of Chemist Warehouse (which now has in excess of 200 large store discount operations as well as an online operation), United Discount Chemists and Discount Drug Stores who are now also competing on the basis of lower prescription price medicines.
Pharmacies can also compete on the basis of service, advice, location, product range and quality. Given their almost homogenous nature, pharmacies can either choose to compete on the basis of value added service where they provide a high level of service, or they can follow the discount model and provide fewer services while discounting prices.
In recent years, traditional community pharmacies have faced a growing degree of competition from both within and outside of the industry. Internal competition has come from the advent of low-price warehouse style pharmacies. There has also been the gradual growth in the number of online and mail order pharmacies (including the likes of ePharmacy, Pharmacy Online, Chemist
Direct, Chemist Works and Ezichem Online Chemists). These online pharmacies are gradually becoming an increasing source of external competition.
Pharmacies have also been under growing pressure from external sources including supermarkets and other non-pharmacy outlets (such as health and beauty niche retailers and discount department stores), which have been increasing their product range to encompass products previously stocked by pharmacies only, including various OTC products. For example, supermarkets tend to stock substitutes for the most widely used non-scheduled chemist-only products. In comparison to supermarkets, pharmacies tend to offer a higher level of service and a wider range of brands while supermarkets tend to compete on price and convenience. A significant development was the 2002 decision by mass merchandiser Priceline (now owned by pharmaceutical wholesaler API) to enter the pharmacy segment with the opening of its first pharmacy in August 2002. One decade later, it now operates 1800 plus pharmacies (although these are actually owned by individual pharmacists as opposed to Priceline-API). Supermarket chain Woolworths has also tried to break into the industry on a number of occasions with plans to operate pharmacies within its supermarkets, although to date it has been unsuccessful.
In view of the changing competitive environment, several pharmacies have chosen to be part of banner groups, which are essentially marketing groups offering branded advertising and promotional support services. In turn, a number of the banner groups (including the likes of AMCAL, Guardian, Chemmart and Soul Pattinson) are operated by the three full-line/CSO pharmaceutical wholesalers that dominate the pharmaceutical industry (namely Symbion Healthcare-Zuellig, Australian Pharmaceutical Industries and

www.IbISwORLd.COM.Au Pharmacies in Australia June 2012 21
Competitive Landscape
Industry Globalisation
Reflecting the fact that the overwhelming majority of stores and pharmacies are Australian owned, this industry has a low level of globalisation. However, two of the three
pharmaceutical wholesalers that operate the main banner groups that account for roughly one-third of all pharmacy numbers have some degree of international operations.
barriers to Entry The major barriers to entry are centred on the high level of regulation surrounding the retail pharmacy sector, in particular, ownership laws, which limit the ownership of pharmacies to registered pharmacists. Pharmacy Location Rules also control the location of approved pharmacies. Despite mounting pressures for the deregulation of the retail pharmaceutical market, these restrictions continue to be retained.
On the other hand ownership restrictions have also prevented the growth of major players or chains capable of dominating the market, which can in many cases, prove to be a substantial barrier. Though saying that, a number of pharmacies have elected to become part of banner groups operated by upstream pharmaceutical wholesalers or in some instances franchised operations as in the case of Priceline Pharmacy or Terry White Chemists. Over the past decade upstream wholesalers have played with a number of retail models essentially
designed to strengthen their position within the retail pharmacy segment. There has also been the entry of other new format players including large scale discount pharmacies which is again serving to redefine the competitive landscape of the industry.
At the same time however recent years have seen the continued entry of new pharmacies. In 2010-11 there were 5,218 community pharmacies, up from 4,951 five years earlier. This suggests that entry barriers are not insurmountable.
basis of Competitioncontinued
Sigma). Alternatively, pharmacies may be part of a buying or retail support group (such as Pharmacy Best Buys and Pharmacy Choice) in a move designed to obtain higher percentage discounts for high volume purchases although many of these are also run by the same upstream wholesalers. Even independent pharmacies can be members of groups
such as The Independent Pharmacists of Australia Group (IPAG) which has 400 pharmacy members, the Pharmacy Alliance group with 420 members, SmarterPharm (80 pharmacies) and United Discount Chemists (42 members). As at the start of 2012 it is estimated that less than 20% of all pharmacies can be considered as true independents.
barriers to entry checklist Level
Competition MediumConcentration LowLife cycle stage MatureCapital intensity LowTechnology change MediumRegulation and policy HeavyIndustry assistance Medium
SOURCE: WWW.IBISWORLD.COM.AU
Level & Trend Barriers to Entry in this industry are High and Steady
Level & Trend Globalisation in this industry is Low and the trend is Steady
www.IbISwORLd.COM.Au Pharmacies in Australia June 2012 22
Player Performance Established as a NSW-based buying group in 1910, Australian Pharmaceutical Industries Limited (API) is now a health and beauty company with three core business units: pharmacy distribution, consumer brands (healthcare product manufacturing in New Zealand) and retailing. In 2010-11, API generated revenue of $3.4 billion. This was up from $1.9 billion nine years earlier, reflecting organic growth and several acquisitions. The company’s retailing operations involve the sale of health, beauty and lifestyle products within the Australian retail industries and its retail franchising arrangements. In 2010-11, the retailing operations generated revenue of $717 million, representing 21% of company revenue.
Although API has traditionally been predominantly involved in upstream wholesaling activities, it has also sought to develop its service offering at the retail level, albeit with tempered success. Of interest was its $112 million acquisition of health, beauty and lifestyle retailer New Price Retail in October 2004, which included the Priceline chain, the Price Attack franchise and the House franchise. However, API has since divested a number of these retail businesses. In July 2007, it sold the House retail chain to Global Retail Brands for $8.5 million, followed by the November 2007 sale of its Price Attack business, which was purchased by one of Price Attack’s major franchisees. It has also divested a number of banner groups, including API Health Care, Value Plus, Green Spot, Thrift Chemists and Chemworld.
Today, the company’s its interests in the Pharmacies industry are limited to its operation of the Priceline Pharmacy
business and the Soul Pattinson and Pharmacist Advice banner groups. In addition, API provides services to independent pharmacies through its API Member program and has launched a premium business-to-business brand for independent pharmacists.
In April 2012, API announced plans to eventually derive as much as half its revenue base from retail. The Priceline operations currently account for roughly 30% of company revenue.
Priceline The company’s latest foray into the Australian pharmacies market occurred through its purchase of the Priceline brand and the establishment of Priceline Pharmacies, which it launched in September 2002. Each store is estimated to generate annual revenue of $4.5 million and stocks about 10,000 products, including more than 500 brands. The business model for Priceline Pharmacies revolves around a lower reliance on dispensary items and a greater emphasis on its mid-mass market health and beauty offerings.
In June 2008, API launched a new brand plan for Priceline, which involved merchandise, store environment, visual identity and training as it attempted to reposition the brand. Having relaunched Priceline’s Clubcard loyalty program in November 2008, as at mid-2012 there were roughly 3.7 million members registered. Clubcard members are estimated to account for over 40% of store sales (including dispensary).
API opened 24 new stores in 2009-10 (including 21 franchises), and 18 new franchise stores (including three conversions) and six company-owned
Major CompaniesAustralian Pharmaceutical Industries Limited | Sigma Pharmaceuticals LimitedZuellig Healthcare Holdings Australia Pty Limited | Other
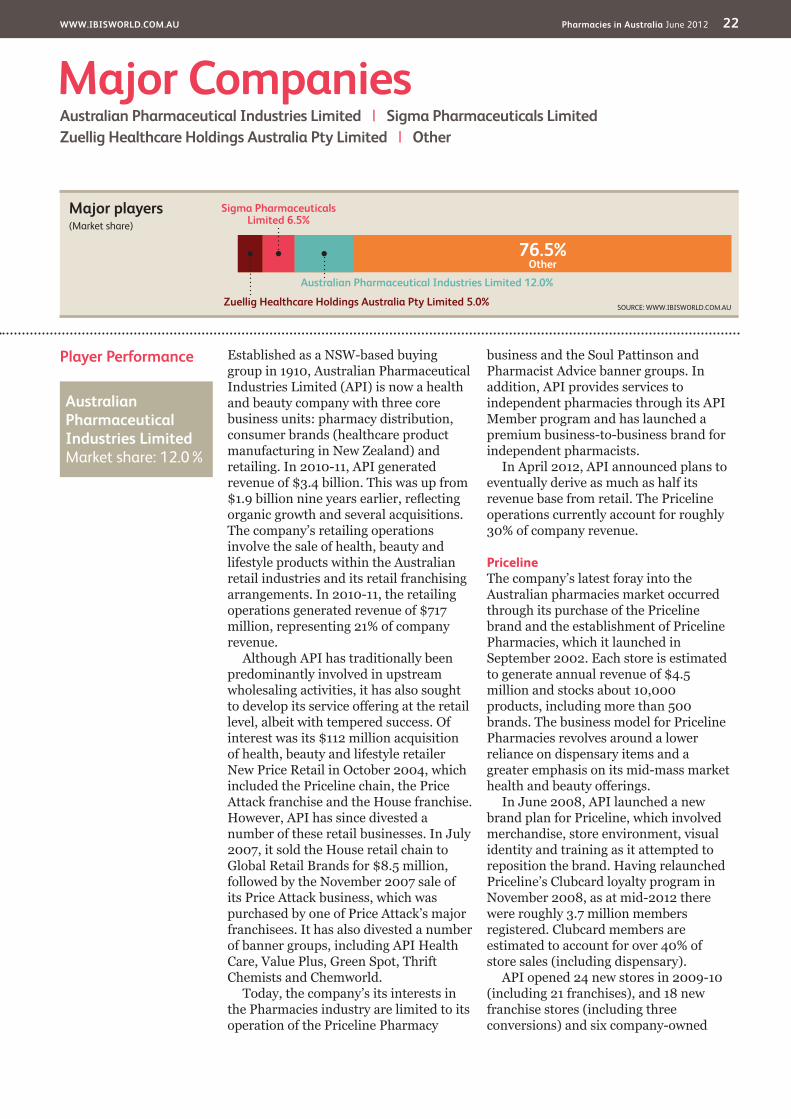
Major players(Market share)
76.5%Other
Australian Pharmaceutical Industries Limited 12.0%
Sigma Pharmaceuticals Limited 6.5%
Zuellig Healthcare Holdings Australia Pty Limited 5.0% SOURCE: WWW.IBISWORLD.COM.AU
Australian Pharmaceutical Industries Limited Market share: 12.0%

www.IbISwORLd.COM.Au Pharmacies in Australia June 2012 23
Major Companies
Player Performancecontinued
stores in 2010-11. However, a number of stores were closed during the year, meaning that the total number of stores (at 327) was essentially unchanged on the previous year. API is in the process of converting its Priceline corporate stores into Priceline Pharmacy franchises as it seeks to transform its portfolio from a predominantly corporate store portfolio to one that is dominated by franchise stores, in line with its strategic move away from being a classic retailer. However, recent economic and retail conditions have meant that the company has had to scale back former ambitions in terms of store rollouts. While there had been talk of having at least 400 Priceline franchises across the country by 2014 (as opposed to an earlier target of 2010), any reference to a time frame has now been dropped. As at April 2012, API had 332 Priceline stores, of which 185 were Priceline Pharmacies.
Soul Pattinson and Pharmacist Advice API operates under the retail banners of Soul Pattinson and Pharmacist Advice. There are currently 70 members in the Pharmacist Advice group.
Established in 1872, Soul Pattinson Chemists was acquired in November 1999 from Washington H Soul Pattinson Ltd. Along with its pharmaceutical wholesaling and manufacturing operations, the acquisition of the 260 franchises under the banner group significantly strengthened API’s position in the retail market, allowing it to obtain critical mass. Prior to this acquisition, the Soul Pattinson retail pharmacy group was a major participant in the industry in its own right. In mid-1999, the company had 16 company-owned stores and 260 franchised stores that operated under the
Soul Pattinson banner. There are estimated to be 90 members in this banner group. In 2007, the Soul Pattinson brand was refreshed with a new image and a broader range of merchandise and services.
Financial performanceIn 2009-10 and 2010-11, API contended with a difficult retail trading environment, which was characterised by restrained consumer expenditure and intensifying competitive pressures. In 2009-10, total retail sales were 4.7% higher than the previous year, although comparable store sales were just 1.4% higher due to the mixed retail environment. Comparable store sales were just 1.4% higher in 2010-11, while total sales growth (excluding dispensary) was a meagre 2.3%. Retail sales for the year totalled $717 million, up from $704 million in the previous year and $680 million three years earlier.
In response to changing market conditions (notably Pfizer’s decision to deal directly with pharmacies), API introduced reduced trading terms for pharmacists, which have been in effect since 1 February 2011.
According to API, one indirect outcome of the ongoing PBS reforms will be an increased interest in Priceline franchises as pharmacists seek to diversify their customer offerings in the face of lower dispensary incomes. The company is also expecting growth in its two banner groups as independent pharmacies also seek to diversify their revenue streams. In the next few years, API will continue to focus on growing its Priceline Pharmacy operations, including by launching a Priceline online store in June 2012.
www.IbISwORLd.COM.Au Pharmacies in Australia June 2012 24
Major Companies
Player Performance Established in Victoria in 1912, Sigma Pharmaceuticals Limited has undergone several changes over its one hundred year history. It relinquished its cooperative status in 1996 and has been listed on the ASX as since 2005. In 2011-12, Sigma is expected to generate sales revenue of $2.85 billion and a net profit (from continuing operations) of $50.3 million. The company divested its manufacturing arm in early 2011 and is now focusing purely on its full-line wholesaling and retail pharmacy operations. It has announced a renewed focus on its retail operations with a particular focus on the end consumer and front-of-shop activities. Its new retail strategy will entail multi-channel elements, which will encompass e-commerce and social media platforms.
Through its Healthcare Banner Management business (part of Sigma Healthcare), Sigma provides retail support services to its banner groups and independent pharmacists. Sigma is estimated to have 470 Amcal, Amcal Max and Guardian member pharmacies, though it owns the buying groups but not the individual pharmacies that operate under its banners.
Over the years, Sigma has tried different strategies for its retail pharmacy banners including the launch of the Embrace program in October 2006. This program involved a three-year contract that bound pharmacies to purchasing private prescription products, OTC drugs and generic drugs from Sigma’s wholesale segment and offered pharmacies preferential pricing, products and services (plus financing) in return for pharmacies giving preference to Sigma’s products. By November 2007, the company had almost 1,450 members (about one-third of all pharmacies), although little more is known with regards to the program. An alternative compliant retail model was launched in 2009 with its Pharmacy Advance retail program for independent pharmacies.
It has also launched a retail-focused pharmacy brand: Amcal Max. The pilot store was opened in Queensland in
August 2005 and two stores opened in Melbourne in late 2005. Offering a broad range of consumer products, including non-prescription medicines, health and beauty products and lifestyle products, Amcal Max stores were expected to earn as much as 50% of their revenue from front-of-store sales, with the remainder derived from the more traditional activity of dispensing prescriptions. However, as at early 2011, Sigma still had only 24 Amcal Max franchisees.
During 2007 and 2008, Sigma sought to grow its banner member base via strategic alliances with industry participants geared at creating value for its banner members. There was also a focus on providing better support and commitment.
During 2011-12, Sigma has invested in growing and strengthening its retail brands and private-label offering. To this end, the company has invested in new support programs offered to both its banner members and independent pharmacies, including pharmacy health management services. It has also allocated additional resources to growing its Amcal Max/Amcal and Guardian brands.
Like rival API, Sigma has implemented changes to customer trading terms for pharmacies in an attempt to offset the effect of Pfizer’s changed distribution strategy and ongoing PBS reforms. It also adjusted its customer discounts offered to pharmacies in the wake of the PBS price cuts that came into effect on 1 April 2012.
Guardian Guardian Family Care Chemists Australia Ltd currently has about 160 members, after losing a number in the past few years. It was acquired by Sigma in March 1997 and was merged with Sigma’s other regional brand groups. It currently has members in all states and in New Zealand.
AmcalAllied Master Chemists of Australia Ltd (Amcal) was established in 1937. Prior to 1998, it was Australia’s largest independent retail pharmacy group. In October 1997, Sigma signed an exclusive
Sigma Pharmaceuticals Limited Market share: 6.5%

www.IbISwORLd.COM.Au Pharmacies in Australia June 2012 25
Major Companies
Player Performancecontinued
five-year distribution agreement with Amcal, before acquiring the 500-strong independent pharmacy group in October 1998. Rival wholesaler Fauldings initially put in a bid of $34 million, but later withdrew the offer on the grounds that the value of Amcal did not justify proceeding with the bid. Sigma eventually gained control of the Amcal banner for $29 million.
In the past few years, Amcal has
relaunched itself with a new image, logo and pharmacy layout. As with the Guardian banner group, Amcal offers a retail loyalty program that currently has over 300,000 members. It also has the largest private-label range in pharmacy with over 230 products generating sales in excess of $18 million per annum. Amcal is estimated to currently have just over 300 members.
Player Performance One of the few large-scale international players in the industry is the Zuellig Group, which is one of world’s largest privately owned pharmaceutical wholesalers and distributors. It owns Australia-based Symbion Pharmacy Services. Established in 2005, Symbion was sold to Zuellig Pharma for $505 million in October 2008. Switzerland-owned and headquartered in Hong Kong, Zuellig Pharma has operations in 119 countries and employs more than 10,000 people. Zuellig represents over 125 multinational pharmaceutical manufacturers, has 250,000 customers and generates annual revenue of about US$12 billion. In 2011, Zuellig Healthcare Holdings Australia Pty Limited generated net profit after tax of $33.5 million on revenue of $3.7 billion. In October 2011, it was reported that Symbion was to rebrand its corporate image with a focus on the name Symbion (as opposed to Symbion Pharmacy Services). This reflects its strategy to diversify operations.
ChemmartSymbion operates in the industry through its Chemmart banner group. With approximately 220 members, Chemmart Chemists is a community-style pharmacy. In the past few years, Chemmart Extra has opened, which is larger retail pharmacies offering a wider product range and more competitive prices. In 2006-07, Symbion commenced the rollout of a new operating format for its Chemmart pharmacies – a direct-
dispensing pharmacy, which offers direct contact between the pharmacist and the customer. Annual revenue for the Chemmart retail chain is approximately $750 million.
Terry WhiteSymbion also owns the Terry White Chemists brand, with the Terry White franchise managed under license under the umbrella of Terry White Management (TWM) Pty Ltd, run by the original founder (Terry White) and six pharmacists.
Established in 1959 (and as a franchise company in 1954), there were 165 franchisees as at June 2011, up from 100 in 2002. These franchisees were present in all states and territories except the Northern Territory. In 2010-11, operating revenue for the Terry White group totalled $43.3 million, up 58% on the previous year. However, like-for-like store growth on a nationwide basis was a more subdued 2.8%. According to Terry White Chemists, the average Terry White pharmacy has a sales split of 55% prescription medicines, 23% non-prescription medicines and 22% general retail. Its goal is to establish the franchise as a leading national pharmacy brand. Within a decade, it plans to have 300 Terry White pharmacies in operation.
In 1998, the group of then-80 Terry White stores was sold to pharmaceutical company FH Fauldings, which was purchased by Mayne Group in 2001. Following Mayne’s split in 2004, the
Zuellig Healthcare Holdings Australia Pty Limited Market share: 5.0% Industry brand Names Chemmart Terry White Chemists
www.IbISwORLd.COM.Au Pharmacies in Australia June 2012 26
Major Companies
Other Companies The industry is typically characterised by small owner-operator firms primarily because of legislation regarding the ownership of registered pharmacies. Individual pharmacists are estimated to own over half of Australia’s pharmacies with the bulk of the remainder owned by partner proprietors. This means that the industry is highly fragmented with no one corporate entity dominating the industry.
The closest things to a large entity that exists within the industry are the various banner groups operated by the three full-line wholesalers API, Sigma and Symbion/Zuellig. The relationship between the major pharmaceutical wholesalers and the downstream retail pharmacies is complex and interdependent. Not only do the wholesalers supply a considerable proportion of the pharmaceutical products dispensed or sold by the pharmacy, but they can also provide guarantee arrangements, free services for the buying and selling of pharmacies, and pharmacy refurbishments. The existence of these banner groups means that in the public eye, pharmacies are not necessarily being operated by individual pharmacy owners given the common imaging, branding and promotion of pharmacies within a banner group.
One exception to the ownership rules are friendly society dispensaries. Mutual organisations where all the assets are owned by the members – friendly society dispensaries – were first established in Australia in the 1840s.
One such entity is National Pharmacies, which celebrated its centenary in 2011.
Established as the trading name of the Friendly Society Medical Association (FSMA), National Pharmacies is a South Australia-based mutual organisation. Today, it has 173,000 memberships covering 317,000 members. In 2010-11, National Pharmacies generated sales of $304.3 million, up from $269 million in 2007-08, $182 million in 2002-03 and $51 million in 1990-91. National Pharmacies currently operates 57 pharmacies, having purchased 25 plus pharmacies over the past decade; for example, in 2009-10 it had purchased three pharmacies in South Australia following recent changes in ownership legislation. In the following year it acquired a large Victorian pharmacy whilst also selling three smaller Victoria pharmacies. Its website offers online shopping facilities. National Pharmacies continues to pursue expansion policies, combined with an ongoing strategy of upgrading and relocating its pharmacies. In addition National Pharmacies operates a PBS medicines wholesaling business and is in fact a CSO distributor for South Australia and Victoria. It also has 22 optical outlets.
A relatively new feature of the industry is the entry of discount pharmacies which include the likes of Chemist Warehouse (200 plus pharmacies), Chemist Direct, Discount Drugs (95 pharmacies) and United Discount Chemists (42 pharmacies)
Other pharmacy “groups” include My Chemist (40 pharmacies), Chemplus (60 pharmacies), Chemist Works (five pharmacies) and You Save Chemists (eight pharmacies).
Player Performancecontinued
Terry White operations were spun-off as part of its wholesale division, Symbion Pharmacy Services. Following the purchase of Symbion, the Zuellig Group agreed to negotiate the sale of the master franchise licence and rights to Terry White Chemists brand back to Terry
White Management, with the transaction occurring in July 2009. Full title to the brand is to be transferred by June 2014 following the achievement of a target level of wholesale purchases and upon the continuation of preferential supply arrangements.
www.IbISwORLd.COM.Au Pharmacies in Australia June 2012 27
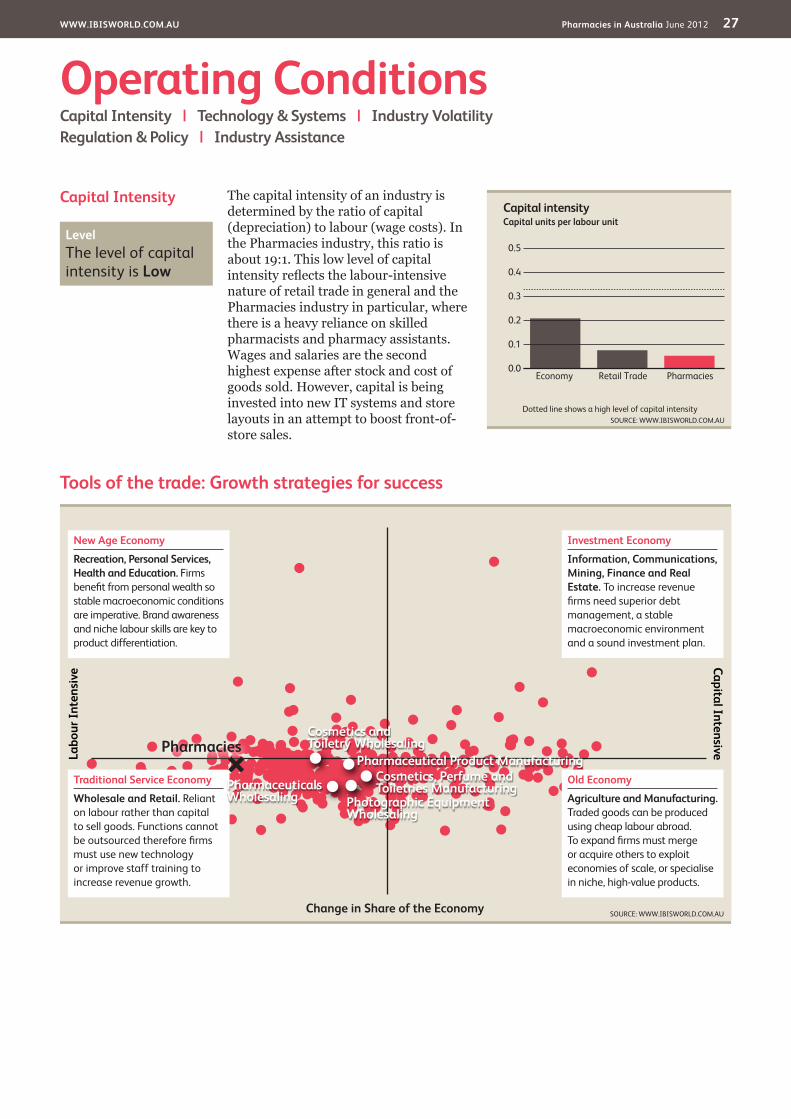
Capital Intensity The capital intensity of an industry is determined by the ratio of capital (depreciation) to labour (wage costs). In the Pharmacies industry, this ratio is about 19:1. This low level of capital intensity reflects the labour-intensive nature of retail trade in general and the Pharmacies industry in particular, where there is a heavy reliance on skilled pharmacists and pharmacy assistants. Wages and salaries are the second highest expense after stock and cost of goods sold. However, capital is being invested into new IT systems and store layouts in an attempt to boost front-of-store sales.
Operating ConditionsCapital Intensity | Technology & Systems | Industry VolatilityRegulation & Policy | Industry Assistance
Tools of the trade: Growth strategies for success
SOURCE: WWW.IBISWORLD.COM.AU
Labo
ur In
tens
ive Capital Intensive
Change in Share of the Economy
New Age Economy
Recreation, Personal Services, Health and Education. Firms benefi t from personal wealth so stable macroeconomic conditions are imperative. Brand awareness and niche labour skills are key to product differentiation.
Traditional Service Economy
wholesale and Retail. Reliant on labour rather than capital to sell goods. Functions cannot be outsourced therefore fi rms must use new technology or improve staff training to increase revenue growth.
Old Economy
Agriculture and Manufacturing. Traded goods can be produced using cheap labour abroad. To expand fi rms must merge or acquire others to exploit economies of scale, or specialise in niche, high-value products.
Investment Economy
Information, Communications, Mining, Finance and Real Estate. To increase revenue fi rms need superior debt management, a stable macroeconomic environment and a sound investment plan.
Pharmaceutical Product ManufacturingCosmetics, Perfume and Toiletries ManufacturingPharmaceuticals
wholesaling Photographic Equipment wholesaling
Cosmetics and Toiletry wholesalingPharmacies
Capital intensity
0.5
0.0
0.1
0.2
0.3
0.4
SOURCE: WWW.IBISWORLD.COM.AUDotted line shows a high level of capital intensity
Capital units per labour unit
PharmaciesRetail TradeEconomy
Level The level of capital intensity is Low
www.IbISwORLd.COM.Au Pharmacies in Australia June 2012 28
Operating Conditions
Technology& Systems
The Australian Pharmacies industry has embraced several technological innovations. One such innovation is the growing use of pre-packaged medications. This development has meant that pharmacists now spend less time actually compounding drugs.
The majority of pharmacies now have computerised dispensing systems, which allow the pharmacist to keep records of a client’s conditions, allergies, prescription history, concessional status, the prescribing doctor and the amount owing to the pharmacy. Approximately 98% of pharmacy stock orders are submitted electronically with deliveries expected on a same-day basis. Computerised retail point-of-sales systems are also allowing the pharmacist to more accurately manage their stock levels and hence, improve their stock turns. Of note is Symbion’s ownership of Minfos, which is a pharmacy management and automation system that streamlines nearly all aspects of pharmacy operation.
Also of interest is the existence of companies such as PharmX, a joint venture company owned by the pharmacy IT vendors Corum, Fred IT Group, Simple Retail and Moutaintop. Commencing operations in 2006, the company works with wholesalers such as Symbion-Zuellig, Sigma and API and various short-line wholesalers and direct suppliers. PharmX allows pharmacists access to a common web gateway exchange providing them with more flexibility in the placement of orders.
The Federal Government also played a role in changing the technological backdrop of the industry with its PBS Online program. It is now in the process of establishing a secure system for the electronic transmission of prescriptions
as part of its e-health agenda, which it announced in December 2008. The establishment of the National E-Health Transition Authority (NEHTA) has been set up to develop better ways of electronically collecting and securely exchanging health information.
Another technological development that may increasingly be used by the industry is the use of radio frequency identification (RFID) tags. In the case of the pharmaceutical industry, this involves tagging products with label embedded radio transmitters that emit radio waves, which can then be used for the remote monitoring of the drug within various stages of the supply chains to help detect counterfeit drugs.
The growing acceptance and use of the Internet in recent years has far-reaching implications for the industry. On the Australian front, an increasing number of participants have an Internet presence to increase customer awareness with others now seeking to employ complementary social media platforms.
Also of significance is the development of online pharmacies, such as ePharmacy, Pharmacy Online, Chemist Warehouse, Chemist Works and Chemist Direct which sell a wide range of health, beauty and personal care products, medical aids and general medicines. They also dispense prescription medicines.
Mail order pharmacy is another development of recent years. Established in 1996, Pharmacy Direct is expected to be Australia’s first mail order pharmacy and it also claims to be the largest.
The growth in both online pharmacies and mail order pharmacies represents a new competitive force and threat within the traditional community pharmacy operating environment.
Level The level of Technology Change is Medium

www.IbISwORLd.COM.Au Pharmacies in Australia June 2012 29
Operating Conditions
Regulation & Policy A highly regulated industry, Australia’s pharmacy legislation dates back to the 1870s when regulations were first introduced requiring the registration of pharmacists in the interests of public safety. Many of the provisions included within the legislation were in fact derived from Great Britain’s Pharmacy Act of 1868.
Pharmacy legislation is enacted in each Australian state and territory. While the terms may vary slightly with each state and territory, in general each relevant act reflects the need for the registration of healthcare professionals to protect the health and safety of the community. Most importantly each state government has the power to limit who may practise pharmacy, who may conduct or own pharmacy business, and determine where pharmacy businesses may be located. As such, these acts have served to determine the profile of the pharmacy retailing industry. Relevant state and territory acts include the New South Wales Pharmacy Act 1964, the Victoria Pharmacists Act 1974, the Queensland Pharmacy Act
1964, the Western Australia Pharmacy Act 1964, the South Australia Pharmacists Act 1991, the Tasmania Pharmacy Act 1980 and the Australian Capital Territory Pharmacy Act 1996.
In addition, the industry is also affected by several other pieces of legislation, which not only affect the various Pharmacy Acts, but are integral to them. These include the Drugs & Poisons and Controlled Substances Acts. These classify human use medicines into five categories; controlled medicines (Schedule 8), prescription only medicines (Schedule 4), pharmacist only medicines (Schedule 3), pharmacy medicines (Schedule 2) and general sales medicines (unscheduled). As such, they are of fundamental importance to the industry as they restrict the supply of some medicines to pharmacies.
Also of relevance is the National Health Act (1953), with particular reference to the provisions governing the operation of the Pharmaceutical Benefits Scheme (PBS), which governs 80% of prescription medicines sold in Australia, the
Revenue Volatility Given the essential nature of the products dispensed by pharmacies, the industry displays a low level of volatility. However, changes in the level of pharmaceutical prescriptions and prices received for dispensing PBS items can affect industry
volatility. Variations in personal expenditure patterns for discretionary items such as cosmetics, perfumes and toiletries, which are also sold by pharmacies, can also affect industry volatility levels.
Level The level of Volatility is Low
SOURCE: WWW.IBISWORLD.COM.AU
Volatility vs Growth
Reve
nue
vola
tility
* (%
)
1000
100
10
1
0.1
Five year annualised revenue growth (%)–30 –10 10 30 50 70
Hazardous
Stagnant
Rollercoaster
blue Chip
* Axis is in logarithmic scale
Pharmacies
A higher level of revenue volatility implies greater industry risk. Volatility can negatively affect long-term strategic decisions, such as the time frame for capital investment.
When a fi rm makes poor investment decisions it may face underutilised capacity if demand suddenly falls, or capacity constraints if it rises quickly.
Level & Trend The level of Regulation is Heavy and the trend is Increasing
www.IbISwORLd.COM.Au Pharmacies in Australia June 2012 30
Operating Conditions
Regulation & Policycontinued
Therapeutic Goods Act 1989, the Friendly Societies Acts, the Trade Practices Act and Consumer Protection Acts.
Of particular importance are the remuneration implications of the PBS. A Commonwealth Government scheme for subsidising the cost of pharmaceuticals to the Australian community, the PBS was first introduced in 1950 and currently covers 760 medicines available in 1,960 forms and marketed as 3,950 different brands. Under the PBS, capped co-payments and safety nets limit the cost of pharmaceuticals to consumers, with the government paying the remainder. In 2010-11, the total cost of the PBS was $8.87 billion of which the Government financed 83.7%.
Remuneration to pharmacists for dispensing pharmaceuticals, which are listed on the PBS, is set via an agreement between the Pharmacy Guild of Australia and the Federal Government. The agreements set a dispensing fee, an administration fee, a mark-up of 10% (where the approved price is below $180) and other agreed fees. Pharmacists are unable to alter the prices of any PBS items, which are subsidised by the government. Under the Fifth Agreement, which came into effect on 1 July 2010, $13.8 billion is to be provided as pharmacy remuneration for the distribution and supply of PBS medicines over the five-year period through 2014-15.
A relatively new area of regulation concerns the manufacture and sale of complementary or alternative therapeutic products. In the face of rising acceptance and usage levels, the government in 1999, introduced the Complementary Medicines Reform Package, which saw the establishment of the Office of Complementary Medicines (OCM) within the TGA, the Complementary Medicines Evaluation Committee (CMEC) and the Complementary Healthcare Consultative Forum (CHCF). The reform package hoped to shift the regulatory focus from pre-market clearance to post-market vigilance for low-risk ‘listable’ goods.
Several industry regulatory bodies exist, such as the Pharmacy Guild of
Australia, which covers nearly 90% of all Australian pharmacist proprietors, the Pharmaceutical Society of Australia (PSA), and the Australian Association of Consultant Pharmacy (AACP), which is jointly owned and operated by the Pharmacy Guild and the PSA and seeks to increase the level of professional, value added specialty services provided through community pharmacies.
DeregulationPressure for industry deregulation has been apparent since the 1960s, although to date it has yet to occur. Of particular note was the 1996 National Commission of Audit recommendation that supermarkets be allowed to own and operate in-store pharmacies that sell prescription drugs although this was rejected by the government of the day. On the other side of the coin, also of interest was the 1999-2000 National Competition Policy Review of Pharmacy Regulation (the Wilkinson Review) which was tasked with examining the existing regulatory framework governing the ownership of pharmacies, the location of pharmacies to dispense PBS products and the registration of pharmacists. Of key importance to the industry was Recommendation 1, which suggested that the legislative restrictions on who may own and operate community pharmacies be retained while the ownership and control of community pharmacies continue to be confined to registered pharmacists. COAG’s 2002 response to the Wilkinson Review included upholding the recommendations of the NCP Review with regards to pharmacist-only ownership of pharmacies as well as the NCP’s recommendations with regards to the number of pharmacies owned by pharmacists. At the same time, it had reservations regarding the NCP’s recommendation over the operation of regulatory authorities.
RelocationPrior to the NCP Review, an amendment to the National Health Act in late 1993 meant that pharmacies dispensing drugs
www.IbISwORLd.COM.Au Pharmacies in Australia June 2012 31
Operating Conditions
Industry Assistance One of the key characteristics of the industry is the existence of five year Community Pharmacy Agreements, which are set between the Australian Government and the Pharmacy Guild of Australia. These agreements provide for remuneration over the life of the agreement to community pharmacies for dispensing PBS medicines and the provision of pharmacy programs and services. As such they encourage pharmacies to expand their role in the delivery of primary healthcare to the Australian community. For example, $663 million was to be provided in funding over the five years through 2009-10 for the provision of professional and patient services by pharmacies.
The Fifth Community Pharmacy Agreement (5CPA) came into effect on 1 July 2010 and is to provide $15.4 billion in funding in total (this covers the dispensing of PBS medicines, the provision of pharmacy programs and services, and the Community Services
Obligation arrangements with pharmaceutical wholesalers) over the five years through 2014-15, up from $11.1 billion in the fourth agreement and $5.6 billion in the third agreement.
As in the past, the fifth agreement sets payments of allowances and fees for dispensing pharmaceutical benefits. However, indexation will not be applied to the dispensing fee in 2010-11 and 2011-12. In addition pharmacists will no longer receive the $0.40 PBS online incentive payment although they will receive a new fee of $0.15 per transaction that is generated electronically by prescribers and processed through a prescription exchange service in line with the government’s e-health agenda.
The fifth agreement also provides for up to $10.6 million in funding for pharmacy R&D over the life of the agreement.
Tariffs or other forms of protection are not applicable to the industry.
Regulation & Policycontinued
under the PBS must first seek the approval of the Australian Community Pharmacy Authority before relocating. The guidelines and approvals for relocation vary according to the distance of the relocation and the distance from competing pharmacies. While all pharmacies have had to be approved locations under the previous act, the amendment ensured the strict enforcement of relocation procedures. The Fourth Community Pharmacy Agreement introduced new pharmacy location rules designed to provide greater flexibility for relocating pharmacies. Under the new rules, which came into effect from 1 July 2006, pharmacies are able to co-locate with large medical centres that operate extended hours; relocate into small shopping centres with 15 or more shops and a large supermarket; and relocate to single pharmacy rural towns and urban areas
with high population growth. The criteria for establishing new pharmacies have been relaxed as has the two year restriction on relocation. However, existing rules that prevent pharmacies from locating within, or that have public access from, a supermarket were retained. The relocation rules were also retained under the Fifth Community Pharmacy Agreement.
However as from 18 October 2011, there are a number of changes to the pharmacy location rules, namely that under the amendments, an existing pharmacy PBS approval is no required for new pharmacies being established in facilities such as shopping centres, large medical centres and private hospitals or in towns where there is only one pharmacy in existence. These amendments follow an independent review of the pharmacy location rules undertaken in 2010.
Level & Trend The level of Industry Assistance is Medium and the trend is Steady

www.IbISwORLd.COM.Au Pharmacies in Australia June 2012 32
Key StatisticsRevenue
($m)
Industry Value Added
($m) Establishments Enterprises Employment Exports Importswages ($m)
domestic demand
2002-03 10,525 3,680 4,907 3,730 38,650 -- -- 1,810 N/A2003-04 10,900 3,775 4,910 3,735 39,500 -- -- 1,870 N/A2004-05 11,050 3,840 4,922 3,740 40,800 -- -- 1,940 N/A2005-06 11,125 3,815 4,951 3,750 43,200 -- -- 2,055 N/A2006-07 11,375 3,990 4,992 3,760 45,000 -- -- 2,145 N/A2007-08 11,675 4,075 5,037 3,770 46,000 -- -- 2,195 N/A2008-09 11,825 4,090 5,084 3,775 46,850 -- -- 2,240 N/A2009-10 11,900 4,110 5,137 3,780 47,600 -- -- 2,275 N/A2010-11 12,185 4,150 5,218 3,785 48,300 -- -- 2,310 N/A2011-12 12,435 4,200 5,270 3,795 49,470 -- -- 2,365 N/A2012-13 12,715 4,265 5,325 3,800 50,250 -- -- 2,405 N/A2013-14 12,975 4,330 5,385 3,805 51,200 -- -- 2,450 N/A2014-15 13,300 4,400 5,450 3,810 51,850 -- -- 2,490 N/A2015-16 13,650 4,475 5,505 3,815 52,500 -- -- 2,520 N/A2016-17 13,975 4,545 5,565 3,820 53,235 -- -- 2,550 N/ASector Rank 10/41 4/41 15/41 19/41 10/41 N/A N/A 7/41 N/AEconomy Rank 85/495 79/495 109/495 112/495 71/495 N/A N/A 67/495 N/A
IVA/Revenue (%)
Imports/demand (%)
Exports/Revenue (%)
Revenue per Employee
($’000)wages/Revenue
(%)Employees
per Est.Average wage
($)
Share of the Economy
(%)2002-03 34.96 N/A N/A 272.32 17.20 7.88 46,830.53 0.352003-04 34.63 N/A N/A 275.95 17.16 8.04 47,341.77 0.352004-05 34.75 N/A N/A 270.83 17.56 8.29 47,549.02 0.342005-06 34.29 N/A N/A 257.52 18.47 8.73 47,569.44 0.332006-07 35.08 N/A N/A 252.78 18.86 9.01 47,666.67 0.332007-08 34.90 N/A N/A 253.80 18.80 9.13 47,717.39 0.332008-09 34.59 N/A N/A 252.40 18.94 9.22 47,812.17 0.332009-10 34.54 N/A N/A 250.00 19.12 9.27 47,794.12 0.322010-11 34.06 N/A N/A 252.28 18.96 9.26 47,826.09 0.322011-12 33.78 N/A N/A 251.36 19.02 9.39 47,806.75 0.312012-13 33.54 N/A N/A 253.03 18.91 9.44 47,860.70 0.302013-14 33.37 N/A N/A 253.42 18.88 9.51 47,851.56 0.302014-15 33.08 N/A N/A 256.51 18.72 9.51 48,023.14 0.292015-16 32.78 N/A N/A 260.00 18.46 9.54 48,000.00 0.292016-17 32.52 N/A N/A 262.52 18.25 9.57 47,900.82 N/ASector Rank 3/41 N/A N/A 21/41 6/41 5/41 5/41 4/41Economy Rank 224/495 N/A N/A 294/495 196/495 231/495 297/495 79/495
Figures are inflation-adjusted 2012 dollars. Rank refers to 2012 data.
Revenue (%)
Industry Value Added
(%)Establishments
(%)Enterprises
(%)Employment
(%)Exports
(%)Imports
(%)wages
(%)
domestic demand
(%)2003-04 3.6 2.6 0.1 0.1 2.2 N/A N/A 3.3 N/A2004-05 1.4 1.7 0.2 0.1 3.3 N/A N/A 3.7 N/A2005-06 0.7 -0.7 0.6 0.3 5.9 N/A N/A 5.9 N/A2006-07 2.2 4.6 0.8 0.3 4.2 N/A N/A 4.4 N/A2007-08 2.6 2.1 0.9 0.3 2.2 N/A N/A 2.3 N/A2008-09 1.3 0.4 0.9 0.1 1.8 N/A N/A 2.1 N/A2009-10 0.6 0.5 1.0 0.1 1.6 N/A N/A 1.6 N/A2010-11 2.4 1.0 1.6 0.1 1.5 N/A N/A 1.5 N/A2011-12 2.1 1.2 1.0 0.3 2.4 N/A N/A 2.4 N/A2012-13 2.3 1.5 1.0 0.1 1.6 N/A N/A 1.7 N/A2013-14 2.0 1.5 1.1 0.1 1.9 N/A N/A 1.9 N/A2014-15 2.5 1.6 1.2 0.1 1.3 N/A N/A 1.6 N/A2015-16 2.6 1.7 1.0 0.1 1.3 N/A N/A 1.2 N/A2016-17 2.4 1.6 1.1 0.1 1.4 N/A N/A 1.2 N/ASector Rank 19/41 27/41 22/41 28/41 8/41 N/A N/A 11/41 N/AEconomy Rank 214/495 252/495 176/495 203/495 129/495 N/A N/A 138/495 N/A
Annual Change
Key Ratios
Industry data
SOURCE: WWW.IBISWORLD.COM.AU
www.IbISwORLd.COM.Au Pharmacies in Australia June 2012 33
Jargon & Glossary
bARRIERS TO ENTRy Barriers to entry can be High, Medium or Low. High means new companies struggle to enter an industry, while Low means it is easy for a firm to enter an industry.
CAPITAL/LAbOuR INTENSITy An indicator of how much capital is used in production as opposed to labour. Level is stated as High, Medium or Low. High is a ratio of less than $3 of wage costs for every $1 of depreciation; Medium is $3-$8 of wage costs to $1 of depreciation; Low is greater than $8 of wage costs for every $1 of depreciation.
CONSTANT PRICES The dollar figures in the Key Statistics table, including forecasts, are adjusted for inflation using 2011-12 as the base year. This removes the impact of changes in the purchasing power of the dollar, leaving only the ‘real’ growth or decline in industry metrics. The inflation adjustments in IBISWorld’s reports are made using the Australian Bureau of Statistics’ implicit GDP price deflator.
dOMESTIC dEMANd The use of goods and services within Australia; the sum of imports and domestic production minus exports.
EARNINGS bEFORE INTEREST ANd TAX (EbIT) IBISWorld uses EBIT as an indicator of a company’s profitability. It is calculated as revenue minus expenses, excluding tax and interest.
EMPLOyMENT The number of working proprietors, partners, permanent, part-time, temporary and casual employees, and managerial and executive employees.
ENTERPRISE A division that is separately managed and keeps management accounts. The most relevant measure of the number of firms in an industry.
ESTAbLISHMENT The smallest type of accounting unit within an Enterprise; usually consists of one or more locations in a state or territory of the country in which it operates.
EXPORTS The total sales and transfers of goods produced by an industry that are exported.
IMPORTS The value of goods and services imported with the amount payable to non-residents.
INduSTRy CONCENTRATION IBISWorld bases concentration on the top four firms. Concentration is identified as High, Medium or Low. High means the top four players account for over 70% of revenue; Medium is 40 –70% of revenue; Low is less than 40%.
INduSTRy REVENuE The total sales revenue of the industry, including sales (exclusive of excise and sales tax) of goods and services; plus transfers to other firms of the same business; plus subsidies on production; plus all other operating income from outside the firm (such as commission income, repair and service income, and rent, leasing and hiring income); plus capital work done by rental or lease. Receipts from interest royalties, dividends and the sale of fixed tangible assets are excluded.
INduSTRy VALuE AddEd The market value of goods and services produced by an industry minus the cost of goods and services used in the production process, which leaves the gross product of the industry (also called its Value Added).
INTERNATIONAL TRAdE The level is determined by: Exports/Revenue: Low is 0-5%; Medium is 5-20%; High is over 20%. Imports/Domestic Demand: Low is 0-5%; Medium is 5-35%; and High is over 35%.
LIFE CyCLE All industries go through periods of Growth, Maturity and Decline. An average life cycle lasts 70 years. Maturity is the longest stage at 40 years with Growth and Decline at 15 years each.
NON-EMPLOyING ESTAbLISHMENT Businesses with no paid employment and payroll are known as non-employing establishments. These are mostly set-up by self employed individuals.
VOLATILITy The level of volatility is determined by the percentage change in revenue over the past five years. Volatility levels: Very High is greater than ±20%; High Volatility is between ±10% and ±20%; Moderate Volatility is between ±3% and ±10%; and Low Volatility is less than ±3%.
wAGES The gross total wages and salaries of all employees of the establishment.
Industry Jargon
IbISworld Glossary
bANNER GROuPS Groups formed to provide support and undertake joint advertising and promotions.
OTC Stands for over-the-counter products, which are sold without requiring a prescription.
PbS The government-subsidised Pharmaceutical Benefits Scheme.
SCHEduLE 2 PHARMACy MEdICINES Non-prescription medicines that can only be sold in a pharmacy.
SCHEduLE 3 PHARMACIST-ONLy MEdICINES Non-prescription medicines sold through a pharmacy on the provision of pharmacist advice.
disclaimer
This product has been supplied by IBISWorld Pty Ltd. (‘IBISWorld’) solely for use by its authorised licenses strictly in accordance with their license agreements with IBISWorld. IBISWorld makes no representation to any other person with regard to the completeness or accuracy of the data or information contained herein, and it accepts no responsibility and disclaims all liability (save for liability which cannot be lawfully disclaimed) for loss or damage whatsoever suffered or incurred by any other person resulting from
the use of, or reliance upon, the data or information contained herein. Copyright in this publication is owned by IBISWorld Pty Ltd. The publication is sold on the basis that the purchaser agrees not to copy the material contained within it for other than the purchasers own purposes. In the event that the purchaser uses or quotes from the material in this publication – in papers, reports, or opinions prepared for any other person – it is agreed that it will be sourced to: IBISWorld Pty Ltd
At IBISWorld we know that industry intelligence is more than assembling factsIt is combining data with analysis to answer the questions that successful businesses askIdentify high growth, emerging & shrinking marketsArm yourself with the latest industry intelligenceAssess competitive threats from existing & new entrantsbenchmark your performance against the competitionMake speedy market-ready, profit-maximising decisions
who is IbISworld?We are strategists, analysts, researchers, and marketers. We provide answers to information-hungry, time-poor businesses. Our goal is to provide real world answers that matter to your business in our 500 Australian industry reports. When tough strategic, budget, sales and marketing decisions need to be made, our suite of Industry and Risk intelligence products give you deeply-researched answers quickly.
IbISworld MembershipIBISWorld offers tailored membership packages to meet your needs.
Copyright 2012 IBISWorld Pty Ltd
www.ibisworld.com.au | (03) 9655 3881 | [email protected]