Embed Size (px)
Citation preview
THE
QUARTERLY JOURNALOF ECONOMICS
Vol. 130 November 2015 Issue 4
THE HIGH-FREQUENCY TRADING ARMS RACE: FREQUENTBATCH AUCTIONS AS A MARKET DESIGN RESPONSE*
Eric Budish
Peter Cramton
John Shim
The high-frequency trading arms race is a symptom of flawed market design.Instead of the continuous limit order book market design that is currentlypredominant, we argue that financial exchanges should use frequent batch
*First version: July 2013. Project start date: October 2010. For helpful discus-sions we are grateful to numerous industry practitioners; seminar audiences at theUniversity of Chicago, Chicago Fed, Universite Libre de Bruxelles, University ofOxford, Wharton, NASDAQ, IEX Group, Berkeley, NBER Market Design, NYU,MIT, Harvard, Columbia, Spot Trading, CFTC, Goldman Sachs, Toronto, AQR,FINRA, SEC First Annual Conference on Financial Market Regulation, NBER IO,UK FCA, Northwestern, Stanford, Netherlands AFM, Paris Market Microstructure,Utah WFC, NY Fed, Cornell, FRB; and Susan Athey, Larry Ausubel, Eduardo Aze-vedo, Simcha Barkai, Ben Charoenwong, Adam Clark-Joseph, John Cochrane, DougDiamond, Darrell Duffie, Gene Fama, Doyne Farmer, Thierry Foucault, Alex Fran-kel, Matt Gentzkow, Larry Glosten, Terry Hendershott, Ali Hortacsu, Laszlo Jakab,Emir Kamenica, Brian Kelly, Pete Kyle, Jon Levin, Donald MacKenzie, GregorMatvos, Albert Menkveld, Paul Milgrom, Toby Moskowitz, Matt Notowidigdo,Mike Ostrovsky, David Parkes, Canice Prendergast, Al Roth, Gideon Saar, JesseShapiro, Spyros Skouras, Andy Skrzypacz, Chester Spatt, Lars Stole, Geoff Swerdlin,Richard Thaler, Brian Weller, Michael Wellman, and Bob Wilson. We thank DanielDavidson, Michael Wong, Ron Yang, and especially Geoff Robinson for outstandingresearch assistance. We thank the editor, Andrei Shleifer, and four anonymous ref-erees for detailed and insightful comments that improved the article in many ways.Budish gratefully acknowledges financial support from the National Science Founda-tion (ICES-1216083), the Fama-Miller Center for Research in Finance at the Uni-versity of Chicago Booth School of Business, and the Initiative on Global Markets atthe University of Chicago Booth School of Business. Corresponding author, EricBudish: Chicago Booth, 5807 S Woodlawn Avenue, Chicago IL 60637; phone: 773-702-8453; email: [email protected].! The Author(s) 2015. Published by Oxford University Press, on behalf of President and Fellows of HarvardCollege.This is an Open Access article distributed under the terms of the Creative Commons Attribution-NonCommercial-NoDerivs licence (http://creativecommons.org/licenses/by-nc-nd/4.0/), which permits non-commercial reproduction and distribution of the work, in any medium, provided the original work is notaltered or transformed in any way, and that the work properly cited. For commercial re-use, please [email protected] Quarterly Journal of Economics (2015), 1547–1621. doi:10.1093/qje/qjv027.Advance Access publication on July 23, 2015.
1547
at Serials Departm
ent on Decem
ber 23, 2015http://qje.oxfordjournals.org/
Dow
nloaded from
auctions: uniform price double auctions conducted, for example, every tenth of asecond. That is, time should be treated as discrete instead of continuous, andorders should be processed in a batch auction instead of serially. Our argumenthas three parts. First, we use millisecond-level direct-feed data from exchanges todocument a series of stylized facts about how the continuous market works athigh-frequency time horizons: (i) correlations completely break down; which (ii)leads to obvious mechanical arbitrage opportunities; and (iii) competition has notaffected the size or frequency of the arbitrage opportunities, it has only raised thebar for how fast one has to be to capture them. Second, we introduce a simpletheory model which is motivated by and helps explain the empirical facts. Thekey insight is that obvious mechanical arbitrage opportunities, like thoseobserved in the data, are built into the market design—continuous-time serial-processing implies that even symmetrically observed public information createsarbitrage rents. These rents harm liquidity provision and induce a never-endingsocially wasteful arms race for speed. Last, we show that frequent batch auctionsdirectly address the flaws of the continuous limit order book. Discrete timereduces the value of tiny speed advantages, and the auction transforms compe-tition on speed into competition on price. Consequently, frequent batch auctionseliminate the mechanical arbitrage rents, enhance liquidity for investors, andstop the high-frequency trading arms race. JEL Codes: D47, D44, D82, G10,G14, G20.
I. Introduction
In 2010, Spread Networks completed construction of a newhigh-speed fiber optic cable connecting financial markets in NewYork and Chicago. Whereas previous connections between thetwo financial centers zigzagged along railroad tracks, aroundmountains, etc., Spread Networks’ cable was dug in a nearlystraight line. Construction costs were estimated at $300 million.The result of this investment? Round-trip communication timebetween New York and Chicago was reduced . . . from 16 millisec-onds to 13 milliseconds. Three milliseconds may not seem likemuch, especially relative to the speed at which fundamental in-formation about companies and the economy evolves. (The blinkof a human eye lasts 400 milliseconds; reading this parentheticaltook roughly 3,000 milliseconds.) But industry observers re-marked that 3 milliseconds is an ‘‘eternity’’ to high-frequencytrading (HFT) firms, and that ‘‘anybody pinging both marketshas to be on this line, or they’re dead.’’ One observer joked atthe time that the next innovation will be to dig a tunnel, speedingup transmission time even further by ‘‘avoiding the planet’s peskycurvature.’’ Spread Networks may not find this joke funny anymore,as its cable is already obsolete. While tunnels have yet to material-ize, a different way to get a straighter line from New York to Chicago
QUARTERLY JOURNAL OF ECONOMICS1548
at Serials Departm
ent on Decem
ber 23, 2015http://qje.oxfordjournals.org/
Dow
nloaded from
is to use microwaves rather than fiber optic cable, since light travelsfaster through air than through glass. Since its emergence inaround 2011, microwave technology has reduced round-trip trans-mission time first to around 10 milliseconds, then 9 milliseconds,then 8.5 milliseconds, and most recently to 8.1 milliseconds.Analogous speed races are occurring throughout the financialsystem, sometimes measured at the level of microseconds (mil-lionths of a second) and even nanoseconds (billionths of a second).1
We argue that the high-frequency trading arms race is a symp-tom of a basic flaw in the design of modern financial exchanges:continuous-time trading. That is, under the continuous limit orderbook market design that is currently predominant, it is possible tobuy or sell stocks or other exchange-traded financial instruments atany instant during the trading day.2 We propose a simple alterna-tive: discrete-time trading. More precisely, we propose a marketdesign in which the trading day is divided into extremely frequentbut discrete time intervals; to fix ideas, say, 100 milliseconds. Alltrade requests received during the same interval are treated ashaving arrived at the same (discrete) time. Then, at the end ofeach interval, all outstanding orders are processed in batch,using a uniform-price auction, as opposed to the serial processingthat occurs in the continuous market. We call this market designfrequent batch auctions. Our argument against continuous limitorder books and in favor of frequent batch auctions has three parts.
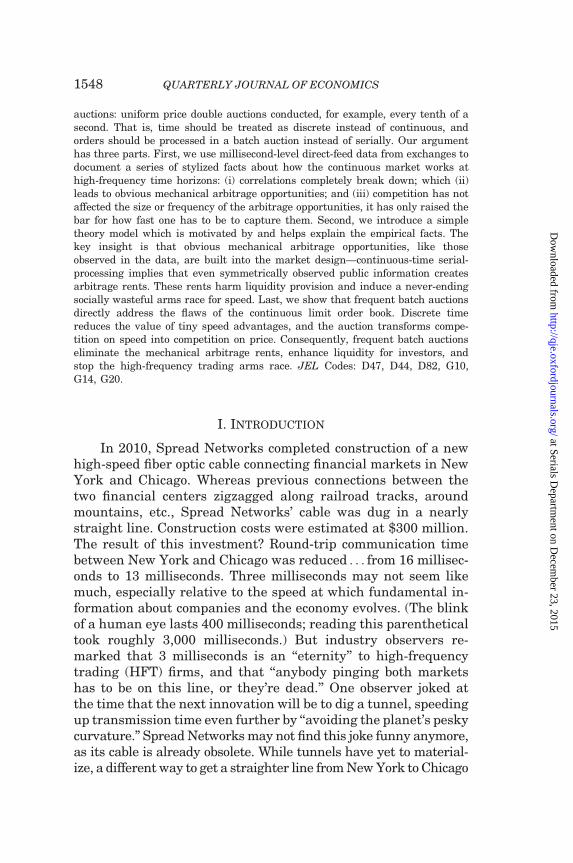
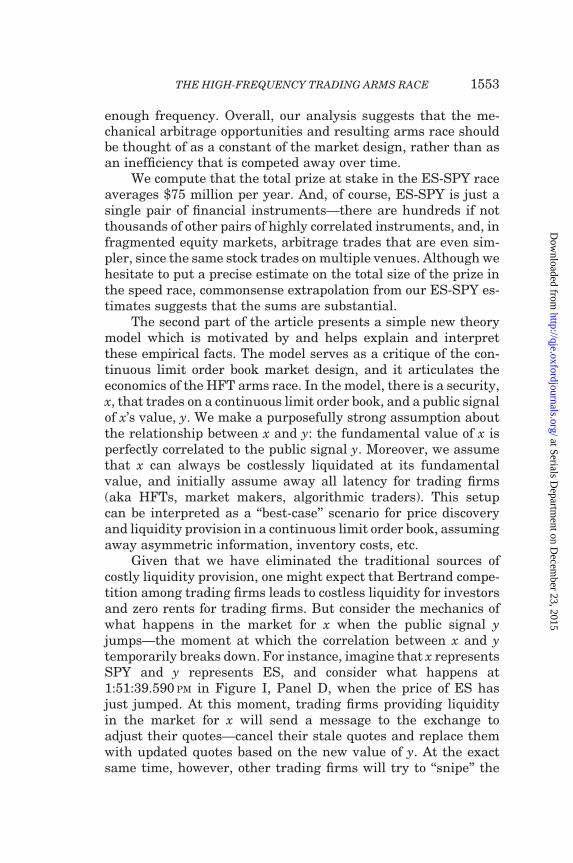
The first part uses millisecond-level direct-feed data fromexchanges to document a series of stylized facts about continuouslimit order book markets. Together, the facts suggest that contin-uous limit order book markets violate basic asset pricing princi-ples at high-frequency time horizons—that is, the continuousmarket does not actually ‘‘work’’ in continuous time. ConsiderFigure I. The figure depicts the price paths of the two largestfinancial instruments that track the S&P 500 index, the SPDRS&P 500 exchange traded fund (ticker SPY) and the S&P 500E-mini futures contract (ticker ES), on a trading day in 2011. In
1. Sources for this paragraph: Steiner (2010); Najarian (2010); Conway (2011);Troianovski (2012); Adler (2012); Bunge (2013); Laughlin, Aguirre, and Grundfest(2014); McKay Brothers Microwave Latencies Table, January 20, 2015 (http://www.mckay-brothers.com/product-page/#latencies), Aurora-Carteret route.
2. Computers do not literally operate in continuous time; they operate in dis-crete time in increments of about 0.3 nanosecond. More precisely, what we mean bycontinuous time is as-fast-as-possible discrete time plus random serial processing oforders that reach the exchange at the exact same discrete time.
THE HIGH-FREQUENCY TRADING ARMS RACE 1549
at Serials Departm
ent on Decem
ber 23, 2015http://qje.oxfordjournals.org/
Dow
nloaded from
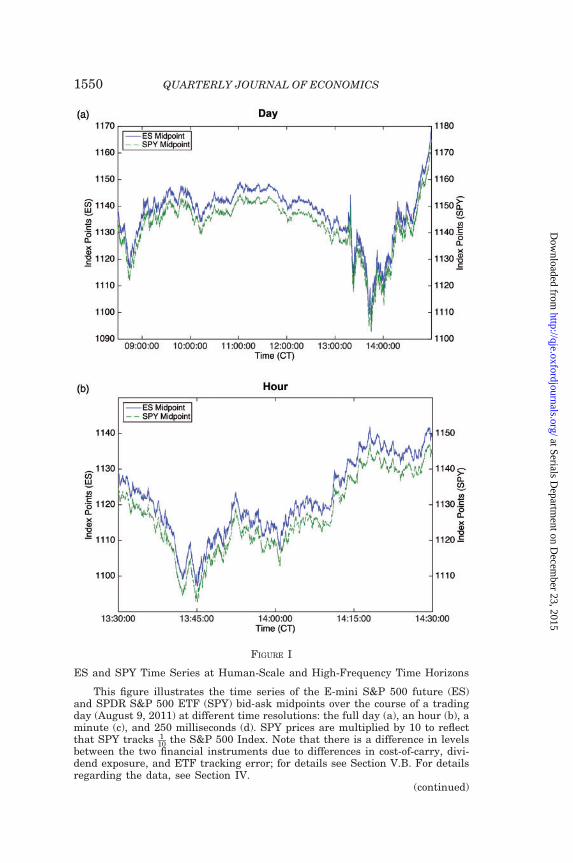
FIGURE I
ES and SPY Time Series at Human-Scale and High-Frequency Time Horizons
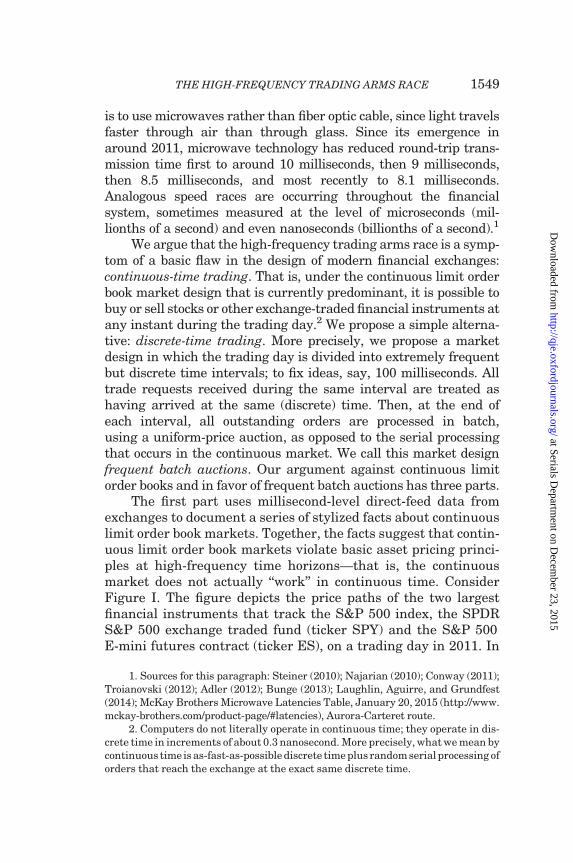
This figure illustrates the time series of the E-mini S&P 500 future (ES)and SPDR S&P 500 ETF (SPY) bid-ask midpoints over the course of a tradingday (August 9, 2011) at different time resolutions: the full day (a), an hour (b), aminute (c), and 250 milliseconds (d). SPY prices are multiplied by 10 to reflectthat SPY tracks 1
10 the S&P 500 Index. Note that there is a difference in levelsbetween the two financial instruments due to differences in cost-of-carry, divi-dend exposure, and ETF tracking error; for details see Section V.B. For detailsregarding the data, see Section IV.
(continued)
QUARTERLY JOURNAL OF ECONOMICS1550
at Serials Departm
ent on Decem
ber 23, 2015http://qje.oxfordjournals.org/
Dow
nloaded from
FIGURE I
Continued
THE HIGH-FREQUENCY TRADING ARMS RACE 1551
at Serials Departm
ent on Decem
ber 23, 2015http://qje.oxfordjournals.org/
Dow
nloaded from
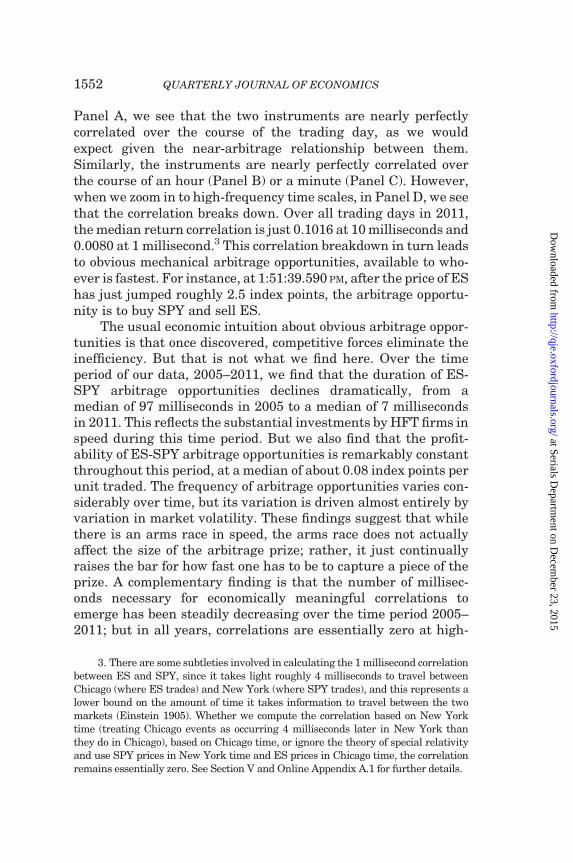
Panel A, we see that the two instruments are nearly perfectlycorrelated over the course of the trading day, as we wouldexpect given the near-arbitrage relationship between them.Similarly, the instruments are nearly perfectly correlated overthe course of an hour (Panel B) or a minute (Panel C). However,when we zoom in to high-frequency time scales, in Panel D, we seethat the correlation breaks down. Over all trading days in 2011,the median return correlation is just 0.1016 at 10 milliseconds and0.0080 at 1 millisecond.3 This correlation breakdown in turn leadsto obvious mechanical arbitrage opportunities, available to who-ever is fastest. For instance, at 1:51:39.590 PM, after the price of EShas just jumped roughly 2.5 index points, the arbitrage opportu-nity is to buy SPY and sell ES.
The usual economic intuition about obvious arbitrage oppor-tunities is that once discovered, competitive forces eliminate theinefficiency. But that is not what we find here. Over the timeperiod of our data, 2005–2011, we find that the duration of ES-SPY arbitrage opportunities declines dramatically, from amedian of 97 milliseconds in 2005 to a median of 7 millisecondsin 2011. This reflects the substantial investments by HFT firms inspeed during this time period. But we also find that the profit-ability of ES-SPY arbitrage opportunities is remarkably constantthroughout this period, at a median of about 0.08 index points perunit traded. The frequency of arbitrage opportunities varies con-siderably over time, but its variation is driven almost entirely byvariation in market volatility. These findings suggest that whilethere is an arms race in speed, the arms race does not actuallyaffect the size of the arbitrage prize; rather, it just continuallyraises the bar for how fast one has to be to capture a piece of theprize. A complementary finding is that the number of millisec-onds necessary for economically meaningful correlations toemerge has been steadily decreasing over the time period 2005–2011; but in all years, correlations are essentially zero at high-
3. There are some subtleties involved in calculating the 1 millisecond correlationbetween ES and SPY, since it takes light roughly 4 milliseconds to travel betweenChicago (where ES trades) and New York (where SPY trades), and this represents alower bound on the amount of time it takes information to travel between the twomarkets (Einstein 1905). Whether we compute the correlation based on New Yorktime (treating Chicago events as occurring 4 milliseconds later in New York thanthey do in Chicago), based on Chicago time, or ignore the theory of special relativityand use SPY prices in New York time and ES prices in Chicago time, the correlationremains essentially zero. See Section V and Online Appendix A.1 for further details.
QUARTERLY JOURNAL OF ECONOMICS1552
at Serials Departm
ent on Decem
ber 23, 2015http://qje.oxfordjournals.org/
Dow
nloaded from
enough frequency. Overall, our analysis suggests that the me-chanical arbitrage opportunities and resulting arms race shouldbe thought of as a constant of the market design, rather than asan inefficiency that is competed away over time.
We compute that the total prize at stake in the ES-SPY raceaverages $75 million per year. And, of course, ES-SPY is just asingle pair of financial instruments—there are hundreds if notthousands of other pairs of highly correlated instruments, and, infragmented equity markets, arbitrage trades that are even sim-pler, since the same stock trades on multiple venues. Although wehesitate to put a precise estimate on the total size of the prize inthe speed race, commonsense extrapolation from our ES-SPY es-timates suggests that the sums are substantial.
The second part of the article presents a simple new theorymodel which is motivated by and helps explain and interpretthese empirical facts. The model serves as a critique of the con-tinuous limit order book market design, and it articulates theeconomics of the HFT arms race. In the model, there is a security,x, that trades on a continuous limit order book, and a public signalof x’s value, y. We make a purposefully strong assumption aboutthe relationship between x and y: the fundamental value of x isperfectly correlated to the public signal y. Moreover, we assumethat x can always be costlessly liquidated at its fundamentalvalue, and initially assume away all latency for trading firms(aka HFTs, market makers, algorithmic traders). This setupcan be interpreted as a ‘‘best-case’’ scenario for price discoveryand liquidity provision in a continuous limit order book, assumingaway asymmetric information, inventory costs, etc.
Given that we have eliminated the traditional sources ofcostly liquidity provision, one might expect that Bertrand compe-tition among trading firms leads to costless liquidity for investorsand zero rents for trading firms. But consider the mechanics ofwhat happens in the market for x when the public signal yjumps—the moment at which the correlation between x and ytemporarily breaks down. For instance, imagine that x representsSPY and y represents ES, and consider what happens at1:51:39.590 PM in Figure I, Panel D, when the price of ES hasjust jumped. At this moment, trading firms providing liquidityin the market for x will send a message to the exchange toadjust their quotes—cancel their stale quotes and replace themwith updated quotes based on the new value of y. At the exactsame time, however, other trading firms will try to ‘‘snipe’’ the
THE HIGH-FREQUENCY TRADING ARMS RACE 1553
at Serials Departm
ent on Decem
ber 23, 2015http://qje.oxfordjournals.org/
Dow
nloaded from
stale quotes—send a message to the exchange attempting to buy xat the old ask, before the liquidity providers can adjust. Since thecontinuous limit order book processes message requests in serial(i.e., one at a time in order of receipt), it is effectively randomwhose request is processed first. And, to avoid being sniped,each one of the liquidity provider’s request to cancel has to getprocessed before all of the other trading firms’ requests to snipeher stale quotes; hence, if there are N trading firms, each liquidityprovider is sniped with probability N�1
N . This shows that tradingfirms providing liquidity, even in an environment with only sym-metric information and with no latency, still get sniped with highprobability because of the rules of the continuous limit order book.The obvious mechanical arbitrage opportunities we observed inthe data are in a sense ‘‘built in’’ to the market design: continu-ous-time serial-processing creates arbitrage rents from symmet-rically observed public information.
These arbitrage rents increase the cost of liquidity provision.In a competitive market, trading firms providing liquidity incor-porate the cost of getting sniped into the bid-ask spread that theycharge; so there is a positive bid-ask spread even without asym-metric information about fundamentals. Similarly, snipingcauses the continuous limit order book market to be thin; thatis, it is especially expensive for investors to trade large quantitiesof stock. The reason is that sniping costs scale linearly with thequantity liquidity providers offer in the book—if quotes are stale,they will get sniped for the whole amount. Whereas the benefits ofproviding a deep book scale less than linearly—since only someinvestors wish to trade large amounts.4,5
4. Our source of costly liquidity provision should be viewed as incremental tothe usual sources of costly liquidity provision: inventory costs (Demsetz 1968; Stoll1978), asymmetric information (Copeland and Galai 1983; Glosten and Milgrom1985; Kyle 1985), and search costs (Duffie, Garleanu, and Pedersen 2005).Mechanically, our source of costly liquidity provision is most similar to that inCopeland and Galai (1983) and Glosten and Milgrom (1985)—we discuss the rela-tionship in detail in Section VI.C. Note too that while our model is extremely styl-ized, one thing we do not abstract from is the rules of the continuous limit order bookitself, whereas Glosten and Milgrom (1985) and subsequent market microstructureanalyses of limit order book markets use a discrete-time sequential-move modelingabstraction of the continuous limit order book. This abstraction is innocuous in thecontext of these prior works, but it precludes a race to respond to symmetricallyobserved public information as in our model.
5. A point of clarification: our claim is not that markets are less liquid todaythan before the rise of electronic trading and HFT; the empirical record is clear that
QUARTERLY JOURNAL OF ECONOMICS1554
at Serials Departm
ent on Decem
ber 23, 2015http://qje.oxfordjournals.org/
Dow
nloaded from
These arbitrage rents also induce a never-ending speed race.We modify our model to allow trading firms to invest in a simplespeed technology, which allows them to observe innovations in yfaster than trading firms who do not invest. With this modifica-tion, the arbitrage rents lead to a classic prisoner’s dilemma:snipers invest in speed to try to win the race to snipe stalequotes; liquidity providers invest in speed to try to get out ofthe way of the snipers; and all trading firms would be better offif they could collectively commit not to invest in speed, but it is ineach firm’s private interest to invest. Notably, competition inspeed does not fix the underlying problem of mechanical arbi-trages from symmetrically observed public information. Thesize of the arbitrage opportunity, and hence the harm to inves-tors via reduced liquidity, depends neither on the magnitude ofthe speed improvements (be they milliseconds, microseconds,nanoseconds, etc.), nor on the cost of cutting-edge speed technol-ogy (if speed costs get smaller over time there is simply moreentry). The arms race is thus an equilibrium constant of themarket design—a result that ties in closely with our empiricalfindings.
The third and final part of our article shows that frequentbatch auctions directly address the problems we have identifiedwith the continuous limit order book. Frequent batch auctionsmay sound like a very different market design from the continu-ous limit order book, but there are really just two differences.First, time is treated as a discrete variable instead of a continuousvariable.6 Second, orders are processed in batch instead ofserial—since multiple orders can arrive at the same (discrete)time—using a standard uniform-price auction. All other designdetails are similar. For instance, orders consist of a price, quan-tity, and direction and can be canceled or modified at any time;priority is price then (discrete) time; there is a well-defined bid-ask spread; and information policy is analogous: orders are
trading costs are lower today than in the pre-HFT era, though most of the benefitsappear to have been realized in the late 1990s and early 2000s (see Virtu 2014, p.103; Angel, Harris, and Spatt 2015, p. 23; Frazzini, Israel, and Moskowitz 2012,table IV). Rather, our claim is that markets are less liquid today than they would beunder an alternative market design that eliminated sniping. For further discussionsee Section VI.E.
6. This article does not characterize a specific optimal batch interval. SeeSection VII.D and Online Appendix B.3 for a discussion of what the presentpaper’s analysis does and does not teach us about the optimal batch interval.
THE HIGH-FREQUENCY TRADING ARMS RACE 1555
at Serials Departm
ent on Decem
ber 23, 2015http://qje.oxfordjournals.org/
Dow
nloaded from
received by the exchange, processed by the exchange (at the endof the discrete time interval, as opposed to continuously), andonly then announced publicly.
Together, the two key design differences—discrete time,and batch processing using a uniform-price auction—have twobeneficial effects. First, discrete time substantially reduces thevalue of a tiny speed advantage, which eliminates the armsrace. In the continuous-time market, if one trader is even 100microseconds faster than the next, then any time there is apublic price shock the faster trader wins the race to respond.In the discrete-time market, such a small speed advantagealmost never matters. Formally, if the batch interval is �,then a � speed advantage is only �
� as likely to matter as inthe continuous-time market. So, if the batch interval is 100milliseconds, then a 100 microsecond speed advantage is 1
1000as important. Second, and more subtly, the auction eliminatessniping by transforming the nature of competition. In the con-tinuous market, it is possible to earn a rent based on a piece ofinformation that many traders observe at basically the sametime (e.g., a jump in ES), because orders are processed inserial and someone is always first. In the frequent batch auc-tion market, by contrast, if multiple traders observe the sameinformation at the same time, they are forced to compete onprice instead of speed. It is no longer possible to earn a rentfrom symmetrically observed public information.
For both of these reasons, frequent batch auctions eliminatethe cost of liquidity provision in continuous limit order book mar-kets associated with stale quotes getting sniped. Intuitively, dis-crete time reduces the likelihood that a tiny speed advantageyields asymmetric information, and the auction ensures thatsymmetric information does not generate arbitrage rents.Batching also resolves the prisoner’s dilemma caused by the con-tinuous market, and in a manner that allocates the welfare sav-ings to investors. In equilibrium, relative to the continuous limitorder book, frequent batch auctions eliminate sniping, enhanceliquidity, and stop the HFT arms race.
We emphasize that the market design perspective we take inthis article sidesteps the ‘‘is HFT good or evil?’’ debate whichseems to animate much of the current discussion about HFTamong policy makers, the press, and market microstructure re-searchers. The market design perspective assumes that marketparticipants optimize with respect to market rules as given, but
QUARTERLY JOURNAL OF ECONOMICS1556
at Serials Departm
ent on Decem
ber 23, 2015http://qje.oxfordjournals.org/
Dow
nloaded from
takes seriously the possibility that the rules themselves areflawed. Many of the negative aspects of HFT that have garneredso much public attention are best understood as symptoms offlawed market design. However, the policy ideas that have beenmost prominent in response to concerns about HFT—for example,Tobin taxes, minimum resting times, message limits—attacksymptoms rather than address the root market design flaw: con-tinuous-time, serial-process trading. Frequent batch auctions di-rectly address the root flaw.
The rest of the article is organized as follows. Section IIdiscusses related literature. Section III briefly reviews therules of the continuous limit order book. Section IV describesour direct-feed data from NYSE and the CME. Section V pre-sents the empirical results on correlation breakdown and me-chanical arbitrage. Section VI presents the model and solvesfor and discusses the equilibrium of the continuous limit orderbook. Section VII analyzes frequent batch auctions, showswhy they directly address the problems with the continuousmarket, and discusses their equilibrium properties. SectionVIII uses our model to discuss alternative proposed responsesto the HFT arms race. Section IX discusses computationaladvantages of discrete-time trading over continuous-time trad-ing. Section X concludes. Online Appendix A provides backupmaterials for the empirical analysis. Online Appendix B pro-vides proofs and other backup materials for the theoreticalanalysis.
II. Related Literature
First, there is a well-known older academic literature on in-frequent batch auctions, for instance, three times per day (open,midday, and close). Important contributions to this literature in-clude Cohen and Schwartz (1989), Madhavan (1992), andEconomides and Schwartz (1995); see also Schwartz (2001) for abook treatment. We emphasize that the arguments for infrequentbatch auctions in this earlier literature are completely distinctfrom the arguments we make for frequent batch auctions. Ourargument focuses on eliminating sniping, encouraging competi-tion on price rather than speed, and stopping the arms race. Theearlier literature focused on enhancing the accuracy of price dis-covery by aggregating the dispersed information of investors into
THE HIGH-FREQUENCY TRADING ARMS RACE 1557
at Serials Departm
ent on Decem
ber 23, 2015http://qje.oxfordjournals.org/
Dow
nloaded from
a single price,7 and reducing intermediation costs by enablinginvestors to trade with each other directly. Perhaps the simplestway to think about the relationship between our work and thisearlier literature is as follows. Our work shows that there is adiscontinuous welfare and liquidity benefit from moving fromcontinuous time to discrete time—more precisely, from the con-tinuous-time serial-process limit order book market to discrete-time batch-process auctions. The earlier literature suggests thatthere might be additional further benefits to greatly lengtheningthe batch interval that are outside our model. But there are alsolikely to be important costs to such lengthening that are outsideour model and outside the models of this earlier literature as well.Developing a richer understanding of the costs of lengthening thetime between auctions is an important topic for future research.
We also note that our specific market design details differfrom those in this earlier literature, beyond simply the frequencywith which the auctions are conducted. Differences include infor-mation policy, the treatment of unexecuted orders, and time pri-ority rules; see Section VII.A for a full description.
Second, there are two recent papers, developed indepen-dently and contemporaneously8 from ours and coming fromdifferent methodological perspectives, that also make cases forfrequent batch auctions. Closest in spirit is Farmer andSkouras (2012), a policy paper commissioned by the UKGovernment’s Foresight Report. They, too, argue that continuoustrading leads to an arms race for speed, and that frequent batchauctions stop the arms race. There are three substantive differ-ences between our arguments. First, two conceptually importantideas that come out of our formal model are that arbitrage rentsare built in to the continuous limit order book market design, inthe sense that even symmetrically observed public informationcreates arbitrage opportunities due to serial processing, and thatthe auction eliminates these rents by transforming competitionon speed into competition on price. These two ideas are not iden-tified in Farmer and Skouras (2012). Second, the details of ourproposed market designs are substantively different. Our theory
7. In Economides and Schwartz (1995), the aggregation is achieved by con-ducting the auction at three significant points during the trading day (open,midday, and close). In Madhavan (1992) the aggregation is achieved by waitingfor a large number of investors with both private- and common-value information toarrive to market.
8. We began work on this project in October 2010.
QUARTERLY JOURNAL OF ECONOMICS1558
at Serials Departm
ent on Decem
ber 23, 2015http://qje.oxfordjournals.org/
Dow
nloaded from
identifies the key flaws of the continuous limit order book andshows that these flaws can be corrected by modifying only twothings: time is treated as discrete instead of continuous, andorders are processed in batch using an auction instead of serially.Farmer and Skouras (2012) depart more dramatically from thecontinuous limit order book, demarcating time using an expo-nential random variable and entirely eliminating time-basedpriority.9 Last, a primary concern of Farmer and Skouras(2012) is market stability, a topic we touch on only briefly inSection IX. Wah and Wellman (2013) make a case for frequentbatch auctions using a zero-intelligence (i.e., non–game theoretic)agent-based simulation model. In their simulation model, inves-tors have heterogeneous private values (costs) for buying (selling)a unit of a security, and use a mechanical strategy of bidding theirvalue (or offering at their cost). Batch auctions enhance efficiencyin their setup by aggregating supply and demand and executingtrades at the market-clearing price. Note that this is a similarargument in favor of frequent batch auctions as that associatedwith the older literature on infrequent batch auctions referencedpreviously. The reason that this force pushes towards frequentbatch auctions in Wah and Wellman (2013) is that their simula-tions utilize an extremely high discount rate of 6 basis points permillisecond.
Third, our paper relates to the burgeoning academic litera-ture on high-frequency trading; see Jones (2013), Biais andFoucault (2014), and O’Hara (2015) for recent surveys. Onefocus of this literature has been on the empirical study of theeffect of high-frequency trading on market quality, within thecontext of the current market design. Examples includeHendershott, Jones, and Menkveld (2011); Hasbrouck and Saar(2013); Brogaard, Hendershott, and Riordan (2014a,b); Foucault,Kozhan, and Tham (2014); and Menkveld and Zoican (2014). Wediscuss the relationship between our results and aspects of thisliterature in Section VI.E. Biais, Foucault, and Moinas (2015)study the equilibrium level of investment in speed technologyin the context of a Grossman-Stiglitz style rational expectations
9. There have been several other white papers and essays making cases forfrequent batch auctions, which to our knowledge were developed independentlyand roughly contemporaneously: Cinnober (2010); Sparrow (2012); McPartland(2015); ISN (2013); Schwartz and Wu (2013). In each case, either the proposedmarket design departs more dramatically from the continuous limit order bookthan ours or important design details are omitted.
THE HIGH-FREQUENCY TRADING ARMS RACE 1559
at Serials Departm
ent on Decem
ber 23, 2015http://qje.oxfordjournals.org/
Dow
nloaded from
model. They find that investment in speed can be socially exces-sive, as we do in our model, and argue for a Pigovian tax on speedtechnology as a policy response; see Section VIII.A for discussionof the traditional Tobin tax and the Biais, Foucault, and Moinas(2015) tax. The Nasdaq ‘‘SOES bandits’’ were an early incarna-tion of stale-quote snipers, in the context of a part-human part-electronic market design that had an unusual feature that wasexploited by the bandits—the prohibition of automated quote up-dates, which necessitated costly and imperfect human monitor-ing. See Foucault, Roell, and Sandas (2003) for a theoreticalanalysis and Harris and Schultz (1998) for empirical facts.Further discussion of other related work from this literature isincorporated into the body of the article.
Fourth, this article is in the tradition of the academic litera-ture on market design. This literature focuses on designing the‘‘rules of the game’’ in real-world markets to achieve objectivessuch as economic efficiency. Examples of markets that have beendesigned by economists include auction markets for wirelessspectrum licenses and the market for matching medical schoolgraduates to residency positions. See Klemperer (2004) andMilgrom (2004, 2011) for surveys of the market design literatureon auction markets and Roth (2002, 2008) for surveys on themarket design literature on matching markets. Some papers inthis literature that are conceptually related to ours, albeit focusedon different market settings, are Roth and Xing (1994) on thetiming of transactions, Roth and Xing (1997) on serial versusbatch processing, and Roth and Ockenfels (2002) on bid sniping.
Last, several of the ideas in our critique of the continuouslimit order book are new versions of classical ideas. Correlationbreakdown is an extreme version of a phenomenon first docu-mented by Epps (1979); see Section V for further discussion.Sniping, and its negative effect on liquidity, is closely related toGlosten and Milgrom (1985) adverse selection; see Section VI.C,which discusses this relationship in detail. The idea that financialmarkets can induce inefficient speed competition traces at least toHirshleifer (1971); in fact, our model clarifies that in the contin-uous market fast traders can earn a rent even from informationthat they observe at exactly the same time as other fast traders,which can be viewed as the logical extreme of what Hirshleifer(1971) called ‘‘foreknowledge’’ rents.
QUARTERLY JOURNAL OF ECONOMICS1560
at Serials Departm
ent on Decem
ber 23, 2015http://qje.oxfordjournals.org/
Dow
nloaded from

III. Brief Description of the Continuous Limit
Order Book
In this section we summarize the rules of the continuouslimit order book market design. Readers familiar with theserules can skip this section. Readers interested in further detailsshould consult Harris (2002).
The basic building block of this market design is thelimit order. A limit order specifies a price, a quantity, andwhether the order is to buy or sell, for example, ‘‘buy 100shares of XYZ at $100.00.’’ Traders may submit limit orders tothe market at any time during the trading day, and they mayfully or partially withdraw their outstanding limit orders at anytime.
The set of limit orders outstanding at any particular momentis known as the limit order book. Outstanding orders to buy arecalled bids and outstanding orders to sell are called asks. Thedifference between the best (highest) bid and the best (lowest)ask is known as the bid-ask spread.
Trade occurs whenever a new limit order is submitted that iseither a buy order with a price weakly greater than the currentbest ask or a sell order with a price weakly smaller than the cur-rent best bid. In this case, the new limit order is interpreted aseither fully or partially accepting one or more outstanding asks.Orders are accepted in order of the attractiveness of their price,with ties broken based on which order has been in the book thelongest; this is known as price-time priority. For example, if thereare outstanding asks to sell 1,000 shares at $100.01 and 1,000shares at $100.02, a limit order to buy 1,500 shares at $100.02 (orgreater) would get filled by trading all 1,000 shares at $100.01,and then by trading the 500 shares at $100.02 that have been inthe book the longest. A limit order to buy 1,500 shares at $100.01would get partially filled, by trading 1,000 shares at $100.01, withthe remainder of the order remaining outstanding in the limitorder book (500 shares at $100.01).
Observe that order submissions and order withdrawals areprocessed by the exchange in serial, that is, one at a time in orderof their receipt. This serial-processing feature of the continuouslimit order book plays an important role in the theoretical anal-ysis in Section VI.
In practice, there are many other order types that traderscan use in addition to limit orders. These include market orders,
THE HIGH-FREQUENCY TRADING ARMS RACE 1561
at Serials Departm
ent on Decem
ber 23, 2015http://qje.oxfordjournals.org/
Dow
nloaded from
stop-loss orders, immediate-or-cancel, and dozens of others thatare considerably more obscure (e.g., Patterson and Strasburg2012; Nanex 2012). These alternative order types are ultimatelyjust proxy instructions to the exchange for the generation of limitorders. For instance, a market order is an instruction to the ex-change to place a limit order whose price is such that it executesimmediately, given the state of the limit order book at the timethe message is processed.
IV. Data
We use ‘‘direct-feed’’ data from the Chicago MercantileExchange (CME) and New York Stock Exchange (NYSE).Direct-feed data record all activity that occurs in an exchange’slimit order book, message by message, with millisecond resolu-tion timestamps assigned to each message by the exchange at thetime the message is processed.10 Practitioners who demand thelowest latency data (e.g., high-frequency traders) use this direct-feed data in real time to construct the limit order book.
The CME data set is called CME Globex DataMine MarketDepth. Our data cover all limit order book activity for the E-miniS&P 500 Futures Contract (ticker ES) over the period of January1, 2005–December 31, 2011. The NYSE data set is called TAQNYSE ArcaBook. While this data covers all U.S. equities tradedon NYSE, we focus most of our attention on the SPDR S&P 500exchange traded fund (ticker SPY). Our data cover the period ofJanuary 1, 2005–December 31, 2011, with the exception of athree-month gap from 5/30/2007 to 8/28/2007 resulting fromdata issues acknowledged to us by the NYSE data team. Wealso drop, from both data sets, the Thursday and Friday fromthe week prior to expiration for every ES expiration month(March, June, September, December) due to the rolling over ofthe front month contract, half days (e.g., day after Thanksgiving),and a small number of days in which either data set’s zip file iscorrupted or truncated. We are left with 1,560 trading days intotal.
10. Prior to November 2008, the CME datafeed product did not populate themillisecond field for time stamps, so the resolution was actually centisecond notmillisecond. CME recently announced that the next iteration of its datafeed productwill be at microsecond resolution.
QUARTERLY JOURNAL OF ECONOMICS1562
at Serials Departm
ent on Decem
ber 23, 2015http://qje.oxfordjournals.org/
Dow
nloaded from

Each message in direct-feed data represents a change in theorder book at that moment in time. It is the subscriber’s respon-sibility to construct the limit order book from this feed, maintainthe status of every order in the book, and update the internallimit order book based on incoming messages. In order to inter-pret raw data messages reported from each feed, we write a feedparser for each raw data format and update the state of the orderbook after every new message.
We emphasize that direct feed data are distinct from the con-solidated feeds that aggregate data from individual exchanges. Inparticular, the TAQ NYSE ArcaBook data set is distinct from themore familiar TAQ NYSE Daily data set (sometimes simply re-ferred to as TAQ), which is an aggregation of orders and tradesfrom all Consolidated Tape Association exchanges. The TAQdata is comprehensive in regard to trades and quotes listed atall participant exchanges, which includes the major electronicexchanges BATS, NASDAQ, and NYSE and also small exchangessuch as the Chicago Stock Exchange. However, practitioners esti-mate that the TAQ’s timestamps are substantially delayed relativeto the direct-feed data that comes directly from the exchanges (ourown informal comparisons confirm this; see also Ding, Hanna, andHendershott 2014). One source of delay is that the TAQ’s time-stamps do not come directly from the exchanges’ order matchingengines. A second source of delay is the aggregation of data fromseveral different exchanges, with the smaller exchanges consid-ered especially likely to be a source of delay. The key advantageof our direct-feed data is that the time stamps are as accurate aspossible. In particular, these are the same data that HFT firmssubscribe to and process in real time to make trading decisions.
V. Correlation Breakdown and Mechanical Arbitrage
In this section we report two sets of stylized facts about howcontinuous limit order book markets behave at high-frequencytime horizons. First, we show that correlations completelybreak down at high-enough frequency. Second, we show thatthere are frequent mechanical arbitrage opportunities associatedwith this correlation breakdown, which are available to which-ever trader acts fastest.
For each result we first present summary statistics and thenexplore how the phenomenon has evolved over the time periodof our data, 2005–2011. The summary statistics give a sense of
THE HIGH-FREQUENCY TRADING ARMS RACE 1563
at Serials Departm
ent on Decem
ber 23, 2015http://qje.oxfordjournals.org/
Dow
nloaded from

magnitudes for what we depicted anecdotally in Figure I. Thetime-series evidence suggests that correlation breakdown andmechanical arbitrage are intrinsic features of the continuouslimit order book market, rather than market failures that arecompeted away over time.
Before proceeding, we emphasize that the finding that corre-lations break down at high-enough frequency—which is an ex-treme version of a phenomenon discovered by Epps (1979)11—isobvious from introspection alone, at least ex post. There is noth-ing in current market architecture—in which each financial in-strument trades in continuous time on its own separate limit-order book, rather than in a single combinatorial auction mar-ket—that would allow different instruments’ prices to move atexactly the same time.
V.A. Correlation Breakdown
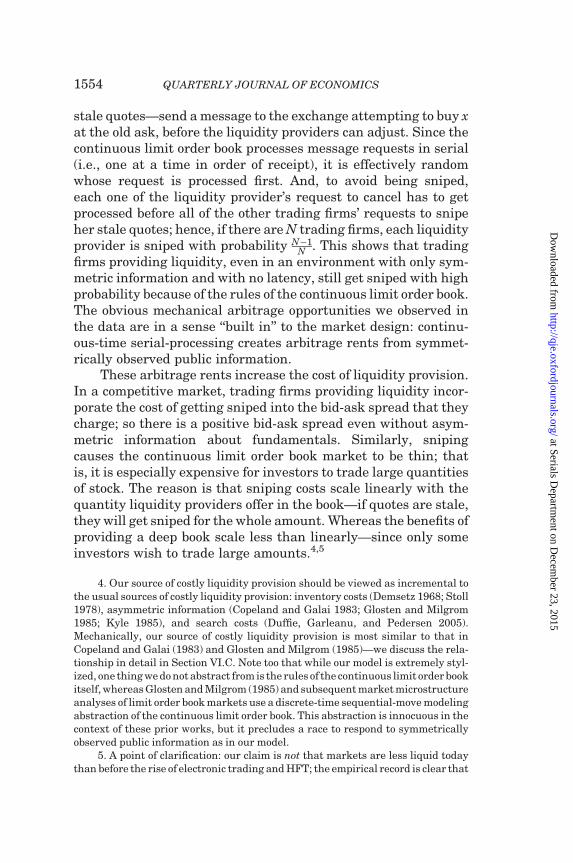
1. Summary Statistics. Figure II displays the median, min,and max daily return correlation between ES and SPY for timeintervals ranging from 1 millisecond to 60 seconds, for our 2011data, under our main specification for computing correlation. Inthis main specification, we compute the correlation of percentagechanges in the equal-weighted midpoint of the ES and SPY bidand ask, and ignore speed-of-light issues. As can be seen from thefigure, the correlation between ES and SPY is nearly 1 at long-enough intervals,12 but breaks down at high-frequency time in-tervals. The 10 millisecond correlation is just 0.1016, and the 1millisecond correlation is just 0.0080.
We consider several other specifications for computing theES-SPY correlation in Online Appendix A.1.1. We also examinecorrelations for pairs of related equity securities in Online
11. Epps (1979) found that equity market correlations among stocks in the sameindustry (e.g., Ford-GM) were much lower over short time intervals than overlonger time intervals; in that era, ‘‘very short’’ meant 10 minutes, and long meanta few days.
12. It may seem surprising at first that the ES-SPY correlation does not ap-proach 1 even faster. An important issue to keep in mind, however, is that ES andSPY trade on discrete price grids with different tick sizes: ES tick sizes are 0.25index points, whereas SPY tick sizes are 0.10 index points. As a result, smallchanges in the fundamental value of the S&P 500 index manifest differently inthe two markets, due to what are essentially rounding issues. At long time horizonsthese rounding issues are negligible relative to changes in fundamentals, but atshorter frequencies these rounding issues are important, and keep correlationsaway from 1.
QUARTERLY JOURNAL OF ECONOMICS1564
at Serials Departm
ent on Decem
ber 23, 2015http://qje.oxfordjournals.org/
Dow
nloaded from
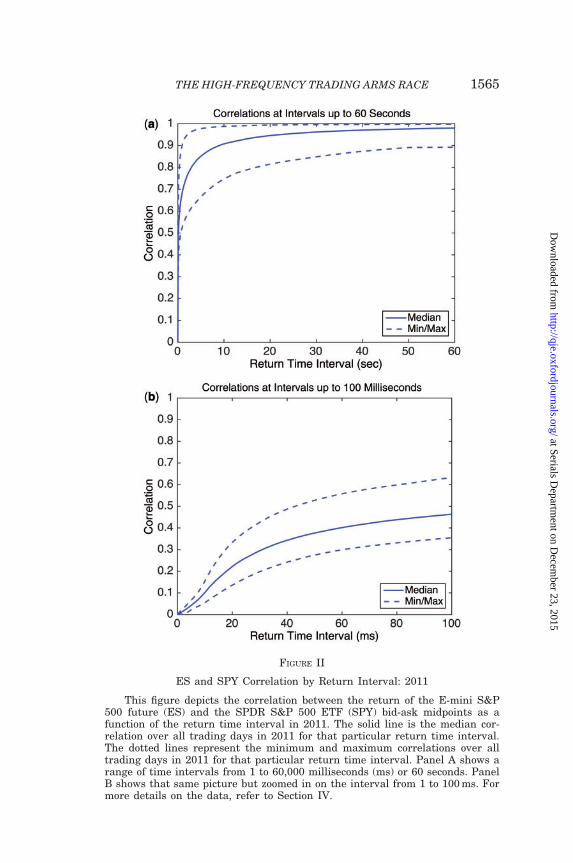
FIGURE II
ES and SPY Correlation by Return Interval: 2011
This figure depicts the correlation between the return of the E-mini S&P500 future (ES) and the SPDR S&P 500 ETF (SPY) bid-ask midpoints as afunction of the return time interval in 2011. The solid line is the median cor-relation over all trading days in 2011 for that particular return time interval.The dotted lines represent the minimum and maximum correlations over alltrading days in 2011 for that particular return time interval. Panel A shows arange of time intervals from 1 to 60,000 milliseconds (ms) or 60 seconds. PanelB shows that same picture but zoomed in on the interval from 1 to 100 ms. Formore details on the data, refer to Section IV.
THE HIGH-FREQUENCY TRADING ARMS RACE 1565
at Serials Departm
ent on Decem
ber 23, 2015http://qje.oxfordjournals.org/
Dow
nloaded from

Appendix A.1.2, for which speed-of-light issues do not arise sincethey trade in the same physical location. In all cases, correlationsbreak down at high frequency.
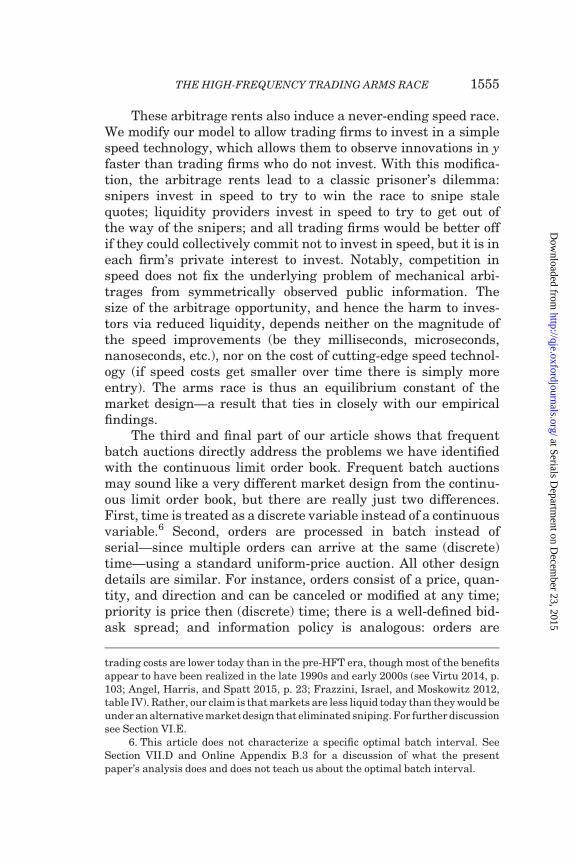
2. Correlation Breakdown over Time. Figure III displays theES-SPY correlation versus time interval curve that we depictedabove as II, Panel b, but separately for each year in the timeperiod 2005–2011 that is covered in our data. As can be seenin the figure, the market has gotten faster over time in thesense that economically meaningful correlations emerge morequickly in the later years of our data than in the earlier years.For instance, in 2011 the ES-SPY correlation reaches 0.50 at a142-millisecond interval, whereas in 2005 the ES-SPY correlationonly reaches 0.50 at a 2.6-second interval. However, in all yearscorrelations are essentially zero at high enough frequency.
FIGURE III
ES and SPY Correlation Breakdown over Time: 2005–2011
This figure depicts the correlation between the return of the E-mini S&P500 future (ES) and the SPDR S&P 500 ETF (SPY) bid-ask midpoints as afunction of the return time interval for every year from 2005 to 2011. Eachline depicts the median correlation over all trading days in a particular year,taken over each return time interval from 1 to 100 milliseconds. For 2005–2008the CME data is only at 10 milliseconds resolution, so we compute the mediancorrelation for each multiple of 10 milliseconds and then fit a cubic spline. Formore details on the data, refer to Section IV.
QUARTERLY JOURNAL OF ECONOMICS1566
at Serials Departm
ent on Decem
ber 23, 2015http://qje.oxfordjournals.org/
Dow
nloaded from

V.B. Mechanical Arbitrage
1. Computing the ES-SPY Arbitrage. Conceptually, our goal isto identify all of the ES-SPY arbitrage opportunities in our data inthe spirit of the example shown in Figure I, Panel D—buy cheapand sell expensive when one instrument has jumped and theother has yet to react—and for each such opportunity measureits profitability and duration. The full details of our method fordoing this are in Online Appendix A.2.1. Here, we mention themost important points.
First, there is a difference in levels between the two instru-ments, called the spread. The spread arises from three sources:ES is larger than SPY by a term that represents the carrying costof the S&P 500 index until the ES contract’s expiration date; SPYis larger than ES by a term that represents S&P 500 dividends,which SPY holders receive and ES holders do not; and the basketof stocks in the ETF typically differs slightly from the basket ofstocks in the S&P 500 index, called ETF tracking error. Our ar-bitrage computation assumes that at high-frequency time hori-zons, changes in the ES-SPY spread are mostly driven not bychanges in these persistent factors but instead by temporarynoise, that is, by correlation breakdown. We then assess the va-lidity of this assumption empirically by classifying as ‘‘bad arbs’’anything that looks like an arbitrage opportunity to our compu-tational procedure but turns out to be a persistent change in thelevel of the ES-SPY spread, for example, due to a change in short-term interest rates.
Second, while Figure I depicts bid-ask midpoints, in comput-ing the arbitrage opportunity we assume that the trader buys thecheaper instrument at its ask while selling the more expensiveinstrument at its bid (with cheap and expensive defined relativeto the difference in levels). That is, the trader pays bid-ask spreadcosts in both markets.13 Our arbitrageur only initiates a tradewhen the expected profit from doing so, accounting for bid-ask
13. This is a simple and transparent estimate of transactions costs. A richerestimate would account for the fact that the trader might not need to pay half thebid-ask spread in both ES and SPY, which would lower costs, and would account forexchange fees and rebates, which on net would increase costs. As an example, ahigh-frequency trader who detects a jump in the price of ES that makes the price ofSPY stale might trade instantaneously in SPY at the stale prices, paying half thebid-ask spread plus an exchange fee, but might seek to trade in ES at its new price asa liquidity provider, in which case he would earn rather than pay half the bid-askspread.
THE HIGH-FREQUENCY TRADING ARMS RACE 1567
at Serials Departm
ent on Decem
ber 23, 2015http://qje.oxfordjournals.org/
Dow
nloaded from
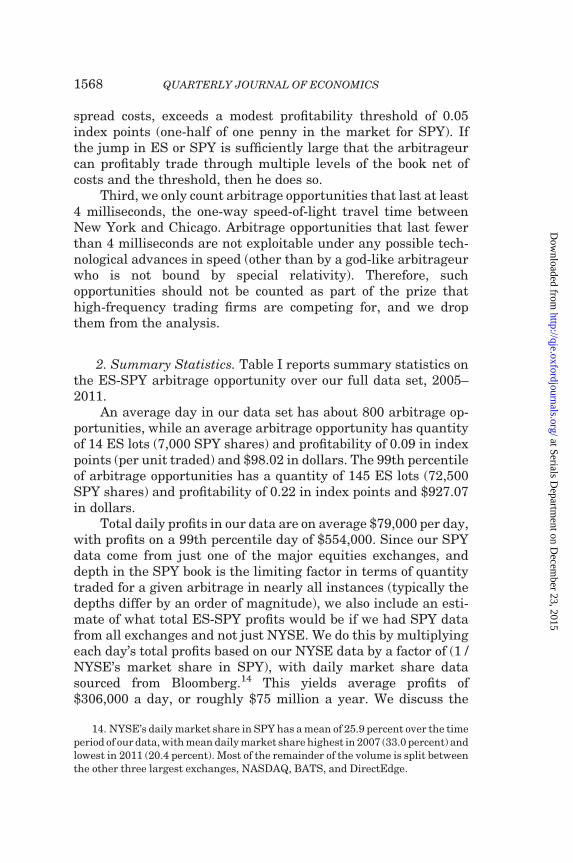
spread costs, exceeds a modest profitability threshold of 0.05index points (one-half of one penny in the market for SPY). Ifthe jump in ES or SPY is sufficiently large that the arbitrageurcan profitably trade through multiple levels of the book net ofcosts and the threshold, then he does so.
Third, we only count arbitrage opportunities that last at least4 milliseconds, the one-way speed-of-light travel time betweenNew York and Chicago. Arbitrage opportunities that last fewerthan 4 milliseconds are not exploitable under any possible tech-nological advances in speed (other than by a god-like arbitrageurwho is not bound by special relativity). Therefore, suchopportunities should not be counted as part of the prize thathigh-frequency trading firms are competing for, and we dropthem from the analysis.
2. Summary Statistics. Table I reports summary statistics onthe ES-SPY arbitrage opportunity over our full data set, 2005–2011.
An average day in our data set has about 800 arbitrage op-portunities, while an average arbitrage opportunity has quantityof 14 ES lots (7,000 SPY shares) and profitability of 0.09 in indexpoints (per unit traded) and $98.02 in dollars. The 99th percentileof arbitrage opportunities has a quantity of 145 ES lots (72,500SPY shares) and profitability of 0.22 in index points and $927.07in dollars.
Total daily profits in our data are on average $79,000 per day,with profits on a 99th percentile day of $554,000. Since our SPYdata come from just one of the major equities exchanges, anddepth in the SPY book is the limiting factor in terms of quantitytraded for a given arbitrage in nearly all instances (typically thedepths differ by an order of magnitude), we also include an esti-mate of what total ES-SPY profits would be if we had SPY datafrom all exchanges and not just NYSE. We do this by multiplyingeach day’s total profits based on our NYSE data by a factor of (1 /NYSE’s market share in SPY), with daily market share datasourced from Bloomberg.14 This yields average profits of$306,000 a day, or roughly $75 million a year. We discuss the
14. NYSE’s daily market share in SPY has a mean of 25.9 percent over the timeperiod of our data, with mean daily market share highest in 2007 (33.0 percent) andlowest in 2011 (20.4 percent). Most of the remainder of the volume is split betweenthe other three largest exchanges, NASDAQ, BATS, and DirectEdge.
QUARTERLY JOURNAL OF ECONOMICS1568
at Serials Departm
ent on Decem
ber 23, 2015http://qje.oxfordjournals.org/
Dow
nloaded from

total size of the arbitrage opportunity in more detail below inSection V.C.
The majority (88.56 percent) of the arbitrage opportunities inour data set are initiated by a price change in ES, with the re-maining 11.44 percent initiated by a price change in SPY. Thatthe large majority of arbitrage opportunities are initiated by ES isconsistent with the practitioner perception that the ES market isthe center for price discovery in the S&P 500 index, as well aswith our finding in Online Appendix Table A.1 that correlationsare higher when we treat the New York market as laggingChicago than when we treat the Chicago market as laggingNew York or treat the two markets equally.
Nearly all (99.99 percent) of the arbitrage opportunities weidentify are ‘‘good arbs,’’ meaning that deviations of the ES-SPYspread from our estimate of fair value that are large enough totrigger an arbitrage nearly always reverse within a modestamount of time. This is one indication that our method of com-puting the ES-SPY arbitrage opportunity is sensible.
3. Mechanical Arbitrage over Time: 2005–2011. In this subsec-tion we explore how the ES-SPY arbitrage opportunity hasevolved over time.
TABLE I
ES-SPY ARBITRAGE SUMMARY STATISTICS, 2005–2011
Percentile
Mean 1 5 25 50 75 95 99
# of arbs/day 801 118 173 285 439 876 2498 5353Per arb quantity (ES lots) 13.83 0.20 0.20 1.25 4.20 11.99 52.00 145.00Per arb profits (index pts) 0.09 0.05 0.05 0.06 0.08 0.11 0.15 0.22Per arb profits ($) 98.02 0.59 1.08 5.34 17.05 50.37 258.07 927.07Total daily profits,
NYSE data ($)79 k 5 k 9 k 18 k 33 k 57 k 204 k 554 k
Total daily profits,all exchanges ($)
306 k 27 k 39 k 75 k 128 k 218 k 756 k 2,333 k
% ES initiated 88.56% good arbs 99.99% buy vs. sell 49.77
Notes. This table shows the mean and various percentiles of arbitrage variables from the mechanicaltrading strategy between the E-mini S&P 500 future (ES) and the SPDR S&P 500 ETF (SPY) described inSection V.B and Online Appendix A.2.1. The data, described in Section IV, cover January 2005 toDecember 2011. Variables are described in the text of Section V.B.
THE HIGH-FREQUENCY TRADING ARMS RACE 1569
at Serials Departm
ent on Decem
ber 23, 2015http://qje.oxfordjournals.org/
Dow
nloaded from
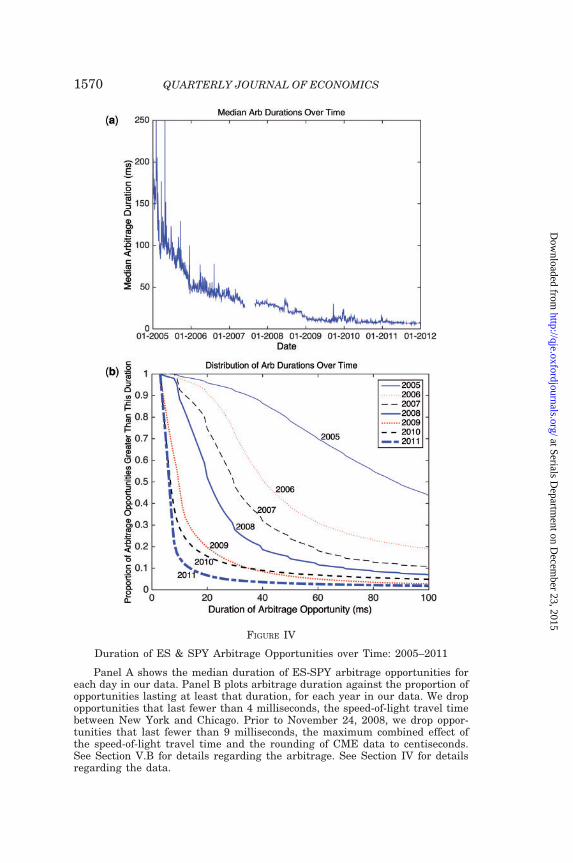
FIGURE IV
Duration of ES & SPY Arbitrage Opportunities over Time: 2005–2011
Panel A shows the median duration of ES-SPY arbitrage opportunities foreach day in our data. Panel B plots arbitrage duration against the proportion ofopportunities lasting at least that duration, for each year in our data. We dropopportunities that last fewer than 4 milliseconds, the speed-of-light travel timebetween New York and Chicago. Prior to November 24, 2008, we drop oppor-tunities that last fewer than 9 milliseconds, the maximum combined effect ofthe speed-of-light travel time and the rounding of CME data to centiseconds.See Section V.B for details regarding the arbitrage. See Section IV for detailsregarding the data.
QUARTERLY JOURNAL OF ECONOMICS1570
at Serials Departm
ent on Decem
ber 23, 2015http://qje.oxfordjournals.org/
Dow
nloaded from
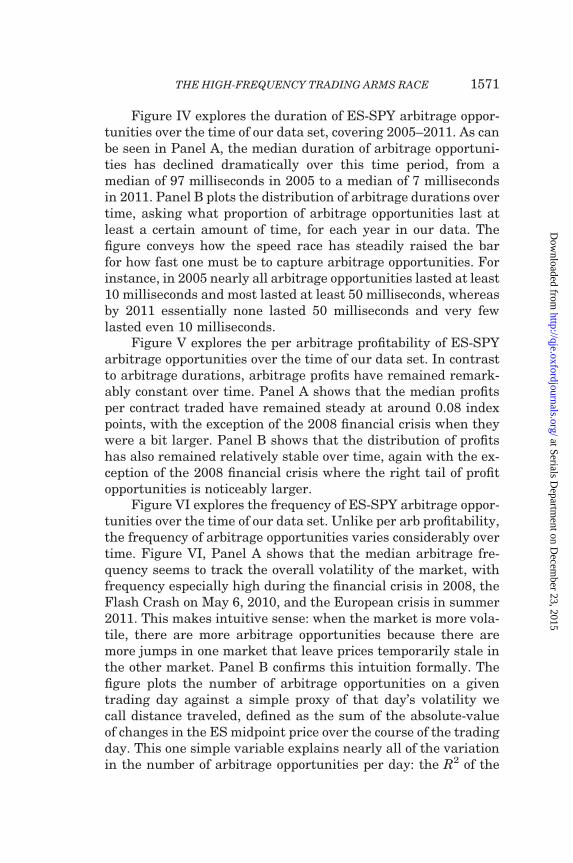
Figure IV explores the duration of ES-SPY arbitrage oppor-tunities over the time of our data set, covering 2005–2011. As canbe seen in Panel A, the median duration of arbitrage opportuni-ties has declined dramatically over this time period, from amedian of 97 milliseconds in 2005 to a median of 7 millisecondsin 2011. Panel B plots the distribution of arbitrage durations overtime, asking what proportion of arbitrage opportunities last atleast a certain amount of time, for each year in our data. Thefigure conveys how the speed race has steadily raised the barfor how fast one must be to capture arbitrage opportunities. Forinstance, in 2005 nearly all arbitrage opportunities lasted at least10 milliseconds and most lasted at least 50 milliseconds, whereasby 2011 essentially none lasted 50 milliseconds and very fewlasted even 10 milliseconds.
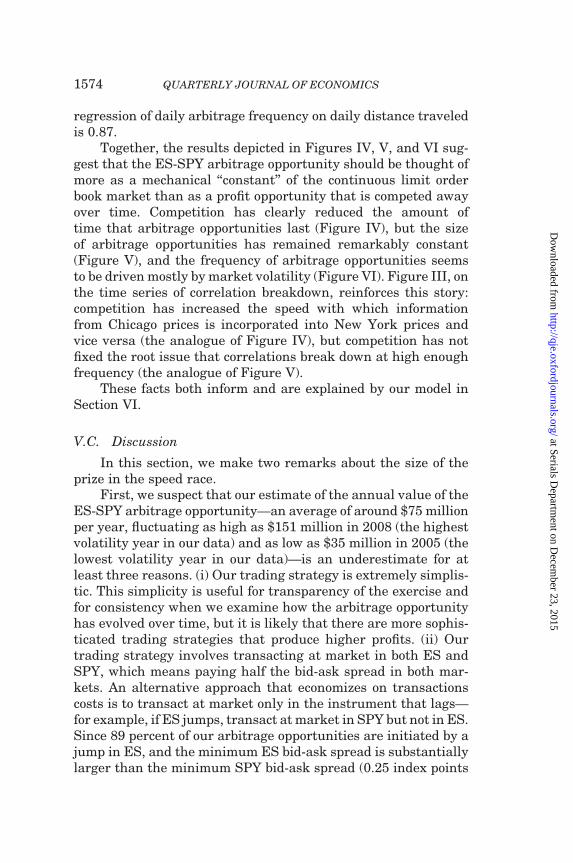
Figure V explores the per arbitrage profitability of ES-SPYarbitrage opportunities over the time of our data set. In contrastto arbitrage durations, arbitrage profits have remained remark-ably constant over time. Panel A shows that the median profitsper contract traded have remained steady at around 0.08 indexpoints, with the exception of the 2008 financial crisis when theywere a bit larger. Panel B shows that the distribution of profitshas also remained relatively stable over time, again with the ex-ception of the 2008 financial crisis where the right tail of profitopportunities is noticeably larger.
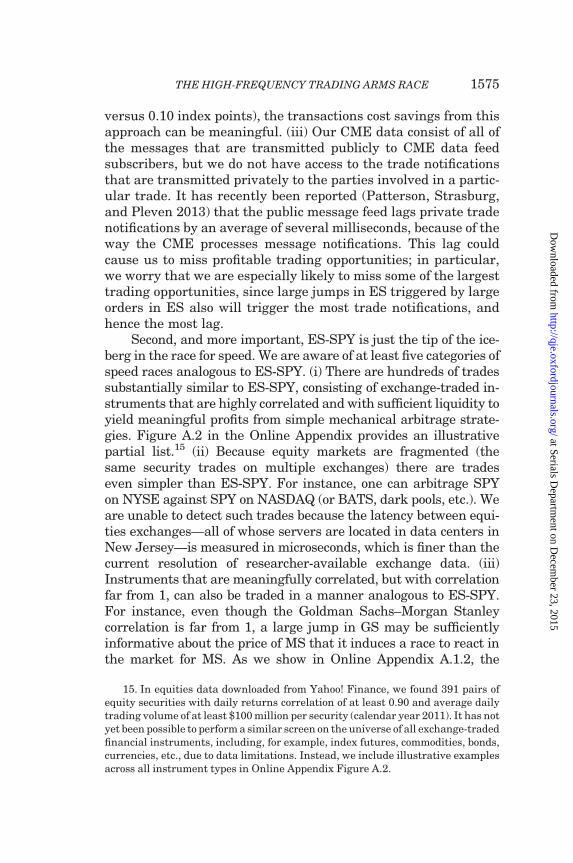
Figure VI explores the frequency of ES-SPY arbitrage oppor-tunities over the time of our data set. Unlike per arb profitability,the frequency of arbitrage opportunities varies considerably overtime. Figure VI, Panel A shows that the median arbitrage fre-quency seems to track the overall volatility of the market, withfrequency especially high during the financial crisis in 2008, theFlash Crash on May 6, 2010, and the European crisis in summer2011. This makes intuitive sense: when the market is more vola-tile, there are more arbitrage opportunities because there aremore jumps in one market that leave prices temporarily stale inthe other market. Panel B confirms this intuition formally. Thefigure plots the number of arbitrage opportunities on a giventrading day against a simple proxy of that day’s volatility wecall distance traveled, defined as the sum of the absolute-valueof changes in the ES midpoint price over the course of the tradingday. This one simple variable explains nearly all of the variationin the number of arbitrage opportunities per day: the R2 of the
THE HIGH-FREQUENCY TRADING ARMS RACE 1571
at Serials Departm
ent on Decem
ber 23, 2015http://qje.oxfordjournals.org/
Dow
nloaded from
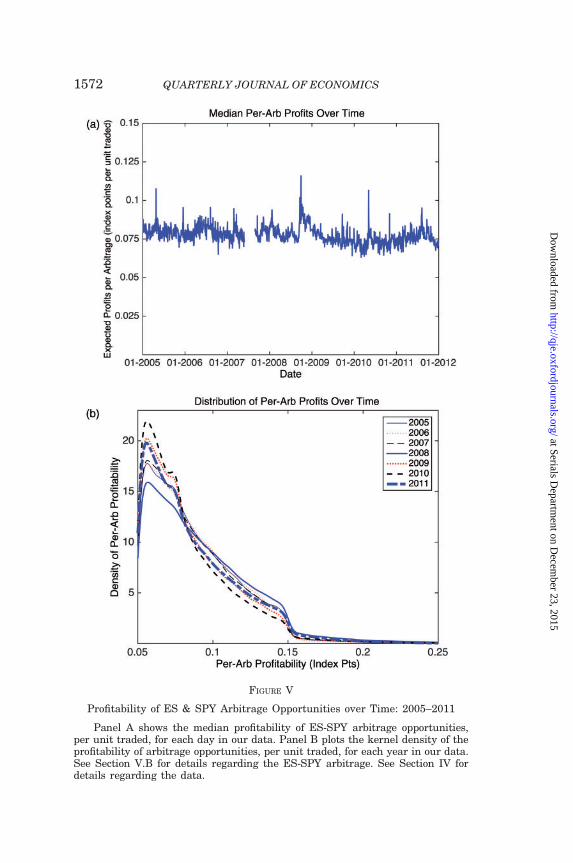
FIGURE V
Profitability of ES & SPY Arbitrage Opportunities over Time: 2005–2011
Panel A shows the median profitability of ES-SPY arbitrage opportunities,per unit traded, for each day in our data. Panel B plots the kernel density of theprofitability of arbitrage opportunities, per unit traded, for each year in our data.See Section V.B for details regarding the ES-SPY arbitrage. See Section IV fordetails regarding the data.
QUARTERLY JOURNAL OF ECONOMICS1572
at Serials Departm
ent on Decem
ber 23, 2015http://qje.oxfordjournals.org/
Dow
nloaded from
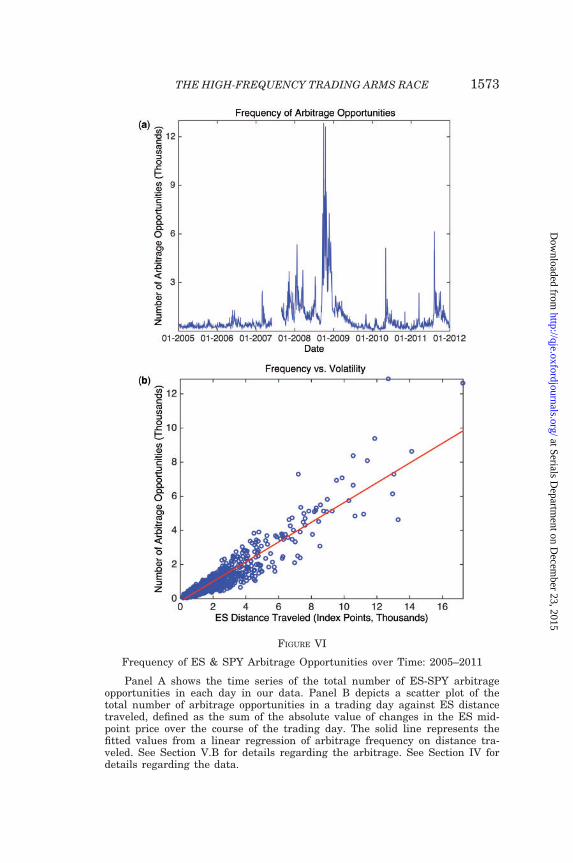
FIGURE VI
Frequency of ES & SPY Arbitrage Opportunities over Time: 2005–2011
Panel A shows the time series of the total number of ES-SPY arbitrageopportunities in each day in our data. Panel B depicts a scatter plot of thetotal number of arbitrage opportunities in a trading day against ES distancetraveled, defined as the sum of the absolute value of changes in the ES mid-point price over the course of the trading day. The solid line represents thefitted values from a linear regression of arbitrage frequency on distance tra-veled. See Section V.B for details regarding the arbitrage. See Section IV fordetails regarding the data.
THE HIGH-FREQUENCY TRADING ARMS RACE 1573
at Serials Departm
ent on Decem
ber 23, 2015http://qje.oxfordjournals.org/
Dow
nloaded from
regression of daily arbitrage frequency on daily distance traveledis 0.87.
Together, the results depicted in Figures IV, V, and VI sug-gest that the ES-SPY arbitrage opportunity should be thought ofmore as a mechanical ‘‘constant’’ of the continuous limit orderbook market than as a profit opportunity that is competed awayover time. Competition has clearly reduced the amount oftime that arbitrage opportunities last (Figure IV), but the sizeof arbitrage opportunities has remained remarkably constant(Figure V), and the frequency of arbitrage opportunities seemsto be driven mostly by market volatility (Figure VI). Figure III, onthe time series of correlation breakdown, reinforces this story:competition has increased the speed with which informationfrom Chicago prices is incorporated into New York prices andvice versa (the analogue of Figure IV), but competition has notfixed the root issue that correlations break down at high enoughfrequency (the analogue of Figure V).
These facts both inform and are explained by our model inSection VI.
V.C. Discussion
In this section, we make two remarks about the size of theprize in the speed race.
First, we suspect that our estimate of the annual value of theES-SPY arbitrage opportunity—an average of around $75 millionper year, fluctuating as high as $151 million in 2008 (the highestvolatility year in our data) and as low as $35 million in 2005 (thelowest volatility year in our data)—is an underestimate for atleast three reasons. (i) Our trading strategy is extremely simplis-tic. This simplicity is useful for transparency of the exercise andfor consistency when we examine how the arbitrage opportunityhas evolved over time, but it is likely that there are more sophis-ticated trading strategies that produce higher profits. (ii) Ourtrading strategy involves transacting at market in both ES andSPY, which means paying half the bid-ask spread in both mar-kets. An alternative approach that economizes on transactionscosts is to transact at market only in the instrument that lags—for example, if ES jumps, transact at market in SPY but not in ES.Since 89 percent of our arbitrage opportunities are initiated by ajump in ES, and the minimum ES bid-ask spread is substantiallylarger than the minimum SPY bid-ask spread (0.25 index points
QUARTERLY JOURNAL OF ECONOMICS1574
at Serials Departm
ent on Decem
ber 23, 2015http://qje.oxfordjournals.org/
Dow
nloaded from
versus 0.10 index points), the transactions cost savings from thisapproach can be meaningful. (iii) Our CME data consist of all ofthe messages that are transmitted publicly to CME data feedsubscribers, but we do not have access to the trade notificationsthat are transmitted privately to the parties involved in a partic-ular trade. It has recently been reported (Patterson, Strasburg,and Pleven 2013) that the public message feed lags private tradenotifications by an average of several milliseconds, because of theway the CME processes message notifications. This lag couldcause us to miss profitable trading opportunities; in particular,we worry that we are especially likely to miss some of the largesttrading opportunities, since large jumps in ES triggered by largeorders in ES also will trigger the most trade notifications, andhence the most lag.
Second, and more important, ES-SPY is just the tip of the ice-berg in the race for speed. We are aware of at least five categories ofspeed races analogous to ES-SPY. (i) There are hundreds of tradessubstantially similar to ES-SPY, consisting of exchange-traded in-struments that are highly correlated and with sufficient liquidity toyield meaningful profits from simple mechanical arbitrage strate-gies. Figure A.2 in the Online Appendix provides an illustrativepartial list.15 (ii) Because equity markets are fragmented (thesame security trades on multiple exchanges) there are tradeseven simpler than ES-SPY. For instance, one can arbitrage SPYon NYSE against SPY on NASDAQ (or BATS, dark pools, etc.). Weare unable to detect such trades because the latency between equi-ties exchanges—all of whose servers are located in data centers inNew Jersey—is measured in microseconds, which is finer than thecurrent resolution of researcher-available exchange data. (iii)Instruments that are meaningfully correlated, but with correlationfar from 1, can also be traded in a manner analogous to ES-SPY.For instance, even though the Goldman Sachs–Morgan Stanleycorrelation is far from 1, a large jump in GS may be sufficientlyinformative about the price of MS that it induces a race to react inthe market for MS. As we show in Online Appendix A.1.2, the
15. In equities data downloaded from Yahoo! Finance, we found 391 pairs ofequity securities with daily returns correlation of at least 0.90 and average dailytrading volume of at least $100 million per security (calendar year 2011). It has notyet been possible to perform a similar screen on the universe of all exchange-tradedfinancial instruments, including, for example, index futures, commodities, bonds,currencies, etc., due to data limitations. Instead, we include illustrative examplesacross all instrument types in Online Appendix Figure A.2.
THE HIGH-FREQUENCY TRADING ARMS RACE 1575
at Serials Departm
ent on Decem
ber 23, 2015http://qje.oxfordjournals.org/
Dow
nloaded from
equities market correlation matrix breaks down at high frequency,suggesting that such trading opportunities—whether they involvepairs of stocks or simple statistical relationships among sets ofstocks—may be important. (iv) There is a race to respond topublic news events such as Fed announcements, the release of im-portant government statistics, the posting of corporate SEC filings,and so on. In this race, the precise effect of the public news on assetprices is often hard to determine at high frequency, but the sign andrough magnitude of the news can be determined quickly (Rogers,Skinner, and Zechman 2014). (v) In addition to the race to snipestale quotes, there is also a race among liquidity providers to the topof the book (see Moallemi 2014; Yao and Ye 2014). This last race isan artifact of the minimum tick increment imposed by regulatorsand/or exchanges.
While we hesitate, in the context of the present article, to puta precise estimate on the total prize at stake in the arms race,back-of-the-envelope extrapolation from our ES-SPY estimatessuggests that the annual sums are substantial.
VI. Model: Critique of the Continuous Limit Order Book
We have established three empirical facts about continuouslimit order book markets. First, correlations completely breakdown at high-enough frequency, even for financial instrumentsthat are nearly perfectly correlated at longer frequencies. Second,this correlation breakdown is associated with frequent mechani-cal arbitrage opportunities, available to whoever wins the race toexploit them. Third, the prize in the arms race seems to be morelike a constant than something that is competed away over time.
We now develop a purposefully simple model that is informedby and helps make sense of these empirical facts. The model ul-timately serves two related purposes: it is a critique of the con-tinuous limit order book market design, and it articulates theeconomics of the HFT arms race.
VI.A. Preliminaries
Security x with Perfect Public Signal y. There is a security xthat trades on a continuous limit order book, the rules of whichare described in Section III. There is a publicly observable signaly of the value of security x. We make the following purposefullystrong assumption: the fundamental value of x is perfectly
QUARTERLY JOURNAL OF ECONOMICS1576
at Serials Departm
ent on Decem
ber 23, 2015http://qje.oxfordjournals.org/
Dow
nloaded from
correlated to the public signal y, and, moreover, x can always becostlessly liquidated at this fundamental value. This is a best-case scenario for price discovery and liquidity provision in a con-tinuous limit order book, abstracting from both asymmetric infor-mation and inventory costs.
We think of x and y as a metaphor for pairs or sets of ex-change-traded financial instruments that are highly correlated.For instance, x is SPY and y is ES. Alternatively, y can be inter-preted more abstractly as a publicly observable perfect signalabout the value of security x.
The signal y, and hence the fundamental value of security x,evolves as a compound Poisson jump process with arrival rateljump and jump distribution Fjump. The jump distribution hasfinite bounded support and is symmetric with mean zero. Let Jdenote the random variable formed by drawing randomly accord-ing to Fjump, and then taking the absolute value; we refer to J asthe jump size distribution.
Investors and Trading Firms. There are two types of players,investors and trading firms. Both types of players are risk-neu-tral and there is no discounting.
The players we call investors we think of as the end users offinancial markets: mutual funds, pension funds, hedge funds, in-dividuals, etc. Since there is no asymmetric information aboutfundamentals in our model, our investors could equivalently becalled ‘‘liquidity traders’’ as in Glosten and Milgrom (1985) or‘‘noise traders’’ as in Kyle (1985). Investors arrive stochasticallyto the market with an inelastic need to either buy or sell a unit of x(we generalize to multiple units in Section VI.B). The arrival pro-cess is Poisson with rate linvest, and, conditional on arrival, it isequally likely that the investor needs to buy versus sell. Weassume that all else equal, investors prefer to transact soonerrather than later. Formally, if an investor arrives to market attime t needing to buy one unit, and then buys a unit at time t0 � tfor price p, her payoff is vþ ðyt0 � pÞ � fdelaycostðt
0 � tÞ, where v is alarge positive constant that represents her inelastic need to com-plete the trade, yt0 is the fundamental value of x at the time shetrades, and the function fdelaycostð�Þ, which is strictly increasing andcontinuous with fdelaycostð0Þ ¼ 0, represents her preference totransact sooner rather than later. If the investor arrives needingto sell, and sells a unit at price p at time t0, her payoff is
THE HIGH-FREQUENCY TRADING ARMS RACE 1577
at Serials Departm
ent on Decem
ber 23, 2015http://qje.oxfordjournals.org/
Dow
nloaded from
vþ ðp� yt0 Þ � fdelaycostðt0 � tÞ. In the equilibrium of the continuous
limit order book we derive in Section VI.B, investors choose totransact immediately. In the equilibria of frequent batch auctions,studied in Section VII, investors will choose to transact in thediscrete-time analogue of immediately, namely, at the next avail-able batch auction. Once investors transact, they exit the game.
Trading firms (equivalently HFTs, market makers, algorith-mic traders) have no intrinsic demand to buy or sell x. Their goalin trading is simply to buy x at prices lower than y, and to sell x atprices higher than y. If a trading firm buys a share of x at price p attime t, they earn profits from that trade of yt � p; similarly, if theysell a share of x at price p at time t they earn profits from thattrade of p� yt. Trading firms’ objective is to maximize profits perunit time. We initially assume that the number of trading firms Nis exogenous, and assume that N � 2. Later, we endogenize entry.
We assume that investors act only as ‘‘takers’’ of liquidity,whereas trading firms act as both ‘‘makers’’ and ‘‘takers’’ of liquid-ity. More concretely, we assume that investors only use marketablelimit orders, which are limit orders with a bid price weakly greaterthan the best outstanding ask (if buying) or an ask price weaklylower than the best outstanding bid (if selling), whereas tradingfirms may use both marketable and nonmarketable limit orders.16
Latency. Initially, we assume away all latency for tradingfirms; again, our goal is to create a best-case environment forprice discovery and liquidity provision in a continuous limitorder book market. Trading firms observe innovations in thesignal y with zero time delay, and there is zero latency in sendingorders to the exchange and receiving updates from the exchange.If multiple messages reach the market at the same time, they areprocessed in serial in a random order. This random tie-breakingcan be interpreted as messages being transmitted with small
16. The assumption that investors (equivalently, liquidity traders or noise tra-ders) are liquidity takers is standard in the market microstructure literature. Ourtreatment of trading firms as both makers and takers of liquidity is slightlynonstandard. This is because our trading firms will play a role that combines as-pects of what the traditional market microstructure literature calls a market maker(who provides liquidity) and what the traditional literature calls an informedtrader(who takes liquidity). This will become clearer when we describe the role tradingfirms play in equilibrium in Section VI.B.
QUARTERLY JOURNAL OF ECONOMICS1578
at Serials Departm
ent on Decem
ber 23, 2015http://qje.oxfordjournals.org/
Dow
nloaded from
random latency, and then processed serially in the orderreceived.17
When we endogenize entry by trading firms, we add latencyto the observation of innovations in y and the ability to investresources to reduce this latency.
We assume that investors observe y with latency strictlygreater than trading firms; it is unimportant by how much.
VI.B. Equilibrium, Exogenous Entry
In this section we describe the equilibrium of our model withexogenous entry by trading firms. The structure of this equilib-rium is unique (as made precise below), but the assignment oftrading firms to roles within this structure is not unique. Oursolution concept is pure-strategy static Nash equilibrium.18
1. Investors. Investors trade immediately when their demandarises, buying or selling at the best available ask or bid, respec-tively. As we will see, the bid-ask spread is constant in equilib-rium, so investors have no incentive to delay trade.
2. Behavior of Trading Firms. The N trading firms endoge-nously sort themselves into two roles: 1 plays a role we call ‘‘li-quidity provider’’ and N – 1 play a role we call ‘‘stale-quotesniper.’’ Trading firms will be indifferent between these tworoles in equilibrium, and our equilibrium uniqueness claim doesnot specify the precise sorting of trading firms into roles. Forsimplicity, we assume that they sort themselves into the tworoles in a coordinated manner, specifically, player 1 alwaysplays the role of liquidity provider. However, there are economi-cally equivalent equilibria in which who plays the role of liquidity
17. Exchanges offer a service called colocation to HFT firms, whereby HFTs payfor the right to place their computers in the same location as the exchange’s com-puters. The exchanges are careful to ensure that each colocated computer is thesame physical distance, measured by cord length, from the exchange computers.Hence, if multiple HFTs send orders to the exchange at the same time, it really israndom which will be processed first. See Rogow (2012) for more details oncolocation.
18. Static Nash equilibrium means that investors’ and trading firms’ play con-stitutes a standard Nash equilibrium in each instant of the trading day. This rulesout, for instance, the possibility of equilibria in which trading firms collude.
THE HIGH-FREQUENCY TRADING ARMS RACE 1579
at Serials Departm
ent on Decem
ber 23, 2015http://qje.oxfordjournals.org/
Dow
nloaded from
provider is stochastic, or rotates, etc.19 In practice, some HFTfirms primarily play the role of liquidity provider, some primarilyplay the role of sniper, and some perform both roles.
Liquidity Provider: The liquidity provider behaves as follows.At the start of trading, which we denote by time 0, the liquidityprovider submits two limit orders, the first to buy 1 unit of x atprice y0 �
s2, the other to sell 1 unit of x at price y0 þ
s2. These
quotes constitute the opening bid and ask, respectively, ands � 0 is the bid-ask spread.20 We derive the equilibrium value ofs below. The bid-ask spread will be constant throughout the trad-ing day.
If the signal y jumps at time t, from yt� to yt (we use thenotation yt� ¼ lim t0!t� yt0 ), per the Poisson arrival process de-scribed above, the liquidity provider immediately adjusts herquotes. Specifically, at time t she sends a message to the exchangeto cancel her previous quotes, of yt� �
s2 and yt� þ
s2, and also sends
a message with a new bid and ask of yt �s2 and yt þ
s2.
If an investor arrives to the market at time t, per the Poissonarrival process described above, and buys at the current ask ofyt þ
s2, the liquidity provider immediately replaces the accepted
ask with a new ask at this same value of yt þs2. Similarly, if an
investor arrives at time t and sells at the current bid of yt �s2, the
liquidity provider immediately replaces the accepted bid with anew bid at this same value of yt �
s2. In either case, the liquidity
provider books profits of s2. Note that the liquidity provider does
not directly observe that her trading partner is an investor asopposed to another trading firm, though she can infer this inequilibrium from the fact that trade has occurred at a time twhen there is not a jump in the signal y.
If in some time interval there is neither a jump in the signaly, nor the arrival of a new investor, the liquidity provider does nottake any action.
19. In practice tick sizes are discrete (penny increments), whereas we allow forbids and asks to be any real value. If we used a discrete price grid, then the role ofliquidity provider would generically be strictly preferred to the role of stale-quotesniper at the equilibrium bid-ask spread. In this case, the N trading firms wouldrace to play the role of liquidity provider, and then the N – 1 losers of the race wouldplay the role of stale-quote sniper. For a large enough tick size there would also begreater than unit depth in the book.
20. We adopt the convention that it is possible for a liquidity provider to quote azero bid-ask spread. Formally, this can be interpreted as the limit as e!0þ of a bid-ask spread of s ¼ e.
QUARTERLY JOURNAL OF ECONOMICS1580
at Serials Departm
ent on Decem
ber 23, 2015http://qje.oxfordjournals.org/
Dow
nloaded from
Stale-Quote Snipers: Suppose that at time t the signal yjumps from yt� to yt, and the jump size jyt � yt� j exceeds s
2. Asdescribed above, the liquidity provider will send a message attime t to cancel her old quotes at yt� �
s2 and yt� þ
s2 and replace
them with new quotes based on the new value of y. At the exactsame time, the N – 1 other trading firms respond to the change iny by sending a message attempting to ‘‘snipe’’ the stale quotes.That is, they attempt to trade at the old quotes based on yt� beforethose quotes are canceled. Since the continuous limit order bookprocesses messages in serial, it is possible that a message to snipea stale quote will get processed before the liquidity provider’smessage to cancel the stale quote, creating a rent for the sniperand a cost for the liquidity provider. In fact it is not only possiblebut probable, because there are N – 1 snipers against 1 liquidityprovider, and it is random whose message is processed first.21
Formally, if yt > yt� þs2, each stale-quote sniper submits a
limit order at t to buy a single unit at price yt� þs2; symmetrically,
if yt < yt� �s2, each stale-quote sniper submits a limit order at t to
sell a single unit at price yt� �s2. If the sniper’s order executes
against the stale quote she books profits of jyt � yt�j �s2. If the
sniper’s order does not execute against the stale quote, that is,if her order is not the first of the N to be processed, she immedi-ately withdraws her order.22
If the jump at t is small, specifically, if yt� �s2 < yt < yt� þ
s2,
then the sniper takes no action. Similarly, if in some time intervalthere is no jump in the signal y, the sniper takes no action.
21. In our model, all trading firms are equally fast, so their messages reach theexchange at the exact same time, and then the exchange breaks the tie randomly. Amore realistic model would add a small random latency to each trading firm’s mes-sage transmission—for example, a uniform-random draw from ½0; e�—and thenwhichever trading firm had the smallest draw from ½0; e� would win the race (seealso note 17). This would yield exactly the same probability of winning the race of 1
N.Note too that in a richer model with multiple liquidity providers this basic 1
N logicstill obtains: for every one liquidity provider trying to cancel, all other tradingfirms—including firms that are also providing their own liquidity—attempt tosnipe.
22. By ‘‘immediately withdraws her order’’ we mean the following. As soon asthe sniper receives confirmation from the exchange that her order was not exe-cuted, she sends a message to the exchange to remove the order. In our model,both the confirmation that the initial order was not executed and the message toremove the order occur instantaneously. Thus, for any time t0 > t, the unsuccessfulsniper’s order is removed by the market by t0. In practice, exchanges automate thistype of behavior with an order type called ‘‘immediate or cancel.’’
THE HIGH-FREQUENCY TRADING ARMS RACE 1581
at Serials Departm
ent on Decem
ber 23, 2015http://qje.oxfordjournals.org/
Dow
nloaded from
Equilibrium Bid-Ask Spread. In equilibrium, the bid-askspread s leaves trading firms indifferent between liquidity provi-sion and stale-quote sniping.
The liquidity provider earns profits of s2 when investors arrive
to market, which occurs at arrival rate linvest, and incurs losseswhenever stale quotes are sniped. The losses from sniping arise ifthere is a jump, which occurs at rate ljump; the jump is larger thans2; and the liquidity provider does not win the race to react (i.e., isnot processed first), which occurs with probability N�1
N . In theevent she loses the race, her expected loss is EðJ � s
2 jJ >s2Þ, that
is, the conditional expectation of the jump size less half the bid-ask spread. Thus, the benefits less costs of providing liquidity, perunit time, are
linvest �s
2� ljump � Pr J >
s
2
� �� E J �
s
2jJ >
s
2
� ��N � 1
N:ð1Þ
Stale-quote snipers earn profits when they successfully ex-ploit a stale quote after a jump larger in size than half the bid-askspread. When such a jump occurs, each sniper wins the race toexploit with probability 1
N. Hence each sniper’s expected profits,per unit time, are
ljump � Pr J >s
2
� �� E J �
s
2jJ >
s
2
� ��
1
N:ð2Þ
Notice that, summed over all N – 1 snipers, this equals theliquidity provider’s cost of providing liquidity; this captures thattrade among trading firms is zero sum.
Equating (1) and (2) yields the equilibrium indifferencecondition:
linvest �s
2¼ ljump � Pr J >
s
2
� �� E J �
s
2jJ >
s
2
� �:ð3Þ
Equation (3) uniquely pins down the equilibrium bid-askspread s�, because the left-hand side is strictly increasing in sand has value 0 at s = 0, whereas the right-hand side is strictlydecreasing in s and is positive for s = 0. The equation also has anatural economic interpretation. The left-hand side is the totalrevenue earned by trading firms from investors from the positivebid-ask spread. The right-hand side is the total rents to tradingfirms from sniping stale quotes. Notice that N�1
N of these rents goto stale-quote snipers and the remaining 1
N of these rents goes tothe liquidity provider, who is compensated for her opportunity
QUARTERLY JOURNAL OF ECONOMICS1582
at Serials Departm
ent on Decem
ber 23, 2015http://qje.oxfordjournals.org/
Dow
nloaded from
cost of not being a sniper. Notice, too, that equation (3) does notdepend on N; this foreshadows that endogenizing entry will haveno effect on the bid-ask spread or arms-race prize.
We summarize the equilibrium with the followingproposition.
PROPOSITION 1 (Equilibrium with Exogenous Entry). There is anequilibrium of the continuous limit order book market designwith play as described above. The structure of this equilib-rium is unique in the following sense. In any equilibrium:
(i) At almost all times t, there is exactly one unit offered inthe limit order book at bid yt �
s�
2 and exactly one unitoffered at ask yt þ
s�
2 , with the bid-ask spread s� uniquelycharacterized by the solution to equation (3). These twoquotes may belong to one trading firm or to two distincttrading firms. There are no other orders in the book,except possibly for orders that trade with probability zero.
(ii) Investors trade immediately when their demand arises.(iii) If there is a jump in yt that is strictly larger than s�
2 , the 1trading firm with a snipe-able stale quote (i.e., the ask ifthe jump is positive, the bid if the jump is negative) im-mediately sends a message to cancel her stale quote, andthe other N – 1 trading firms immediately send a messageto snipe the stale quote. The liquidity provider is snipedwith probability N�1
N .(iv) Trading firms are indifferent between liquidity provision
and stale-quote sniping, for both the bid and the ask.(v) As per equation (3), the following two quantities are equiv-
alent in any equilibrium and do not depend on N:. The total rents to trading firms, ljump � PrðJ > s�
2 Þ�
EðJ � s�
2 jJ >s�
2 Þ. That is, the sum of the value of allarbitrage opportunities that the snipers are racing tocapture.
. The total revenue liquidity providers earn from inves-tors via the positive bid-ask spread, linvest �
s�
2 .
See Online Appendix B for further details about this equilib-rium, such as behavior off the equilibrium path, which completethe proof of Proposition 1.
4. Market Depth. Consider the model of Section VI.A but mod-ified so that investors sometimes need to buy or sell multiple
THE HIGH-FREQUENCY TRADING ARMS RACE 1583
at Serials Departm
ent on Decem
ber 23, 2015http://qje.oxfordjournals.org/
Dow
nloaded from

units. Specifically, investors arrive to market at rate linvest andare equally likely to need to buy or sell, as before, but now theyneed to transact a quantity q 2 f1; . . .; qg, with pk> 0 the proba-bility that they need to transact k units, for k ¼ 1; . . .; q. Before,we assumed that investors trade a single unit immediately atmarket. Here, we make a stronger assumption which is that in-vestors transact their full quantity desired immediately atmarket. We emphasize that such behavior is not optimal: an in-vestor with multi-unit demand will prefer to split his order intoseveral smaller orders (analogously to Kyle (1985); Vayanos(1999); Sannikov and Skrzypacz (2014)). Instead, we view thisassumption as allowing us to illustrate a mechanical pointabout continuous limit order book markets, which is that snipingmakes it especially costly to provide a deep book.
There is an equilibrium of this model analogous to that inSection VI.B, in which the N trading firms serve both as liquidityproviders and stale-quote snipers, and are indifferent betweenthese two roles quote by quote. In equilibrium, the bid-askspread for the kth unit of liquidity, sk, is governed by indifferencebetween liquidity provision (LHS) and stale-quote sniping (RHS)at the kth level of the book:
linvest �Xq
i¼k
pi �sk
2�ljump �Pr J>
sk
2
� ��E J�
sk
2jJ>
sk
2
� ��N�1
N
¼ ljump �Pr J>sk
2
� ��E J�
sk
2jJ>
sk
2
� ��
1
N:ð4Þ
The LHS of equation (4) represents the benefits less costs ofliquidity provision in the kth level of the book. Notice that thesecond term on the LHS of equation (4), which describes the costsof getting sniped, is the same as the second term of equation (1).This is because if a quote becomes stale, stale-quote snipers willattempt to pick off as much quantity as is available at an advan-tageous price. Similarly, the RHS of equation (4), which repre-sents the benefits of sniping the kth level of the book, is the sameas equation (2).
By contrast, except for the case of k = 1, the first term on theLHS of equation (4), which describes the benefits of providingliquidity, is strictly smaller than the first term of equation (1).This is because only proportion
Pqi¼k pi of investors trade the kth
level of the order book.
QUARTERLY JOURNAL OF ECONOMICS1584
at Serials Departm
ent on Decem
ber 23, 2015http://qje.oxfordjournals.org/
Dow
nloaded from
Intuitively, the benefits of providing liquidity scale subline-arly with the quantity offered, because only some investors re-quire a large quantity; whereas the costs of providing liquidityscale linearly with the quantity offered, because snipers will ex-ploit stale quotes in the full quantity offered.23 The result is thatthe equilibrium bid-ask spread is wider for the second unit thanfor the first unit, wider for the third unit than the second unit, etc.That is, the market is ‘‘thin’’ for large-quantity trades.
PROPOSITION 2 (Market Thinness). There exists an equilibrium ofthe multi-unit demand model with play as described above.The structure of this equilibrium is unique in the followingsense. In any equilibrium:
(i) At almost all times t there is exactly one unit offered inthe limit order book at bid yt �
s�k
2 and one unit offered atask yt þ
s�k
2 , for each k ¼ 1; . . .; q. The bid-ask spread s�k forthe kth unit of liquidity is uniquely characterized by equa-tion (4). These 2q quotes may belong to one trading firm orto multiple distinct trading firms. There are no otherorders in the book, except possibly for orders that tradewith probability zero.
(ii) Spreads are strictly increasing,
s�1 < s�2 < . . . < s�q :
Hence, investors’ per-unit cost of trading is strictly in-creasing in order size.
(iii) If there is a jump in yt that is strictly larger thans�
k
2 andweakly less than
s�kþ1
2 , then there are k snipe-able stalequotes. For each of the k stale quotes, the trading firmwith the stale quote immediately sends a message tocancel, and the N – 1 other trading firms immediatelysend a message to snipe. Each stale quote is sniped withprobability N�1
N .(iv) The N trading firms are indifferent between liquidity pro-
vision and stale-quote sniping at all levels of the orderbook.
23. A similar intuition is present in Glosten (1994), which derives bid-askspreads that increase with quantity in a model with asymmetric information.Our market thinness result is to Glosten (1994) as our bid-ask spread result is toGlosten and Milgrom (1985).
THE HIGH-FREQUENCY TRADING ARMS RACE 1585
at Serials Departm
ent on Decem
ber 23, 2015http://qje.oxfordjournals.org/
Dow
nloaded from
(v) As per equation (4), the following two quantities are equiv-alent in any equilibrium and do not depend on N:
. The total rents to trading firms:Pq
k¼1 ljump � PrðJ >s�
k
2 Þ�
EðJ �s�
k
2 jJ >s�
k
2 Þ. That is, the sum of the value of allsniping opportunities, across all levels of the book.
. The total revenue liquidity providers earn from inves-tors via the positive bid-ask spreads, linvest
Pqk¼1 �Pq
i¼k pi �s�
k
2 .
VI.C. Discussion: Sniping Is ‘‘Built In’’ to the Market Design
Given the model setup, one might have conjectured thatBertrand competition among the N trading firms leads to infinitecostless liquidity for investors and zero rents for trading firms. Allof the usual channels of costly liquidity provision are turned off.There is no asymmetric information as in the models of Copelandand Galai (1983), Glosten and Milgrom (1985), or Kyle (1985);instead, all trading firms observe innovations in the signal y atexactly the same time, and this signal y is perfectly informativeabout the fundamental value of x. There are no inventory costs asin Stoll (1978) or search costs as in Duffie, Garleanu, andPedersen (2005); instead, the security x can at all times be cost-lessly liquidated at its fundamental value y. So one should expectthat competitive forces would drive the price for liquidity to zero.
Our analysis shows, however, that the continuous limit orderbook market design itself is a source of costly liquidity provision.The core issue is that even symmetrically observed public infor-mation creates arbitrage opportunities for trading firms, becausetrade requests are processed serially. As suggested by the em-pirics, obvious mechanical arbitrage opportunities are ‘‘built in’’to the market design. Moreover, serial processing stacks the deckagainst liquidity providers in the race to respond to new publicinformation. To avoid being sniped, the liquidity provider’s re-quest to cancel her stale quote must be processed before all ofthe other trading firms’ requests to exploit her stale quote.Hence, liquidity providers get sniped with probability N�1
N eventhough they learn their quotes are stale at exactly the same timeas the other trading firms. In a competitive market, liquidity pro-viders recover the expense of being sniped by charging more forliquidity, that is, sniping costs lead to wider bid-ask spreads andthinner markets.
QUARTERLY JOURNAL OF ECONOMICS1586
at Serials Departm
ent on Decem
ber 23, 2015http://qje.oxfordjournals.org/
Dow
nloaded from
REMARK 1 (Sniping Harms Liquidity). In our model there are noinventory costs, search costs, or information asymmetries.Nevertheless, in any equilibrium, the bid-ask spread s� isstrictly positive and investors’ per-unit cost of trading isstrictly increasing in order size.
Our source of costly liquidity provision is most similar to thatin Copeland and Galai (1983) and Glosten and Milgrom (1985),namely, a liquidity provider sometimes gets exploited by anotherplayer who knows that the liquidity provider’s quote is mispriced.The conceptual difference is that in Copeland and Galai (1983)and Glosten and Milgrom (1985) there is asymmetric informationbetween the liquidity provider and this other player (the ‘‘in-formed trader’’), whereas in our model the liquidity providersand these other players (stale-quote snipers) are symmetricallyinformed.24 The mechanical reason that our source of costly li-quidity provision does not arise in these prior works is a subtledifference in how the continuous limit order book is modeled. Ourmodel uses the actual rules of the continuous limit order book (seeSection III) in which the market runs in continuous time andplayers can submit orders whenever they like. Copeland andGalai (1983) and Glosten and Milgrom (1985), as well as othersubsequent market microstructure analyses of limit order bookssuch as Foucault (1999) and Goettler, Parlour, and Rajan (2005),use abstractions of the continuous limit order book in which playoccurs in discrete time and players can only act when it is theirexogenously specified turn to do so. This abstraction is innocuousin the context of their analyses, but it precludes the possibility ofa race to respond to symmetrically observed public information asin our analysis.
A potentially useful way to summarize the relationship isthat our model shows that the continuous limit order book
24. One could argue that, in reality, information among HFT firms is always atleast slightly asymmetric. Some firm detects the change in the signal y a tiny bitearlier than other firms, and during the interval is asymmetrically informed. Thus,one might argue, sniping is no different from traditional adverse selection due toasymmetric information. However, this argument implicitly assumes that there isno such thing as symmetrically observed information in financial markets (otherthan perhaps when the market is closed), whereas it is clearly implicit in financialmarket regulation that certain kinds of information—company news releases, gov-ernment data announcements, order book activity—should be disseminated sym-metrically. Frequent batch auctions restore the possibility of meaningfullysymmetric information.
THE HIGH-FREQUENCY TRADING ARMS RACE 1587
at Serials Departm
ent on Decem
ber 23, 2015http://qje.oxfordjournals.org/
Dow
nloaded from
market design causes symmetrically observed public informationto be processed by the market as if it were asymmetrically ob-served private information. As we will see, discrete-time batchingeliminates this built-in adverse selection and restores the possi-bility of meaningfully symmetric information.
VI.D. Equilibrium with Endogenous Entry: The HFT Arms Race
The equilibrium analysis in Section VI.B shows that the con-tinuous limit order book creates rents for trading firms, and thatthe sniping associated with these rents harms liquidity provision.In this section we incorporate latency into the model and endo-genize entry by allowing trading firms to invest in a costly speedtechnology. This modification induces an arms race for speed. Thearms race dissipates the rents created by the continuous marketwhile doing nothing to fix the underlying liquidity problem asso-ciated with sniping.
1. Speed Technology. We model investment in speed in asimple way. Trading firms can costlessly observe the signal ywith latency �slow > 0, meaning that the value of signal y attime t is observed at time tþ �slow. In addition, trading firmscan choose to invest in a speed technology, at a rental cost ofcspeed per unit time, which reduces their latency to �fast < �slow.The cost cspeed is a metaphor for the cost of access to high-speeddata connections (such as the Spread Networks cable, or the mi-crowaves that replaced it), the cost of cutting-edge hardware, thecost of colocation facilities, the cost of the relevant human capital,and so on. We assume that the decision of whether to pay thisspeed cost is taken at the start of the game and is observable andirreversible.25 Define � ¼ �slow � �fast, the speed difference be-tween fast and slow trading firms.
Before, the number of trading firms N was exogenously spe-cified. Here, we assume that there is a large fringe of slow tradingfirms, of whom N endogenously decide to invest in speed. Therewill be no role for slow trading firms in equilibrium. We assumethat the cost of speed satisfies a mild condition, described belowafter equation (7) in note 26, which ensures that in equilibrium
25. Given the speed investment stage, our equilibrium concept becomes pure-strategy subgame perfect Nash equilibrium for the investment stage, and pure-strategy static Nash equilibrium throughout the trading day.
QUARTERLY JOURNAL OF ECONOMICS1588
at Serials Departm
ent on Decem
ber 23, 2015http://qje.oxfordjournals.org/
Dow
nloaded from

there are at least two fast trading firms. For simplicity we thenallow N to take on any real value greater than or equal to 2,rather than requiring N to be an integer. This allows us to char-acterize the equilibrium level of N using a zero-profit condition.Alternatively we could require that N is an integer, in which caseequilibrium N is characterized by weakly positive profits for trad-ing firms with N entrants and strictly negative with N + 1.
2. Equilibrium. For expositional simplicity we focus on thecase where investors need to buy or sell a single unit; the gener-alization to multi-unit trading akin to Section VI.B followsnaturally.
Equilibrium has a very similar structure to above. The N fasttrading firms who endogenously enter then sort themselves into 1liquidity provider and N – 1 stale-quote snipers. Both the liquid-ity provider and the stale-quote snipers behave exactly as de-scribed above in Section VI.B, with the one modification thatthey now each react to jumps in y with latency �fast. Investorsbehave exactly as before, buying or selling immediately onarrival.
Notice that while a fast liquidity provider successfully avoidsgetting sniped 1
N of the time, a slow liquidity provider wouldalways be sniped. Similarly, a fast stale-quote sniper is successful1N of the time, whereas a slow stale-quote sniper would never besuccessful. This is the intuition for why there is no role for slow-trading firms in equilibrium.
Equilibrium is characterized by two zero-profit conditions.First, we have the zero-profit condition for the liquidity provider,which says that revenues minus costs as written in equation (1)equal the costs of speed:
linvest �s
2� ljump � Pr J >
s
2
� �� E J �
s
2jJ >
s
2
� ��N � 1
N¼ cspeed:
ð5Þ
Second is the zero-profit condition for stale-quote snipers,which says that the rents from sniping as written in equation(2) equal the costs of speed:
ljump � Pr J >s
2
� �� E J �
s
2jJ >
s
2
� ��
1
N¼ cspeed:ð6Þ
THE HIGH-FREQUENCY TRADING ARMS RACE 1589
at Serials Departm
ent on Decem
ber 23, 2015http://qje.oxfordjournals.org/
Dow
nloaded from
Together, equations (5) and (6) characterize the equilibriumbid-ask spread s� and the equilibrium quantity of entry N�.Notice that subtracting equation (6) from equation (5) yields ex-actly equation (3); hence, the equilibrium bid-ask spread is thesame as in the exogenous entry case. We can then solve for theequilibrium entry quantity by adding equation (5) and N – 1 timesequation (6) to obtain
linvest �s�
2¼ N� � cspeed:ð7Þ
The economic interpretation of equation (7) is that all of theexpenditure by trading firms on speed technology (RHS) is ulti-mately borne by investors via the cost of liquidity (LHS).Examining equation (3) as well, we have an equivalence betweenthe total prize in the arms race, the total expenditures on speed inthe arms race, and the cost to investors.26 Hence, the rents cre-ated by the continuous limit order book are dissipated by thespeed race.27
PROPOSITION 3. There is an equilibrium of the continuous limitorder book market design with endogenous entry with playas described above. The equilibrium number of fast tradingfirms N� and the equilibrium bid-ask spread s� are uniquelydetermined by the zero-profit conditions equations (5) and(6). The structure of play in this equilibrium is identical tothat in the exogenous entry case, as characterized byProposition 1, but replacing the exogenous N trading firmswith the endogenous N� fast trading firms. Slow tradingfirms play no role in equilibrium. The following three quan-tities are equivalent in any equilibrium:
26. The assumption that N � 2 in equilibrium can be written ascspeed <
12 linvest �
s�
2 . This is mild since linvest �s�
2 is equal to the total prize in thearms race.
27. We have assumed that all fast traders are equally fast and have the samecost of speed. A simple way to capture the fact that some trading firms may have acomparative advantage in speed technology is to allow the cost of speed to vary overfirms. Under this modification, the marginal fast trading firm earns zero profits,while inframarginal trading firms earn strictly positive profits. With this modifi-cation, the total sniping rents to trading firms remain equal to the total revenueliquidity providers earn from investors via the positive bid-ask spread, and thesetwo quantities each strictly exceed the total equilibrium expenditure by tradingfirms on speed technology.
QUARTERLY JOURNAL OF ECONOMICS1590
at Serials Departm
ent on Decem
ber 23, 2015http://qje.oxfordjournals.org/
Dow
nloaded from
. The total rents to trading firms, ljump � PrðJ > s�
2 Þ�
EðJ � s�
2 jJ >s�
2 Þ. That is, the sum of the value of all arbi-trage opportunities that the snipers are racing tocapture.
. The total revenue liquidity providers earn from investorsvia the positive bid-ask spread, linvest �
s�
2 .. The total equilibrium expenditure by trading firms on
speed technology, N� � cspeed.
VI.E. Discussion of the Equilibrium
1. Welfare Costs of the Arms Race: A Prisoner’s Dilemmaamong Trading Firms. The equilibrium derived above can be in-terpreted as the outcome of a prisoner’s dilemma among tradingfirms. To see this, compare the equilibrium outcome with endog-enous entry to the equilibrium outcome with exogenous entry ifthe exogenous number of trading firms is N� and their latency is�slow. In both cases, the N� trading firms sort themselves into 1liquidity provider and N� � 1 stale-quote snipers, and in bothcases the bid-ask spread, s�, is characterized by trading firms’indifference between liquidity provision and stale-quote sniping.The only difference is that now all trading firms—both the liquid-ity provider and the snipers—respond to changes in y with a delayof �slow instead of �fast. Investors still get to trade immediately andstill pay the same bid-ask spread cost of s�
2 , so their welfare isunchanged. The welfare of the N� trading firms is strictly greaterthough, since they no longer pay the cost of speed.
PROPOSITION 4 (Prisoner’s Dilemma). Consider the model ofSection VI.D modified so that the number of trading firmsis N�. Social welfare would be higher by N� � cspeed per unittime if the N� trading firms could commit not to invest in thespeed technology, with the gains shared equally among theN� trading firms. But each individual trading firm has a dom-inant strategy incentive to deviate and invest in speed, so thisis not an equilibrium. The situation constitutes a prisoner’sdilemma with social costs equal to the total expenditure onspeed.
As we will see below, frequent batch auctions resolve thisprisoner’s dilemma, and in a manner that allocates the welfaresavings to investors instead of trading firms.
THE HIGH-FREQUENCY TRADING ARMS RACE 1591
at Serials Departm
ent on Decem
ber 23, 2015http://qje.oxfordjournals.org/
Dow
nloaded from
2. Connection to the Empirics: The Arms Race Is a ‘‘Constant’’.
PROPOSITION 5 (Comparative Statics of the Arms Race Prize). Thesize of the prize in the arms race, ljump � PrðJ > s�
2 Þ�
EðJ � s�
2 jJ >s�
2 Þ, has the following comparative statics:
(i) The size of the prize is increasing in the frequency ofjumps, ljump.
(ii) If jump distribution F0jump is a mean-preserving spreadof Fjump, then the size of the prize is strictly largerunder F0jump than Fjump.
(iii) The size of the prize is invariant to the cost of speed, cspeed.(iv) The size of the prize is invariant to the speed of fast trad-
ing firms, �fast.(v) The size of the prize is invariant to the difference in speed
between fast and slow trading firms, �.
Proposition 5 suggests that the HFT arms race is best under-stood as an equilibrium constant of the continuous limit orderbook—and thus helps make sense of our empirical results.Specifically, suppose that speed technology improves each year,and reinterpret the model so that cspeed is the cost of being at thecutting edge of speed technology in the current year, �fast is thespeed at the cutting edge, and � is the speed differential betweenthe cutting edge and other trading firms. Under this interpreta-tion, in equilibrium of our model, the speed with which informa-tion ( y) is incorporated into prices (x) grows faster and faster eachyear—as consistent with our findings in the correlation break-down analysis (Figure III). And, arbitrage durations declineeach year—as consistent with our findings on the duration ofES-SPY opportunities (Figure IV). However, the arms raceprize itself is unaffected by these advances in speed, which isconsistent with Figures V and VI because the total size of theprize can be decomposed as per arbitrage profitability EðJ � s�
2 jJ> s�
2 Þ times arbitrage frequency ljump � PrðJ > s�
2 Þ. What does affectthe size of the prize are the market volatility parameters, againconsistent with our findings in the arbitrage analysis.
3. Relationship to the Efficient Markets Hypothesis. It is in-teresting to interpret the equilibrium derived above as it relatesto the efficient markets hypothesis.
QUARTERLY JOURNAL OF ECONOMICS1592
at Serials Departm
ent on Decem
ber 23, 2015http://qje.oxfordjournals.org/
Dow
nloaded from

On the one hand, the market is highly efficient in the sense ofinstantaneously incorporating news about y into the price of x.Formally, the midpoint of the bid-ask spread for x is equal to fasttrading firms’ information about x’s fundamental value, yt��fast
, forproportion one of the trading day.
On the other hand, a strictly positive volume of trade is con-ducted at prices known by all trading firms to be stale. Formally,the proportion of trade that is conducted at quotes that do notcontain yt��fast
is
ljump � PrðJ > s�
2 Þ �N��1
N�
ljump � PrðJ > s�2 Þ �
N��1N� þ linvest
:
Hence, the market is extremely efficient in time space but notin volume space: a lot of volume gets transacted at incorrectprices. This volume is in turn associated with rents from symmet-rically observed public information about securities’ prices, whichis in violation of the weak-form efficient markets hypothesis (seeFama 1970).28
4. Role of HFTs. In equilibrium of our model, fast tradingfirms endogenously serve two roles: liquidity provision andstale-quote sniping. The liquidity provision role is useful to inves-tors; the stale-quote sniping role is detrimental to investors be-cause it increases the costs of liquidity provision.29
This distinction between roles is important to keep in mindwhen interpreting the historical evidence on the effect of HFT onliquidity. The rise of HFT over the past 15 years or so conflatestwo distinct phenomena: the increased role of information tech-nology (IT) in financial markets, and the speed race. The empir-ical record is unambiguous that, overall, IT has improvedliquidity—see especially Hendershott, Jones, and Menkveld
28. The citation for the 2013 Nobel Prize in Economics asserted that asset pricesare predictable in the long run but ‘‘next to impossible to predict in the short run’’(Economic Sciences Prize Committee 2013). Our empirical and theoretical resultsshow that in fact, prices are extremely easy to predict in the extremely short run.
29. In practice, and in richer models, HFTs serve roles beyond these two. Forinstance, Clark-Joseph (2013) studies an HFT strategy that relates to the sophis-ticated use of information technology to detect patterns in others’ trading activityand trade in advance of large orders. Clark-Joseph (2013) argues that this strategy,which he calls exploratory trading, is detrimental to investors, and it is clearlydistinct from stale-quote sniping.
THE HIGH-FREQUENCY TRADING ARMS RACE 1593
at Serials Departm
ent on Decem
ber 23, 2015http://qje.oxfordjournals.org/
Dow
nloaded from
(2011), which uses a natural experiment to show that the transi-tion from human-based liquidity provision to computer-based li-quidity provision enhanced liquidity. This makes intuitiveeconomic sense, as IT has lowered costs in numerous sectorsthroughout the economy. However, there is little support forthe proposition that the speed race per se has improved liquidity.Moreover, in the time series of both bid-ask spreads over time(Virtu 2014, p. 103) and the cost of executing large trades overtime (Angel, Harris and Spatt 2015, p. 23; Frazzini, Israel, andMoskowitz 2012, table IV), it appears that most of the improve-ments in liquidity associated with the rise of IT were realized inthe late 1990s and early to mid-2000s, well before the millisecond-and microsecond-level speed race.
We emphasize that our results do not imply that on net HFThas been negative for liquidity or social welfare. Our results saythat sniping is negative for liquidity and that the speed race issocially wasteful. Frequent batch auctions preserve (in a sense,enhance) the useful function served by HFTs—liquidity provisionand price discovery—while eliminating sniping and the speed race.
VII. Frequent Batch Auctions as a Market Design
Response
In this section we define the frequent batch auction marketdesign and show that it directly addresses the problems we haveidentified with the continuous limit order book market design.
VII.A. Frequent Batch Auctions: Definition
Informally, frequent batch auctions are just like the contin-uous limit order book but with two departures: (i) time is treatedas discrete, not continuous; and (ii) orders are processed in batch,using a uniform-price auction, instead of serially in order of re-ceipt. The remainder of this subsection defines frequent batchauctions formally.30
The trading day is divided into equal-length discrete timeintervals, each of length � > 0. We refer to the parameter � asthe batch length and to the intervals as batch intervals. We
30. See also Budish, Cramton, andShim (2014), which provides additional prac-tical implementation details.
QUARTERLY JOURNAL OF ECONOMICS1594
at Serials Departm
ent on Decem
ber 23, 2015http://qje.oxfordjournals.org/
Dow
nloaded from
refer to a generic batch interval either using the interval, gener-ically ð0; ��, or using the ending time, generically t.
At any moment in time during a batch interval, traders (i.e.,investors or trading firms) may submit offers to buy and sellshares of stock in the form of limit orders and market orders.Just as in the continuous market, a limit order is a price-quantitypair expressing an offer to buy or sell a specific quantity at aspecific price, and a market order specifies a quantity but not aprice.31 A single trader may submit multiple orders, which can beinterpreted as submitting a demand function or a supply function(or both). Just as in the continuous market, traders may freelymodify or cancel their orders at any moment in time. Also, justas in the continuous market, orders remain outstanding untileither executed or canceled; that is, if an order is not executedin the batch at time t, it automatically carries over fortþ �; tþ 2�; tþ 3�, etc.
At the end of each batch interval, the exchange batches alloutstanding orders—both new orders received during this inter-val, and orders outstanding from previous intervals—and com-putes the aggregate demand and supply functions out of all bidsand asks, respectively. If demand and supply do not intersect,then there is no trade and all orders remain outstanding for thenext batch auction. If demand and supply do intersect, then themarket clears where supply equals demand, with all transactionsoccurring at the same price—that is, at a ‘‘uniform price.’’ Thereare two cases to consider. If demand and supply intersect hori-zontally or at a point, this pins down a unique market-clearingprice p� and a unique maximum possible quantity q�. In this case,offers to buy with bids strictly greater than p� and offers to sellwith asks strictly less than p� transact their full quantity at pricep�, whereas for bids and asks of exactly p� it may be necessaryto ration one side of the market to enable market clearing.32
31. We assume that there is a finite maximum allowable bid and minimumallowable ask. A market order to buy q shares is then interpreted as a limit orderto buy q shares at the maximum allowable bid, and symmetrically for market ordersto sell. In practice, price circuit breakers might determine what constitutes thesemaximum and minimum amounts (e.g., the most recently transacted price plus orminus some specified percentage).
32. A potential reason to favor fine rather than coarse tick sizes is to reduce thelikelihood of ties and hence the amount of rationing. We also note that one of thearguments against fine tick sizes in continuous markets—the explosion in messagetraffic associated with traders outbidding each other by economically negligible
THE HIGH-FREQUENCY TRADING ARMS RACE 1595
at Serials Departm
ent on Decem
ber 23, 2015http://qje.oxfordjournals.org/
Dow
nloaded from
For this rationing, we adopt a time-priority rule analogous tocurrent practice under the continuous market but treating timeas discrete: orders that have been left outstanding for a larger(integer) number of batch intervals have higher priority, whereasif two orders were submitted in the same batch interval they havethe same priority irrespective of the precise time they were sub-mitted within that batch interval. If necessary to break ties be-tween orders submitted during the same batch interval therationing is random (pro rata). If demand and supply intersectvertically, this pins down a unique quantity q� and an intervalof market-clearing prices, ½p�L;p
�H �. In this case, all offers to buy
with bids weakly greater than p�H and all offers to sell with asksweakly lower than p�L transact their full quantity, and the price isp�
Lþp�
H
2 .Information policy details are as follows. After each auction
is computed all of the orders that were entered into the batchauction, both outstanding orders from previous batch intervalsand new orders entered during the just-completed batch interval,are displayed publicly. Also displayed are details of the auctionoutcome: the supply and demand functions, and the market-clearing price and quantity (or ‘‘no trade’’). Activity during thebatch interval is not displayed publicly during the batch interval;that is, information is disseminated in discrete time. So, for thetime t auction, participants see all of the orders and auction in-formation from the auctions at time t� �; t� 2�; t� 3�; . . .; butthey do not see new activity for the time t auction until afterthe auction is completed. This information policy may sound dif-ferent from current practice, but it is in fact closely analogous. Inthe continuous market, new order book activity is first economi-cally processed by the exchange (e.g., a new order is entered in thebook, or a new order trades against the book), and only then is theorder announced publicly (along with the updated state of thebook). Similarly, here, new order book activity is first economi-cally processed by the exchange and only then announced pub-licly; the only difference is that the economic processing occurs in
amounts—is less of an issue in discrete time. For these reasons, we conjecture thatthe optimal tick size in a frequent batch auction is at least as fine as that in thecontinuous limit order book. This is an open question for future research.
QUARTERLY JOURNAL OF ECONOMICS1596
at Serials Departm
ent on Decem
ber 23, 2015http://qje.oxfordjournals.org/
Dow
nloaded from
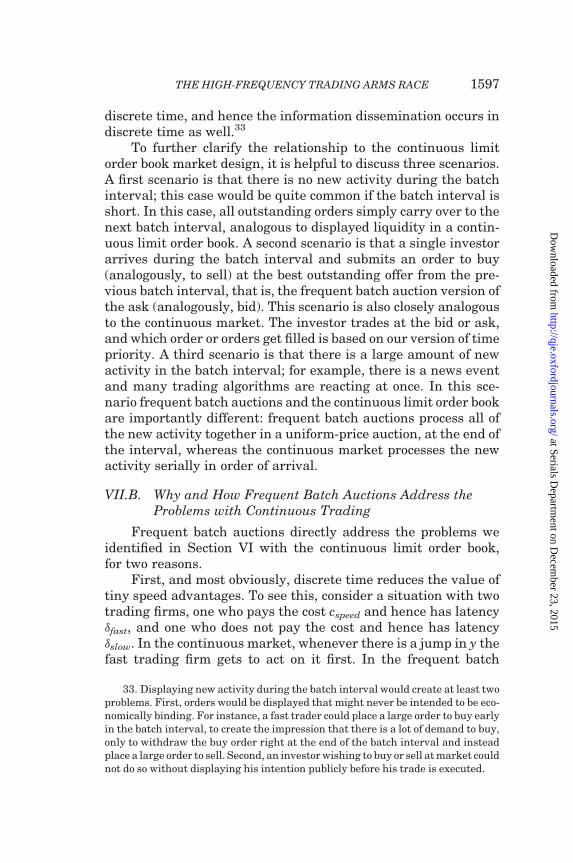
discrete time, and hence the information dissemination occurs indiscrete time as well.33
To further clarify the relationship to the continuous limitorder book market design, it is helpful to discuss three scenarios.A first scenario is that there is no new activity during the batchinterval; this case would be quite common if the batch interval isshort. In this case, all outstanding orders simply carry over to thenext batch interval, analogous to displayed liquidity in a contin-uous limit order book. A second scenario is that a single investorarrives during the batch interval and submits an order to buy(analogously, to sell) at the best outstanding offer from the pre-vious batch interval, that is, the frequent batch auction version ofthe ask (analogously, bid). This scenario is also closely analogousto the continuous market. The investor trades at the bid or ask,and which order or orders get filled is based on our version of timepriority. A third scenario is that there is a large amount of newactivity in the batch interval; for example, there is a news eventand many trading algorithms are reacting at once. In this sce-nario frequent batch auctions and the continuous limit order bookare importantly different: frequent batch auctions process all ofthe new activity together in a uniform-price auction, at the end ofthe interval, whereas the continuous market processes the newactivity serially in order of arrival.
VII.B. Why and How Frequent Batch Auctions Address theProblems with Continuous Trading
Frequent batch auctions directly address the problems weidentified in Section VI with the continuous limit order book,for two reasons.
First, and most obviously, discrete time reduces the value oftiny speed advantages. To see this, consider a situation with twotrading firms, one who pays the cost cspeed and hence has latency�fast, and one who does not pay the cost and hence has latency�slow. In the continuous market, whenever there is a jump in y thefast trading firm gets to act on it first. In the frequent batch
33. Displaying new activity during the batch interval would create at least twoproblems. First, orders would be displayed that might never be intended to be eco-nomically binding. For instance, a fast trader could place a large order to buy earlyin the batch interval, to create the impression that there is a lot of demand to buy,only to withdraw the buy order right at the end of the batch interval and insteadplace a large order to sell. Second, an investor wishing to buy or sell at market couldnot do so without displaying his intention publicly before his trade is executed.
THE HIGH-FREQUENCY TRADING ARMS RACE 1597
at Serials Departm
ent on Decem
ber 23, 2015http://qje.oxfordjournals.org/
Dow
nloaded from
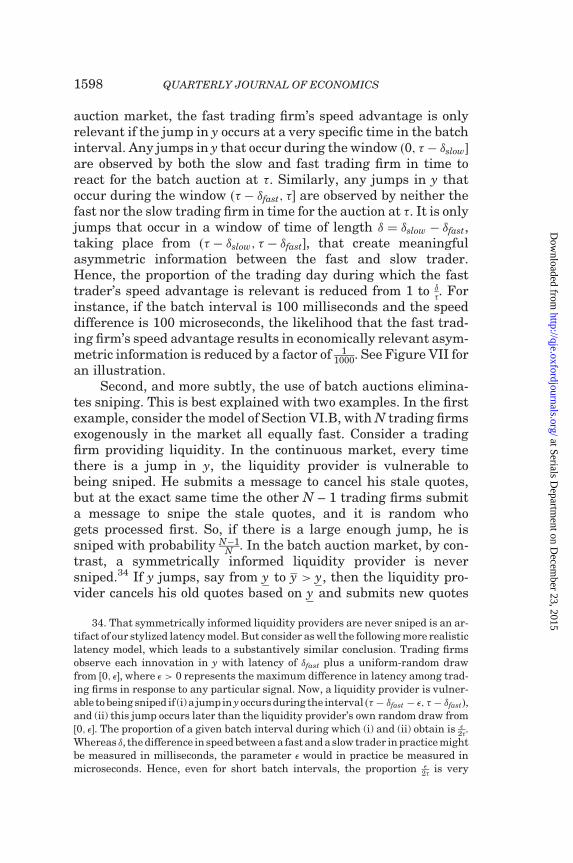
auction market, the fast trading firm’s speed advantage is onlyrelevant if the jump in y occurs at a very specific time in the batchinterval. Any jumps in y that occur during the window ð0; � � �slow�
are observed by both the slow and fast trading firm in time toreact for the batch auction at �. Similarly, any jumps in y thatoccur during the window ð� � �fast; �� are observed by neither thefast nor the slow trading firm in time for the auction at �. It is onlyjumps that occur in a window of time of length � ¼ �slow � �fast,taking place from ð� � �slow; � � �fast�, that create meaningfulasymmetric information between the fast and slow trader.Hence, the proportion of the trading day during which the fasttrader’s speed advantage is relevant is reduced from 1 to �
�. Forinstance, if the batch interval is 100 milliseconds and the speeddifference is 100 microseconds, the likelihood that the fast trad-ing firm’s speed advantage results in economically relevant asym-metric information is reduced by a factor of 1
1000. See Figure VII foran illustration.
Second, and more subtly, the use of batch auctions elimina-tes sniping. This is best explained with two examples. In the firstexample, consider the model of Section VI.B, with N trading firmsexogenously in the market all equally fast. Consider a tradingfirm providing liquidity. In the continuous market, every timethere is a jump in y, the liquidity provider is vulnerable tobeing sniped. He submits a message to cancel his stale quotes,but at the exact same time the other N – 1 trading firms submita message to snipe the stale quotes, and it is random whogets processed first. So, if there is a large enough jump, he issniped with probability N�1
N . In the batch auction market, by con-trast, a symmetrically informed liquidity provider is neversniped.34 If y jumps, say from y to y > y, then the liquidity pro-vider cancels his old quotes based on y and submits new quotes
34. That symmetrically informed liquidity providers are never sniped is an ar-tifact of our stylized latency model. But consider as well the following more realisticlatency model, which leads to a substantively similar conclusion. Trading firmsobserve each innovation in y with latency of �fast plus a uniform-random drawfrom ½0; e�, where e > 0 represents the maximum difference in latency among trad-ing firms in response to any particular signal. Now, a liquidity provider is vulner-able to being sniped if (i) a jump in yoccurs during the interval ð� � �fast � e; � � �fastÞ,and (ii) this jump occurs later than the liquidity provider’s own random draw from½0; e�. The proportion of a given batch interval during which (i) and (ii) obtain is e
2�.Whereas �, the difference in speed between a fast and a slow trader in practice mightbe measured in milliseconds, the parameter e would in practice be measured inmicroseconds. Hence, even for short batch intervals, the proportion e
2� is very
QUARTERLY JOURNAL OF ECONOMICS1598
at Serials Departm
ent on Decem
ber 23, 2015http://qje.oxfordjournals.org/
Dow
nloaded from
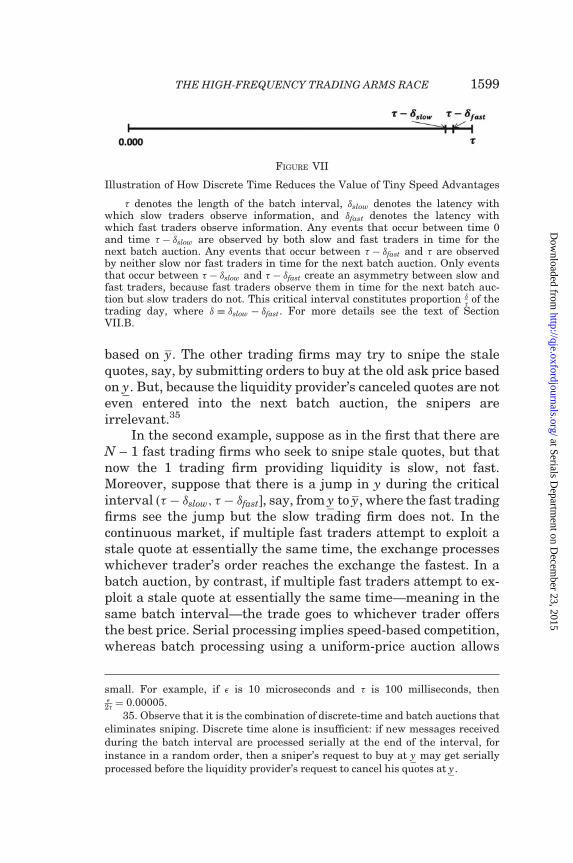
based on y. The other trading firms may try to snipe the stalequotes, say, by submitting orders to buy at the old ask price basedon y. But, because the liquidity provider’s canceled quotes are noteven entered into the next batch auction, the snipers areirrelevant.35
In the second example, suppose as in the first that there areN – 1 fast trading firms who seek to snipe stale quotes, but thatnow the 1 trading firm providing liquidity is slow, not fast.Moreover, suppose that there is a jump in y during the criticalinterval ð� � �slow; � � �fast�, say, from y to y, where the fast tradingfirms see the jump but the slow trading firm does not. In thecontinuous market, if multiple fast traders attempt to exploit astale quote at essentially the same time, the exchange processeswhichever trader’s order reaches the exchange the fastest. In abatch auction, by contrast, if multiple fast traders attempt to ex-ploit a stale quote at essentially the same time—meaning in thesame batch interval—the trade goes to whichever trader offersthe best price. Serial processing implies speed-based competition,whereas batch processing using a uniform-price auction allows
FIGURE VII
Illustration of How Discrete Time Reduces the Value of Tiny Speed Advantages
� denotes the length of the batch interval, �slow denotes the latency withwhich slow traders observe information, and �fast denotes the latency withwhich fast traders observe information. Any events that occur between time 0and time � � �slow are observed by both slow and fast traders in time for thenext batch auction. Any events that occur between � � �fast and � are observedby neither slow nor fast traders in time for the next batch auction. Only eventsthat occur between � � �slow and � � �fast create an asymmetry between slow andfast traders, because fast traders observe them in time for the next batch auc-tion but slow traders do not. This critical interval constitutes proportion �
� of thetrading day, where � � �slow � �fast. For more details see the text of SectionVII.B.
small. For example, if e is 10 microseconds and � is 100 milliseconds, thene
2� ¼ 0:00005.35. Observe that it is the combination of discrete-time and batch auctions that
eliminates sniping. Discrete time alone is insufficient: if new messages receivedduring the batch interval are processed serially at the end of the interval, forinstance in a random order, then a sniper’s request to buy at y may get seriallyprocessed before the liquidity provider’s request to cancel his quotes at y.
THE HIGH-FREQUENCY TRADING ARMS RACE 1599
at Serials Departm
ent on Decem
ber 23, 2015http://qje.oxfordjournals.org/
Dow
nloaded from
for price competition. Equilibrium price competition among fasttraders then drives the price of x up to its new correct level,namely, y. At any hypothetical market-clearing price p < y,each fast trader strictly prefers to deviate and bid a tinyamount more, so in any equilibrium the market-clearing pricein the auction is y.
Thus, frequent batch auctions eliminate sniping and thearms race by transforming the nature of competition among trad-ing firms: from competition on speed to competition on price. Wesummarize this discussion as follows:
PROPOSITION 6 (Batching Eliminates Sniping and the ArmsRace). Consider the frequent batch auction market designin the model of Section VI.D.
(i) The proportion of the trading day during which jumps in yleave a slow liquidity provider vulnerable to being snipedby a fast trader is �
�.(ii) The proportion of the trading day during which jumps in y
leave a fast liquidity provider vulnerable to being sniped is 0.(iii) If there are N � 2 fast traders exogenously in the market,
and there is a slow liquidity provider with a vulnerable stalequote—that is, there is a jump in y during ð� � �slow; � � �fast�
such that y���fastis either greater than the slow liquidity
provider’s ask or less than the bid—then Bertrand competi-tion among the fast traders drives the batch auction price ofx to y���fast
. The slow liquidity provider transacts at y���fast.
By contrast, in the continuous limit order book:
(i) The proportion of the trading day during which jumps in yleave a slow liquidity provider vulnerable to being snipedby a fast trader is 1.
(ii) A fast liquidity provider is sniped for proportion N�1N of
sufficiently large jumps in y, where N is the number offast traders present in the market. This is the case eventhough she observes jumps in y at exactly the same timeas the other N – 1 fast traders.
(iii) If there are N � 2 fast traders present in the market, andthere is a slow liquidity provider with a vulnerable stalequote—that is, there is a jump in y at time t such that yt iseither greater than the slow liquidity provider’s ask or lessthan the bid—then whichever of the N fast traders’ orders
QUARTERLY JOURNAL OF ECONOMICS1600
at Serials Departm
ent on Decem
ber 23, 2015http://qje.oxfordjournals.org/
Dow
nloaded from
is processed by the exchange first transacts at the stalequote. The slow liquidity provider transacts at the stalequote.
VII.C. Equilibrium of Frequent Batch Auctions
Section VII.B described why frequent batch auctions elimi-nate sniping and the HFT arms race, by reducing the value of tinyspeed advantages and transforming competition on speed intocompetition on price. In this section we study how this in turntranslates into equilibrium effects on bid-ask spreads, marketdepth, and investment in speed. Following the analysis ofSection VI, we first consider the case of exogenous entry andthen consider endogenous entry.
1. Model. We study the equilibria of frequent batch auctionsusing the model of Section VI.A that we used to study the contin-uous limit order book, with one modification. In the model ofSection VI.A, investors arrive according to a Poisson processwith arrival rate linvest. In the context of the continuousmarket, the Poisson process makes an implicit finiteness assump-tion, because the probability that more than one investor arrivesat any instant is zero. Here, we need to make an explicit finite-ness assumption. Specifically, we assume that investors continueto arrive according to the Poisson process, and continue to beequally likely to need to buy or sell a unit, but we assume thatthe net demand of investors in any batch interval—number whoneed to buy minus number who need to sell—is bounded.Formally, let Að�Þ denote the random variable describing thenumber of investors who arrive in a batch interval of length �,and let Dð�Þ denote the random variable describing their netdemand. We assume that Dð�Þ is symmetric about zero and thatthere exists a Q <1 such that the absolute value of Dð�Þ isbounded by Q � 1. We view this assumption as innocuous solong as Q is large relative to the standard deviation of thePoisson arrival process,
ffiffiffiffiffiffiffiffiffiffiffiffiffiffiffi�linvest
p.
2. Exogenous Entry
We begin by considering the setting of Section VI.B in whichthe number of trading firms is exogenously set to N � 2 and thereis no latency.
THE HIGH-FREQUENCY TRADING ARMS RACE 1601
at Serials Departm
ent on Decem
ber 23, 2015http://qje.oxfordjournals.org/
Dow
nloaded from

Since all trading firms are equally fast, there is no sniping,per the discussion in Section VII.B. Since all of the other sourcesof costly liquidity provision are turned off, there exists an equi-librium in which fast trading firms offer at least the maximumnecessary depth, Q, at zero bid-ask spread,36 and investors tradeat market in the batch auction immediately following their arri-val. This equilibrium is essentially unique and obtains for anybatch interval � > 0.
PROPOSITION 7 (Equilibrium of Frequent Batch Auctions withExogenous Entry). Fix any batch interval � > 0 and anynumber of trading firms N � 2. In any equilibrium of thefrequent batch auction market design with exogenousentry, investors trade at market in the next batch auctionafter their arrival, and the N trading firms collectively offerat least the maximum necessary depth to satisfy investordemand at zero bid-ask spread. As compared to the equilib-rium of the continuous limit order book market, the equilib-rium effects of frequent batch auctions are as follows:
(i) The bid-ask spread for the first-quoted unit is narrower: itis 0 instead of the spread characterized by equation (3).
(ii) The market is deeper: the order book has the maximumdepth necessary to serve all investors at zero bid-askspread, whereas in the continuous limit order book, asper the model considered in Section VI.B.4, the bid-askspread grows wider with the quantity traded.
This equilibrium highlights the central differences betweenfrequent batch auctions and the continuous limit order book.There are no longer rents from symmetrically observed publicinformation; in equilibrium, trading firms earn zero rents.Liquidity providers are no longer vulnerable to sniping; discretetime affords liquidity providers an opportunity after each jump iny to adjust their quotes to reflect the new public information.Bertrand competition competes the bid-ask spread to zero, andgenerates effectively infinite market depth, as we would haveexpected given the model setup.
36. We maintain the convention from Section VI that it is possible to offer a zerobid-ask spread. Formally, fast trading firms can be interpreted as offering to buy atleast Q units at price y� � e and sell at least Q units at price y� þ e, in the limit ase!0þ.
QUARTERLY JOURNAL OF ECONOMICS1602
at Serials Departm
ent on Decem
ber 23, 2015http://qje.oxfordjournals.org/
Dow
nloaded from
3. Endogenous Entry. In this section we consider the equilib-rium of frequent batch auctions with endogenous entry. We showthat if the batch interval � is sufficiently large relative to � there isan essentially unique equilibrium in which no trading firms paythe cost cspeed to have latency �fast rather than �slow. Liquidity isprovided to investors by slow trading firms. As in the equilibriumwith exogenous entry, competition leads to a bid-ask spread ofzero and effectively infinite depth.
Suppose that slow trading firms in aggregate provide Q ofdepth for x at zero bid-ask spread. That is, in the auction endingat �, slow trading firms collectively offer to buy and sell Q units atprice y���slow
, where y���slowrepresents the best available informa-
tion for a slow trader about the value of security x in the auctionending at �.
A potential entrant considers whether to invest cspeed to befast, with the aim of sniping this Q of depth in the event thatthere is a jump in y in the time interval ð� � �slow; � � �fast�, whichthe entrant would observe and the slow trading firms providingliquidity would not. If there are Q units of depth in the limit orderbook, and there is, say, a positive jump, the entrant will wish tobuy all Q units at the stale ask prices. If the imbalance D ofinvestors—number of orders to buy minus orders to sell—is pos-itive, then the amount that the fast trader can transact will besmaller than Q by the amount D, because the investors willoutbid him for D of the Q units. On the other hand, if the imbal-ance D is negative, the fast trader can transact not just the Qunits offered by the slow trading firms but can also satisfy theimbalance. He can achieve this by submitting a large limit orderto buy at a price slightly larger than y���slow
, so that he purchasesall Q units at the ask of y���slow
as well as satisfies the D netmarket orders to sell. Hence, the fast trader transacts an ex-pected quantity of Q units in any batch interval where there isan exploitable jump.
Let pjump denote the probability that there are one or morejumps in y in the � interval, and let J0 denote the random variabledescribing the total jump amount in a � interval, conditional onthere being at least one jump. Since the probability of multiplejumps in a � interval is small, pjump&�ljump and EðJ0Þ&EðJÞ. Thefast trader’s expected profits from exploiting the slow liquidityproviders, on a per unit time basis, are thus pjump
� EðJ0Þ �Q& �� �
ljumpEðJÞ �Q. Note that a difference versus the analogous expres-sion in equation (2) is that the bid-ask spread is now zero, so any
THE HIGH-FREQUENCY TRADING ARMS RACE 1603
at Serials Departm
ent on Decem
ber 23, 2015http://qje.oxfordjournals.org/
Dow
nloaded from
jump can be profitably exploited, in the full jump size amount.The fast trading firm’s costs per unit time are cspeed. Hence, entryas a fast trading firm sniping the slow trading firms is not optimalif, using the approximations above,
�
�� ljump � EðJÞ �Q < cspeed:ð8Þ
The fraction �� is the proportion of time that the fast trader
sees jumps in y that the slow traders do not see in time (seeFigure VII), and these jumps occur at rate ljump. The LHS ofequation (8) is thus increasing in �, the fast trader’s speed advan-tage, but decreasing in �, the batch interval. Intuitively, in a longbatch interval, most jumps occur at times where both the fast andslow traders are able to react in time.
For any finite Q, equation (8) is satisfied for sufficiently large�. Hence, any desired market depth can be provided by slow trad-ing firms at zero cost if the batch interval � is sufficiently large.Moreover, the maximum depth Q consistent with equation (8)grows linearly with �, whereas the expected imbalance of investordemand in a batch interval grows at rate
ffiffiffi�p
.We summarize the derived equilibrium as follows.
PROPOSITION 8 (Equilibrium of Frequent Batch Auctions withEndogenous Entry). Fix any batch interval � satisfyingpjump
� EðJ0Þ �Q < cspeed, the exact version of equation (8). Inany equilibrium of the frequent batch auction marketdesign with endogenous entry, investors trade at market inthe next batch auction after their arrival, and slow tradingfirms collectively offer at least the maximum necessary depthto satisfy investor demand at zero bid-ask spread. As com-pared to the equilibrium of the continuous limit order bookmarket, the equilibrium effects of frequent batch auctions areas follows:
(i) The bid-ask spread for the first-quoted unit is narrower: it
is 0 instead ofN��cspeed
linvest.
(ii) The market is deeper: the order book has the maximumdepth necessary to serve all investors at zero bid-askspread, whereas in the continuous limit order book, asper the extended model considered in Section VI.B, thebid-ask spread grows wider with the quantity traded.
(iii) Social welfare:
QUARTERLY JOURNAL OF ECONOMICS1604
at Serials Departm
ent on Decem
ber 23, 2015http://qje.oxfordjournals.org/
Dow
nloaded from
. Benefits: there is no more arms race. Trading firmschoose latency �slow rather than paying cspeed to havelatency �fast. This generates a welfare savings of N��cspeed per unit time, where N� is the number of fasttrading firms in equilibrium of the continuous limitorder book.
. Costs: investors have to wait a positive amount oftime to complete their trade. Expected delay costsare 1
�
R �0 fdelaycostðxÞlinvestdx per unit time.
Notice that with respect to social welfare, frequent batch auc-tions have both benefits and costs. The benefit is that they stopthe arms race in speed, which we showed in Proposition 4 can beunderstood as a socially wasteful prisoner’s dilemma.37 The costis that investors have to wait a positive amount of time to trade,so they incur delay costs. Intuition suggests that these delay costsare likely to be negligible for the kinds of time intervals we arediscussing in this article, but since we lack a theoretical founda-tion for where these delay costs come from, we do not reach adefinitive conclusion about social welfare in the proposition.38
In Online Appendix B.3.1, we use a combination of our ES-SPY analysis and information from HFT public documents to cal-ibrate equation (8). The goal of this exercise is not to determinethe optimal batch interval, but rather to get an extremely rough
37. Frequent batch auctions enhance liquidity, but since investors’ demand totrade is inelastic in our model this enhanced liquidity does not translate into awelfare gain. In a richer model with elastic demand to trade this would be an addi-tional welfare benefit of frequent batch auctions.
38. The working paper version of this article considers the case where � failsequation (8). In this case, it is no longer an equilibrium for liquidity to be provided bytrading firms who do not pay cspeed. Such trading firms would be too vulnerable tosniping. Instead, liquidity is provided by a fast trading firm who pays cspeed, as in theequilibrium of the continuous limit order book with endogenous entry. The keydifference is that the fast trading firm is no longer vulnerable to sniping, as perProposition 6. As a result, the equilibrium bid-ask spread is narrower and depth isgreater than in the continuous market with endogenous entry, though the spread iswider and the market is less deep than in the case of � satisfying equation (8).Equilibrium expenditure on speed also lies between the continuous market withendogenous entry and frequent batch auctions with � satisfying equation (8). In thelimiting case of �!0þ we can reach a definitive welfare conclusion, because thereare benefits of frequent batch auctions—though not as large as in the case where �satisfies equation (8)—and zero costs, because investor delay costs vanish as thedelay goes to zero.
THE HIGH-FREQUENCY TRADING ARMS RACE 1605
at Serials Departm
ent on Decem
ber 23, 2015http://qje.oxfordjournals.org/
Dow
nloaded from
sense of magnitudes for how long a batch interval is long enoughto stop the HFT speed race. The parameter � is open to two po-tential interpretations. One interpretation is that � representsthe year-on-year speed improvements of state-of-the-art HFTs;in New York–Chicago trades like ES-SPY, the difference in one-way latency between state-of-the-art in 2014 versus 2013 was lessthan 100 microseconds. A second interpretation is that � repre-sents the speed difference between HFTs and sophisticated algo-rithmic trading firms that are not at the cutting edge of speed; inNew York–Chicago trades, this difference might be a few milli-seconds. Under the first interpretation of �, when we plug in es-timates for the other parameters in equation (8), we obtain alower bound for � on the order of 10–100 milliseconds. Underthe second interpretation of � we obtain a lower bound for � onthe order of 100 milliseconds to 1 second. Again, we make thecaveat that the exercise is rough and at best gives a sense ofmagnitudes.
Online Appendix B.3.2 discusses a modification of the modelin which, under frequent batch auctions, information arrives indiscrete time rather than continuous time. The idea of this mod-ification is that to the extent that information y about the value ofsecurity x is information about other security prices, then the useof frequent batch auctions would cause information to arrive indiscrete time at frequency �. Under this modification we obtain anequilibrium analogous to one we just got but with a simpler andless stringent sufficient condition under which frequent batchauctions stop the speed race: � > �slow. Under this condition,any time there is a jump in y both slow and fast traders observethe jump in time for the next batch auction. This condition wouldpoint to a lower bound on � on the order of 1–10 milliseconds.
VII.D. Discussion of the Equilibria
In this section, we make two sets of remarks concerning theequilibria of frequent batch auctions.
First, we discuss how the various cases we studied corre-spond to various potential implementations of frequent batchauctions. The exogenous entry case, studied in Section VII.C, isthe right modeling device for scenarios in which the implementa-tion of frequent batch auctions does not have a significant effecton the overall level of investment in speed. This could correspondto either a small-scale implementation of frequent batch auctions
QUARTERLY JOURNAL OF ECONOMICS1606
at Serials Departm
ent on Decem
ber 23, 2015http://qje.oxfordjournals.org/
Dow
nloaded from
(e.g., a pilot test on a small number of stocks), which affects only asmall proportion of the prize in the speed race, or a larger-scaleimplementation but in the short run during which speed invest-ments are somewhat fixed. The endogenous entry case, studied inthe previous section, is more appropriate for scenarios in whichthe implementation of frequent batch auctions would have a sig-nificant impact on trading firms’ speed investment decisions. Thiswould correspond to a larger-scale implementation of frequentbatch auctions, in the medium to long run during which speedinvestments are flexible.
Second, we discuss what our analysis does and does not tellus about the choice of the batch interval. Both the discussion inSection VII.B and the equilibrium analysis for the exogenousentry case clarify that frequent batch auctions have importantbenefits over continuous limit order books even for exceptionallyshort �. In the model, these benefits—the elimination of sniping,which in turn enhances liquidity—manifest for any � > 0. That is,there is a discontinuous benefit from switching from continuoustime to discrete time. More practically, we think of this analysisas pertaining to any � long enough to enable genuine batch pro-cessing of orders by traders responding to the same stimulus withessentially the same speed technology at essentially the sametime. A batch interval of 1 nanosecond technically constitutesdiscrete time but would fail this practical test, because of random-ness in computer response time, communications latencies, etc.
The discussion in Section VII.B and the equilibrium analysisfor the endogenous entry case then clarify that a longer batchinterval has an additional benefit over continuous limit orderbooks, namely that it stops the arms race. In the model ofSection VII.C, in which information arrives in continuous time,the batch interval � should be long in relative terms compared tothe increments at stake in the speed race �. That is, the ratio �
�should be sufficiently small, as per equation (8). In a modificationof the model in which information arrives in discrete time, asdiscussed in Online Appendix B.3.2, the batch interval shouldbe long in absolute terms compared to the speed of slow traders,�slow. The calibration exercise in Online Appendix B.3.1, althoughextremely rough, suggests that a batch interval on the order of 10milliseconds or 100 milliseconds may be sufficient to stop thearms race by either measure.
Lengthening the batch interval may also have real costs,which we capture in a stylized way as investor delay costs.
THE HIGH-FREQUENCY TRADING ARMS RACE 1607
at Serials Departm
ent on Decem
ber 23, 2015http://qje.oxfordjournals.org/
Dow
nloaded from
Intuition suggests that such costs are small if the batch interval issmall, and vanish to zero as the batch interval goes to zero.39
VIII. Alternative Responses to the HFT Arms Race
Policy discussions about the HFT arms race have suggestedseveral alternative responses, most prominently Tobin taxes,minimum resting times, message-to-trade ratios, and randomdelays. In this section we briefly discuss each of these proposals.We also discuss a recent private sector market design innovationthat is an alternative way to mitigate sniping.
VIII.A. Tobin Taxes
Tobin taxes (financial transactions taxes) were originallyproposed as ‘‘sand in the gears’’ to curb perceived excessive spec-ulation and excessive volatility in foreign exchange markets (seeTobin 1978; Summers and Summers 1989). More recently, Tobintaxes have been proposed as a response to the HFT arms race byStiglitz (2014), among others,40 and adopted in fall 2013 by Italy.
Tobin taxes can be formally modeled in our framework asfollows. Introduce a Tobin tax of � > 0 per unit traded to the en-dogenous entry model of Section VI.D. For expositional simplicityassume that the tax is paid by the liquidity-taking side of thetrade. This tax has two effects. The direct effect is that itsimply increases the cost of trading by �. The indirect effect isthat by increasing the cost of trading the Tobin tax reduces theattractiveness of sniping opportunities. This in turn reducesentry by stale-quote snipers, which serves to reduce the equilib-rium bid-ask spread and reduce equilibrium expenditure onspeed. In Online Appendix B.2.1 we show formally that theTobin tax (i) reduces investment in speed; (ii) reduces the snip-ing-cost component of transactions costs; and (iii) increases
39. For example, suppose both options and stocks traded on frequent batchauction markets. Then liquidity providers in the option market, who, if tradedagainst, seek to hedge in the underlying stock, would be exposed to delta risk forthe length of the batch interval.
40. The European Commission proposed a financial transactions tax in 2011. AFrequently Asked Questions document available on the EC website has a question‘‘Who is most irritated by these taxation plans?’’, the answer to which begins: ‘‘Thetaxation plans are, of course, most irritating for high-frequency traders and for fundand hedge fund managers whose business model is based on quick successions offinancial transactions. . .’’ See European Commission (2013).
QUARTERLY JOURNAL OF ECONOMICS1608
at Serials Departm
ent on Decem
ber 23, 2015http://qje.oxfordjournals.org/
Dow
nloaded from
investors’ all in trading costs, that is, from the perspective of in-vestors the cost of the tax outweighs the benefit from less sniping.All three effects are monotonically increasing in �. For intuition,consider the extreme case of a tax larger than the largest possiblesniping opportunity; in this case there is no sniping, no invest-ment in speed, and the equilibrium cost to investors to trade issimply the (very high) tax.
Hence, while the Tobin tax does address sniping and the HFTarms race, it achieves these benefits at the expense of makinginvestors worse off.41 A second caveat is that the Tobin tax is arelatively blunt instrument: to fully eliminate the incentive toinvest in speed, the Tobin tax needs to be larger than the maxi-mum possible sniping opportunity. In our ES-SPY data, reducingarms race profits by 90 percent would require a Tobin tax on theorder of 10 basis points, or roughly 10 times the average SPY bid-ask spread in our data.42
Biais, Foucault, and Moinas (2015) argue for a tax directly onspeed technology as opposed to trading. Such a tax can be mod-eled as increasing the cost of speed from cspeed to cspeed þ �speed,with �speed the level of the tax. Equations (5)–(6) imply that such atax has no effect on investors’ trading costs, while equation (7)implies that such a tax does reduce investment in speed. Hence,in our model, the Biais, Foucault, and Moinas (2015) tax is con-ceptually superior to the traditional Tobin tax. Again, though, themagnitudes necessary to meaningfully impact the arms race arelarge. To reduce arms race expenditures by 90 percent would re-quire a tax of �speed ¼ 9cspeed, that is, a 900 percent tax on speedexpenditures.
41. Whether the Tobin tax enhances social welfare in our model depends on theinterpretation of the social value of the tax revenue that the tax generates. If oneassumes that a dollar of government revenue is as socially valuable as a dollar ofinvestor profit, then the Tobin tax increases welfare. If the government uses therevenue from the Tobin tax to reduce other taxes that are distortionary, then thesocial welfare benefit would be higher; if the government wastes the money, thenthe net social welfare effect would be negative.
42. This assumes that the arbitrageur pays the tax twice per arbitrage oppor-tunity, once in ES and once in SPY. The total tax paid by the arbitrageur is 20 basispoints.
THE HIGH-FREQUENCY TRADING ARMS RACE 1609
at Serials Departm
ent on Decem
ber 23, 2015http://qje.oxfordjournals.org/
Dow
nloaded from
VIII.B. ‘‘Bans’’ on HFT: Message Ratios and Minimum RestingTimes
Two common characteristics of high-frequency trading strat-egies are (i) that HFTs often cancel their orders soon after placingthem, and (ii) a high ratio of messages to completed trades.43 Notcoincidentally, two of the most widely discussed policy responsesto the HFT arms race are minimum resting times and message-to-trade ratios. Minimum resting times prohibit canceling anorder too soon after initial submission; orders must rest in thebook for some minimum quantity of time, such as 500 millise-conds. Message-to-trade ratios prohibit having a ratio of mes-sages to completed trades that is above some maximumthreshold.
We wish to make two points about these proposals. First,these proposals seem to misunderstand cause and effect. Ourmodel shows that both of these characteristics of HFT tradingstrategies are part of equilibrium behavior under the continuouslimit order book. Liquidity providers cancel their orders and re-place them with new orders every time there is a jump in y. Stale-quote snipers cancel their orders whenever their attempt to snipedoes not win the race. See also Baruch and Glosten (2013) whoanalyze additional reasons why the continuous market may leadto what they call ‘‘flickering quotes.’’
Second, minimum resting times seem likely to exacerbaterather than reduce sniping. Specifically, if there is a jump in ythat is within the resting time of the previous jump, then liquidityproviders with stale quotes in the book are simply prohibited fromattempting to cancel their stale quotes, ensuring that they will besniped with probability 1.
VIII.C. Random Message Delays
Random message delays are described by Harris (2012) asfollows: ‘‘Regulatory authorities could require that all exchangesdelay the processing of every posting, canceling, and taking in-struction they receive by a random period of between 0 and 10milliseconds.’’ The idea is that millisecond-level randomnessdwarfs any microsecond-level differences in speed among trading
43. The SEC’s Concept Release on Equity Market Structure listed these as twoof five common characteristics of HFT strategies, along with the use of speed tech-nology, the use of colocation, and ending the trading day close to flat (Securities andExchange Commission 2010).
QUARTERLY JOURNAL OF ECONOMICS1610
at Serials Departm
ent on Decem
ber 23, 2015http://qje.oxfordjournals.org/
Dow
nloaded from
firms responding to the same stimulus, which in turn reduces theincentive to invest in tiny speed improvements. Although intui-tively appealing, there are two important concerns with randommessage delays. First, random message delays do not addresssniping. If a liquidity provider attempts to cancel a stale quote,and other trading firms attempt to snipe a stale quote, therandom message delay just adds an additional source of random-ness regarding whose request is processed first. If there are Nfirms approximately equally fast, each of whom send one mes-sage, and the random message delay is large relative to any dif-ferences in speed among the N firms, then the liquidity providerwill get sniped with probability of approximately N�1
N , just as inour model without random delay.
Second, random message delays incentivize trading firms tosubmit redundant messages. Consider our model of Section VI.B,modified to include a random message delay that is a uniformrandom draw from ½0; e�. Suppose there is a jump in y thatcauses a liquidity provider’s quotes to become stale. Then eachof the other N – 1 trading firms has incentive to submit not justone message to snipe, but many, because each message to snipe islike a lottery ticket hoping to get a short random delay. Similarly,the liquidity provider has incentive to submit not just one butmany messages to cancel their stale quote, again in the hopesthat one of these messages will get processed with delay 0.44
We show both of these points formally in Online AppendixB.2.2. Adding a random message delay to our model of the con-tinuous limit order book with endogenous entry in Section VI.Dhas no effect on sniping, equilibrium expenditure on speed, or thebid-ask spread; the only effect is to encourage redundant messagetraffic.
VIII.D. Asymmetric Delay to Immediately Executable Orders
The previous section discussed why random message delaysdo not address sniping and encourage redundant message traffic.Consider, however, the following alternative, which captures the
44. A natural idea in response to this concern is to place a cap on the number ofredundant messages any one firm can send, for instance, a cap of one message perfirm. However, such a cap would at best have no effect on sniping and could actuallyexacerbate sniping. The reason is that the cap would certainly bind for liquidityproviders, whose message to cancel is tied to a specific quote of theirs in the book,whereas stale-quote snipers could circumvent a message cap by using multipletrading accounts.
THE HIGH-FREQUENCY TRADING ARMS RACE 1611
at Serials Departm
ent on Decem
ber 23, 2015http://qje.oxfordjournals.org/
Dow
nloaded from

key idea of recent market design innovations by TMX and IEX:apply a deterministic but asymmetric delay of � > 0 only to im-mediately executable orders.45,46 If immediately executableorders are delayed but posting and canceling messages are not,then, when there is a jump in y, liquidity providers have a headstart over stale-quote snipers in the race to react. In the model ofSection VI.D, it is straightforward to see that if the delay � ex-ceeds the difference in speed � between fast and slow tradingfirms, then slow trading firms can provide liquidity without riskof being sniped by fast trading firms. Recent work by Baldauf andMollner (2014) shows this formally.
Hence, in our model of Section VI, the asymmetric delayeliminates sniping and stops the arms race. However, there aretwo important disadvantages of the asymmetric delay relative tofrequent batch auctions, each of which can be captured withsimple extensions of our model. Both disadvantages stem fromthe fact that the continuous limit order book with asymmetricdelay is still a continuous-time serial-process market design,and as a result cannot eliminate the incentive to be a tiny bitfaster than the competition.
45. The key details of the TMX Group’s proposed TSX Alpha Exchange are asfollows. There is an order type called Post Only that can be entered and canceledwithout delay. The two requirements on Post Only orders are (i) that they be nonex-ecutable at the time of submission, and (ii) that their quantity exceed a minimumthreshold. All other orders and cancels are subject to a delay, called a speed bump.The length of the delay is random, which our analysis in Section VIII.C suggestsmay not be wise. For more details on the proposed rules see http://www.osc.gov.on.ca/documents/en/Marketplaces/alpha-exchange_20141106_amd-request-for-com-ments.pdf.
46. The key details of the IEX Alternative Trading System are as follows (seeIEX Group 2014). There is a 350-microsecond delay applied symmetrically to allorders and cancels. In addition, there is price-sliding logic that adjusts stale quotesin the order book based on updates to the National Best Bid and Offer (NBBO)coming from otherUSequity exchanges. The rule is that any order present in theIEX limit order book that is priced more aggressively than the NBBO midpointslides to the NBBO midpoint. Since IEX receives updates to the NBBO fasterthan the 350-microsecond delay (latency in the NBBO is on the order of 200 micro-seconds, given the geographical distances between the different exchanges’ datacenters in New Jersey), the effect of the combination of the symmetric speed bumpand price-sliding logic is economically similar to the effect of an asymmetric delay.Formally, if innovations in y are interpreted as innovations in the NBBO, then theIEX market design eliminates sniping in our model just as does the asymmetricdelay.Apotential concern about this market design is that it only mitigates snipingto the extent that prices are discovered via the NBBO exchanges rather than IEX.
QUARTERLY JOURNAL OF ECONOMICS1612
at Serials Departm
ent on Decem
ber 23, 2015http://qje.oxfordjournals.org/
Dow
nloaded from
First, the asymmetric delay does not address the race to thetop of the book; see Yao and Ye (2014) and Moallemi (2014) foranalyses of this component of the speed race. Formally, consider amodification to the model of Section VI in which trades can onlyoccur at prices on a discrete price grid, with the incrementdenoted � > 0. Suppose that � is large relative to the bid-askspread that would obtain in the absence of a price constraint;this is a common case in practice (Yao and Ye 2014). In thiscase, in the continuous market, trading firms strictly prefer therole of liquidity provider to the role of stale-quote sniper (see note19). In equilibrium, after jumps in y, there are races both to snipestale quotes and to be at the top of the queue to provide liquidityat the new price level. Frequent batch auctions address bothraces. The advantage a fast trading firm has over a slow tradingfirm with respect to obtaining priority in the order book is pro-portional to �
�,47 just as is the advantage a fast trading firm has
over a slow trading firm with respect to sniping stale quotes. Bycontrast, the asymmetric delay has zero effect on the race to thetop of the book.
Second, the asymmetric delay does not transform competi-tion on speed into competition on price if there are quotes in thebook that become stale based on public information and are notupdated within �; for example, nonmarketable limit orders sub-mitted by participants more than � slower than the cutting edge.Formally, consider a modification of our model in Section VI inwhich some investors have latency �slower > � and attempt to sat-isfy their demand to trade by buying at the bid or selling at theask. This behavioral type captures the idea that some investorsattempt to trade without paying the bid-ask spread even thoughtheir monitoring technology is meaningfully slower than the cut-ting edge. Suppose a behavioral type’s quote becomes stale basedon a sufficiently large jump in the public signal y. In the contin-uous limit order book with asymmetric delay, the stale quote in-duces a race to snipe; whichever trading firm reacts first gets totrade at the stale price. In the frequent batch auction market thestale quote induces competition on price and will get filled at aprice determined by the batch auction based on the new public
47. The fast trading firm obtains time priority in the book over the slow tradingfirm only if their order reaches the order book in an earlier batch interval. Hence,just as depicted in Figure VII, it is only jumps in y that occur during a �
� proportion ofthe batch interval that give a time priority advantage to the fast trading firm.
THE HIGH-FREQUENCY TRADING ARMS RACE 1613
at Serials Departm
ent on Decem
ber 23, 2015http://qje.oxfordjournals.org/
Dow
nloaded from
information rather than at the stale price. Put differently, non-HFTs can provide liquidity in frequent batch auctions withoutgetting sniped, even if they are more than � slower than thecutting edge, whereas they would get sniped by HFTs in the con-tinuous limit order book with asymmetric delay.
IX. Computational Advantages of Discrete-Time Trading
Our theoretical argument for frequent batch auctions as aresponse to the HFT arms race focuses on sniping, liquidity,and socially wasteful expenditure on speed. Practitioners andpolicy makers have argued that another important cost of theHFT arms race is that it is destabilizing for financial markets,making the market more vulnerable to extreme events such asthe Flash Crash.48 Although an analysis of the effect of frequentbatch auctions on market stability is beyond the scope of the pre-sent article, here we discuss several computational simplicity ad-vantages of discrete-time trading over continuous-time trading.As we note in the conclusion, we think that market stability is animportant topic for future research.
First, frequent batch auctions are computationally simple forexchanges. Uniform-price auctions are fast to compute,49 and
48. Duncan Niederauer, former CEO of NYSE Euronext, testified to Congresson market structure issues including the Flash Crash that ‘‘there is reason forCongress and the SEC to be concerned that without action, we leave ourselvesopen to a greater loss of investor confidence and market stability. To solve theproblem, policymakers should focus on establishing fairer and more transparentequity markets, as well as a more level playing field among trading centers andinvestors’’ (Niederauer 2012). See also the report on the regulatory response to theFlash Crash prepared by the Joint CFTC-SEC Advisory Committee on EmergingRegulatory Issues (SEC and CFTC 2010), the CFTC Concept Release on RiskControls and System Safeguards for Automated Trading (Commodity FuturesTrading Commission 2013), and policy papers by Haldane (2011) and Farmer andSkouras (2012).
49. Formally, the processing time of the uniform-price auction is Oðn log nÞ,where n is the number of orders. Sorting bids and asks to compute the demandand supply curve is Oðn log nÞ (Cormen et al. 2009), and then walking down thedemand curve and up the supply curve to compute the market clearing price is O(n).We also ran some simple computational simulations of uniform-price auctions,using randomly generated bids and asks, on an ordinary laptop using C++. Wefound that a uniform-price auction with 250,000 orders—the rate of messages persecond during the flash crash according to a Nanex analysis (2011)—cleared inabout 10 milliseconds in this simple computational environment.
QUARTERLY JOURNAL OF ECONOMICS1614
at Serials Departm
ent on Decem
ber 23, 2015http://qje.oxfordjournals.org/
Dow
nloaded from

exchange computers can be allocated a discrete block of timeduring which to perform this computation.50 By contrast, in thecontinuous limit order book market design, exchange computersare not allocated a block of time during which to perform orderprocessing, but instead process orders and other messages seriallyon arrival. While processing any single order is computationallytrivial, even a trivial operation takes strictly positive computa-tional time, which implies that during surges of activity therewill be backlog and processing delay. This backlog can lead to con-fusion for trading algorithms, which are temporarily left uncertainabout the state of their own orders. Moreover, backlog is mostsevere at times of especially high market activity, when relianceon low-latency information is also at its highest; Facebook’s initialpublic offering on NASDAQ and the Flash Crash are salientexamples (Nanex 2011; Jones 2013; Strasburg and Bunge 2013).
A second computational simplicity benefit of frequent batch-ing is that it gives algorithmic traders a discrete block of timebetween when they receive a message—for example, a trade no-tification or an order book update—and by when they must makea decision, for example, submit a new order. In the continuousmarket, by contrast, trading algorithms are incentivized to reactas fast as possible whenever they receive a new piece of informa-tion. This means, first, that trading algorithms are incentivized totrade off ‘‘smarts’’ for speed, that is, to make trading decisionsbased on only partial information and with only simple economiclogic, since incorporating additional information and using morecomplicated economic logic each take time. And, second, thattrading algorithms are incentivized to trade off error and riskchecking for speed, because error and risk checking each taketime and even tiny speed advantages can matter.51 While discretetime certainly will not prevent trading firms from making pro-gramming errors (e.g., the Knight Capital incident of August2012, see Strasburg and Bunge 2012), it does reduce the incentiveto sacrifice robustness for speed.
50. For instance, with a 100 millisecond batch interval, the first 10 millisecondsof each batch interval could be allocated to the exchange computers for computingand reporting outcomes from the previous batch interval.
51. The sociologist Donald MacKenzie (2014) provides several detailed exam-ples of this trade off between code robustness and speed described to him in inter-views with high-frequency traders. For example, one trader is quoted ‘‘There arerules you need to follow to write fast code. Don’t touch the kernel. Don’t touch mainmemory . . . . Don’t branch.’’
THE HIGH-FREQUENCY TRADING ARMS RACE 1615
at Serials Departm
ent on Decem
ber 23, 2015http://qje.oxfordjournals.org/
Dow
nloaded from
Third, discrete time simplifies the market paper trail for reg-ulators and other market observers. In the continuous-timemarket, figuring out the precise sequence of market events isdifficult to impossible. Exchange timestamps are always some-what noisy, due to various processing delays including backlog,which means that the sequence of time stamps across exchangesmay not reflect the actual sequence of events. Further complicat-ing the paper trail is the need to adjust for relativity—even per-fect time stamps do not reveal the sequence of events because thesequence of events depends on the location of the observer. In thediscrete-time market the paper trail is much simpler: the regula-tory authorities observe everything that happens at time t, tþ �,tþ 2�, etc. As long as the batch interval � is long relative to theimprecision in time stamps and latency across exchanges, thecomplexities that affect the continuous market’s paper trailbecome nonissues. As evidence for the potential importance of asimple paper trail, consider that it took months of analysis forregulators to understand the basic sequence of events that causedthe Flash Crash (SEC and CFTC 2010), and even today our un-derstanding of that day’s events remains incomplete.
Last, discrete time makes it technologically possible to dis-seminate public information symmetrically. In the continuous-time market, it is technologically difficult to disseminateinformation in such a way that all market participants whowish to receive it do so at the same time. Two recent examplesthat have attracted considerable attention are the SEC’s diffi-culty with symmetric dissemination of corporate filings (Rogers,Skinner, and Zechman 2014) and the discrepancy in latency be-tween direct exchange feeds and the SIP feed (Ding, Hanna, andHendershott 2014; see also Lewis 2014). Moreover, even if infor-mation could be disseminated in such a way that all market par-ticipants who wish to receive it do so at exactly the same time, ourmodel in Section VI shows that, economically, the continuous-time market processes their responses to the information as ifthe information were asymmetric. In contrast, in the discrete-time market it is technologically simple both to disseminate in-formation to many participants at the same time and to processtheir responses at the same time.
In a sense, continuous-time markets implicitly assume thatcomputers and communications are infinitely fast. Computers arefast but not infinitely so. Discrete time respects the limits ofcomputers.
QUARTERLY JOURNAL OF ECONOMICS1616
at Serials Departm
ent on Decem
ber 23, 2015http://qje.oxfordjournals.org/
Dow
nloaded from
X. Conclusion
This article argues that the continuous limit order book is aflawed market design and proposes a new market design, fre-quent batch auctions, which directly addresses the flaw. Torecap, our basic argument is as follows. First, we show empiri-cally that the continuous limit order book market design does notreally ‘‘work’’ in continuous time: correlations completely breakdown at high-frequency time scales, which leads to obvious me-chanical arbitrage opportunities. The time series evidence sug-gests that the arms race profits should be thought of more as aconstant of the market design, rather than as a prize that is com-peted away over time. Next, we build a simple theoretical modelguided by these empirical facts. We show that the mechanicalarbitrage opportunities we observed in the data are in a sense‘‘built in’’ to the market design: even symmetrically observedpublic information creates arbitrage rents. These rents come atthe expense of liquidity provision, as measured by both bid-askspreads and market depth, and induce a never-ending arms racefor speed. Last, we show that frequent batch auctions eliminatethe mechanical arbitrages and the HFT arms race, which in turnenhances liquidity and, unless investors are extremely impatient,improves social welfare. Discrete time makes tiny speed advan-tages orders of magnitude less valuable, and the auction trans-forms competition on speed into competition on price.
There are several important directions for future research.First, our model is extremely stylized. This level of abstraction isappropriate both for making stark the key design flaw of the con-tinuous limit order book and for articulating why frequent batchauctions directly address the flaw. However, future analysis offrequent batch auctions should be conducted in a richer modelingenvironment, ideally including features such as asymmetric in-formation, inventory management considerations, multilegtrades, and investors needing to trade large quantities overtime. Among other things, such a model would help shed lighton the optimal batch interval.
A second area for future research is the nature of competitionamong exchanges. Suppose that one or more exchanges adoptfrequent batch auctions while other exchanges continue to usecontinuous trading: what is the equilibrium? Can an entrant ex-change that adopts frequent batch auctions attract market share?We note that these questions may also be related to the analysis
THE HIGH-FREQUENCY TRADING ARMS RACE 1617
at Serials Departm
ent on Decem
ber 23, 2015http://qje.oxfordjournals.org/
Dow
nloaded from
of the optimal batch interval. They may have implications forregulatory policy as well.
A third topic for future research is the effect of frequent batchauctions on market stability. In Section IX we discussed severalcomputational advantages of discrete-time trading over continu-ous-time trading. For example, the market paper trail becomessimpler because issues that complicate the paper trail in contin-uous time—exchange and communication latency, clock synchro-nization, the discrepancy between direct feeds and the SIP feed,relativity—are nonissues in discrete time. However, we cautionthat this discussion was necessarily informal and speculative.Further research is needed, especially to understand whetherand to what extent computational simplicity reduces the market’svulnerability to the kinds of extreme events at the center of thedebate on the effect of HFT on market stability.
University Of Chicago
University Of Maryland
University Of Chicago
Supplementary Material
An Online Appendix for this article can be found at QJEonline (qje.oxfordjournal.org).
References
Adler, Jerry, ‘‘Raging Bulls: How Wall Street Got Addicted to Light-SpeedTrading,’’ Wired Magazine, August 2012, available at http://www.wired.com/business/2012/08/ff_wallstreet_trading/.
Angel, James J., Lawrence E. Harris, and Chester S. Spatt, ‘‘Equity Trading in the21st Century: An Update,’’ Quarterly Journal of Finance, 5 (2015), 1–39.
Baldauf, Markus, and Joshua Mollner, ‘‘High-Frequency Trade and MarketPerformance,’’ Working Paper, 2014.
Baruch, Shmuel, and Lawrence R. Glosten, ‘‘Fleeting Orders,’’ Working Paper,2013.
Biais, Bruno, and Thierry Foucault, ‘‘HFT and Market Quality,’’ Bankers,Markets & Investors, 128 (2014), 5–19.
Biais, Bruno, Theirry Foucault, and Sophie Moinas, ‘‘Equilibrium Fast Trading,’’Journal of Financial Economics, 116 (2015), 292–313.
Brogaard, Jonathan, Terrence Hendershott, and Ryan Riordan, ‘‘High FrequencyTrading and Price Discovery,’’ Review of Financial Studies, 27 (2014a), 2267–2306.
———, ‘‘High Frequency Trading and the 2008 Short Sale Ban,’’ Working Paper,2014b.
Budish, Eric, Peter Cramton, and John Shim, ‘‘Implementation Details forFrequent Batch Auctions: Slowing Down Markets to the Blink of an Eye,’’American Economic Review: Papers and Proceedings, 104 (2014), 418–424.
QUARTERLY JOURNAL OF ECONOMICS1618
at Serials Departm
ent on Decem
ber 23, 2015http://qje.oxfordjournals.org/
Dow
nloaded from
Bunge, Jacob, ‘‘CME, Nasdaq Plan High-Speed Network Venture,’’ Wall StreetJournal, March 28, 2013, available at http://online.wsj.com/article/SB10001424127887324685104578388343221575294.html.
Cinnober, ‘‘Using Adaptive Micro Auctions to Provide Efficient Price DiscoveryWhen Access in Terms of Latency Is Differentiated among MarketParticipants,’’ White Paper, 2010.
Clark-Joseph, Adam, ‘‘Exploratory Trading,’’ Working Paper, 2013.Cohen, Kalman J., and Robert A. Schwartz, ‘‘The Challenge of Information
Technology for the Securities Markets: Liquidity, Volatility and GlobalTrading,’’ in An Electronic Call Market: Its Design and Desirability,Henry Lucas and Robert Schwartz, eds. (Homewood, IL: Dow Jones-Irwin,1989).
Commodity Futures Trading Commission, ‘‘Concept Release on Risk Controls andSystem Safeguards for Automated Trading Environments,’’ 2013.
Conway, Brendan, ‘‘Wall Street’s Need for Trading Speed: The Nanosecond Age,’’Wall Street Journal, June 14, 2011, available at http://blogs.wsj.com/marketbeat/2011/06/14/wall-streets-need-for-trading-speed-the-nanosecond-age/.
Copeland, Thomas E., and Dan Galai, ‘‘Information Effects on the Bid-AskSpread,’’ Journal of Finance, 38 (1983), 1457–1469.
Cormen, Thomas H., Charles E. Leiserson, Ronald L. Rivest, and Clifford Stein,Introduction to Algorithms, 3rd ed. (Cambridge, MA: MIT Press, 2009).
Demsetz, Harold, ‘‘The Cost of Transacting,’’ Quarterly Journal of Economics, 82(1968), 33–53.
Ding, Shengwei, John Hanna, and Terrence Hendershott, ‘‘How Slow Is theNBBO? A Comparison with Direct Exchange Feeds,’’ Financial Review, 49(2014), 313–332.
Duffie, Darrell, Nicolae Garleanu, and Lasse Heje Pedersen, ‘‘Over-the-CounterMarkets,’’ Econometrica, 73 (2005), 1815–1847.
Economic Sciences Prize Committee, ‘‘Scientific Background on the SverigesRiksbank Prize in Economic Sciences in Memory of Alfred Nobel 2013:Understanding Asset Prices,’’ Royal Swedish Academy of Sciences, 2013.
Economides, Nicholas, and Robert A. Schwartz, ‘‘Electronic Call Market Trading:Let Competition Increase Efficiency,’’ Journal of Portfolio Management, 21(1995), 10–18.
Einstein, Albert, ‘‘Zur Elektrodynamik bewegter Korper (On the Electrodynamicsof Moving Bodies),’’ Annalen der Physik, 322 (1905), 891–921.
Epps, Thomas, ‘‘Comovements in Stock Prices in the Very Short Run,’’ Journal ofthe American Statistical Association, 74 (1979), 291–298.
European Commission, ‘‘FTT—Non-technical Answers to Some Questions on CoreFeatures and Potential Effects,’’ 2013.
Fama, Eugene F., ‘‘Efficient Capital Markets: A Review of Theory and EmpiricalWork,’’ Journal of Finance, 25 (1970), 383–417.
Farmer, J. Doyne, and Spyros Skouras, ‘‘Review of the Benefits of a ContinuousMarket vs. Randomised Stop Auctions and of Alternative Priority Rules(Policy Options 7 and 12),’’ UK Government’s Foresight Project, TheFuture of Computer Trading in Financial Markets, Economic ImpactAssessment EIA11, 2012.
Foucault, Thierry, ‘‘Order Flow Composition and Trading Costs in a DynamicLimit Order Market,’’ Journal of Financial Markets, 2 (1999), 99–134.
Foucault, Thierry, Roman Kozhan, and Wing Wah Tham, ‘‘Toxic Arbitrage,’’CEPR Discussion Papers 9925, 2014.
Foucault, Thierry, Ailsa Roell, and Patrik Sandas, ‘‘Market Making with CostlyMonitoring: An Analysis of the SOES Controversy,’’ Review of FinancialStudies, 16 (2003), 345–384.
Frazzini, Andrea, Ronen Israel, and Tobias J. Moskowitz, ‘‘Trading Costs of AssetPricing Anomalies,’’ Fama-Miller Working Paper, Chicago Booth ResearchPaper No. 14-05, 2012.
Glosten, Lawrence R., ‘‘Is the Electronic Open Limit Order Book Inevitable?,’’Journal of Finance, 49 (1994), 1127–1161.
Glosten, Lawrence R., and Paul Milgrom, ‘‘Bid, Ask and Transaction Prices in aSpecialist Market with Heterogeneously Informed Traders,’’ Journal ofFinancial Economics, 14 (1985), 71–100.
THE HIGH-FREQUENCY TRADING ARMS RACE 1619
at Serials Departm
ent on Decem
ber 23, 2015http://qje.oxfordjournals.org/
Dow
nloaded from
Goettler, Ronald L., Christine A. Parlour, and Uday Rajan, ‘‘Equilibrium in aDynamic Limit Order Market,’’ Journal of Finance, 60 (2005), 2149–2192.
Haldane, Andrew, ‘‘The Race To Zero,’’ Speech at the International EconomicAssociation Sixteenth World Congress, Beijing, July 8, 2011.
Harris, Jeffrey, and Paul Schultz, ‘‘The Trading Profits of SOES Bandits,’’ Journalof Financial Economics, 50 (1998), 39–62.
Harris, Larry, Trading and Exchanges: Market Microstructure for Practitioners(Oxford: Oxford University Press, 2002).
———, ‘‘Stop the High-Frequency Trader Arms Race,’’ Financial Times,December 27, 2012.
Hasbrouck, Joel, and Gideon Saar, ‘‘Low-Latency Trading,’’ Journal of FinancialMarkets, 16 (2013), 646–679.
Hendershott, Terrence, Charles Jones, and Albert Menkveld, ‘‘Does AlgorithmicTrading Improve Liquidity?,’’ Journal of Finance, 66 (2011), 1–33.
Hirshleifer, Jack, ‘‘The Private and Social Value of Information and the Reward toInventive Activity,’’ American Economic Review, 61 (1971), 561–574.
IEX Group, ‘‘Form ATS: Initial Operation Report, Amendment to InitialOperation Report and Cessation of Operations Report for AlternativeTrading Systems,’’ 2014.
ISN, ‘‘Toward a Fairer and More Efficient Market,’’ ISN Research Report, 2013.Jones, Charles, ‘‘What Do We Know About High-Frequency Trading?,’’ Columbia
University Working Paper, 2013.Klemperer, Paul, Auctions: Theory and Practice (Princeton, NJ: Princeton
University Press, 2004).Kyle, Albert S., ‘‘Continuous Auctions and Insider Trading,’’ Econometrica, 53
(1985), 1315–1335.Laughlin, Gregory, Anthony Agiurre, and Joseph Grundfest, ‘‘Information
Transmission between Financial Markets in Chicago and New York,’’Financial Review, 49 (2014), 283–312.
Lewis, Michael, Flash Boys: A Wall Street Revolt (New York: Norton, 2014).MacKenzie, Donald, ‘‘Be Grateful for Drizzle,’’ London Review of Books, 36 (2014),
27–30.Madhavan, Ananth, ‘‘Trading Mechanisms in Securities Markets,’’ Journal of
Finance, 47 (1992), 607–641.McPartland, John, ‘‘Recommendations for Equitable Allocation of Trades in High
Frequency Trading Environments,’’ Journal of Trading, 10 (2015), 81–100.Menkveld, Albert J., and Marius A. Zoican, ‘‘Need for Speed? Exchange Latency
and Liquidity,’’ Tinbergen Institute Discussion Papers: 140-097/IV, 2014.Milgrom, Paul, Putting Auction Theory to Work (Cambridge: Cambridge
University Press, 2004).———, ‘‘Critical Issues in the Practice of Market Design,’’ Economic Inquiry, 49
(2011), 311–320.Moallemi, Ciamac, ‘‘The Value of Queue Position in a Limit Order Book,’’ Working
Paper, 2014.Najarian, Jon A., ‘‘The Ultimate Trading Weapon,’’ 2010, available at http://
moneytalks.net/pdfs/37895070-The-Ultimate-Trading-Weapon.pdfNanex, ‘‘CQS Was Saturated and Delayed on May 6th, 2010,’’ July 25, 2011, avail-
able at http://www.nanex.net/Research/NewFlashCrash1/FlashCrash.CQS.Saturation.html.
———, ‘‘Dangerous Order Types,’’ November 15, 2012, available at http://www.nanex.net/aqck2/3681.html.
Niederauer, Duncan, ‘‘Market Structure: Ensuring Orderly, Efficient, Innovativeand Competitive Markets for Issuers and Investors: Congressional HearingBefore the Subcommittee on Capital Markets and Government SponsoredEnterprises of the Committee on Financial Services US House ofRepresentatives, 112th Congress,’’ Congressional Testimony, Panel I, 2012,available at http://financialservices.house.gov/uploadedfiles/112-137.pdf.
O’Hara, Maureen, ‘‘High Frequency Market Microstructure,’’ Journal ofFinancial Economics, 116 (2015), 257–270.
Patterson, Scott, and Jenny Strasburg, ‘‘How ‘Hide Not Slide’ Orders Work,’’ WallStreet Journal, September 18, 2012, available at http://online.wsj.com/article/SB10000872396390444812704577605840263150860.html.
QUARTERLY JOURNAL OF ECONOMICS1620
at Serials Departm
ent on Decem
ber 23, 2015http://qje.oxfordjournals.org/
Dow
nloaded from

Patterson, Scott, Jenny Strasburg, and Liam Pleven, ‘‘High-Speed TradersExploit Loophole,’’ Wall Street Journal, May 1, 2013.
Rogers, Jonathan L., Douglas J. Skinner, and Sarah L. C. Zechman, ‘‘Run EDGARRun: SEC Dissemination in a High-Frequency World,’’ Working Paper, 2014.
Rogow, Geoffrey, ‘‘Colocation: The Root of all High-Frequency Trading Evil?,’’ WallStreet Journal, September 20, 2012, available at http://blogs.wsj.com/market-beat/2012/09/20/collocation-the-root-of-all-high-frequency-trading-evil/.
Roth, Alvin E., ‘‘The Economist as Engineer: Game Theory, Experimentation andComputation as Tools for Design Economics,’’ Econometrica, 70 (2002), 1341–1378.
———, ‘‘What Have We Learned from Market Design?,’’ Economic Journal, 118(2008), 285–310.
Roth, Alvin E., and Axel Ockenfels, ‘‘Last-Minute Bidding and the Rules forEnding Second-Price Auctions: Evidence from eBay and Amazon Auctionson the Internet,’’ American Economic Review, 92 (2002), 1093–1103.
Roth, Alvin E., and Xiaolin Xing, ‘‘Jumping the Gun: Imperfections andInstitutions Related to the Timing of Market Transactions,’’ AmericanEconomic Review, 84 (1994), 992–1044.
———, ‘‘Turnaround Time and Bottlenecks in Market Clearing: DecentralizedMatching in the Market for Clinical Psychologists,’’ Journal of PoliticalEconomy, 105 (1997), 284–329.
Sannikov, Yuliy, and Andrzej Skrzypacz, ‘‘Dynamic Trading: Price Inertia, Front-Running and Relationship Banking,’’ Working Paper, 2014.
Schwartz, Robert, ed., The Electronic Call Auction: Market Mechanism andTrading (Boston: Kluwer Academic, 2001).
Schwartz, Robert A., and Liuren Wu, ‘‘Equity Trading in the Fast Lane: TheStaccato Alternative,’’ Journal of Portfolio Management, 39 (2013), 3–6.
SEC and CFTC, ‘‘Findings Regarding the Market Events of May 6, 2010,’’ Reportof the Staffs of the CFTC and SEC to the Joint Advisory Committee onEmerging Regulatory Issues, 10, (2010), 2012.
Securities and Exchange Commission, ‘‘Concept Release on Equity MarketStructure,’’ 2010.
Sparrow, Chris, ‘‘The Failure of Continuous Markets,’’ Journal of Trading, 7(2012), 44–47.
Steiner, Christopher, ‘‘Wall Street’s Speed War,’’ Forbes Magazine, September 27,2010.
Stiglitz, Joseph E., ‘‘Tapping the Brakes: Are Less Active Markets Safer andBetter for the Economy?,’’ Presented at the Federal Reserve Bank ofAtlanta 2014 Financial Markets Conference, 2014.
Stoll, Hans R., ‘‘The Supply of Dealer Services in Securities Markets,’’ Journal ofFinance, 33 (1978), 1133–1151.
Strasburg, Jenny, and Jacob Bunge, ‘‘Loss Swamps Trading Firm,’’ Wall StreetJournal, August 2, 2012.
———, ‘‘Nasdaq Is Still on Hook as SEC Backs Payout for Facebook IPO,’’ WallStreet Journal, March 25, 2013, available at http://online.wsj.com/article/SB10001424127887323466204578382193806926064.html.
Summers, Laurence H., and Victoria P. Summers, ‘‘When Financial MarketsWork Too Well: A Cautious Case for a Securities Transactions Tax,’’Journal of Financial Services Research, 3 (1989), 261–286.
Tobin, James, ‘‘A Proposal for International Monetary Reform,’’ Eastern EconomicJournal, 4 (1978), 153–159.
Troianovski, Anton, ‘‘Networks Built on Milliseconds,’’ Wall Street Journal, May30, 2012, available at http://online.wsj.com/article/SB10001424052702304065704577426500918047624.html.
Vayanos, Dimitri, ‘‘Strategic Trading and Welfare in a Dynamic Market,’’ Reviewof Economic Studies, 66 (1999), 219–254.
Virtu, ‘‘Form S-1: Virtu Financial, Inc.,’’ 2014.Wah, Elaine, and Michael Wellman, ‘‘Latency Arbitrage, Market Fragmentation,
and Efficiency: A Two-Market Model,’’ Proceedings of the Fourteenth ACMConference: Electronic Commerce, 2013.
Yao, Chen, and Mao Ye, ‘‘Tick Size Constraints, High-Frequency Trading, andLiquidity,’’ Working Paper, 2014.
THE HIGH-FREQUENCY TRADING ARMS RACE 1621
at Serials Departm
ent on Decem
ber 23, 2015http://qje.oxfordjournals.org/
Dow
nloaded from
This page intentionally left blank
at Serials Departm
ent on Decem
ber 23, 2015http://qje.oxfordjournals.org/
Dow
nloaded from