Embed Size (px)
Citation preview

THE
QUARTERLY JOURNALOF ECONOMICS
Vol CXIX August 2004 Issue 3
THE CAUSES AND CONSEQUENCESOF DISTINCTIVELY BLACK NAMES
ROLAND G FRYER JR AND STEVEN D LEVITT
In the 1960s Blacks and Whites chose relatively similar first names for theirchildren Over a short period of time in the early 1970s that pattern changeddramatically with most Blacks (particularly those living in racially isolated neigh-borhoods) adopting increasingly distinctive names but a subset of Blacks actuallymoving toward more assimilating names The patterns in the data appear mostconsistent with a model in which the rise of the Black Power movement influencedhow Blacks perceived their identities Among Blacks born in the last two decadesnames provide a strong signal of socioeconomic status which was not previouslythe case We find however no negative relationship between having a distinc-tively Black name and later life outcomes after controlling for a childrsquos circum-stances at birth
I INTRODUCTION
On May 17 1954 the landmark Supreme Court decision inBrown v Board of Education of Topeka Kansas ruled unani-mously that segregation in public schools was unconstitutional
We are grateful to George Akerlof Susan Athey Gary Becker David CardJohn Donohue Esther Duflo Edward Glaeser Shoshana Grossbard-ShechtmanDaniel Hamermesh Lawrence Katz Glenn Loury Douglas McAdam AndreiShleifer and Steven Tadelis for helpful comments and suggestions We thankseminar participants too numerous to mention for their comments and sugges-tions We also thank two editors and three anonymous referees for detailedfeedback that improved the paper Michael Roh provided excellent research as-sistance Financial support was provided by the National Science FoundationA portion of this paper was written while Fryer was an NSF Post-DoctoralFellow at the University of Chicago and Levitt was a fellow at the Center forAdvanced Study in the Behavioral Sciences in Stanford Correspondence canbe addressed to Fryer at Harvard University Littauer Center Cambridge MA02138 (e-mail rfryerfasharvardedu) or Levitt at Department of EconomicsUniversity of Chicago 1126 East 59th Street Chicago IL 60637 (e-mailslevittmidwayuchicagoedu)
copy 2004 by the President and Fellows of Harvard College and the Massachusetts Institute ofTechnologyThe Quarterly Journal of Economics August 2004
767
This ruling paved the way for the fall of Jim Crow and large-scaledesegregation In the 1960s a series of further government ac-tions were taken with the goal of achieving racial equality andintegration most notably the Civil Rights Act of 1964 ExecutiveOrder 11246 in 1965 and the Fair Housing Act of 1968 The civilrights movement arguably represents one of the most profoundsocial transformations in American history [Woodward 1974Young 1996]
Nonetheless an enormous racial divide persists There arelarge disparities between Blacks and Whites in the United Stateson many indicators of social and economic welfare including in-come [Bound and Freeman 1992 Chandra 2003 HeckmanLyons and Todd 2000 Smith and Welch 1989] educationalachievement [Jencks and Phillips 1998] out-of-wedlock child-bearing [Ventura and Bachrach 2000] health (see Kington andNickens [2001]) and criminal involvement [Reno et al 1997] Thedegree of residential segregation by race though lower todaythan in 1970 remains high [Cutler Glaeser and Vigdor 1999Massey 2001]
Racial differences also persist and in some cases have be-come even more pronounced on a wide range of cultural dimen-sions including musical tastes [Waldfogel 2003] linguistic pat-terns [Wolfram and Thomas 2002] and consumption choices Forinstance the cigarette brand Newport has a 75 percent marketshare among Black teens but just 12 percent among White teensmokers 65 percent of White teens smoke Marlboro comparedwith only 8 percent of Blacks [Johnston et al 1999] Seinfeld oneof the most popular sitcoms in television history among whitesnever ranked in the top 50 among Blacks Indeed of the top tenshows with the highest viewership among Whites during the1999ndash2000 television season only one show was also among thetop ten for blacks NFL Monday Night Football (Nielsen MediaResearch httpwwwnielsenmediacomethnicmeasure)
Understanding whether cultural differences are a cause ofcontinued economic disparity between races is a question of greatsocial importance Cultural differences may be a cause of Blackeconomic struggle if Black culture interferes with the acquisitionof human capital or otherwise lowers the labor market produc-tivity of Blacks (as argued in the culture of poverty paradigm insociology see Hannerz [1969] Lewis [1966] Riessman [1962]and implicitly Anderson [1990]) For instance high-achievingBlack children may be ostracized by their peers for ldquoacting whiterdquopotentially leading to lower investment in human capital
768 QUARTERLY JOURNAL OF ECONOMICS
[Fordham and Ogbu 1986 Austen-Smith and Fryer 2003] Speak-ing ldquoEbonicsrdquo may interfere with the ability to interact withWhite coworkers and customers or disrupt human capital acqui-sition more directly [Orr 1989] On the other hand the presenceof a Black culture may simply be the consequence of past andcurrent segregation and economic inequality but play no role inperpetuating economic disparity If differences in tastes do notinfluence human capital acquisition or labor market productivitythen there is little reason to believe that such tastes will have acausal negative economic impact on Blacks For example ldquosoulfoodrdquo [Counihan and Van Esterik 1997] and traditional African-American spirituals [Jackson 1944] can be traced to the socialconditions endured during slavery but are unlikely to be causesof current poverty Eliminating cultural differences in this sce-nario would have no overall impact on Black welfare relative toWhites
A primary obstacle to the study of culture has been the lackof quantitative measures In this paper we focus on one particularaspect of Black culturemdashthe distinctive choice of first namesmdashasa way of measuring cultural investments1 Our research buildsupon a growing literature by economists devoted to understand-ing a diverse set of social and cultural phenomena [Akerlof andKranton 2000 Berman 2000 Fryer 2003 Glaeser Laibson andSacerdote 2002 Iannaccone 1992 Lazear 1999] In contrast tothese earlier papers however our contribution is primarilyempirical
Using data that cover every child born in California over aperiod of four decades our analysis of first names uncovers a richset of facts We first document the stark differences betweenBlack and White name choices in recent years2 For examplemore than 40 percent of the Black girls born in California inrecent years received a name that not one of the roughly 100000White girls born in California in that year was given3 Even
1 Other than the audit studies of resumes discussed below the only othereconomic analysis of name choices that we are aware of is Goldin and Shim [2003]which examines the issue of women retaining their maiden names at marriageThe seminal work on names outside of economics has been done in a series ofpapers by Stanley Lieberson and coauthors culminating in Lieberson [2000]
2 There are multiple dimensions along which a name can be consideredldquoblackrdquo or ldquowhiterdquo For example Lieberson and Mikelson [1995] study distinctivepatterns of phonemes that are characteristic of Black names In this paper westudy only one dimension of the issue the relatively frequency with which Blacksand Whites choose a given name for their children
3 Lieberson and Mikelson [1995] using a sample of names from birthrecords in Illinois find that approximately 30 percent of black baby girls born
769DISTINCTIVELY BLACK NAMES
among popular names racial patterns are pronounced Namessuch as DeShawn Tyrone Reginald Shanice Precious Kiaraand Deja are quite popular among Blacks but virtually unheardof for Whites4 The opposite is true for names like Connor CodyJake Molly Emily Abigail and Caitlin Each of those namesappears in at least 2000 cases (between 1989ndash2000) with lessthan 2 percent of the recipients Black5 Overall Black choices offirst names today differ substantially more from Whites than dothe names chosen by native-born Hispanics and Asians
More surprising perhaps is the time series pattern of Blackfirst names In the 1960s the differences in name choices betweenBlacks and Whites were relatively small and factors that predictdistinctively Black names in later years (single mothers raciallyisolated neighborhoods etc) have much lower explanatory powerin the 1960s At that time Blacks who lived in highly raciallysegregated neighborhoods adopted names that were almost indis-tinguishable from Blacks in more integrated neighborhoods andsimilar to Whites Within a seven-year period in the early 1970showever a profound shift in naming conventions took placeespecially among Blacks in racially isolated neighborhoods Themedian Black female in a segregated area went from receiving aname that was twice as likely to be given to Blacks as Whites toa name that was more than twenty times as likely to be given toBlacks Black male names moved in the same direction but theshift was less pronounced On the other hand among a subset ofBlacks encompassing about one-fourth of Blacks overall and one-half of those in predominantly White neighborhoods namechoices actually became more similar to those of Whites duringthis same period
We argue that these empirical patterns are most consistentwith a model in which the rise of the Black Power movementinfluenced Black identity Other models we consider such asignorance on the part of Black parents who unwittingly stigma-
between 1920 and 1960 have unique names Starting in the early 1960s there wasa remarkable increase in the prevalence of unique names resulting in a peak in1980 in which 60 percent of Black girls were given unique names A similarthough less pronounced phenomenon existed among Black boys
4 There are 463 children named DeShawn 458 of whom are Black Thename Tyrone is given to 502 Black boys and only 17 Whites 310 out of 318Shanicersquos are Black as are 431 out of 454 girls named Precious and 591 out of 626girls named Deja
5 The most extreme case is for the name Molly in which only 9 of 2248children given the name are Black
770 QUARTERLY JOURNAL OF ECONOMICS
tize their children with such names simple price theory modelsand signaling models all contradict the data in important ways
The paper concludes by analyzing the relationship betweendistinctively Black names and life outcomes Previous studieshave found that distinctively Black names are viewed negativelyby others (eg Busse and Seraydarian [1977]) Most persuasiveare audit studies in which matched resumes one with a distinc-tively Blackethnic minority name and another with a tradition-ally White name are provided to potential employers [Jowell andPrescott-Clarke 1970 Hubbick and Carter 1980 Brown and Gay1985 Bart et al 1997 Bertrand and Mullainathan 2003] Suchstudies repeatedly have found that resumes with traditionalnames are substantially more likely to lead to job interviews thanare identical resumes with distinctively minority-soundingnames The results suggest that giving onersquos child a minorityname may impose important economic costs on the child In ourdata however we find no compelling evidence of a negativerelationship between Black names and a wide range of life out-comes after controlling for background characteristics Althoughseemingly in conflict with prior audit studies using Black nameson resumes there are three interpretations of the data thatreconcile the two sets of results (1) Black names are used assignals of race by discriminatory employers at the resume stagebut are unimportant once an interview reveals the candidatersquosrace or (2) Black names provide a useful signal to employersabout labor market productivity after controlling for informationon the resume or (3) names themselves have a modest causalimpact on job callbacks and unemployment duration that we areunable to detect
The remainder of the paper is structured as follows SectionII describes the data used in the analysis Section III summarizesthe basic patterns observed in the data Section IV attempts toreconcile the stylized facts with a range of potential theoriesSection V analyzes the relationship between names and life out-comes and attempts to reconcile our results with previous auditstudies Section VI concludes A data appendix describes thedetails of our sample construction
II THE DATA
The data used in this paper are drawn from the Birth Sta-tistical Master File maintained by the Office of Vital Records inthe California Department of Health Services These files provide
771DISTINCTIVELY BLACK NAMES
information drawn from birth certificates for all children born inCalifornia over the period 1961ndash2000mdashover sixteen millionbirths With the approval of the California Committee for theProtection of Human Subjects personal identifiers includingmotherrsquos first name motherrsquos maiden name and childrsquos full namehave been added to the public use versions of the data Details ofthe data set are provided in the appendix
The information included varies by year and has generallybeen increasing over time For our entire sample we have infor-mation on the babyrsquos first name race gender date of birthhospital of birth and birth weight as well as the motherrsquos maidenname parental ages and inferred marital status By 1989 infor-mation on parental education residential zip code and source ofpayment were added to the data Also starting in 1989 we knowthe motherrsquos first name and exact date of birth two criticalelements for linking information from a womanrsquos own birth cer-tificate to that of her children in those cases in which a woman isboth born in California and later gives birth there This allows usto look at the relationship between circumstances at a womanrsquosbirth (eg her own name her motherrsquos level of education hermotherrsquos marital status racial segregation etc) and the situationin which that same woman lives in when she gives birth decadeslater6 It also enables us to link information from all births to thesame mother that took place in California which permits thecomparison of naming patterns controlling for mother-fixedeffects
We restrict our sample to non-Hispanic Blacks (referred tosimply as Blacks)7 In determining how Black a name is ourcomparison group is non-Hispanic Whites Summary statistics forthe Black babies are provided in Table I8 We divide the sampleinto four sets of years 1961ndash1967 1968ndash1977 1978ndash1988 and
6 Unfortunately the fatherrsquos first name is not included in the data so aparallel analysis cannot be performed for males
7 There is some ambiguity in racial and ethnic categorizations when chil-dren are born to parents of different races We use the classification of a childrsquosrace and ethnicity on the birth certificate to assign these categories except in theyears 1999 and 2000 when the information on childrsquos race is missing In thoseyears a child is considered Black if either parent is Black Before 1989 we do nothave explicit identifiers for Hispanics Using information from later years of datahowever we are able to effectively identify Hispanic surnames and drop from thesample any child born to a parent with a surname or maiden name that is morethan 10 percent Hispanic
8 The percentages of black babies born in a hospital or county are timevarying variables measured on an annual basis using the full sample of Californiabirths Within our four groupings of years we provide the mean over the relevantyears
772 QUARTERLY JOURNAL OF ECONOMICS
TABLE ISUMMARY STATISTICS FOR BLACK BIRTHS CALIFORNIA 1961ndash2000
Variables 1961ndash1967 1968ndash1977 1978ndash1988 1989ndash2000
Female 049 049 049 049(50) (50) (50) (50)
Age of mother at time of birth 2443 2325 2443 2570(612) (556) (547) (616)
Age of father at time of birth 2847 2685 2772 2870(749) (721) (729) (760)
Mother born in California 014 039 051 062(035) (049) (050) (048)
Mother unmarried at time of birth 031 046 056 058(046) (050) (050) (049)
Birth weight (in grams) 309887 312758 318153 322300(58126) (59812) (58749) (59127)
Total number of children 320 229 211 229(236) (169) (134) (150)
Months of prenatal care 587 677 708 728(195) (168) (159) (159)
Teen mother at time of birth 023 029 020 018(042) (045) (040) (038)
County hospital 042 016 011 009(049) (037) (032) (029)
White mother mdash 010 013 020mdash (030) (033) (040)
White father mdash 002 002 004mdash (014) (015) (019)
Motherrsquos years of education mdash mdash mdash 1258mdash mdash mdash (199)
Fatherrsquos years of education mdash mdash mdash 1260mdash mdash mdash (255)
Privately insured mdash mdash mdash 043mdash mdash mdash (049)
Per capita income in zip code mdash mdash mdash 1316630(All residents in 1989 1989 dollars) mdash mdash mdash (527724)Per capita income in zip code mdash mdash mdash 1157752(Blacks in 1989 1989 dollars) mdash mdash mdash (419011)Percent of Black population in zip code mdash mdash mdash 3784
mdash mdash mdash (3455)Percent of Black babies in birth county 1283 1765 2357 2725
(418) (673) (888) (997)Percent of Black babies in birth hospital 3794 3686 4011 4147
(2802) (2763) (2750) (2765)Black Name Index 6087 6665 6813 7049
(2773) (3127) (3130) (3149)Black Name IndexmdashMedian 6019 7024 7340 8228Number of observations 164648 253735 402120 488959
All data are drawn from California birth certificate records except for the information on zip codes whichcombines birth certificate information with data from the 1990 Census The sample in columns 1ndash4 representall Blacks born in California between 1961ndash1967 1967ndash1977 1978ndash1988 and 1989ndash2000 respectively Thenumbers in parentheses are standard deviations See the data appendix for further details of the constructionof the samples and variables
773DISTINCTIVELY BLACK NAMES
1989ndash2000 The cutoffs for these groups have been chosen withthree goals in mind (1) roughly equalizing the time periods ineach group (2) matching the cutoffs to breaks in trend in theaggregate data and (3) grouping years in which similar sets ofcovariates are available Excluded from the data set are a smallpercentage of observations missing information on names Whenother variables are missing we opt to leave the observation in theanalysis including an indicator variable for a missing value
The bottom row of Table I presents our summary measure ofhow distinctively Black first names are The measure we choosewhich we term our ldquoBlack name indexrdquo (BNI) is
(1) BNInamet PrnameBlackt
PrnameBlackt PrnameWhitet 100
where name reflects a particular first name and t reflects the year ofbirth The index ranges from 0 to 100 If all children who receive aparticular name are White then BNI takes on a value of 0 If onlyBlack children receive a name BNI is equal to 100 If Whites andBlacks are equally likely to choose a name BNI equals 50 If Blacksare four times as likely to select a name then BNI takes on a valueof 80 (eg 4[4 1] 100 80)9 A BNI of 90 implies Blacks choosea name nine times more often This measure is invariant to thefraction of the population that a particular minority group com-prises and to the overall popularity of a name Names that arepronounced the same but spelled differently are treated as separatenames The bottom row of Table I shows that the mean BNI forBlacks rises from 609 in the early period (implying that the meanBlack name is given to Blacks about 50 percent more often than it isgiven to Whites) to 710 in the last period (implying that thesenames are given to Blacks about two and one-half times morefrequently than Whites)
Figure I(A) more clearly demonstrates the dramatic differ-ences between Black and White name choices The figure pre-sents a smoothed plot of the probability distribution function ofBlack and White names The horizontal axis reflects how Blackan individualrsquos name is The vertical axis measures the density ofnames chosen by race More than 40 percent of Whites are givennames that are at least four times as likely to be given to Whites
9 In computing BNI for a particular child we exclude that child from thecalculation When a name is unique meaning that only one child receives thatname in a particular year we assign the name a value of 0 if the person gettingthe name is White and 100 if the baby is Black We explore unique names ingreater detail later in the paper
774 QUARTERLY JOURNAL OF ECONOMICS
FIGURE IBlack Name Index (A) Asian Name Index (B) and Hispanic Name Index (C)
Distributions 1989ndash2000
775DISTINCTIVELY BLACK NAMES
(between 0ndash20) The fraction of Whites steadily shrinks as onemoves from left to right in the figure More than half of all Blackshave names that are at least four times as likely to be given toBlacks (between 81ndash100) For both races there is very littleweight in the middle of the distribution (41ndash60) implying thatthere are relatively few individuals carrying names that aresimilarly likely for Blacks and Whites
One might suspect that the sharp differences across races inFigure I(A) may in part be an artifact of how we construct ourmeasure of Black names using the observed empirical distribu-tion In other words we might miscategorize a name as beingdistinctively Black or White simply because for many names weobserve only a few individuals with that name Limiting thesample to names that appear at least twenty times in the datahowever does little to change the picture Figure I(B) which isidentical to Figure I(A) except that it compares the naming pat-terns of Whites with that of American-born Asians further dem-onstrates that the result for Blacks is not an artifact of ourmeasure With the exception of a small fraction (approximately10 percent) of the Asian population adopting names that are rareamong Whites name choices of American-born Asians stronglyparallel White name choices A comparison of native-born His-panics and Whites in Figure I(C) shows differences in namingpatterns among these two groups although there is still substan-tially more overlap than for Blacks and Whites10
An important racial difference in naming patterns is thegreater usage of unique or nearly unique names in the Blackcommunity (see also Lieberson and Michelson [1995]) FiguresII(A) and II(B) report by race and gender the number of childrenborn in California in that same year (regardless of race) with thatchildrsquos name Remarkably nearly 30 percent of Black girls receivea name that is unique among the hundreds of thousands ofchildren born annually in California Among Whites that fractionis only 50 percent Similarly the fraction of unique names amongBlack boys is six times higher than for White boys although onlyabout half the rate of Black girls The median Black child shares
10 We have also compared the names chosen by Whites with different levelsof education There are systematic differences in name choices (larger in factthan between Asians and Whites overall) but these differences are much smallerthan either the Black-White or Hispanic-White gap
776 QUARTERLY JOURNAL OF ECONOMICS
his or her name with 23 other children the number is almostfifteen times greater for Whites (351)11
Perhaps the most interesting findings in the data are the
11 The differences between Blacks and Whites in Figure II are not primarilydue to the fact that there are many more Whites than Blacks born in Californiaeach year If we randomly select a subset of Whites equal in size to the number ofBlacks born each year a similar pattern of results persists
FIGURE IIDistribution of Male (A) and Female (B) Babies by How Many Share
a Name 1989ndash2000(among children of all races born in California in a year)
777DISTINCTIVELY BLACK NAMES
changes in the distribution of name choices over time For chil-dren born in each year between 1961 and 2000 we compute ourBlack name index and then rank order the Blacks in our sampleaccording to how Black their name is Figure III presents themean BNI by year for each of the four quartiles of the distribu-tion The top quartile is very close to 100 throughout the entiretime period (ie almost one-quarter of Blacks had names virtu-ally never given to Whites throughout the sample) and thusexhibits little time-series variation For the other three quartilesBlack naming patterns were largely stable throughout most ofthe 1960s Beginning in the late 1960s the second quartile fromthe top experiences a sharp rise in how Black the name choicesare Between 1968 and 1977 the mean BNI within this quartilegoes from roughly 75 (meaning the name was three times aslikely to be given to a Black baby as a White baby) to almost 95(fifteen times more likely to be given to a Black baby) The thirdquartile also rises over that time period but not as sharply andalso steadily increases over the period 1985ndash2000 The bottom
FIGURE IIIBlack Naming Patterns 1961ndash2000 by Quartile of Black Name Index
778 QUARTERLY JOURNAL OF ECONOMICS
quartile in contrast remains almost unchanged throughout thesample period12
Figure IV is identical to Figure III except that it disag-gregates the data by the degree of racial segregation in thehospital in which a Black baby is born We sort by racialsegregation of the hospital and then by quartile of BNI Weshow only the top and bottom deciles (ie the 10 percent ofBlacks giving birth in hospitals with the greatest percent Blackand the lowest percent Black respectively) to highlight theextremes of the distribution The most important observationemerging from Figure IV is the widening gap between thenames given to Black babies born in predominantly Black andpredominantly White hospitals over time At the beginning ofthe sample name choices differ little by the degree of racialsegregation For example in the bottom quartile Blacks bornin racially segregated hospitals have a mean BNI of 26 versus
12 The divergence in naming patterns in the late 1960s and early 1970s isunique to Blacks Among Hispanics and Asians name choices relative to Whiteschange little between 1961 and 1978 This suggests that a shift in Black namechoices drives the patterns in Figure III In the 1990s however Hispanic namesdiverge somewhat from those of Whites suggesting that changes in White namingpatterns may be a factor in that time period
FIGURE IVChanges in Black Naming Patterns by Racial Composition of Neighborhood
and by Quartile of Black Name Index
779DISTINCTIVELY BLACK NAMES
23 for Blacks born in predominantly White hospitals By 1978these gaps have widened substantially particularly in thethird quartile where Blacks in Black hospitals have shiftedmore than twenty points relative to the beginning of the sam-ple but names of Blacks in White hospitals are essentiallyunchanged Interestingly among the Black babies given theleast distinctively Black names (the bottom quartile) thoseborn in White hospitals actually see a discernible decrease inhow Black their names are in contrast to the rest of thedistribution13
The sharp rise in the prevalence of distinctively Black names isdriven in part by the increasing use of unique names among BlacksFigures V(A) and V(B) present time-series data on the percentage ofbabies with unique first names by gender and racial mix of the birthhospital where a unique name is defined as a name that no otherbaby born in California that year shares The fraction of Black babygirls receiving unique names rose for the first fifteen years of thesample Initially rates of unique naming were similar among Blacksin predominantly Black and predominantly White neighborhoods(around 10 percent) that gap grows over time Nonetheless even forBlacks in White neighborhoods almost one-quarter of baby girlsreceived unique names Among Whites the rates are around 5percent although this (as well as the Black numbers) is likely to bean upper bound due to typographical errors being counted as uniquenames14 Figure V(B) documents a parallel though less pronouncedphenomenon for Black boys In 1961 the percentage of uniquenames ranged from 5ndash6 percent irrespective of hospital By 2000one-fifth of Black boys born in predominantly Black hospitals re-ceive unique names
Unique names while an important part of the explanationfor the divergence in Black and White naming patterns are notthe entire story Figure VI presents time-series evidence on thefraction of Blacks who have nonunique names that are above 80on the BNI index as well as the fraction of Blacks with uniquenames The share of babies given distinctively Black but non-unique names rises from 15 percent to 22 percent from the be-
13 The choice of names by Whites over time does not exhibit this pattern ofbifurcation that is present in Black naming in Figures IV and V The BNI forWhites is almost uncorrelated with the racial segregation of the hospitals in whichthey give birth throughout the entire time period
14 There are two difficulties that arise in trying to purge the data of typo-graphical errors First the scale of the data is enormous Second we have no wayof knowing whether a particular name represents a typo (eg ldquoBrianrdquo mistyped asldquoBrainrdquo) or linguistic innovation
780 QUARTERLY JOURNAL OF ECONOMICS
ginning of the sample to the peak in the mid-1970s Uniquenames rise from 7 percent to 18 percent over that same periodAfter a dip in the 1980s unique names gain in prominence in the1990s whereas nonunique distinctively Black names do not risein popularity in the later years
FIGURE VPercentage of Unique Girl (A) and Boy (B) Names by Racial Mix of Hospital
781DISTINCTIVELY BLACK NAMES
Table II examines the relationship between parental charac-teristics birth circumstances and the names given to children atfour different points in time We estimate equations of the form
(2) BNIiht Xiht Zht Yct εiht
where i h and t index individuals hospitals and time respec-tively Xiht represents an array of individual level backgroundvariables Zht are hospital-level (potentially time varying) con-trols and Yct denotes county-level (possibly time varying) con-trols The standard errors are clustered by hospital-year The firstfour columns of the table correspond to different sample periodsColumn 1 reflects Black children born between 1961 and 1967prior to the sharp changes in Black naming behavior Column 2has births occurring between the years 1968 and 1977 the yearsin which the transition occurred Columns 3 and 4 capture theperiods 1978ndash1988 and 1989ndash2000 respectively We separatethese two time periods because of the availability of a morecomplete set of covariates after 1989 Also after 1989 we have the
FIGURE VIPercent of Black Babies Given Unique Names and Nonunique Distinctively
Black Names 1961ndash2000
782 QUARTERLY JOURNAL OF ECONOMICS
necessary information to link multiple births to the same womenallowing for the inclusion of mother-fixed effects in column 6 Allof the controls included in the regression are taken from a childrsquosbirth certificate and thus are determined at the time of birth Forthe entire period covariates available include parentsrsquo maritalstatus age and race motherrsquos place of birth her total number ofchildren months of prenatal care the babyrsquos birth weight thepercent Black at the birth hospital the percent Black in thecounty and whether the child is born in a county hospital In thelater years of the sample the set of included controls is muchricher income and percent Black at the zip code level highestgrade completed by mother and father and expected source ofpayment for the delivery
Columns 1ndash4 hold the set of covariates constant and comparethe relative importance of these variables in predicting BNI overthe four periods In almost all cases variables associated with lowsocioeconomic status are also associated with Blacker namesMoreover the link between low socioeconomic status and Blacknames becomes much stronger over time The coefficients onmotherrsquos age birth weight and single mother are less than one-half as large in the first period (column 1) as they are in the lastperiod (column 4) Fatherrsquos age has no impact in the early periodbut does have a negative coefficient in the later periods Note alsothat the R2 in the regressions increases steadily over time mean-ing that these characteristics explain a growing fraction of thevariation in names A final implication of the table is that namesare becoming more distinctively Black over the course of thesample For instance a woman with the mean sample character-istics in the 1960s would be predicted to choose a name with aBNI of 609 in the 1961ndash1967 period A woman with those samecharacteristics giving birth in the 1990s will on average choose aname with a BNI of 714 Likewise for a woman with the averagetraits of mothers giving birth in the 1990s the predicted BNI ofthe name is 705 for a baby born in the 1990s compared with 618if that baby had been born in the 1960s15
The specification estimated in columns 5 and 6 are similar tothose in the previous columns of the table except the richer set of
15 The results in Table II are similar if the sample is restricted to namesgiven to twenty or more babies in a given year Patterns are also similar if we useas the dependent variable an indicator for whether or not a child has a uniquename Although not shown in tabular form we also find that many of the samefactors that predict the choice of names among Blacks also predict the choice ofnames among Whites although for Whites the magnitude of the impacts issubstantially smaller in magnitude
783DISTINCTIVELY BLACK NAMES
TA
BL
EII
DE
TE
RM
INA
NT
SO
FN
AM
EC
HO
ICE
SA
MO
NG
BL
AC
KS
Var
iabl
e19
61ndash1
967
1968
ndash197
719
78ndash1
988
1989
ndash200
019
89ndash2
000
Fu
llco
vs19
89ndash2
000
Mot
her
FE
s
Fem
ale
129
331
484
306
317
404
(01
4)(0
14)
(01
1)(0
10)
(01
0)(0
14)
Per
cen
tof
Bla
ckba
bies
inbi
rth
hos
pita
l0
045
006
00
081
009
10
027
001
8(0
004
)(0
005
)(0
003
)(0
004
)(0
004
)(0
005
)P
erce
nt
ofB
lack
babi
esin
cou
nty
006
40
142
003
50
012
000
8
000
4(0
020
)(0
016
)(0
010
)(0
010
)(0
010
)(0
016
)M
oth
erbo
rnin
Cal
ifor
nia
2
160
46
006
046
011
mdash(0
35)
(01
6)(0
11)
(01
1)(0
10)
mdashM
oth
errsquos
age
atti
me
ofbi
rth
0
35
054
0
63
074
0
500
15(0
02)
(00
2)(0
01)
(00
1)(0
01)
(00
5)F
ath
errsquos
age
atti
me
ofbi
rth
000
0
17
013
0
19
016
0
06(0
02)
(00
1)(0
01)
(00
1)(0
01)
(00
2)M
onth
sof
pren
atal
care
0
070
27
004
0
17
004
000
(00
4)(0
04)
(00
3)(0
03)
(00
3)(0
05)
Cou
nty
hos
pita
l1
16
005
068
008
0
90
060
(02
0)(0
29)
(01
9)(0
30)
(02
9)(0
35)
Bir
thw
eigh
tin
kilo
gram
s
042
1
12
191
1
78
059
002
(01
2)(0
11)
(00
9)(0
08)
(00
8)(0
16)
Tot
aln
um
ber
ofch
ildr
en0
220
731
321
840
85
006
(00
4)(0
05)
(00
5)(0
04)
(00
4)(0
11)
Sin
gle
mot
her
210
421
521
473
295
020
(02
8)(0
15)
(01
3)(0
12)
(01
1)(0
21)
Per
cen
tage
ofB
lack
babi
esin
zip
code
mdashmdash
mdashmdash
0
0029
0
0103
mdashmdash
mdashmdash
(00
024)
(00
045)
784 QUARTERLY JOURNAL OF ECONOMICS
TA
BL
EII
(CO
NT
INU
ED
)
Var
iabl
e19
61ndash1
967
1968
ndash197
719
78ndash1
988
1989
ndash200
019
89ndash2
000
Fu
llco
vs19
89ndash2
000
Mot
her
FE
s
Per
capi
tain
com
e(a
llre
side
nts
19
89)
mdashmdash
mdashmdash
0
0622
0
0116
(10
00)
mdashmdash
mdashmdash
(00
163)
(00
340)
Per
capi
tain
com
e(B
lack
resi
den
ts
1989
)mdash
mdashmdash
mdash
022
94
008
30(
1000
)mdash
mdashmdash
mdash(0
018
7)(0
038
9)M
oth
errsquos
year
sof
edu
cati
onmdash
mdashmdash
mdash
085
00
060
mdashmdash
mdashmdash
(00
30)
(00
73)
Fat
her
rsquosye
ars
ofed
uca
tion
mdashmdash
mdashmdash
0
295
0
029
mdashmdash
mdashmdash
(00
23)
(00
43)
Pri
vate
lyin
sure
dmdash
mdashmdash
mdash
298
0
55mdash
mdashmdash
mdash(0
15)
(02
2)W
hit
em
oth
ermdash
mdashmdash
mdash
122
2mdash
mdashmdash
mdashmdash
(01
3)mdash
Wh
ite
fath
ermdash
mdashmdash
mdash
179
4
628
mdashmdash
mdashmdash
(02
6)(0
81)
Con
stan
t66
61
761
181
61
881
810
461
mdash(0
78)
(05
9)(0
51)
(05
0)(0
62)
mdashR
20
0117
003
540
0464
005
920
0951
077
64B
irth
sam
ple
use
d19
61ndash1
967
1968
ndash197
719
78ndash1
988
1989
ndash200
019
89ndash2
000
1989
ndash200
0In
clu
dem
oth
er-fi
xed
effe
cts
No
No
No
No
No
Yes
Nu
mbe
rof
obse
rvat
ion
s16
4648
2537
0340
2120
4889
5948
8959
4884
85
Th
ede
pen
den
tva
riab
lein
all
colu
mn
sis
the
Bla
ckN
ame
Inde
xof
the
nam
egi
ven
toth
ech
ild
atbi
rth
Th
eB
lack
Nam
eIn
dex
ran
ges
from
0fo
rn
ames
that
are
only
give
nto
Wh
ites
to10
0fo
rn
ames
that
are
only
give
nto
Bla
cks
All
vari
able
sin
clu
ded
onth
eri
ght-
han
dsi
deof
the
regr
essi
onar
ekn
own
atth
eti
me
ofa
baby
rsquosbi
rth
In
clu
ded
inth
ere
gres
sion
bu
tn
otre
port
edin
the
tabl
ear
ein
dica
tor
vari
able
sfo
rm
issi
ng
valu
esS
tan
dard
erro
rsar
ecl
ust
ered
tota
kein
toac
cou
nt
corr
elat
ion
acro
sspe
ople
born
inth
esa
me
hos
pita
lin
the
sam
eye
ar
785DISTINCTIVELY BLACK NAMES
covariates is used Blacker names are associated with lower-income zip codes lower levels of parental education not havingprivate insurance and having a mother who herself has a Blackername
The last column of Table II adds mother-fixed effects to thespecification Thus the identification comes from changes in amotherrsquos situation across different births To the extent thatmothers anticipate the changes that occur in their circumstancesbetween births and factor these expectations into the name givento their first child the fixed-effects coefficients will be biasedtoward zero The estimates in column 6 are substantially smallerin magnitude than in the earlier columns with the exception ofvariables reflecting how Black the neighborhood is and the coef-ficient on female The coefficient on motherrsquos age flips sign im-plying that women who have babies early in life tend to chooseBlack names relative to other women but that a given womanpicks slightly Blacker names for her children as she growsolder16 In addition the inclusion of mother-fixed effects raisesthe R2 from 095 to 776mdashthere is a great degree of continuity inthe names mothers choose for their children implying that per-son-specific tastes are quite important determinants of namechoice The results with mother-fixed effects suggest either thattemporary changes in circumstances have a relatively small im-pact on name choices or that our measures of current circum-stances are noisy
III UNDERSTANDING THE PATTERNS IN THE DATA THROUGH
THE LENS OF ECONOMIC THEORY
A number of stylized facts emerge from the analysis of thepreceding sections Blacks much more than other minoritieschoose distinctive names for their children The distinctiveness ofBlack names has risen greatly over time most notably in the late1960s and early 1970s These shifts in naming patterns have nothowever been uniform In particular among the quarter of theBlack population choosing the names most common amongWhites the opposite pattern is evident Further Blacks living inhighly segregated Black communities today are much more likelyto have distinctively Black names than those in integrated com-munities whereas this was not the case in the early 1960s
16 This result holds up when we include a full set of year dummies implyingthat the increases in BNI are age effects of the mothers and not time effects
786 QUARTERLY JOURNAL OF ECONOMICS
Finally until the late 1970s the choice of Black names was onlyweakly associated with socioeconomic status in the 1980s and1990s distinctively Black names have come to be increasinglyassociated with mothers who are young poor unmarried andhave low education
In this section we consider the extent to which existing the-ories can successfully account for this disparate set of facts
IIIA The Ignorance Model
One explanation for the prevalence of distinctively Blacknames is ignorance on the part of Black parents who fail toappreciate the costs they are imposing on their children throughsuch choices Audit study results for instance suggest that Blacknames may be punished in the labor market
This theory fails to adequately explain the sharp increase indistinctively Black names in the late 1960s and early 1970sThere is little reason to believe that Black parents became sys-tematically less informed about the consequences of distinctivelyBlack names at that time This theory is also at odds with the factthat those adopting Black names in the early 1970s were for themost part representative of the Black community not a smallsubset of parents likely to be particularly misinformed17
IIIB Price Theory Model
Consider the following skeletal outline of a price theorymodel of names which we derive formally in an earlier version ofthis paper [Fryer and Levitt 2002] Parents give names to theirchildren at birth to maximize the childrsquos expected utility Individ-uals are born into neighborhoods that differ in racial compositionPeople live and work in the same neighborhoods Moving betweenneighborhoods is costly The returns to ability are assumed to behigher in predominantly White neighborhoods White names pro-
17 On the other hand one cannot a priori rule out that this explanation haspotential relevance for explaining at least some of the patterns of the last twodecades If it became apparent in the 1980s that there were costs to having a Blackname one might expect that parents who were likely to be best informed aboutthese costs (eg older working parents living in less racially isolated neighbor-hoods) would choose such names less frequently whereas learning on this dimen-sion might be more gradual for teenage mothers in the inner city In absoluteterms this explanation fails because the adoption of Black names rose through-out the 1990s At least in relative terms however there was a shift in the 1980sand 1990s toward an increasing concentration of distinctively Black names amongparents least likely to be well informed about the potential stigma of such namesin broader society In light of results presented later in the paper that call intoquestion the costs of adopting distinctively Black names however we are quiteskeptical of this theory as an explanation for the observed phenomena
787DISTINCTIVELY BLACK NAMES
vide benefits in interactions with Whites Black names are bene-ficial when interacting with Blacks We also assume that thevalue of a White name is increasing in ability motivated by theaudit study literature which suggests that the primary cost of adistinctively Black name is via the labor market A childrsquos abilityis not known with certainty at birth although the distributionfrom which the childrsquos ability will be drawn is known
In this model parents will opt for Whiter names when (i)their children are more likely to be high ability (ii) the cost ofmoving to predominantly White neighborhoods falls (iii) returnsto ability rise in the labor market (iv) the relative cost of havinga White name when interacting with Blacks falls and (v) thebenefit of having a White name when interacting with Whitesrises
The predictions of this model face mixed success in terms ofthe patterns observed in the data Consistent with the theory isthe fact that those in racially isolated communities are especiallylikely to adopt distinctively Black names in recent decades andthat such names are most common among groups likely to facethe greatest barriers to participating in traditional labor mar-kets This theory however does quite poorly in explaining thesharp rise in distinctively Black names in the late 1960s andearly 1970smdasha period immediately following the passage of na-tional Fair Housing laws in 1968 falling social barriers to inte-gration and increased economic opportunity for Blacks Empiri-cally urban racial segregation which had been rising began to fallaround this time and has steadily declined for three decades[Cutler Glaeser and Vigdor 1999]18 In light of these apparentreductions in the costs of switching between neighborhoods onewould have expected a shift away from distinctively Black namesat precisely the point where such names were becoming mostprevalent
Additionally it is not clear that the price theory model pro-vides an adequate explanation as to why Black names are muchmore distinctive than Asian or Hispanic names when presum-ably many of the same trade-offs might also exist among thoseminority groups
18 Although the level of residential racial segregation has declined at arelatively slow rate to the extent that these persistent declines were anticipatedand parents are concerned with the impact a name will have on their children asadults in the labor market one would nonetheless expect to see an immediateabrupt shift in naming patterns
788 QUARTERLY JOURNAL OF ECONOMICS
IIIC A Signaling Model
A third model to consider is a simple signaling model inwhich distinctively Black names serve as a signaling device butare otherwise not productive along the lines of prior research byIannaccone [1992] Berman [2000] and Fryer [2003]19 Imagine apredominantly Black neighborhood populated by Black individu-als of one or two types those who have a strong affinity for theBlack community (the ldquoblackrdquo type) and those who do not (theldquowhiterdquo type) An individualrsquos type is fixed at birth and cannot bechanged Each individual knows her own type but type is notobservable to others An individualrsquos utility is determined by histype and the neighborhoodrsquos perception about his type Regard-less of onersquos actual type social interactions in the Black commu-nity yield higher utility if others believe that one has an affinityfor the Black community20 Thus all else being equal both typesprefer to be perceived as being a ldquoblackrdquo type
One way in which an individual signals his or her type is bythe names that they choose for their children In the model eachparent has one child and bestows a name on that child The(suitably anthropomorphized) community observes the name thateach parent gives his or her child and based on that signal drawsunbiased inferences about the parentrsquos type As in the pricetheory model we assume that White names provide labor marketbenefits The total cost and marginal cost of giving a child aBlacker name is lower for a parent with the ldquoblackrdquo type
Either separating or pooling equilibria may arise in suchmodels In any separating equilibrium parents whose type isldquoblackrdquo are willing to give otherwise costly names to their chil-dren simply because it allows them to distinguish themselvesfrom parents who identify as ldquowhiterdquo and derive more utilityfrom social interactions As a result peers come to regard Blacknames as a signal of community loyalty In any pooling equilib-rium the payoff to social interactions is determined by the un-derlying population distribution of types Pooling is likely tooccur in our model when the marginal rates of substitution forboth types of parents are similar
The predictions of the signaling model fit some of the basic
19 For a formal treatment of this model see the earlier version of this paper[Fryer and Levitt 2002]
20 For example those with an affinity to the Black community may be morelikely to contribute to local public goods than those with ldquowhiterdquo identitiesinducing better treatment from their neighbors For instance Anderson [1999]talks about the importance of having others ldquowatch your backrdquo
789DISTINCTIVELY BLACK NAMES
patterns observed in the data Black name choices in the 1960sfor instance look roughly consistent with a pooling equilibrium inwhich onersquos name is not a strong signal Any mechanism thatamplified the differences in the cost of signaling between the twotypes could cause a bifurcation in the distribution of Black namessuch as occurred in the early 1970s with ldquoblackrdquo types moving todistinctively Black names and ldquowhiterdquo types shifting towardWhiter names (if they previously had been in a pooling equilib-rium) or continuing to choose traditional white names (if theyformerly were in a separating equilibrium) Such a change couldhave come as a result of the increased opportunities for integra-tion due to the civil rights movement [Fryer 2003] Those Blackswith the most to gain from integration would opt for Whiternames Somewhat counterintuitively for those Blacks who con-tinue to signal a ldquoblackrdquo type to sustain the new equilibriumrequires an even costlier (ie Blacker) name choice since theoutside option is now more attractive
The signaling model appears to fall short in explaining fourdimensions of the data First in the 1980s and 1990s individualswho are most likely to adopt distinctively Black names (youngunmarried women in predominantly Black neighborhoods) arethose with the least need to signal affinity with the Black com-munity or their commitment to remaining in the neighborhoodSecond the signaling model has a hard time explaining whyBlack names became more prevalent among many different typesof Blacks including those who live in mostly White communitiesThird in order for the Black names signal to be credible it mustimpose costs on those who carry the names In Section IV of thispaper however we are unable to detect evidence that Blacknames are costly Finally the signaling model provides littlerationale as to why Blacks might engage much more extensivelyin signaling than do either Asians or Hispanics
IIID An Identity Model
The primary shortcoming of the signaling model in explain-ing the data is that for a large segment of the Black communitydistinctively Black names appear to be viewed as a benefit ratherthan a cost In the signaling model an investment must be costlyto provide a credible signal Using a similar framework butallowing Black names to be a benefit for those with the ldquoblackrdquotype and a cost for those with the ldquowhiterdquo type converts thesignaling model into a simple identity model
In particular we have in mind the framework of Akerlof and
790 QUARTERLY JOURNAL OF ECONOMICS
Kranton [2000] In their language identities are accompanied bycertain ldquoprescriptionsrdquo that define appropriate behaviors for aperson of that type When an individual takes actions in line withthese prescriptions (eg a ldquoblackrdquo type choosing a distinctivelyBlack name or a ldquowhiterdquo type choosing a White name) there is autility benefit
To justify the patterns in the time series circa 1970 throughthis model there must be a shock to the identity prescriptions(ie what it means to be Black) around this time period The riseof Black Power appears to be precisely that sort of shock Theunderlying philosophy of the Black Power movement was to en-courage Blacks to accentuate and affirm Black culture and fightthe claims of Black inferiority [Van Deburg 1992] Within theBlack community there were widespread changes in hair stylesand the rising popularity of afro-centric clothing between 1968ndash1975 [Van Deburg 1992 Woodward 1974] The adoption of dis-tinctively Black names would be completely consistent with theseother cultural phenomena The identity model may also help toexplain why naming patterns among Blacks are quite distinctivefrom Whites but Asians name their children in much the samemanner as Whites For instance if Asian ldquoprescriptionsrdquo stressfinancial success and assimilation Asian names would be ex-pected to mirror those of Whites
Another fact consistent with a Black Power explanation isthat the concentration of Blacks by county is a much strongerpredictor of Black names in the 1968ndash1977 period than the rest ofthe sample In column 2 of Table II the coefficient on that vari-able is 142 (standard error of 016) for 1968ndash1977 but neverlarger than 064 in any other period The county-level trends alsoexhibit a basic consistency with a Black Power story Alameda (inwhich Oakland is located) Los Angeles and San Francisco coun-ties were the centers of the Black Power movement Black namesincreased earlier and to a greater extent in these three countiesthan the rest of the state
The identity model may also apply to the increases in BNI inthe 1990s as there is suggestive evidence that there was a sec-ondary Black cultural movement during this time Indeed this isprecisely the period in which Blacks (headed by Jesse Jacksonand Detroit Mayor Coleman Young) demanded to be referred to asAfrican-American This change was meant to tie Blacks moreclosely to their African cultural heritage Enrollment in histori-cally Black colleges and universities which had been declining fora decade rose over 20 percent between 1986 and 1994 [Hoffman
791DISTINCTIVELY BLACK NAMES
1996] There was an emergence in the entertainment industry ofpolitically motivated music (Public Enemy for example) and film(ie Do the Right Thing Spike Lee) which highlighted the ab-horrence in black communities of the status quo Recall a similarspark ignited the Black Power movement as some Blacks werefrustrated with the niceties of the civil rights generation In arelated paper McAdams Fryer and Levitt [2003] provide a morethorough investigation of the black power movement between1968ndash1975 and the Black cultural movement in the 1990s asexplanations of the time-series changes in BNI21
In summary although the evidence in favor of the identitymodel is far from overwhelming it is the only theory examinedwhich does not yield predictions that are directly at odds with theobserved patterns in the data
IV THE RELATIONSHIP BETWEEN NAMES AND ADULT OUTCOMES
In light of audit studies documenting the use of names as ascreening device by employers one might expect that having adistinctively Black name should be associated with worse eco-nomic outcomes holding all else equal In this section we linkinformation from a womanrsquos own birth certificate to her adultcircumstances as reflected in the information on the birth certifi-cates of her children at the time she gives birth
In order to make this linkage a woman must be born inCalifornia and later give birth in California We focus our analy-sis on women born in 1973 and 1974mdashthe earliest years for whichwe have the necessary information to make reliable links Of thewomen still residing in California who have given birth we matchat a high rate (over 90 percent)22 The subset of women that wesuccessfully link is not representative of all women born in 1973ndash1974 In particular women who defer childbearing to their latetwenties are excluded from our sample The women we are able tolink are themselves born to slightly younger unmarried mothers
21 Lieberson and Michelson [1995] make a similar point as they relate therise in the prevalence of unique names to the rise of the Black Panther Party
22 According to the 1990 Census roughly 20 percent of Black women born inCalifornia live outside the state during their childbearing years Also based on1990 Census data 42 percent of Black women born in California have no childrenby age 27 If leaving California is independent of the decision to have a child byage 27 then 464 percent of Black women born in California should give birth inCalifornia in our sample [1ndash2] 58 For details of how this linkage is performedsee the data appendix A smaller subset of White women are successfully linkedbecause more Whites move out of state and more White women defer childbearinguntil later in life
792 QUARTERLY JOURNAL OF ECONOMICS
The differences between the whole sample and the linked subsetare consistent with higher fertility rates and lower rates of cross-state mobility among these groups Importantly however aftercontrolling for socioeconomic characteristics there is no system-atic difference between the first names of the women who are orare not successfully linked If we regress an indicator variable fora successful link (equal to one if a link occurs and zero otherwise)on the womanrsquos BNI and background characteristics at the timeof the womanrsquos birth the coefficient on the womanrsquos BNI is bothsubstantively and statistically insignificant Nonetheless it isimportant to emphasize that our sample for testing the relation-ship between names and life outcomes is limited to females bornin California who later give birth there before the age of 27Further our outcome measures are coarse We do not observeindividual wages or family economic circumstances but ratherthe median income of their zip code years of education etc whichare highly correlated with the relevant outcomes
Our approach to testing for a relationship between namesand life outcomes involves predicting adult life outcomes as afunction of everything known about a woman and her parents atthe time of her own birth including her name
(3) yiadult BNIi Xi
birth hbirth εi
where i indexes women h represents hospitals and the super-scripts adult and birth correspond to the time at which thevariable is measured In some specifications we restrict the sam-ple only to Blacks in other cases we include both Blacks andWhites including an indicator for race and interactions betweenBNI and race We analyze a wide selection of outcomes as depen-dent variables All of the covariates included in the earlier analy-sis of the cohorts born in the 1970s are also in this specificationWe limit the sample to the last birth that we observe for aparticular woman in order to most closely approximate the long-run outcomes of the women although the results are not sensitiveto this restriction
The clear weakness of this empirical approach is that ifunobserved characteristics of the woman are correlated both withlife outcomes and her name our estimates will be biased Giventhat Black names are associated with lower socioeconomic statuson observable measures one would expect that Black names arealso likely to be positively correlated with omitted variables that
793DISTINCTIVELY BLACK NAMES
predict worse life outcomes leading our estimates to exaggeratethe true relationship between a womanrsquos name and her life out-comes although one can also construct scenarios in which theopposite bias could arise23
The results of estimating equation (3) restricting the sampleto Black women are presented for a range of outcome variable inthe top two rows of Table III The top row does not include anycontrols the second row includes the full set of controls In bothcases only the coefficient on the womanrsquos own Black Name Indexis presented in the table In the absence of controls for back-ground characteristics Blacker names are uniformly associatedwith worse adult outcomes Given the correlation between Blacknames growing up in segregated neighborhoods and more diffi-cult home environments this relationship is expected What issurprising especially in light of the biases discussed above ishow limited the impact of a womanrsquos name is on her life outcomesonce we control for other factors that are present at the time ofher birth When we include covariates in the basic specification(row 2) we find statistically significant coefficients for only fouroutcomes percent Black in the hospital the mother gives birthwhether the woman is unmarried at the time of the birth percapita income among Blacks living in her zip code and how Blacka name the woman chooses for her own child Even in these casesof statistical significance the magnitude of the coefficients asso-ciated with the BNI is substantively small Changing the BNIfrom 50 to 100 raises the percent Black in the hospital where themother gives birth by less than one percentage point the proba-bility of an unmarried birth two-tenths of one percentage pointand per capita income for Blacks in the zip code by $100 Thelargest impact that a womanrsquos name appears to have is on howshe names her children An increase of 50 in the BNI raises theBNI of her children by about 3mdasha little more than half the impactthat being a single mother has on naming and the same impactas having the child in a hospital in which an extra 30 percent ofthe births are to Blacks None of the other variables consideredyield statistically significant coefficients years of education of thewoman or the father of her child motherrsquos age at first birth
23 One logical solution to this problem would be to use the name of thewomanrsquos mother as an instrument The motherrsquos name is a strong predictor of herdaughterrsquos name but one might plausibly argue that controlling for a wide rangeof covariates at the time of the daughterrsquos birth the motherrsquos name will have noimpact on her daughterrsquos adult outcomes Unfortunately the motherrsquos first nameis not included in our data set until 1982 so this instrumental variables strategywill not be feasible until more years of time have passed
794 QUARTERLY JOURNAL OF ECONOMICS
private insurance coverage her babyrsquos birth weight and numberof total children born to date24 Particularly in light of the biaseslikely to be pushing the results toward finding a spurious nega-tive relationship between names and outcomes we conclude thatthere is little evidence that how Black onersquos name is negativelyimpacts life outcomes
In the remaining rows of Table III we expand the sample toinclude both Whites and Blacks In addition to the same set ofcontrol variables included in the second row of the table we addan indicator variable for a womanrsquos race as well as interactionsbetween race and BNI The race dummy captures systematicdifferences in outcomes for Blacks and Whites with otherwisesimilar observable characteristics at birth The interactions be-tween BNI and race allow for a differential impact of name choiceby race Empirically we find large coefficients on the race vari-able for most outcomes Controlling for the set of characteristicsobserved at the time of a womanrsquos birth Black women live inneighborhoods with 288 percentage points more Blacks givebirth about one year earlier have babies that weigh almost 200grams less are 26 percentage points more likely to be unmarriedwhen they give birth nine percentage points less likely to haveprivate insurance and live in neighborhoods with per capitaincome over $2000 lower than Whites The only variables forwhich the race dummies are not substantively large is for years ofeducation These systematic racial differences may reflect eitherdiscrimination or unmeasured differences between Blacks andWhites we have no power to distinguish between these compet-ing hypotheses Note however that the weak relationship be-tween names and outcomes persists Interestingly there is gen-erally a stronger relationship between BNI and life outcomes forWhites than Blacks although in both cases the magnitude of theeffects is small25
24 The findings are robust to relaxing the restriction that BNI affect theoutcome measures linearly If we replace our measure of BNI with a set ofmutually exclusive indicator variables corresponding to having a unique name aBNI greater than 80 but not unique a BNI between 50 and 80 and the omittedcategory which is a BNI less than 50 the basic conclusions are unchanged
25 We have also explored whether other aspects of naming have a causalimpact on life outcomes For example one might expect that having the ldquowrongrdquokind of name (ie a White name in a Black neighborhood and vice versa) will atleast in terms of utility adversely affect life outcomes We attempted to identifypeople with the ldquowrongrdquo names in two different ways In the first approach wecalculate the deviation between the BNI that a person actually received and theBNI that we predict they should have received based on their birth circumstancesThe absolute magnitude of the deviation represents how ldquowrongrdquo their name isfrom an ex ante perspective An alternative way of characterizing someone as
795DISTINCTIVELY BLACK NAMES
TA
BL
EII
IT
HE
RE
LA
TIO
NS
HIP
BE
TW
EE
NN
AM
ES
AN
DL
IFE
OU
TC
OM
ES
Per
cen
tB
lack
inre
side
nti
alzi
pco
deas
anad
ult
Per
cen
tB
lack
inh
ospi
tal
wh
ere
mot
her
give
sbi
rth
asan
adu
lt
Per
cen
tm
inor
ity
inh
ospi
tal
wh
ere
mot
her
give
sbi
rth
asan
adu
lt
Yea
rsof
edu
cati
on(t
he
wom
anh
erse
lf)
Yea
rsof
edu
cati
on(f
ath
erof
wom
anrsquos
chil
d)
Wom
anrsquos
age
atfi
rst
birt
h
Mea
n43
347
457
012
412
219
6S
tan
dard
dev
(35
0)(2
72)
(23
3)(1
6)
(22
)(3
0)
Oth
erco
ntr
ols
Sam
ple
rest
rict
edto
Bla
cks
Coe
ffici
ent
onth
eva
riab
le
Bla
ckN
ame
Inde
xN
o0
0602
005
430
0458
0
0006
0
0006
0
0020
(00
099)
(00
080)
(00
101)
(00
005)
(00
007)
(00
008)
Bla
ckN
ame
Inde
xY
es0
0155
001
720
0201
000
080
0000
000
09(0
009
6)(0
007
2)(0
009
2)(0
000
5)(0
000
7)(0
000
7)S
ampl
ein
clu
des
Bla
cks
and
Wh
ites
Coe
ffici
ent
onth
eva
riab
le
Bla
ckN
ame
Inde
x
Bla
ckY
es0
0007
000
760
0073
000
090
0004
000
03(0
009
6)(0
007
3)(0
006
2)(0
000
5)(0
000
7)(0
000
8)B
lack
Nam
eIn
dex
W
hit
eY
es0
0018
001
510
0144
0
0022
0
0013
0
0026
(00
028)
(00
041)
(00
043)
(00
0044
)(0
000
66)
(00
0063
)B
lack
Yes
288
207
190
009
7
007
2
091
1(1
2)
(10
)(0
9)
(00
46)
(00
71)
(00
78)
796 QUARTERLY JOURNAL OF ECONOMICS
TA
BL
EII
I(C
ON
TIN
UE
D)
Bab
yrsquos
birt
hw
eigh
tin
gram
s
Un
mar
ried
wh
enba
bybo
rn
Pri
vate
lyin
sure
dat
tim
eof
birt
hT
otal
chil
dren
born
sofa
r
Per
capi
tazi
pco
dein
com
e(a
llre
side
nts
)
Per
capi
tazi
pco
dein
com
e(B
lack
resi
den
ts)
Bla
ckN
ame
Inde
xof
nam
ech
osen
for
her
chil
d
3219
40
710
372
0112
587
1117
077
8(5
604
)(0
45)
(04
8)(1
16)
(469
7)(3
552)
(29
23)
Sam
ple
rest
rict
edto
Bla
cks
Coe
ffici
ent
onth
eva
riab
le
Bla
ckN
ame
Inde
x
027
000
07
000
040
0009
7
1
50
008
1(0
16)
(00
001)
(00
001)
(00
003)
(14
)(1
1)
(00
09)
Bla
ckN
ame
Inde
x
004
000
04
000
010
0005
2
2
19
006
2(0
17)
(00
001)
(00
001)
(00
003)
(11
)(1
4)
(00
09)
Sam
ple
incl
ud
esB
lack
san
dW
hit
es
Coe
ffici
ent
onth
eva
riab
le
Bla
ckN
ame
Inde
x
Bla
ck0
150
0002
000
000
0005
0
2
11
005
8(0
17)
(00
001)
(00
001)
(00
003)
(14
)(1
1)
(00
09)
Bla
ckN
ame
Inde
x
Wh
ite
015
000
02
000
040
0008
5
0
18
003
4(0
15)
(00
001)
(00
001)
(00
002)
(14
)(1
8)
(00
07)
Bla
ck
194
50
26
009
021
23
643
68
79
413
7(1
51)
(00
1)(0
02)
(00
3)(1
507
)(1
326
)(0
82)
The
depe
nden
tva
riab
leis
liste
dat
the
top
ofea
chco
lum
nT
heva
lues
repo
rted
inth
eta
ble
are
the
coef
ficie
nton
the
mea
sure
ofho
wB
lack
anin
divi
dual
rsquosna
me
isI
nth
eto
ptw
oro
ws
the
key
regr
esso
ris
the
Bla
ckN
ame
Inde
xIn
the
bott
omsi
xro
ws
thre
ein
dica
tor
vari
able
sar
ein
clud
edde
noti
ngw
heth
era
nam
eis
uniq
ueg
reat
erth
an80
onth
eB
lack
Nam
eIn
dex
orbe
twee
n50
and
80T
heom
itte
dca
tego
ryis
less
than
50in
thos
esp
ecifi
cati
ons
Res
ults
are
pres
ente
dw
ith
noco
ntro
lsan
din
clud
ing
perc
ent
ofB
lack
babi
esin
birt
hho
spit
alp
erce
ntof
Bla
ckba
bies
inbi
rth
coun
tyw
heth
erm
othe
rw
asbo
rnin
Cal
ifor
nia
mot
herrsquo
sag
eat
tim
eof
birt
hfa
ther
rsquosag
eat
tim
eof
birt
hm
onth
sof
pren
atal
care
whe
ther
born
ina
coun
tyho
spit
al
birt
hw
eigh
tto
taln
umbe
rof
child
ren
and
dum
my
for
sing
lem
othe
rT
hesa
mpl
ein
the
top
pane
lof
the
pape
ris
the
set
ofB
lack
wom
enfo
rw
hom
we
succ
essf
ully
mat
chth
eir
own
birt
hce
rtifi
cate
info
rmat
ion
toth
atof
thei
rch
ildre
nw
hen
the
wom
enth
emse
lves
give
birt
hT
hesa
mpl
ein
the
bott
ompa
neli
nclu
des
both
Bla
cks
and
Whi
tes
who
mw
esu
cces
sful
lym
atch
from
own
birt
hce
rtifi
cate
toth
ech
ildrsquos
Sta
ndar
der
rors
are
inpa
rent
hese
sA
llof
the
cova
riat
esin
the
regr
essi
ons
(per
cent
Bla
ckba
bies
inw
oman
rsquosbi
rth
hosp
ital
per
cent
ofB
lack
babi
esin
coun
tyof
wom
anrsquos
birt
hw
heth
erw
oman
rsquosm
othe
ris
born
inC
alif
orni
am
othe
rrsquos
and
fath
errsquos
age
atti
me
ofw
oman
rsquosbi
rth
mot
herrsquo
sm
onth
sof
pren
atal
care
whe
ther
wom
anrsquos
mot
her
was
mar
ried
atth
eti
me
ofw
oman
rsquosbi
rth
whe
ther
wom
anw
asbo
rnin
aco
unty
hosp
ital
w
oman
rsquosbi
rth
wei
ght
and
tota
lnu
mbe
rof
prio
rbi
rths
toth
ew
oman
rsquosm
othe
r)ar
ekn
own
asof
1973
ndash197
4w
hen
the
wom
enar
ebo
rnA
llof
the
outc
ome
vari
able
sco
rres
pond
toth
eci
rcum
stan
ces
whe
nth
eygi
vebi
rth
asad
ults
inth
epe
riod
1989
ndash200
0
797DISTINCTIVELY BLACK NAMES
There are three possible interpretations of the data thatreconcile our findings with that of the audit study literature Onepossibility is that the only function names serve is as a noisyinitial indicator of race In this view of the world those with Blacknames may receive fewer job interviews but no fewer job offersDiscriminatory employers will use distinctively Black names asnoisy signals of race but names become irrelevant once the can-didate shows up for an interview and the employer directly ob-serves race26 Indeed in such a world there is a benefit to Blacksof signaling their race through name choice in order to avoidundertaking costly interviews unlikely to yield jobs and to signalrace to employers giving preferential treatment to Blacks Asecond interpretation of the data that is consistent with ourfindings and those of the audit studies is that Black namesbecause of self-selection among Black parents provide usefulsignals of human capital to employers even controlling for raceitself and other information available on resumes27 A final pos-sibility is that names themselves have a modest causal impact onjob callbacks and unemployment duration that we are unable todetect using the relatively coarse outcome measures available tous Note that only in the third of these three interpretations doesa personrsquos name have any causal impact on life outcomes
We cannot directly test between these competing hypothesesfor two reasons First our data set lacks clean measures ofproductivity We do however observe worker characteristics that
having the ldquowrongrdquo name is to look at cases in which a womanrsquos name is mis-matched ex post with the actual neighborhood in which she lives as an adult Inneither case do we find a systematic link between having the ldquowrongrdquo name andthe types of outcomes we are measuring
26 Even if names have an impact that extends beyond the resume stage inan efficient market with sufficiently many nondiscriminatory employers thepresence of discrimination need not result in worse outcomes for Blacks [Becker1957] Note also that at least in the past a relatively small fraction of the jobswere actually obtained through a formal resume-based process Granovetter[1974] reports that approximately 10 percent of respondents in a survey reportobtaining their job through job advertisements
27 From a legal perspective the use of names as a basis for hiring decisionsis likely to be a violation of current law regardless of whether there are under-lying productivity differences In the 1971 decision Griggs v Duke Power theSupreme Court ruled unanimously that policies that are neutral on their face buthave a disparate impact on Blacks are not allowed This doctrine was codified inthe Civil Rights Act of 1991 after the 1989 case Antonio v Wards Cove Packingmodified the Griggs ruling by stating that policies with disparate impacts wereallowable as long as they served a legitimate business interest Indeed even theuse of names to choose a subset of Blacks from an entirely Black hiring pool wouldprobably be viewed as illegal under Connecticut v Teal in which it was found thateven policies that have no disparate impact on a protected group but harm someindividuals within that group violate the law
798 QUARTERLY JOURNAL OF ECONOMICS
might be correlated with labor productivity (see eg Heckmanand Carneiro [2003]) but are typically not included on a resume(and are for the most part illegal for employers to inquire about)whether a woman is a single mother was born to a teenagemother was raised in a single-parent household or the degree ofracial segregation into which she was born The second difficultyin testing this hypothesis is that we do not have in our data all ofthe information on a resume (eg particular schools attendedcomplete work history misspellings)
Our empirical strategy in light of these shortcomings is toestimate a number of specifications in the general spirit of equa-tion (2) varying the set of covariates included in the regression Acritical difference between the earlier estimates and those pre-sented below are that we now include information about the adultcircumstances of a woman as covariates since such information ison the resume The results are presented in Table IV Rows of thetable correspond to different factors that might be correlated withlabor productivity due to their influence on human capital seg-regation in onersquos birth hospital motherrsquos marital status whetheronersquos mother was a teenager the womanrsquos own birth weight thewomanrsquos own marital status the education level of the man whois father to her children and the total number of children born tothe woman The first two columns of the table include both Blacksand Whites in the regressions We do not however include racedummies in the specification because race is not directly observedby the prospective employer from the resume The third andfourth columns of the table limit the sample only to Blacks Theentries in the table are the coefficient on the womanrsquos BNI Eachtable entry is from a different regression The first and thirdcolumns do not include any covariates the second and fourthcolumn includes the womanrsquos age years of education whether ornot she has private health insurance (the best measure we havewith respect to the quality of her current employment) zip code ofresidence fixed effects and year dummies These variables cap-ture some of the information on a resume Our sample is the setof women whom we observe both at their birth in 1973ndash1974 andas adults in 1989ndash2000
The results in Table IV suggest that a womanrsquos first name isindeed a useful predictor of the circumstances in which she grewup and her current situation both of which may in turn becorrelated with labor productivity This is true even after includ-ing our crude set of controls that proxy for information availableon the resume A womanrsquos name is a particularly important
799DISTINCTIVELY BLACK NAMES
predictor when we pool Blacks and Whites in the same regression(columns 1 and 2) In column 2 a woman with a BNI equal to 100(implying a name that no Whites have) is 209 percentage pointsmore likely to have been born to a teenage mother and 313percentage points more likely to have been born out-of-wedlockthan a Black woman living in the same zip code with the same ageand education but carrying a name that is equally commonamong Whites and Blacks The woman with a Black name is alsomuch more likely to have been born in a Black neighborhood toherself be unmarried to have had lower birth weight and to havegiven birth to more children The same pattern of results al-though generally somewhat smaller in magnitude is apparenteven when we restrict the sample to Blacks In other words evenif the employer knows that a candidate is Black the Blackness of
TABLE IVTHE SIGNALING VALUE OF NAMES TO EMPLOYERS
Dependent variable
Sample includes Blacksand Whites
Sample includes onlyBlacks
Nocontrolsincluded
Controlsproxying for
some informationon a resume
Nocontrolsincluded
Controlsproxying for
some informationon a resume
Percent of Black babies inwomanrsquos birth hospital
03015 01417 00690 00526(00026) (00045) (00064) (00085)
Woman born to a teenagemother
000260 000209 000238 000232(000005) (000009) (000011) (000016)
Woman born to an unmarriedmother
000508 000313 000193 000176(000005) (000009) (000011) (000017)
Womanrsquos birth weight(in grams)
216 103 016 011(007) (009) (013) (016)
Woman herself unmarried attime she gives birth
000338 000111 000038 000023(000006) (000006) (000010) (000009)
Years of education for theman who fathers thewomanrsquos child
00050 00002 00010 00006(00003) (00004) (00006) (00006)
Total number of childrenborn to the woman
000283 000238 000079 000090(000011) (000016) (000025) (000029)
The relevant dependent variable is listed on the left-hand side of the table The values reported in thetable are the coefficients on the Black Name Index of the woman Each table entry is from a separateregression In columns 1 and 3 no controls are included In columns 2 and 4 controls for a womanrsquos age yearsof education zip code of residence whether the woman is privately insured and year dummies are includedThese variables proxy for some of the types of information available to employers on resumes The sampleused in all regressions is the set of black women for whom we successfully link information from their ownbirth certificate to their childrsquos birth certificate Unlike earlier regressions these specifications control forchoices that a woman makes over the course of her life such as years of education The number ofobservations is 62309 for the sample that includes Blacks and Whites and 18427 for the sample that onlyincludes Blacks
800 QUARTERLY JOURNAL OF ECONOMICS
the name continues to serve as an important signal of socioeco-nomic status Thus while we cannot rule out animus on the partof employers we find evidence supporting a potential productiv-ity-related statistical discrimination motive for employers to baseinterview decisions on first names
V CONCLUSION
We document stark differences in naming patterns betweenBlacks and Whites and demonstrate that these patterns changesharply over time While most Blacks have shifted toward moredistinctively Black names (particularly in the late 1960s andearly 1970s) the fraction of Blacks choosing starkly White nameshas also increased How distinctively Black onersquos name was ap-pears to have signaled little in the early 1960s Naming conven-tions differed modestly across parental characteristics or neigh-borhood types The last two decades however have led to aldquoghettoizationrdquo of distinctively Black names namely a distinc-tively Black name is now a much stronger predictor of socioeco-nomic status Among the theories we consider models in whichthe rise of the Black Power movement triggers important changesin Black identity appear to be most consistent with our data Wefind no relationship between how Black onersquos name is and lifeoutcomes after controlling for other factors If that conclusion iscorrect then the proper interpretation of earlier audit studiesusing Black names on resumes is either that the impact of namesdoes not extend beyond the callback decision (because race isdirectly observed at the interview stage) or that names are cor-related with determinants of productivity not captured by a re-sume In our data it is difficult to distinguish between thesecompeting hypotheses
More generally this paper takes first steps toward an at-tempt to understand what role Black culture might play in ex-plaining continued poverty and racial isolation With respect tothis particular aspect of distinctive Black culture we concludethat carrying a black name is primarily a consequence rather thana cause of poverty and segregation
APPENDIX DATA DESCRIPTION
In this data appendix we describe the data sources that wedraw upon in our analysis give a description of some data limi-
801DISTINCTIVELY BLACK NAMES
tations and other data issues with which we are confrontedprovide definitions and describe the process used to link mothers
1 Data SourcesBirth Data Our empirical analyses are mainly based on data
drawn from the Birth Statistical Master File maintained by theOffice of Vital Records in the California Department of HealthServices These files provide information drawn from birth cer-tificates for virtually all children born in California over theperiod 1961ndash2000 With the approval of the California Committeefor the Protection of Human Subjects we have been able tosupplement the information contained on the public use versionsof these data sets with personal identifiers including motherrsquosfirst name motherrsquos maiden name and childrsquos full name
Zip Code Statistics U S Bureau of the Census AmericanFact Finder 1990 Census
Demographic and Socioeconomic Data For an accuracycheck on mother-children links data were obtained from theAmerican Community Survey 5 Percent Public Use of MicrodataSamples (PUMS) for California and United States (All States)U S Bureau of the Census Arabic First Names To identify anddiscard Arabic names from our data we used Bruce Lansky[1999] Baby Names Around the World
2 Data Limitations and Other Data IssuesRaceEthnicity From 1998 to 2000 information of a childrsquos
race is missing For these three years a child is considered Blackif either parent is Black In other years over 98 percent ofchildren with at least one Black parent are coded as Black Priorto 1982 most Hispanics are included with whites and it is notpossible to directly calculate statistics for Non-Hispanics Begin-ning in 1982 an identifier for Hispanic ethnicity was added to thebirth certificate in California Using information from this latterperiod we drop anyone in the earlier time period with a surnameor motherrsquos maiden name that is more than 10 percent Hispanic
Link of Birth Certificate Data for Women Born in 1973ndash1974to When They Give Birth Themselves in the Period 1989ndash2000 Inorder to uniquely link information from a womanrsquos own birthcertificate to those of her children when she gives birth a womanmust both be born in California and later give birth there Onlyafter 1989 do we have the motherrsquos date of birth and full firstname two critical pieces of information for making the linkageWe thus limit the sample to babies born 1989ndash2000 to Blackwomen themselves born in California In order to identify women
802 QUARTERLY JOURNAL OF ECONOMICS
whose birth histories are likely to be most fully captured by theperiod 1989ndash2000 we restrict the matching to women who werethemselves born in 1973ndash1974 We restrict the sample to Blackwomen born in California We then carry out five different match-ing procedures in which we use a motherrsquos exact date of birth andpermutations of her first name and maiden name (match only onmaiden name only on first name on first name and maidenname on first initial and maiden name and on first name andmaiden name initial) We keep only cases where the match be-tween mother and child is unique ie there is no other womanborn in California in 1973ndash1974 who has information that couldpossibly match the characteristics of the mother on the birthcertificate Because of typographical errors using only a subset ofthe information in a womanrsquos name somewhat increases thenumber of successful matches
HARVARD UNIVERSITY SOCIETY OF FELLOWS AND NBERDEPARTMENT OF ECONOMICS UNIVERSITY OF CHICAGO
REFERENCES
Akerlof George and Rachel Kranton ldquoEconomics and Identityrdquo Quarterly Jour-nal of Economics CXV (2000) 715ndash753
Anderson Elijah Streetwise Race Class and Change in an Urban Community(Chicago IL University of Chicago Press 1990)
mdashmdash Code of the Street Decency Violence and the Moral Life of the Inner City(New York NY W W Norton and Company Inc 1999)
Austen-Smith David and Roland Fryer ldquoThe Economics of lsquoActing WhitersquordquoNBER Working Paper No 9904 2003
Bart Barbara Marsha Hass Jane Philbrick Martha Sparks and Craig WilliamsldquoWhatrsquos in a Namerdquo Women in Management Review XII (1997) 209ndash308
Becker Gary The Economics of Discrimination (Chicago IL University of Chi-cago Press 1957)
Berman Eli ldquoSect Subsidy and Sacrifice An Economistrsquos View of Ultra-Ortho-dox Jewsrdquo Quarterly Journal of Economics CXV (2000) 905ndash953
Bertrand Marianne and Sendhil Mullainathan ldquoAre Emily and Greg MoreEmployable Than Lakisha and Jamal A Field Experiment Evidence onLabor Market Discriminationrdquo NBER Working Paper No 9873 2003
Bound John and Richard Freeman ldquoWhat Went Wrong The Erosion of RelativeEarnings and Employment among Black Men in the 1980srdquo Quarterly Jour-nal of Economics CVII (1992) 201ndash232
Brown C and P Gay Racial Discrimination 17 Years After the Act (London UKPolicy Studies Institute 1985)
Busse Thomas V and Louisa Seraydarian ldquoDesirability of First Names Ethnic-ity and Parental Educationrdquo Psychological Reports XL (1977) 739ndash742
Chandra Amitabh ldquoIs the Convergence of the Racial Wage Gap Illusoryrdquo NBERWorking Paper No 9476 2003
Counihan Carol and Penny Van Esterik Food and Culture A Reader (New YorkNY Routledge 1997)
Cutler David Edward Glaeser and Jake Vigdor ldquoThe Rise and Decline of theAmerican Ghettordquo Journal of Political Economy CVII (1999) 455ndash506
Fordham Signithia and John Ogbu ldquoBlack Studentsrsquo School Successes Copingwith the Burden of lsquoActing Whitersquordquo The Urban Review XVIII (1986)176ndash206
803DISTINCTIVELY BLACK NAMES
Fryer Roland G ldquoAn Economic Approach to Cultural Capitalrdquo unpublishedmanuscript University of Chicago 2003
Fryer Roland and Steven Levitt ldquoThe Causes and Consequences of DistinctivelyBlack Namesrdquo unpublished manuscript University of Chicago 2002
Glaeser Edward David Laibson and Bruce Sacerdote ldquoAn Economic Approach toSocial Capitalrdquo Economic Journal CXII (2002) 437ndash458
Goldin Claudia and Maria Shim ldquoMaking a Name Womenrsquos Surnames atMarriage and Beyondrdquo mimeo Harvard University 2003
Granovetter Mark Getting a Job A Study of Contacts and Careers (Chicago ILUniversity of Chicago Press 1974)
Hannerz Ulf Soulside Inquiries into Ghetto Culture and Community (New YorkNY Columbia University Press 1969)
Heckman James Tom Lyons and Petra Todd ldquoUnderstanding Black-WhiteWage Differentials 1960ndash1990rdquo American Economic Review XC (2000)344ndash349
Heckman James and Pedro Carneiro ldquoHuman Capital Policyrdquo NBER WorkingPaper No 9495 2003
Hoffman Charles ldquoHistorically Black Colleges and Universities 1976ndash1994rdquoNCES Technical Paper No 96902 1996
Hubbick J and S Carter Half a Chance A Report on Job Discriminationagainst Young Black Males in Nottingham (London UK Commission forRacial Equality 1980)
Iannaccone Laurence ldquoSacrifice and Stigma Reducing Free-Riding in CultsCommunes and Other Collectivesrdquo Journal of Political Economy C (1992)271ndash291
Jackson George White and Negro Spirituals their Life Span and Kinship Trac-ing 200 Years of Untrammeled Song Making and Singing among our CountryFolk with 116 Songs as Sung by Both Races (New York NY J J Augustin1944)
Jencks Christopher and Meredith Phillips The Black-White Test Score Gap(Washington DC Brookings Institution 1998)
Johnston Lloyd Patrick OrsquoMalley Jerald Bachman and John Schulenberg ldquoCig-arette Brand Preferences among Adolescentsrdquo Monitoring the Future Occa-sional Paper 45 Institute for Social Research University of Michigan 1999
Jowell R and P Prescott-Clarke ldquoRacial Discrimination and White-CollarWorkers in Britainrdquo Race XI (1970) 397ndash417
Kington Raynard and Herbert Nickens ldquoRacial and Ethnic Differences inHealth Recent Trends Current Patterns and Future Directionsrdquo in AmericaBecoming Racial Trends and Their Consequences Neil J Smelser William JWilson and Faith Mitchell editors Commission on Behavioral and SocialSciences and Education (Washington DC National Academy Press 2001)pp 253ndash310
Lazear Edward ldquoCulture and Languagerdquo Journal of Political Economy CVII(1999) S95ndashS126
Lewis Oscar La Vida A Puerto Rican Family in the Culture of PovertymdashSanJuan and New York (New York NY Random House 1966)
Lieberson Stanley A Matter of Taste How Names Fashions and Culture Change(New Haven CT Yale University Press 2000)
Lieberson Stanley and Kelly Mikelson ldquoDistinctive African-American NamesAn Experimental Historical and Linguistic Analysis of Innovationrdquo Ameri-can Sociological Review LX (1995) 928ndash946
Massey Douglas ldquoResidential Segregation and Neighborhood Conditions in U SMetropolitan Areasrdquo in America Becoming Racial Trends and Their Conse-quences I (Washington DC The National Academies Press 2001) pp391ndash434
McAdams Doug Roland Fryer and Steven Levitt ldquoWhatrsquos in a Name BlackPower and the Change in African-American Names 1961ndash2000rdquo workingpaper Stanford University 2003
Orr Eleanor Twice as Less Black English and the Performance of Black Studentsin Mathematics and Science (New York NY W W Norton 1989)
Reno Janet et al Correctional Populations of the United States (WashingtonDC Bureau of Justice Statistics 1997)
Riessman Frank The Culturally Deprived Child (New York NY Harper amp Bros1962)
804 QUARTERLY JOURNAL OF ECONOMICS
Smith James and Finis Welch ldquoBlack Economic Progress After Myrdalrdquo Journalof Economic Literature XXVII (1989) 519ndash564
Van Deburg W L New Day in Babylon The Black Power Movement and Ameri-can Culture 1965ndash1975 (Chicago IL University of Chicago Press 1992)
Ventura Stephanie and Christine Bachrach ldquoNonmarital Childbearing in theUnited States 1940ndash1999rdquo in National Vital Statistics Reports XLVIII(Hyattsville MD National Center for Health Statistics 2000)
Waldfogel Joel ldquoPreference Externalities An Empirical Study of Who BenefitsWhom in Differentiated Product Marketsrdquo Rand Journal of EconomicsXXXIV (2003) 557ndash568
Wilson William The Truly Disadvantaged The Inner City the Underclass andPublic Policy (Chicago IL University of Chicago Press 1987)
Wolfram Walt and Erik Thomas Development of African-American English(Oxford UK Blackwell Publishers 2002)
Woodward Vann C The Strange Career of Jim Crow (New York NY OxfordUniversity Press 1974)
Young Andrew An Easy Burden The Civil Rights Movement and the Transfor-mation of America (New York NY HarperCollins Publishers 1996)
805DISTINCTIVELY BLACK NAMES
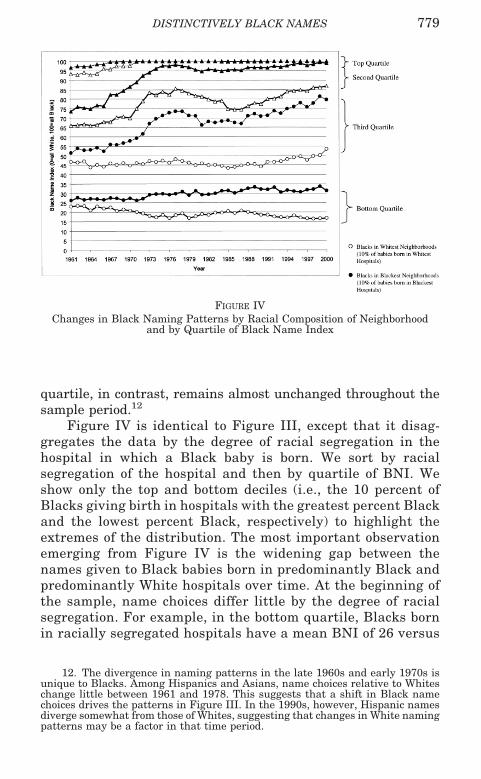
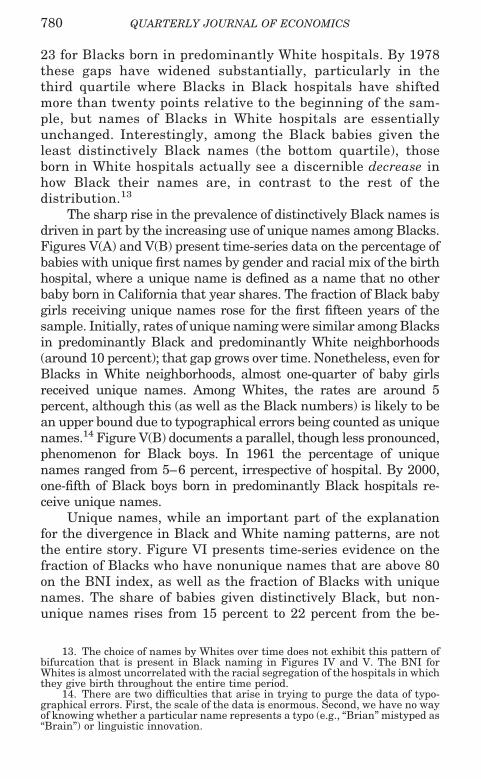
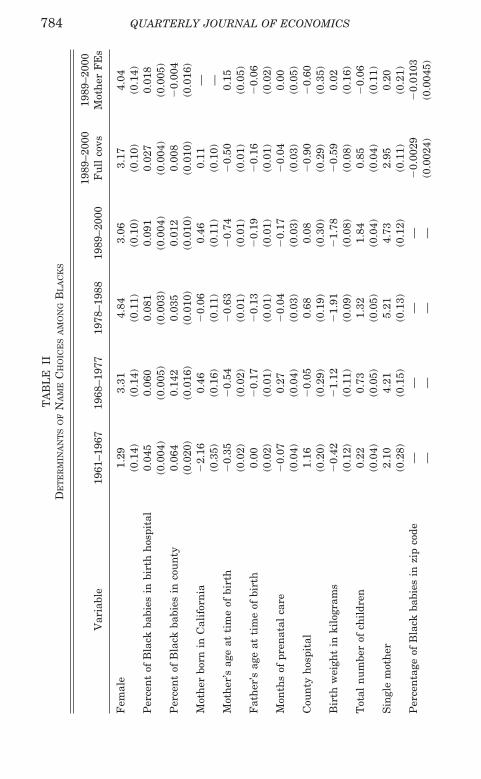
TA
BL
EII
(CO
NT
INU
ED
)
Var
iabl
e19
61ndash1
967
1968
ndash197
719
78ndash1
988
1989
ndash200
019
89ndash2
000
Fu
llco
vs19
89ndash2
000
Mot
her
FE
s
Per
capi
tain
com
e(a
llre
side
nts
19
89)
mdashmdash
mdashmdash
0
0622
0
0116
(10
00)
mdashmdash
mdashmdash
(00
163)
(00
340)
Per
capi
tain
com
e(B
lack
resi
den
ts
1989
)mdash
mdashmdash
mdash
022
94
008
30(
1000
)mdash
mdashmdash
mdash(0
018
7)(0
038
9)M
oth
errsquos
year
sof
edu
cati
onmdash
mdashmdash
mdash
085
00
060
mdashmdash
mdashmdash
(00
30)
(00
73)
Fat
her
rsquosye
ars
ofed
uca
tion
mdashmdash
mdashmdash
0
295
0
029
mdashmdash
mdashmdash
(00
23)
(00
43)
Pri
vate
lyin
sure
dmdash
mdashmdash
mdash
298
0
55mdash
mdashmdash
mdash(0
15)
(02
2)W
hit
em
oth
ermdash
mdashmdash
mdash
122
2mdash
mdashmdash
mdashmdash
(01
3)mdash
Wh
ite
fath
ermdash
mdashmdash
mdash
179
4
628
mdashmdash
mdashmdash
(02
6)(0
81)
Con
stan
t66
61
761
181
61
881
810
461
mdash(0
78)
(05
9)(0
51)
(05
0)(0
62)
mdashR
20
0117
003
540
0464
005
920
0951
077
64B
irth
sam
ple
use
d19
61ndash1
967
1968
ndash197
719
78ndash1
988
1989
ndash200
019
89ndash2
000
1989
ndash200
0In
clu
dem
oth
er-fi
xed
effe
cts
No
No
No
No
No
Yes
Nu
mbe
rof
obse
rvat
ion
s16
4648
2537
0340
2120
4889
5948
8959
4884
85
Th
ede
pen
den
tva
riab
lein
all
colu
mn
sis
the
Bla
ckN
ame
Inde
xof
the
nam
egi
ven
toth
ech
ild
atbi
rth
Th
eB
lack
Nam
eIn
dex
ran
ges
from
0fo
rn
ames
that
are
only
give
nto
Wh
ites
to10
0fo
rn
ames
that
are
only
give
nto
Bla
cks
All
vari
able
sin
clu
ded
onth
eri
ght-
han
dsi
deof
the
regr
essi
onar
ekn
own
atth
eti
me
ofa
baby
rsquosbi
rth
In
clu
ded
inth
ere
gres
sion
bu
tn
otre
port
edin
the
tabl
ear
ein
dica
tor
vari
able
sfo
rm
issi
ng
valu
esS
tan
dard
erro
rsar
ecl
ust
ered
tota
kein
toac
cou
nt
corr
elat
ion
acro
sspe
ople
born
inth
esa
me
hos
pita
lin
the
sam
eye
ar
785DISTINCTIVELY BLACK NAMES
covariates is used Blacker names are associated with lower-income zip codes lower levels of parental education not havingprivate insurance and having a mother who herself has a Blackername
The last column of Table II adds mother-fixed effects to thespecification Thus the identification comes from changes in amotherrsquos situation across different births To the extent thatmothers anticipate the changes that occur in their circumstancesbetween births and factor these expectations into the name givento their first child the fixed-effects coefficients will be biasedtoward zero The estimates in column 6 are substantially smallerin magnitude than in the earlier columns with the exception ofvariables reflecting how Black the neighborhood is and the coef-ficient on female The coefficient on motherrsquos age flips sign im-plying that women who have babies early in life tend to chooseBlack names relative to other women but that a given womanpicks slightly Blacker names for her children as she growsolder16 In addition the inclusion of mother-fixed effects raisesthe R2 from 095 to 776mdashthere is a great degree of continuity inthe names mothers choose for their children implying that per-son-specific tastes are quite important determinants of namechoice The results with mother-fixed effects suggest either thattemporary changes in circumstances have a relatively small im-pact on name choices or that our measures of current circum-stances are noisy
III UNDERSTANDING THE PATTERNS IN THE DATA THROUGH
THE LENS OF ECONOMIC THEORY
A number of stylized facts emerge from the analysis of thepreceding sections Blacks much more than other minoritieschoose distinctive names for their children The distinctiveness ofBlack names has risen greatly over time most notably in the late1960s and early 1970s These shifts in naming patterns have nothowever been uniform In particular among the quarter of theBlack population choosing the names most common amongWhites the opposite pattern is evident Further Blacks living inhighly segregated Black communities today are much more likelyto have distinctively Black names than those in integrated com-munities whereas this was not the case in the early 1960s
16 This result holds up when we include a full set of year dummies implyingthat the increases in BNI are age effects of the mothers and not time effects
786 QUARTERLY JOURNAL OF ECONOMICS
Finally until the late 1970s the choice of Black names was onlyweakly associated with socioeconomic status in the 1980s and1990s distinctively Black names have come to be increasinglyassociated with mothers who are young poor unmarried andhave low education
In this section we consider the extent to which existing the-ories can successfully account for this disparate set of facts
IIIA The Ignorance Model
One explanation for the prevalence of distinctively Blacknames is ignorance on the part of Black parents who fail toappreciate the costs they are imposing on their children throughsuch choices Audit study results for instance suggest that Blacknames may be punished in the labor market
This theory fails to adequately explain the sharp increase indistinctively Black names in the late 1960s and early 1970sThere is little reason to believe that Black parents became sys-tematically less informed about the consequences of distinctivelyBlack names at that time This theory is also at odds with the factthat those adopting Black names in the early 1970s were for themost part representative of the Black community not a smallsubset of parents likely to be particularly misinformed17
IIIB Price Theory Model
Consider the following skeletal outline of a price theorymodel of names which we derive formally in an earlier version ofthis paper [Fryer and Levitt 2002] Parents give names to theirchildren at birth to maximize the childrsquos expected utility Individ-uals are born into neighborhoods that differ in racial compositionPeople live and work in the same neighborhoods Moving betweenneighborhoods is costly The returns to ability are assumed to behigher in predominantly White neighborhoods White names pro-
17 On the other hand one cannot a priori rule out that this explanation haspotential relevance for explaining at least some of the patterns of the last twodecades If it became apparent in the 1980s that there were costs to having a Blackname one might expect that parents who were likely to be best informed aboutthese costs (eg older working parents living in less racially isolated neighbor-hoods) would choose such names less frequently whereas learning on this dimen-sion might be more gradual for teenage mothers in the inner city In absoluteterms this explanation fails because the adoption of Black names rose through-out the 1990s At least in relative terms however there was a shift in the 1980sand 1990s toward an increasing concentration of distinctively Black names amongparents least likely to be well informed about the potential stigma of such namesin broader society In light of results presented later in the paper that call intoquestion the costs of adopting distinctively Black names however we are quiteskeptical of this theory as an explanation for the observed phenomena
787DISTINCTIVELY BLACK NAMES
vide benefits in interactions with Whites Black names are bene-ficial when interacting with Blacks We also assume that thevalue of a White name is increasing in ability motivated by theaudit study literature which suggests that the primary cost of adistinctively Black name is via the labor market A childrsquos abilityis not known with certainty at birth although the distributionfrom which the childrsquos ability will be drawn is known
In this model parents will opt for Whiter names when (i)their children are more likely to be high ability (ii) the cost ofmoving to predominantly White neighborhoods falls (iii) returnsto ability rise in the labor market (iv) the relative cost of havinga White name when interacting with Blacks falls and (v) thebenefit of having a White name when interacting with Whitesrises
The predictions of this model face mixed success in terms ofthe patterns observed in the data Consistent with the theory isthe fact that those in racially isolated communities are especiallylikely to adopt distinctively Black names in recent decades andthat such names are most common among groups likely to facethe greatest barriers to participating in traditional labor mar-kets This theory however does quite poorly in explaining thesharp rise in distinctively Black names in the late 1960s andearly 1970smdasha period immediately following the passage of na-tional Fair Housing laws in 1968 falling social barriers to inte-gration and increased economic opportunity for Blacks Empiri-cally urban racial segregation which had been rising began to fallaround this time and has steadily declined for three decades[Cutler Glaeser and Vigdor 1999]18 In light of these apparentreductions in the costs of switching between neighborhoods onewould have expected a shift away from distinctively Black namesat precisely the point where such names were becoming mostprevalent
Additionally it is not clear that the price theory model pro-vides an adequate explanation as to why Black names are muchmore distinctive than Asian or Hispanic names when presum-ably many of the same trade-offs might also exist among thoseminority groups
18 Although the level of residential racial segregation has declined at arelatively slow rate to the extent that these persistent declines were anticipatedand parents are concerned with the impact a name will have on their children asadults in the labor market one would nonetheless expect to see an immediateabrupt shift in naming patterns
788 QUARTERLY JOURNAL OF ECONOMICS
IIIC A Signaling Model
A third model to consider is a simple signaling model inwhich distinctively Black names serve as a signaling device butare otherwise not productive along the lines of prior research byIannaccone [1992] Berman [2000] and Fryer [2003]19 Imagine apredominantly Black neighborhood populated by Black individu-als of one or two types those who have a strong affinity for theBlack community (the ldquoblackrdquo type) and those who do not (theldquowhiterdquo type) An individualrsquos type is fixed at birth and cannot bechanged Each individual knows her own type but type is notobservable to others An individualrsquos utility is determined by histype and the neighborhoodrsquos perception about his type Regard-less of onersquos actual type social interactions in the Black commu-nity yield higher utility if others believe that one has an affinityfor the Black community20 Thus all else being equal both typesprefer to be perceived as being a ldquoblackrdquo type
One way in which an individual signals his or her type is bythe names that they choose for their children In the model eachparent has one child and bestows a name on that child The(suitably anthropomorphized) community observes the name thateach parent gives his or her child and based on that signal drawsunbiased inferences about the parentrsquos type As in the pricetheory model we assume that White names provide labor marketbenefits The total cost and marginal cost of giving a child aBlacker name is lower for a parent with the ldquoblackrdquo type
Either separating or pooling equilibria may arise in suchmodels In any separating equilibrium parents whose type isldquoblackrdquo are willing to give otherwise costly names to their chil-dren simply because it allows them to distinguish themselvesfrom parents who identify as ldquowhiterdquo and derive more utilityfrom social interactions As a result peers come to regard Blacknames as a signal of community loyalty In any pooling equilib-rium the payoff to social interactions is determined by the un-derlying population distribution of types Pooling is likely tooccur in our model when the marginal rates of substitution forboth types of parents are similar
The predictions of the signaling model fit some of the basic
19 For a formal treatment of this model see the earlier version of this paper[Fryer and Levitt 2002]
20 For example those with an affinity to the Black community may be morelikely to contribute to local public goods than those with ldquowhiterdquo identitiesinducing better treatment from their neighbors For instance Anderson [1999]talks about the importance of having others ldquowatch your backrdquo
789DISTINCTIVELY BLACK NAMES
patterns observed in the data Black name choices in the 1960sfor instance look roughly consistent with a pooling equilibrium inwhich onersquos name is not a strong signal Any mechanism thatamplified the differences in the cost of signaling between the twotypes could cause a bifurcation in the distribution of Black namessuch as occurred in the early 1970s with ldquoblackrdquo types moving todistinctively Black names and ldquowhiterdquo types shifting towardWhiter names (if they previously had been in a pooling equilib-rium) or continuing to choose traditional white names (if theyformerly were in a separating equilibrium) Such a change couldhave come as a result of the increased opportunities for integra-tion due to the civil rights movement [Fryer 2003] Those Blackswith the most to gain from integration would opt for Whiternames Somewhat counterintuitively for those Blacks who con-tinue to signal a ldquoblackrdquo type to sustain the new equilibriumrequires an even costlier (ie Blacker) name choice since theoutside option is now more attractive
The signaling model appears to fall short in explaining fourdimensions of the data First in the 1980s and 1990s individualswho are most likely to adopt distinctively Black names (youngunmarried women in predominantly Black neighborhoods) arethose with the least need to signal affinity with the Black com-munity or their commitment to remaining in the neighborhoodSecond the signaling model has a hard time explaining whyBlack names became more prevalent among many different typesof Blacks including those who live in mostly White communitiesThird in order for the Black names signal to be credible it mustimpose costs on those who carry the names In Section IV of thispaper however we are unable to detect evidence that Blacknames are costly Finally the signaling model provides littlerationale as to why Blacks might engage much more extensivelyin signaling than do either Asians or Hispanics
IIID An Identity Model
The primary shortcoming of the signaling model in explain-ing the data is that for a large segment of the Black communitydistinctively Black names appear to be viewed as a benefit ratherthan a cost In the signaling model an investment must be costlyto provide a credible signal Using a similar framework butallowing Black names to be a benefit for those with the ldquoblackrdquotype and a cost for those with the ldquowhiterdquo type converts thesignaling model into a simple identity model
In particular we have in mind the framework of Akerlof and
790 QUARTERLY JOURNAL OF ECONOMICS
Kranton [2000] In their language identities are accompanied bycertain ldquoprescriptionsrdquo that define appropriate behaviors for aperson of that type When an individual takes actions in line withthese prescriptions (eg a ldquoblackrdquo type choosing a distinctivelyBlack name or a ldquowhiterdquo type choosing a White name) there is autility benefit
To justify the patterns in the time series circa 1970 throughthis model there must be a shock to the identity prescriptions(ie what it means to be Black) around this time period The riseof Black Power appears to be precisely that sort of shock Theunderlying philosophy of the Black Power movement was to en-courage Blacks to accentuate and affirm Black culture and fightthe claims of Black inferiority [Van Deburg 1992] Within theBlack community there were widespread changes in hair stylesand the rising popularity of afro-centric clothing between 1968ndash1975 [Van Deburg 1992 Woodward 1974] The adoption of dis-tinctively Black names would be completely consistent with theseother cultural phenomena The identity model may also help toexplain why naming patterns among Blacks are quite distinctivefrom Whites but Asians name their children in much the samemanner as Whites For instance if Asian ldquoprescriptionsrdquo stressfinancial success and assimilation Asian names would be ex-pected to mirror those of Whites
Another fact consistent with a Black Power explanation isthat the concentration of Blacks by county is a much strongerpredictor of Black names in the 1968ndash1977 period than the rest ofthe sample In column 2 of Table II the coefficient on that vari-able is 142 (standard error of 016) for 1968ndash1977 but neverlarger than 064 in any other period The county-level trends alsoexhibit a basic consistency with a Black Power story Alameda (inwhich Oakland is located) Los Angeles and San Francisco coun-ties were the centers of the Black Power movement Black namesincreased earlier and to a greater extent in these three countiesthan the rest of the state
The identity model may also apply to the increases in BNI inthe 1990s as there is suggestive evidence that there was a sec-ondary Black cultural movement during this time Indeed this isprecisely the period in which Blacks (headed by Jesse Jacksonand Detroit Mayor Coleman Young) demanded to be referred to asAfrican-American This change was meant to tie Blacks moreclosely to their African cultural heritage Enrollment in histori-cally Black colleges and universities which had been declining fora decade rose over 20 percent between 1986 and 1994 [Hoffman
791DISTINCTIVELY BLACK NAMES
1996] There was an emergence in the entertainment industry ofpolitically motivated music (Public Enemy for example) and film(ie Do the Right Thing Spike Lee) which highlighted the ab-horrence in black communities of the status quo Recall a similarspark ignited the Black Power movement as some Blacks werefrustrated with the niceties of the civil rights generation In arelated paper McAdams Fryer and Levitt [2003] provide a morethorough investigation of the black power movement between1968ndash1975 and the Black cultural movement in the 1990s asexplanations of the time-series changes in BNI21
In summary although the evidence in favor of the identitymodel is far from overwhelming it is the only theory examinedwhich does not yield predictions that are directly at odds with theobserved patterns in the data
IV THE RELATIONSHIP BETWEEN NAMES AND ADULT OUTCOMES
In light of audit studies documenting the use of names as ascreening device by employers one might expect that having adistinctively Black name should be associated with worse eco-nomic outcomes holding all else equal In this section we linkinformation from a womanrsquos own birth certificate to her adultcircumstances as reflected in the information on the birth certifi-cates of her children at the time she gives birth
In order to make this linkage a woman must be born inCalifornia and later give birth in California We focus our analy-sis on women born in 1973 and 1974mdashthe earliest years for whichwe have the necessary information to make reliable links Of thewomen still residing in California who have given birth we matchat a high rate (over 90 percent)22 The subset of women that wesuccessfully link is not representative of all women born in 1973ndash1974 In particular women who defer childbearing to their latetwenties are excluded from our sample The women we are able tolink are themselves born to slightly younger unmarried mothers
21 Lieberson and Michelson [1995] make a similar point as they relate therise in the prevalence of unique names to the rise of the Black Panther Party
22 According to the 1990 Census roughly 20 percent of Black women born inCalifornia live outside the state during their childbearing years Also based on1990 Census data 42 percent of Black women born in California have no childrenby age 27 If leaving California is independent of the decision to have a child byage 27 then 464 percent of Black women born in California should give birth inCalifornia in our sample [1ndash2] 58 For details of how this linkage is performedsee the data appendix A smaller subset of White women are successfully linkedbecause more Whites move out of state and more White women defer childbearinguntil later in life
792 QUARTERLY JOURNAL OF ECONOMICS
The differences between the whole sample and the linked subsetare consistent with higher fertility rates and lower rates of cross-state mobility among these groups Importantly however aftercontrolling for socioeconomic characteristics there is no system-atic difference between the first names of the women who are orare not successfully linked If we regress an indicator variable fora successful link (equal to one if a link occurs and zero otherwise)on the womanrsquos BNI and background characteristics at the timeof the womanrsquos birth the coefficient on the womanrsquos BNI is bothsubstantively and statistically insignificant Nonetheless it isimportant to emphasize that our sample for testing the relation-ship between names and life outcomes is limited to females bornin California who later give birth there before the age of 27Further our outcome measures are coarse We do not observeindividual wages or family economic circumstances but ratherthe median income of their zip code years of education etc whichare highly correlated with the relevant outcomes
Our approach to testing for a relationship between namesand life outcomes involves predicting adult life outcomes as afunction of everything known about a woman and her parents atthe time of her own birth including her name
(3) yiadult BNIi Xi
birth hbirth εi
where i indexes women h represents hospitals and the super-scripts adult and birth correspond to the time at which thevariable is measured In some specifications we restrict the sam-ple only to Blacks in other cases we include both Blacks andWhites including an indicator for race and interactions betweenBNI and race We analyze a wide selection of outcomes as depen-dent variables All of the covariates included in the earlier analy-sis of the cohorts born in the 1970s are also in this specificationWe limit the sample to the last birth that we observe for aparticular woman in order to most closely approximate the long-run outcomes of the women although the results are not sensitiveto this restriction
The clear weakness of this empirical approach is that ifunobserved characteristics of the woman are correlated both withlife outcomes and her name our estimates will be biased Giventhat Black names are associated with lower socioeconomic statuson observable measures one would expect that Black names arealso likely to be positively correlated with omitted variables that
793DISTINCTIVELY BLACK NAMES
predict worse life outcomes leading our estimates to exaggeratethe true relationship between a womanrsquos name and her life out-comes although one can also construct scenarios in which theopposite bias could arise23
The results of estimating equation (3) restricting the sampleto Black women are presented for a range of outcome variable inthe top two rows of Table III The top row does not include anycontrols the second row includes the full set of controls In bothcases only the coefficient on the womanrsquos own Black Name Indexis presented in the table In the absence of controls for back-ground characteristics Blacker names are uniformly associatedwith worse adult outcomes Given the correlation between Blacknames growing up in segregated neighborhoods and more diffi-cult home environments this relationship is expected What issurprising especially in light of the biases discussed above ishow limited the impact of a womanrsquos name is on her life outcomesonce we control for other factors that are present at the time ofher birth When we include covariates in the basic specification(row 2) we find statistically significant coefficients for only fouroutcomes percent Black in the hospital the mother gives birthwhether the woman is unmarried at the time of the birth percapita income among Blacks living in her zip code and how Blacka name the woman chooses for her own child Even in these casesof statistical significance the magnitude of the coefficients asso-ciated with the BNI is substantively small Changing the BNIfrom 50 to 100 raises the percent Black in the hospital where themother gives birth by less than one percentage point the proba-bility of an unmarried birth two-tenths of one percentage pointand per capita income for Blacks in the zip code by $100 Thelargest impact that a womanrsquos name appears to have is on howshe names her children An increase of 50 in the BNI raises theBNI of her children by about 3mdasha little more than half the impactthat being a single mother has on naming and the same impactas having the child in a hospital in which an extra 30 percent ofthe births are to Blacks None of the other variables consideredyield statistically significant coefficients years of education of thewoman or the father of her child motherrsquos age at first birth
23 One logical solution to this problem would be to use the name of thewomanrsquos mother as an instrument The motherrsquos name is a strong predictor of herdaughterrsquos name but one might plausibly argue that controlling for a wide rangeof covariates at the time of the daughterrsquos birth the motherrsquos name will have noimpact on her daughterrsquos adult outcomes Unfortunately the motherrsquos first nameis not included in our data set until 1982 so this instrumental variables strategywill not be feasible until more years of time have passed
794 QUARTERLY JOURNAL OF ECONOMICS
private insurance coverage her babyrsquos birth weight and numberof total children born to date24 Particularly in light of the biaseslikely to be pushing the results toward finding a spurious nega-tive relationship between names and outcomes we conclude thatthere is little evidence that how Black onersquos name is negativelyimpacts life outcomes
In the remaining rows of Table III we expand the sample toinclude both Whites and Blacks In addition to the same set ofcontrol variables included in the second row of the table we addan indicator variable for a womanrsquos race as well as interactionsbetween race and BNI The race dummy captures systematicdifferences in outcomes for Blacks and Whites with otherwisesimilar observable characteristics at birth The interactions be-tween BNI and race allow for a differential impact of name choiceby race Empirically we find large coefficients on the race vari-able for most outcomes Controlling for the set of characteristicsobserved at the time of a womanrsquos birth Black women live inneighborhoods with 288 percentage points more Blacks givebirth about one year earlier have babies that weigh almost 200grams less are 26 percentage points more likely to be unmarriedwhen they give birth nine percentage points less likely to haveprivate insurance and live in neighborhoods with per capitaincome over $2000 lower than Whites The only variables forwhich the race dummies are not substantively large is for years ofeducation These systematic racial differences may reflect eitherdiscrimination or unmeasured differences between Blacks andWhites we have no power to distinguish between these compet-ing hypotheses Note however that the weak relationship be-tween names and outcomes persists Interestingly there is gen-erally a stronger relationship between BNI and life outcomes forWhites than Blacks although in both cases the magnitude of theeffects is small25
24 The findings are robust to relaxing the restriction that BNI affect theoutcome measures linearly If we replace our measure of BNI with a set ofmutually exclusive indicator variables corresponding to having a unique name aBNI greater than 80 but not unique a BNI between 50 and 80 and the omittedcategory which is a BNI less than 50 the basic conclusions are unchanged
25 We have also explored whether other aspects of naming have a causalimpact on life outcomes For example one might expect that having the ldquowrongrdquokind of name (ie a White name in a Black neighborhood and vice versa) will atleast in terms of utility adversely affect life outcomes We attempted to identifypeople with the ldquowrongrdquo names in two different ways In the first approach wecalculate the deviation between the BNI that a person actually received and theBNI that we predict they should have received based on their birth circumstancesThe absolute magnitude of the deviation represents how ldquowrongrdquo their name isfrom an ex ante perspective An alternative way of characterizing someone as
795DISTINCTIVELY BLACK NAMES
TA
BL
EII
IT
HE
RE
LA
TIO
NS
HIP
BE
TW
EE
NN
AM
ES
AN
DL
IFE
OU
TC
OM
ES
Per
cen
tB
lack
inre
side
nti
alzi
pco
deas
anad
ult
Per
cen
tB
lack
inh
ospi
tal
wh
ere
mot
her
give
sbi
rth
asan
adu
lt
Per
cen
tm
inor
ity
inh
ospi
tal
wh
ere
mot
her
give
sbi
rth
asan
adu
lt
Yea
rsof
edu
cati
on(t
he
wom
anh
erse
lf)
Yea
rsof
edu
cati
on(f
ath
erof
wom
anrsquos
chil
d)
Wom
anrsquos
age
atfi
rst
birt
h
Mea
n43
347
457
012
412
219
6S
tan
dard
dev
(35
0)(2
72)
(23
3)(1
6)
(22
)(3
0)
Oth
erco
ntr
ols
Sam
ple
rest
rict
edto
Bla
cks
Coe
ffici
ent
onth
eva
riab
le
Bla
ckN
ame
Inde
xN
o0
0602
005
430
0458
0
0006
0
0006
0
0020
(00
099)
(00
080)
(00
101)
(00
005)
(00
007)
(00
008)
Bla
ckN
ame
Inde
xY
es0
0155
001
720
0201
000
080
0000
000
09(0
009
6)(0
007
2)(0
009
2)(0
000
5)(0
000
7)(0
000
7)S
ampl
ein
clu
des
Bla
cks
and
Wh
ites
Coe
ffici
ent
onth
eva
riab
le
Bla
ckN
ame
Inde
x
Bla
ckY
es0
0007
000
760
0073
000
090
0004
000
03(0
009
6)(0
007
3)(0
006
2)(0
000
5)(0
000
7)(0
000
8)B
lack
Nam
eIn
dex
W
hit
eY
es0
0018
001
510
0144
0
0022
0
0013
0
0026
(00
028)
(00
041)
(00
043)
(00
0044
)(0
000
66)
(00
0063
)B
lack
Yes
288
207
190
009
7
007
2
091
1(1
2)
(10
)(0
9)
(00
46)
(00
71)
(00
78)
796 QUARTERLY JOURNAL OF ECONOMICS
TA
BL
EII
I(C
ON
TIN
UE
D)
Bab
yrsquos
birt
hw
eigh
tin
gram
s
Un
mar
ried
wh
enba
bybo
rn
Pri
vate
lyin
sure
dat
tim
eof
birt
hT
otal
chil
dren
born
sofa
r
Per
capi
tazi
pco
dein
com
e(a
llre
side
nts
)
Per
capi
tazi
pco
dein
com
e(B
lack
resi
den
ts)
Bla
ckN
ame
Inde
xof
nam
ech
osen
for
her
chil
d
3219
40
710
372
0112
587
1117
077
8(5
604
)(0
45)
(04
8)(1
16)
(469
7)(3
552)
(29
23)
Sam
ple
rest
rict
edto
Bla
cks
Coe
ffici
ent
onth
eva
riab
le
Bla
ckN
ame
Inde
x
027
000
07
000
040
0009
7
1
50
008
1(0
16)
(00
001)
(00
001)
(00
003)
(14
)(1
1)
(00
09)
Bla
ckN
ame
Inde
x
004
000
04
000
010
0005
2
2
19
006
2(0
17)
(00
001)
(00
001)
(00
003)
(11
)(1
4)
(00
09)
Sam
ple
incl
ud
esB
lack
san
dW
hit
es
Coe
ffici
ent
onth
eva
riab
le
Bla
ckN
ame
Inde
x
Bla
ck0
150
0002
000
000
0005
0
2
11
005
8(0
17)
(00
001)
(00
001)
(00
003)
(14
)(1
1)
(00
09)
Bla
ckN
ame
Inde
x
Wh
ite
015
000
02
000
040
0008
5
0
18
003
4(0
15)
(00
001)
(00
001)
(00
002)
(14
)(1
8)
(00
07)
Bla
ck
194
50
26
009
021
23
643
68
79
413
7(1
51)
(00
1)(0
02)
(00
3)(1
507
)(1
326
)(0
82)
The
depe
nden
tva
riab
leis
liste
dat
the
top
ofea
chco
lum
nT
heva
lues
repo
rted
inth
eta
ble
are
the
coef
ficie
nton
the
mea
sure
ofho
wB
lack
anin
divi
dual
rsquosna
me
isI
nth
eto
ptw
oro
ws
the
key
regr
esso
ris
the
Bla
ckN
ame
Inde
xIn
the
bott
omsi
xro
ws
thre
ein
dica
tor
vari
able
sar
ein
clud
edde
noti
ngw
heth
era
nam
eis
uniq
ueg
reat
erth
an80
onth
eB
lack
Nam
eIn
dex
orbe
twee
n50
and
80T
heom
itte
dca
tego
ryis
less
than
50in
thos
esp
ecifi
cati
ons
Res
ults
are
pres
ente
dw
ith
noco
ntro
lsan
din
clud
ing
perc
ent
ofB
lack
babi
esin
birt
hho
spit
alp
erce
ntof
Bla
ckba
bies
inbi
rth
coun
tyw
heth
erm
othe
rw
asbo
rnin
Cal
ifor
nia
mot
herrsquo
sag
eat
tim
eof
birt
hfa
ther
rsquosag
eat
tim
eof
birt
hm
onth
sof
pren
atal
care
whe
ther
born
ina
coun
tyho
spit
al
birt
hw
eigh
tto
taln
umbe
rof
child
ren
and
dum
my
for
sing
lem
othe
rT
hesa
mpl
ein
the
top
pane
lof
the
pape
ris
the
set
ofB
lack
wom
enfo
rw
hom
we
succ
essf
ully
mat
chth
eir
own
birt
hce
rtifi
cate
info
rmat
ion
toth
atof
thei
rch
ildre
nw
hen
the
wom
enth
emse
lves
give
birt
hT
hesa
mpl
ein
the
bott
ompa
neli
nclu
des
both
Bla
cks
and
Whi
tes
who
mw
esu
cces
sful
lym
atch
from
own
birt
hce
rtifi
cate
toth
ech
ildrsquos
Sta
ndar
der
rors
are
inpa
rent
hese
sA
llof
the
cova
riat
esin
the
regr
essi
ons
(per
cent
Bla
ckba
bies
inw
oman
rsquosbi
rth
hosp
ital
per
cent
ofB
lack
babi
esin
coun
tyof
wom
anrsquos
birt
hw
heth
erw
oman
rsquosm
othe
ris
born
inC
alif
orni
am
othe
rrsquos
and
fath
errsquos
age
atti
me
ofw
oman
rsquosbi
rth
mot
herrsquo
sm
onth
sof
pren
atal
care
whe
ther
wom
anrsquos
mot
her
was
mar
ried
atth
eti
me
ofw
oman
rsquosbi
rth
whe
ther
wom
anw
asbo
rnin
aco
unty
hosp
ital
w
oman
rsquosbi
rth
wei
ght
and
tota
lnu
mbe
rof
prio
rbi
rths
toth
ew
oman
rsquosm
othe
r)ar
ekn
own
asof
1973
ndash197
4w
hen
the
wom
enar
ebo
rnA
llof
the
outc
ome
vari
able
sco
rres
pond
toth
eci
rcum
stan
ces
whe
nth
eygi
vebi
rth
asad
ults
inth
epe
riod
1989
ndash200
0
797DISTINCTIVELY BLACK NAMES
There are three possible interpretations of the data thatreconcile our findings with that of the audit study literature Onepossibility is that the only function names serve is as a noisyinitial indicator of race In this view of the world those with Blacknames may receive fewer job interviews but no fewer job offersDiscriminatory employers will use distinctively Black names asnoisy signals of race but names become irrelevant once the can-didate shows up for an interview and the employer directly ob-serves race26 Indeed in such a world there is a benefit to Blacksof signaling their race through name choice in order to avoidundertaking costly interviews unlikely to yield jobs and to signalrace to employers giving preferential treatment to Blacks Asecond interpretation of the data that is consistent with ourfindings and those of the audit studies is that Black namesbecause of self-selection among Black parents provide usefulsignals of human capital to employers even controlling for raceitself and other information available on resumes27 A final pos-sibility is that names themselves have a modest causal impact onjob callbacks and unemployment duration that we are unable todetect using the relatively coarse outcome measures available tous Note that only in the third of these three interpretations doesa personrsquos name have any causal impact on life outcomes
We cannot directly test between these competing hypothesesfor two reasons First our data set lacks clean measures ofproductivity We do however observe worker characteristics that
having the ldquowrongrdquo name is to look at cases in which a womanrsquos name is mis-matched ex post with the actual neighborhood in which she lives as an adult Inneither case do we find a systematic link between having the ldquowrongrdquo name andthe types of outcomes we are measuring
26 Even if names have an impact that extends beyond the resume stage inan efficient market with sufficiently many nondiscriminatory employers thepresence of discrimination need not result in worse outcomes for Blacks [Becker1957] Note also that at least in the past a relatively small fraction of the jobswere actually obtained through a formal resume-based process Granovetter[1974] reports that approximately 10 percent of respondents in a survey reportobtaining their job through job advertisements
27 From a legal perspective the use of names as a basis for hiring decisionsis likely to be a violation of current law regardless of whether there are under-lying productivity differences In the 1971 decision Griggs v Duke Power theSupreme Court ruled unanimously that policies that are neutral on their face buthave a disparate impact on Blacks are not allowed This doctrine was codified inthe Civil Rights Act of 1991 after the 1989 case Antonio v Wards Cove Packingmodified the Griggs ruling by stating that policies with disparate impacts wereallowable as long as they served a legitimate business interest Indeed even theuse of names to choose a subset of Blacks from an entirely Black hiring pool wouldprobably be viewed as illegal under Connecticut v Teal in which it was found thateven policies that have no disparate impact on a protected group but harm someindividuals within that group violate the law
798 QUARTERLY JOURNAL OF ECONOMICS
might be correlated with labor productivity (see eg Heckmanand Carneiro [2003]) but are typically not included on a resume(and are for the most part illegal for employers to inquire about)whether a woman is a single mother was born to a teenagemother was raised in a single-parent household or the degree ofracial segregation into which she was born The second difficultyin testing this hypothesis is that we do not have in our data all ofthe information on a resume (eg particular schools attendedcomplete work history misspellings)
Our empirical strategy in light of these shortcomings is toestimate a number of specifications in the general spirit of equa-tion (2) varying the set of covariates included in the regression Acritical difference between the earlier estimates and those pre-sented below are that we now include information about the adultcircumstances of a woman as covariates since such information ison the resume The results are presented in Table IV Rows of thetable correspond to different factors that might be correlated withlabor productivity due to their influence on human capital seg-regation in onersquos birth hospital motherrsquos marital status whetheronersquos mother was a teenager the womanrsquos own birth weight thewomanrsquos own marital status the education level of the man whois father to her children and the total number of children born tothe woman The first two columns of the table include both Blacksand Whites in the regressions We do not however include racedummies in the specification because race is not directly observedby the prospective employer from the resume The third andfourth columns of the table limit the sample only to Blacks Theentries in the table are the coefficient on the womanrsquos BNI Eachtable entry is from a different regression The first and thirdcolumns do not include any covariates the second and fourthcolumn includes the womanrsquos age years of education whether ornot she has private health insurance (the best measure we havewith respect to the quality of her current employment) zip code ofresidence fixed effects and year dummies These variables cap-ture some of the information on a resume Our sample is the setof women whom we observe both at their birth in 1973ndash1974 andas adults in 1989ndash2000
The results in Table IV suggest that a womanrsquos first name isindeed a useful predictor of the circumstances in which she grewup and her current situation both of which may in turn becorrelated with labor productivity This is true even after includ-ing our crude set of controls that proxy for information availableon the resume A womanrsquos name is a particularly important
799DISTINCTIVELY BLACK NAMES
predictor when we pool Blacks and Whites in the same regression(columns 1 and 2) In column 2 a woman with a BNI equal to 100(implying a name that no Whites have) is 209 percentage pointsmore likely to have been born to a teenage mother and 313percentage points more likely to have been born out-of-wedlockthan a Black woman living in the same zip code with the same ageand education but carrying a name that is equally commonamong Whites and Blacks The woman with a Black name is alsomuch more likely to have been born in a Black neighborhood toherself be unmarried to have had lower birth weight and to havegiven birth to more children The same pattern of results al-though generally somewhat smaller in magnitude is apparenteven when we restrict the sample to Blacks In other words evenif the employer knows that a candidate is Black the Blackness of
TABLE IVTHE SIGNALING VALUE OF NAMES TO EMPLOYERS
Dependent variable
Sample includes Blacksand Whites
Sample includes onlyBlacks
Nocontrolsincluded
Controlsproxying for
some informationon a resume
Nocontrolsincluded
Controlsproxying for
some informationon a resume
Percent of Black babies inwomanrsquos birth hospital
03015 01417 00690 00526(00026) (00045) (00064) (00085)
Woman born to a teenagemother
000260 000209 000238 000232(000005) (000009) (000011) (000016)
Woman born to an unmarriedmother
000508 000313 000193 000176(000005) (000009) (000011) (000017)
Womanrsquos birth weight(in grams)
216 103 016 011(007) (009) (013) (016)
Woman herself unmarried attime she gives birth
000338 000111 000038 000023(000006) (000006) (000010) (000009)
Years of education for theman who fathers thewomanrsquos child
00050 00002 00010 00006(00003) (00004) (00006) (00006)
Total number of childrenborn to the woman
000283 000238 000079 000090(000011) (000016) (000025) (000029)
The relevant dependent variable is listed on the left-hand side of the table The values reported in thetable are the coefficients on the Black Name Index of the woman Each table entry is from a separateregression In columns 1 and 3 no controls are included In columns 2 and 4 controls for a womanrsquos age yearsof education zip code of residence whether the woman is privately insured and year dummies are includedThese variables proxy for some of the types of information available to employers on resumes The sampleused in all regressions is the set of black women for whom we successfully link information from their ownbirth certificate to their childrsquos birth certificate Unlike earlier regressions these specifications control forchoices that a woman makes over the course of her life such as years of education The number ofobservations is 62309 for the sample that includes Blacks and Whites and 18427 for the sample that onlyincludes Blacks
800 QUARTERLY JOURNAL OF ECONOMICS
the name continues to serve as an important signal of socioeco-nomic status Thus while we cannot rule out animus on the partof employers we find evidence supporting a potential productiv-ity-related statistical discrimination motive for employers to baseinterview decisions on first names
V CONCLUSION
We document stark differences in naming patterns betweenBlacks and Whites and demonstrate that these patterns changesharply over time While most Blacks have shifted toward moredistinctively Black names (particularly in the late 1960s andearly 1970s) the fraction of Blacks choosing starkly White nameshas also increased How distinctively Black onersquos name was ap-pears to have signaled little in the early 1960s Naming conven-tions differed modestly across parental characteristics or neigh-borhood types The last two decades however have led to aldquoghettoizationrdquo of distinctively Black names namely a distinc-tively Black name is now a much stronger predictor of socioeco-nomic status Among the theories we consider models in whichthe rise of the Black Power movement triggers important changesin Black identity appear to be most consistent with our data Wefind no relationship between how Black onersquos name is and lifeoutcomes after controlling for other factors If that conclusion iscorrect then the proper interpretation of earlier audit studiesusing Black names on resumes is either that the impact of namesdoes not extend beyond the callback decision (because race isdirectly observed at the interview stage) or that names are cor-related with determinants of productivity not captured by a re-sume In our data it is difficult to distinguish between thesecompeting hypotheses
More generally this paper takes first steps toward an at-tempt to understand what role Black culture might play in ex-plaining continued poverty and racial isolation With respect tothis particular aspect of distinctive Black culture we concludethat carrying a black name is primarily a consequence rather thana cause of poverty and segregation
APPENDIX DATA DESCRIPTION
In this data appendix we describe the data sources that wedraw upon in our analysis give a description of some data limi-
801DISTINCTIVELY BLACK NAMES
tations and other data issues with which we are confrontedprovide definitions and describe the process used to link mothers
1 Data SourcesBirth Data Our empirical analyses are mainly based on data
drawn from the Birth Statistical Master File maintained by theOffice of Vital Records in the California Department of HealthServices These files provide information drawn from birth cer-tificates for virtually all children born in California over theperiod 1961ndash2000 With the approval of the California Committeefor the Protection of Human Subjects we have been able tosupplement the information contained on the public use versionsof these data sets with personal identifiers including motherrsquosfirst name motherrsquos maiden name and childrsquos full name
Zip Code Statistics U S Bureau of the Census AmericanFact Finder 1990 Census
Demographic and Socioeconomic Data For an accuracycheck on mother-children links data were obtained from theAmerican Community Survey 5 Percent Public Use of MicrodataSamples (PUMS) for California and United States (All States)U S Bureau of the Census Arabic First Names To identify anddiscard Arabic names from our data we used Bruce Lansky[1999] Baby Names Around the World
2 Data Limitations and Other Data IssuesRaceEthnicity From 1998 to 2000 information of a childrsquos
race is missing For these three years a child is considered Blackif either parent is Black In other years over 98 percent ofchildren with at least one Black parent are coded as Black Priorto 1982 most Hispanics are included with whites and it is notpossible to directly calculate statistics for Non-Hispanics Begin-ning in 1982 an identifier for Hispanic ethnicity was added to thebirth certificate in California Using information from this latterperiod we drop anyone in the earlier time period with a surnameor motherrsquos maiden name that is more than 10 percent Hispanic
Link of Birth Certificate Data for Women Born in 1973ndash1974to When They Give Birth Themselves in the Period 1989ndash2000 Inorder to uniquely link information from a womanrsquos own birthcertificate to those of her children when she gives birth a womanmust both be born in California and later give birth there Onlyafter 1989 do we have the motherrsquos date of birth and full firstname two critical pieces of information for making the linkageWe thus limit the sample to babies born 1989ndash2000 to Blackwomen themselves born in California In order to identify women
802 QUARTERLY JOURNAL OF ECONOMICS
whose birth histories are likely to be most fully captured by theperiod 1989ndash2000 we restrict the matching to women who werethemselves born in 1973ndash1974 We restrict the sample to Blackwomen born in California We then carry out five different match-ing procedures in which we use a motherrsquos exact date of birth andpermutations of her first name and maiden name (match only onmaiden name only on first name on first name and maidenname on first initial and maiden name and on first name andmaiden name initial) We keep only cases where the match be-tween mother and child is unique ie there is no other womanborn in California in 1973ndash1974 who has information that couldpossibly match the characteristics of the mother on the birthcertificate Because of typographical errors using only a subset ofthe information in a womanrsquos name somewhat increases thenumber of successful matches
HARVARD UNIVERSITY SOCIETY OF FELLOWS AND NBERDEPARTMENT OF ECONOMICS UNIVERSITY OF CHICAGO
REFERENCES
Akerlof George and Rachel Kranton ldquoEconomics and Identityrdquo Quarterly Jour-nal of Economics CXV (2000) 715ndash753
Anderson Elijah Streetwise Race Class and Change in an Urban Community(Chicago IL University of Chicago Press 1990)
mdashmdash Code of the Street Decency Violence and the Moral Life of the Inner City(New York NY W W Norton and Company Inc 1999)
Austen-Smith David and Roland Fryer ldquoThe Economics of lsquoActing WhitersquordquoNBER Working Paper No 9904 2003
Bart Barbara Marsha Hass Jane Philbrick Martha Sparks and Craig WilliamsldquoWhatrsquos in a Namerdquo Women in Management Review XII (1997) 209ndash308
Becker Gary The Economics of Discrimination (Chicago IL University of Chi-cago Press 1957)
Berman Eli ldquoSect Subsidy and Sacrifice An Economistrsquos View of Ultra-Ortho-dox Jewsrdquo Quarterly Journal of Economics CXV (2000) 905ndash953
Bertrand Marianne and Sendhil Mullainathan ldquoAre Emily and Greg MoreEmployable Than Lakisha and Jamal A Field Experiment Evidence onLabor Market Discriminationrdquo NBER Working Paper No 9873 2003
Bound John and Richard Freeman ldquoWhat Went Wrong The Erosion of RelativeEarnings and Employment among Black Men in the 1980srdquo Quarterly Jour-nal of Economics CVII (1992) 201ndash232
Brown C and P Gay Racial Discrimination 17 Years After the Act (London UKPolicy Studies Institute 1985)
Busse Thomas V and Louisa Seraydarian ldquoDesirability of First Names Ethnic-ity and Parental Educationrdquo Psychological Reports XL (1977) 739ndash742
Chandra Amitabh ldquoIs the Convergence of the Racial Wage Gap Illusoryrdquo NBERWorking Paper No 9476 2003
Counihan Carol and Penny Van Esterik Food and Culture A Reader (New YorkNY Routledge 1997)
Cutler David Edward Glaeser and Jake Vigdor ldquoThe Rise and Decline of theAmerican Ghettordquo Journal of Political Economy CVII (1999) 455ndash506
Fordham Signithia and John Ogbu ldquoBlack Studentsrsquo School Successes Copingwith the Burden of lsquoActing Whitersquordquo The Urban Review XVIII (1986)176ndash206
803DISTINCTIVELY BLACK NAMES
Fryer Roland G ldquoAn Economic Approach to Cultural Capitalrdquo unpublishedmanuscript University of Chicago 2003
Fryer Roland and Steven Levitt ldquoThe Causes and Consequences of DistinctivelyBlack Namesrdquo unpublished manuscript University of Chicago 2002
Glaeser Edward David Laibson and Bruce Sacerdote ldquoAn Economic Approach toSocial Capitalrdquo Economic Journal CXII (2002) 437ndash458
Goldin Claudia and Maria Shim ldquoMaking a Name Womenrsquos Surnames atMarriage and Beyondrdquo mimeo Harvard University 2003
Granovetter Mark Getting a Job A Study of Contacts and Careers (Chicago ILUniversity of Chicago Press 1974)
Hannerz Ulf Soulside Inquiries into Ghetto Culture and Community (New YorkNY Columbia University Press 1969)
Heckman James Tom Lyons and Petra Todd ldquoUnderstanding Black-WhiteWage Differentials 1960ndash1990rdquo American Economic Review XC (2000)344ndash349
Heckman James and Pedro Carneiro ldquoHuman Capital Policyrdquo NBER WorkingPaper No 9495 2003
Hoffman Charles ldquoHistorically Black Colleges and Universities 1976ndash1994rdquoNCES Technical Paper No 96902 1996
Hubbick J and S Carter Half a Chance A Report on Job Discriminationagainst Young Black Males in Nottingham (London UK Commission forRacial Equality 1980)
Iannaccone Laurence ldquoSacrifice and Stigma Reducing Free-Riding in CultsCommunes and Other Collectivesrdquo Journal of Political Economy C (1992)271ndash291
Jackson George White and Negro Spirituals their Life Span and Kinship Trac-ing 200 Years of Untrammeled Song Making and Singing among our CountryFolk with 116 Songs as Sung by Both Races (New York NY J J Augustin1944)
Jencks Christopher and Meredith Phillips The Black-White Test Score Gap(Washington DC Brookings Institution 1998)
Johnston Lloyd Patrick OrsquoMalley Jerald Bachman and John Schulenberg ldquoCig-arette Brand Preferences among Adolescentsrdquo Monitoring the Future Occa-sional Paper 45 Institute for Social Research University of Michigan 1999
Jowell R and P Prescott-Clarke ldquoRacial Discrimination and White-CollarWorkers in Britainrdquo Race XI (1970) 397ndash417
Kington Raynard and Herbert Nickens ldquoRacial and Ethnic Differences inHealth Recent Trends Current Patterns and Future Directionsrdquo in AmericaBecoming Racial Trends and Their Consequences Neil J Smelser William JWilson and Faith Mitchell editors Commission on Behavioral and SocialSciences and Education (Washington DC National Academy Press 2001)pp 253ndash310
Lazear Edward ldquoCulture and Languagerdquo Journal of Political Economy CVII(1999) S95ndashS126
Lewis Oscar La Vida A Puerto Rican Family in the Culture of PovertymdashSanJuan and New York (New York NY Random House 1966)
Lieberson Stanley A Matter of Taste How Names Fashions and Culture Change(New Haven CT Yale University Press 2000)
Lieberson Stanley and Kelly Mikelson ldquoDistinctive African-American NamesAn Experimental Historical and Linguistic Analysis of Innovationrdquo Ameri-can Sociological Review LX (1995) 928ndash946
Massey Douglas ldquoResidential Segregation and Neighborhood Conditions in U SMetropolitan Areasrdquo in America Becoming Racial Trends and Their Conse-quences I (Washington DC The National Academies Press 2001) pp391ndash434
McAdams Doug Roland Fryer and Steven Levitt ldquoWhatrsquos in a Name BlackPower and the Change in African-American Names 1961ndash2000rdquo workingpaper Stanford University 2003
Orr Eleanor Twice as Less Black English and the Performance of Black Studentsin Mathematics and Science (New York NY W W Norton 1989)
Reno Janet et al Correctional Populations of the United States (WashingtonDC Bureau of Justice Statistics 1997)
Riessman Frank The Culturally Deprived Child (New York NY Harper amp Bros1962)
804 QUARTERLY JOURNAL OF ECONOMICS
Smith James and Finis Welch ldquoBlack Economic Progress After Myrdalrdquo Journalof Economic Literature XXVII (1989) 519ndash564
Van Deburg W L New Day in Babylon The Black Power Movement and Ameri-can Culture 1965ndash1975 (Chicago IL University of Chicago Press 1992)
Ventura Stephanie and Christine Bachrach ldquoNonmarital Childbearing in theUnited States 1940ndash1999rdquo in National Vital Statistics Reports XLVIII(Hyattsville MD National Center for Health Statistics 2000)
Waldfogel Joel ldquoPreference Externalities An Empirical Study of Who BenefitsWhom in Differentiated Product Marketsrdquo Rand Journal of EconomicsXXXIV (2003) 557ndash568
Wilson William The Truly Disadvantaged The Inner City the Underclass andPublic Policy (Chicago IL University of Chicago Press 1987)
Wolfram Walt and Erik Thomas Development of African-American English(Oxford UK Blackwell Publishers 2002)
Woodward Vann C The Strange Career of Jim Crow (New York NY OxfordUniversity Press 1974)
Young Andrew An Easy Burden The Civil Rights Movement and the Transfor-mation of America (New York NY HarperCollins Publishers 1996)
805DISTINCTIVELY BLACK NAMES

TA
BL
EII
IT
HE
RE
LA
TIO
NS
HIP
BE
TW
EE
NN
AM
ES
AN
DL
IFE
OU
TC
OM
ES
Per
cen
tB
lack
inre
side
nti
alzi
pco
deas
anad
ult
Per
cen
tB
lack
inh
ospi
tal
wh
ere
mot
her
give
sbi
rth
asan
adu
lt
Per
cen
tm
inor
ity
inh
ospi
tal
wh
ere
mot
her
give
sbi
rth
asan
adu
lt
Yea
rsof
edu
cati
on(t
he
wom
anh
erse
lf)
Yea
rsof
edu
cati
on(f
ath
erof
wom
anrsquos
chil
d)
Wom
anrsquos
age
atfi
rst
birt
h
Mea
n43
347
457
012
412
219
6S
tan
dard
dev
(35
0)(2
72)
(23
3)(1
6)
(22
)(3
0)
Oth
erco
ntr
ols
Sam
ple
rest
rict
edto
Bla
cks
Coe
ffici
ent
onth
eva
riab
le
Bla
ckN
ame
Inde
xN
o0
0602
005
430
0458
0
0006
0
0006
0
0020
(00
099)
(00
080)
(00
101)
(00
005)
(00
007)
(00
008)
Bla
ckN
ame
Inde
xY
es0
0155
001
720
0201
000
080
0000
000
09(0
009
6)(0
007
2)(0
009
2)(0
000
5)(0
000
7)(0
000
7)S
ampl
ein
clu
des
Bla
cks
and
Wh
ites
Coe
ffici
ent
onth
eva
riab
le
Bla
ckN
ame
Inde
x
Bla
ckY
es0
0007
000
760
0073
000
090
0004
000
03(0
009
6)(0
007
3)(0
006
2)(0
000
5)(0
000
7)(0
000
8)B
lack
Nam
eIn
dex
W
hit
eY
es0
0018
001
510
0144
0
0022
0
0013
0
0026
(00
028)
(00
041)
(00
043)
(00
0044
)(0
000
66)
(00
0063
)B
lack
Yes
288
207
190
009
7
007
2
091
1(1
2)
(10
)(0
9)
(00
46)
(00
71)
(00
78)
796 QUARTERLY JOURNAL OF ECONOMICS
TA
BL
EII
I(C
ON
TIN
UE
D)
Bab
yrsquos
birt
hw
eigh
tin
gram
s
Un
mar
ried
wh
enba
bybo
rn
Pri
vate
lyin
sure
dat
tim
eof
birt
hT
otal
chil
dren
born
sofa
r
Per
capi
tazi
pco
dein
com
e(a
llre
side
nts
)
Per
capi
tazi
pco
dein
com
e(B
lack
resi
den
ts)
Bla
ckN
ame
Inde
xof
nam
ech
osen
for
her
chil
d
3219
40
710
372
0112
587
1117
077
8(5
604
)(0
45)
(04
8)(1
16)
(469
7)(3
552)
(29
23)
Sam
ple
rest
rict
edto
Bla
cks
Coe
ffici
ent
onth
eva
riab
le
Bla
ckN
ame
Inde
x
027
000
07
000
040
0009
7
1
50
008
1(0
16)
(00
001)
(00
001)
(00
003)
(14
)(1
1)
(00
09)
Bla
ckN
ame
Inde
x
004
000
04
000
010
0005
2
2
19
006
2(0
17)
(00
001)
(00
001)
(00
003)
(11
)(1
4)
(00
09)
Sam
ple
incl
ud
esB
lack
san
dW
hit
es
Coe
ffici
ent
onth
eva
riab
le
Bla
ckN
ame
Inde
x
Bla
ck0
150
0002
000
000
0005
0
2
11
005
8(0
17)
(00
001)
(00
001)
(00
003)
(14
)(1
1)
(00
09)
Bla
ckN
ame
Inde
x
Wh
ite
015
000
02
000
040
0008
5
0
18
003
4(0
15)
(00
001)
(00
001)
(00
002)
(14
)(1
8)
(00
07)
Bla
ck
194
50
26
009
021
23
643
68
79
413
7(1
51)
(00
1)(0
02)
(00
3)(1
507
)(1
326
)(0
82)
The
depe
nden
tva
riab
leis
liste
dat
the
top
ofea
chco
lum
nT
heva
lues
repo
rted
inth
eta
ble
are
the
coef
ficie
nton
the
mea
sure
ofho
wB
lack
anin
divi
dual
rsquosna
me
isI
nth
eto
ptw
oro
ws
the
key
regr
esso
ris
the
Bla
ckN
ame
Inde
xIn
the
bott
omsi
xro
ws
thre
ein
dica
tor
vari
able
sar
ein
clud
edde
noti
ngw
heth
era
nam
eis
uniq
ueg
reat
erth
an80
onth
eB
lack
Nam
eIn
dex
orbe
twee
n50
and
80T
heom
itte
dca
tego
ryis
less
than
50in
thos
esp
ecifi
cati
ons
Res
ults
are
pres
ente
dw
ith
noco
ntro
lsan
din
clud
ing
perc
ent
ofB
lack
babi
esin
birt
hho
spit
alp
erce
ntof
Bla
ckba
bies
inbi
rth
coun
tyw
heth
erm
othe
rw
asbo
rnin
Cal
ifor
nia
mot
herrsquo
sag
eat
tim
eof
birt
hfa
ther
rsquosag
eat
tim
eof
birt
hm
onth
sof
pren
atal
care
whe
ther
born
ina
coun
tyho
spit
al
birt
hw
eigh
tto
taln
umbe
rof
child
ren
and
dum
my
for
sing
lem
othe
rT
hesa
mpl
ein
the
top
pane
lof
the
pape
ris
the
set
ofB
lack
wom
enfo
rw
hom
we
succ
essf
ully
mat
chth
eir
own
birt
hce
rtifi
cate
info
rmat
ion
toth
atof
thei
rch
ildre
nw
hen
the
wom
enth
emse
lves
give
birt
hT
hesa
mpl
ein
the
bott
ompa
neli
nclu
des
both
Bla
cks
and
Whi
tes
who
mw
esu
cces
sful
lym
atch
from
own
birt
hce
rtifi
cate
toth
ech
ildrsquos
Sta
ndar
der
rors
are
inpa
rent
hese
sA
llof
the
cova
riat
esin
the
regr
essi
ons
(per
cent
Bla
ckba
bies
inw
oman
rsquosbi
rth
hosp
ital
per
cent
ofB
lack
babi
esin
coun
tyof
wom
anrsquos
birt
hw
heth
erw
oman
rsquosm
othe
ris
born
inC
alif
orni
am
othe
rrsquos
and
fath
errsquos
age
atti
me
ofw
oman
rsquosbi
rth
mot
herrsquo
sm
onth
sof
pren
atal
care
whe
ther
wom
anrsquos
mot
her
was
mar
ried
atth
eti
me
ofw
oman
rsquosbi
rth
whe
ther
wom
anw
asbo
rnin
aco
unty
hosp
ital
w
oman
rsquosbi
rth
wei
ght
and
tota
lnu
mbe
rof
prio
rbi
rths
toth
ew
oman
rsquosm
othe
r)ar
ekn
own
asof
1973
ndash197
4w
hen
the
wom
enar
ebo
rnA
llof
the
outc
ome
vari
able
sco
rres
pond
toth
eci
rcum
stan
ces
whe
nth
eygi
vebi
rth
asad
ults
inth
epe
riod
1989
ndash200
0
797DISTINCTIVELY BLACK NAMES
There are three possible interpretations of the data thatreconcile our findings with that of the audit study literature Onepossibility is that the only function names serve is as a noisyinitial indicator of race In this view of the world those with Blacknames may receive fewer job interviews but no fewer job offersDiscriminatory employers will use distinctively Black names asnoisy signals of race but names become irrelevant once the can-didate shows up for an interview and the employer directly ob-serves race26 Indeed in such a world there is a benefit to Blacksof signaling their race through name choice in order to avoidundertaking costly interviews unlikely to yield jobs and to signalrace to employers giving preferential treatment to Blacks Asecond interpretation of the data that is consistent with ourfindings and those of the audit studies is that Black namesbecause of self-selection among Black parents provide usefulsignals of human capital to employers even controlling for raceitself and other information available on resumes27 A final pos-sibility is that names themselves have a modest causal impact onjob callbacks and unemployment duration that we are unable todetect using the relatively coarse outcome measures available tous Note that only in the third of these three interpretations doesa personrsquos name have any causal impact on life outcomes
We cannot directly test between these competing hypothesesfor two reasons First our data set lacks clean measures ofproductivity We do however observe worker characteristics that
having the ldquowrongrdquo name is to look at cases in which a womanrsquos name is mis-matched ex post with the actual neighborhood in which she lives as an adult Inneither case do we find a systematic link between having the ldquowrongrdquo name andthe types of outcomes we are measuring
26 Even if names have an impact that extends beyond the resume stage inan efficient market with sufficiently many nondiscriminatory employers thepresence of discrimination need not result in worse outcomes for Blacks [Becker1957] Note also that at least in the past a relatively small fraction of the jobswere actually obtained through a formal resume-based process Granovetter[1974] reports that approximately 10 percent of respondents in a survey reportobtaining their job through job advertisements
27 From a legal perspective the use of names as a basis for hiring decisionsis likely to be a violation of current law regardless of whether there are under-lying productivity differences In the 1971 decision Griggs v Duke Power theSupreme Court ruled unanimously that policies that are neutral on their face buthave a disparate impact on Blacks are not allowed This doctrine was codified inthe Civil Rights Act of 1991 after the 1989 case Antonio v Wards Cove Packingmodified the Griggs ruling by stating that policies with disparate impacts wereallowable as long as they served a legitimate business interest Indeed even theuse of names to choose a subset of Blacks from an entirely Black hiring pool wouldprobably be viewed as illegal under Connecticut v Teal in which it was found thateven policies that have no disparate impact on a protected group but harm someindividuals within that group violate the law
798 QUARTERLY JOURNAL OF ECONOMICS
might be correlated with labor productivity (see eg Heckmanand Carneiro [2003]) but are typically not included on a resume(and are for the most part illegal for employers to inquire about)whether a woman is a single mother was born to a teenagemother was raised in a single-parent household or the degree ofracial segregation into which she was born The second difficultyin testing this hypothesis is that we do not have in our data all ofthe information on a resume (eg particular schools attendedcomplete work history misspellings)
Our empirical strategy in light of these shortcomings is toestimate a number of specifications in the general spirit of equa-tion (2) varying the set of covariates included in the regression Acritical difference between the earlier estimates and those pre-sented below are that we now include information about the adultcircumstances of a woman as covariates since such information ison the resume The results are presented in Table IV Rows of thetable correspond to different factors that might be correlated withlabor productivity due to their influence on human capital seg-regation in onersquos birth hospital motherrsquos marital status whetheronersquos mother was a teenager the womanrsquos own birth weight thewomanrsquos own marital status the education level of the man whois father to her children and the total number of children born tothe woman The first two columns of the table include both Blacksand Whites in the regressions We do not however include racedummies in the specification because race is not directly observedby the prospective employer from the resume The third andfourth columns of the table limit the sample only to Blacks Theentries in the table are the coefficient on the womanrsquos BNI Eachtable entry is from a different regression The first and thirdcolumns do not include any covariates the second and fourthcolumn includes the womanrsquos age years of education whether ornot she has private health insurance (the best measure we havewith respect to the quality of her current employment) zip code ofresidence fixed effects and year dummies These variables cap-ture some of the information on a resume Our sample is the setof women whom we observe both at their birth in 1973ndash1974 andas adults in 1989ndash2000
The results in Table IV suggest that a womanrsquos first name isindeed a useful predictor of the circumstances in which she grewup and her current situation both of which may in turn becorrelated with labor productivity This is true even after includ-ing our crude set of controls that proxy for information availableon the resume A womanrsquos name is a particularly important
799DISTINCTIVELY BLACK NAMES
predictor when we pool Blacks and Whites in the same regression(columns 1 and 2) In column 2 a woman with a BNI equal to 100(implying a name that no Whites have) is 209 percentage pointsmore likely to have been born to a teenage mother and 313percentage points more likely to have been born out-of-wedlockthan a Black woman living in the same zip code with the same ageand education but carrying a name that is equally commonamong Whites and Blacks The woman with a Black name is alsomuch more likely to have been born in a Black neighborhood toherself be unmarried to have had lower birth weight and to havegiven birth to more children The same pattern of results al-though generally somewhat smaller in magnitude is apparenteven when we restrict the sample to Blacks In other words evenif the employer knows that a candidate is Black the Blackness of
TABLE IVTHE SIGNALING VALUE OF NAMES TO EMPLOYERS
Dependent variable
Sample includes Blacksand Whites
Sample includes onlyBlacks
Nocontrolsincluded
Controlsproxying for
some informationon a resume
Nocontrolsincluded
Controlsproxying for
some informationon a resume
Percent of Black babies inwomanrsquos birth hospital
03015 01417 00690 00526(00026) (00045) (00064) (00085)
Woman born to a teenagemother
000260 000209 000238 000232(000005) (000009) (000011) (000016)
Woman born to an unmarriedmother
000508 000313 000193 000176(000005) (000009) (000011) (000017)
Womanrsquos birth weight(in grams)
216 103 016 011(007) (009) (013) (016)
Woman herself unmarried attime she gives birth
000338 000111 000038 000023(000006) (000006) (000010) (000009)
Years of education for theman who fathers thewomanrsquos child
00050 00002 00010 00006(00003) (00004) (00006) (00006)
Total number of childrenborn to the woman
000283 000238 000079 000090(000011) (000016) (000025) (000029)
The relevant dependent variable is listed on the left-hand side of the table The values reported in thetable are the coefficients on the Black Name Index of the woman Each table entry is from a separateregression In columns 1 and 3 no controls are included In columns 2 and 4 controls for a womanrsquos age yearsof education zip code of residence whether the woman is privately insured and year dummies are includedThese variables proxy for some of the types of information available to employers on resumes The sampleused in all regressions is the set of black women for whom we successfully link information from their ownbirth certificate to their childrsquos birth certificate Unlike earlier regressions these specifications control forchoices that a woman makes over the course of her life such as years of education The number ofobservations is 62309 for the sample that includes Blacks and Whites and 18427 for the sample that onlyincludes Blacks
800 QUARTERLY JOURNAL OF ECONOMICS
the name continues to serve as an important signal of socioeco-nomic status Thus while we cannot rule out animus on the partof employers we find evidence supporting a potential productiv-ity-related statistical discrimination motive for employers to baseinterview decisions on first names
V CONCLUSION
We document stark differences in naming patterns betweenBlacks and Whites and demonstrate that these patterns changesharply over time While most Blacks have shifted toward moredistinctively Black names (particularly in the late 1960s andearly 1970s) the fraction of Blacks choosing starkly White nameshas also increased How distinctively Black onersquos name was ap-pears to have signaled little in the early 1960s Naming conven-tions differed modestly across parental characteristics or neigh-borhood types The last two decades however have led to aldquoghettoizationrdquo of distinctively Black names namely a distinc-tively Black name is now a much stronger predictor of socioeco-nomic status Among the theories we consider models in whichthe rise of the Black Power movement triggers important changesin Black identity appear to be most consistent with our data Wefind no relationship between how Black onersquos name is and lifeoutcomes after controlling for other factors If that conclusion iscorrect then the proper interpretation of earlier audit studiesusing Black names on resumes is either that the impact of namesdoes not extend beyond the callback decision (because race isdirectly observed at the interview stage) or that names are cor-related with determinants of productivity not captured by a re-sume In our data it is difficult to distinguish between thesecompeting hypotheses
More generally this paper takes first steps toward an at-tempt to understand what role Black culture might play in ex-plaining continued poverty and racial isolation With respect tothis particular aspect of distinctive Black culture we concludethat carrying a black name is primarily a consequence rather thana cause of poverty and segregation
APPENDIX DATA DESCRIPTION
In this data appendix we describe the data sources that wedraw upon in our analysis give a description of some data limi-
801DISTINCTIVELY BLACK NAMES
tations and other data issues with which we are confrontedprovide definitions and describe the process used to link mothers
1 Data SourcesBirth Data Our empirical analyses are mainly based on data
drawn from the Birth Statistical Master File maintained by theOffice of Vital Records in the California Department of HealthServices These files provide information drawn from birth cer-tificates for virtually all children born in California over theperiod 1961ndash2000 With the approval of the California Committeefor the Protection of Human Subjects we have been able tosupplement the information contained on the public use versionsof these data sets with personal identifiers including motherrsquosfirst name motherrsquos maiden name and childrsquos full name
Zip Code Statistics U S Bureau of the Census AmericanFact Finder 1990 Census
Demographic and Socioeconomic Data For an accuracycheck on mother-children links data were obtained from theAmerican Community Survey 5 Percent Public Use of MicrodataSamples (PUMS) for California and United States (All States)U S Bureau of the Census Arabic First Names To identify anddiscard Arabic names from our data we used Bruce Lansky[1999] Baby Names Around the World
2 Data Limitations and Other Data IssuesRaceEthnicity From 1998 to 2000 information of a childrsquos
race is missing For these three years a child is considered Blackif either parent is Black In other years over 98 percent ofchildren with at least one Black parent are coded as Black Priorto 1982 most Hispanics are included with whites and it is notpossible to directly calculate statistics for Non-Hispanics Begin-ning in 1982 an identifier for Hispanic ethnicity was added to thebirth certificate in California Using information from this latterperiod we drop anyone in the earlier time period with a surnameor motherrsquos maiden name that is more than 10 percent Hispanic
Link of Birth Certificate Data for Women Born in 1973ndash1974to When They Give Birth Themselves in the Period 1989ndash2000 Inorder to uniquely link information from a womanrsquos own birthcertificate to those of her children when she gives birth a womanmust both be born in California and later give birth there Onlyafter 1989 do we have the motherrsquos date of birth and full firstname two critical pieces of information for making the linkageWe thus limit the sample to babies born 1989ndash2000 to Blackwomen themselves born in California In order to identify women
802 QUARTERLY JOURNAL OF ECONOMICS
whose birth histories are likely to be most fully captured by theperiod 1989ndash2000 we restrict the matching to women who werethemselves born in 1973ndash1974 We restrict the sample to Blackwomen born in California We then carry out five different match-ing procedures in which we use a motherrsquos exact date of birth andpermutations of her first name and maiden name (match only onmaiden name only on first name on first name and maidenname on first initial and maiden name and on first name andmaiden name initial) We keep only cases where the match be-tween mother and child is unique ie there is no other womanborn in California in 1973ndash1974 who has information that couldpossibly match the characteristics of the mother on the birthcertificate Because of typographical errors using only a subset ofthe information in a womanrsquos name somewhat increases thenumber of successful matches
HARVARD UNIVERSITY SOCIETY OF FELLOWS AND NBERDEPARTMENT OF ECONOMICS UNIVERSITY OF CHICAGO
REFERENCES
Akerlof George and Rachel Kranton ldquoEconomics and Identityrdquo Quarterly Jour-nal of Economics CXV (2000) 715ndash753
Anderson Elijah Streetwise Race Class and Change in an Urban Community(Chicago IL University of Chicago Press 1990)
mdashmdash Code of the Street Decency Violence and the Moral Life of the Inner City(New York NY W W Norton and Company Inc 1999)
Austen-Smith David and Roland Fryer ldquoThe Economics of lsquoActing WhitersquordquoNBER Working Paper No 9904 2003
Bart Barbara Marsha Hass Jane Philbrick Martha Sparks and Craig WilliamsldquoWhatrsquos in a Namerdquo Women in Management Review XII (1997) 209ndash308
Becker Gary The Economics of Discrimination (Chicago IL University of Chi-cago Press 1957)
Berman Eli ldquoSect Subsidy and Sacrifice An Economistrsquos View of Ultra-Ortho-dox Jewsrdquo Quarterly Journal of Economics CXV (2000) 905ndash953
Bertrand Marianne and Sendhil Mullainathan ldquoAre Emily and Greg MoreEmployable Than Lakisha and Jamal A Field Experiment Evidence onLabor Market Discriminationrdquo NBER Working Paper No 9873 2003
Bound John and Richard Freeman ldquoWhat Went Wrong The Erosion of RelativeEarnings and Employment among Black Men in the 1980srdquo Quarterly Jour-nal of Economics CVII (1992) 201ndash232
Brown C and P Gay Racial Discrimination 17 Years After the Act (London UKPolicy Studies Institute 1985)
Busse Thomas V and Louisa Seraydarian ldquoDesirability of First Names Ethnic-ity and Parental Educationrdquo Psychological Reports XL (1977) 739ndash742
Chandra Amitabh ldquoIs the Convergence of the Racial Wage Gap Illusoryrdquo NBERWorking Paper No 9476 2003
Counihan Carol and Penny Van Esterik Food and Culture A Reader (New YorkNY Routledge 1997)
Cutler David Edward Glaeser and Jake Vigdor ldquoThe Rise and Decline of theAmerican Ghettordquo Journal of Political Economy CVII (1999) 455ndash506
Fordham Signithia and John Ogbu ldquoBlack Studentsrsquo School Successes Copingwith the Burden of lsquoActing Whitersquordquo The Urban Review XVIII (1986)176ndash206
803DISTINCTIVELY BLACK NAMES
Fryer Roland G ldquoAn Economic Approach to Cultural Capitalrdquo unpublishedmanuscript University of Chicago 2003
Fryer Roland and Steven Levitt ldquoThe Causes and Consequences of DistinctivelyBlack Namesrdquo unpublished manuscript University of Chicago 2002
Glaeser Edward David Laibson and Bruce Sacerdote ldquoAn Economic Approach toSocial Capitalrdquo Economic Journal CXII (2002) 437ndash458
Goldin Claudia and Maria Shim ldquoMaking a Name Womenrsquos Surnames atMarriage and Beyondrdquo mimeo Harvard University 2003
Granovetter Mark Getting a Job A Study of Contacts and Careers (Chicago ILUniversity of Chicago Press 1974)
Hannerz Ulf Soulside Inquiries into Ghetto Culture and Community (New YorkNY Columbia University Press 1969)
Heckman James Tom Lyons and Petra Todd ldquoUnderstanding Black-WhiteWage Differentials 1960ndash1990rdquo American Economic Review XC (2000)344ndash349
Heckman James and Pedro Carneiro ldquoHuman Capital Policyrdquo NBER WorkingPaper No 9495 2003
Hoffman Charles ldquoHistorically Black Colleges and Universities 1976ndash1994rdquoNCES Technical Paper No 96902 1996
Hubbick J and S Carter Half a Chance A Report on Job Discriminationagainst Young Black Males in Nottingham (London UK Commission forRacial Equality 1980)
Iannaccone Laurence ldquoSacrifice and Stigma Reducing Free-Riding in CultsCommunes and Other Collectivesrdquo Journal of Political Economy C (1992)271ndash291
Jackson George White and Negro Spirituals their Life Span and Kinship Trac-ing 200 Years of Untrammeled Song Making and Singing among our CountryFolk with 116 Songs as Sung by Both Races (New York NY J J Augustin1944)
Jencks Christopher and Meredith Phillips The Black-White Test Score Gap(Washington DC Brookings Institution 1998)
Johnston Lloyd Patrick OrsquoMalley Jerald Bachman and John Schulenberg ldquoCig-arette Brand Preferences among Adolescentsrdquo Monitoring the Future Occa-sional Paper 45 Institute for Social Research University of Michigan 1999
Jowell R and P Prescott-Clarke ldquoRacial Discrimination and White-CollarWorkers in Britainrdquo Race XI (1970) 397ndash417
Kington Raynard and Herbert Nickens ldquoRacial and Ethnic Differences inHealth Recent Trends Current Patterns and Future Directionsrdquo in AmericaBecoming Racial Trends and Their Consequences Neil J Smelser William JWilson and Faith Mitchell editors Commission on Behavioral and SocialSciences and Education (Washington DC National Academy Press 2001)pp 253ndash310
Lazear Edward ldquoCulture and Languagerdquo Journal of Political Economy CVII(1999) S95ndashS126
Lewis Oscar La Vida A Puerto Rican Family in the Culture of PovertymdashSanJuan and New York (New York NY Random House 1966)
Lieberson Stanley A Matter of Taste How Names Fashions and Culture Change(New Haven CT Yale University Press 2000)
Lieberson Stanley and Kelly Mikelson ldquoDistinctive African-American NamesAn Experimental Historical and Linguistic Analysis of Innovationrdquo Ameri-can Sociological Review LX (1995) 928ndash946
Massey Douglas ldquoResidential Segregation and Neighborhood Conditions in U SMetropolitan Areasrdquo in America Becoming Racial Trends and Their Conse-quences I (Washington DC The National Academies Press 2001) pp391ndash434
McAdams Doug Roland Fryer and Steven Levitt ldquoWhatrsquos in a Name BlackPower and the Change in African-American Names 1961ndash2000rdquo workingpaper Stanford University 2003
Orr Eleanor Twice as Less Black English and the Performance of Black Studentsin Mathematics and Science (New York NY W W Norton 1989)
Reno Janet et al Correctional Populations of the United States (WashingtonDC Bureau of Justice Statistics 1997)
Riessman Frank The Culturally Deprived Child (New York NY Harper amp Bros1962)
804 QUARTERLY JOURNAL OF ECONOMICS
Smith James and Finis Welch ldquoBlack Economic Progress After Myrdalrdquo Journalof Economic Literature XXVII (1989) 519ndash564
Van Deburg W L New Day in Babylon The Black Power Movement and Ameri-can Culture 1965ndash1975 (Chicago IL University of Chicago Press 1992)
Ventura Stephanie and Christine Bachrach ldquoNonmarital Childbearing in theUnited States 1940ndash1999rdquo in National Vital Statistics Reports XLVIII(Hyattsville MD National Center for Health Statistics 2000)
Waldfogel Joel ldquoPreference Externalities An Empirical Study of Who BenefitsWhom in Differentiated Product Marketsrdquo Rand Journal of EconomicsXXXIV (2003) 557ndash568
Wilson William The Truly Disadvantaged The Inner City the Underclass andPublic Policy (Chicago IL University of Chicago Press 1987)
Wolfram Walt and Erik Thomas Development of African-American English(Oxford UK Blackwell Publishers 2002)
Woodward Vann C The Strange Career of Jim Crow (New York NY OxfordUniversity Press 1974)
Young Andrew An Easy Burden The Civil Rights Movement and the Transfor-mation of America (New York NY HarperCollins Publishers 1996)
805DISTINCTIVELY BLACK NAMES
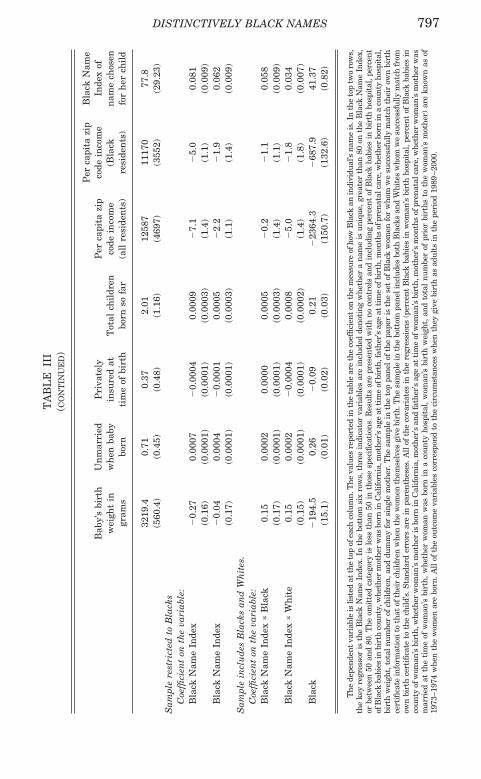
TA
BL
EII
I(C
ON
TIN
UE
D)
Bab
yrsquos
birt
hw
eigh
tin
gram
s
Un
mar
ried
wh
enba
bybo
rn
Pri
vate
lyin
sure
dat
tim
eof
birt
hT
otal
chil
dren
born
sofa
r
Per
capi
tazi
pco
dein
com
e(a
llre
side
nts
)
Per
capi
tazi
pco
dein
com
e(B
lack
resi
den
ts)
Bla
ckN
ame
Inde
xof
nam
ech
osen
for
her
chil
d
3219
40
710
372
0112
587
1117
077
8(5
604
)(0
45)
(04
8)(1
16)
(469
7)(3
552)
(29
23)
Sam
ple
rest
rict
edto
Bla
cks
Coe
ffici
ent
onth
eva
riab
le
Bla
ckN
ame
Inde
x
027
000
07
000
040
0009
7
1
50
008
1(0
16)
(00
001)
(00
001)
(00
003)
(14
)(1
1)
(00
09)
Bla
ckN
ame
Inde
x
004
000
04
000
010
0005
2
2
19
006
2(0
17)
(00
001)
(00
001)
(00
003)
(11
)(1
4)
(00
09)
Sam
ple
incl
ud
esB
lack
san
dW
hit
es
Coe
ffici
ent
onth
eva
riab
le
Bla
ckN
ame
Inde
x
Bla
ck0
150
0002
000
000
0005
0
2
11
005
8(0
17)
(00
001)
(00
001)
(00
003)
(14
)(1
1)
(00
09)
Bla
ckN
ame
Inde
x
Wh
ite
015
000
02
000
040
0008
5
0
18
003
4(0
15)
(00
001)
(00
001)
(00
002)
(14
)(1
8)
(00
07)
Bla
ck
194
50
26
009
021
23
643
68
79
413
7(1
51)
(00
1)(0
02)
(00
3)(1
507
)(1
326
)(0
82)
The
depe
nden
tva
riab
leis
liste
dat
the
top
ofea
chco
lum
nT
heva
lues
repo
rted
inth
eta
ble
are
the
coef
ficie
nton
the
mea
sure
ofho
wB
lack
anin
divi
dual
rsquosna
me
isI
nth
eto
ptw
oro
ws
the
key
regr
esso
ris
the
Bla
ckN
ame
Inde
xIn
the
bott
omsi
xro
ws
thre
ein
dica
tor
vari
able
sar
ein
clud
edde
noti
ngw
heth
era
nam
eis
uniq
ueg
reat
erth
an80
onth
eB
lack
Nam
eIn
dex
orbe
twee
n50
and
80T
heom
itte
dca
tego
ryis
less
than
50in
thos
esp
ecifi
cati
ons
Res
ults
are
pres
ente
dw
ith
noco
ntro
lsan
din
clud
ing
perc
ent
ofB
lack
babi
esin
birt
hho
spit
alp
erce
ntof
Bla
ckba
bies
inbi
rth
coun
tyw
heth
erm
othe
rw
asbo
rnin
Cal
ifor
nia
mot
herrsquo
sag
eat
tim
eof
birt
hfa
ther
rsquosag
eat
tim
eof
birt
hm
onth
sof
pren
atal
care
whe
ther
born
ina
coun
tyho
spit
al
birt
hw
eigh
tto
taln
umbe
rof
child
ren
and
dum
my
for
sing
lem
othe
rT
hesa
mpl
ein
the
top
pane
lof
the
pape
ris
the
set
ofB
lack
wom
enfo
rw
hom
we
succ
essf
ully
mat
chth
eir
own
birt
hce
rtifi
cate
info
rmat
ion
toth
atof
thei
rch
ildre
nw
hen
the
wom
enth
emse
lves
give
birt
hT
hesa
mpl
ein
the
bott
ompa
neli
nclu
des
both
Bla
cks
and
Whi
tes
who
mw
esu
cces
sful
lym
atch
from
own
birt
hce
rtifi
cate
toth
ech
ildrsquos
Sta
ndar
der
rors
are
inpa
rent
hese
sA
llof
the
cova
riat
esin
the
regr
essi
ons
(per
cent
Bla
ckba
bies
inw
oman
rsquosbi
rth
hosp
ital
per
cent
ofB
lack
babi
esin
coun
tyof
wom
anrsquos
birt
hw
heth
erw
oman
rsquosm
othe
ris
born
inC
alif
orni
am
othe
rrsquos
and
fath
errsquos
age
atti
me
ofw
oman
rsquosbi
rth
mot
herrsquo
sm
onth
sof
pren
atal
care
whe
ther
wom
anrsquos
mot
her
was
mar
ried
atth
eti
me
ofw
oman
rsquosbi
rth
whe
ther
wom
anw
asbo
rnin
aco
unty
hosp
ital
w
oman
rsquosbi
rth
wei
ght
and
tota
lnu
mbe
rof
prio
rbi
rths
toth
ew
oman
rsquosm
othe
r)ar
ekn
own
asof
1973
ndash197
4w
hen
the
wom
enar
ebo
rnA
llof
the
outc
ome
vari
able
sco
rres
pond
toth
eci
rcum
stan
ces
whe
nth
eygi
vebi
rth
asad
ults
inth
epe
riod
1989
ndash200
0
797DISTINCTIVELY BLACK NAMES
There are three possible interpretations of the data thatreconcile our findings with that of the audit study literature Onepossibility is that the only function names serve is as a noisyinitial indicator of race In this view of the world those with Blacknames may receive fewer job interviews but no fewer job offersDiscriminatory employers will use distinctively Black names asnoisy signals of race but names become irrelevant once the can-didate shows up for an interview and the employer directly ob-serves race26 Indeed in such a world there is a benefit to Blacksof signaling their race through name choice in order to avoidundertaking costly interviews unlikely to yield jobs and to signalrace to employers giving preferential treatment to Blacks Asecond interpretation of the data that is consistent with ourfindings and those of the audit studies is that Black namesbecause of self-selection among Black parents provide usefulsignals of human capital to employers even controlling for raceitself and other information available on resumes27 A final pos-sibility is that names themselves have a modest causal impact onjob callbacks and unemployment duration that we are unable todetect using the relatively coarse outcome measures available tous Note that only in the third of these three interpretations doesa personrsquos name have any causal impact on life outcomes
We cannot directly test between these competing hypothesesfor two reasons First our data set lacks clean measures ofproductivity We do however observe worker characteristics that
having the ldquowrongrdquo name is to look at cases in which a womanrsquos name is mis-matched ex post with the actual neighborhood in which she lives as an adult Inneither case do we find a systematic link between having the ldquowrongrdquo name andthe types of outcomes we are measuring
26 Even if names have an impact that extends beyond the resume stage inan efficient market with sufficiently many nondiscriminatory employers thepresence of discrimination need not result in worse outcomes for Blacks [Becker1957] Note also that at least in the past a relatively small fraction of the jobswere actually obtained through a formal resume-based process Granovetter[1974] reports that approximately 10 percent of respondents in a survey reportobtaining their job through job advertisements
27 From a legal perspective the use of names as a basis for hiring decisionsis likely to be a violation of current law regardless of whether there are under-lying productivity differences In the 1971 decision Griggs v Duke Power theSupreme Court ruled unanimously that policies that are neutral on their face buthave a disparate impact on Blacks are not allowed This doctrine was codified inthe Civil Rights Act of 1991 after the 1989 case Antonio v Wards Cove Packingmodified the Griggs ruling by stating that policies with disparate impacts wereallowable as long as they served a legitimate business interest Indeed even theuse of names to choose a subset of Blacks from an entirely Black hiring pool wouldprobably be viewed as illegal under Connecticut v Teal in which it was found thateven policies that have no disparate impact on a protected group but harm someindividuals within that group violate the law
798 QUARTERLY JOURNAL OF ECONOMICS
might be correlated with labor productivity (see eg Heckmanand Carneiro [2003]) but are typically not included on a resume(and are for the most part illegal for employers to inquire about)whether a woman is a single mother was born to a teenagemother was raised in a single-parent household or the degree ofracial segregation into which she was born The second difficultyin testing this hypothesis is that we do not have in our data all ofthe information on a resume (eg particular schools attendedcomplete work history misspellings)
Our empirical strategy in light of these shortcomings is toestimate a number of specifications in the general spirit of equa-tion (2) varying the set of covariates included in the regression Acritical difference between the earlier estimates and those pre-sented below are that we now include information about the adultcircumstances of a woman as covariates since such information ison the resume The results are presented in Table IV Rows of thetable correspond to different factors that might be correlated withlabor productivity due to their influence on human capital seg-regation in onersquos birth hospital motherrsquos marital status whetheronersquos mother was a teenager the womanrsquos own birth weight thewomanrsquos own marital status the education level of the man whois father to her children and the total number of children born tothe woman The first two columns of the table include both Blacksand Whites in the regressions We do not however include racedummies in the specification because race is not directly observedby the prospective employer from the resume The third andfourth columns of the table limit the sample only to Blacks Theentries in the table are the coefficient on the womanrsquos BNI Eachtable entry is from a different regression The first and thirdcolumns do not include any covariates the second and fourthcolumn includes the womanrsquos age years of education whether ornot she has private health insurance (the best measure we havewith respect to the quality of her current employment) zip code ofresidence fixed effects and year dummies These variables cap-ture some of the information on a resume Our sample is the setof women whom we observe both at their birth in 1973ndash1974 andas adults in 1989ndash2000
The results in Table IV suggest that a womanrsquos first name isindeed a useful predictor of the circumstances in which she grewup and her current situation both of which may in turn becorrelated with labor productivity This is true even after includ-ing our crude set of controls that proxy for information availableon the resume A womanrsquos name is a particularly important
799DISTINCTIVELY BLACK NAMES
predictor when we pool Blacks and Whites in the same regression(columns 1 and 2) In column 2 a woman with a BNI equal to 100(implying a name that no Whites have) is 209 percentage pointsmore likely to have been born to a teenage mother and 313percentage points more likely to have been born out-of-wedlockthan a Black woman living in the same zip code with the same ageand education but carrying a name that is equally commonamong Whites and Blacks The woman with a Black name is alsomuch more likely to have been born in a Black neighborhood toherself be unmarried to have had lower birth weight and to havegiven birth to more children The same pattern of results al-though generally somewhat smaller in magnitude is apparenteven when we restrict the sample to Blacks In other words evenif the employer knows that a candidate is Black the Blackness of
TABLE IVTHE SIGNALING VALUE OF NAMES TO EMPLOYERS
Dependent variable
Sample includes Blacksand Whites
Sample includes onlyBlacks
Nocontrolsincluded
Controlsproxying for
some informationon a resume
Nocontrolsincluded
Controlsproxying for
some informationon a resume
Percent of Black babies inwomanrsquos birth hospital
03015 01417 00690 00526(00026) (00045) (00064) (00085)
Woman born to a teenagemother
000260 000209 000238 000232(000005) (000009) (000011) (000016)
Woman born to an unmarriedmother
000508 000313 000193 000176(000005) (000009) (000011) (000017)
Womanrsquos birth weight(in grams)
216 103 016 011(007) (009) (013) (016)
Woman herself unmarried attime she gives birth
000338 000111 000038 000023(000006) (000006) (000010) (000009)
Years of education for theman who fathers thewomanrsquos child
00050 00002 00010 00006(00003) (00004) (00006) (00006)
Total number of childrenborn to the woman
000283 000238 000079 000090(000011) (000016) (000025) (000029)
The relevant dependent variable is listed on the left-hand side of the table The values reported in thetable are the coefficients on the Black Name Index of the woman Each table entry is from a separateregression In columns 1 and 3 no controls are included In columns 2 and 4 controls for a womanrsquos age yearsof education zip code of residence whether the woman is privately insured and year dummies are includedThese variables proxy for some of the types of information available to employers on resumes The sampleused in all regressions is the set of black women for whom we successfully link information from their ownbirth certificate to their childrsquos birth certificate Unlike earlier regressions these specifications control forchoices that a woman makes over the course of her life such as years of education The number ofobservations is 62309 for the sample that includes Blacks and Whites and 18427 for the sample that onlyincludes Blacks
800 QUARTERLY JOURNAL OF ECONOMICS
the name continues to serve as an important signal of socioeco-nomic status Thus while we cannot rule out animus on the partof employers we find evidence supporting a potential productiv-ity-related statistical discrimination motive for employers to baseinterview decisions on first names
V CONCLUSION
We document stark differences in naming patterns betweenBlacks and Whites and demonstrate that these patterns changesharply over time While most Blacks have shifted toward moredistinctively Black names (particularly in the late 1960s andearly 1970s) the fraction of Blacks choosing starkly White nameshas also increased How distinctively Black onersquos name was ap-pears to have signaled little in the early 1960s Naming conven-tions differed modestly across parental characteristics or neigh-borhood types The last two decades however have led to aldquoghettoizationrdquo of distinctively Black names namely a distinc-tively Black name is now a much stronger predictor of socioeco-nomic status Among the theories we consider models in whichthe rise of the Black Power movement triggers important changesin Black identity appear to be most consistent with our data Wefind no relationship between how Black onersquos name is and lifeoutcomes after controlling for other factors If that conclusion iscorrect then the proper interpretation of earlier audit studiesusing Black names on resumes is either that the impact of namesdoes not extend beyond the callback decision (because race isdirectly observed at the interview stage) or that names are cor-related with determinants of productivity not captured by a re-sume In our data it is difficult to distinguish between thesecompeting hypotheses
More generally this paper takes first steps toward an at-tempt to understand what role Black culture might play in ex-plaining continued poverty and racial isolation With respect tothis particular aspect of distinctive Black culture we concludethat carrying a black name is primarily a consequence rather thana cause of poverty and segregation
APPENDIX DATA DESCRIPTION
In this data appendix we describe the data sources that wedraw upon in our analysis give a description of some data limi-
801DISTINCTIVELY BLACK NAMES
tations and other data issues with which we are confrontedprovide definitions and describe the process used to link mothers
1 Data SourcesBirth Data Our empirical analyses are mainly based on data
drawn from the Birth Statistical Master File maintained by theOffice of Vital Records in the California Department of HealthServices These files provide information drawn from birth cer-tificates for virtually all children born in California over theperiod 1961ndash2000 With the approval of the California Committeefor the Protection of Human Subjects we have been able tosupplement the information contained on the public use versionsof these data sets with personal identifiers including motherrsquosfirst name motherrsquos maiden name and childrsquos full name
Zip Code Statistics U S Bureau of the Census AmericanFact Finder 1990 Census
Demographic and Socioeconomic Data For an accuracycheck on mother-children links data were obtained from theAmerican Community Survey 5 Percent Public Use of MicrodataSamples (PUMS) for California and United States (All States)U S Bureau of the Census Arabic First Names To identify anddiscard Arabic names from our data we used Bruce Lansky[1999] Baby Names Around the World
2 Data Limitations and Other Data IssuesRaceEthnicity From 1998 to 2000 information of a childrsquos
race is missing For these three years a child is considered Blackif either parent is Black In other years over 98 percent ofchildren with at least one Black parent are coded as Black Priorto 1982 most Hispanics are included with whites and it is notpossible to directly calculate statistics for Non-Hispanics Begin-ning in 1982 an identifier for Hispanic ethnicity was added to thebirth certificate in California Using information from this latterperiod we drop anyone in the earlier time period with a surnameor motherrsquos maiden name that is more than 10 percent Hispanic
Link of Birth Certificate Data for Women Born in 1973ndash1974to When They Give Birth Themselves in the Period 1989ndash2000 Inorder to uniquely link information from a womanrsquos own birthcertificate to those of her children when she gives birth a womanmust both be born in California and later give birth there Onlyafter 1989 do we have the motherrsquos date of birth and full firstname two critical pieces of information for making the linkageWe thus limit the sample to babies born 1989ndash2000 to Blackwomen themselves born in California In order to identify women
802 QUARTERLY JOURNAL OF ECONOMICS
whose birth histories are likely to be most fully captured by theperiod 1989ndash2000 we restrict the matching to women who werethemselves born in 1973ndash1974 We restrict the sample to Blackwomen born in California We then carry out five different match-ing procedures in which we use a motherrsquos exact date of birth andpermutations of her first name and maiden name (match only onmaiden name only on first name on first name and maidenname on first initial and maiden name and on first name andmaiden name initial) We keep only cases where the match be-tween mother and child is unique ie there is no other womanborn in California in 1973ndash1974 who has information that couldpossibly match the characteristics of the mother on the birthcertificate Because of typographical errors using only a subset ofthe information in a womanrsquos name somewhat increases thenumber of successful matches
HARVARD UNIVERSITY SOCIETY OF FELLOWS AND NBERDEPARTMENT OF ECONOMICS UNIVERSITY OF CHICAGO
REFERENCES
Akerlof George and Rachel Kranton ldquoEconomics and Identityrdquo Quarterly Jour-nal of Economics CXV (2000) 715ndash753
Anderson Elijah Streetwise Race Class and Change in an Urban Community(Chicago IL University of Chicago Press 1990)
mdashmdash Code of the Street Decency Violence and the Moral Life of the Inner City(New York NY W W Norton and Company Inc 1999)
Austen-Smith David and Roland Fryer ldquoThe Economics of lsquoActing WhitersquordquoNBER Working Paper No 9904 2003
Bart Barbara Marsha Hass Jane Philbrick Martha Sparks and Craig WilliamsldquoWhatrsquos in a Namerdquo Women in Management Review XII (1997) 209ndash308
Becker Gary The Economics of Discrimination (Chicago IL University of Chi-cago Press 1957)
Berman Eli ldquoSect Subsidy and Sacrifice An Economistrsquos View of Ultra-Ortho-dox Jewsrdquo Quarterly Journal of Economics CXV (2000) 905ndash953
Bertrand Marianne and Sendhil Mullainathan ldquoAre Emily and Greg MoreEmployable Than Lakisha and Jamal A Field Experiment Evidence onLabor Market Discriminationrdquo NBER Working Paper No 9873 2003
Bound John and Richard Freeman ldquoWhat Went Wrong The Erosion of RelativeEarnings and Employment among Black Men in the 1980srdquo Quarterly Jour-nal of Economics CVII (1992) 201ndash232
Brown C and P Gay Racial Discrimination 17 Years After the Act (London UKPolicy Studies Institute 1985)
Busse Thomas V and Louisa Seraydarian ldquoDesirability of First Names Ethnic-ity and Parental Educationrdquo Psychological Reports XL (1977) 739ndash742
Chandra Amitabh ldquoIs the Convergence of the Racial Wage Gap Illusoryrdquo NBERWorking Paper No 9476 2003
Counihan Carol and Penny Van Esterik Food and Culture A Reader (New YorkNY Routledge 1997)
Cutler David Edward Glaeser and Jake Vigdor ldquoThe Rise and Decline of theAmerican Ghettordquo Journal of Political Economy CVII (1999) 455ndash506
Fordham Signithia and John Ogbu ldquoBlack Studentsrsquo School Successes Copingwith the Burden of lsquoActing Whitersquordquo The Urban Review XVIII (1986)176ndash206
803DISTINCTIVELY BLACK NAMES
Fryer Roland G ldquoAn Economic Approach to Cultural Capitalrdquo unpublishedmanuscript University of Chicago 2003
Fryer Roland and Steven Levitt ldquoThe Causes and Consequences of DistinctivelyBlack Namesrdquo unpublished manuscript University of Chicago 2002
Glaeser Edward David Laibson and Bruce Sacerdote ldquoAn Economic Approach toSocial Capitalrdquo Economic Journal CXII (2002) 437ndash458
Goldin Claudia and Maria Shim ldquoMaking a Name Womenrsquos Surnames atMarriage and Beyondrdquo mimeo Harvard University 2003
Granovetter Mark Getting a Job A Study of Contacts and Careers (Chicago ILUniversity of Chicago Press 1974)
Hannerz Ulf Soulside Inquiries into Ghetto Culture and Community (New YorkNY Columbia University Press 1969)
Heckman James Tom Lyons and Petra Todd ldquoUnderstanding Black-WhiteWage Differentials 1960ndash1990rdquo American Economic Review XC (2000)344ndash349
Heckman James and Pedro Carneiro ldquoHuman Capital Policyrdquo NBER WorkingPaper No 9495 2003
Hoffman Charles ldquoHistorically Black Colleges and Universities 1976ndash1994rdquoNCES Technical Paper No 96902 1996
Hubbick J and S Carter Half a Chance A Report on Job Discriminationagainst Young Black Males in Nottingham (London UK Commission forRacial Equality 1980)
Iannaccone Laurence ldquoSacrifice and Stigma Reducing Free-Riding in CultsCommunes and Other Collectivesrdquo Journal of Political Economy C (1992)271ndash291
Jackson George White and Negro Spirituals their Life Span and Kinship Trac-ing 200 Years of Untrammeled Song Making and Singing among our CountryFolk with 116 Songs as Sung by Both Races (New York NY J J Augustin1944)
Jencks Christopher and Meredith Phillips The Black-White Test Score Gap(Washington DC Brookings Institution 1998)
Johnston Lloyd Patrick OrsquoMalley Jerald Bachman and John Schulenberg ldquoCig-arette Brand Preferences among Adolescentsrdquo Monitoring the Future Occa-sional Paper 45 Institute for Social Research University of Michigan 1999
Jowell R and P Prescott-Clarke ldquoRacial Discrimination and White-CollarWorkers in Britainrdquo Race XI (1970) 397ndash417
Kington Raynard and Herbert Nickens ldquoRacial and Ethnic Differences inHealth Recent Trends Current Patterns and Future Directionsrdquo in AmericaBecoming Racial Trends and Their Consequences Neil J Smelser William JWilson and Faith Mitchell editors Commission on Behavioral and SocialSciences and Education (Washington DC National Academy Press 2001)pp 253ndash310
Lazear Edward ldquoCulture and Languagerdquo Journal of Political Economy CVII(1999) S95ndashS126
Lewis Oscar La Vida A Puerto Rican Family in the Culture of PovertymdashSanJuan and New York (New York NY Random House 1966)
Lieberson Stanley A Matter of Taste How Names Fashions and Culture Change(New Haven CT Yale University Press 2000)
Lieberson Stanley and Kelly Mikelson ldquoDistinctive African-American NamesAn Experimental Historical and Linguistic Analysis of Innovationrdquo Ameri-can Sociological Review LX (1995) 928ndash946
Massey Douglas ldquoResidential Segregation and Neighborhood Conditions in U SMetropolitan Areasrdquo in America Becoming Racial Trends and Their Conse-quences I (Washington DC The National Academies Press 2001) pp391ndash434
McAdams Doug Roland Fryer and Steven Levitt ldquoWhatrsquos in a Name BlackPower and the Change in African-American Names 1961ndash2000rdquo workingpaper Stanford University 2003
Orr Eleanor Twice as Less Black English and the Performance of Black Studentsin Mathematics and Science (New York NY W W Norton 1989)
Reno Janet et al Correctional Populations of the United States (WashingtonDC Bureau of Justice Statistics 1997)
Riessman Frank The Culturally Deprived Child (New York NY Harper amp Bros1962)
804 QUARTERLY JOURNAL OF ECONOMICS
Smith James and Finis Welch ldquoBlack Economic Progress After Myrdalrdquo Journalof Economic Literature XXVII (1989) 519ndash564
Van Deburg W L New Day in Babylon The Black Power Movement and Ameri-can Culture 1965ndash1975 (Chicago IL University of Chicago Press 1992)
Ventura Stephanie and Christine Bachrach ldquoNonmarital Childbearing in theUnited States 1940ndash1999rdquo in National Vital Statistics Reports XLVIII(Hyattsville MD National Center for Health Statistics 2000)
Waldfogel Joel ldquoPreference Externalities An Empirical Study of Who BenefitsWhom in Differentiated Product Marketsrdquo Rand Journal of EconomicsXXXIV (2003) 557ndash568
Wilson William The Truly Disadvantaged The Inner City the Underclass andPublic Policy (Chicago IL University of Chicago Press 1987)
Wolfram Walt and Erik Thomas Development of African-American English(Oxford UK Blackwell Publishers 2002)
Woodward Vann C The Strange Career of Jim Crow (New York NY OxfordUniversity Press 1974)
Young Andrew An Easy Burden The Civil Rights Movement and the Transfor-mation of America (New York NY HarperCollins Publishers 1996)
805DISTINCTIVELY BLACK NAMES