Embed Size (px)
Citation preview
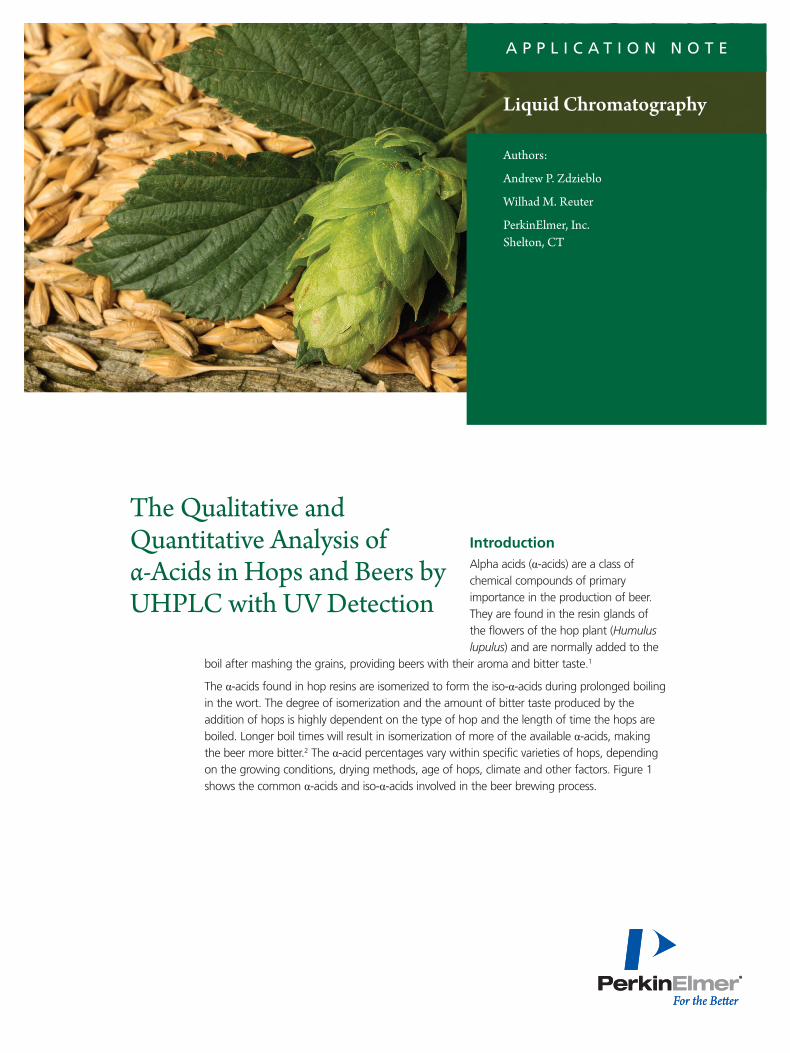
Authors:
Andrew P. Zdzieblo
Wilhad M. Reuter
PerkinElmer, Inc. Shelton, CT
Introduction Alpha acids (α-acids) are a class of chemical compounds of primary importance in the production of beer. They are found in the resin glands of the flowers of the hop plant (Humulus lupulus) and are normally added to the
boil after mashing the grains, providing beers with their aroma and bitter taste.1
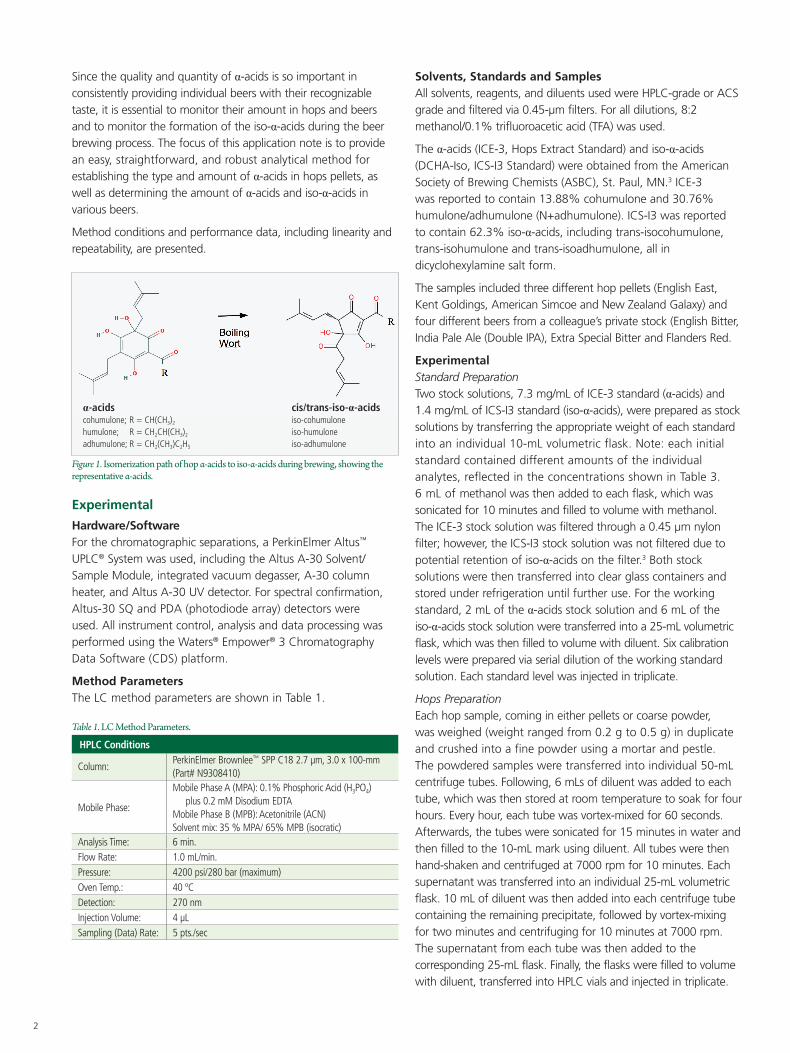
The α-acids found in hop resins are isomerized to form the iso-α-acids during prolonged boiling in the wort. The degree of isomerization and the amount of bitter taste produced by the addition of hops is highly dependent on the type of hop and the length of time the hops are boiled. Longer boil times will result in isomerization of more of the available α-acids, making the beer more bitter.2 The α-acid percentages vary within specific varieties of hops, depending on the growing conditions, drying methods, age of hops, climate and other factors. Figure 1 shows the common α-acids and iso-α-acids involved in the beer brewing process.
The Qualitative and Quantitative Analysis of α-Acids in Hops and Beers by UHPLC with UV Detection
A P P L I C A T I O N N O T E
Liquid Chromatography
2
Since the quality and quantity of α-acids is so important in consistently providing individual beers with their recognizable taste, it is essential to monitor their amount in hops and beers and to monitor the formation of the iso-α-acids during the beer brewing process. The focus of this application note is to provide an easy, straightforward, and robust analytical method for establishing the type and amount of α-acids in hops pellets, as well as determining the amount of α-acids and iso-α-acids in various beers.
Method conditions and performance data, including linearity and repeatability, are presented.
Experimental
Hardware/SoftwareFor the chromatographic separations, a PerkinElmer Altus™ UPLC® System was used, including the Altus A-30 Solvent/Sample Module, integrated vacuum degasser, A-30 column heater, and Altus A-30 UV detector. For spectral confirmation, Altus-30 SQ and PDA (photodiode array) detectors were used. All instrument control, analysis and data processing was performed using the Waters® Empower® 3 Chromatography Data Software (CDS) platform.
Method ParametersThe LC method parameters are shown in Table 1.
Solvents, Standards and SamplesAll solvents, reagents, and diluents used were HPLC-grade or ACS grade and filtered via 0.45-µm filters. For all dilutions, 8:2 methanol/0.1% trifluoroacetic acid (TFA) was used.
The α-acids (ICE-3, Hops Extract Standard) and iso-α-acids (DCHA-Iso, ICS-I3 Standard) were obtained from the American Society of Brewing Chemists (ASBC), St. Paul, MN.3 ICE-3 was reported to contain 13.88% cohumulone and 30.76% humulone/adhumulone (N+adhumulone). ICS-I3 was reported to contain 62.3% iso-α-acids, including trans-isocohumulone, trans-isohumulone and trans-isoadhumulone, all in dicyclohexylamine salt form.
The samples included three different hop pellets (English East, Kent Goldings, American Simcoe and New Zealand Galaxy) and four different beers from a colleague’s private stock (English Bitter, India Pale Ale (Double IPA), Extra Special Bitter and Flanders Red.
ExperimentalStandard Preparation Two stock solutions, 7.3 mg/mL of ICE-3 standard (α-acids) and 1.4 mg/mL of ICS-I3 standard (iso-α-acids), were prepared as stock solutions by transferring the appropriate weight of each standard into an individual 10-mL volumetric flask. Note: each initial standard contained different amounts of the individual analytes, reflected in the concentrations shown in Table 3. 6 mL of methanol was then added to each flask, which was sonicated for 10 minutes and filled to volume with methanol. The ICE-3 stock solution was filtered through a 0.45 µm nylon filter; however, the ICS-I3 stock solution was not filtered due to potential retention of iso-α-acids on the filter.3 Both stock solutions were then transferred into clear glass containers and stored under refrigeration until further use. For the working standard, 2 mL of the α-acids stock solution and 6 mL of the iso-α-acids stock solution were transferred into a 25-mL volumetric flask, which was then filled to volume with diluent. Six calibration levels were prepared via serial dilution of the working standard solution. Each standard level was injected in triplicate.
Hops Preparation Each hop sample, coming in either pellets or coarse powder, was weighed (weight ranged from 0.2 g to 0.5 g) in duplicate and crushed into a fine powder using a mortar and pestle. The powdered samples were transferred into individual 50-mL centrifuge tubes. Following, 6 mLs of diluent was added to each tube, which was then stored at room temperature to soak for four hours. Every hour, each tube was vortex-mixed for 60 seconds. Afterwards, the tubes were sonicated for 15 minutes in water and then filled to the 10-mL mark using diluent. All tubes were then hand-shaken and centrifuged at 7000 rpm for 10 minutes. Each supernatant was transferred into an individual 25-mL volumetric flask. 10 mL of diluent was then added into each centrifuge tube containing the remaining precipitate, followed by vortex-mixing for two minutes and centrifuging for 10 minutes at 7000 rpm. The supernatant from each tube was then added to the corresponding 25-mL flask. Finally, the flasks were filled to volume with diluent, transferred into HPLC vials and injected in triplicate.
Table 1. LC Method Parameters.
HPLC Conditions
Column: PerkinElmer Brownlee™ SPP C18 2.7 µm, 3.0 x 100-mm (Part# N9308410)
Mobile Phase:
Mobile Phase A (MPA): 0.1% Phosphoric Acid (H3PO4) plus 0.2 mM Disodium EDTAMobile Phase B (MPB): Acetonitrile (ACN) Solvent mix: 35 % MPA/ 65% MPB (isocratic)
Analysis Time: 6 min.Flow Rate: 1.0 mL/min. Pressure: 4200 psi/280 bar (maximum)Oven Temp.: 40 ºCDetection: 270 nmInjection Volume: 4 µLSampling (Data) Rate: 5 pts./sec
Figure 1. Isomerization path of hop α-acids to iso-α-acids during brewing, showing the representative α-acids.
α-acidscohumulone; R = CH(CH3)2
humulone; R = CH2CH(CH3)2 adhumulone; R = CH2(CH3)C2H5
cis/trans-iso-α-acidsiso-cohumulone iso-humulone iso-adhumulone
3
Beer PreparationThe four beer samples were prepared by liquid-liquid extraction (LLE). Duplicate 10-mL aliquots of each beer were transferred into individual centrifuge tubes followed by the addition of 0.5 mL of phosphoric acid and 10 mL of trimethylpentane. A blank sample was prepared by substituting 10 mL of water for the 10 mL of beer. The tubes were vortexed for one minute. To diminish the layer of foam that developed between the water and trimethylpentane layers, 1-2 mL of methanol was added to the centrifuge tube. Subsequently, each tube was sonicated in water for 15 minutes, followed by centrifuging for five minutes at 2000 rpm. 5 mLs of clear supernatant was then collected in an evaporating dish and evaporated to dryness under a stream
of nitrogen. The residue was re-dissolved in 2.0 mL of diluent, transferred into HPLC vials and injected in triplicate.
Results and Discussion
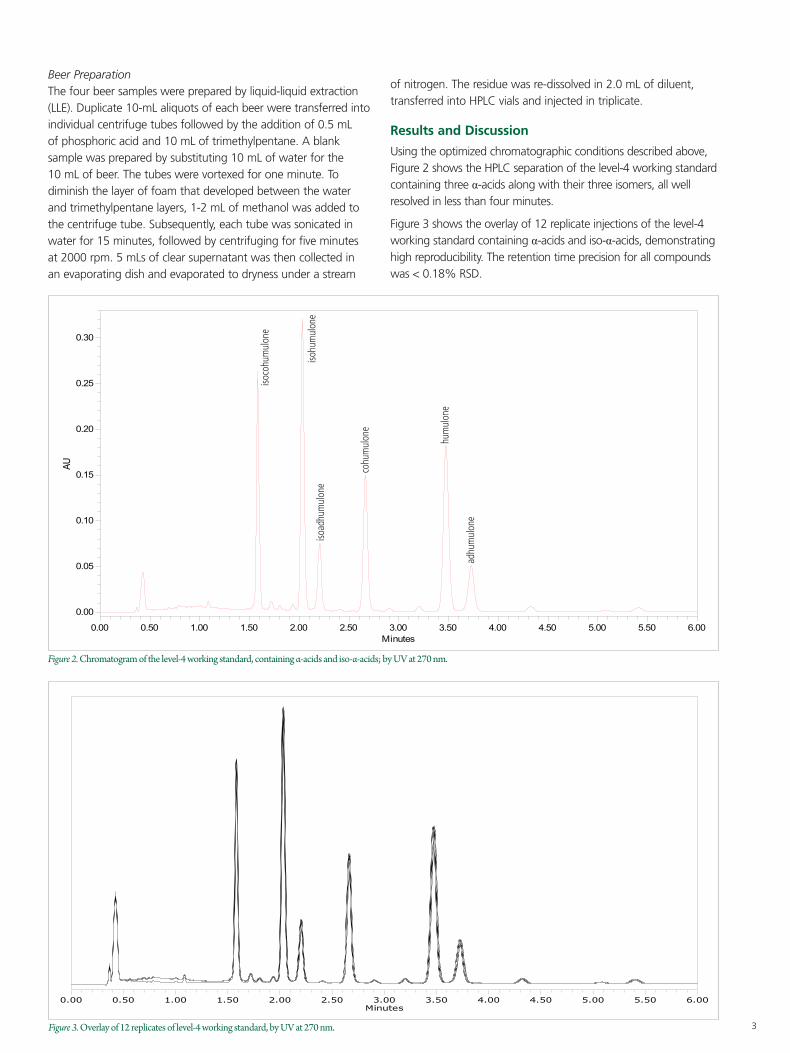
Using the optimized chromatographic conditions described above, Figure 2 shows the HPLC separation of the level-4 working standard containing three α-acids along with their three isomers, all well resolved in less than four minutes.
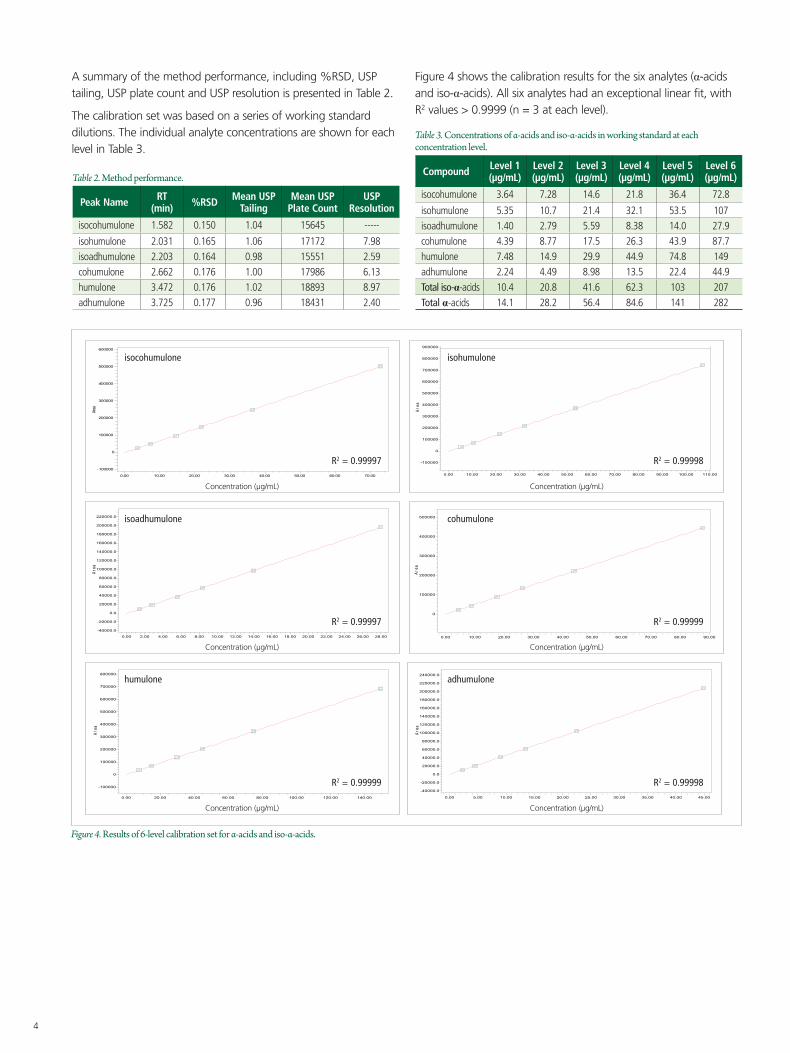
Figure 3 shows the overlay of 12 replicate injections of the level-4 working standard containing α-acids and iso-α-acids, demonstrating high reproducibility. The retention time precision for all compounds was < 0.18% RSD.
Figure 3. Overlay of 12 replicates of level-4 working standard, by UV at 270 nm.
Minutes0.00 0.50 1.00 1.50 2.00 2.50 3.00 3.50 4.00 4.50 5.00 5.50 6.00
isoco
hum
ulon
e
isohu
mul
one
isoad
hum
ulon
e
cohu
mul
one
adhu
mul
one
Figure 2. Chromatogram of the level-4 working standard, containing α-acids and iso-α-acids; by UV at 270 nm.
AU
0.00
0.05
0.10
0.15
0.20
0.25
0.30
Minutes0.00 0.50 1.00 1.50 2.00 2.50 3.00 3.50 4.00 4.50 5.00 5.50 6.00
hum
ulon
e
4
A summary of the method performance, including %RSD, USP tailing, USP plate count and USP resolution is presented in Table 2.
The calibration set was based on a series of working standard dilutions. The individual analyte concentrations are shown for each level in Table 3.
Figure 4 shows the calibration results for the six analytes (α-acids and iso-α-acids). All six analytes had an exceptional linear fit, with R2 values > 0.9999 (n = 3 at each level).
Table 2. Method performance.
Peak Name RT (min) %RSD Mean USP
TailingMean USP
Plate CountUSP
Resolution
isocohumulone 1.582 0.150 1.04 15645 -----
isohumulone 2.031 0.165 1.06 17172 7.98isoadhumulone 2.203 0.164 0.98 15551 2.59cohumulone 2.662 0.176 1.00 17986 6.13humulone 3.472 0.176 1.02 18893 8.97adhumulone 3.725 0.177 0.96 18431 2.40
Table 3. Concentrations of α-acids and iso-α-acids in working standard at each concentration level.
Compound Level 1 (µg/mL)
Level 2 (µg/mL)
Level 3 (µg/mL)
Level 4 (µg/mL)
Level 5 (µg/mL)
Level 6 (µg/mL)
isocohumulone 3.64 7.28 14.6 21.8 36.4 72.8
isohumulone 5.35 10.7 21.4 32.1 53.5 107isoadhumulone 1.40 2.79 5.59 8.38 14.0 27.9cohumulone 4.39 8.77 17.5 26.3 43.9 87.7humulone 7.48 14.9 29.9 44.9 74.8 149adhumulone 2.24 4.49 8.98 13.5 22.4 44.9Total iso-α-acids 10.4 20.8 41.6 62.3 103 207Total α-acids 14.1 28.2 56.4 84.6 141 282
Figure 4. Results of 6-level calibration set for α-acids and iso-α-acids.
Area
-100000
0
100000
200000
300000
400000
500000
600000
0.00 10.00 20.00 30.00 40.00 50.00 60.00 70.00
Area
-100000
0
100000
200000
300000
400000
500000
600000
700000
800000
900000
0.00 10.00 20.00 30.00 40.00 50.00 60.00 70.00 80.00 90.00 100.00 110.00
Area
-40000.0
-20000.0
0.0
20000.0
40000.0
60000.0
80000.0
100000.0
120000.0
140000.0
160000.0
180000.0
200000.0
220000.0
0.00 2.00 4.00 6.00 8.00 10.00 12.00 14.00 16.00 18.00 20.00 22.00 24.00 26.00 28.00
Area
0
100000
200000
300000
400000
500000
0.00 10.00 20.00 30.00 40.00 50.00 60.00 70.00 80.00 90.00
Area
-100000
0
100000
200000
300000
400000
500000
600000
700000
800000
0.00 20.00 40.00 60.00 80.00 100.00 120.00 140.00
Area
-40000.0
-20000.0
0.0
20000.0
40000.0
60000.0
80000.0
100000.0
120000.0
140000.0
160000.0
180000.0
200000.0
220000.0
240000.0
0.00 5.00 10.00 15.00 20.00 25.00 30.00 35.00 40.00 45.00
Area
-2.0x10⁵
0.0
2.0x10⁵
4.0x10⁵
6.0x10⁵
8.0x10⁵
1.0x10⁶
1.2x10⁶
1.4x10⁶
1.6x10⁶
0.00 50.00 100.00 150.00 200.00 250.00
Area
-2.0x10⁵
0.0
2.0x10⁵
4.0x10⁵
6.0x10⁵
8.0x10⁵
1.0x10⁶
1.2x10⁶
1.4x10⁶
1.6x10⁶
0.00 20.00 40.00 60.00 80.00 100.00 120.00 140.00 160.00 180.00 200.00
R2 = 0.99997
Concentration (µg/mL)
isocohumulone
Area
-100000
0
100000
200000
300000
400000
500000
600000
0.00 10.00 20.00 30.00 40.00 50.00 60.00 70.00
Area
-100000
0
100000
200000
300000
400000
500000
600000
700000
800000
900000
0.00 10.00 20.00 30.00 40.00 50.00 60.00 70.00 80.00 90.00 100.00 110.00
Area
-40000.0
-20000.0
0.0
20000.0
40000.0
60000.0
80000.0
100000.0
120000.0
140000.0
160000.0
180000.0
200000.0
220000.0
0.00 2.00 4.00 6.00 8.00 10.00 12.00 14.00 16.00 18.00 20.00 22.00 24.00 26.00 28.00
Area
0
100000
200000
300000
400000
500000
0.00 10.00 20.00 30.00 40.00 50.00 60.00 70.00 80.00 90.00
Area
-100000
0
100000
200000
300000
400000
500000
600000
700000
800000
0.00 20.00 40.00 60.00 80.00 100.00 120.00 140.00
Area
-40000.0
-20000.0
0.0
20000.0
40000.0
60000.0
80000.0
100000.0
120000.0
140000.0
160000.0
180000.0
200000.0
220000.0
240000.0
0.00 5.00 10.00 15.00 20.00 25.00 30.00 35.00 40.00 45.00
Area
-2.0x10⁵
0.0
2.0x10⁵
4.0x10⁵
6.0x10⁵
8.0x10⁵
1.0x10⁶
1.2x10⁶
1.4x10⁶
1.6x10⁶
0.00 50.00 100.00 150.00 200.00 250.00
Area
-2.0x10⁵
0.0
2.0x10⁵
4.0x10⁵
6.0x10⁵
8.0x10⁵
1.0x10⁶
1.2x10⁶
1.4x10⁶
1.6x10⁶
0.00 20.00 40.00 60.00 80.00 100.00 120.00 140.00 160.00 180.00 200.00
R2 = 0.99998
Concentration (µg/mL)
isohumulone
Area
-100000
0
100000
200000
300000
400000
500000
600000
0.00 10.00 20.00 30.00 40.00 50.00 60.00 70.00
Area
-100000
0
100000
200000
300000
400000
500000
600000
700000
800000
900000
0.00 10.00 20.00 30.00 40.00 50.00 60.00 70.00 80.00 90.00 100.00 110.00
Area
-40000.0
-20000.0
0.0
20000.0
40000.0
60000.0
80000.0
100000.0
120000.0
140000.0
160000.0
180000.0
200000.0
220000.0
0.00 2.00 4.00 6.00 8.00 10.00 12.00 14.00 16.00 18.00 20.00 22.00 24.00 26.00 28.00
Area
0
100000
200000
300000
400000
500000
0.00 10.00 20.00 30.00 40.00 50.00 60.00 70.00 80.00 90.00
Area
-100000
0
100000
200000
300000
400000
500000
600000
700000
800000
0.00 20.00 40.00 60.00 80.00 100.00 120.00 140.00
Area
-40000.0
-20000.0
0.0
20000.0
40000.0
60000.0
80000.0
100000.0
120000.0
140000.0
160000.0
180000.0
200000.0
220000.0
240000.0
0.00 5.00 10.00 15.00 20.00 25.00 30.00 35.00 40.00 45.00
Area
-2.0x10⁵
0.0
2.0x10⁵
4.0x10⁵
6.0x10⁵
8.0x10⁵
1.0x10⁶
1.2x10⁶
1.4x10⁶
1.6x10⁶
0.00 50.00 100.00 150.00 200.00 250.00
Area
-2.0x10⁵
0.0
2.0x10⁵
4.0x10⁵
6.0x10⁵
8.0x10⁵
1.0x10⁶
1.2x10⁶
1.4x10⁶
1.6x10⁶
0.00 20.00 40.00 60.00 80.00 100.00 120.00 140.00 160.00 180.00 200.00
R2 = 0.99997
Concentration (µg/mL)
isoadhumulone
Area
-100000
0
100000
200000
300000
400000
500000
600000
0.00 10.00 20.00 30.00 40.00 50.00 60.00 70.00
Area
-100000
0
100000
200000
300000
400000
500000
600000
700000
800000
900000
0.00 10.00 20.00 30.00 40.00 50.00 60.00 70.00 80.00 90.00 100.00 110.00
Area
-40000.0
-20000.0
0.0
20000.0
40000.0
60000.0
80000.0
100000.0
120000.0
140000.0
160000.0
180000.0
200000.0
220000.0
0.00 2.00 4.00 6.00 8.00 10.00 12.00 14.00 16.00 18.00 20.00 22.00 24.00 26.00 28.00
Area
0
100000
200000
300000
400000
500000
0.00 10.00 20.00 30.00 40.00 50.00 60.00 70.00 80.00 90.00
Area
-100000
0
100000
200000
300000
400000
500000
600000
700000
800000
0.00 20.00 40.00 60.00 80.00 100.00 120.00 140.00
Area
-40000.0
-20000.0
0.0
20000.0
40000.0
60000.0
80000.0
100000.0
120000.0
140000.0
160000.0
180000.0
200000.0
220000.0
240000.0
0.00 5.00 10.00 15.00 20.00 25.00 30.00 35.00 40.00 45.00
Area
-2.0x10⁵
0.0
2.0x10⁵
4.0x10⁵
6.0x10⁵
8.0x10⁵
1.0x10⁶
1.2x10⁶
1.4x10⁶
1.6x10⁶
0.00 50.00 100.00 150.00 200.00 250.00
Area
-2.0x10⁵
0.0
2.0x10⁵
4.0x10⁵
6.0x10⁵
8.0x10⁵
1.0x10⁶
1.2x10⁶
1.4x10⁶
1.6x10⁶
0.00 20.00 40.00 60.00 80.00 100.00 120.00 140.00 160.00 180.00 200.00
R2 = 0.99999
Concentration (µg/mL)
cohumulone
Area
-100000
0
100000
200000
300000
400000
500000
600000
0.00 10.00 20.00 30.00 40.00 50.00 60.00 70.00
Area
-100000
0
100000
200000
300000
400000
500000
600000
700000
800000
900000
0.00 10.00 20.00 30.00 40.00 50.00 60.00 70.00 80.00 90.00 100.00 110.00
Area
-40000.0
-20000.0
0.0
20000.0
40000.0
60000.0
80000.0
100000.0
120000.0
140000.0
160000.0
180000.0
200000.0
220000.0
0.00 2.00 4.00 6.00 8.00 10.00 12.00 14.00 16.00 18.00 20.00 22.00 24.00 26.00 28.00
Area
0
100000
200000
300000
400000
500000
0.00 10.00 20.00 30.00 40.00 50.00 60.00 70.00 80.00 90.00
Area
-100000
0
100000
200000
300000
400000
500000
600000
700000
800000
0.00 20.00 40.00 60.00 80.00 100.00 120.00 140.00
Area
-40000.0
-20000.0
0.0
20000.0
40000.0
60000.0
80000.0
100000.0
120000.0
140000.0
160000.0
180000.0
200000.0
220000.0
240000.0
0.00 5.00 10.00 15.00 20.00 25.00 30.00 35.00 40.00 45.00
Area
-2.0x10⁵
0.0
2.0x10⁵
4.0x10⁵
6.0x10⁵
8.0x10⁵
1.0x10⁶
1.2x10⁶
1.4x10⁶
1.6x10⁶
0.00 50.00 100.00 150.00 200.00 250.00
Area
-2.0x10⁵
0.0
2.0x10⁵
4.0x10⁵
6.0x10⁵
8.0x10⁵
1.0x10⁶
1.2x10⁶
1.4x10⁶
1.6x10⁶
0.00 20.00 40.00 60.00 80.00 100.00 120.00 140.00 160.00 180.00 200.00
R2 = 0.99999
Concentration (µg/mL)
humulone
Area
-100000
0
100000
200000
300000
400000
500000
600000
0.00 10.00 20.00 30.00 40.00 50.00 60.00 70.00
Area
-100000
0
100000
200000
300000
400000
500000
600000
700000
800000
900000
0.00 10.00 20.00 30.00 40.00 50.00 60.00 70.00 80.00 90.00 100.00 110.00
Area
-40000.0
-20000.0
0.0
20000.0
40000.0
60000.0
80000.0
100000.0
120000.0
140000.0
160000.0
180000.0
200000.0
220000.0
0.00 2.00 4.00 6.00 8.00 10.00 12.00 14.00 16.00 18.00 20.00 22.00 24.00 26.00 28.00
Area
0
100000
200000
300000
400000
500000
0.00 10.00 20.00 30.00 40.00 50.00 60.00 70.00 80.00 90.00
Area
-100000
0
100000
200000
300000
400000
500000
600000
700000
800000
0.00 20.00 40.00 60.00 80.00 100.00 120.00 140.00
Area
-40000.0
-20000.0
0.0
20000.0
40000.0
60000.0
80000.0
100000.0
120000.0
140000.0
160000.0
180000.0
200000.0
220000.0
240000.0
0.00 5.00 10.00 15.00 20.00 25.00 30.00 35.00 40.00 45.00
Area
-2.0x10⁵
0.0
2.0x10⁵
4.0x10⁵
6.0x10⁵
8.0x10⁵
1.0x10⁶
1.2x10⁶
1.4x10⁶
1.6x10⁶
0.00 50.00 100.00 150.00 200.00 250.00
Area
-2.0x10⁵
0.0
2.0x10⁵
4.0x10⁵
6.0x10⁵
8.0x10⁵
1.0x10⁶
1.2x10⁶
1.4x10⁶
1.6x10⁶
0.00 20.00 40.00 60.00 80.00 100.00 120.00 140.00 160.00 180.00 200.00
R2 = 0.99998
Concentration (µg/mL)
adhumulone
5
Table 4 presents the estimated limits of quantitation and detection (LOQ, LOD) for all tested α-acids and iso-α-acids. These limits were derived using the signal-to-noise (s/n) results obtained during calibration, using an average of three replicates per level.
As can be seen, the LODs and LOQs for the three iso-α-acids are quite similar. Also, they are over twice as low as those of the three α-acids.
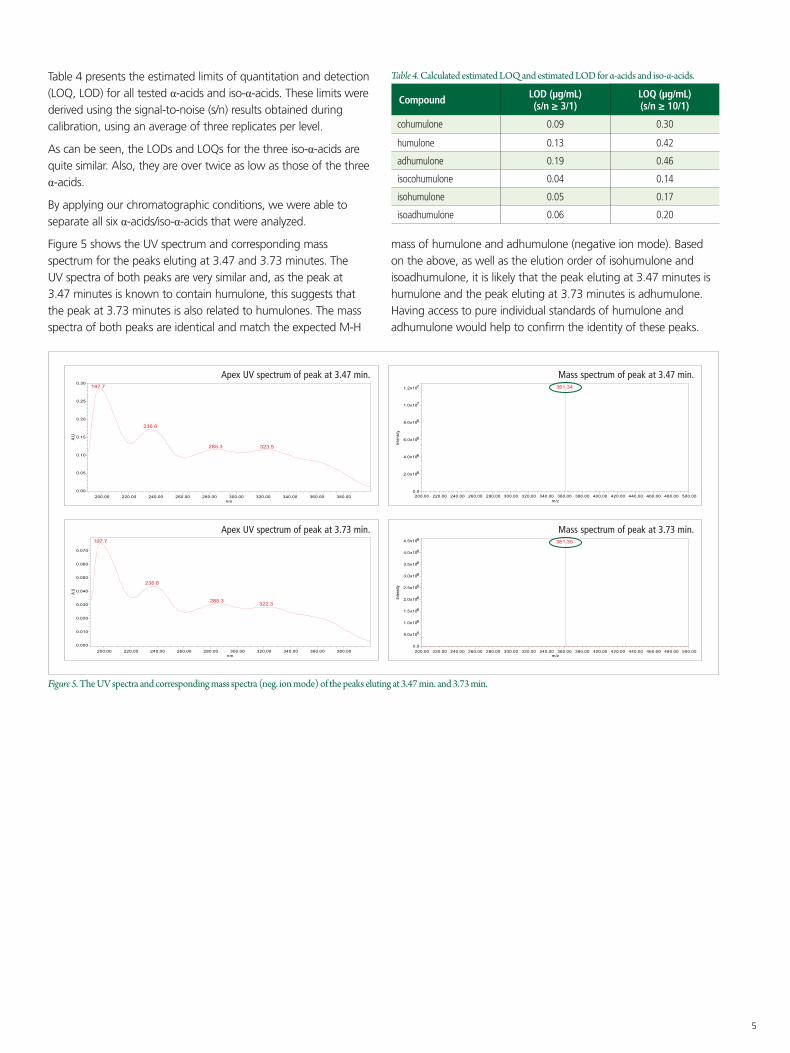
By applying our chromatographic conditions, we were able to separate all six α-acids/iso-α-acids that were analyzed.
Figure 5 shows the UV spectrum and corresponding mass spectrum for the peaks eluting at 3.47 and 3.73 minutes. The UV spectra of both peaks are very similar and, as the peak at 3.47 minutes is known to contain humulone, this suggests that the peak at 3.73 minutes is also related to humulones. The mass spectra of both peaks are identical and match the expected M-H
Table 4. Calculated estimated LOQ and estimated LOD for α-acids and iso-α-acids.
Compound LOD (µg/mL) (s/n ≥ 3/1)
LOQ (µg/mL) (s/n ≥ 10/1)
cohumulone 0.09 0.30
humulone 0.13 0.42
adhumulone 0.19 0.46
isocohumulone 0.04 0.14
isohumulone 0.05 0.17
isoadhumulone 0.06 0.20
mass of humulone and adhumulone (negative ion mode). Based on the above, as well as the elution order of isohumulone and isoadhumulone, it is likely that the peak eluting at 3.47 minutes is humulone and the peak eluting at 3.73 minutes is adhumulone. Having access to pure individual standards of humulone and adhumulone would help to confirm the identity of these peaks.
Figure 5. The UV spectra and corresponding mass spectra (neg. ion mode) of the peaks eluting at 3.47 min. and 3.73 min.
197.7
236.6
284.1 322.3
AU
0.00
0.02
0.04
0.06
0.08
0.10
0.12
0.14
0.16
0.18
0.20
0.22
nm200.00 220.00 240.00 260.00 280.00 300.00 320.00 340.00 360.00 380.00
197.7
236.6
285.3 323.5
AU
0.00
0.05
0.10
0.15
0.20
0.25
0.30
nm200.00 220.00 240.00 260.00 280.00 300.00 320.00 340.00 360.00 380.00
197.7
236.6
285.3322.3
AU
0.000
0.010
0.020
0.030
0.040
0.050
0.060
0.070
nm200.00 220.00 240.00 260.00 280.00 300.00 320.00 340.00 360.00 380.00
Apex UV spectrum of peak at 3.47 min.
197.7
236.6
284.1 322.3
AU
0.00
0.02
0.04
0.06
0.08
0.10
0.12
0.14
0.16
0.18
0.20
0.22
nm200.00 220.00 240.00 260.00 280.00 300.00 320.00 340.00 360.00 380.00
197.7
236.6
285.3 323.5
AU
0.00
0.05
0.10
0.15
0.20
0.25
0.30
nm200.00 220.00 240.00 260.00 280.00 300.00 320.00 340.00 360.00 380.00
197.7
236.6
285.3322.3
AU
0.000
0.010
0.020
0.030
0.040
0.050
0.060
0.070
nm200.00 220.00 240.00 260.00 280.00 300.00 320.00 340.00 360.00 380.00
Apex UV spectrum of peak at 3.73 min.
347.29
Intensity
0.0
2.0x10 6
4.0x10 6
6.0x10 6
8.0x10 6
1.0x10 7
m/z200.00 220.00 240.00 260.00 280.00 300.00 320.00 340.00 360.00 380.00 400.00 420.00 440.00 460.00 480.00 500.00
361.34
Intensity
0.0
2.0x10⁶
4.0x10⁶
6.0x10⁶
8.0x10⁶
1.0x10⁷
1.2x10⁷
m/z200.00 220.00 240.00 260.00 280.00 300.00 320.00 340.00 360.00 380.00 400.00 420.00 440.00 460.00 480.00 500.00
361.35
Intensity
0.0
5.0x10⁵
1.0x10⁶
1.5x10⁶
2.0x10⁶
2.5x10⁶
3.0x10⁶
3.5x10⁶
4.0x10⁶
4.5x10⁶
m/z200.00 220.00 240.00 260.00 280.00 300.00 320.00 340.00 360.00 380.00 400.00 420.00 440.00 460.00 480.00 500.00
Mass spectrum of peak at 3.47 min.
347.29
Intensity
0.0
2.0x10 6
4.0x10 6
6.0x10 6
8.0x10 6
1.0x10 7
m/z200.00 220.00 240.00 260.00 280.00 300.00 320.00 340.00 360.00 380.00 400.00 420.00 440.00 460.00 480.00 500.00
361.34Intensity
0.0
2.0x10⁶
4.0x10⁶
6.0x10⁶
8.0x10⁶
1.0x10⁷
1.2x10⁷
m/z200.00 220.00 240.00 260.00 280.00 300.00 320.00 340.00 360.00 380.00 400.00 420.00 440.00 460.00 480.00 500.00
361.35
Intensity
0.0
5.0x10⁵
1.0x10⁶
1.5x10⁶
2.0x10⁶
2.5x10⁶
3.0x10⁶
3.5x10⁶
4.0x10⁶
4.5x10⁶
m/z200.00 220.00 240.00 260.00 280.00 300.00 320.00 340.00 360.00 380.00 400.00 420.00 440.00 460.00 480.00 500.00
Mass spectrum of peak at 3.73 min.
6
Figure 6. Chromatograms of the three analyzed hop species.
AU
0.00
0.05
0.10
0.15
0.20
0.25
0.30
0.35
0.40
0.45
0.50
Minutes0.00 0.50 1.00 1.50 2.00 2.50 3.00 3.50 4.00 4.50 5.00 5.50 6.00
AU
0.00
0.10
0.20
0.30
0.40
0.50
0.60
0.70
0.80
0.90
1.00
1.10
Minutes0.00 0.50 1.00 1.50 2.00 2.50 3.00 3.50 4.00 4.50 5.00 5.50 6.00
AU
0.00
0.05
0.10
0.15
0.20
0.25
0.30
0.35
0.40
0.45
0.50
Minutes0.00 0.50 1.00 1.50 2.00 2.50 3.00 3.50 4.00 4.50 5.00 5.50 6.00
AU
0.00
0.05
0.10
0.15
0.20
0.25
0.30
0.35
0.40
0.45
0.50
Minutes0.00 0.50 1.00 1.50 2.00 2.50 3.00 3.50 4.00 4.50 5.00 5.50 6.00
AU
0.00
0.10
0.20
0.30
0.40
0.50
0.60
0.70
0.80
0.90
1.00
1.10
Minutes0.00 0.50 1.00 1.50 2.00 2.50 3.00 3.50 4.00 4.50 5.00 5.50 6.00
AU
0.00
0.05
0.10
0.15
0.20
0.25
0.30
0.35
0.40
0.45
0.50
Minutes0.00 0.50 1.00 1.50 2.00 2.50 3.00 3.50 4.00 4.50 5.00 5.50 6.00
iso-h
umul
one
iso-a
dhum
ulon
e
cohu
mul
one
hum
ulon
ead
hum
ulon
e
iso-h
umul
one
isoad
hum
ulon
e
cohu
mul
one
hum
ulon
e
adhu
mul
one
iso-c
ohum
ulon
e
iso-h
umul
one
iso-a
dhum
ulon
e
cohu
mul
one
hum
ulon
e
adhu
mul
one
GALAXY
SIMCOE
EAST KENT GOLDINGS
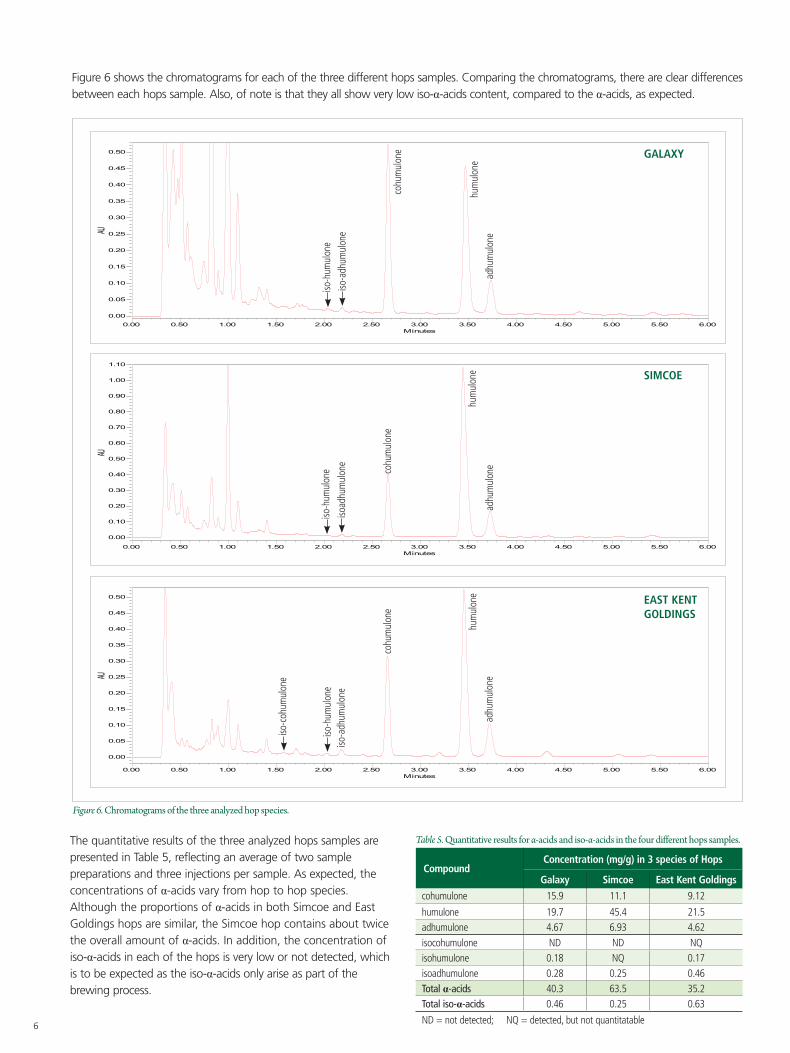
Figure 6 shows the chromatograms for each of the three different hops samples. Comparing the chromatograms, there are clear differences between each hops sample. Also, of note is that they all show very low iso-α-acids content, compared to the α-acids, as expected.
The quantitative results of the three analyzed hops samples are presented in Table 5, reflecting an average of two sample preparations and three injections per sample. As expected, the concentrations of α-acids vary from hop to hop species. Although the proportions of α-acids in both Simcoe and East Goldings hops are similar, the Simcoe hop contains about twice the overall amount of α-acids. In addition, the concentration of iso-α-acids in each of the hops is very low or not detected, which is to be expected as the iso-α-acids only arise as part of the brewing process.
Table 5. Quantitative results for α-acids and iso-α-acids in the four different hops samples.
CompoundConcentration (mg/g) in 3 species of Hops
Galaxy Simcoe East Kent Goldings
cohumulone 15.9 11.1 9.12
humulone 19.7 45.4 21.5adhumulone 4.67 6.93 4.62isocohumulone ND ND NQisohumulone 0.18 NQ 0.17isoadhumulone 0.28 0.25 0.46Total α-acids 40.3 63.5 35.2Total iso-α-acids 0.46 0.25 0.63
ND = not detected; NQ = detected, but not quantitatable
7
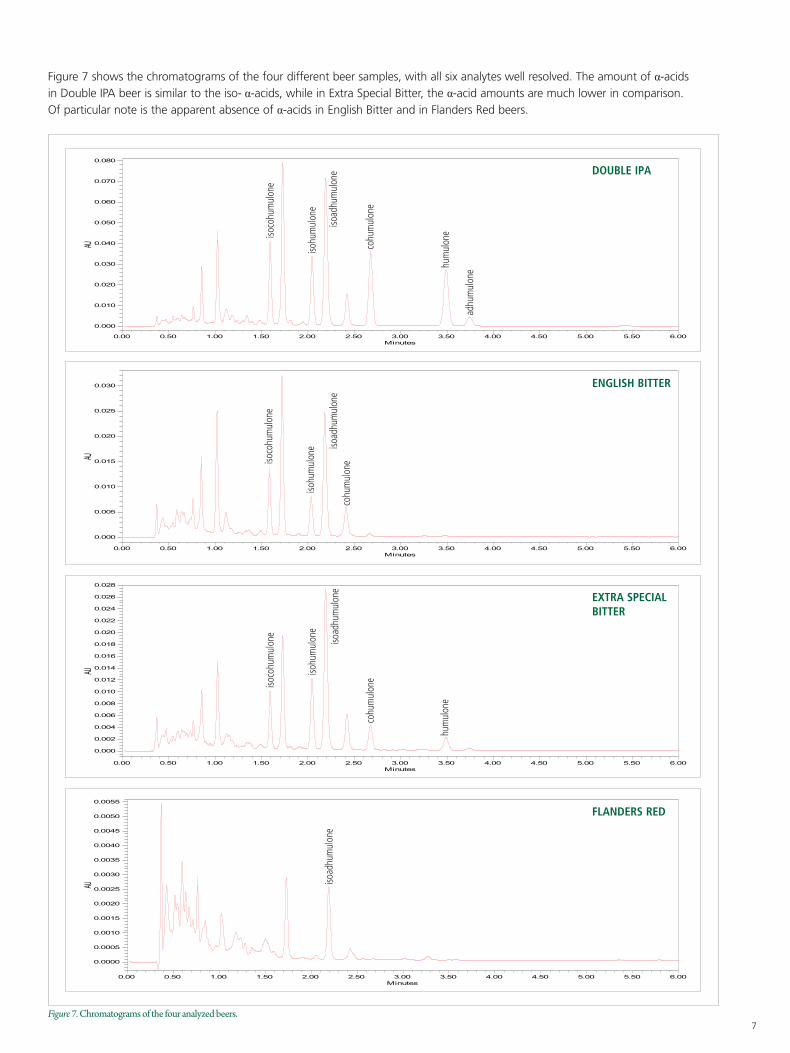
Figure 7 shows the chromatograms of the four different beer samples, with all six analytes well resolved. The amount of α-acids in Double IPA beer is similar to the iso- α-acids, while in Extra Special Bitter, the α-acid amounts are much lower in comparison. Of particular note is the apparent absence of α-acids in English Bitter and in Flanders Red beers.
Figure 7. Chromatograms of the four analyzed beers.
isoco
hum
ulon
e
isohu
mul
one
isoad
hum
ulon
e
cohu
mul
one
hum
ulon
e
adhu
mul
one
AU
0.000
0.010
0.020
0.030
0.040
0.050
0.060
0.070
0.080
Minutes0.00 0.50 1.00 1.50 2.00 2.50 3.00 3.50 4.00 4.50 5.00 5.50 6.00
AU
0.000
0.005
0.010
0.015
0.020
0.025
0.030
Minutes0.00 0.50 1.00 1.50 2.00 2.50 3.00 3.50 4.00 4.50 5.00 5.50 6.00
AU
0.000
0.002
0.004
0.006
0.008
0.010
0.012
0.014
0.016
0.018
0.020
0.022
0.024
0.026
0.028
Minutes0.00 0.50 1.00 1.50 2.00 2.50 3.00 3.50 4.00 4.50 5.00 5.50 6.00
AU
0.0000
0.0005
0.0010
0.0015
0.0020
0.0025
0.0030
0.0035
0.0040
0.0045
0.0050
0.0055
Minutes0.00 0.50 1.00 1.50 2.00 2.50 3.00 3.50 4.00 4.50 5.00 5.50 6.00
DOUBLE IPA
AU
0.000
0.010
0.020
0.030
0.040
0.050
0.060
0.070
0.080
Minutes0.00 0.50 1.00 1.50 2.00 2.50 3.00 3.50 4.00 4.50 5.00 5.50 6.00
AU
0.000
0.005
0.010
0.015
0.020
0.025
0.030
Minutes0.00 0.50 1.00 1.50 2.00 2.50 3.00 3.50 4.00 4.50 5.00 5.50 6.00
AU
0.000
0.002
0.004
0.006
0.008
0.010
0.012
0.014
0.016
0.018
0.020
0.022
0.024
0.026
0.028
Minutes0.00 0.50 1.00 1.50 2.00 2.50 3.00 3.50 4.00 4.50 5.00 5.50 6.00
AU
0.0000
0.0005
0.0010
0.0015
0.0020
0.0025
0.0030
0.0035
0.0040
0.0045
0.0050
0.0055
Minutes0.00 0.50 1.00 1.50 2.00 2.50 3.00 3.50 4.00 4.50 5.00 5.50 6.00
ENGLISH BITTER
isoco
hum
ulon
e
isohu
mul
one iso
adhu
mul
one
cohu
mul
one
AU
0.000
0.010
0.020
0.030
0.040
0.050
0.060
0.070
0.080
Minutes0.00 0.50 1.00 1.50 2.00 2.50 3.00 3.50 4.00 4.50 5.00 5.50 6.00
AU
0.000
0.005
0.010
0.015
0.020
0.025
0.030
Minutes0.00 0.50 1.00 1.50 2.00 2.50 3.00 3.50 4.00 4.50 5.00 5.50 6.00
AU
0.000
0.002
0.004
0.006
0.008
0.010
0.012
0.014
0.016
0.018
0.020
0.022
0.024
0.026
0.028
Minutes0.00 0.50 1.00 1.50 2.00 2.50 3.00 3.50 4.00 4.50 5.00 5.50 6.00
AU
0.0000
0.0005
0.0010
0.0015
0.0020
0.0025
0.0030
0.0035
0.0040
0.0045
0.0050
0.0055
Minutes0.00 0.50 1.00 1.50 2.00 2.50 3.00 3.50 4.00 4.50 5.00 5.50 6.00
EXTRA SPECIAL BITTER
isoco
hum
ulon
e
isohu
mul
one
isoad
hum
ulon
e
cohu
mul
one
hum
ulon
e
AU
0.000
0.010
0.020
0.030
0.040
0.050
0.060
0.070
0.080
Minutes0.00 0.50 1.00 1.50 2.00 2.50 3.00 3.50 4.00 4.50 5.00 5.50 6.00
AU
0.000
0.005
0.010
0.015
0.020
0.025
0.030
Minutes0.00 0.50 1.00 1.50 2.00 2.50 3.00 3.50 4.00 4.50 5.00 5.50 6.00
AU
0.000
0.002
0.004
0.006
0.008
0.010
0.012
0.014
0.016
0.018
0.020
0.022
0.024
0.026
0.028
Minutes0.00 0.50 1.00 1.50 2.00 2.50 3.00 3.50 4.00 4.50 5.00 5.50 6.00
AU
0.0000
0.0005
0.0010
0.0015
0.0020
0.0025
0.0030
0.0035
0.0040
0.0045
0.0050
0.0055
Minutes0.00 0.50 1.00 1.50 2.00 2.50 3.00 3.50 4.00 4.50 5.00 5.50 6.00
FLANDERS RED
isoad
hum
ulon
e
For a complete listing of our global offices, visit www.perkinelmer.com/ContactUs
Copyright ©2015, PerkinElmer, Inc. All rights reserved. PerkinElmer® is a registered trademark of PerkinElmer, Inc. All other trademarks are the property of their respective owners. 012326_01 PKI
PerkinElmer, Inc. 940 Winter Street Waltham, MA 02451 USA P: (800) 762-4000 or (+1) 203-925-4602www.perkinelmer.com
Conclusion
The results obtained confirm the applicability of this method for the efficient, routine, and robust chromatographic analysis of the six investigated α-acids including their isomers. All compounds are completely separated in under six minutes by UHPLC® using UV detection. The results showed excellent retention time repeatability as well as exceptional linearity over the tested concentration ranges. Thereupon and considering the very lower LOQ levels for these α-acids and their corresponding isomers, this application can be considered very effective for the monitoring of these acids during beer production.
References
1. [Online]. Available: https://en.wikipedia.org/wiki/Alpha_acid. [Accessed 12 06 2015].
2. International Calibration Standards, American Society of Brewing Chemist, 2009.
3. ASBC, Method of Analysis of the American Society of Brewing Chemists, St. Paul: American Society of Brewing Chemists, 1996.
4. The Technical Committee and the Editorial Committee of the ASBC, "Iso-a-, a-, and b-acids in Hop extracts and isomerized Hop extracts by HPLC," in Methods of Analysis of the American Society of Brewing Chemists, St. Paul, American Society of Brewing Chemists, 2009, pp. 1-4, chapter Hops-16.
5. S. Hieronymus, For the Love of Hops. The practical Guide to Aroma, Bitterness and the Culture of Hops, Boulder: Brewers Publications, 2012
Table 6. Quantitative results for α-acids and iso-α-acids in four different beers.
CompoundEnglish Bitter Double IPA Extra Special
BitterFlanders Red
2014
µg/mL µg/mL µg/mL µg/mL
cohumulone NQ 5.51 0.66 ND
humulone ND 5.90 0.50 NDadhumulone ND 1.02 ND NDisocohumulone 0.90 2.94 0.74 NDisohumulone 0.69 3.00 1.13 NDisoadhumulone 2.03 6.94 2.57 0.23Total α-acids ND 12.4 1.16 NDTotal iso-α-acids 3.62 12.9 4.44 0.23
NQ = detected, but not quantitatable; ND = not detected
The results for the analysis of the four tested beers are presented in Table 6 and reflect an average of two sample preparations and three injections per sample. The concentration and proportion of α-acids and iso-α-acids differ markedly from beer to beer. Compared to the concentrations found in hops, the concentrations of iso-α-acids are much higher. This was to be expected, as these acids increase markedly during the brewing process.5