Embed Size (px)
Citation preview
The Puzzles and Contradictions of Development Policy and Finance….
…and what it means for international ‘donorship’ and governance
Kanni WignarajaUN RC/UNDP REP, ZAMBIA
September, 2013,
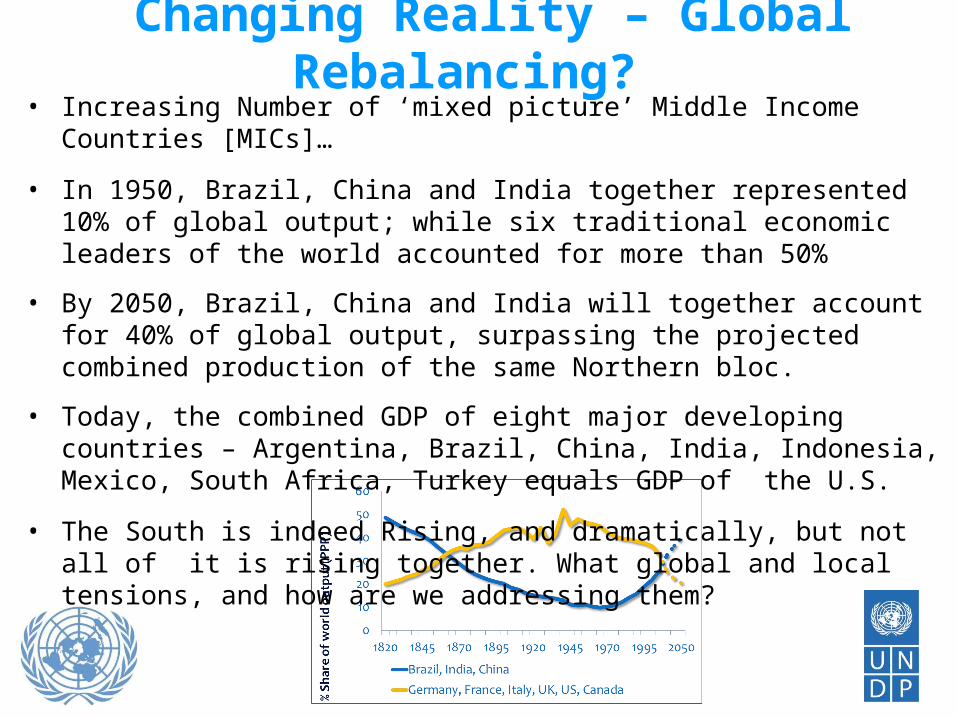
Changing Reality – Global Rebalancing? • Increasing Number of ‘mixed picture’ Middle Income Countries [MICs]…
• In 1950, Brazil, China and India together represented 10% of global output; while six traditional economic leaders of the world accounted for more than 50%
• By 2050, Brazil, China and India will together account for 40% of global output, surpassing the projected combined production of the same Northern bloc.
• Today, the combined GDP of eight major developing countries – Argentina, Brazil, China, India, Indonesia, Mexico, South Africa, Turkey equals GDP of the U.S.
• The South is indeed Rising, and dramatically, but not all of it is rising together. What global and local tensions, and how are we addressing them?
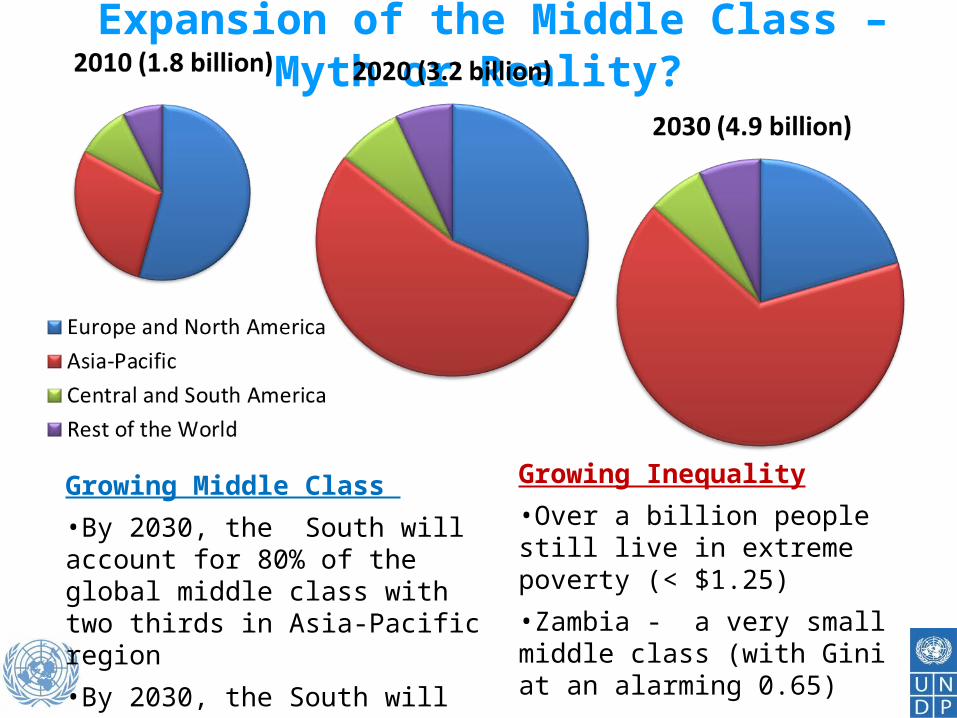
Expansion of the Middle Class – Myth or Reality?
Growing Middle Class •By 2030, the South will account for 80% of the global middle class with two thirds in Asia-Pacific region•By 2030, the South will account for 70% of the global total consumption expenditure
Growing Inequality•Over a billion people still live in extreme poverty (< $1.25)•Zambia - a very small middle class (with Gini at an alarming 0.65)
Economic Growth Story
•Robust and resilient economic growth rates (overall annual growth rates averaging 5.2 %)
•Second fastest growing region, globally
•Economic growth accompanied by falling inflation rates, from average inflation rates of 22% in the 1990s to around 8% in 2010
•Rising annual labour productivity rates of around 2.7%
•Trade between Africa and the rest of the world increased 200 % between 2000 and 2010
•Reduced external debt and budget deficits – sound macro economic management
Contrasting and Confusing Development: with Africa as Illustration
Human Development Story
•75% of SSA countries are in the low human development group
•Very high inequality accounting for an average loss of human development of 35%
•Over 25% or close to 218 million people in Africa are undernourished
•150,000 women in Africa continue to die at childbirth each year
•12 out of 100 children in Africa die before their fifth birthday
•A third of children in Africa between the ages of 5 and 14 are child labourers
What Makes for this Puzzling Scenario of Global Convergence with Local Divergence
• Is it fundamentals or legacy?
• Is it the nature and capacity of leaders and institutions?
• Is it world demand for copper/oil/minerals?
• Is it the peace dividend?
• Is it knowledge and technology driven leap-frogging?
So what works for more just, balanced and sustainable progress?
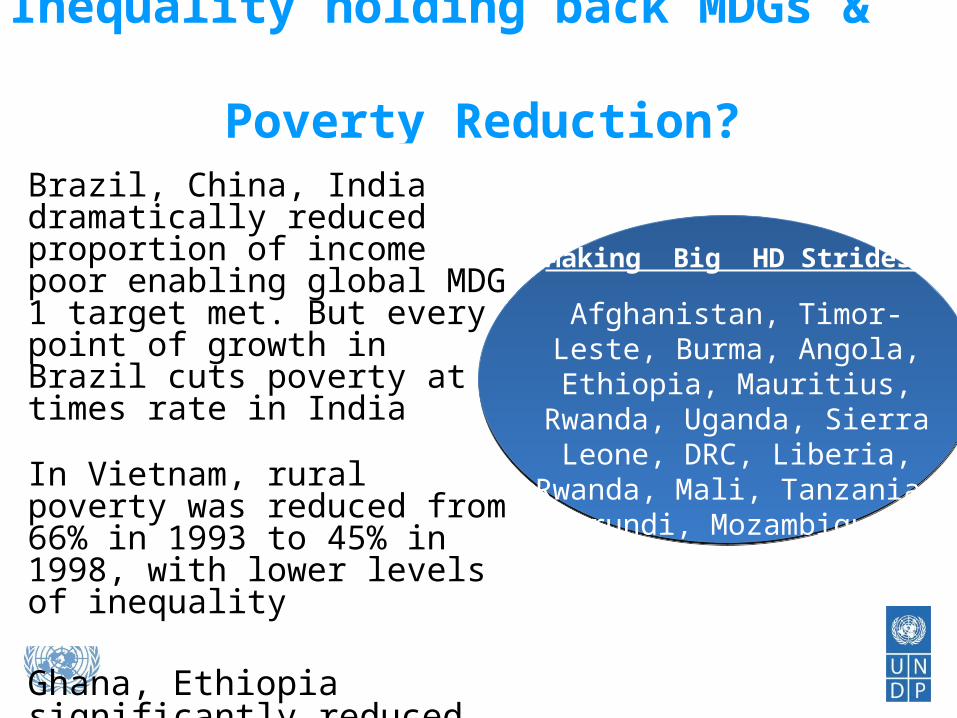
Inequality holding back MDGs & Poverty Reduction?
Brazil, China, India dramatically reduced proportion of income poor enabling global MDG 1 target met. But every point of growth in Brazil cuts poverty at 5 times rate in India
In Vietnam, rural poverty was reduced from 66% in 1993 to 45% in 1998, with lower levels of inequality
Ghana, Ethiopia significantly reduced both inequality and poverty
Making Big HD Strides
Afghanistan, Timor-Leste, Burma, Angola, Ethiopia,
Mauritius, Rwanda, Uganda, Sierra Leone, DRC, Liberia,
Rwanda, Mali, Tanzania, Burundi, Mozambique, Niger
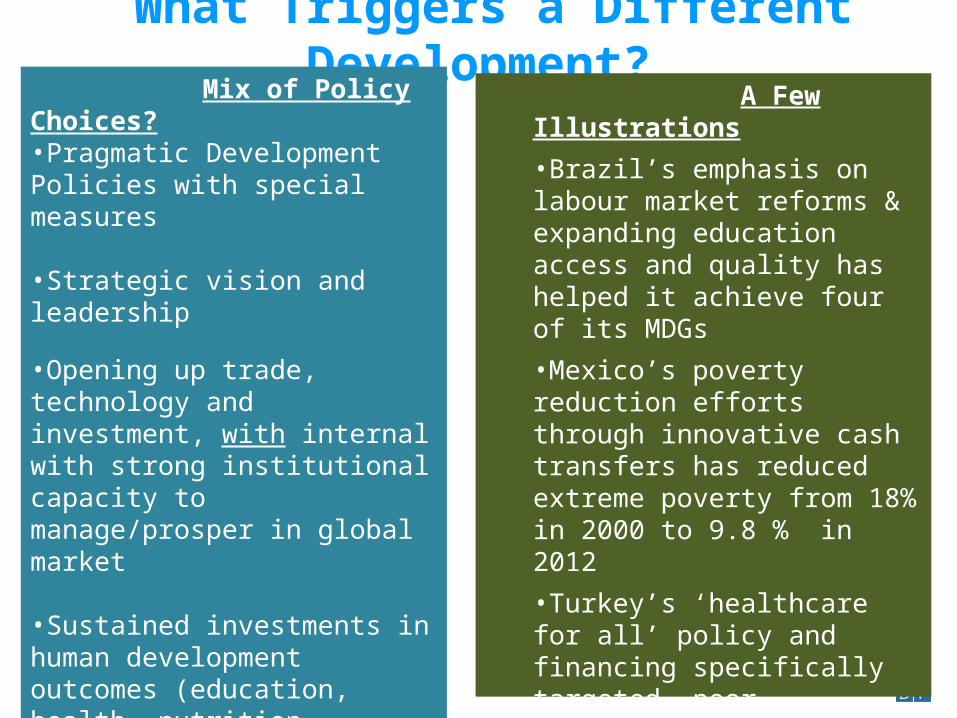
What Triggers a Different Development? A Few Illustrations
•Brazil’s emphasis on labour market reforms & expanding education access and quality has helped it achieve four of its MDGs
•Mexico’s poverty reduction efforts through innovative cash transfers has reduced extreme poverty from 18% in 2000 to 9.8 % in 2012
•Turkey’s ‘healthcare for all’ policy and financing specifically targeted poor households
•Use of affordable technology and investing in R&D and innovation has industry and services sector in India. By 2011, 8 of the world’s biggest corporations on the Fortune 500 list were from India.
Mix of Policy Choices?•Pragmatic Development Policies with special measures
•Strategic vision and leadership
•Opening up trade, technology and investment, with internal with strong institutional capacity to manage/prosper in global market
•Sustained investments in human development outcomes (education, health, nutrition, water/sanitation)
•Social security schemes not as add-on, but as human capital and social cohesion investment
•The capacity to deliver development programmes
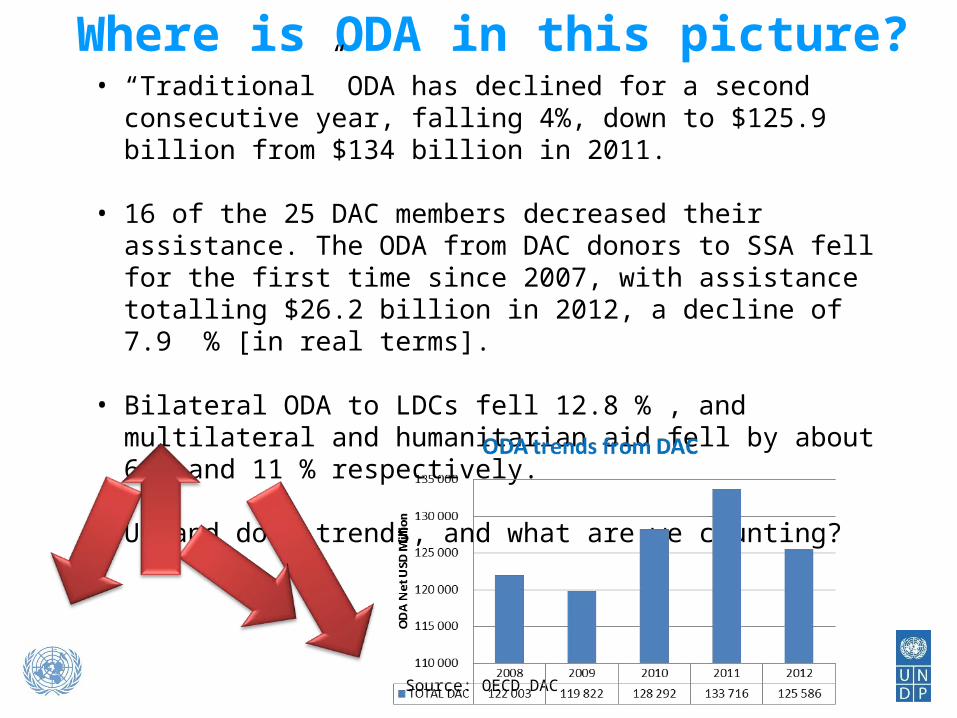
Where is ODA in this picture?• “Traditional” ODA has declined for a second consecutive year,
falling 4%, down to $125.9 billion from $134 billion in 2011.
• 16 of the 25 DAC members decreased their assistance. The ODA from DAC donors to SSA fell for the first time since 2007, with assistance totalling $26.2 billion in 2012, a decline of 7.9 % [in real terms].
• Bilateral ODA to LDCs fell 12.8 % , and multilateral and humanitarian aid fell by about 6 % and 11 % respectively.
• Up and down trends, and what are we counting?
Source: OECD DAC
The Changing Face of ODA
Source: OECD DAC
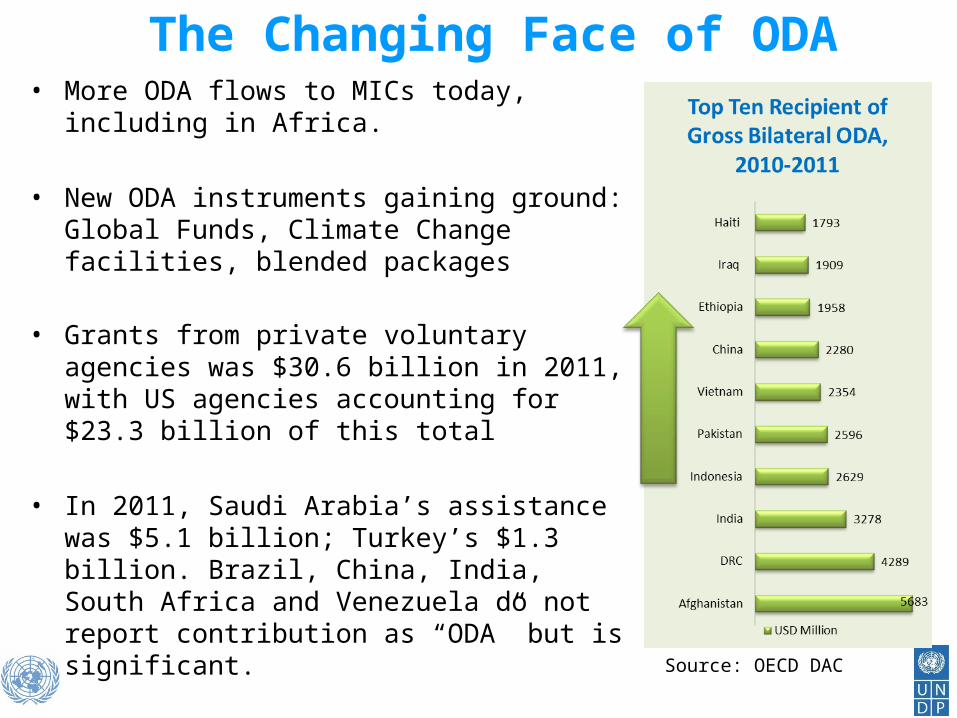
• More ODA flows to MICs today, including in Africa.
• New ODA instruments gaining ground: Global Funds, Climate Change facilities, blended packages
• Grants from private voluntary agencies was $30.6 billion in 2011, with US agencies accounting for $23.3 billion of this total
• In 2011, Saudi Arabia’s assistance was $5.1 billion; Turkey’s $1.3 billion. Brazil, China, India, South Africa and Venezuela do not report contribution as “ODA” but is significant.
• Bilateral ODA increased slightly [1% in 2012]. Several countries, including EU members, increased aid in 2012 ; some met the UN target of 0.7 per cent
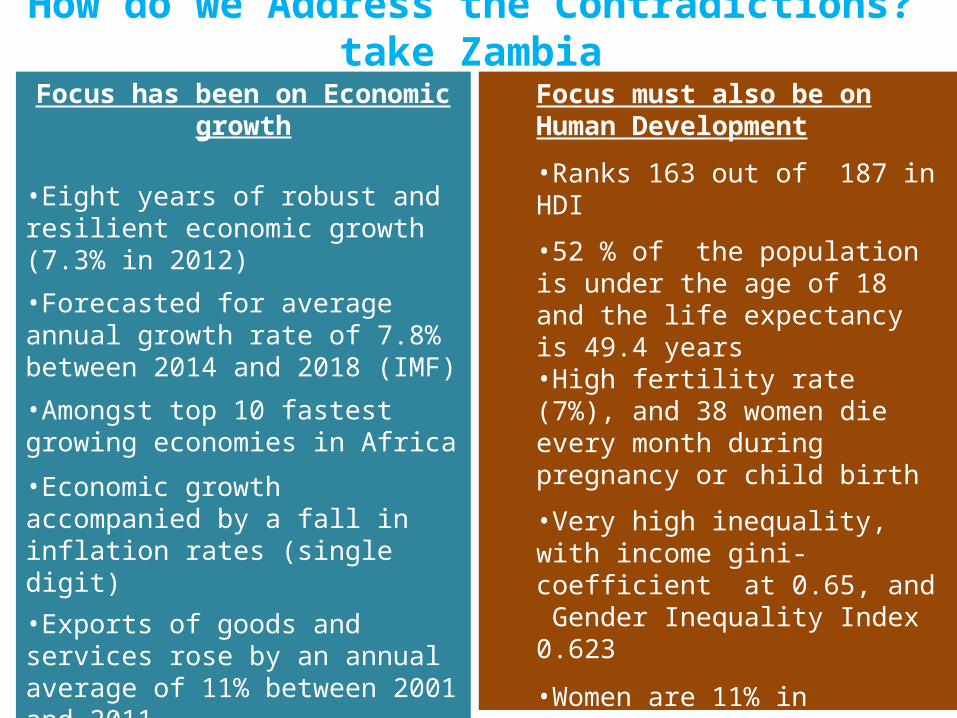
Focus has been on Economic growth
•Eight years of robust and resilient economic growth (7.3% in 2012)
•Forecasted for average annual growth rate of 7.8% between 2014 and 2018 (IMF)
•Amongst top 10 fastest growing economies in Africa
•Economic growth accompanied by a fall in inflation rates (single digit)
•Exports of goods and services rose by an annual average of 11% between 2001 and 2011
•Non-traditional exports have quadrupled from US$392 million in 2003 to US$1,608 million in 2011
How do we Address the Contradictions? take Zambia
Focus must also be on Human Development
•Ranks 163 out of 187 in HDI
•52 % of the population is under the age of 18 and the life expectancy is 49.4 years •High fertility rate (7%), and 38 women die every month during pregnancy or child birth
•Very high inequality, with income gini-coefficient at 0.65, and Gender Inequality Index 0.623
•Women are 11% in parliament
•42% live in extreme poverty (rural)
•Primary school drop out rate is 47 %. Two-thirds of those in primary do not complete secondary school
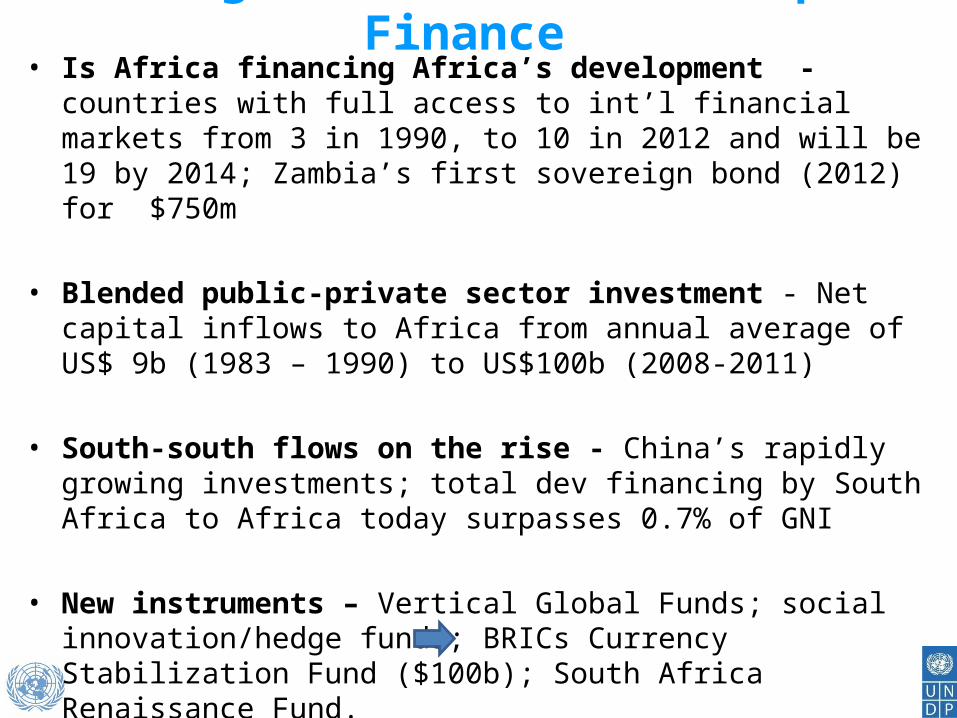
Shifting Patterns in Development Finance
• Is Africa financing Africa’s development - countries with full access to int’l financial markets from 3 in 1990, to 10 in 2012 and will be 19 by 2014; Zambia’s first sovereign bond (2012) for $750m
• Blended public-private sector investment - Net capital inflows to Africa from annual average of US$ 9b (1983 – 1990) to US$100b (2008-2011)
• South-south flows on the rise - China’s rapidly growing investments; total dev financing by South Africa to Africa today surpasses 0.7% of GNI
• New instruments – Vertical Global Funds; social innovation/hedge funds; BRICs Currency Stabilization Fund ($100b); South Africa Renaissance Fund.
And ODA? To target the gaps; seed innovation; invest in national capacities focus on the Inequality and Rights
agenda to get to the MDGs and Human Dev
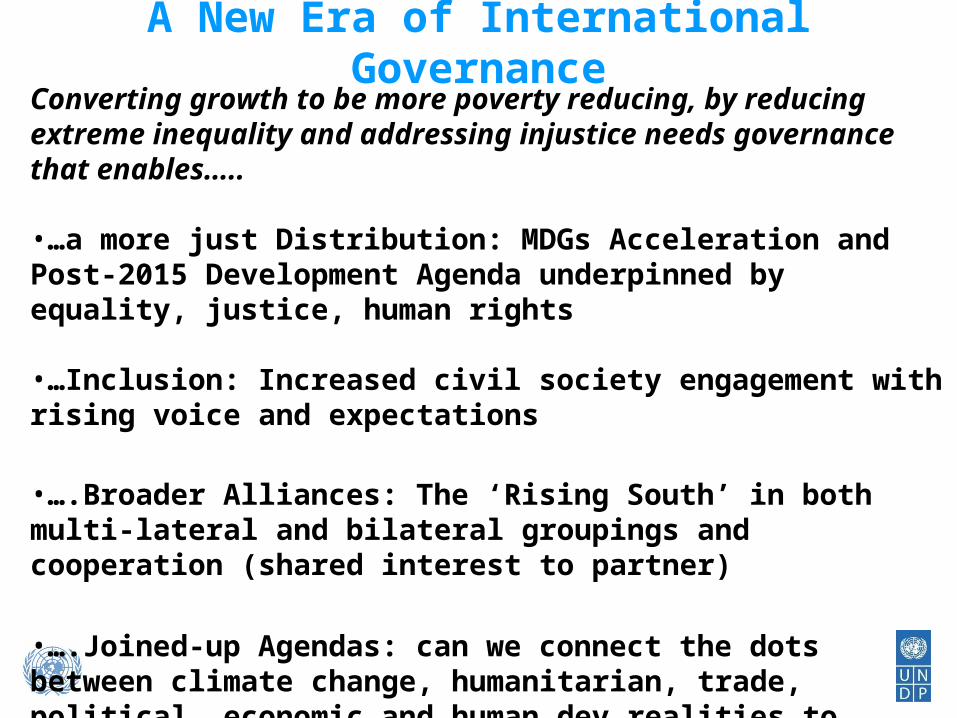
A New Era of International GovernanceConverting growth to be more poverty reducing, by reducing extreme inequality and addressing injustice needs governance that enables…..
•…a more just Distribution: MDGs Acceleration and Post-2015 Development Agenda underpinned by equality, justice, human rights
•…Inclusion: Increased civil society engagement with rising voice and expectations
•….Broader Alliances: The ‘Rising South’ in both multi-lateral and bilateral groupings and cooperation (shared interest to partner)
•….Joined-up Agendas: can we connect the dots between climate change, humanitarian, trade, political, economic and human dev realities to better address global and local vulnerabilities and shocks?
Going that tough Last Mile……
THANK YOU