Embed Size (px)
Citation preview
1
Regional Inequalities on Health Services Supply: an analysis for Brazil, 2002*
Cristina Guimarães Rodrigues1
Pedro Vasconcelos Maia do Amaral2
Rodrigo Ferreira Simões3
ABSTRACT
Since the 1988 Constitution, the Brazilian health sector functions as a unified system. The main alteration was the decentralization of the federative responsibilities, which made the municipalities the principal supplier and administrator of the health services. This occurred as a means to identify the real necessities of the population in order to homogenize the spatial distribution of health services. The objective of this work is to identify and analyze the urban network of health services supply in the Brazilian macro regions with municipal data. The theoretical framework used in the analyses of the health services distribution is based on the Central Place Theory. The basic assumption is that the services supply distribution responds to a spatial network of sub-regional hierarchical urban centers, with prevalence of systems composed of first order central places and other urban centers that are hierarchically inferior. In order to do this we utilized the Pesquisa de Assistência Médico-Sanitária (Medical-Sanitary Assistance Survey) database from IBGE (Brazilian Institute of Geography and Statistics), from the year of 2002, which has data about equipments, facilities and human resources in the public and private spheres of the health system. The identification of the urban network of health services was obtained with the use of Cluster Analysis. Subsequently, these results were statistically tested with the Spatial Analysis (LISA) technique and Spatial Econometrics. It was verified that the urban network of health services in Brazil was at the same time not inclusive, overlapped, widely unequal in the regional distribution and concentrated in the South and Southeast Regions of Brazil, beyond what would be expected by economic and population aspects. The obtained results not only describe the hierarchical network of health services supply, but also can aid governmental actions at the planning level for health policies in Brazil.
INTRODUCTION
The provision of health services in developing countries is characterized by large
regional disparities. In Brazil, barriers to the use of medical services are frequently observed,
despite the fact that the Brazilian 1988 Constitution declares such services as a right that
should be equally accessible to all citizens. These barriers are imposed, among other factors,
by the lack of availability of basic and specialized health services to the majority of the
population.
* This work is part of the project “Urban Networks on Health Services: a spatial analysis of the public health system in Brazil”, funded by Brazilian National Scientific and Technological Development Council (CNPq). 1 Ph.D. Candidate in Demography at Centre for Regional and Development Planning (CEDEPLAR) at the Federal University of Minas Gerais, Brazil. 2 M.A. Candidate in Economics at Centre for Regional and Development Planning (CEDEPLAR) at the Federal University of Minas Gerais, Brazil. 3 Professor of Centre for Regional and Development Planning (CEDEPLAR) at the Federal University of Minas Gerais – Brazil.
2
The geographical distribution of productive capacity in health is another important
constraint in the access to these services, given that the distance between the location of
supply and of demand imposes additional difficulties in the use of the services.
Understanding all the spatial dimensions involved in the prevention and treatment of illnesses
may provide us with adequate planning possibilities on this issue, especially for less
developed regions where health costs are relatively higher for a population facing poor living
conditions.
This paper intends to analyze the spatial distribution of health services supply in the
Brazilian macro-regions in 2002. The remainder of the paper has six sections, besides this
introduction. Next section discusses the process of decentralization of health services since
the creation of the Unique Health System4 (SUS); section three provides the theoretical
background to understand the question of services supply; section four introduces the
database and presents a descriptive analysis of the variables; section five discusses the
methodology of multivariate analysis; section six shows the main results and, finally, the last
section presents the conclusions of the paper.
DECENTRALIZATION AND REGIONALIZATION OF HEALTH SERVICES IN
THE UNIQUE HEALTH SYSTEM (SUS)
The Brazilian 1988 Constitution has created the Unique Health System (SUS) aiming
to reduce inequalities in the supply of health services, by providing adequate access to these
services at no cost to the population5. The SUS establishes that the access to health services is
to be guaranteed to all citizens, with full coverage of medical needs and equal treatment to
people with equal needs. Its organizational principles are decentralization, regionalization and
hierarchy of services, as well as community participation. It intends to promote the
decentralization of the health system at the local level, both in the management and funding
of the services, aiming to adjust the model of assistance to the real medical needs of the
population by bringing the solution of the problems to the same regions where they occur
(Andrade, 2002).
The process of decentralization and regionalization of health services has gradually
developed over time with the implementation of government policies, the so-called 4 SUS stands for Sistema Único de Saúde (Unique Health System), and is the system through which most of the health services are provided by the government. 5 However, SUS was only regulated two years after its creation, with the Leis Orgânicas da Saúde nº 8.080/90 e nº 8.142/90
3
NOB/SUS (Basic Operational Norms of SUS), aiming at regulating and defining strategies
for the efficient operation of the system. The negotiation of aspects relating to health services
are made by the Bipartite Management Commission (composed by members from
municipalities and states) and Tripartite Management Commission (with members from
local, state and federal governments). Such commissions are responsible for formulating
strategies to consolidate the SUS and integrate all levels of government.
Since the beginning of the 1990s there have been several attempts to transfer duties
related to the health system to the municipalities. The norms NOB/SUS 01/91 and NOB/SUS
01/92 had emphasized the importance of decentralizing the actions and services of the health
system, but only after norm NOB 01/93 such process of decentralization has actually taken
place. Norm NOB 01/93 has defined the conditions under which the municipalities would
qualify for the receipt of resources from the National Health Fund (Fundo Nacional de
Saúde) and has identified criteria according to the various management conditions (incipient,
partial, semi-full). Due to difficulties in managing the services, norm NOB/SUS 01/96 has
been established in 1996 aiming to define the conditions for managing services at local6 and
state7 levels. This norm, which is still ruling nowadays, has allowed a rapid expansion of the
network of medical services at the local level. In this case, mangers at state and federal levels
are co-responsible for the provision of health services.
The Operational Norm of Health Assistance (NOAS/SUS 2001) has been established
in 2001 in order to promote regional health care centres and to avoid inefficiencies in the
provision of services in each municipality. In this norm, the focus has changed from
atomization of services (locally) to optimization of services (regionally). NOAS/SUS 2001
has established a Regionalization Guiding Plan8 – henceforth PDR – which proposes to
organize the health care system at regional level, under the coordination of a state manager.
That norm aims to identify the roles of the municipalities in the state health system and to
tackle inequalities in the provision of services. In order to do so, it defines a set of actions to
be taken by all municipalities regarding basic health care and supports the creation of
regional units, able to fulfil the medical needs of a larger population according to its
geographical location.
NOAS/SUS 2001 has provided greater flexibility in dealing with regional health care
issues, because the PDR has been created in accordance with the epidemiological, sanitary,
6 Gestão da Atenção Básica e Gestão Plena do Sistema Municipal de Saúde 7 Gestão Avançada e Gestão Plena do Sistema Estadual 8 Plano Diretor de Regionalização
4
geographical and social specificities of each state, as well as the particular conditions
regarding the access to health services in each region. However, serious problems in the
management and funding of the system still persist, despite the efforts to promote and
facilitate the provision of all kinds of health services to the population. As Cordeiro (2001:
324) puts it, The atomization of the network of services, due to the increase in the
number of small towns (ten to twenty thousand inhabitants) represents
a political and administrative difficulty for a regionalized and
hierarchical system. The agreement between federal, state, and local
governments, which was already complex in the Brazilian federation,
has become even more complicated for the implementation of SUS,
given that the Lei Orgânica da Saúde has defined five administrative
levels for the SUS (federal, state, regional, municipal, and district
levels), with political and financial autonomy for the management to
health subsystems at each level.
In addition, according to Souza (2001), the funding of SUS depends to a certain
degree on the productive capacity of the health system in each region, which is sometimes not
in accordance with the real needs of the population. Therefore, despite the intents to
guarantee universal and equal health care to the entire population under the rules guiding the
creation of SUS, it is important to check on the spatial distribution of these services in terms
of physical and human infrastructure, in order to identify the inequalities that persist between
regions in Brazil.
URBAN NETWORK AND CENTRALITY
The provision of health care is composed by basic services, which are used frequently
and have lower costs, and by complex services which are subject to economies of scale,
because they involve higher technology and lower spatial density of demand. For this reason,
the distribution of health services supply is spatially differentiated. As pointed out by Vlahov
& Gálea (2002:37),
(...) social service systems in cities often provide a far wider range of services than
are available in smaller cities or in non-urban areas. Although use of these services
may be limited by sparse staffing and by difficult, complicated access, their

5
availability in cities suggests that resources may already exist in many urban
contexts that can contribute to well-being.
Given the existence of such differentiation and such complexity in the supply of
health services, it is necessary to search for theoretical elements to interpret this issue. In this
case, the Central Place Theory (CPT) and its contemporary developments seem to provide a
valuable theoretical benchmark to the analysis of the spatial distribution of health services.
Despite the restrictive assumptions of the original model (such as uniform population density,
equal transport costs, equal consumer preferences, equal income distribution), its basic
concepts of threshold and range can help us in the general understanding of urban networks
in the supply of services.
The Central Place Theory, developed by Christäller (1933, 1966), is based on the
principle of centrality and considers the space to be organized around a main urban core,
called central place. The complementary region, or hinterland, presents a relation of co-
dependency with the main core, since this is the locus of supply of goods and services that are
urban in nature.
The main role of an urban core is to be a centre of services to its immediate
hinterland, by providing essential goods and services. These, in turn, have different features,
and generate a hierarchy of urban cores according to the services provided. There are two key
concepts to understand CPT: i) threshold, defined as the minimum level of demand necessary
to promote the supply of a good or service, which reflects the economies of scale in the
production of the service as well as the urban agglomeration economies; and ii) range,
defined as the maximum distance the consumer is willing to move in order to access a given
good or service, and which varies with the complexity of the service.
Therefore, the critical limit may be represented as the smallest concentric circle that
justifies the supply of a good or service, and the reach may be described as the largest
concentric circle that forms the complementary region of the central place and defines its area
of influence. The limits of such area of influence are given by the existence of another area of
influence of another centre of similar or higher hierarchy. The size of this exterior circle
varies according to the different goods and services that are supplied, and the demand in its
interior varies inversely with the distance to the urban core.
The model intends to demonstrate that the sizes of the areas of influence of each
central place depend directly to the size and hierarchy of the centres, being the periphery of
smaller centres included in the complementary regions of larger ones. The largest the

6
centrality of a central place, the largest is its hinterland, i.e., the largest the complexity of the
services provided, the largest is the area influenced by this centre. According to Regales
(1992), the areas of influence of centres of different sizes overlap according to the complexity
(hierarchy) of the services supplied, building up urban networks of supply of complementary
and interdependent services. Ullman (1970) stresses that the distribution of central places and
its areas of influence are not static, and that investment and economic development change
the spatial distribution in the supply of services. Richardson (1969) points up that CPT has
limits to its applicability due to its extremely restrictive assumption of a uniform distribution
of purchasing power, and given that not all areas receive adequate supply of all services
demanded.
Despite the limitations of CPT (Berry et al., 1988; Eswaran & Ware, 1986; Gusein-
Zade, 1993; Harwitz & Lentnek, 1973; Keane, 1989; Parr, 1978, 1995, 1997; South & Boots,
1999; Thill, 1992), we agree with Richardson (1969:167) when he states that “(…) no other
theory emphasizes so much the interdependence between a city and the region where it is
located.”
In addition, Berry et al. (1988) maintains that in many occasions the services are used
very rarely, resulting in a not optimal situation. This argument can be considered given the
fact that the supply of health services does not have the same frequency as its utilization. That
is to say, emergency services do not present the same spatial frequency as non-emergency
services. More than this, there are periodic services that follow identified epidemiologic
patterns, but there are also unforeseen and sporadic demands that would justify the supply of
complex services without reaching the critical limit that would validate it. From this
perspective, a decentralized network of distribution of such demands is extremely necessary
in order to optimize the system of provision (Berry et al., 1988).
This argument would be valid for regions in which the distribution of a given service
is efficient, i.e., where the services supplied are sufficient for the demands of the region. The
complementarities and interdependencies in the supply of complex services, as described by
the original model and its extensions, can explain some specific processes regarding services
that are public in nature, such as health care, especially in the case of developed countries. In
the case of peripheral countries such as Brazil – which has a very unequal income
distribution, presents regional imbalances in terms of physical, economic and social
infrastructure, shows an erratic pattern of social public spending and has a State that
deliberately disregard planning at all levels – the notions of complementarities and
interdependence in the supply of services are harder to define and describe. That is to say,
7
what we usually find are gaps and juxtapositions in the Brazilian urban network – or else
redundancies and absences – that are expressed in many aspects, including the health care
system.
What one would expect for the case of Brazil is an incomplete urban network, with
strong spatial concentration in the main metropolitan centres and their extended surroundings,
an incipient capillarity in the South-Southeast region, and a large gap in the Centre-North-
Northeast portions of the country. This is the pattern that the paper intends to describe and
analyze. Such would be the first step for the identification of unsatisfied needs and for the
development of public policies towards provision of adequate and equal health care services
in the entire country.
DATABASE AND DESCRIPTION OF VARIABLES
The information in this paper comes from the Pesquisa de Assistência Médico-
Sanitária (AMS)9 from 2002. AMS is a national research disaggregated at local level which
collects information on physical infrastructure and human resources in health services in
Brazil, as well as services supporting diagnosis, treatment and control of diseases. The
research includes all health care facilities, both public and private, which provide medical
services to individuals and communities.
Using this information, it is possible to analyze the spatial distribution of health
services at all levels. The empirical analysis provides information for the formulation of
public policies in regard to the health system, aiming at reducing the deficiencies in health
care for large parts of the population.
The variables used in this study were grouped in two categories: physical
infrastructure and human resources. The former includes equipments, from the simplest to the
most complex ones, and health care facilities in general. The latter comprises workers in the
health system, with different qualifications – elementary, middle, high schools, and higher
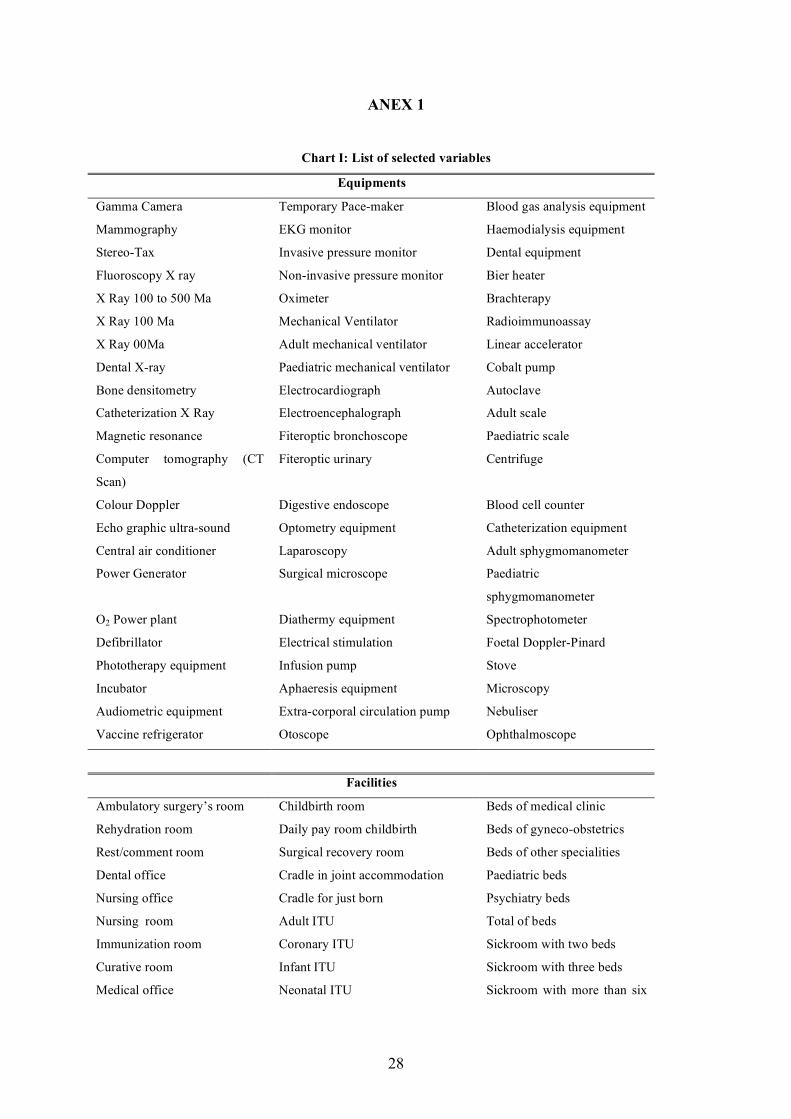
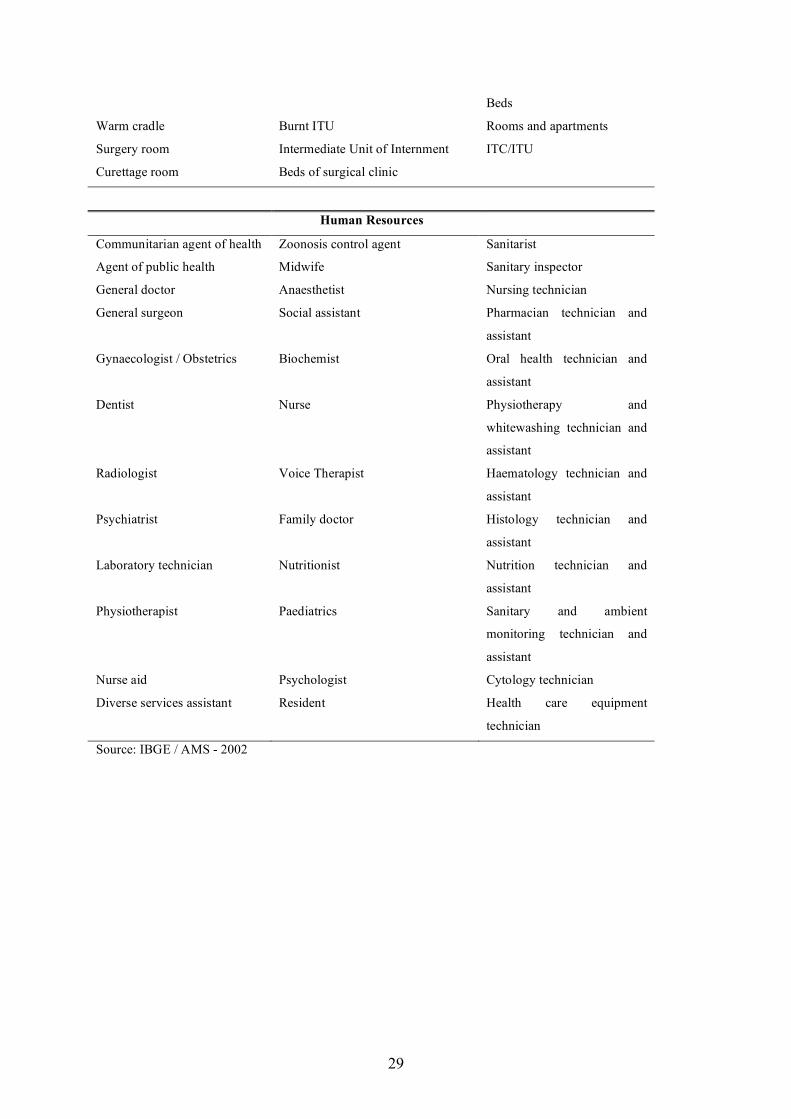
education10. In this paper we utilized 66 variables of equipments, 34 variables of physical
facilities and 36 variables of human resources11. Next subsection presents the main socio-
demographic features of the Brazilian regions, followed by a preliminary analysis of some of
the main variables discussed. 9 Stands for Research on Medical and Sanitary Care. 10 However, the number of persons working in all the facilities is not a precise indicator of the amount of workers in a given municipality, since a person can work in more than one facility. 11 The complete list of variables is on ANEX 1.

8
Brief socio-demographic characterization of the Brazilian macro-regions
The political-administrative division of Brazil comprises the macro-regions North,
Northeast, Southeast, South, and Centre-West. These regions present clear differences
regarding socio-economic and demographic aspects. According to Carvalho and Wood
(1994: 9): The understanding of regional differences is crucial for the study of
population and development in Brazil. The division in five macro-
regions: North, Northeast, Southeast, South, and Centre-West, provides
a broad perspective on the most important features of the Brazilian
spatial diversity.
Such differences are based on the history of development of the country, whose
regional configuration is characterized by poor linkages among the regions, inherited from
the colonial and slavery periods. The concentration of production initially occurred in the
Centre-South parts of the country, given the higher development of transportation and
communication systems, and the expansion of agriculture in the South region. From the
1970s on, the agricultural frontier expanded towards the Centre-West and North regions and
the same process happened in some parts of the Northeast region starting from the late 1980s
(Diniz, 1995). This movement of dispersion of production and the expansion in stagnant
regions promote demand for other kinds of activities and services, such as health care,
education, sewage systems etc in these remote localities.
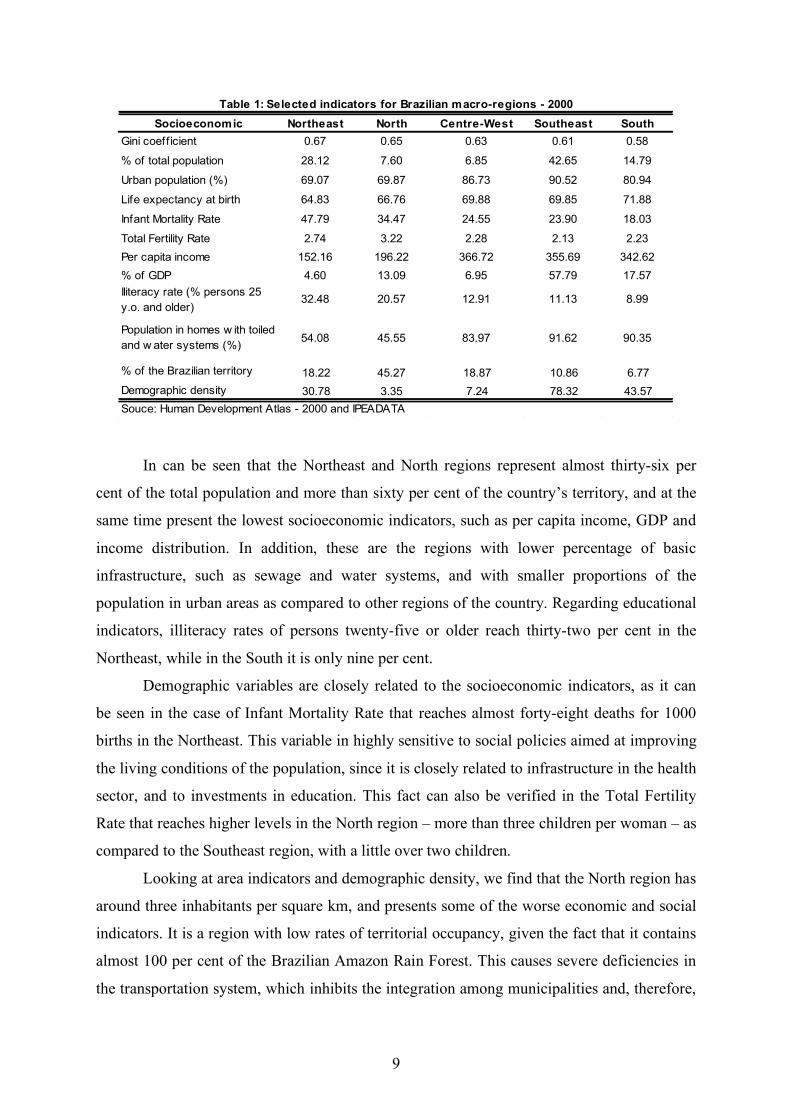
Table 1 presents the main economic and demographic variables, in order to describe
the socio-demographic features of each region.
9
Socioeconomic Northeast North Centre-West Southeast South
Gini coeff icient 0.67 0.65 0.63 0.61 0.58
% of total population 28.12 7.60 6.85 42.65 14.79
Urban population (%) 69.07 69.87 86.73 90.52 80.94
Life expectancy at birth 64.83 66.76 69.88 69.85 71.88
Infant Mortality Rate 47.79 34.47 24.55 23.90 18.03
Total Fertility Rate 2.74 3.22 2.28 2.13 2.23
Per capita income 152.16 196.22 366.72 355.69 342.62
% of GDP 4.60 13.09 6.95 57.79 17.57
Iliteracy rate (% persons 25
y.o. and older)32.48 20.57 12.91 11.13 8.99
Population in homes w ith toiled
and w ater systems (%)54.08 45.55 83.97 91.62 90.35
% of the Brazilian territory 18.22 45.27 18.87 10.86 6.77
Demographic density 30.78 3.35 7.24 78.32 43.57
Souce: Human Development Atlas - 2000 and IPEADATA
Table 1: Selected indicators for Brazilian macro-regions - 2000
In can be seen that the Northeast and North regions represent almost thirty-six per
cent of the total population and more than sixty per cent of the country’s territory, and at the
same time present the lowest socioeconomic indicators, such as per capita income, GDP and
income distribution. In addition, these are the regions with lower percentage of basic
infrastructure, such as sewage and water systems, and with smaller proportions of the
population in urban areas as compared to other regions of the country. Regarding educational
indicators, illiteracy rates of persons twenty-five or older reach thirty-two per cent in the
Northeast, while in the South it is only nine per cent.
Demographic variables are closely related to the socioeconomic indicators, as it can
be seen in the case of Infant Mortality Rate that reaches almost forty-eight deaths for 1000
births in the Northeast. This variable in highly sensitive to social policies aimed at improving
the living conditions of the population, since it is closely related to infrastructure in the health
sector, and to investments in education. This fact can also be verified in the Total Fertility
Rate that reaches higher levels in the North region – more than three children per woman – as
compared to the Southeast region, with a little over two children.
Looking at area indicators and demographic density, we find that the North region has
around three inhabitants per square km, and presents some of the worse economic and social
indicators. It is a region with low rates of territorial occupancy, given the fact that it contains
almost 100 per cent of the Brazilian Amazon Rain Forest. This causes severe deficiencies in
the transportation system, which inhibits the integration among municipalities and, therefore,
10
the accessibility to health services. In this case, it is important to analyze the distribution of
health services, in order to identify the existence of gaps in the supply of these services and,
by doing so, provide information for better planning of policies aiming at the basic needs of
the population.
Descriptive Analysis
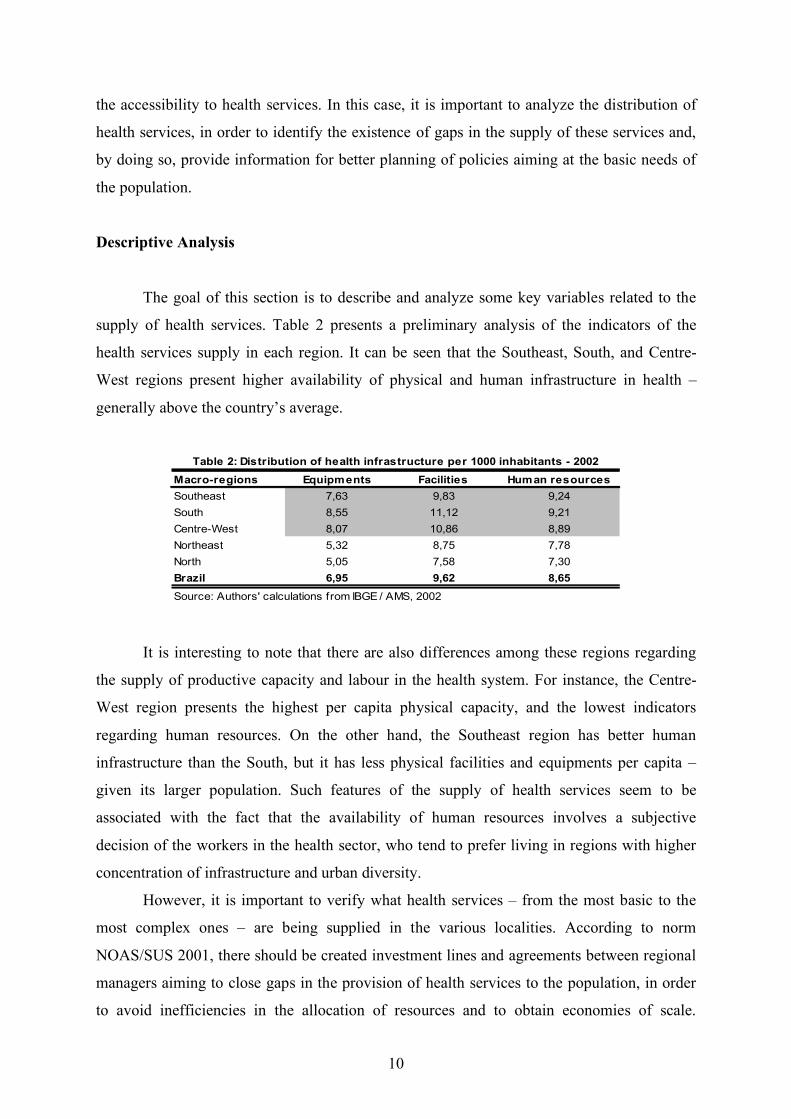
The goal of this section is to describe and analyze some key variables related to the
supply of health services. Table 2 presents a preliminary analysis of the indicators of the
health services supply in each region. It can be seen that the Southeast, South, and Centre-
West regions present higher availability of physical and human infrastructure in health –
generally above the country’s average.
Macro-regions Equipments Facilities Human resources
Southeast 7,63 9,83 9,24
South 8,55 11,12 9,21
Centre-West 8,07 10,86 8,89
Northeast 5,32 8,75 7,78
North 5,05 7,58 7,30
Brazil 6,95 9,62 8,65
Source: Authors' calculations from IBGE / AMS, 2002
Table 2: Distribution of health infrastructure per 1000 inhabitants - 2002
It is interesting to note that there are also differences among these regions regarding
the supply of productive capacity and labour in the health system. For instance, the Centre-
West region presents the highest per capita physical capacity, and the lowest indicators
regarding human resources. On the other hand, the Southeast region has better human
infrastructure than the South, but it has less physical facilities and equipments per capita –
given its larger population. Such features of the supply of health services seem to be
associated with the fact that the availability of human resources involves a subjective
decision of the workers in the health sector, who tend to prefer living in regions with higher
concentration of infrastructure and urban diversity.
However, it is important to verify what health services – from the most basic to the
most complex ones – are being supplied in the various localities. According to norm
NOAS/SUS 2001, there should be created investment lines and agreements between regional
managers aiming to close gaps in the provision of health services to the population, in order
to avoid inefficiencies in the allocation of resources and to obtain economies of scale.
11
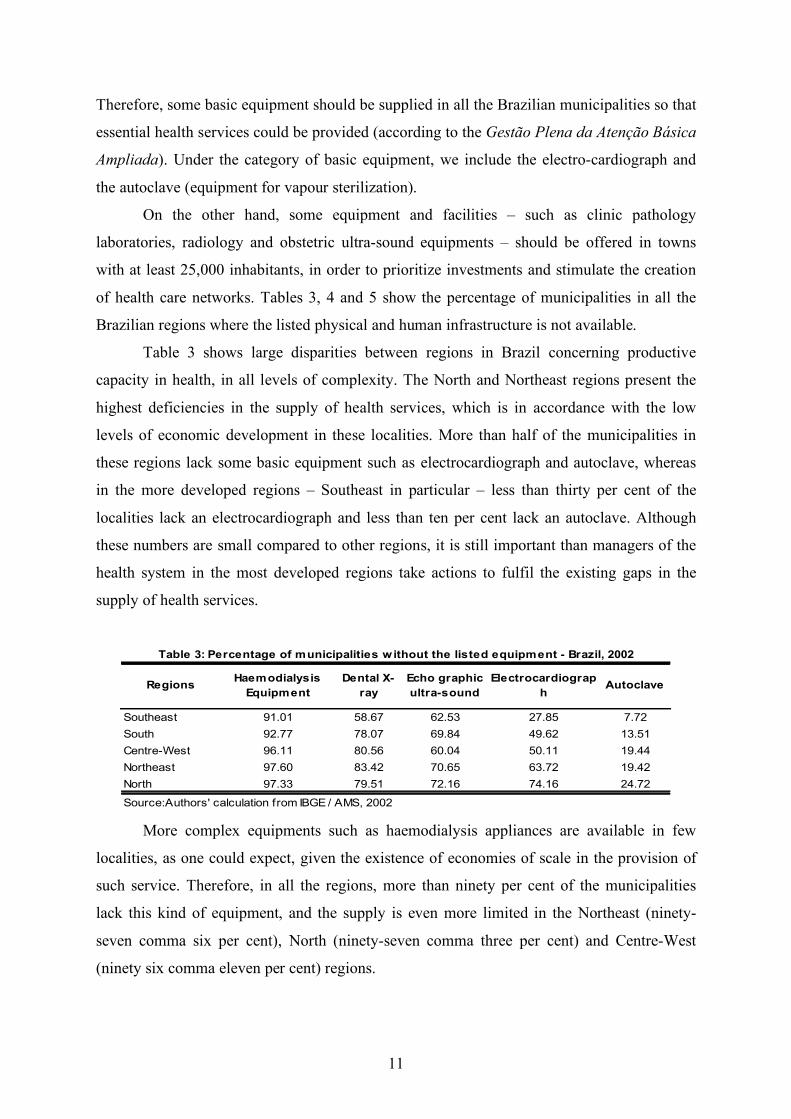
Therefore, some basic equipment should be supplied in all the Brazilian municipalities so that
essential health services could be provided (according to the Gestão Plena da Atenção Básica
Ampliada). Under the category of basic equipment, we include the electro-cardiograph and
the autoclave (equipment for vapour sterilization).
On the other hand, some equipment and facilities – such as clinic pathology
laboratories, radiology and obstetric ultra-sound equipments – should be offered in towns
with at least 25,000 inhabitants, in order to prioritize investments and stimulate the creation
of health care networks. Tables 3, 4 and 5 show the percentage of municipalities in all the
Brazilian regions where the listed physical and human infrastructure is not available.
Table 3 shows large disparities between regions in Brazil concerning productive
capacity in health, in all levels of complexity. The North and Northeast regions present the
highest deficiencies in the supply of health services, which is in accordance with the low
levels of economic development in these localities. More than half of the municipalities in
these regions lack some basic equipment such as electrocardiograph and autoclave, whereas
in the more developed regions – Southeast in particular – less than thirty per cent of the
localities lack an electrocardiograph and less than ten per cent lack an autoclave. Although
these numbers are small compared to other regions, it is still important than managers of the
health system in the most developed regions take actions to fulfil the existing gaps in the
supply of health services.
RegionsHaemodialysis
Equipment
Dental X-
ray
Echo graphic
ultra-sound
Electrocardiograp
hAutoclave
Southeast 91.01 58.67 62.53 27.85 7.72
South 92.77 78.07 69.84 49.62 13.51
Centre-West 96.11 80.56 60.04 50.11 19.44
Northeast 97.60 83.42 70.65 63.72 19.42
North 97.33 79.51 72.16 74.16 24.72
Source:Authors' calculation from IBGE / AMS, 2002
Table 3: Percentage of municipalities w ithout the listed equipment - Brazil, 2002
More complex equipments such as haemodialysis appliances are available in few
localities, as one could expect, given the existence of economies of scale in the provision of
such service. Therefore, in all the regions, more than ninety per cent of the municipalities
lack this kind of equipment, and the supply is even more limited in the Northeast (ninety-
seven comma six per cent), North (ninety-seven comma three per cent) and Centre-West
(ninety six comma eleven per cent) regions.

12
Regions ITU Surgery roomPaediatric
bedsDental office Medical office
Southeast 85.51 36.83 47.47 5.95 1.14
South 90.31 36.36 39.76 5.18 1.95
Centre-West 92.44 31.97 39.09 10.37 3.67
Northeast 95.65 45.42 41.07 10.21 0.95
North 95.10 44.54 42.54 17.81 3.34
Source: Authors' calculation from IBGE / AMS, 2002
Table 4: Percentage of municipalities w ithout the listed facility - Brazil, 2002
The supply of physical facilities shows a similar pattern in terms of the inequalities
between regions and between levels of complexity. A reason for concern refers to the
existence of dental offices in the North, Northeast and Centre-West regions. A little over ten
per cent of the localities in the Centre-West and Northeast do not have any dental offices, and
this percentage rises up to almost eighteen per cent in the North region. We can also see that
the deficiencies are a lot smaller regarding low complexity facilities such as medical offices,
even though its supply is still more deficient in less developed regions. The productive
capacity in highly complex facilities such as ITU is not present in more than ninety per cent
of the localities, except in the case of the Southeast region.
Regions Radiologist Physiotherapist Dentist General doctor Nurse
Southeast 63.25 39.93 6.89 4.74 4.68
South 67.83 56.71 5.43 4.50 5.43
Centre-West 75.16 64.58 9.07 8.21 7.13
Northeast 80.84 75.01 10.76 9.36 4.26
North 84.41 81.29 17.59 12.03 9.35
Source: Authors' calculation from IBGE/AMS, 2002
Table 5: Percentage of localities w ithout the listed health care worker - Brazil, 2002
Table 5 shows the distribution of human resources in health. It is clear that the higher
disparities occur with respect to workers in services of medium complexity, such as
physiotherapist and dentist. Around forty per cent of the municipalities in the Southeast
region lack a physiotherapist, and this percentage increases to over eighty per cent in the
North. The difference is also significant between the Southeast and South regions. On the
other hand, the lower percentage of localities without a dentist can be seen in the South
region (five comma forty-three per cent). Once more, the North region shows great
deficiencies as compared with the other regions, since over seventeen per cent of the
municipalities lack human resources for dental care.

13
This preliminary analysis points out to the existence of clear deficiencies in the supply
of health services in Brazil, despite the efforts towards the fulfilment of the principles of
universality, completeness, and equity, as stated in the legislation. The highest disparities in
the supply of services relate to low complexity physical and human infrastructure. That is,
large part of the municipalities especially in the North and Northeast regions are not able to
fulfil even the most frequent and basic needs of the population, which comprise around
eighty-five per cent of all health care needs in the country (Brazil, 1999). This shows that
problem solving abilities in the health system are very unequal and highly related with the
level of economic and social development of the Brazilian regions. It is clear, therefore, that
there is room for intervention by the health system managers especially regarding the basic
treatment needs of the population.
Although the principle of regionalization states that health care should be offered at
the minimal levels, the demands occur in different levels of assistance. Thus the definition of
hierarchies and the regionalization of the health services represent important instruments in
verifying the ability of the municipalities to offer health services of reference and counter-
reference. Next section presents a multivariate analysis that intends to show how the supply
of services is spatially distributed among the municipalities in Brazilian macro-regions.
METHODOLOGICAL FOUNDATIONS: CLUSTERS AND SPATIAL ANALYSIS
This study applies a non-hierarchic clusters analysis (K-means12) using the software
S-Plus, in order to group the sample of municipalities according to the variables discussed
here. The method uses the simple Euclidian distance, measured according to the differences
between the variables analyzed in each locality, in order to group those with similar
configurations of health services supply and to separate in different groups the localities with
distinct health care structures, up to the point when the internal variance of each class could
no longer be reduced, for a given number of classes.
After classifying the municipalities in specific clusters and viewing the spatial
inequalities in the supply of health services in the Brazilian macro-regions, we proceed to the
Exploratory Spatial Data Analysis (ESDA), aiming to identify the existence or not of
statistically significant spatial patterns at local level (Anselin, 1992, 1995).
12 On this method, see MacQueen (1967).

14
( ) nxm
i
i
2
0 ! "= µ( )
( )! ""
=j
jij
i
i xwm
xI µ
µ
0
One of the most used tests for the detection of global spatial autocorrelation is
Moran’s I. According to Perobelli and Haddad (2003), Moran’s I statistic provides a formal
indication of the linear association between the vector of observed variables and the vector of
weighted averages of their neighbouring values, or the spatial lag. Formally:
(1)
where !!=i j
ijWS0
, xi is the observation in region i, µ is the average observation of the
neighbouring localities, n is the number of neighbours, wij are the elements of the matrix of
spatial weights W, that defines the degree in which the municipalities are classified as
neighbours of each other. The matrix elements indicate how region i is connected to region j.
Different criteria can be used for constructing the matrix of weights, such as adjacency,
distance, inverse distance, k closest neighbours, among others. The stability or consistency of
the results needs to be tested by using different matrices, since the choice of W can affect the
value of Moran’s I statistic. In this study the geographic adjacency is defined by the method
Queen of first order, which identifies as neighbours of a given individual all the bordering
individuals in any direction.
The value of the estimated statistic I needs to be compared to the expected theoretical
value E(I)=-1/(n-1). If the estimated statistic is significantly higher than its expected value,
this suggests the existence of positive spatial autocorrelation in the data. On the other hand, if
the estimated statistic is significantly lower than expected, there is an indication of negative
autocorrelation.
The structure of local spatial autocorrelation can be understood with the use of
specific techniques such as Moran’s dispersion maps and graphs and the LISA (Local
Indicators of Spatial Association) statistics.
According to Gallo and Ertur (2000), the local version of Moran’s I statistic for each
region i is given by:
where (2)
( )( )
( )!
!!
"
""
=
i
i
ji
i j
ij
x
xxw
S
nI
2
0 µ
µµ

15
The local statistics allow the identification of significant agglomerations of (dis)similar
values. In addition, these statistics are useful for the detection of spatial outliers and influent
observations.
The final stage of the spatial analysis consists on the visualization of Moran Maps,
which are divided in four quadrants representing the different types of association:
1. High-High: region presents high value of the variable under analysis, and is
surrounded by a neighbourhood that also has on average a high value of the same
variable;
2. Low-Low: region with low values with a neighbourhood that also presents low
values;
3. Low-High: region with low values, surrounded by regions with high values on
average;
4. High-low: region has high value and its neighbours have low value on average.
RESULTS AND DISCUSSION
Cluster Analysis
This section intends to analyze the clusters of health services supply in Brazil as a
whole. The study presents two separate analysis for clusters of human resources (Chart 1) and
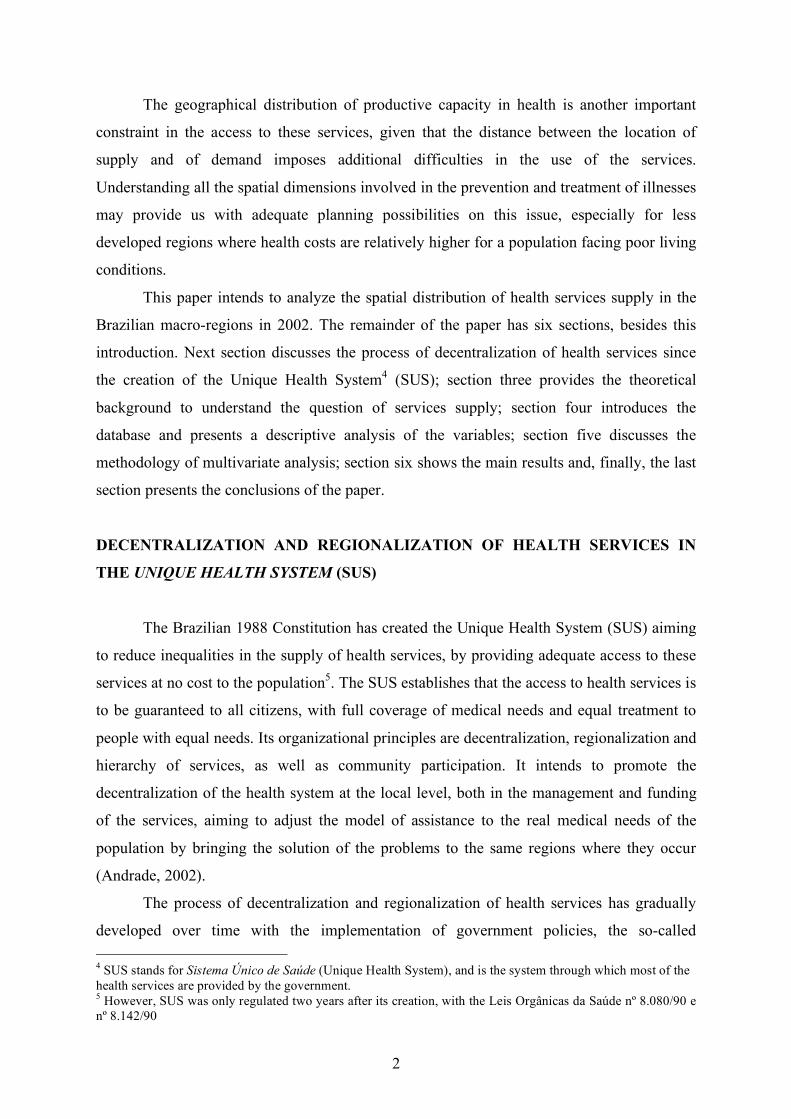
clusters of equipment and facilities (Chart 2). The Brazilian map, with indication of Brazilian
States and its abbreviations is above.

16
Figure 1. Brazilian Administrative Map
NORTH
NORTHEAST
CENTRE-WEST
SOUTHEAST
SOUTH
Roraima (RR)Amapá (AP)
Acre (AC)
Rondônia (RO)
Amazonas (AM)Pará (PA)
Mato Grosso (MT)
Mato Grossodo Sul (MS)
Rio Grandedo Sul (RS)
SantaCatarina (SC)
Paraná (PR) São Paulo (SP)
Rio de Janeiro (RJ)
Espírito Santo (ES)
Minas Gerais (MG)Goiás (GO)
Tocantins(TO)
Bahia (BA)
Sergipe (SE)
Alagoas (AL)
Pernambuco (PE)
Paraíba (PB)
Rio Grandedo Norte (RN)
Ceará (CE)Piauí (PI)
Maranhão (MA)
States
Federal District - Brasília
Regions
The analysis of the supply of health services in general shows that cities of São Paulo
and Rio de Janeiro present clusters hierarchically superior, both in terms of human resources
and equipment/facilities. Such municipalities concentrate the largest productive capacity in
health in Brazil, and are reference points concerning the treatment of certain diseases, as it is
the case of cardiovascular illnesses in São Paulo.
The differentiation of groups begins after cluster three since certain large cities – such
as Fortaleza and Porto Alegre – are not included in cluster three in case of human resources,
but they are included in this same cluster in terms of physical infrastructure. These two cities
are reference points for large geographical areas. In the Northeast region, only two
municipalities are hierarchically superior to Fortaleza in the supply of human resources in
health: Salvador and Recife. Since this region has large territorial extension and over 1790
municipalities, this creates an excess demand in these localities, especially for more complex
services.
Therefore, Fortaleza fulfils part of this deficiency and represents a core of absorption
of demands for specialized health services in the northern parts of the Northeast region,
despite being in a cluster that is hierarchically inferior to Salvador and Recife.

17
Cluster 1
São Paulo (SP - SE) North South-East
Manacapuru (AM) Bauru (SP)
Cluster 2 Belém (PA) Campinas (SP)
Rio de Janeiro (RJ - SE) Guarulhos (SP)
North-East Juiz de Fora (MG)
Cluster 3 Aracaju (SE) Jundiaí (SP)
Belo Horizonte (MG - SE) João Pessoa (PB) Niterói (RJ)
Salvador (BA - NE) Maceió (AL) Osasco (SP)
Recife (PE - NE) Natal (RN) Ribeirão Preto (SP)
Teresina (PI) Santo André (SP)
Cluster 4 São Luiz (MA) Santos (SP)
Brasília (DF - CW) São Bernardo do Campo (SP)
Curitiba (PR - S) Centre-West São Gonçalo (RJ)
Fortaleza (CE - NE) Campo Grande (MS) São José do Rio Preto (SP)
Porto Alegre (RS - S) Cuiabá (MT) São José dos Campos (SP)
Goiânia (GO) Sorocaba (SP)
Cluster 6 Vitória (ES)
All other
South
Florianópolis (SC)
Londrina (PR)
Source: Authors' elaboration from IBGE / AMS - 2002
Chart 1
Clusters of human resources by localities - Brazil, 2002
Cluster 5
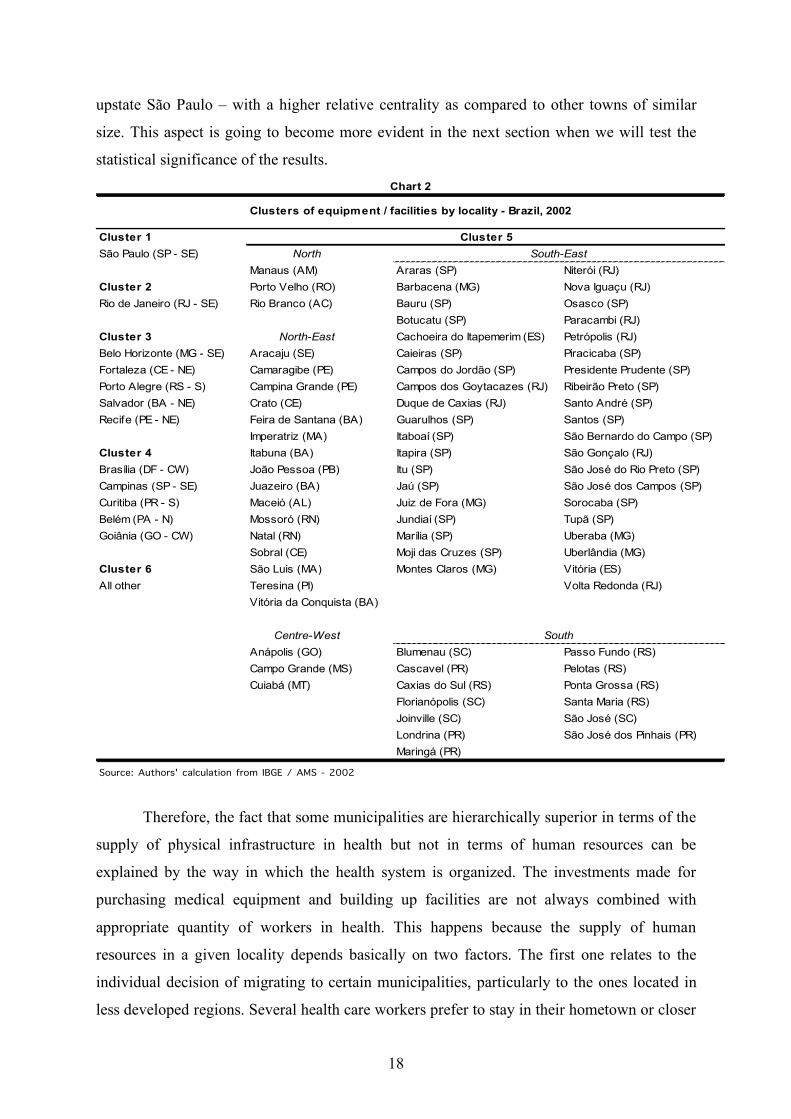
Another important result appears when we compare cluster five in both charts. It can
be seen that there is a significant difference in the quantity of municipalities in this cluster.
The human resources cluster has a smaller number of towns, and some towns are included in
chart 1 but not in chart 2. This is the case of the North region, for instance. Manacapuru and
Belém are included in the human resources cluster, but not in the physical infrastructure
cluster. On the other hand, Manaus, Porto Velho and Rio Branco appear in cluster five in the
case of equipment/facilities but not in case of human resources. This difference depends in
part of the planning strategies of the various state secretaries of health. The Secretary of
Health in the state of Amazonas, for instance, prioritizes the formation of human resources,
aiming at the development and quality improvement of the Family Health Program13. This
depends on coordinated efforts from health managers and research institutions for the
creation of training centres for workers in the health system, such as Oficinas de Educação
(Education workshops). One of the three Oficinas de Educação in the state of Amazonas is
located in Manacapuru, a town with around 80,000 inhabitants. It is also remarkable the large
number of medium size municipalities in cluster five in the Southeast region – particularly in
13 Programa de Saúde da Família
18
upstate São Paulo – with a higher relative centrality as compared to other towns of similar
size. This aspect is going to become more evident in the next section when we will test the
statistical significance of the results.
Cluster 1
São Paulo (SP - SE) North
Manaus (AM) Araras (SP) Niterói (RJ)
Cluster 2 Porto Velho (RO) Barbacena (MG) Nova Iguaçu (RJ)
Rio de Janeiro (RJ - SE) Rio Branco (AC) Bauru (SP) Osasco (SP)
Botucatu (SP) Paracambi (RJ)
Cluster 3 North-East Cachoeira do Itapemerim (ES) Petrópolis (RJ)
Belo Horizonte (MG - SE) Aracaju (SE) Caieiras (SP) Piracicaba (SP)
Fortaleza (CE - NE) Camaragibe (PE) Campos do Jordão (SP) Presidente Prudente (SP)
Porto Alegre (RS - S) Campina Grande (PE) Campos dos Goytacazes (RJ) Ribeirão Preto (SP)
Salvador (BA - NE) Crato (CE) Duque de Caxias (RJ) Santo André (SP)
Recife (PE - NE) Feira de Santana (BA) Guarulhos (SP) Santos (SP)
Imperatriz (MA) Itaboaí (SP) São Bernardo do Campo (SP)
Cluster 4 Itabuna (BA) Itapira (SP) São Gonçalo (RJ)
Brasília (DF - CW) João Pessoa (PB) Itu (SP) São José do Rio Preto (SP)
Campinas (SP - SE) Juazeiro (BA) Jaú (SP) São José dos Campos (SP)
Curitiba (PR - S) Maceió (AL) Juiz de Fora (MG) Sorocaba (SP)
Belém (PA - N) Mossoró (RN) Jundiaí (SP) Tupã (SP)
Goiânia (GO - CW) Natal (RN) Marília (SP) Uberaba (MG)
Sobral (CE) Moji das Cruzes (SP) Uberlândia (MG)
Cluster 6 São Luis (MA) Montes Claros (MG) Vitória (ES)
All other Teresina (PI) Volta Redonda (RJ)
Vitória da Conquista (BA)
Centre-West
Anápolis (GO) Blumenau (SC) Passo Fundo (RS)
Campo Grande (MS) Cascavel (PR) Pelotas (RS)
Cuiabá (MT) Caxias do Sul (RS) Ponta Grossa (RS)
Florianópolis (SC) Santa Maria (RS)
Joinville (SC) São José (SC)
Londrina (PR) São José dos Pinhais (PR)
Maringá (PR)
Source: Authors' calculation from IBGE / AMS - 2002
South
Chart 2
Clusters of equipment / facilities by locality - Brazil, 2002
Cluster 5
South-East
Therefore, the fact that some municipalities are hierarchically superior in terms of the
supply of physical infrastructure in health but not in terms of human resources can be
explained by the way in which the health system is organized. The investments made for
purchasing medical equipment and building up facilities are not always combined with
appropriate quantity of workers in health. This happens because the supply of human
resources in a given locality depends basically on two factors. The first one relates to the
individual decision of migrating to certain municipalities, particularly to the ones located in
less developed regions. Several health care workers prefer to stay in their hometown or closer

19
to the major urban centres of the country, even at lower wages, than to move to distant
localities where the supply of other kinds of services such as education, leisure,
transportation, among others, is deficient14. Another factor relates to the very availability of
public resources to fund the hiring of human resources, particularly of certain types of
specialists that receive higher wages.
In this sense, the complementarities between the supply of equipment/facilities and
human resources in health care are essential for adequate planning and resource allocation in
the health system, in order to provide good quality services to the population and to use
public funds efficiently.
Exploratory Spatial Data Analysis
This section presents an exploratory data analysis of each of the Brazilian macro-
regions separately, in order not to overlook the regional specificities of the country. Only the
North and Centre-West regions are grouped together due to their similarities regarding health
services supply.
Figure 2. Spatial correlation in the supply of health services – Northeast
Fortaleza
Campina Grande
Natal
São Luis
João Pessoa
Recife
Aracaju
Salvador
Maceió
Teresina
N
States
High-LowLow-HighLow-LowHigh-HighNon-significant
Source: Author’s elaboration from IBGE/AMS (2002)
14 However, one of the factors that can explain the decision to move to smaller and more isolated localities is the increasing concern with quality of life, due to security problems and other issues common to large cities.
20
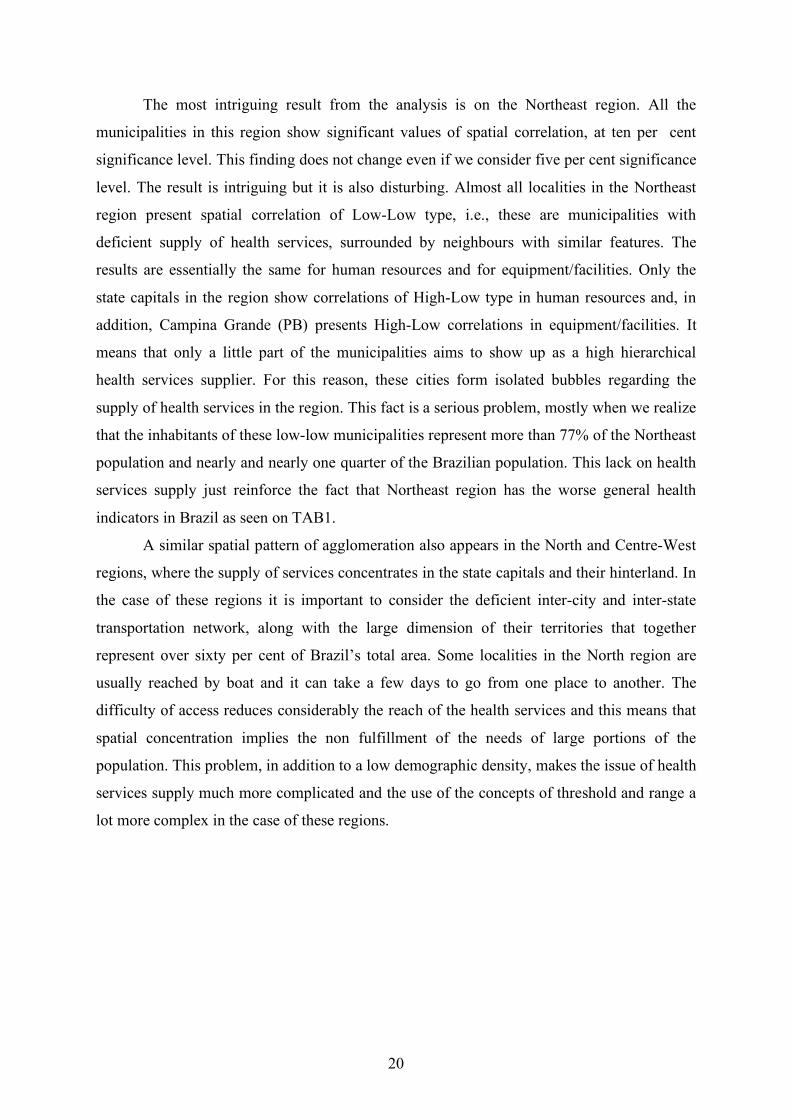
The most intriguing result from the analysis is on the Northeast region. All the
municipalities in this region show significant values of spatial correlation, at ten per cent
significance level. This finding does not change even if we consider five per cent significance
level. The result is intriguing but it is also disturbing. Almost all localities in the Northeast
region present spatial correlation of Low-Low type, i.e., these are municipalities with
deficient supply of health services, surrounded by neighbours with similar features. The
results are essentially the same for human resources and for equipment/facilities. Only the
state capitals in the region show correlations of High-Low type in human resources and, in
addition, Campina Grande (PB) presents High-Low correlations in equipment/facilities. It
means that only a little part of the municipalities aims to show up as a high hierarchical
health services supplier. For this reason, these cities form isolated bubbles regarding the
supply of health services in the region. This fact is a serious problem, mostly when we realize
that the inhabitants of these low-low municipalities represent more than 77% of the Northeast
population and nearly and nearly one quarter of the Brazilian population. This lack on health
services supply just reinforce the fact that Northeast region has the worse general health
indicators in Brazil as seen on TAB1.
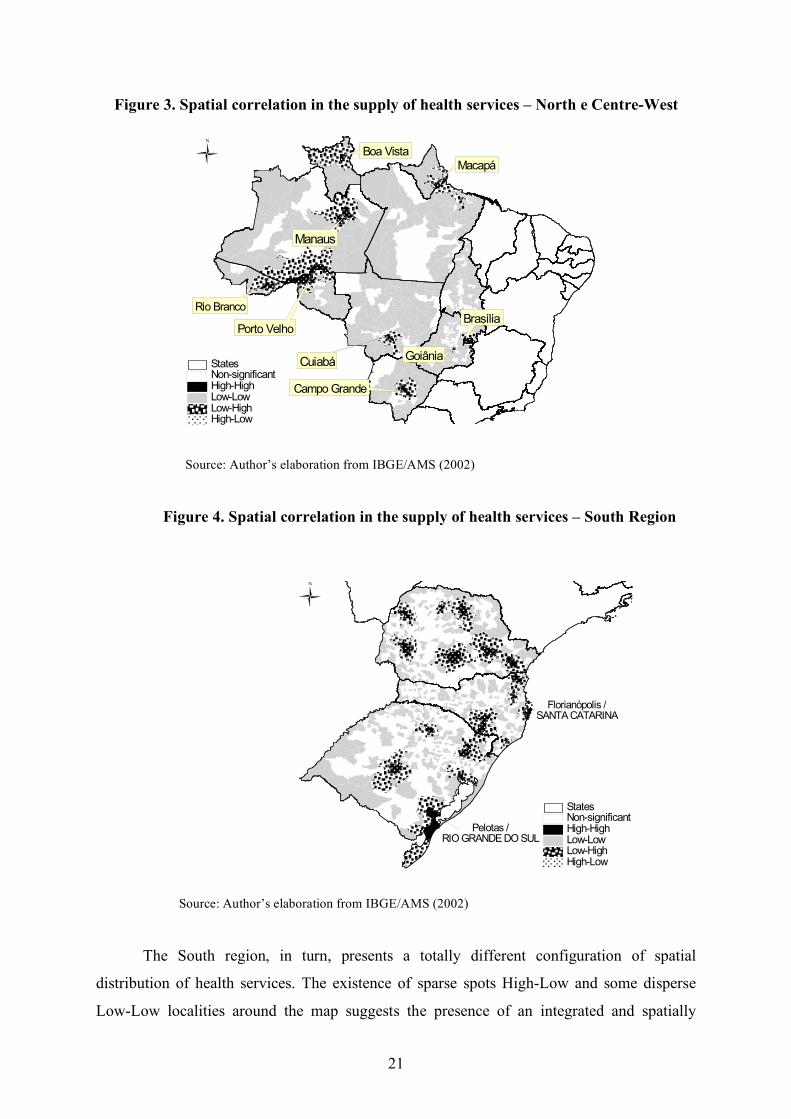
A similar spatial pattern of agglomeration also appears in the North and Centre-West
regions, where the supply of services concentrates in the state capitals and their hinterland. In
the case of these regions it is important to consider the deficient inter-city and inter-state
transportation network, along with the large dimension of their territories that together
represent over sixty per cent of Brazil’s total area. Some localities in the North region are
usually reached by boat and it can take a few days to go from one place to another. The
difficulty of access reduces considerably the reach of the health services and this means that
spatial concentration implies the non fulfillment of the needs of large portions of the
population. This problem, in addition to a low demographic density, makes the issue of health
services supply much more complicated and the use of the concepts of threshold and range a
lot more complex in the case of these regions.
21
Figure 3. Spatial correlation in the supply of health services – North e Centre-West
Boa VistaMacapá
Rio Branco
Porto Velho
Cuiabá
Manaus
Brasília
Goiânia
Campo Grande
N
Non-significantHigh-HighLow-LowLow-HighHigh-Low
States
Source: Author’s elaboration from IBGE/AMS (2002)
Figure 4. Spatial correlation in the supply of health services – South Region
Florianópolis /SANTA CATARINA
Pelotas /RIO GRANDE DO SUL
N
States
High-LowLow-HighLow-LowHigh-HighNon-significant
Source: Author’s elaboration from IBGE/AMS (2002)
The South region, in turn, presents a totally different configuration of spatial
distribution of health services. The existence of sparse spots High-Low and some disperse
Low-Low localities around the map suggests the presence of an integrated and spatially
22
distributed network of health services supply. The occurrence of High-High localities in the
metropolitan areas of Curitiba and Florianópolis, as well as in Pelotas-Rio Grande, shows the
concentration of more complex services around the large cities, which are also benefited in
statistical terms by the small number of neighbouring municipalities. Nevertheless, the
existence of many Low-Low municipalities shows that, even in the South (one of the more
developed regions in the country) the more complexes health services network is inefficient
in the point of view of geographical accessibility.
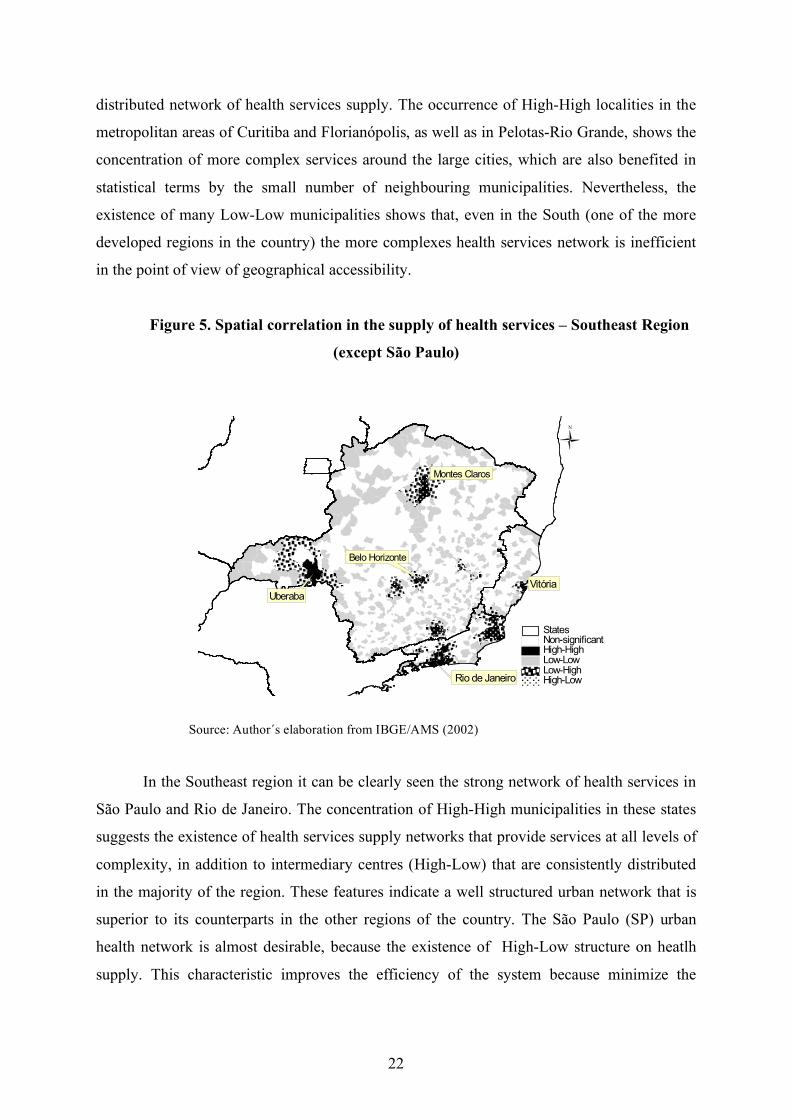
Figure 5. Spatial correlation in the supply of health services – Southeast Region
(except São Paulo)
Montes Claros
VitóriaUberaba
Belo Horizonte
Rio de Janeiro
N
States
High-LowLow-HighLow-LowHigh-HighNon-significant
Source: Author´s elaboration from IBGE/AMS (2002)
In the Southeast region it can be clearly seen the strong network of health services in
São Paulo and Rio de Janeiro. The concentration of High-High municipalities in these states
suggests the existence of health services supply networks that provide services at all levels of
complexity, in addition to intermediary centres (High-Low) that are consistently distributed
in the majority of the region. These features indicate a well structured urban network that is
superior to its counterparts in the other regions of the country. The São Paulo (SP) urban
health network is almost desirable, because the existence of High-Low structure on heatlh
supply. This characteristic improves the efficiency of the system because minimize the
23
transportation costs and maximize the accessibility to all kind of health services. More than
this, it reduces the demand overpressure on a few localities.
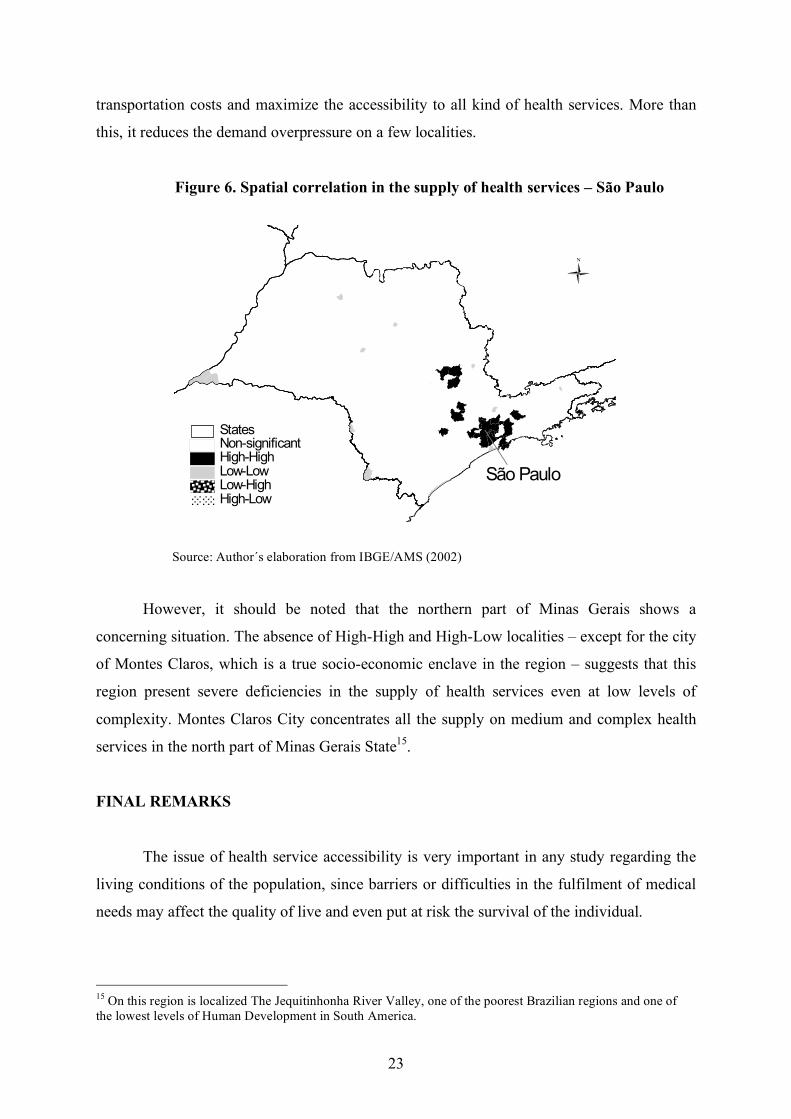
Figure 6. Spatial correlation in the supply of health services – São Paulo
N
São Paulo
States
High-LowLow-HighLow-LowHigh-HighNon-significant
Source: Author´s elaboration from IBGE/AMS (2002)
However, it should be noted that the northern part of Minas Gerais shows a
concerning situation. The absence of High-High and High-Low localities – except for the city
of Montes Claros, which is a true socio-economic enclave in the region – suggests that this
region present severe deficiencies in the supply of health services even at low levels of
complexity. Montes Claros City concentrates all the supply on medium and complex health
services in the north part of Minas Gerais State15.
FINAL REMARKS
The issue of health service accessibility is very important in any study regarding the
living conditions of the population, since barriers or difficulties in the fulfilment of medical
needs may affect the quality of live and even put at risk the survival of the individual.
15 On this region is localized The Jequitinhonha River Valley, one of the poorest Brazilian regions and one of the lowest levels of Human Development in South America.
24
In this context, the availability of physical and human infrastructure in the health
system is extremely relevant. The current study shows the existence of large gaps in the
supply of health services, including the total absence of certain types of equipment, facilities
and human resources, necessary for basic medical procedures, in several localities in Brazil.
These gaps in the supply of services point to deficiencies in the inter-cities assistance
networks, which are one of the pillars of the proposals for regionalization of the health
system. Such results may obstruct the implementation of adequate policies for the health
system in the country, and may hamper the access of the population to health services at all
levels.
Despite the advances in the health system in the last few years, the spatial inequalities
in the supply of health services reflect primarily the disparities in the levels of social and
economic development among the Brazilian regions. They also point to deficiencies in the
planning of public policies and in the priorities regarding the allocation of public resources in
strategic areas for the population.
The managers of the health system at the three levels of government should act in a
coordinated way in order to provide not only basic medical services – which represent most
of the demands of the population – but also to allow the access to more complex medical
procedures. This is an important challenge to be faced, aiming to provide comprehensive
and good quality health care to all the Brazilian population, and allowing an improvement in
the health indicators in the country.
25
REFERENCES
ANDRADE, M.V. (2002). ‘Políticas estaduais na área de saúde’, in: Minas Gerais do Século
XXI: Investindo em Políticas Sociais, v.III, Banco de Desenvolvimento de Minas Gerais,
Belo Horizonte: BDMG.
ANSELIN, L. (1992) SpaceStat tutorial: a workbook for using SpaceStat in the analysis of
spatial data. University of Illinois: Urbana-Champaign.
ANSELIN, L. (1995) ‘Local indicators of spatial association – LISA’. Geographical
Analysis, 27(2).
BERRY, B.J.L et al.(1988) Market centers and retail location: theory and applications. NJ:
Prentice-Hall, Englewood Cliffs.
BRASIL. Ministério da Saúde (1999) Manual para a Organização da Atenção Básica.
Secretaria de Assistência à Saúde. Brasília: Ministério da Saúde.
CHRISTÄLLER W. (1966) Central places in southern Germany. NJ: Prentice-Hall,
Englewood Cliffs.
CORDEIRO, H. (2001) ‘Descentralização, universalidade e equidade nas reformas de saúde’.
Ciência & Saúde Coletiva 6(2):319-328.
DINIZ, C. C. (1995) A dinâmica regional recente da economia brasileira e suas
perspectivas, IPEA, Texto para discussão nº 375.
ESWARAN, M. & WARE R. (1986) ‘On the shape of market areas in Löschian spatial
models’, Journal of Regional Science 26: 307-319.
FUNDAÇÃO JOÃO PINHEIRO (2000) Atlas do Desenvolvimento Humano no Brasil.
GUSEIN-ZADE S.M. (1993) ‘Alternative explanations of the dependence of the density of
centers on the density of population’, Journal of Regional Science 33: 547-558.
26
HARWITZ, M. & LENTNEK B. (1973) ‘A contextual theory of central places on a linear
market’, Journal of Regional Science 13: 213-222.
INSTITUTO BRASILEIRO DE GEOGRAFIA E ESTATÍSTICA (IBGE) (2002) Pesquisa
da Assistência Médico-Sanitária.
KEANE M.J. (1989) ‘Function and competition among urban centers’, Journal of Regional
Science 29: 265-276.
LE GALLO, J. & ERTUR, C. (2000) Exploratory spatial data analysis of the distribution of
regional per capita GPD in Europe, 1980-1995. University of Burgundy, Dijon. Available at:
<http://www.u-bourgogne.fr/LATEC> (Access in 12/01/2006)
J. MACQUEEN. (1967) ‘Some methods for classification and analysis of multivariate
observations’, in: L. Le Cam and J. Neyman (eds.), 5th Berkley Symposium on Mathematical
Statistics and Probability, pp. 281-297.
PARR, J.B. (1997) ‘The law of market areas and the size distribution of urban centers’,
Papers in Regional Science. 76: 43-68.
PARR, J.B. (1995) ‘Alternative approaches to market-area structure in urban systems’ Urban
Studies, 32:1317-1329.
PARR, J.B. (1978) ‘Models of the central place system: a more general approach’ Urban
Studies 15: 35-49.
PEROBELLI, F. & HADDAD, E. (2003) Brazilian interregional trade (1985-1996): an
exploratory spatial data analysis. Procedures of XXXI Encontro Nacional de Economia. Porto
Seguro: ANPEC.
REGALES, M.F. (1992) Sistemas urbanos: los países industrializados del Hemisferio Norte
y Iberoamérica. Madrid: Sintesis.
27
RICHARDSON, H. (1969) Teoria da localização, estrutura urbana e crescimento regional.
Rio de Janeiro: Zahar Editores.
SOUTH, R. & BOOTS, B. (1999). ‘Relaxing the nearest centre assumption in central place
theory’, Papers in Regional Science, 78:157-177.
SOUZA, R.R. (2001) ‘A regionalização no contexto atual das políticas de saúde’ Ciência &
Saúde Coletiva 6(2):451-455.
THILL, J.C. (1992) ‘Spatial competition and market interdependence’, Papers in Regional
Science 71: 259-275.
ULLMAN, E. (1970) ‘A theory of location for cities’ in: LEAHY, W. (ed) Urban economics.
United States: Free Press.
VLAHOV, D. & GALEA, S. (2002) ‘Urbanization, urbanicity and health’, Journal of Urban
Health 79(4): Supl.1.
WOOD, C. H.; CARVALHO, J.A.M. (1994) A demografia da desigualdade no Brasil. Rio
de Janeiro: IPEA, 330p.
28
ANEX 1
Chart I: List of selected variables
Equipments
Gamma Camera Temporary Pace-maker Blood gas analysis equipment
Mammography EKG monitor Haemodialysis equipment
Stereo-Tax Invasive pressure monitor Dental equipment
Fluoroscopy X ray Non-invasive pressure monitor Bier heater
X Ray 100 to 500 Ma Oximeter Brachterapy
X Ray 100 Ma Mechanical Ventilator Radioimmunoassay
X Ray 00Ma Adult mechanical ventilator Linear accelerator
Dental X-ray Paediatric mechanical ventilator Cobalt pump
Bone densitometry Electrocardiograph Autoclave
Catheterization X Ray Electroencephalograph Adult scale
Magnetic resonance Fiteroptic bronchoscope Paediatric scale
Computer tomography (CT
Scan)
Fiteroptic urinary Centrifuge
Colour Doppler Digestive endoscope Blood cell counter
Echo graphic ultra-sound Optometry equipment Catheterization equipment
Central air conditioner Laparoscopy Adult sphygmomanometer
Power Generator Surgical microscope Paediatric
sphygmomanometer
O2 Power plant Diathermy equipment Spectrophotometer
Defibrillator Electrical stimulation Foetal Doppler-Pinard
Phototherapy equipment Infusion pump Stove
Incubator Aphaeresis equipment Microscopy
Audiometric equipment Extra-corporal circulation pump Nebuliser
Vaccine refrigerator Otoscope Ophthalmoscope
Facilities
Ambulatory surgery’s room Childbirth room Beds of medical clinic
Rehydration room Daily pay room childbirth Beds of gyneco-obstetrics
Rest/comment room Surgical recovery room Beds of other specialities
Dental office Cradle in joint accommodation Paediatric beds
Nursing office Cradle for just born Psychiatry beds
Nursing room Adult ITU Total of beds
Immunization room Coronary ITU Sickroom with two beds
Curative room Infant ITU Sickroom with three beds
Medical office Neonatal ITU Sickroom with more than six
29
Beds
Warm cradle Burnt ITU Rooms and apartments
Surgery room Intermediate Unit of Internment ITC/ITU
Curettage room Beds of surgical clinic
Human Resources
Communitarian agent of health Zoonosis control agent Sanitarist
Agent of public health Midwife Sanitary inspector
General doctor Anaesthetist Nursing technician
General surgeon Social assistant Pharmacian technician and
assistant
Gynaecologist / Obstetrics Biochemist Oral health technician and
assistant
Dentist Nurse Physiotherapy and
whitewashing technician and
assistant
Radiologist Voice Therapist Haematology technician and
assistant
Psychiatrist Family doctor Histology technician and
assistant
Laboratory technician Nutritionist Nutrition technician and
assistant
Physiotherapist Paediatrics Sanitary and ambient
monitoring technician and
assistant
Nurse aid Psychologist Cytology technician
Diverse services assistant Resident Health care equipment
technician
Source: IBGE / AMS - 2002


![FRANCISCO CUNHA RODRIGUES.pdf - Master PDF Editor (NOT ...dspace.bc.uepb.edu.br/jspui/bitstream/123456789/19759/1/PDF - Fra… · Rodrigues, Francisco Cunha. Boi de reis [manuscrito]](https://img.pdfslide.us/doc/110x75/604ed2c6e31db670bd1f809c/francisco-cunha-master-pdf-editor-not-dspacebcuepbedubrjspuibitstream123456789197591pdf.jpg)