Embed Size (px)
Citation preview
June 2021
The Projected Economic Impact of Extreme Sea-Level Rise in Seven Asian Cities in 2030

Toxic air: The price of fossil fuels February 2020
Cover image: Typhoon Hagibis hits Tokyo’s metropolitan area. © Masaya Noda/Greenpeace
This page: Floods in Jakarta, December 2019. © Daviara/Greenpeace
Introduction
Summary
Data and Methodology
Results
Results by City
Conclusion
References
Endnotes
01
03
04
07
08
22
23
26
Contents

Toxic air: The price of fossil fuels February 2020
People walk along a flooded highway in Bangbuathong area, Nonthaburi province, on the northern outskirts of Bangkok. © Sataporn Thongma/Greenpeace

1
Introduction
Extreme rising sea levels and flooding is a threat to coastal cities. We selected seven cities in Asia that are economic centers and are located on or close to the coast to analyze how their gross domestic product (GDP) could potentially be impacted by extreme coastal flooding in 2030 with the business-as-usual (BAU) carbon-emission scenario, also called the RCP8.5 scenario. Our analysis suggests how the climate crisis may affect the economies of the cities analysed in less than one decade unless we act immediately to achieve a rapid reduction in greenhouse gas emissions.
Global mean sea level rose by an estimated rate of 1.6 to 1.9 millimetres per year in the twentieth century in large part due to anthropogenic climate change (Hay et al., 2015). In addition to sea-level rise, people living in coastal areas can be at risk of flooding from storm surges and high tides. Intensification of tropical storms are likely caused by climate change (GFDL, 2021). Climate modelling projections suggest that through the twenty-first century, the intensity of storms will increase, with more damaging wind speeds, higher storm surges, and more extreme rainfall rates than storms experienced in the past (Knutson et al., 2020).
We urge for faster and more ambitious climate action and ask governments to commit to achieving ‘net zero’ by 2050 to limit global warming to 1.5°C above pre-industrial levels, as outlined by the IPCC in its publication ‘The Special Report on Global Warming of 1.5°C’ (IPCC, 2018). We ask governments to deliver implementation plans with firm and achievable solutions, such as phasing out domestic use and financing of the fossil fuel industry and switching to an economy that is based on renewable energy. Governments and leaders across Asia must take responsibility to meet the international climate target of achieving a 1.5°C pathway to protect the economy, safeguard the lives and livelihoods of their countries’ residents, and help to conserve biodiversity.

2 The Projected Economic Impact of Extreme Sea-Level Rise in Seven Asian Cities in 2030Typhoon Vamco aftermath in Manila @Jilson Tiu

3
The concentration of carbon dioxide in the Earth’s atmosphere is currently at nearly 412 parts per million and continues to rise (Buis, 2019), and the rate of sea-level rise is accelerating. An estimated 600 million people (Kirezci et al., 2020), many of whom live in Asia, live in low-lying coastal regions and are at risk of flooding events that could potentially be caused by a rise in sea levels. Some of the areas at risk of flooding are economic centers with significant gross domestic product (GDP) (World Ocean Review, 2010).
Extreme weather events include heat waves, excessive rainfall and tropical cyclones. This report focuses on tropical cyclones and associated storm surges, high tides and sea-level rise that may affect seven major cities in Asia. Tropical cyclones present a major risk to human populations and therefore research that assesses the likelihood of such events taking place in future decades is important (Seneviratne et al., 2012). However, an important factor to note is that making projections of extreme climate events and the extent to which those events will affect particular regions is extremely difficult because weather systems are complex and the scientific data on which modelling projections are based is not always accurate or complete. In addition, basing projections on only a few decades of data makes it difficult for scientists to determine whether observed changes are caused by anthropogenic activity, natural variability – or a combination of both.
Another key point to note is that the accuracy of climate projections differs depending on the climate event in question. For example, the global trend is that the frequency, intensity and duration of extreme heat events are all expected to increase (Xu et al., 2020). However, whether or not tropical storms and cyclones will increase or decrease in frequency during the twenty-first century is not certain (Seneviratne et al., 2012). Tropical cyclones may become more intense this century because the sea-surface temperature has been increasing, so more heat energy is available for tropical cyclones to develop. However, the projections are based on only four decades of observational data,
and there may be regional variations in tropical cyclone activity between the different ocean basins (Seneviratne et al., 2012). There is evidence to suggest that the global trend is tropical cyclones may become more intense this century because sea-surface temperatures are warming. However, the projections are based on only four decades of observational data, and there may be regional variations in tropical cyclone activity between the different ocean basins (Seneviratne et al., 2012). The threat of extreme sea-level rise1 means that many coastal and estuarine cities are vulnerable to flooding, risking the lives of the population, causing damage to infrastructure and the local economy.
Land, population and GDP are among the fundamental resources of economic development (Yong, 2021), therefore an accurate estimation of the potential effects of sea-level rise is important to help make decisions to protect local properties, infrastructure, and well-being of the population. We used gridded data on extreme sea-level rise, population and GDP to calculate the potential impact of sea-level rise in seven Asian cities. This analysis is one of the first of its kind to use high spatial resolution data to suggest the areas of each city that may be affected by an increase in sea level, and to what extent the impact might be. A similar analysis was conducted in 2020 but on a global scale for the years 2050 and 2100 using the same population and an older version of GDP datasets (Kirezci et al., 2020).
We selected seven major Asian cities that are economic centers and located on or close to the coast. For each city, we calculated the GDP, population and land area that may be affected by extreme sea levels and coastal flooding in 2030 if we continue to increase greenhouse gas emissions at the current rate. The seven cities are: Hong Kong, Taipei, Seoul, Tokyo, Jakarta, Manila and Bangkok.
Our analysis suggests that across the seven cities we analysed, a total of 724 billion USD, 15 million people, and 1,829 km2 land area could potentially be affected by extreme sea-level rise and coastal flooding. The estimated GDP impact accounted ranged from 0.4% to 96% of each city’s entire GDP.
Summary
4 The Projected Economic Impact of Extreme Sea-Level Rise in Seven Asian Cities in 2030
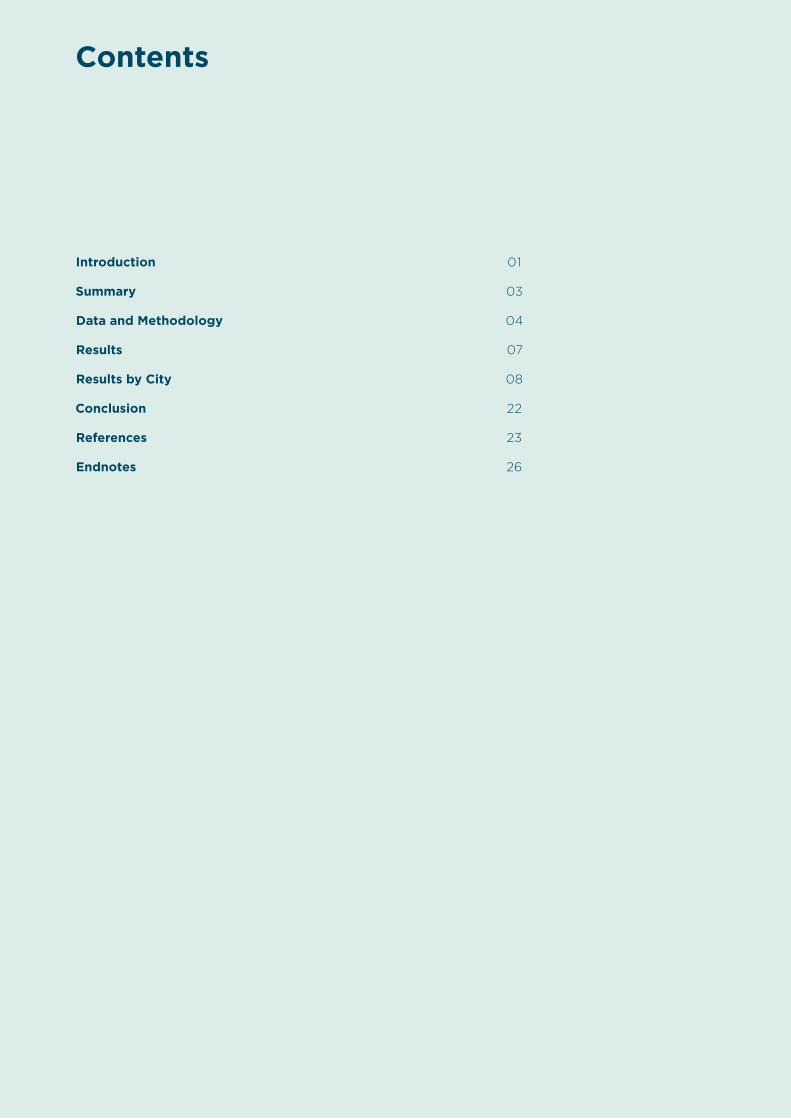
Research suggests that coastal impacts from sea-level rise are one of the key economic damages associated with climate change (Brown et al., 2011). Other economic impacts caused by climate change include those to health (for example, premature mortality), agriculture, the energy sector and riverine flooding (Schinko et al., 2020). In the Asia Pacific region, some coastal cities are economic centers, therefore coastal flooding from extreme sea-level rise may cause higher damages to those cities and their economies. We selected seven cities for which we analyzed their gross domestic product (GDP), population, and land area affected by extreme sea-level rise and coastal flooding. The seven cities are Hong Kong, Taipei, Seoul, Tokyo, Jakarta, Manila, and Bangkok.
In this analysis, three datasets are used: flooded area by extreme sea-level rise and coastal flooding caused by storm surges and high tides (data #1), population density (data #2), and GDP (data #3).
The projection of gridded sea-level rise and coastal flooding data is from Climate Central (Kulp and Strauss, 2019). It uses elevation, extreme sea levels caused by storm surges and high tides to determine if a land area may flood or not. The spatial resolution of the dataset is 30 meters.
The flooding setting used in this analysis is local sea-level projection plus the added height of a local ‘moderate flood’. A moderate flood’s height above sea level has a 10% annual chance of being exceeded – another way to say it is a once-in-a-decade flood.
The scenario used in this analysis is Business-as-Usual (BAU) greenhouse gas emissions projections to 2030, in a scenario in which the annual global greenhouse gas emissions continue to climb through most of the twenty-first century. The BAU scenario is consistent with 3 or 4 ° Celsius of warming by 2100 in comparison to pre-industrial temperatures; this high-emissions scenario is also called the RCP8.5 scenario.
The gridded global population density dataset is from the Socioeconomic Data and Applications Center of the U.S. National Aeronautics and Space Administration. Population data are available for five years: 2000, 2005, 2010, 2015, 2020 (CIESIN, 2016). The data used in this analysis are the most recent, 2020. The spatial resolution is 1km.
Figure 1: A geographical illustration showing the areas of Tokyo that are potentially at risk from sea-level rise and coastal flooding in 2030, under the RCP8.5 scenario.
Data and Methodology
5
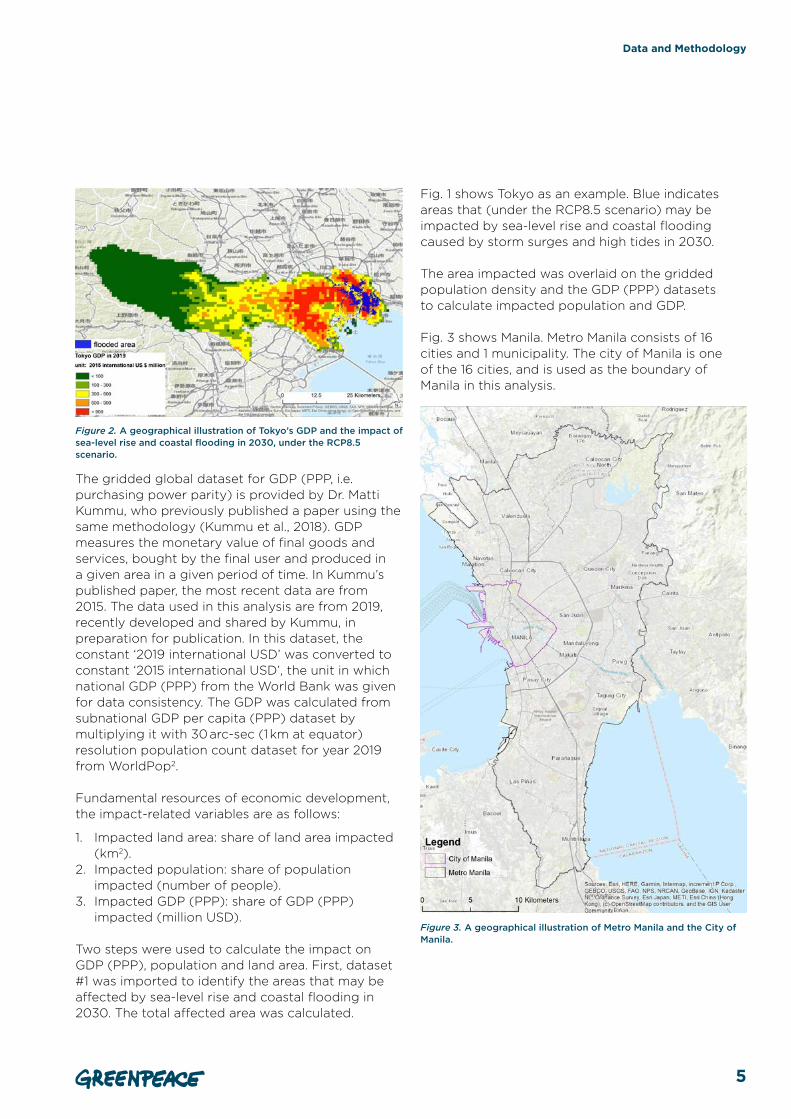
Figure 2. A geographical illustration of Tokyo’s GDP and the impact of sea-level rise and coastal flooding in 2030, under the RCP8.5 scenario.
Data and Methodology
The gridded global dataset for GDP (PPP, i.e. purchasing power parity) is provided by Dr. Matti Kummu, who previously published a paper using the same methodology (Kummu et al., 2018). GDP measures the monetary value of final goods and services, bought by the final user and produced in a given area in a given period of time. In Kummu’s published paper, the most recent data are from 2015. The data used in this analysis are from 2019, recently developed and shared by Kummu, in preparation for publication. In this dataset, the constant ‘2019 international USD’ was converted to constant ‘2015 international USD’, the unit in which national GDP (PPP) from the World Bank was given for data consistency. The GDP was calculated from subnational GDP per capita (PPP) dataset by multiplying it with 30 arc-sec (1 km at equator) resolution population count dataset for year 2019 from WorldPop2.
Fundamental resources of economic development, the impact-related variables are as follows:
1. Impacted land area: share of land area impacted (km2).
2. Impacted population: share of population impacted (number of people).
3. Impacted GDP (PPP): share of GDP (PPP) impacted (million USD).
Two steps were used to calculate the impact on GDP (PPP), population and land area. First, dataset #1 was imported to identify the areas that may be affected by sea-level rise and coastal flooding in 2030. The total affected area was calculated.
Fig. 1 shows Tokyo as an example. Blue indicates areas that (under the RCP8.5 scenario) may be impacted by sea-level rise and coastal flooding caused by storm surges and high tides in 2030.
The area impacted was overlaid on the gridded population density and the GDP (PPP) datasets to calculate impacted population and GDP.
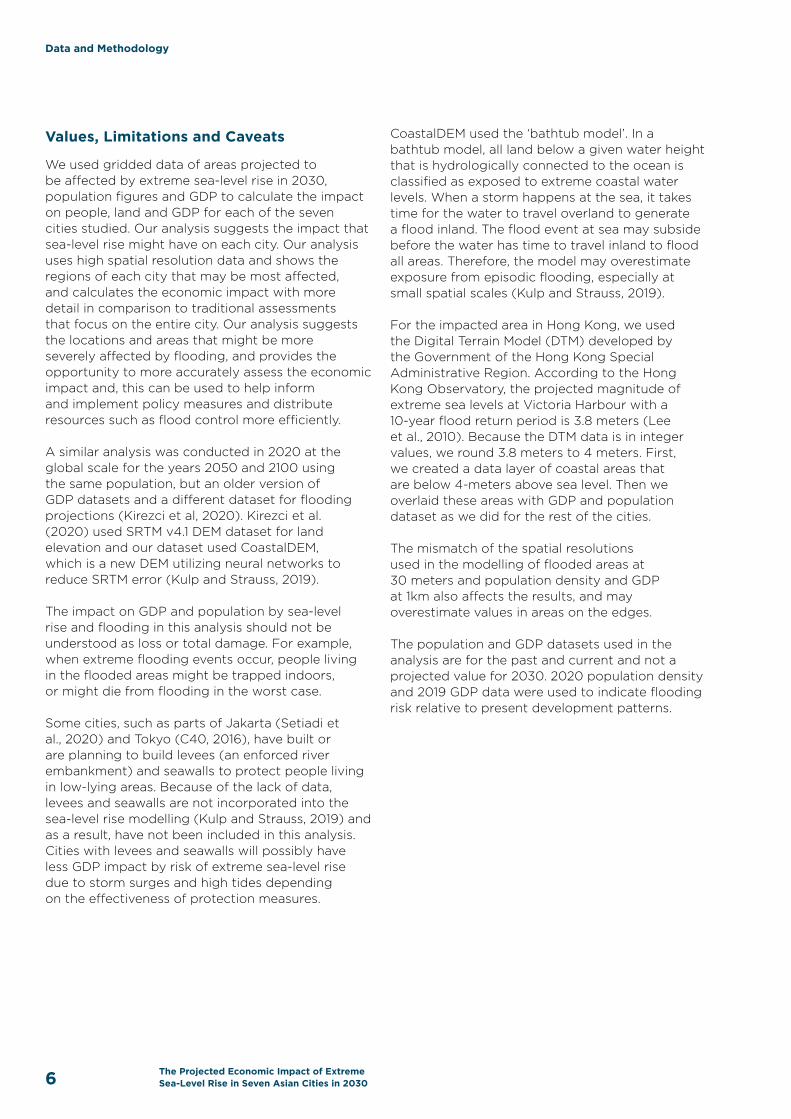
Fig. 3 shows Manila. Metro Manila consists of 16 cities and 1 municipality. The city of Manila is one of the 16 cities, and is used as the boundary of Manila in this analysis.
Figure 3. A geographical illustration of Metro Manila and the City of Manila.
6 The Projected Economic Impact of Extreme Sea-Level Rise in Seven Asian Cities in 2030
Values, Limitations and Caveats
We used gridded data of areas projected to be affected by extreme sea-level rise in 2030, population figures and GDP to calculate the impact on people, land and GDP for each of the seven cities studied. Our analysis suggests the impact that sea-level rise might have on each city. Our analysis uses high spatial resolution data and shows the regions of each city that may be most affected, and calculates the economic impact with more detail in comparison to traditional assessments that focus on the entire city. Our analysis suggests the locations and areas that might be more severely affected by flooding, and provides the opportunity to more accurately assess the economic impact and, this can be used to help inform and implement policy measures and distribute resources such as flood control more efficiently.
A similar analysis was conducted in 2020 at the global scale for the years 2050 and 2100 using the same population, but an older version of GDP datasets and a different dataset for flooding projections (Kirezci et al, 2020). Kirezci et al. (2020) used SRTM v4.1 DEM dataset for land elevation and our dataset used CoastalDEM, which is a new DEM utilizing neural networks to reduce SRTM error (Kulp and Strauss, 2019).
The impact on GDP and population by sea-level rise and flooding in this analysis should not be understood as loss or total damage. For example, when extreme flooding events occur, people living in the flooded areas might be trapped indoors, or might die from flooding in the worst case.
Some cities, such as parts of Jakarta (Setiadi et al., 2020) and Tokyo (C40, 2016), have built or are planning to build levees (an enforced river embankment) and seawalls to protect people living in low-lying areas. Because of the lack of data, levees and seawalls are not incorporated into the sea-level rise modelling (Kulp and Strauss, 2019) and as a result, have not been included in this analysis. Cities with levees and seawalls will possibly have less GDP impact by risk of extreme sea-level rise due to storm surges and high tides depending on the effectiveness of protection measures.
CoastalDEM used the ‘bathtub model’. In a bathtub model, all land below a given water height that is hydrologically connected to the ocean is classified as exposed to extreme coastal water levels. When a storm happens at the sea, it takes time for the water to travel overland to generate a flood inland. The flood event at sea may subside before the water has time to travel inland to flood all areas. Therefore, the model may overestimate exposure from episodic flooding, especially at small spatial scales (Kulp and Strauss, 2019).
For the impacted area in Hong Kong, we used the Digital Terrain Model (DTM) developed by the Government of the Hong Kong Special Administrative Region. According to the Hong Kong Observatory, the projected magnitude of extreme sea levels at Victoria Harbour with a 10-year flood return period is 3.8 meters (Lee et al., 2010). Because the DTM data is in integer values, we round 3.8 meters to 4 meters. First, we created a data layer of coastal areas that are below 4-meters above sea level. Then we overlaid these areas with GDP and population dataset as we did for the rest of the cities.
The mismatch of the spatial resolutions used in the modelling of flooded areas at 30 meters and population density and GDP at 1km also affects the results, and may overestimate values in areas on the edges.
The population and GDP datasets used in the analysis are for the past and current and not a projected value for 2030. 2020 population density and 2019 GDP data were used to indicate flooding risk relative to present development patterns.
Data and Methodology

7
Results
Table 1 lists the projected impacted GDP (PPP), population and areas of seven Asian cities in order of city size for the year 2030. The impacted area for the cities ranges from less than 20 km2 to more than 1,500 km2. The impacted GDP (PPP) ranges from less than US$3 billion to more than US$500 billion. The impacted population ranges from less than 100 thousand to more than 10 million.
Table 1. 2030 projections for the impact of sea-level rise and flooding on GDP(PPP), population and affected areas of seven cities, listed in the order of total city size in km2.
City Impacted area in km2 Impacted GDP (PPP) in US$ billion
Impacted population in millions
Bangkok 1512.94 512.28 10.45
Hong Kong 27.36 2.24 0.09
Tokyo 79.28 68.19 0.83
Jakarta 109.38 68.20 1.80
Seoul 16.52 4.69 0.13
Taipei 46.93 29.64 0.43
Manila 37.29 39.24 1.54
Bus passengers look at boats on the same in the flooded street at Bang Kae district in Bangkok. © Athit Perawongmetha/Greenpeace
Data and Methodology

8 The Projected Economic Impact of Extreme Sea-Level Rise in Seven Asian Cities in 2030
Results by City
BangkokBangkok is located in one of Asia’s mega deltas and has an average elevation of 1.5 meters above sea level. Bangkok is extremely vulnerable to flooding, particularly during the monsoon season. The city’s vulnerability to flooding is exacerbated by the fact that the city is sinking due to soft soils, heavy urbanization and land subsidence. The maximum subsidence in Bangkok is 30 mm/year (Phien-wej et al., 2005). All these factors make Bangkok particularly vulnerable to climate change and rising sea levels. An increase in extreme storm surges could erode the coastal area and potentially cause significant flooding. Salt water intrusion could also have a negative impact on drinking water supply.3
More than 96% of Bangkok’s land area is below the level to which sea water could rise should a 10-year flood4 occur in 2030, according to our analysis using projections under RCP8.5 (Fig.4). The potential flood areas include high density residential and commercial areas in the city center, medium to low density residential areas further from the city center, industrial as well as large agricultural areas on the outskirts of the city. Part of Bangkok’s core Central Business District Silom/Sathorn and
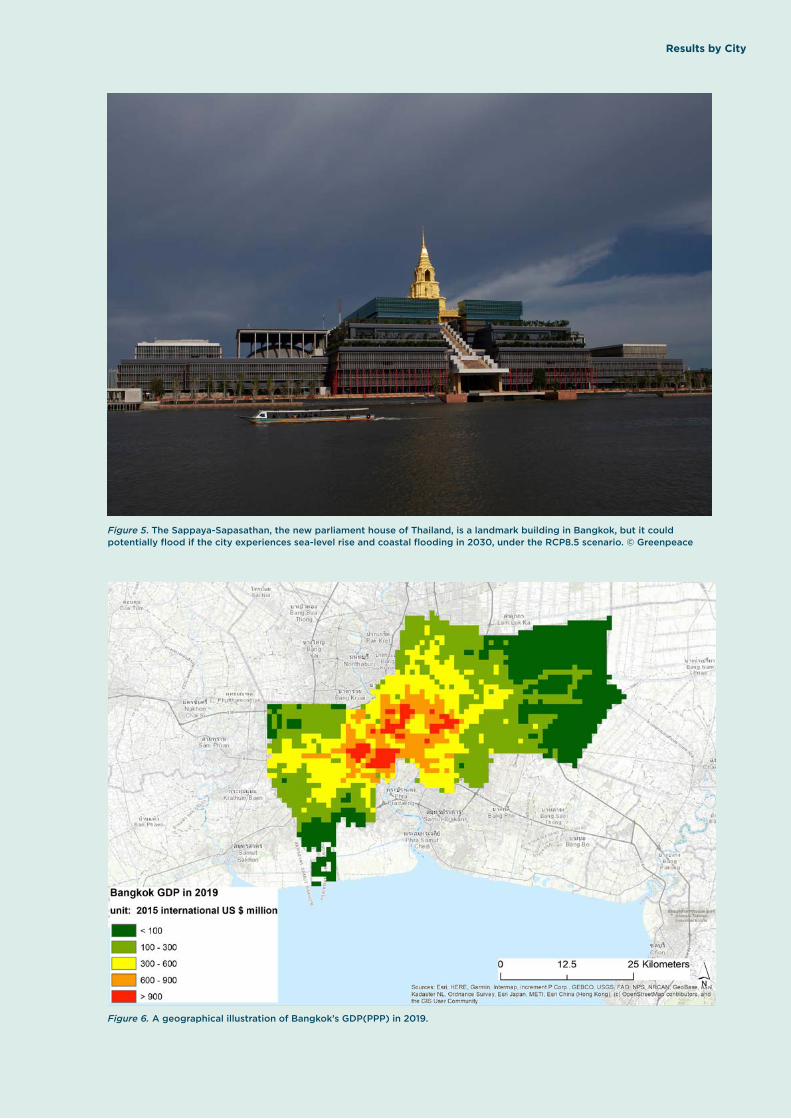
Wireless/Ploenchit could potentially be affected. The Sappaya-Sapasathan, the new parliament house of Thailand (Fig. 5), could potentially be flooded. Mangroves along the coast and along the Chao Phraya river could be at risk of flooding.
Fig. 6 shows Bangkok’s GDP in 2019. Our analysis projects that in Bangkok, extreme sea-level rise and any subsequent flooding in 2030 could put US$512.28 billion of GDP(PPP) and 10.45 million people at risk. The impacted GDP(PPP) accounts for 96% of Bangkok’s total GDP(PPP).
Figure 4. A geographical illustration of the potential impact of sea-level rise and coastal flooding in Bangkok in 2030, under the RCP8.5 scenario.
9
Results by City
Figure 5. The Sappaya-Sapasathan, the new parliament house of Thailand, is a landmark building in Bangkok, but it could potentially flood if the city experiences sea-level rise and coastal flooding in 2030, under the RCP8.5 scenario. © Greenpeace
Figure 6. A geographical illustration of Bangkok’s GDP(PPP) in 2019.

10 The Projected Economic Impact of Extreme Sea-Level Rise in Seven Asian Cities in 2030
Hong KongHong Kong is surrounded by the South China Sea on all sides except the north, which neighbours Shenzhen city along the Shenzhen River.
Hong Kong is affected by inter-annual and inter-decadal fluctuations in the annual number of tropical cyclones. The lowest records are two per year in 1997 and 2007, and highest is 11 tropical cyclones in 1974. The average number of tropical cyclones that affect Hong Kong is between 5 and 7 per year. Tropical cyclones cause storm surges, and the most extreme events in the past saw the sea level exceeding the tide level by more than 3 metres (Lee et al., 2010), bringing serious sea flooding to coastal low-lying areas.
About 2% of Hong Kong’s land area is below the level to which sea water could rise should a 10-year flood occur in 2030, according to our analysis under projections under RCP8.5 (Fig. 7). Areas with higher GDP, such as financial centers on Hong Kong Island, would be less affected. On the other hand, areas with rich biodiversity and ecological functionality would potentially be more
at risk of flooding. Northwest Hong Kong, such as Mai Po Nature Reserve and where a large portion of land is mangrove and wetland, has a very low elevation and is vulnerable to sea-level rise. On the path of the East Asian-Australasian Flyway, more than 80,000 waterbirds visit Mai Po each year (Wikramanayake et al., 2020). Tai O at the southwest of Hong Kong may also be flooded (Fig. 8).
Fig. 9 shows Hong Kong’s GDP in 2019. Our analysis projects that in Hong Kong, extreme sea-level rise and any subsequent flooding in 2030 could put US$2.24 billion of GDP(PPP) and 90,000 people at risk. The impacted GDP(PPP) accounts for 0.4% of Hong Kong’s total GDP(PPP), which is a smaller proportion of the GDP than for some other cities in Asia because the areas in Hong Kong with high GDP are not projected to be affected as much as in some cities. However, the projected impact from sea-level rise and coastal flooding is still significant.
Figure 7. A geographical illustration of potential flooded areas in Hong Kong if the city experiences sea-level rise and coastal flooding in 2030, under the RCP8.5 scenario.
Results by City

11
Figure 8. Tai O, a fishing village on Lantau Island, Hong Kong, could potentially be flooded if the area experiences sea-level rise and coastal flooding in 2030, under the RCP8.5 scenario. © Joseph Chan/Unsplash
Figure 9. A geographical illustration of Hong Kong’s GDP in 2019.
Results by City

12 The Projected Economic Impact of Extreme Sea-Level Rise in Seven Asian Cities in 2030
TokyoTropical cyclones typically cause a temporary rise in sea level – a ‘storm surge’ – and coastal flooding. Approximately 11 typhoons make landfall each year in Japan (Yamashita and Mitsumata, 2013). In Japan, an increasing frequency and intensity of storms and torrential rain has been reported in recent years (Japan Meteorological Agency, 2020). At the same time, the impact of storm surge flooding during typhoons is on track to become even more severe due to rising sea levels.
Although the average elevation of Tokyo is 40 meters above sea level, a number of low-lying areas are still at risk of flooding. According to the Bureau of Port and Harbor, Tokyo Metropolitan Government, Tokyo’s zero-meter zone encompasses about 20% of the “Tokyo 23 special wards” area and is home to approximately 1.5 million inhabitants. Approximately 40% of the 23 special wards area is 5 meters above the low tide level and this section is home to about 3 million inhabitants (Tokyo Bureau of Port and Harbor, 2021).
About 4% of Tokyo’s land area is below the level to which sea water could rise should a 10-year flood occur in 2030, according to our analysis using projections under RCP8.5 (Fig. 10). Areas at risk of flooding are primarily residential and
commercial. The low-lying “Koto 5 Wards” (Sumida, Koto, Adachi, Katsushika and Edogawa) in the eastern part of Tokyo are primarily located in the zero-meter zone and could be affected by sea-level rise and coastal flooding in 2030, under the RCP8.5 scenario. An estimated 2.5 million people live in the flood prone area. In Edogawa City, 70% of the land area is below sea level, and the area has experienced devastating flooding in the past. Other areas that are at risk of flooding if sea levels continue to rise include Kasai Rinkai Park (including Tokyo Sea Life Park), which is built on reclaimed land, and riverparks along the Arakawa River, which are popular destinations to watch the cherry trees bloom in spring. Tokyo Skytree, a Tokyo’s iconic landmark and Japan’s tallest tower located in Sumida City, could potentially be partially flooded (Fig. 11).
Fig. 12 shows Tokyo’s GDP in 2019. Our analysis projects that in Tokyo, extreme sea-level rise and any subsequent flooding in 2030 could put US$68.19 billion of GDP(PPP) 0.83 million people at risk. The impacted GDP(PPP) accounts for 7% of Tokyo’s total GDP(PPP).
Figure 10. A geographical illustration showing areas in Tokyo that could potentially be flooded if the city experiences sea-level rise and coastal flooding in 2030, under the RCP8.5 scenario.
Results by City

13
Results by City
Figure 11. Tokyo Skytree could potentially be partially flooded if the city experiences sea-level rise and coastal flooding in 2030, under the RCP8.5 scenario. © Shutterstock
Figure 12. A geographical illustration of Tokyo’s GDP in 2019.
14 The Projected Economic Impact of Extreme Sea-Level Rise in Seven Asian Cities in 2030
JakartaJakarta is located on the northwest coast of Java, at the mouth of the Ciliwung River on Jakarta Bay. Sitting in a low and flat alluvial plain, the elevation of Jakarta ranges from −2 to 50 metres with an average elevation of 8 metres above sea level. Thirteen rivers flow through Jakarta, which make the city prone to flooding due to clogging caused by insufficient drainage (Akmalah and Grigg, 2011).
Each year, Jakarta experiences flooding disasters following heavy rains, high river discharges, and high tides (Surya et al., 2019). In 2007, north Jakarta was affected by unusually high tides and heavy rains, and approximately 70% of Jakarta was flooded (Rukmana, 2016). In 2020, the Meteorology Climatology and Geophysics Agency of Indonesia warned about the potential for high waves and sea water increase or tidal floods of possibly 4 meters high, especially on the northern coast of Jakarta (CSRI, 2019). In addition, excessive groundwater drainage is contributing to Jakarta’s subsidence, which is on average 1 to 15 centimetres each year (Abidin et al., 2011). Some areas of Jakarta have sunk between 3 to 4.1 meters, especially in coastal areas (Rahman et al., 2018). Parts of Jakarta could be entirely submerged by 2050 (Kummu et al., 2018).
In 2019, The Guardian newspaper reported that the capital of Indonesia would move from Jakarta to a yet-to-be-built city in Kalimantan (Lyons, 2019), more than 1,000km away in the near future.
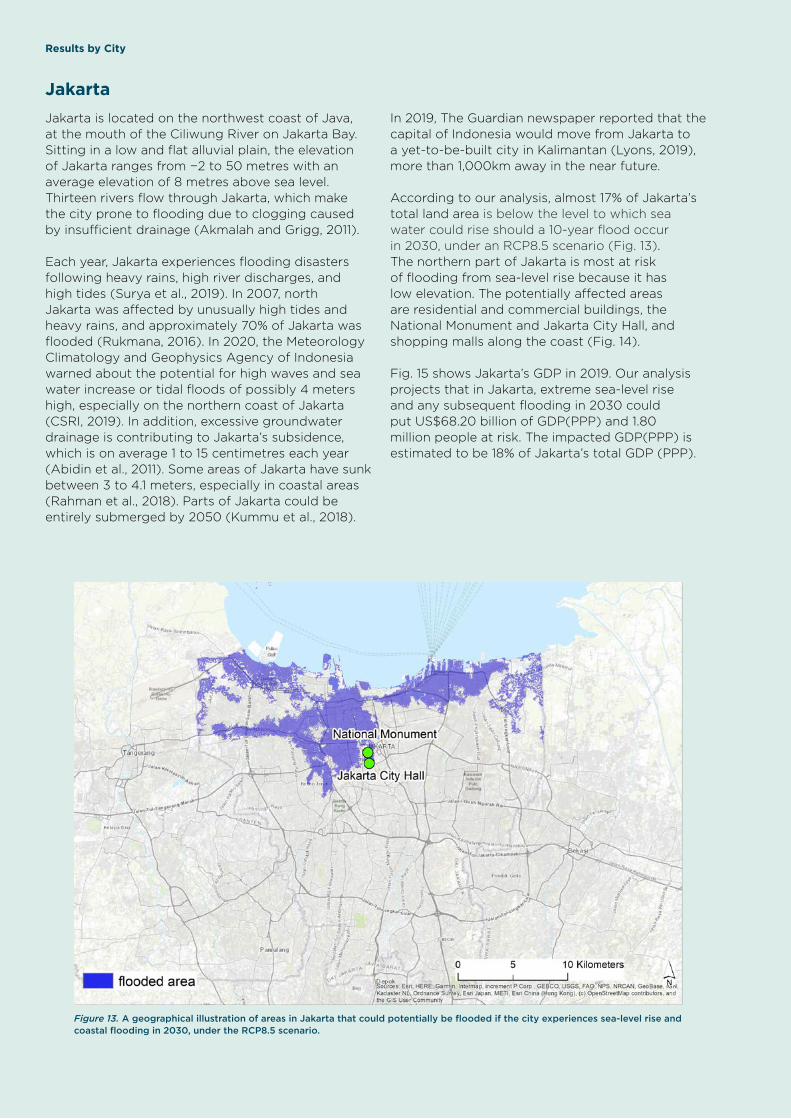
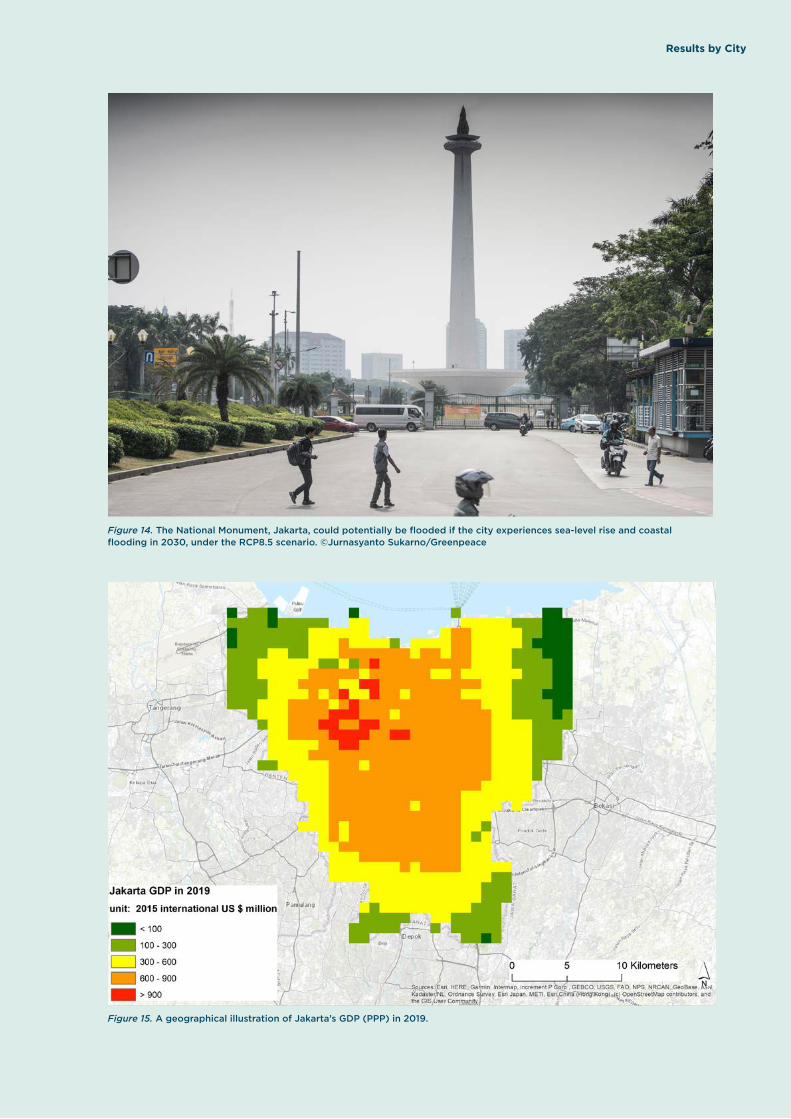
According to our analysis, almost 17% of Jakarta’s total land area is below the level to which sea water could rise should a 10-year flood occur in 2030, under an RCP8.5 scenario (Fig. 13). The northern part of Jakarta is most at risk of flooding from sea-level rise because it has low elevation. The potentially affected areas are residential and commercial buildings, the National Monument and Jakarta City Hall, and shopping malls along the coast (Fig. 14).
Fig. 15 shows Jakarta’s GDP in 2019. Our analysis projects that in Jakarta, extreme sea-level rise and any subsequent flooding in 2030 could put US$68.20 billion of GDP(PPP) and 1.80 million people at risk. The impacted GDP(PPP) is estimated to be 18% of Jakarta’s total GDP (PPP).
Figure 13. A geographical illustration of areas in Jakarta that could potentially be flooded if the city experiences sea-level rise and coastal flooding in 2030, under the RCP8.5 scenario.
Results by City
15
Results by City
Figure 14. The National Monument, Jakarta, could potentially be flooded if the city experiences sea-level rise and coastal flooding in 2030, under the RCP8.5 scenario. ©Jurnasyanto Sukarno/Greenpeace
Figure 15. A geographical illustration of Jakarta’s GDP (PPP) in 2019.
16 The Projected Economic Impact of Extreme Sea-Level Rise in Seven Asian Cities in 2030
SeoulSeoul is connected to the Yellow Sea by the Han River, which flows through Seoul.
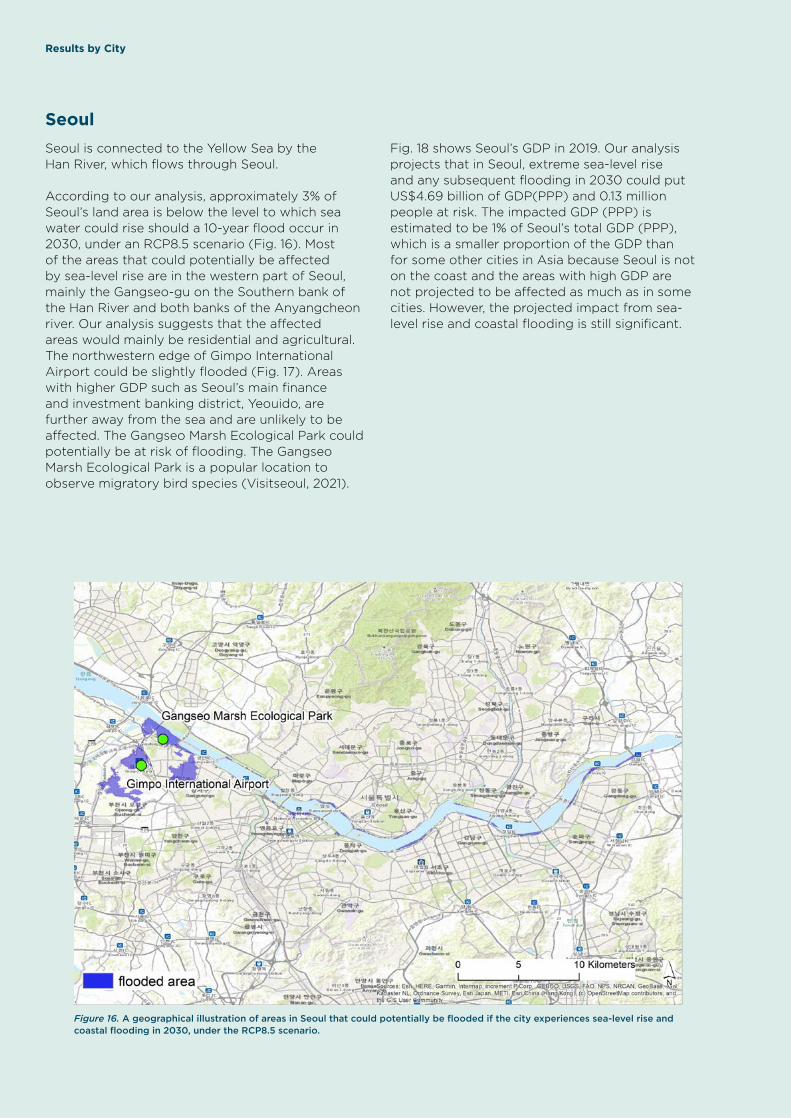
According to our analysis, approximately 3% of Seoul’s land area is below the level to which sea water could rise should a 10-year flood occur in 2030, under an RCP8.5 scenario (Fig. 16). Most of the areas that could potentially be affected by sea-level rise are in the western part of Seoul, mainly the Gangseo-gu on the Southern bank of the Han River and both banks of the Anyangcheon river. Our analysis suggests that the affected areas would mainly be residential and agricultural. The northwestern edge of Gimpo International Airport could be slightly flooded (Fig. 17). Areas with higher GDP such as Seoul’s main finance and investment banking district, Yeouido, are further away from the sea and are unlikely to be affected. The Gangseo Marsh Ecological Park could potentially be at risk of flooding. The Gangseo Marsh Ecological Park is a popular location to observe migratory bird species (Visitseoul, 2021).
Fig. 18 shows Seoul’s GDP in 2019. Our analysis projects that in Seoul, extreme sea-level rise and any subsequent flooding in 2030 could put US$4.69 billion of GDP(PPP) and 0.13 million people at risk. The impacted GDP (PPP) is estimated to be 1% of Seoul’s total GDP (PPP), which is a smaller proportion of the GDP than for some other cities in Asia because Seoul is not on the coast and the areas with high GDP are not projected to be affected as much as in some cities. However, the projected impact from sea-level rise and coastal flooding is still significant.
Figure 16. A geographical illustration of areas in Seoul that could potentially be flooded if the city experiences sea-level rise and coastal flooding in 2030, under the RCP8.5 scenario.
Results by City

17
Results by City
Figure 17. Gimpo international airport, Seoul, could potentially be flooded if the city experiences sea-level rise and coastal flooding in 2030, under the RCP8.5 scenario. © Shutterstock
Figure 18. A geographical illustration of Seoul’s GDP(PPP) in 2019.
18 The Projected Economic Impact of Extreme Sea-Level Rise in Seven Asian Cities in 2030
TaipeiLocated in the Taipei Basin, Taipei is bordered by the Xindian River on the south and Tamsui River on the west.
As previously mentioned, a storm surge, or a temporary rise in sea level, often occurs during tropical cyclones. According to past century typhoon records from the Central Weather Bureau (CWB) in Taiwan, an average of 4 typhoons make landfall on Taiwan each year, and the strength and scale of a typhoon has been increasing in the past year (Hsu et al., 2017). Typhoons often cause severe flooding to coastal areas of Taiwan (Hsu et al., 2014). In 2001, heavy rainfall at the same time as storm surges and high tides during Typhoon Nari resulted in major flooding in Taipei. Press reports were that the metro system in the city was severely damaged by floods and inoperable for almost six months (BBC, 2001).
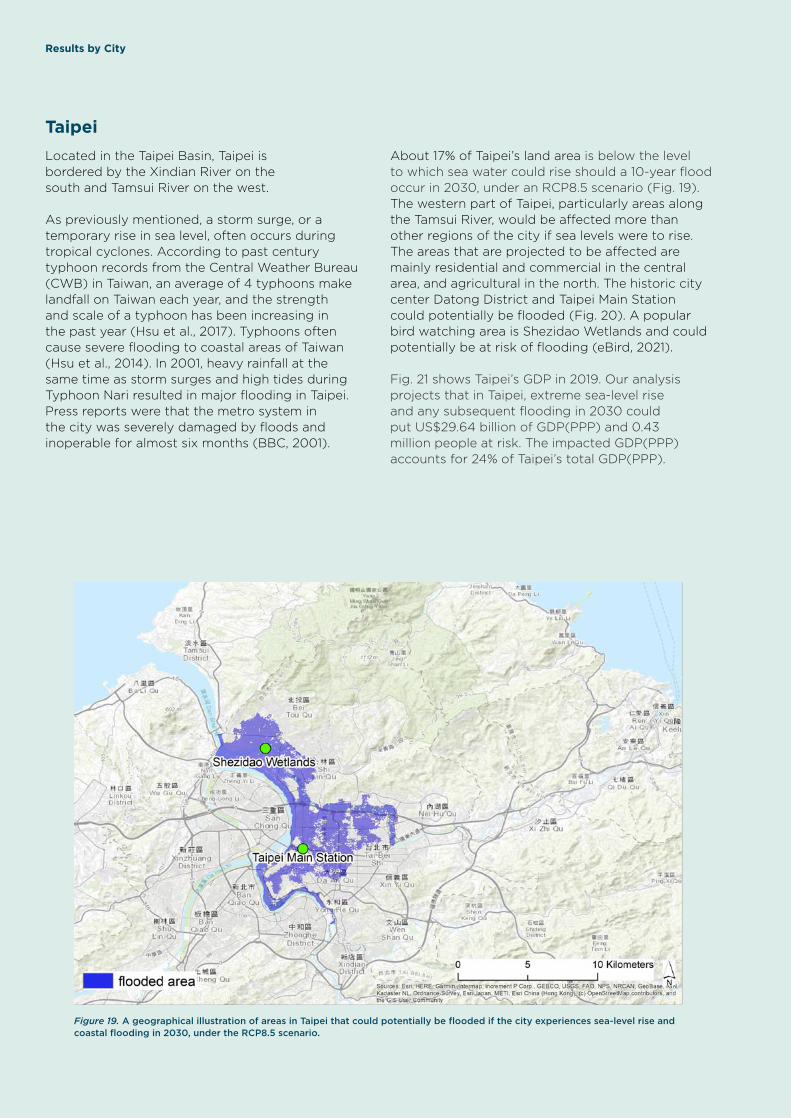
About 17% of Taipei’s land area is below the level to which sea water could rise should a 10-year flood occur in 2030, under an RCP8.5 scenario (Fig. 19). The western part of Taipei, particularly areas along the Tamsui River, would be affected more than other regions of the city if sea levels were to rise. The areas that are projected to be affected are mainly residential and commercial in the central area, and agricultural in the north. The historic city center Datong District and Taipei Main Station could potentially be flooded (Fig. 20). A popular bird watching area is Shezidao Wetlands and could potentially be at risk of flooding (eBird, 2021).
Fig. 21 shows Taipei’s GDP in 2019. Our analysis projects that in Taipei, extreme sea-level rise and any subsequent flooding in 2030 could put US$29.64 billion of GDP(PPP) and 0.43 million people at risk. The impacted GDP(PPP) accounts for 24% of Taipei’s total GDP(PPP).
Figure 19. A geographical illustration of areas in Taipei that could potentially be flooded if the city experiences sea-level rise and coastal flooding in 2030, under the RCP8.5 scenario.
Results by City

19
Results by City
Figure 20. Taipei Main Station could potentially be flooded if the city experiences sea-level rise and coastal flooding in 2030, under the RCP8.5 scenario. © Shutterstock
Figure 21. A geographical illustration of Taipei’s GDP(PPP) in 2019.

20 The Projected Economic Impact of Extreme Sea-Level Rise in Seven Asian Cities in 2030
City of ManilaThe City of Manila, one of the 16 cities that make up Metropolitan Manila, is situated on the eastern shore of Manila Bay. The Pasig River flows through the city, dividing Manila into the north and south. The average elevation is 5 meters above sea level. Some of the coastal areas of Manila are extremely low-lying, with elevations less than two to three meters above mean sea level (Morin et al., 2016).
From 1902 to 2005, between 3.6 and 6.0 tropical cyclones made landfall in the Philippines (Takagi & Esteban, 2016). In 2009, Metro Manila experienced its worst flooding when Typhoon Ketsana flooded almost the entire Metropolis and surrounding provinces, affecting almost 5 million people (National Disaster Coordinating Council, 2009). In 2020, Metropolitan Manila was again paralysed when Typhoon Vamco hit. It was reported in the media that about 1.9 million households were without power in the metropolis and nearby provinces (Al Jazeera and news agencies, 2020). In parts of Metro Manila, the water depth was up to the waist. In Manila Bay, the sea level is rising at 13.24 mm per year (Tseng, 2014). In addition, Metro Manila is sinking by a rate of 10 cm annually (Kramer, 2018), which is caused by the over-extraction of groundwater (Clemente et al., 2001).
Almost 87% of the City of Manila’s land area is below the level to which sea water could rise, should a 10-year flood occur in 2030, according to our analysis under an RCP8.5 scenario (Fig. 22). The potential flood areas, should sea levels rise, include highly populated areas as well as commercial and cultural areas in the city center, high-density residential areas further from the city center, industrial areas, as well as places of government agencies. Historical landmarks and popular tourist destinations such as Binondo, Intramuros, Malacanang Palace, and the Jose Rizal National Monument in Luneta Park could potentially be flooded (Fig. 23). Luneta is one of the largest urban parks in Asia and home to a variety of wildlife (Gonzales & Magnaye, 2017).
Fig. 24 shows Manila’s GDP in 2019. Our analysis projects that in the City of Manila, extreme sea-level rise and any subsequent flooding in 2030 could put US$39.24 billion of GDP(PPP) and 1.54 million people at risk. The impacted GDP(PPP) accounts for 87% of Manila’s total GDP(PPP).
Figure 22. A geographical illustration of areas in the City of Manila that could potentially be flooded if the city experiences sea-level rise and coastal flooding in 2030, under the RCP8.5 scenario.
Results by City

21
Results by City
Figure 23. The Jose Rizal National Monument in the City of Manila could potentially be flooded if the city experiences sea-level rise and coastal flooding in 2030, under the RCP8.5 scenario. © Jilson Ti
Figure 24. A geographical illustration of Manila’s GDP(PPP) in 2019.

22 The Projected Economic Impact of Extreme Sea-Level Rise in Seven Asian Cities in 2030
The analysis carried out for this report has modelled the potential areas, population and GDP of seven Asian cities that could be affected by sea-level rise and coastal flooding in 2030, under the RCP8.5 scenario (RCP8.5 is considered to be a ‘worst-case scenario’). The projected impact to the seven cities in Asia that we analysed could be significant. Therefore it is crucial that governments and corporations in each of the cities we have analysed urgently phase out the use and financing of fossil fuels to protect each city’s economy and safeguard its residents.
Greenpeace urges governments and corporations to take concrete actions faster, e.g. halt coal-financing and transition to large-scale renewable energy, to keep the world’s temperature rise within 1.5 degree celsius. We urge governments to develop coherent climate actions to curb greenhouse gas emissions and enable communities to cope with climate impacts. Specifically, we ask governments to:
1. develop more ambitious nationally determined contribution5 targets consistent with the Paris Agreement 1.5°C limit ahead of COP26
2. carry out and accelerate domestic energy transition by cancelling all new coal-fired power plants in the pipeline, expediting the phase-out of coal-fired power plants and nuclear power stations and accelerating the shift to clean and renewable energy
3. stop all finance for the overseas fossil fuel market4. stop all forms of deforestation and
conversion of peatlands5. enable cities and communities to
build climate resilience, by:a. updating infrastructure, including
establishing early warning systems, b. decentralizing climate information to enable
more people to plan for climate impactsc. strengthening community-based disaster risk
reduction and response to climate impacts.
Rising sea levels can impact national GDP and lead to the loss of homes, livelihoods and jobs, and can affect health, and the availability of fresh water and food. Coastal flooding, storm surges and extreme weather events can also have a negative impact on wildlife and ecosystems, which we also seek to protect. Currently climate action, including nationally determined contribution targets, is insufficient to avoid the risk of severe coastal flooding. If leaders fail to take the magnitude of the climate crisis seriously, the livelihoods of their citizens as well as national economies are likely to become increasingly vulnerable to sea-level rise, tropical cyclones and storm surges.
Conclusion

23
Abidin, H.Z., Andreas, H., Gumilar, I. et al. 2011. Land subsidence of Jakarta (Indonesia) and its relation with urban development. Nat Hazards 59, 1753. doi:10.1007/s11069-011-9866-9
Akmalah, E., & Grigg, N. 2011. Jakarta flooding: Systems study of socio-technical forces. Water International, 36(6), 733–77. doi:10.1080/02508060.2011.61072910.1080/02508060.2011.610729
Al Jazeera and news agencies. 2020. Manila paralysed after Typhoon Vamco sweeps across Philippines. 12 Nov 2020https://www.aljazeera.com/news/2020/11/12/manila-paralysed-after-typhoon-vamco-sweeps-across-philippines
BBC. 2001. Typhoon Nari kills 48 in Taiwan. 18 September 2001. http://news.bbc.co.uk/2/hi/asia-pacific/1550748.stm
Brown, S., Nicholls, RJ., Vafeidis, A, Hinkel, J. & Watkiss, P. 2011. The Impacts and Economic Costs of Sea-Level Rise in Europe and the Costs and Benefits of Adaptation. Summary of Results from the EC RTD ClimateCost Project. In The ClimateCost Project. Final Report (eds. P. Watkiss). Volume 1: Europe. Published by the Stockholm Environment Institute, Sweden. http://www.climatecost.cc/images/Policy_brief_2_Coastal_10_lowres.pdf
Buis, A. 2019. The Atmosphere: Getting a Handle on Carbon Dioxide. 9 October 2019. https://climate.nasa.gov/news/2915/the-atmosphere-getting-a-handle-on-carbon-dioxide/
C40. 2016. C40 Good Practice Guides: Tokyo - Super levees. 15th February, 2016. https://www.c40.org/case_studies/c40-good-practice-guides-tokyo-super-levees
Center for International Earth Science Information Network - CIESIN - Columbia University. 2016. Gridded Population of the World, Version 4 (GPWv4): Population Density Adjusted to Match 2015 Revision UN WPP Country Totals. Palisades, NY: NASA Socioeconomic Data and Applications Center (SEDAC). doi.org:10.7927/H4HX19NJ. Accessed 14 May 2021.
Clemente, R. et al. 2001. Groundwater Supply in Metro Manila:Distribution, Environmental and Economic Assessment. DISCUSSION PAPER SERIES NO. 2001-06. https://citeseerx.ist.psu.edu/viewdoc/download?doi=10.1.1.155.1356&rep=rep1&type=pdf
CSRI. 2019. Cabinet Secretariat of the Republic of Indonesia. BMKG Warns Against Heavy Rain on Christmas, New Year Holiday. Published online December 24, 2019. Available at: https://setkab.go.id/en/bmkg-warns-against-heavy-rain-on-christmas-new-year-holiday/ [Accessed June 4, 2021.]
Ebird. 2021. https://ebird.org/hotspot/L6675201Edogawa City Planning. 2019. Edogawa City Hazard Map. May 2019. https://www.city.edogawa.tokyo.jp/documents/519/sassi-en.pdf
GFDL. 2021. Global Warming and Hurricanes An Overview of Current Research Results. https://www.gfdl.noaa.gov/global-warming-and-hurricanes/
Gonzales, L. & Magnaye, D. 2017. Measuring the Urban Biodiversity of Green Spaces in a Highly Urbanizing Environment and Its Implications for Human Settlement Resiliency Planning: The Case of Manila City, Philippines, Procedia Environmental Sciences 37: 83-100
Hay, C., Morrow, E., Kopp, R. et al.2015 Probabilistic reanalysis of twentieth-century sea-level rise. Nature 517, 481–484. doi.org:10.1038/nature14093
Hsu, T.-W., Shih, D.-S. ,Li, C.-Y., Lan, Y.-J., & Lin, Y.-C. 2017. A Study on Coastal Flooding and Risk Assessment under Climate Change in the Mid-Western Coast of Taiwan. Water, 9, 390. doi.org:10.3390/w9060390 https://ascelibrary.org/doi/abs/10.1061/%28ASCE%29HE.1943-5584.0001069
IPCC. 2018. Summary for Policymakers. In: Global Warming of 1.5°C. An IPCC Special Report on the impacts of global warming of 1.5°C above pre-industrial levels and related global greenhouse gas emission pathways, in the context of strengthening the global response to the threat of climate change, sustainable development, and efforts to eradicate poverty [Masson-Delmotte, V., P. Zhai, H.-O. Pörtner, D. Roberts, J. Skea, P.R. Shukla, A. Pirani, W. Moufouma-Okia, C. Péan, R. Pidcock, S. Connors, J.B.R. Matthews, Y. Chen, X. Zhou, M.I. Gomis, E. Lonnoy, T. Maycock, M. Tignor, and T. Waterfield (eds.)].
Japan Meteorological Agency. 2020. Special feature To protect lives and livelihoods from the intensifying heavy rain disaster. https://www.jma.go.jp/jma/kishou/books/hakusho/2020/index1.html
References

24 The Projected Economic Impact of Extreme Sea-Level Rise in Seven Asian Cities in 2030
Kirezci, E., Young, I.R., Ranasinghe, R. et al. 2020. Projections of global-scale extreme sea levels and resulting episodic coastal flooding over the 21st Century. Sci Rep 10, 11629 doi:10.1038/s41598-020-67736-6
Knutson, T.,et al. 2020. Tropical Cyclones and Climate Change Assessment: Part II: Projected Response to Anthropogenic Warming.Bulletin of the American Meteorological Society 101(3). https://journals.ametsoc.org/view/journals/bams/101/3/bams-d-18-0194.1.xml?tab_body=pdf
Kossin, J.P. Knapp, K.R. Olander, T.L. & Velden, C.S. 2020. Global increase in major tropical cyclone exceedance probability over the past four decades. Proceedings of the National Academy of Sciences 117 (22) 11975-1980. doi: 10.1073/pnas.1920849117 https://www.pnas.org/content/117/22/11975
Kramer, K. 2018. Sinking Cities, Rising Seas: A perfect storm of climate change and bad development choices.Christian Aid. https://www.christianaid.org.uk/sites/default/files/2018-10/Christian-Aid-Sinking-cities-rising-seas-report.pdf
Kulp, S.A. & Strauss, B.H. 2019. New elevation data triple estimates of global vulnerability to sea-level rise and coastal flooding. Nature Communications 10: 4844 . doi:10.1038/s41467-019-12808-z https://www.nature.com/articles/s41467-019-12808-z
Kummu, M., Taka, M. & Guillaume, J. 2018. Gridded global datasets for Gross Domestic Product and Human Development Index over 1990–2015. Scientific Data 5, 180004 doi:10.1038/sdata.2018.4 https://www.nature.com/articles/sdata20184
Lee, B.Y. , Wong, W.T. & Woo, W.C. 2010. Sea-level Rise and Storm Surge –Impacts of Climate Change on Hong Kong. HKIE Civil Division Conference 2010, 12-14 April 2010, Hong Kong. https://www.hko.gov.hk/en/publica/reprint/files/r915.pdf
Lyons, K. 2019. Why is Indonesia moving its capital city? Everything you need to know. 27 August, 2019. https://www.theguardian.com/world/2019/aug/27/why-is-indonesia-moving-its-capital-city-everything-you-need-to-know
Morin, V.M., Warnitchai, P. & Weesakul, S. 2016. Storm surge hazard in Manila Bay: Typhoon Nesat (Pedring) and the SW monsoon. Natural Hazards (81), 1569–1588. doi.org:10.1007/s11069-016-2146-y
National Disaster Coordinating Council, 2009. Final report on tropical storm “Ondoy“. https://ndrrmc.gov.ph/attachments/article/1543/Update_Final_Report_TS_Ondoy_and_Pepeng_24-27SEP2009and30SEP-20OCT2009.pdf
Phien-we,j N. Giao, PH. Nutalaya, P. 2006. Land subsidence in Bangkok, Thailand. Eng Geol 82:187–210.https://www.researchgate.net/publication/223622817_Land_subsidence_in_Bangkok_Thailand
Rahman, S., Sumotarto, U., & Pramudito, H. 2018. Influence the condition land subsidence and groundwater impact of Jakarta coastal area. IOP Conference Series: Earth and Environmental Science. 106 012006. https://iopscience.iop.org/article/10.1088/1755-1315/106/1/012006/meta
Rukmana, D. 2016. Flood Governance in Jakarta: The Role of CBOs in Mitigating Annual Floods. 7th January, 2016. https://www.mei.edu/publications/flood-governance-jakarta-role-cbos-mitigating-annual-floods
Schinko, T., et al. 2020. Economy-wide effects of coastal flooding due to sea level rise: a multi-model simultaneous treatment of mitigation, adaptation, and residual impacts. Environmental Research Communications 2(1) 015002 https://iopscience.iop.org/article/10.1088/2515-7620/ab6368#fnref-ercab6368bib61
Seneviratne, S.I., N. Nicholls, D. Easterling, C.M. Goodess, S. Kanae, J. Kossin, Y. Luo, J. Marengo, K. McInnes, M. Rahimi, M. Reichstein, A. Sorteberg, C. Vera, and X. Zhang. 2012. Changes in climate extremes and their impacts on the natural physical environment. In: Managing the Risks of Extreme Events and Disasters to Advance Climate Change Adaptation [Field, C.B., V. Barros, T.F. Stocker, D. Qin, D.J. Dokken, K.L. Ebi, M.D. Mastrandrea, K.J. Mach, G.-K. Plattner, S.K. Allen, M. Tignor, and P.M. Midgley (eds.)]. A Special Report of Working Groups I and II of the Intergovernmental Panel on Climate Change (IPCC). Cambridge University Press, Cambridge, UK, and New York, NY, USA, pp. 109-230.https://www.ipcc.ch/site/assets/uploads/2018/03/SREX-Chap3_FINAL-1.pdf
References
25
Setiadi, R., Baumeister, J; Burton, P; Nalau, J. 2020. Extending Urban Development on Water: Jakarta Case Study. Environment and Urbanization ASIA, doi: 10.1177/0975425320938539 https://research-repository.griffith.edu.au/bitstream/handle/10072/397378/Burton442235-Accepted.pdf;jsessionid=03F286BE96F60BCFD98D5D82F2F506E4?sequence=3
Surya, M.Y., He, Z. Xia, Y. & Li, L. 2019. Impacts of Sea Level Rise and River Discharge on the Hydrodynamics Characteristics of Jakarta Bay (Indonesia). Water 11, 1384, doi:10.3390/w11071384
Takagi, H., Esteban, M. 2016. Statistics of tropical cyclone landfalls in the Philippines: unusual characteristics of 2013 Typhoon Haiyan. Nat Hazards 80, 211–222. https://doi.org/10.1007/s11069-015-1965-6
Tokyo Bureau of Port and Harbor. 2021. A Tokyoite is protected from a tunami and a tidal wave.https://kouwan-metro-tokyo-lg-jp.j-server.com/LUCKOUWAN/ns/tl.cgi/https://www.kouwan.metro.tokyo.lg.jp/jigyo/madoguchi/kensetsu-jimusyo/UmetateKankyo/?SLANG=ja&TLANG=en&XMODE=0&XCHARSET=utf-8&XJSID=0
Tseng, Y., TDing, JJ. & Lou, JY. 2014. Global sea level change in the past century. OCEANS 2014 - TAIPEI. IEEE.doi: 10.1109/OCEANS-TAIPEI.2014.6964580https://ieeexplore.ieee.org/abstract/document/6964580
Visitseoul. 2021. https://english.visitseoul.net/nature/Gangseo-Marsh-Ecological-Park_/24154
Wikramanayake, E., Or, C., Costa, F., Wen, X., Cheung, F. & Shapiro, A. 2020. A climate adaptation strategy for Mai Po Inner Deep Bay Ramsar site: Steppingstone to climate proofing the East Asian-Australasian Flyway. PLoS ONE 15(10): e0239945. doi:10.1371/journal.pone.0239945
World Ocean Review. 2010. 1 Living with the oceans – A report on the state of the world’s oceans. maribus gGmbH, Pickhuben 2, 20457 Hamburg, Germany. ISBN 978-3-86648-012-4. https://worldoceanreview.com/wp-content/downloads/wor1/WOR1_en_chapter_3.pdf
Xu, C., Kohler, T. A., Lenton, T. M. 2020. Svenning, J.-C. & Scheffer, M. Future of the human climate niche. Proc. Natl. Acad. Sci. U.S.A. 117, 11350–11355. DOI: 10.1073/ pnas.1910114117Yamashita, M. & Mitsumata, J. 2013. Does Global Warming Affect Typhoon Patterns in Japan? Discussion from the Viewpoints of the Numbers of Typhoons That Develop, Approach, and Hit Japan, and Their Intensities. Resources and Environment 3(5): 115-128, doi:10.5923/j.re.20130305.02
Yong, E. 2021. Understanding the economic impacts of sea-level rise on tourism prosperity: Conceptualization and panel data evidence, Advances in Climate Change Research 12(2): 240-253. /doi:10.1016/j.accre.2021.03.009.
References
26 The Projected Economic Impact of Extreme Sea-Level Rise in Seven Asian Cities in 2030
1 In this report, ‘extreme sea-level rise’ refers to sea level rise caused by high tides and storm surges, such as once-in-a-decade flooding events (i.e., events with a return period of ten years).
2 https://www.worldpop.org/3 https://www.usgs.gov/mission-areas/water-resources/sci-
ence/saltwater-intrusion4 In this report, a ‘ten-year flood’ is a coastal flooding
event that is caused by storm surges and high tides. The flood’s height above sea level has a 10% annual chance of being exceeded.
5 Nationally determined contributions or NDCs are the pledges made by each country or region to reduce greenhouse gas emissions and to meet the Paris agreement targets.
Endnotes
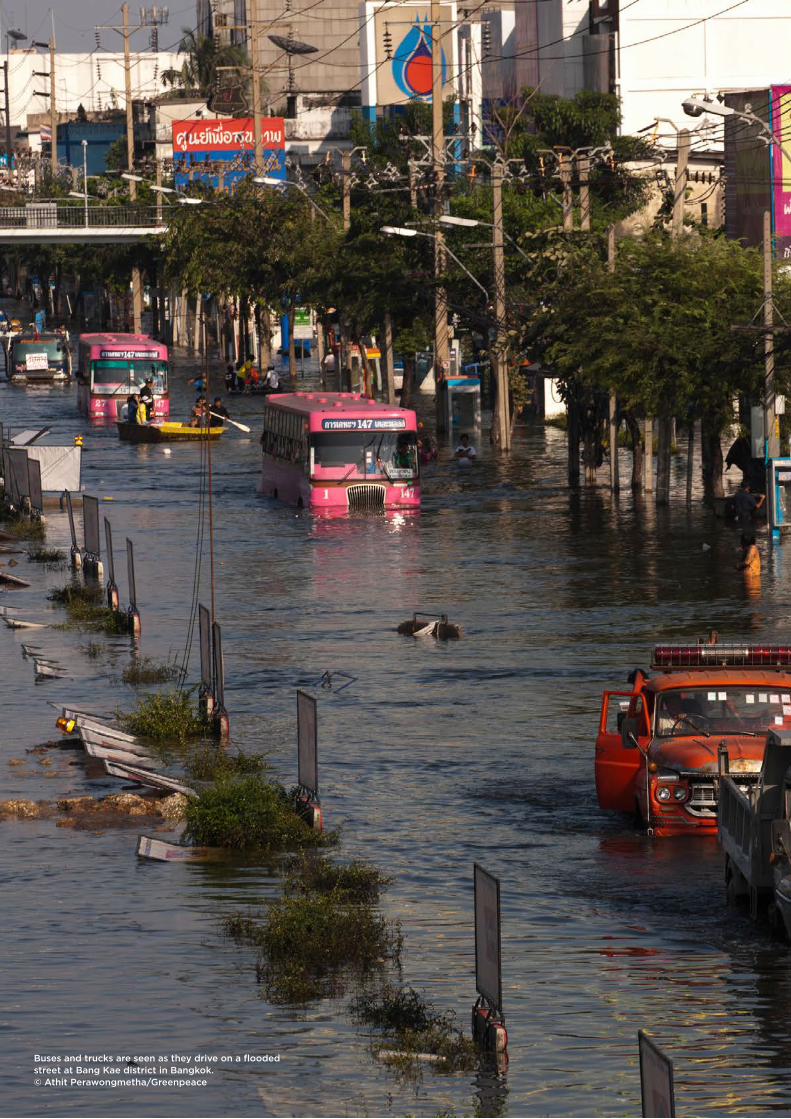
27Buses and trucks are seen as they drive on a flooded street at Bang Kae district in Bangkok. © Athit Perawongmetha/Greenpeace

28 The Projected Economic Impact of Extreme Sea-Level Rise in Seven Asian Cities in 2030
Published June 2021 by Greenpeace East Asia
Copyright © 2021 Greenpeace
Authors: Jiao Wang, Mikyoung KimEditors: Kathryn Miller, Erin NewportDesign: Lauren AustinContributors: Greenpeace East Asia, Greenpeace South East Asia, Greenpeace East Asia Research UnitSpecial thanks to: Climate Central, Dr. Matti Kummu
Disclaimer Greenpeace East Asia (“GPEA”) acts to change attitudes and behaviors, to protect and conserve the environment and to develop solutions for a green and peaceful future. GPEA is politically independent and does not take sides in territorial disputes. Boundaries on maps and place names on maps and in the text reflect the data sources used and do not represent GPEA’s political stance.
Maps throughout this book were created using ArcGIS® software by Esri. ArcGIS® and ArcMap™ are the intellectual property of Esri and are used herein under license. Copyright © Esri. All rights reserved. For more information about Esri® software, please visit www.esri.com.
www.greenpeace.org/eastasia


![[PPT]Rise of Totalitarianism - Weeblyglaserandmaloney.weebly.com/.../rise_of_totalitarianism_part_1.ppt · Web viewRise of Totalitarianism Stalin ... Extreme sense of nationalism](https://img.pdfslide.us/doc/110x75/5aa274b17f8b9ab4208d1209/pptrise-of-totalitarianism-we-viewrise-of-totalitarianism-stalin-extreme.jpg)