Embed Size (px)
Citation preview
THEPRINCIPLESOFMRIANDANALYSISOFTHEADOPTIONOFMRIINCHINA 1
THEPRINCIPLESOFMRIANDANALYSISOFTHEADOPTIONOFMRIINCHINA
ZHEKAI JIN Mentored by Dr. Robin B. Kinnel
HangZhouForeignLanguageSchool
AuthorNote
ZheKaiJin,CambridgeA-LevelCenter,HangZhouForeignLanguageSchool
ThisresearchisconductedundertheprogramcalledPioneer
Contact:[email protected]
THEPRINCIPLESOFMRIANDANALYSISOFTHEADOPTIONOFMRIINCHINA
2
Abstract
This paper explores the technical side of the Magnetic Resonance Imaging (MRI), the
real life application and its particular usage at China. Firstly, the principles of magnetic
resonance imaging will be introduced along with its imaging method and hardware.
Within this section, MRI’s interrelatedness with nuclear magnetic resonance (NMR) will
also be explained. Then, some advanced techniques and limitations in the MRI will be
explained and a brief introduction of history will follow. Then there is a comparison of
MRI with X-ray and computerized tomography (CT), and MRI’s distinct features are
analyzed. In the last session, there is a real-life-usage analysis of MRI in China, and the
reason why China has such a low percentage of the global MRI market share will be
analyzed, followed by the growing trend of MRI in China and some challenges MRI’s
growth in China may face. The goal of this paper is to let patients know what MRI is and
the benefits it can bring. An insight into China’s MRI usage is also provided.
Key words: magnetic resonance imaging, nuclear magnetic resonance
THEPRINCIPLESOFMRIANDANALYSISOFTHEADOPTIONOFMRIINCHINA 3
THEPRINCIPLESOFMRIANDANALYSISOFTHEADOPTIONOFMRIINCHINA
Magnetic resonance imaging (MRI) is an imaging technique used primarily in
medical settings to produce high quality images of the inside of the human body. The
following section briefly introduces what MRI is and how it works.
The Workings of Magnetic Resonance
The Basics
Since Magnetic resonance imaging technology is derived from Nuclear magnetic
resonance, it uses the basic principle of Nuclear magnetic resonance and modifies it to fit
the human body as the subject. And it all starts with a nature attributed to the nucleons:
spin. Spin is a fundamental and intrinsic property of nature. But it is the unpaired nucleon
that really matters here because the spins cancel each other out when nucleons pair up
together. It is worthy to note that electrons also possess spin, which will explain the
chemical shift phenomenon later in the text. Putting it together, individual unpaired
electrons, protons, and neutrons each possess a spin with a value of 1/2, and the total spin
of protons and neutrons will be called the nuclear spin. While the spin direction of a
nucleus is random in its natural state, there is a magnetic field generated (symbolized by
B), called the magnetic moment. Therefore, when the nucleus is put into an external
magnetic field, it will behave like a little magnet. Thus, it will align itself either with the
field or against it according to quantum mechanics. So the nucleus will align itself either
parallel or anti-parallel with the external field. The spin that aligns itself against the field,
called the beta-spin state, will have a higher energy state, while the spin that aligns itself
with the field has a lower energy state, to be called the alpha-spin state. Because the
a-spin state is lower in energy, there are slightly more alpha spins than beta spins.
Though there are only a few more alpha spins than beta spins, this small excess of alpha
spins is the most crucial part of both NMR and MRI. This happens because a particle
with nuclear spin can absorb a photon (with a specific electromagnetic energy that is
equal to the energy difference between the two states) to flip from alpha to beta and from
beta to alpha. And the energy difference is proportional to both the gyromagnetic ratio of
that particle under study, which is decided by the magnetic moment of its nucleus, and
the external magnetic field strength. An interesting thing to note here is that when an
THEPRINCIPLESOFMRIANDANALYSISOFTHEADOPTIONOFMRIINCHINA
4
alpha energy spin flips, there can be a beta spin that flips to cancel out its effect. But
when a few more alpha spins exist to use up the electromagnetic energy, this energy
absorption can be detected and can give a signal leading to a component in the spectrum,
where different spins give distinct signals. To put a definition here, when a nucleus is
subjected to the right combination of magnetic field and electromagnetic radiation to flip
its spin, it is said to be “in resonance” and its absorption of energy is detected by the
NMR spectrometer. This is the origin of the term “nuclear magnetic resonance.” But the
resonance phenomenon can’t fully explain how the NMR can be used to detect the
structure of most organic molecules since resonance will happen on every single atom of
the same element in the exact same way since all atoms of the element have the same
gyromagnetic ratio. If this really happens, we can’t use NMR to get the structure of the
organic compound because we can’t tell which part of the molecule an atom such as
hydrogen is attached to and which functional group it belongs to since all the hydrogen
atoms give the same signal. Here is where the chemical shift, which results from the
electrons around the nucleus, comes into play. Put in a magnetic field, the electrons will
circulate around the nucleus to produce an induced magnetic field that is against the
external magnetic field. This part is of great importance because the electrons will cause
the magnitude of the real magnetic field the nucleus is subjected to to be less than the
external magnetic field, a phenomenon called shielding. And in order to make this
nucleus undergo resonance under a specific frequency that allows it to undergo resonance
when there are no electrons around, the applied magnetic field must be increased to make
it possible. This fact leads to differences between the fields needed to have the atoms at
resonance due to different extents of shielding in different chemical environments around
the atoms; atoms with high electronegativity will have a de-shielding effect on their
surroundings while the atoms with low electronegativity tend to have a shielding effect
on their surroundings. With this fact, the molecular formula of the molecule can be
deduced from the signals of an NMR spectrometer.
But the signals we get from the resonance do not make up a nuclear magnetic
resonance spectrum yet. There is a data processing step that needs to be detailed. And we
need to look at all the spins at a macroscopic scale. The first step is to define the spin
THEPRINCIPLESOFMRIANDANALYSISOFTHEADOPTIONOFMRIINCHINA 5
packet. A spin packet is a group of spins experiencing the same magnetic field strength.
Because there are more alpha spins, the net spin direction is on the positive z-axis. It is
represented as the net magnetization vector (NMV) (Hornak, 1996). When the resonance
happens, the NMV will tip away from the positive z-axis. The net spin will wobble
around the z-axis at the rate of resonance frequency, which is called Larmor frequency.
And this creates a longitudinal magnetization vector along the Z-axis, which already
existed, and a transverse magnetization vector, which is along the XY plane. This is a
phenomenon called precession. This precession will not last forever. There is relaxation
because there is a tendency for the nuclear spin to go back to its magnetic equilibrium. So
relaxation is basically the dephasing of magnetization. This relaxation is about both the
Z-axis and the XY plane, which is the horizontal plane. Precession induces a current in a
wire nearby and produces the sinusoidal curve with diminishing intensity due to the
relaxation. Thus the name, free induction decay (FID), is given. With the effect of
relaxation, the net magnetization vector will eventually get back to its original state
before the resonance and magnetization on the XY plane are decreased to zero after
relaxation finishes. The longitudinal relaxation (T1) is also called spin lattice relaxation
due to the fact that it must give all the energy it absorbs back to the surroundings to gain
its original NMV back. However, the transverse magnetization decay does not transfer
energy to its surroundings. The transverse magnetization decays because some spin in the
spin packet can’t catch up to other spins’ precession speeds; this out-of-phase situation
cancels out some of the magnetization effect instead of adding together individual’s
magnetization effects when all spins possess the same rate of precession. Gradually, those
spins that were in phase right after the resonance begin to lose their phases with respect to
others’. This fact happens because each spin has its little magnetic field and it randomly
interacts with others’ magnetic fields within the packet, which will cause a lower or faster
rate of precession, leading to cumulative loss of phase. This phenomenon, called
spin-spin relaxation, is only a transfer of energy between the spins, so its time constant
T2 is independent from the external magnetic field. While spin lattice relaxation and
spin-spin relaxation simultaneously happen, T1 is always longer or equal to T2. Another
factor contributing to the transverse dephase of the spins is the inhomogeneity of the
THEPRINCIPLESOFMRIANDANALYSISOFTHEADOPTIONOFMRIINCHINA
6
magnetic field, governed by the time constant T2*. This can be avoided by using spin
echo sequence, which will be elaborated later in the text. The loss of the magnetization
constructs free induction decay (Weishaupt et al, 2006). A computer and a radio receiver
can record the transverse FID in just a few seconds. Once the FID, which is the primary
data collected, is obtained, the spectrum can be calculated through a method called
Fourier transform (FT). From FID, we get the info of intensity against time as sinusoidal
curves that are set as intensity against time domain to get all the data we need to deduce
the molecular formula. Fourier transform is a mathematical method to change the time
domain of a graph to the frequency domain. Basically, Fourier transform uses the integral
of the product of the former function and a wave function to get a frequency domain.
Within that process, a method called quadrature detection is needed to differentiate
between +n and –n rotation, thus eliminating the imaginary value. This method puts both
the Mx (NMV along x axis) and My (NMV along x axis) into the Fourier transform to
give an imaginary value for negativity. Without this method, the detector must discard
one half of the signal to differentiate +N rotation and –N rotation using the linear
detection, which only detects Mx or My. With Fourier transform applied with phase
correction and Convolution Theorem, the frequency spectrum will give a clear and
obvious graph for a chemist to deduce the sample’s molecular formula. And all this is
crucial in MRI since there are many distinct imaging methods that tip the spin in different
sequences to get the FID and transformed data, which will be elaborated later.
Imaging Principles in MRI
In Magnetic Resonance Imaging (MRI), though the same basic principles of NMR
are followed, the hardware and imaging principles are quite different from those of NMR
owing to the fact that the subject is the human body; MRI needs to make many
adjustments to be able to fit in to clinical use. The human body is primarily water and fat.
Therefore, hydrogen atoms will make up about 63% of the human body by number
(Freitas, 1999). So MRI focuses primarily on the hydrogen nucleus rather than carbon or
nitrogen to get the most comprehensive data. MRI also subjects the human body to a
strong magnetic field, in the range of 1.5–4.0 T (15,000–40,000 gauss), and introduces a
particular frequency to let the hydrogen spin in the body resonate. The magnetic field is
THEPRINCIPLESOFMRIANDANALYSISOFTHEADOPTIONOFMRIINCHINA 7
60,000 times stronger and the resulting longitudinal magnetization is correspondingly
larger than the earth’s magnetic field (Weishaupt et al, 2006). Such a strong magnetic
field is used to detect the weak Magnetic Resonance (MR) signal. But one problem that
needs to be addressed here is that all the hydrogen particles are experiencing about the
same field and shielding, since there is no such thing as distinct chemical environments to
differentiate them. Even if they have different chemical environments, the difference
would be too small to give accurate data to locate their pinpoints. One way to solve this
problem is to add gradient to the external magnetic field, making each part of the location
subject to different magnetic fields. A magnetic field gradient is a variation in the
magnetic field with respect to position. There is a one-dimensional gradient and a
two-dimensional one. The isocenter of the magnet is where the reference point of the X,
Y, Z directions is set. The isocenter is also the geometric center of the main magnetic
field, where the field strength is not affected by any gradient. (Weishaupt et al, 2006) The
magnetic field at the isocenter is Bo and the resonant frequency is νo.
When a one-dimensional magnetic field gradient along the x direction, called Gx, is applied to the field, the resonance frequency will be ν = γ (Bo + x Gx ) = νo + γ x Gx,
where γ is the gyromagnetic constant of the hydrogen nucleus and v will be the resonance
frequency of that hydrogen at a particular location along the X direction. Since the signal gives us the frequency, we can have its location along the X-axis as x = (ν - νo ) / (γ Gx ).
This step is called frequency encoding. And the same step can be applied to the Y and Z
directions as well.
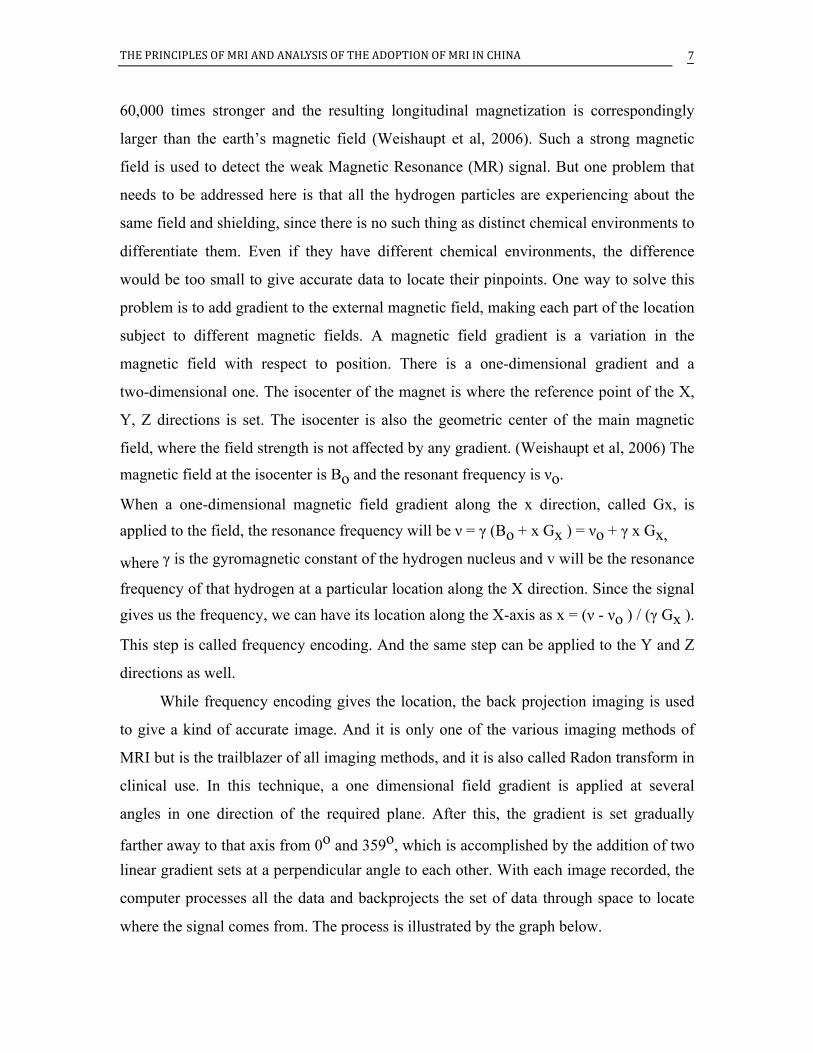
While frequency encoding gives the location, the back projection imaging is used
to give a kind of accurate image. And it is only one of the various imaging methods of
MRI but is the trailblazer of all imaging methods, and it is also called Radon transform in
clinical use. In this technique, a one dimensional field gradient is applied at several
angles in one direction of the required plane. After this, the gradient is set gradually
farther away to that axis from 0o and 359o, which is accomplished by the addition of two linear gradient sets at a perpendicular angle to each other. With each image recorded, the
computer processes all the data and backprojects the set of data through space to locate
where the signal comes from. The process is illustrated by the graph below.
THEPRINCIPLESOFMRIANDANALYSISOFTHEADOPTIONOFMRIINCHINA
8
Step 2: step 3: 1
But this is only a rough 2D imaging method and does not give accurate enough data
(mostly used in CT). In Nowadays MR imaging machine, another kind of locating
method is used to enable a more accurate image to be plotted. This is called the phase encoding gradient. The phase encoding gradient is a gradient in the magnetic field Bo. Its
main function is to give a specific phase angle to transverse magnetization vector. The
value of the angle depends on the location of that vector. Take two spins in a plane to see
how it works: firstly, the two spins are undergoing precession at the same Larmor
frequency since they are subject to the same field and they are both hydrogen nuclei.
When the gradient turns on, the vectors will precess about the direction of the applied magnetic field at a frequency given by the resonance equation (ν = γ (Bo + x Gx) = νo + γ
x Gx ). This means that each spin is in precession at its distinct rate. When this situation
is achieved, the gradient is then turned off to give back these two spins the same Larmor
frequency. But now, they have different phases. Thus, their positions in that plane along
the X direction, which is the phase encoding gradient applied, can be located. These give
the location of the signal in a plane, but another gradient is still needed to select which
plane should be looked at at a specific time to produce a desired image. This gradient is
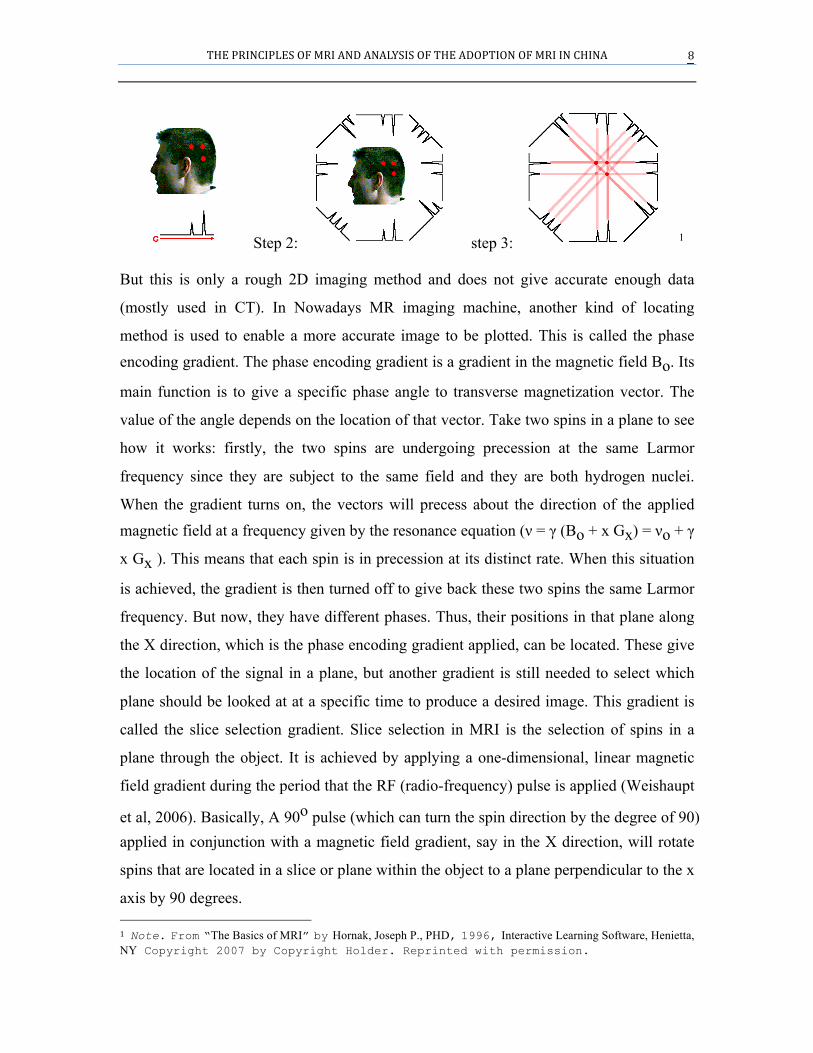
called the slice selection gradient. Slice selection in MRI is the selection of spins in a
plane through the object. It is achieved by applying a one-dimensional, linear magnetic
field gradient during the period that the RF (radio-frequency) pulse is applied (Weishaupt
et al, 2006). Basically, A 90o pulse (which can turn the spin direction by the degree of 90) applied in conjunction with a magnetic field gradient, say in the X direction, will rotate
spins that are located in a slice or plane within the object to a plane perpendicular to the x
axis by 90 degrees. 1 Note. From “The Basics of MRI” by Hornak, Joseph P., PHD, 1996, Interactive Learning Software, Henietta, NY Copyright 2007 by Copyright Holder. Reprinted with permission.
THEPRINCIPLESOFMRIANDANALYSISOFTHEADOPTIONOFMRIINCHINA 9
2And due to the specific sequence of this 90o pulse, only the spin at that slice (specific frequency) will be turned and the others will not because the larger or smaller frequency
will receive fewer turning angles. The slice selection gradient’s strength has an influence
on the thickness of the slice imaging produced, with stronger gradients leading to thinner
slices. With this slice selection gradient, the back projection imaging method and the one
with phase encoding can both give 2D images of the part specified by the doctors. Firstly
for the back projection imaging, a back projection tomographic image can be achieved by
the application of a particular sequence of pulses. At first, an apodized sinc pulse shaped
90o pulse is applied in conjunction with a slice selection gradient. A frequency encoding gradient, which is composed of a Gx and Gy gradient, is turned on once the slice
selection pulse is turned off. And then the Free Induction Decays are Fourier transformed
to produce the frequency domain spectrum, which is then backprojected to produce the
image. In terms of the frequency encoding in the back projection, Fourier Transform can
easily acquire the frequency from the signal. In the phase encoding gradient, we also
want to acquire the phase to pinpoint the location of the spin in the direction in which
phase encoding gradient is applied. Again, Fourier transform is needed (Hornak, 1996).
And this type of imaging method, in which phase encoding plays the major part, is called 2 2 Note. From “The Basics of MRI” by Hornak, Joseph P., PHD, 1996, Interactive Learning Software, Henietta,
THEPRINCIPLESOFMRIANDANALYSISOFTHEADOPTIONOFMRIINCHINA
10
Fourier Transform Tomographic Imaging (FT Tomographic Imaging), which is widely
used in modern MRI machines. It actually combines the use of phase encoding and
frequency encoding to give a more accurate image, with each type of encoding applying
to one dimension. A typical imaging sequence contains a 90o slice selective pulse, a slice
selection gradient pulse, a phase encoding gradient pulse, a frequency encoding gradient
pulse, and a signal. Firstly, the slice selection gradient and the slice selection RF pulse are
applied at the same time perpendicular to the slice plane required. The slice selection
gradient will be turned off after the RF is completed. Then, the phase encoding gradient
is applied along one of the sides of the image plane. Once the phase encoding gradient
has been turned off, a frequency-encoding gradient is applied along the other edge of the
image plane and a signal is recorded. The signal is free induction decayed and is saved by
the computer for later Fourier Transform. This typical sequence of pulses is usually
repeated 128 or 256 times, and separated by the time between each repetition called the
repetition time (RT), to collect all the data needed to produce an image. Each repetition
uses a different phase angle to record distinct free induction decay; thus the phase
encoding gradient is typically varied from a maximum value of G max to a minimum
value of - G max in 128 or 256 equal steps. The reason why so many different steps are
needed is because though each spin has its unique phase due to the phase encoding, the
phase is still an unknown and comparative value. So to solve for the unknown, there will
be a need for many different equations with different values of the unknown to solve the
equation and later Fourier transform (Weishaupt et al, 2006). With the two encodings set
at perpendicular directions, the exact point of the signal in the plane can be obtained by
two Fourier transforms, first to frequency and second for phase. And with slice selection,
the point can be pinpointed. The Fourier transformed data is displayed as an image by
converting the intensities of the peaks to intensities of pixels representing the
tomographic image. Furthermore, the phase encoding gradient can also be used in the
z-axis to give a 3D image. The whole body image can be beneficial since there are more
spins excited to reduce the ratio of signal to noise and the data acquired can be
postprocessed to give a specific plane image. The 3D imaging needs another axis to be
encoded, which is the z-axis, to give spin identification with phase encoding. It sounds
THEPRINCIPLESOFMRIANDANALYSISOFTHEADOPTIONOFMRIINCHINA 11
easy but the time needed to process the data is extremely long since there is a
three-dimensional Fourier transform with an additional transform in the z direction that
needs to be conducted. And the scan time is extremely long since x and y directions of
spatial encoding need to be done for each different-in-value z direction phase encoding
(Weishaupt et al, 2006).
Hardware
With the rough idea how an image can be created, here the hardware of the MRI is
introduced. A typical MRI machine consists of a strong magnet, a gradient system, a
radiofrequency (RF) transmitter, a highly sensitive RF receiver, the patient table,
electro-cardiography (ECG) equipment, respiration monitors and other peripheral devices
like a cooling system for the magnet. First, the magnet is used to generate the static
magnetic field (B0) and it is aligned to make the z-axis along the body axis of the
subjected human body. This part of the MRI, the magnet, is extremely important because
the magnetic field needs to be strong and stable enough to create the minor difference in
spins and give the exact Larmor frequency aided by gradients. Besides stability, a good
magnet should have an adequate strength to fit the hydrogen nucleus and radio frequency
range, which is about 0.1 to 3.0 Tesla. In addition, the homogeneity of the magnet should
be high enough that the inhomogeneity should be below 5 parts per million to ensure the
stability. There are three types of magnets primarily used for MRI: resistive magnets,
which are conventional electromagnets that depend on a high and constant power supply
to create a magnetic field, permanent magnets, which consist of ferromagnetic substances
and create a magnetic field that is maintained without an external power supply, and the
most frequently used one is a Superconducting magnet. Superconducting magnets consist
of a coil made of a niobium-titanium (Nb-Ti) alloy whose resistance to current flow is
virtually eliminated when cooled to near absolute zero (about 4°Kelvin or –269°C).
Coolants known as cryogens (usually liquid helium) are usually used to cool the magnet
down to this value. Because of the approximately 0 resistance, the current can flow
practically forever in the magnet. So the magnetic field can be maintained forever
without any additional power input, in theory. However, liquid helium evaporates and
must be resupplied regularly, about five times a year (Kinnel, 2014). And helium used in
THEPRINCIPLESOFMRIANDANALYSISOFTHEADOPTIONOFMRIINCHINA
12
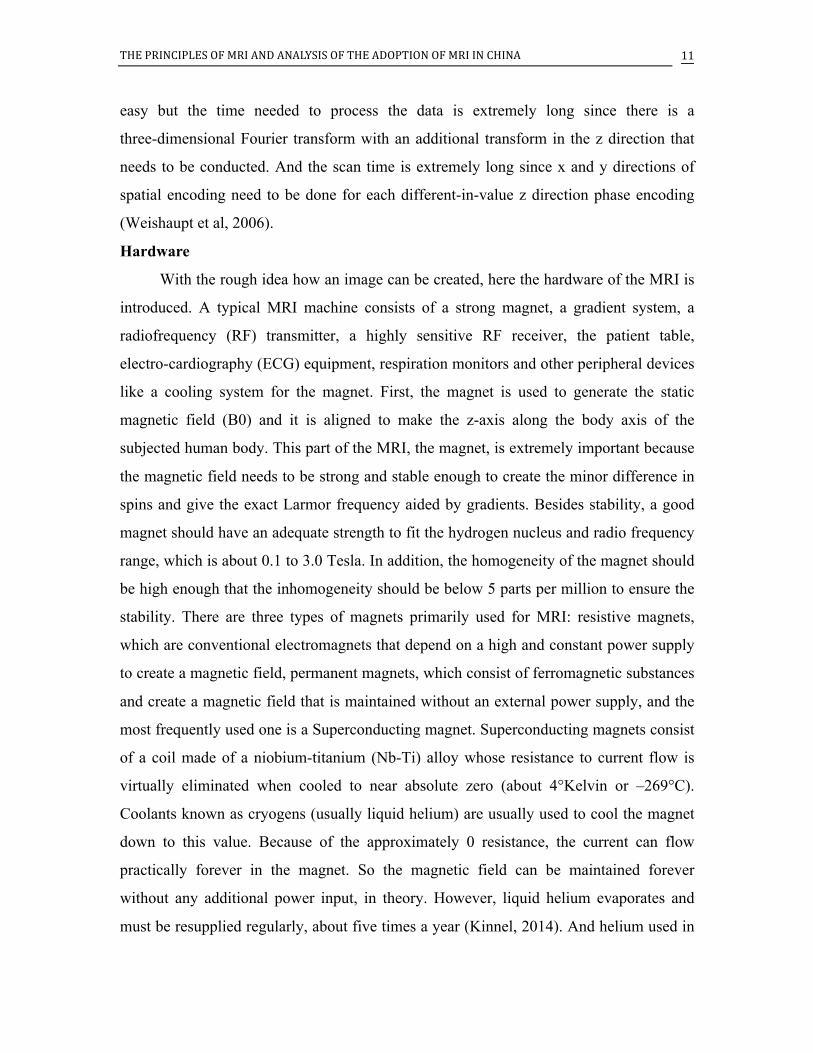
MRI constitutes about 20% of the world’s usage of helium each year (Lowe, 2012). The
pros and cons of the three kinds of magnets are listed below.
3
With the magnet set, the gradient system needs to be attached. The gradient is taking
charge of the spatial encoding, which consists of phase encoding and frequency encoding,
as mentioned before. The current inside the gradient coil would be several hundred
amperes, comparatively small relative to the magnet. A gradient coil along one axis
consists of two coils where currents flow in opposite directions, one that adds the Bo and
one that subtracts the Bo, to produce the specified magnetic field gradient (Weishaupt, D.,
& Chli, V, 2006). A good gradient should have three satisfactory values: Maximum
gradient strength (in units of mT/m), Rise time (time to maximum gradient amplitude),
and Slew rate (maximum gradient amplitude/rise time, which is the overall measure of
the gradient). If these criteria are matched, the gradient shall give a precise differentiation
of spin for Fourier transform. Early systems had maximum gradient strengths of 10 mT/m 3 A quench refers to a magnet’s sudden loss of superconductivity with subsequent breakdown of the magnetic field
and may be induced by very minute movements of the coil.
THEPRINCIPLESOFMRIANDANALYSISOFTHEADOPTIONOFMRIINCHINA 13
and rather slow switching times. Current generation systems can have maximum gradient
strengths of 100 mT/m and much faster switching times (slew rates) of 150 mT/m/ms.
These values allow the system to achieve a 0.7 mm slice thickness for 2D acquisitions
and 0.1 in 3D (Hornak, 1996, Ch. 6).
And the last major part is the Radio-frequency Coil, or RF coil. It is composed of a
powerful RF generator and a highly sensitive receiver. The RF coil is responsible for
putting all kinds of pulses into the patients’ body. As there are different kinds of
situations and needs, there are many types of coils and each has its special use. For
example, an internal coil is one designed to record information from regions outside of
the coil, such as a catheter coil designed to be inserted into a blood vessel (Hornak, 1996).
But all the coils need to be sensitive and stable enough to precisely and adequately get
both the phase and frequency info of those spins. With MR signal being very small, any
exterior interference may distort the detection. So the coil is put in a conductive structure
like a Faraday Cage to exclude the distortion. There are also specially customized coils
for better effects on a specific body part. For example, a single turn solenoid-imaging coil
can be used to image a man’s wrist. Unlike transmitters, the receiver has gone through a
lot of development to get to where it is now. In the 1980s, the linear analog detectors and
single channel digitizers were used. This meant that digitization rate of the MR signal
needed to be at least two times the largest frequency since Fourier transform requires half
of the data to be ignored to differentiate between positive and negative frequency. Later,
quadrature analog detectors with two channel digitizers became available and there was
no longer any need to discard values, leading to the requirement that digitization rate be
equal to the largest frequency. Now, the fast digitizers, single channel digitizers followed
by digital quadrature detection, are used to avoid quadrature ghost artifacts, which is one
of the limitations that will be discussed later. The data can be acquired with a good
quality now, but there is one thing to be cautious with: the wrap around. The wrap around
is the situation where there is too much frequency data in a spectrum and some data
wraps around to the other side or to the wrong place within a field of view (FOV), and
there are basically three ways to solve or reduce that. The first is oversampling. By
requiring much more data than necessary, one enlarges the FOV more than needed to
THEPRINCIPLESOFMRIANDANALYSISOFTHEADOPTIONOFMRIINCHINA
14
avoid wrap around. But this step will cause extra storage needs for the data. Secondly,
Digital filtering can be used. Digital filtering is basically removal of a selected band from
the signal. With any signals possessing a distance from the isocenter larger than a certain
value eliminated, the FOV can contain the spectrum properly. Moreover, decimation is
just removal of a certain ratio of the signal from the signal band to stop wrap around from
happening. These steps, pulse emission and image procession, are all controlled by the
computer that is in the radiologist’s hand.
Imaging sequences
All this equipment with powerful strength allows the MRI machine to work in a
proper way to get the image with proper handling. But what sequence of pules should be
used to acquire the image?
There are three types of basic sequences that would be used in MRI. They are the
spin echo (SE) sequence, the inversion recovery (IR) sequence, and the gradient echo
(GRE) sequence. The term ‘echo’ appears in two of these names, and it stands for the
signal induced in the receiver coil after phase coherence has been restored and it can be
measured (Weishaup et al, 2006). Besides, the two of them, IR and SE, are somewhat
related to the basic sequence that is used in the NMR.
The spin echo sequence in MRI is fundamentally the same as in NMR, using an
180o pulse after the first 90o pulse is put in the system, and there is a time difference
between the applications of these two pulses. When the first pulse is over, the NMV is
starting to diphase when the second pulse arrives, so there will be an echo as some spins
are undergoing rephase. In detail, when the first half of the echo time (TE) has elapsed, a
180° RF pulse is given to reverse the spin, or in another word, to let the positive phase
difference become negative. Because the same inhomogeneity is still subjected by the
spin, the originally faster spin will finally catch up with the slowest one after another half
time of TE has elapsed. At this moment, the spins are all back to being in phase again and
an echo is generated. The signal equation goes like this: S = k (1 - e-TR/T1) e-TE/T2
where the TR is defined as the time between the 90o pulse and the maximum amplitude in
the echo. The use of SE can eliminate the static magnetic field inhomogeneity (T2*)
since echo is taken into the data. This elimination of T2* can give a high precision in the
THEPRINCIPLESOFMRIANDANALYSISOFTHEADOPTIONOFMRIINCHINA 15
image, but a longer scan time for compensation. The long scan time causes an interesting
fact that is called the black blood effect, as the blood is flowing faster relative to the scan
time, leading to no signal in blood. According to this effect, doctors can tell the patients’
conditions regarding blood flow when it is not dark in image since a non-dark blood
image may suggest slow blood flow or thrombosis.
The inversion recovery sequence, which is also used in NMR technique, can be
related to fat suppression in MRI. Since fat appears bright both on T1-weighted images
and on T2-weighted fast spin-echo (FSE) Images, Fat suppression is often used in MRI to
give a clearer image. Fat suppression imaging, sometimes called chemical shift imaging,
therefore, is the production of an image from just the water in the body. An IR sequence
is an SE sequence with an additional 180° inversion pulse that precedes the usual 90°
excitation pulse and 180° rephasing pulse of a conventional SE sequence (Weishaup et al,
2006). The 180° simply changes NMV from the positive Z-axis to the negative, which
gives no FID at the time. But when some relaxation occurs, the 90° pulse is put in to give
transverse magnetization. The time between the 180° pulse and the 90° RF pulse is the
inversion time (TI). The inversion time can be adjusted to manipulate the image contrast,
which will be elaborated later. The inversion recovery’s sequence equation is as follows:
S = k (1 - 2e-TI/T1). And the fact that the equation crosses zero when TI = T1 ln2 is
very important to fat suppression. In the fat suppression method, the TI time is set to
T1ln2 where T1 is the spin-lattice relaxation time of fat. In that way, the fat signals can be
totally eliminated. And the same method can be used to suppress water signals where the
T1 of water is equal to TI over T1. (This method can be used only if fat’s T1 is not equal
to water’s).
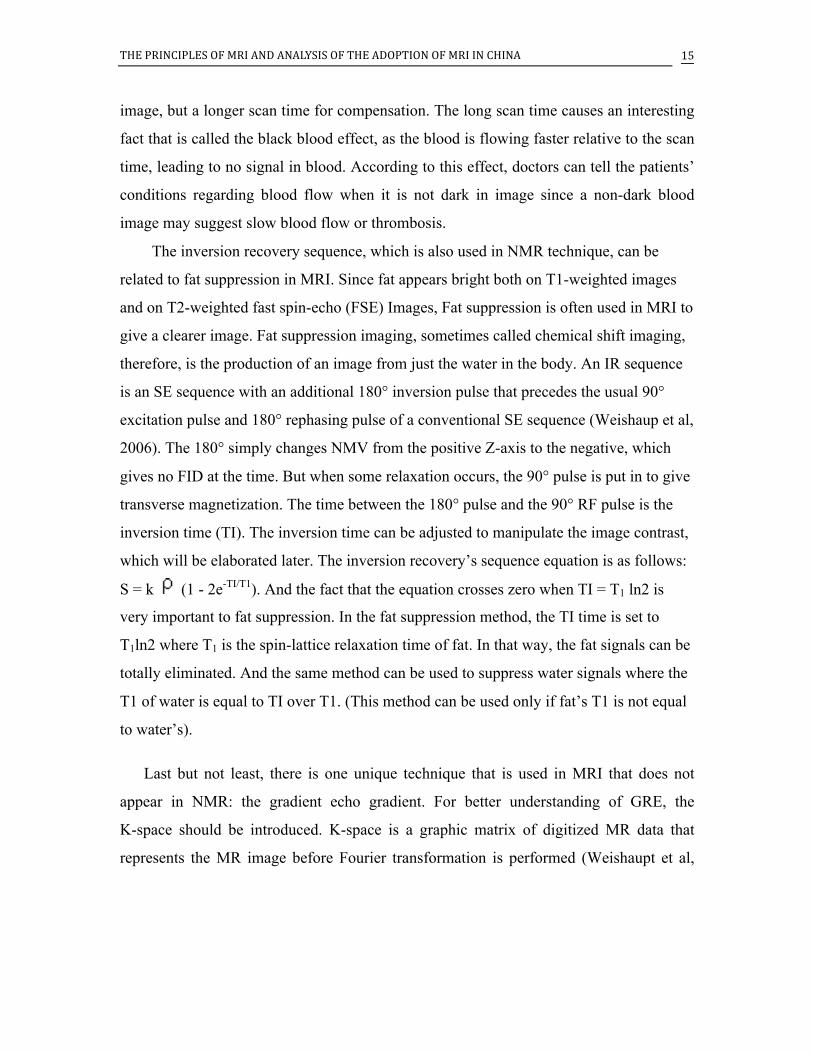
Last but not least, there is one unique technique that is used in MRI that does not
appear in NMR: the gradient echo gradient. For better understanding of GRE, the
K-space should be introduced. K-space is a graphic matrix of digitized MR data that
represents the MR image before Fourier transformation is performed (Weishaupt et al,
THEPRINCIPLESOFMRIANDANALYSISOFTHEADOPTIONOFMRIINCHINA
16
2006).
Each line in the K-space suggests one measurement, which is acquired every phase
encoding step. Data in the center of k-space primarily determines contrast in the image
while the periphery (the outer lines) primarily contains spatial information. And the
complex data in the right half of k-space is the complex conjugate of the data in the left
half of k-space. Similarly, the data in the top half of k-space is the complex conjugate of
the data in the bottom half of k-space. In a normal 90-FID sequence where only a
90-degree pulse sequence is used, only half of the K-space is used. However, if the echo
is generated in the center of the window, it will give both right and left halves of the
window that will speed up the scanning process. Essentially, GRE sequence uses a
gradient to generate an echo, as its name suggests. Firstly, a Frequency encoding gradient
with negative polarity is introduced to make spins out of phase with each other. Then, the
gradient reverses to give back the phase coherence where all the spins are back in phase
in the mid of the window with each other, giving out an echo. Here, an echo is produced
without using a refocusing 180-degree pulse, saving a large amount of scanning time. But
one artifact this sequence is facing is that static field inhomogeneity is not compensated
for and the signal decays with T2* to cause some imprecision (Weishaupt et al, 2006).
But this can be sort of prevented by a method called Multiecho sequence, which is
essentially the combination of SE and GRE sequences in one cycle. This allows T2
weighting (which will be discussed immediately) and quicker acquisition of data, which
will be elaborated soon. And one thing to keep in mind here is that all the basic pulses
introduced here are an addition to the former sequence discussed before; the spatial
encoding and slice selection are still needed.
THEPRINCIPLESOFMRIANDANALYSISOFTHEADOPTIONOFMRIINCHINA 17
Image contrast
Now, with the RF pulse technique filling in the gap within the process in terms of
how to efficiently excite spin, the question of how to differentiate the tumor from normal
tissue remains unaddressed. This leads to the image contrast. It is the tissue’s self-quality
that leads to viable differentiation. Three facts lead to its signal intensity or brightness on
an MR image and they are proton density, the T1 time of a tissue and the T2 time of a
tissue. Firstly, the proton density suggests that the number of excitable spins per unit
volume determines the maximum signal that can be obtained from a given tissue. Proton
density can be emphasized, leading to a proton density-weighted image, by minimizing
the other two attributes of tissues. The next one is T1 and it is strongly related to the
repetition time (TR) of the sequence. Repetition time (TR) is the length of the relaxation
period between two excitation pulses, as mentioned before. Since T1 is the time constant
for the longitudinal relaxation, if T1 is short enough to let the NMV back to the
equilibrium state before the next sequence is started, the MR signal that the receiver can
get will be larger. However, if the T1 is long and the NMV cannot get back to the
equilibrium as the next RF pulse is applied, the signal will be small and appear to be dark.
That’s also why the saturation phenomenon can happen. (Saturation is the situation when
a series of excitation pulses is applied, and the MR signal becomes weaker and weaker
after each repeat pulse). So T1 can be a determent for tissue discrimination and TR
adjustment is crucial for this step since very long TR can let tissues with both long and
short T1 get back to equilibrium. Images where T1 is emphasized would be called
T1-weighted and most of them have short TR. Finally, the T2 factor is related to the Echo
Time (TE), which is the interval between application of the excitation pulse and
collection of the MR signal. T2 is on the scale of a few hundred milliseconds, but TE can
be even smaller, on the scale of about 50 ms (Weishaupt et al, 2006). So if a small T1 is
used, the dephasing has just started and there would be a very small difference in the
signal. However if the TE is selected to be long (but not out of range where FID is null),
the T2 will play a significant part and the signal difference between different kinds of
tissue would be large and the tissue with long T2 will be brighter whereas the one with
short T2 will have a darker image. Besides these factors, there are also techniques like
THEPRINCIPLESOFMRIANDANALYSISOFTHEADOPTIONOFMRIINCHINA
18
magnetization transfer and presaturation, which can be used to enhance image contrast.
Since these techniques are more related to clinical use, they will not be discussed here.
What’s more, when some part of the body needs detailed examination, a chemical
contrast agent (CA) can be introduced to enhance the image contrast. CA, mostly
paramagnetic material, is a substance that is introduced into the body to change the
contrast between the tissues. Injectable contrast or dyes are mainly used by MRI to alter
the local magnetic field in the tissue being examined. Normal and abnormal tissue will
respond differently to this slight alteration given by the contrast agent, thus giving
differing signals. And the different signal will be represented as different shades in image.
An MRI system can display more than 250 shades of gray to depict the varying tissue.
This allows doctors to visualize different types of tissue abnormalities better than they
could without the contrast and identity tumors.
Fast Imaging
Now we have a good sense of all the procedures in MRI, but we would find the
imaging time extremely long since there are normally 256 steps for the phase encoding
step, where almost 8 minutes would be taken to produce one image if TR is set as 2
seconds. The imaging time for 10 pictures would be over one and a half hours. However,
the actual time in MRI, according to my experience, is 20 minutes. So what is the trick
here? It is the Multislice imaging technique. In fact, in the 2-second TR, there is a lot of
space unused, and the time waiting for the relaxation to finish can be used to excite other
slices on the body as long as it doesn’t affect the slice that is under imaging. This can be
accomplished by applying one magnitude slice selection gradient and changing the RF
frequency of the 90o pulses (Weishaupt et al, 2006). This technique, simple enough, has
become a default mode in the MRI machines nowadays.
Another mode that can be used in MRI is oblique imaging. Oblique imaging comes
into use when the required slice is not along the X, Y, Z directions. And a simple
transform matrix to combine the X, Y, Z directions and give the gradient in the direction
is needed. (The gradient directions’ relationship with the required slice is listed in the FT
imaging section).
Though multislice imaging can provide a relatively quick way to give the image,
THEPRINCIPLESOFMRIANDANALYSISOFTHEADOPTIONOFMRIINCHINA 19
with such an expensive machine like the MRI machine, scientists seek a faster way to
retrieve the image for time saving. The first way is to use the improved Gradient echo
sequence. In a clinical way, the GRE sequence does not have an exact 90-degree pulse.
Instead, a smaller tip angle would be used to allow the NMV to relax to its equilibrium
more quickly and be ready for the next sequence. Thus, the TR can be set to a fairly small
value to give an efficient imaging method. Besides, short TR also gives a favorable T1
weighting, as mentioned before. But certainly the signal will be smaller since the
transverse magnetization is smaller with a smaller tip angle. But overall, the image
quality is good and can be acquired in 2 to 3 seconds for a slice. This kind of GRE is
nearly perfect for quick motion scanning, for instance, to blood, and it reduces a lot of
motion artifacts.
However, there are other methods that do not reduce TR to give a quicker imaging.
Fractional NEX Imaging is one typical example. Since the K-space’s four halves have
interrelations with each other as pairs, the Fractional Nex Imaging method only records a
little over half of all the normal steps (256) in the phase encoding step and uses the
relationship to get the other half’s value. And this kind of method has the benefit of
reducing the imaging time without reducing the image contrast between tissues.
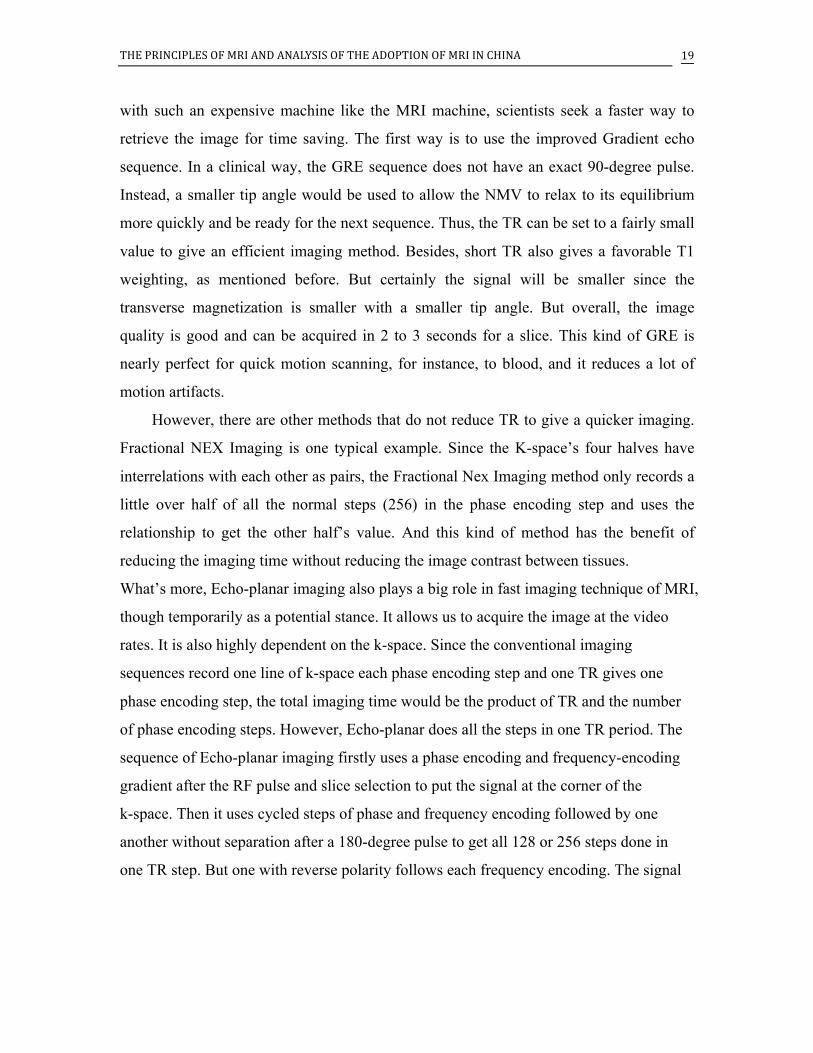
What’s more, Echo-planar imaging also plays a big role in fast imaging technique of MRI,
though temporarily as a potential stance. It allows us to acquire the image at the video
rates. It is also highly dependent on the k-space. Since the conventional imaging
sequences record one line of k-space each phase encoding step and one TR gives one
phase encoding step, the total imaging time would be the product of TR and the number
of phase encoding steps. However, Echo-planar does all the steps in one TR period. The
sequence of Echo-planar imaging firstly uses a phase encoding and frequency-encoding
gradient after the RF pulse and slice selection to put the signal at the corner of the
k-space. Then it uses cycled steps of phase and frequency encoding followed by one
another without separation after a 180-degree pulse to get all 128 or 256 steps done in
one TR step. But one with reverse polarity follows each frequency encoding. The signal
THEPRINCIPLESOFMRIANDANALYSISOFTHEADOPTIONOFMRIINCHINA
20
will traverse the K-space like this (the first picture stands for the trace in K-space and the
second for cycled sequence).4
This technique enables MRI to get an image with a resolution of 256×128 after a single
excitation pulse (single shot) in 70 msec, which corresponds to 16 images per second!
However, there are problems underlying this technique; the echo-planar sequence does
not give much image contrast due to the lack of T1 and the field inhomogeneity (T2*),
with an induced inhomogeneity caused by rapid switch of gradients leading to a
distortion to the image (Weishaupt et al, 2006). Thus, this method is not currently used
clinically. Besides these methods, there are also other advanced imaging methods, like
flow imaging and diffusion imaging, designed for particular usage.5
Limitations
Though an energetic and promising technology, MRI does have some limitations.
Sometimes the machine won’t act exactly as the theory assumes, so there are certain
artifacts lying in the MRI clinical use. An image artifact is any feature that appears in an
image, which is not present in the original imaged object. It may induce false positive
signals or false negatives. Some artifacts are caused by inappropriate operation, for
instance, the wrap around caused by improper field of view, while others may be related
to the source, like motion artifacts. There are lots of artifacts types and four specific ones
are introduced here.
4 AlotofthetechnicalsideexplanationsareparaphrasedfromideasinJoseph P. Hornak, Ph.D ‘s work “the basics of MRI” and Dominik Weishaupt’s “ How does MRI work?”. 5 Exploremoreathttp://www.cis.rit.edu/htbooks/mri/inside.htmChapter13
THEPRINCIPLESOFMRIANDANALYSISOFTHEADOPTIONOFMRIINCHINA 21
The first one to introduce is RF noise. An image that has an RF noise problem will
have some extent of blurriness and some bright spots appearing in somewhere that is
supposed to be dark (for example, where there is no tissue). The cause of this problem is
the failure of the RF shielding that prevents external noise from getting into the detector
(Hornak, 1996). A simple check of the sealing of the scanning room or anything improper
in the room, like a radio generator, will help to solve this problem. Another artifact,
which is often involved in clinical imaging, is called motion artifact. This is simply
caused by the motion of the imaged body or part of the body under screening. During
imaging, there are generally two Fourier transforms to be conducted on the signal, one for
the frequency encoding sequence and another for the phase coding. However, if the
imaged body is under motion, the signal which has undergone the first Fourier transform,
which can be considered as a wave, will be abruptly broken when some parts go to
another frequency. Since the Fourier pair of an abruptly truncated sine wave is a sinc
function, the second Fourier transform result in two points or a blurred line. Sometimes
this problem can be easily eliminated when it is possible to keep patients’ imaged body
part still. But when it is breathing or heart-beating constructing the artifact, the TR needs
to be adjusted to fit in the cardiac or respiratory cycle of the patient with a certain fixed
delay. Thus whenever the sequence is applied, the imaging part will be at the same place.
Moreover, as mentioned before in the text, there is another artifact called the quadrature
ghost artifact, which is related to the RF coil, particularly the receiver. Quadrature ghost
artifact is caused by the unequal efficiency of the gain of the two sets of doubly balanced
mixers, filters, and amplifiers in the real and imaginary channels of the quadrature
detector (Hornak, 1996). And the unequal gain of signal will cause the Fourier transform
to work improperly, thus creating a small component at the negative of any frequencies
present in the signal. This fact will give a ghost-like shadow in the image acquired.
Last but not least, there is the interesting magic angle. The magnetic resonance
imaging requires spins in tissue to be able to rotate freely, but this is unlikely in solids.
Thus the chemical shift and spin-spin coupling are dependent on the orientations of the
molecule. And the dipole interaction follows the equation (3cosθ2 - 1). Under this
circumstance, 54.7 degrees will give a dipole action as zero, causing a dark image. And a
THEPRINCIPLESOFMRIANDANALYSISOFTHEADOPTIONOFMRIINCHINA
22
molecule lying at this angle with Bo will have a longer T2 that leads to an increase in
signal, thus being potentially mistaken for a tumor (Gaillard, n.d.).
History of Magnetic Resonance
Earlier Works
With a clear mind of how MRI works and its pros and cons, now it’s the time to review
the historical development of MRI. And this can be in retrospect to the discovery of the
MR effect. Although the basic discovery of MR was often refered to the Nobel Prize in
1952, the fundamental phenomenon of MR is much older and may be traced back to the
Fourier transform which is the real watershed in the history of MR (Edelman, Hesselink,
Zlatkin, 2005).
“Fourier transform was developed in the 19th century by J. Fourier, who was one of the
chief engineers on Napoleon's expedition to Egypt.” (Edelman et al, 2005). Though an
engineer, Fourier had channeled mostofhiseffortstowardsthefieldofmathematics
andsciences, and Fourier transform was evidenceofthis. With Fourier transform
setting a mathematical basis for Magnetic Resonance at such an early stage, the
development of quantum mechanics did even more to provide a path towards the
discovery of Magnetic Resonance. In 1924, an Austrian physicist, Wolfgang Pauli, who
was later the founder of the Pauli exclusion principle6, proposed a quantum spin number
for electrons (Edelman et al, 2005). Inspired by the Pauli exclusion principle, George
Uhlenbeck proposed his theory about spinning electrical charge with angular momentum
and magnetic moment:
“It occurred to me that, since (I had learned) each quantum number corresponds to a
degree of freedom of the electron, Pauli's fourth quantum number must mean that the
electron had an additional degree of freedom - in other words the electron must be
rotating."
6 Exploremoreathttp://hyperphysics.phy-astr.gsu.edu/Hbase/pauli.html
THEPRINCIPLESOFMRIANDANALYSISOFTHEADOPTIONOFMRIINCHINA 23
The concept immediately excited a number of great scientists at that time such as Bohr,
Pauli, Einstein, Heisenberg and others interested in quantum theory (Edelman et al,
2005).
In the 1930s, a breakthrough came along. Isaac Rabi published a paper called "A
New Method of Measuring Nuclear Magnetic Moment" in 1938 where the first MR
signal from LiCL (lithium chloride) was reported. In 1944, he received the Nobel Prize
for physics for his investigation on the molecular beam magnetic resonance methods.
(Edelman et al, 2005) However, one interesting fact is that Isaac Rabi got the inspiration
forhispaperfromtheideasofDutchphysicistCornelisJacobusGorter. Rabi had set
up a center for atomic and molecular studies at Columbia University. In September 1937,
Gorter and his assistant dropped by and shared with Rabi unsuccessful attempts to
observe nuclear magnetic resonance in pure crystalline materials.7 Adapting from
Gorter’s papers and accepting the suggestion that Gorter made about the failure of the
experiment, Rabi modified the experiment and witnessed the resonance experimentally
(Edelman et al, 2005). Thus the Rabi’s paper was published and received a sensational
embrace. Although this publication refers to Gorter's visit as well as his unsuccessful
experiment, it does not acknowledge his suggestions.
Infuriated by the publication, Gorter said: “I cannot deny that I felt some pride, mixed
with the feeling that my contribution was somewhat undervalued though my advice was
acknowledged in the Letter (Gorter. n.d.)." Gorter was indeed a great theoretical developer. He had the idea that an alternating radiofrequency (RF) field B1 is applied
perpendicular to B0 to generate the resonance effect and he intended to use a calorimetric
method to detect the heat generated by the resonance of the sample. But he didn’t get any
heat absorption and concluded that a long spin-lattice relaxation time caused the spin
system to be partially saturated.
7 Gorter CJ, Broer LJF: Negative result of an attempt to observe nuclear magnetic
resonance in solids. Physica 9:591-596, 1942
THEPRINCIPLESOFMRIANDANALYSISOFTHEADOPTIONOFMRIINCHINA
24
It turned out that he was right; the excessively pure sample he used had an extremely
long T1 and caused the partial saturation and no data received. However, Rabi realized
the problem with the sample and successfully got heat absorption with the modified
experiment. Unaware of the linchpin, Gorter missed out on the Nobel Prize.
In 1940s, Evgeny Zavoisky, a Russian scientist, made the first electron paramagnetic
resonance feasible. Aware of the experiences of Rabi and Gorter, he overcame several
failures and finally acquired signals with equipment working in the range of 1 GHZ and
published a paper with his achievements. (Edelman et al, 2005)
NMR
Though a lot of breakthrough were made before the 1950s, the practical value of
magnetic resonance emerged in the 1950s with the effort of two American scientists,
Felix Bloch and Edward Purcell.
Edward Purcell was a leader of a fundamental research group at the MIT Radiation
Laboratory. He proposed trying an experiment to detect the transition between nuclear
magnetic energy levels using RF methods. Unlike Gorter, he used a resonant cavity to
observe the absorption of RF energy in paraffin. And he soon received the signal and
confirmed it to be resonance.
In the meantime, Bloch, who immigrated to USA from Switzerland, used another
method which he termed as "nuclear induction." Bloch described the experiment as
measuring an electromotive force resulting from the forced precession of the nuclear
magnetization in the applied RF field (Bloch, 1946). This concept leads to what in MR
scheme is understood today as the precession represented as a means of energy transfer.
These two scientists’ independent discoveries about Magnetic resonance and its
mechanisms paved the way for the later adaption to MRI and constructed a solid
foundation for NMR spectroscopy.
MRI
THEPRINCIPLESOFMRIANDANALYSISOFTHEADOPTIONOFMRIINCHINA 25
While NMR was developing rapidly during the 1950s, one physician, Dr. Raymond
Damadian, saw something else from NMR. Dr.Damadian had been working on NMR on
cells. He found that the potassium ions in solution gave a longer relaxation time than the
potassium solid sample (Damadian, 1969). Concluding that this effect was because
potassium ions are complexed with other counter-ions, he deduced that cells will give a
much shorter relaxation time compared to distilled water. And he found his deduction
was true. So he went further. He proposed that NMR can be used as a tool to detect
cancerous cells in the human body since cancerous cells’ disordering of malignant cells
and high potassium levels both give a longer relaxation time. Based on the theory that
tumors and cancerous tissue would give longer relaxation times compared to normal
tissue, Dr. Damadian published his theorem in the Science Journal. Though Dr.
Damadian was able to use the T1 and T2 difference between cells, which was an
extremely important idea since 90% of MRI today still relies on T1 or T2 weighted
images, his imaging method was still primitive. According to the Wall Street Journal, Dr.
Damadian used a point-by-point scan of the entire body and used relaxation rates, which
turned out to not be an effective indicator of cancerous tissue (STRACHER, 2002). Due
to his impractical method, Dr. Damadian received little support since lots of people
within the field thought this idea was far-fetched. But Dr. Damadian soon got the first
patent related to MRI and a grant from the National Institutes of Health (NIH) in 1971 to
continue his work (Kauffman, 2013).
While Dr. Damadian was still working on human body imaging, Hounsfield
successfully introduced x-ray-based computerized tomography (CT) to hospitals in the
United States in 1973, signaling that the hospitals were willing to pay for expensive
imaging machines. This signal soon triggered a milestone in MRI.
Mr. Lauterbur, the Nobel Prize winner in 2003 for the invention of MRI, was the first
to see how the difference could be used to reconstruct an image. It was on September 2,
1971 that the chemist Paul Lauterbur had an idea about MRI while he was eating a
hamburger (Dawson, 2013). And this idea would change the practice of medical research.
In the same year as CT was introduced, Paul Lauterbur used the back projection method
THEPRINCIPLESOFMRIANDANALYSISOFTHEADOPTIONOFMRIINCHINA
26
on two small tubes of water for the demonstration of a more efficient MRI method. He
originally named the method zeugmatography, which later evolved to MRI. This method
puts a weak gradient magnetic field next to the main magnetic field to allow spatial
location of the spins, as explained earlier in the text. This new technique, which is
partially derived from CT but soon surpasses the technique in CT, allows a
two-dimensional imaging rather than the one-dimensional or point-to-point method used
before, signaling the possibility of MRI’s practical use.
In the late 1970s, the other winner of the Nobel Prize who later took the same prize
as Paul did, Sir Peter Mansfield along with his group at Nottingham University
introduced echo-planar imaging to the MRI, which is considered to be the first ultra-high
speed-imaging method of MRI. Sir Peter Mansfield also contributed to the MRI field
with the development of ideas in terms of slice selection, MRI’s diffraction in solids, and
some shielding methods to lower the noise caused by the gradient. With such a great
contribution and being the first person to conduct a clinical magnetic resonance imaging
(on patients’ fingers), itisnotsurprisingthatSir MansfieldeventuallywontheNobel
Prize.
Nobel Prize Controversy
However, the absence of Dr. Damadian’s name in the 2003 Noble Prize list
generated a huge controversy. Though the Nobel Prize permitted three living individuals
to receive the award, Dr.Damadian ‘s name was not on the list with Mr. Lauterbur and Sir
Mansfield; the omission was clearly deliberate. There are a few possible reasons why he
was excluded according to the Armenian Weekly; “he was a physician not an academic
scientist; his intensive lobbying for the prize; his supposedly abrasive personality; and his
active support of creationism” (Kauffman, 2013). But none of this seems to be a
reasonable factor to stop him from getting the Nobel Prize. Dr. Damadian himself didn’t
agree to take this injustice. Damadian correctly claimed that he had invented the MRI and
that Lauterbur and Mansfield had merely refined the technology (Kauffman, 2013).
Besides, a group called “The Friends of Raymond Damadian” protested the denial with
full-page advertisements, “The Shameful Wrong That Must Be Righted” in the New York
THEPRINCIPLESOFMRIANDANALYSISOFTHEADOPTIONOFMRIINCHINA 27
Times, Washington Post and the Los Angeles Times. These actions didn’t bring the Nobel
Prize nominee back into consideration. However, Dr. Damadian’s arguments stirred up a
huge wave. Lots of people within the field couldn’t believe that Dr. Damadian was not on
the list after all he had done. But some held the idea that Dr.Damadian was only able to
come up with the idea relating to clinical use, but couldn’t find an efficient enough way
to turn the idea into reality. However, Dr. Damadian received general acknowledgements
from the scientific field with his numerous rewards; he was named Knights of Vartan
2003 “Man of the Year,” and on March 18, 2004, he received the Bower Award from the
Franklin Institute of Philadelphia for his development of the MRI.
Later development
After the 1970s’ great achievements in MRI, Gradient Echo imaging, NMR
Microscope and MR angiography were introduced one after another. Another technique
called functional MRI was invented in 1992. Functional MRI (fMRI) is a functional
neuroimaging procedure using MRI technology that measures brain activity by detecting
associated changes in blood flow (Huettel &Song, 2004). It allows deeper and more
informative analysis of the brain area. While the first Commercial MRI scanner was
introduced in the 1980s, in 2003, there were approximately 10,000 MRI units worldwide,
and approximately 75 million MRI scans per year performed, and the number continues
to increase (Govindan, n.d.).
Comparison with CT and X-Ray
Overall, MRI is both an energetic industry and a young science. Though it certainly
has some limitation, it is generally considered to be better than other two kinds of
imaging method: Computer tomography (CT) and X-ray. An X-ray is very effective for
showing doctors a broken bone, but if the soft tissue, such as organs, ligaments and the
circulatory system need to be imaged, then an MRI scan would be desirable. MRI also
has a major advantage in its ability to perform 3-D imaging. CT, however, is limited to
one plane. An MRI system can create axial images as well as oblique images as long as
the sequences are applied in the required direction without even moving the subject’s
THEPRINCIPLESOFMRIANDANALYSISOFTHEADOPTIONOFMRIINCHINA
28
body, making it superior to the other two. And as a non-invasive imaging method, it will
not cause any postoperative effects on the patients’ bodies; though the spins in the tissue
will be tumbling during the scanning and the noise the RF coil produces is harrowing, it
won’t cause potential harm as the ionizing radiation used in CT and X-ray will do. These
facts all make the MRI superior, but one factor is always the patients’ first concern.
Safety Concerns
Though MRI does not use ionizing radiation, there are still certain risks, thus
regulation on the machine and standards in use is very important. In 1982 the US FDA set
guidelines for MRI exams that covered the maximum Bo field, change in magnetic field
with respect to time (dB/dt), the absorption of radio frequency energy, and acoustic noise
levels and kept updating it. The most up-to-date requirement keeps the Bo under 8 Tesla
for adults. It is great for a MRI machine to have high external magnetic field because it
can reduce the signal to noise ratio, but the high field MRI will also give a greater risk.
Human exposure to strong magnetic fields has been a primary safety concern due to their
potential for coupling with sensitive organs, presence of paramagnetic tissues in the body
like blood, and their effect on metallic objects brought into these fields(Kangarlu, n.d.).
And each of these potential risks can be deadly. Firstly, it is well-known that the motion
of electrically charged objects will be affected by the magnetic field, which produces a
force called Lorentz Force (Schenck, 2000). Thus, electrically conductive fluid flow in a
magnetic field will induce an electric current and therefore a Lorentz force to oppose the
flowof fluidssuchasblood. And the effect, which is proportional to the field, will be
greatest when flow is perpendicular to the field. While the potential difference is
proportional to the Bo, the force induced is proportional to B02, which means that the
well-known phenomenon of “T-wave swelling” distortion on the electrocardiogram will
be exacerbated at high fields, making the task to obtaining a good-quality
electrocardiogram more difficult (Stafford, n.d.). But the increased blood pressure needed
to obtain the electrocardiogram is negligible (< 0.2% at 10 Tesla). This little effect may
be explained by the fact that T-wave elevation is dependent on the misalignment of the
THEPRINCIPLESOFMRIANDANALYSISOFTHEADOPTIONOFMRIINCHINA 29
blood flow and B0. And absence of a large angle between the direction of blood flow in
the main arteries and B0 diminishes the severity of this effect (Kangarlu, n.d.). So it is
hypothesized that field strengths of 18 Tesla will cause a significant risk to humans
(Stafford, n.d.). Besides a blood pressure increase, the high field magnetic field will also
cause an attractive force acting on metallic objects that are brought into these fields. As
the magnetic field inhomogeneity (dB/dz) has a high value in the strong magnetic field,
the magnetic field will act as a force on the magnetized object and attract it towards the
machine with enormous force, whose magnitude is determined by the magnetization of
the object and the quantity dB/dz *B (Kangarlu, n.d.). Thus, greater Bo will accordingly
cause a greater pulling force and greater damage. Similar effects will happen on metallic
implants, posing an equal or greater health risk on patients (Kangarlu, n.d.). With that in
mind, most of the MRI facilities have a pre-operation check for any metallic objects and a
questionnaire for the metallic implants questions. What’s more, there is a risk of getting
burned if improper imaging is used. It is often caused by incorrect modes that will
introduce high temperature to some coils, such as the surface coil around the receiver,
causing the patients to suffer severe thermal injuries (Hornak, 1996). Since the power of
the pulsed RF coil is related to the magnetic field strength, the high field magnet will
have a higher risk of causing thermal injuries(Thermal Injuries and Patient Monitoring
during MRI Studies. n.d.). So it is important for the technician and radiologist to observe
and ask patients’ statuses during the scanning. Besides these safety issues, there are two
standardized requirements in MRI scanning. The first is the RF shield surrounding the
scan room. The shield prevents the high power RF pulses from radiating out through the
hospital. It also prevents the various RF signals from television and radio stations from
being detected by the imager (Hornak, 1996). A magnetic shield will sometimes be used
also to prevent the magnetic field from extending to the outside. Another standardized
equipment is an oxygen monitor for a superconducting magnet room. It will measure the
oxygen level in the room and raise the alarm if there is a low level of oxygen in the air. It
is necessary because when an MRI machine needs to be shut down during an emergency,
like a personnel injury, the liquid cryogens that cool the magnet coils boil off rapidly,
which results in helium escaping very rapidly from the cryogen bath and a high level of
THEPRINCIPLESOFMRIANDANALYSISOFTHEADOPTIONOFMRIINCHINA
30
helium in the air (Quenching. n.d.). With the cryogen released out into the air, the
temperature of the magnet increases rapidly, thus increasing the resistance; the
superconducting magnet stops working. This process is called quenching and the high
level of helium gas in air will suffocate people in the scanning room, thus an alarm is
necessary.
While all these safety concerns are all reasonable and there are indeed some accidents
that happen during the MRI scanning, the injury can surely be avoided by proper
operation and the direct following of the state-of-art standardization.
Adoption of MRI
MRI as a young and efficient technology has spread all around the world. Starting
from the 1980s, MRI has developed quickly. In 2010, the global market of MRI had the
value of US$5.5 billion and is expected to have a value of US$7.5 billion by the year
2015. And the United States took the largest portion in this figure, having a value of US
4.5million (2010). The value of the US market is estimated to rise to US$5.8 million by
2015. In this report, the US, European and Japanese markets took approximately 80% of
this total global market and were largely mature markets, with purchasers upgrading their
outmoded systems and acquiring additional MRI scanners to meet demand in a cost
efficient mode(Today's MRI Market. n.d.). However, according to J. Dai’s research,
there is only one MR scanner per 1 million people in china, whereas there are
approximately 50 MR scanners per million people in the USA (Dai, n.d). And according
to research conducted by Da He, China had lower numbers of CTs and MRIs per million
people in 2009 than most of the selected OECD (Organization for economic co-operation
and development) countries. (He, Yu & Chen,2013)
China’s case
As China is the world’s largest developing country, China’s low market percentage
of MRI is worth analyzing and the following section will give a brief analysis of the
Chinese MRI’s market status and growing trends.
THEPRINCIPLESOFMRIANDANALYSISOFTHEADOPTIONOFMRIINCHINA 31
China has a low percentage of the MRI market mainly due to three reasons.
Firstly, China has just recovered from its ten-year political upheaval (the Cultural
Revolution) in the 1980s. The Chinese government was focusing on a political reform
under the leadership of chairman Deng XiaoPing. Though there is also a health care
reform included in this political reform, the Chinese government hasn’t got much money
to focus on the health care; China’s focus in the first few years was mainly on the
agriculture and manufacture and China’s economic status is extremely poor compared to
the US with the ratio of 8.9 to 100 in 1980($ 249 billion to $ 2790 billion). In fact, there
is only policy and no subsidization from the government. However, the Chinese hospitals
then were generally owned by the government (though under the trend of decentralization,
which will be elaborated later) and no subsidization essentially meant no research and
development. Besides, the Chinese medical equipments’ status was primitive at that time;
the transition to newly commercialized MRI machine was a jump too big to conduct.
The second reason why Chinese has such a low portion of MRI market share is
related to the general misconception. According to a small scale study I conducted on
peoplewhowerebetweentheagesof20and40duringthattime, (whoareintheir
50-70s now), people in China then were mostly unaware of the MRI technology’s
existence, and the few intellectuals who had heard about MRI (mainly in the eastern part
of China, where the economy is relatively developed) often took it as a derivation of a
nuclear technology. Often hearing that it was derived from NMR, those intellectuals were
confused by the world “nuclear” in NMR and related that to nuclear reactions. Unfamiliar
with the facts about MRI (which has no relation with nuclear reactions) and afraid of the
term “Nuclear”, those intellectuals didn’t take further steps to explore MRI, which caused
the general misconceptions about MRI.
Moreover, the education system in China in the 1980s also contributes to the low
percentage of MRI market share. With China’s internal upheaval in the 1970s, there was
hardly any connection with the outside world where a golden age of quantum mechanics
was happening and the MR technology was applied to clinical use. With the political
reform going on in the 1980s in China, the education system, like the medical system ,
THEPRINCIPLESOFMRIANDANALYSISOFTHEADOPTIONOFMRIINCHINA
32
was included in the reform but didn’t get so much attention as the agriculture got . Thus
the pace of edition of the textbooks used in universities lagged behind the pace of the
world. And there was generally no research for MRI at the undergraduate level except at
some top universities like Peking Universities, thus causing the general misconception
about MRI within society which held the opinion that MRI was harzardous.
Opportunities and Challenges
Considering all the factors that impeded the MRI market in China from the start, the
low percentage of Chinese market share now is reasonable. However, China’s medical
equipment development has been amazing over these years. According to Da He’s study,
the increases in its CT and MRI numbers from 2006 to 2009 were higher than most of the
OECD countries(He, et al,2013); the Chinese healthcare markets have achieved more
than 16% annual growth over the last decade, with the number of MRIs increasing 90.2
percent from 2002 to 2005 (Ma et al, 2008), making it one of the fastest growing
healthcare markets in the world (Dai, n.d). And the reasons for the fast development are
mostly the dissolution of the factors impeding the development of MRI, as mentioned
before. Firstly, the economic reform in 1978 has caused a trend for the hospitals in China
(mostly are nominally owned by the government) to decentralize. With profit pursuit and
lack of private investment, hospitals have increasingly relied on prescribing expensive
pharmaceuticals and diagnostic tests through high-technology medical equipment, such
as CTs and MRIs, to balance their budgets (He, et al, 2013).
. It is reported that most 3A hospitals (the best hospitals) in China already have MRI
systems installed, which constitutes 1000 out of the total 18,000 hospitals in China. In the
next ten years, small to medium-sized Chinese hospitals are expected to install a total of
more than 4,000 MR scanners, an average of 300-400 units each year (Dai, n.d). And the
fact underlying under this rapid development of advanced imaging methods may also be
related to the medical arms race, which is a typical phenomenon in industrialized
countries.
What’s more, the economy also has a large influence on the MRI’s development.
With a population of about 1.4 billion, one-fifth of the world’s total, China now has a
THEPRINCIPLESOFMRIANDANALYSISOFTHEADOPTIONOFMRIINCHINA 33
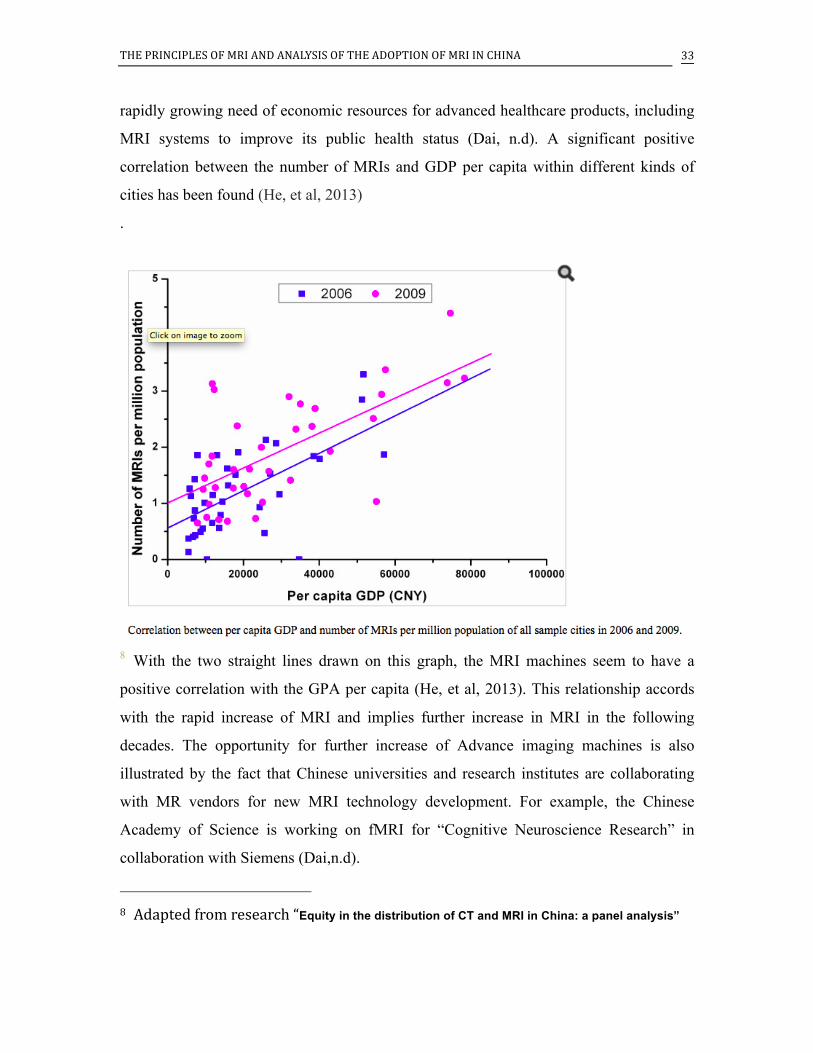
rapidly growing need of economic resources for advanced healthcare products, including
MRI systems to improve its public health status (Dai, n.d). A significant positive
correlation between the number of MRIs and GDP per capita within different kinds of
cities has been found (He, et al, 2013)
.
8 With the two straight lines drawn on this graph, the MRI machines seem to have a
positive correlation with the GPA per capita (He, et al, 2013). This relationship accords
with the rapid increase of MRI and implies further increase in MRI in the following
decades. The opportunity for further increase of Advance imaging machines is also
illustrated by the fact that Chinese universities and research institutes are collaborating
with MR vendors for new MRI technology development. For example, the Chinese
Academy of Science is working on fMRI for “Cognitive Neuroscience Research” in
collaboration with Siemens (Dai,n.d).
8 Adaptedfromresearch“Equity in the distribution of CT and MRI in China: a panel analysis”
THEPRINCIPLESOFMRIANDANALYSISOFTHEADOPTIONOFMRIINCHINA
34
Last but not the least, the controversial Chinese education system is now trying to
improve its education content and keep pace with the world’s developments. In fact, a
small introduction to MRI can be found in a high school chemistry textbook and the
misconceptions about the mysterious “Nuclear” in MRI as well as NMR is being
gradually eliminated; according to my own experience with MRI scanning at Shanghai
No.9 People's Hospital, the patients are all aware of the distinct feature of MRI: no
ionizing radiation, and they are not afraid of being put into the machine for scanning.
Though China’s medical equipment market has great potential, there are lots of
challenges to overcome. The first is China’s manufacturing. Currently the five major
systems integrators (GE Healthcare, Siemens, Philips, Toshiba and Hitachi) dominate the
global MRI market, with GE and Siemens having the largest market share. And there is
no Chinese manufacturer in the market (Today’s MRI market, n.d.). So Chinese MRI
machines are all imported, leading to a non-stable supply and higher charge for scanning.
This shortage suggests the huge economic potential for a Chinese MRI selling market but
the problems relating to entry into the market must be addressed. Secondly, there is a
huge equity problem existing in China related to MRI, with the eastern richer area having
more MRI machines per million people. And Chinese government introduced a policy in
2005 called CON (certificate of need), which gave local government control over how
many MRI machines a specific hospital can purchase, to address the equity problem and
prevent the medical arm race. But the effect is unknown since high charges for scanning
also stop the patients from going into the scanning room, which means a low demand for
MRI. The last problem is the shortage of experts in MRI for both the technical side and
the medical side. There are only a few doctors able to analyze the images with enough
expertise and there is a shortage of MRI training programs in China. Unlike the US,
where 12-month programs are available to become a qualified MRI technician (Govindan,
n.d.), Chinese MRI technicians often came from medical school backgrounds with higher
requirements. However, with doctors relying more and more on MRI, the probability of
quick-training programs multiplying is large.
Conclusion

THEPRINCIPLESOFMRIANDANALYSISOFTHEADOPTIONOFMRIINCHINA 35
In conclusion, there is a bright potential for MRI’s development in China and the
benefits MRI can bring to Chinese public health are massive, but certain barriers must be
surpassed for this brilliant future.
THEPRINCIPLESOFMRIANDANALYSISOFTHEADOPTIONOFMRIINCHINA
36
Reference Bloch F: Nuclear induction. Phys Rev 70:460-473, 1946.
Damadian, R., “Ion Exchange in Escherichia coli: Potassium-Binding Proteins”, Science
165(3888):79–81, 4 July 1969
Dawson, M. (2013). Paul Lauterbur and the inventin of MRI. Cambridge, Mass.: MIT
Press.
Dai, J. (n.d.). Opportunities and Challenges of MRI in the Developing World. Retrieved
September 24, 2014
Edelman, R., Hesselink, J., & Zlatkin, M. (1996). MRI: Clinical magnetic resonance
imaging (2nd ed.). Philadelphia: Saunders.
Freitas, R. (1999). Nanomedicine. Austin, TX: Landes Bioscience.
Gaillard, F. (n.d.). Magic angle effect - MRI artefact. Retrieved September 23, 2014.
Govindan, R. (n.d.). MRI Ever Expanding Opportunities. Retrieved September 23, 2014.
Hornak, J. (1996, September 1). The Basics of MRI. Retrieved September 23, 2014.
He, D., Yu, H., & Chen, Y. (2013, June 6). Equity in the distribution of CT and MRI in
China: A panel analysis. Retrieved September 24, 2014
Huettel, S., & Song, A. (2004). Functional magnetic resonance imaging. Sunderland,
Mass.: Sinauer Associates.
THEPRINCIPLESOFMRIANDANALYSISOFTHEADOPTIONOFMRIINCHINA 37
Kauffman, G. (2013, November 7). 2003 Nobel Prize for MRI Denied to Raymond
Vahan Damadian. Retrieved September 22, 2014
Kangarlu, A. (n.d.). MRI Safety Issues for Very High Field. New York: Columbia
University and New York State Psychiatric Institute.
Lowe, S. (2012, June 11). MRI Maintenance: How to Beat the MRI Helium Shortage.
Retrieved September 23, 2014.
Ma J, Lu M, Quan H. From a national, centrally planned health system to a system based
on the market: lessons from China. Health Aff (Millwood) 2008
Quenching. (n.d.). Retrieved September 23, 2014.
Stafford, R. (n.d.). High Field MRI: Technology, Applications, Safety, and Limitations.
Houston: The University of Texas M. D. Anderson Cancer Center.
SchenckJ.F., Safety of Strong, Static Magnetic Fields. Journal of Magn. Reson. Imag.
2000
STRACHER, C. (2002, June 14). Scan and Deliver. Retrieved September 22, 2014
Thermal Injuries and Patient Monitoring during MRI Studies. (n.d.). Retrieved September
23, 2014.
Today's MRI Market. (n.d.). Retrieved September 24, 2014.
Weishaupt, D., & Chli, V. (2006). How does MRI work? an introduction to the physics

THEPRINCIPLESOFMRIANDANALYSISOFTHEADOPTIONOFMRIINCHINA
38
and function of magnetic resonance imaging (2nd ed.). Berlin: Springer.


![Ln[DO3A-N -(pyrenebutanamido)propionate] complexes ...€¦ · Magnetic Resonance Imaging (MRI), Ultra Sound (US), and X-ray Computerized Axial Tomography (CAT), are imaging modalities](https://img.pdfslide.us/doc/110x75/608645510e0cde1f8e352066/lndo3a-n-pyrenebutanamidopropionate-complexes-magnetic-resonance-imaging.jpg)