Embed Size (px)
Citation preview
The Pricing Performance of Market Advisory Services in Cattle Over 1995-2004
by
Tracy L. Brandenberger, Scott H. Irwin,and Darrel L. Good
The Pricing Performance of Market Advisory Services in Cattle Over 1995-2004
by
Tracy L. Brandenberger, Scott H. Irwin, and Darrel L. Good1
June 2012
AgMAS Project Research Report 2012-02
1 Tracy L. Brandenburger is a former Graduate Research Assistant with the AgMAS Project in the Department of Agricultural and Consumer Economics at the University of Illinois at Urbana-Champaign. Scott H. Irwin is the Laurence J. Norton Chair of Agricultural Marketing in the Department of Agricultural and Consumer Economics at the University of Illinois at Urbana-Champaign. Darrel L. Good is a Professor in the Department of Agricultural and Consumer Economics at the University of Illinois at Urbana-Champaign. The authors gratefully acknowledge the research assistance of Greg Price and Tom Jackson, former AgMAS Project Managers, and Nicole Aulerich, Silvina Cabrini, Evelyn Colino, Lewis Hagedorn, Mark Jirik, Robert Merrin, Wei Shi, and Brian Stark, former Graduate Research Assistants for the AgMAS Project. The assistance of Hongxia Jiao in formatting this publication is gratefully acknowledged.
i
DISCLAIMER
The advisory service marketing recommendations used in this research represent the best efforts of the AgMAS Project staff to accurately and fairly interpret the information made available by each advisory service. In cases where a recommendation is vague or unclear, some judgment is exercised as to whether or not to include that particular recommendation or how to implement the recommendation. Given that some recommendations are subject to interpretation, the possibility is acknowledged that the AgMAS track record of recommendations for a given program may differ from that stated by the advisory service, or from that recorded by another subscriber. In addition, the net advisory prices presented in this report may differ substantially from those computed by an advisory service or another subscriber due to differences in marketing assumptions.
This material is based upon work supported by the Cooperative State Research, Education and Extension Service, U.S. Department of Agriculture, under Project Nos. 98-EXCA-3-0606 and 00-52101-9626. Any opinions, findings, conclusions, or recommendations expressed in this publication are those of the authors and do not necessarily reflect the view of the U.S. Department of Agriculture.
ii
The Pricing Performance of Market Advisory Services in Cattle Over 1995-2004
Abstract
The purpose of this report is to evaluate the pricing performance of market advisory services’ live cattle hedging recommendations over 1995-2004. Also, feeder cattle, corn, and soybean meal recommendations were evaluated as input hedges and combined with the live cattle marketing recommendations to approximate the margin that a typical feedlot would face from the third quarter of 1999 through 2004. Other marketing assumptions were also applied to approximate a real world feedlot in Western Kansas. Several key assumptions are 1) the feedlot markets on average 1 cwt. of live cattle per quarter, inputs are purchased at rates that will yield on average 1 cwt. of live cattle per quarter, or 4 cwt. total per year, 2) the marketing widow for live cattle marketings begins six months prior to the start of the marketing quarter, making the total marketing window nine months long, 3) brokerage costs are subtracted from futures and options markets gains or losses and 4) the quarterly purchases of inputs, live cattle marketingsand benchmark prices are weighted by quarter to reflect the cyclical nature of live cattle marketing.
The net price an advisory service receives for a given quarter is compared to a market benchmark to evaluate the performance of the service. The market benchmarks used in this study are weighted average cash prices per quarter for each of the hedged items.
Four performance measures are used to evaluate the pricing performance of the advisory services over 1995-2004 for live cattle and 1999 Q3-2004 for margin recommendations. Results show that advisory services as a group do not outperform the benchmarks in either live cattle or margin recommendations. Also, no advisory services produced prices that were statistically different from the benchmark when averaged over all quarters. When risk was taken into account, advisory services did not outperform the benchmark as a group; however, two advisory services yielded pricing performance superior to the benchmarks in live cattle and one in margin hedging.
Overall, the results show that advisory services do not “beat the market.” While there were a few services that produced results superior to the benchmarks, the services as a group did not provide feedlots the opportunity to improve their margin levels relative to the market. A strategy of marketing a portion of live cattle each month and achieving the market benchmark was the most profitable strategy.
iii
The Pricing Performance of Market Advisory Services in Cattle Over 1995-2004
Table of Contents
Introduction··································································································· 1
Objectives ·································································································· 1Collection of Recommendations ········································································ 3Services Included·························································································· 6Geographic Location······················································································ 7Marketing Window ······················································································· 7Net Advisory Price Computation ······································································· 8
Feedlot Model··························································································· 8Cash Marketing Strategy and Quantity Sold························································ 9
Prices········································································································ 9Brokerage Costs ··························································································10
Marketing Behavior of Advisory Services·······························································10
Marketing Tools ··························································································11Construction of Marketing Profiles ····································································11
Net Amount Sold/Bought ············································································13Marketing Profiles ·······················································································14
Benchmark Formulation and Performance Evaluation·················································16
Benchmark Specification················································································16Cash Benchmark ·························································································16Performance Evaluation of Services ···································································18Net Advisory Prices and Benchmarks for 1995-2004 ···············································18Directional Performance ················································································20Average Price Performance ·············································································21Risk/Return Analysis ····················································································24Predictability Tests·······················································································25Advisory Service Performance Comparison··························································25
References ···································································································31
1
The Pricing Performance of Market Advisory Services in Cattle Over 1995-2004
Introduction
Cattle feeders face many risks. While some of these risks, like weather, are uncontrollable, one risk that may be managed is price risk. The price of feeder steers and the cost of feed account for a substantial portion of total costs, while the sales price of the finished steer is the most important factor in determining total returns.
Feedlot managers have several options when managing the price risks of a feedlot. There is the option to participate in the spot cash market only for inputs and fed cattle. Alternatively, the manager may follow his/her own hedging strategy or a strategy recommended by a market advisory service
Previous research analyzing the performance of marketing advisory services has shownlimited ability of services to provide an average price greater than the benchmark value (e.g. Irwin et al., 2006; Batts, Irwin, and Good, 2009; Webber et al., 2012). These studies suggest market advisory services have a small ability to beat the market in corn and soybeans but no ability in wheat or hogs. The inability to beat the market in hogs may or may not be generalized to all livestock markets. Following both input and output hedging recommendations may provide better insight into the ability of services to outperform the market in livestock.
Objectives
The purpose of this research is to evaluate the pricing performance of market advisory services in marketing live cattle and in purchasing corn, soybean meal and feeder cattle.
� Do marketing advisory service hedging recommendations in live cattle-related markets produce results different from a market benchmark? The null hypothesis is that advisory services do not produce results different from the benchmark. The alternative hypothesis is that advisory services do produce results statistically better or worse than the benchmark.
� Is there predictability of advisory service performance from quarter-to-quarter? The null hypothesis is that advisory services do not exhibit predictability of performance from quarter-to-quarter. The alternative hypothesis is that advisory services do exhibit predictability of returns.
Through the AgMAS program at the University of Illinois at Urbana-Champaign, recommendations were recorded for at least 23 advisory services from 1995 through 2004. Nineadvisory services gave consistent recommendations on live cattle marketing during this time period. Hedging recommendations for forty quarters beginning in the first quarter of 1995 and ending the last quarter of 2004 are evaluated for live cattle. Of this subset, eight services gave consistent recommendations for feeder cattle purchases and seven gave recommendations for corn and soybean meal purchases. For these services, hedging recommendations for twenty-four quarters are evaluated beginning the first quarter of 1999 and ending the last quarter of 2004 to
2
determine the net average margin on purchases of feeder cattle, corn and soybean meal and sales of live cattle.
Average prices in both the output-only and input-output strategies are compared to market benchmarks. The benchmarks are average spot cash prices for the quarter, assuming cashtransactions are made routinely throughout the quarter. In the live cattle only recommendations,this includes only live cattle spot prices. In the margin hedging scenario, the benchmarks include the spot cash price of feeder cattle, corn and soybean meal.
Performance of advisory services relative to the benchmarks will be measured by the proportion of advisory services exceeding the benchmark cash prices and by the magnitude of this difference. A mean-variance analysis will be used to compare the average price and risk of advisory service returns compared to that of the market benchmark. Another performance measure will test predictability of advisory service performance from quarter to quarter.
Net Advisory Prices
Procedures used to determine the net price received by an advisory service will be similar to those used by Webber et al. (2012). Advisory service recommendations were collected daily on a real time basis by staff members of the AgMAS project at the University of Illinois atUrbana-Champaign. Specific information recorded for each recommendation included the date the recommended position is entered, futures or options price, percent of production or input covered and time period hedged.
Next, these recommendations are assembled in chronological order and input into models which compute the net price received for each advisory service for the corresponding quarter. It is assumed the feedlot manager will follow the recommendations precisely.
It is assumed that all feedlots market their livestock on a similar schedule and the net advisory price is computed as the average cash price for the quarter plus or minus gains or losses and any brokerage costs associated with futures or options trades. Cash forward contracting advice was treated as hedging recommendations for feeder cattle, corn and soybean meal. Net advisory margin calculations were determined by matching average costs from input recommendations with the average price for live cattle of the associated quarters.
Each advisory service has a unique way of giving recommendations and to make them consistent and comparable for interpretation, a few assumptions were made. First, feedlots operate on a consistent production schedule and therefore receive the average quarterly cashprice for their sales. Second, it is assumed that there is no lumpiness in trading futures contracts. When recommendations are made to lift hedges as cattle are sold, they are lifted on the Wednesday closest to the fifteenth of the month. If no recommendation is made to lift a hedge as cattle are sold, the position is held until a recommendation is given to exit or the expiration of the contract. Finally, all hedges in corn, soybean meal and feeder cattle are lifted on the Wednesday closest to the fifteenth of the month, regardless of recommendation.
3
Data and Simulation Methodology
This intent of this section is to explain the process used to derive an individual advisoryservice’s net price. Recommendations are applied to a feedlot designed to be representative of a western Kansas feedlot. The marketing window for this study is nine months long, including six months prior to the placement of cattle on feed and three between placement and marketing.
Cash prices from the western Kansas area are used to simulate the prices a feedlot manager in western Kansas would pay or receive. These markets include the Kansas direct slaughter cattle prices, Kansas direct feeder cattle prices, western Kansas corn prices and Kansas City soybean meal prices. Marketings and purchases are hedged through the live cattle, feeder cattle, corn and soybean meal futures contracts at the Chicago Board of Trade and Chicago Mercantile Exchange.
Collection of Recommendations
Collection of marketing advisory service recommendations follows the guidelines set forth in Irwin et al. (2006) for corn and soybeans. It is recognized that the group of services selected is not a random sample and does not comprise the entire population of advisory services available to feedlot managers. There is no clearly defined designation of what constitutes as a marketing advisory service and therefore the AgMAS project developed a set of criteria to determine which services to include in this study. Irwin et al. (2006) offer five criteria to determine which studies to include in AgMAS studies.
The first criterion is that recommendations must be received electronically and in “real-time.” This ensures that a feedlot manager would be able to implement them as recommended and that the recommendations are not received after they were to be implemented. Sources for the services tracked include emails, websites and satellite news services.
The second criterion is that the recommendation must be intended for a feedlot manager who is hedging as opposed to a speculator or trader. Speculative advice is given by some marketing advisory services which are tracked by the AgMAS project, but the hedging and speculative advice must be clearly distinguishable and only production marketing advice may be followed. There is no attempt, however to distinguish between futures and options used for speculation and futures and options used for hedging in a feedlot marketing strategy.
The third criterion specifies services must give recommendations in a manner that easily suits a representative feedlot. The recommendation must include the percent of production or purchases for a given marketing period, the futures and/or options price where applicable and the date of implementation. An example of this type of recommendation is to hedge 25% of second quarter live cattle marketings with June futures at $98.75. A recommendation that says to hedge two June live cattle contracts for June cattle marketing is not included in this study because two contracts may represent different proportions of marketings to feedlots of differing size.
4
The forth criterion is that a service must give “one size fits all” type recommendations. The recommendations are not to be customized to individual customers although various programs such as aggressive or basic hedging programs may be included.
The fifth criterion specifies that any services subscribed to must be viable commercialbusinesses. Someone with little or no expertise may easily start up an advisory service due to advances in Internet and email technology. Therefore, it is necessary to exclude firms which are not viable commercial businesses, but the criterion is not restrictive to new or small firms which have recently begun operations.
Originally, marketing advisory services were selected from a list of Premium Services maintained by two agricultural satellite news services, Data Transmission Network (DTN) and FarmDayta in 1994. The list of services from these two news networks does not attempt to include all marketing advisory services but does include those services which are most in demand from users. It must be noted that the services were originally selected for use in evaluating recommendations in the corn and soybean markets and not in livestock. Therefore, the sample of services may not include all the most relevant advisory services to feedlot manager, but is a representative sample of the majority of services available.
There are four potential forms of survivorship bias which may be a problem when collecting the recommendations given by advisory services. Survivorship bias may bias performance upwards since the ‘survivors’ have higher performance than ‘non-survivors’ (e.g. Brown et al. 1992; Carpenter and Lynch 1999). The first form of survivorship bias occurs when the sample of services is limited to services that are in business at the end of the period. The sample of services in this analysis will not be subject to this form of survivorship bias because all the services which gave consistent recommendations were in business for the entire collection period.
The second form of survivorship bias occurs when a service is excluded from the sample in the quarter when they are discontinued. This is a form of survivorship bias because only survivors of a full quarter are tracked. This form of survivorship bias will not be present in this analysis because no service was discontinued during the range of years in which recommendations were collected.
The third form of survivorship bias which may be present is a result of recommendations being ‘back-filled’ at the point of time when the program was added to the database. This is not relevant here because no advisory programs in the AgMAS project were back-filled. Recommendations were collected only for the quarter after an advisory program had been added to the database.
Finally, when assembling a database on advisory program recommendations is the consideration of hindsight bias (e.g., Jaffe and Mahoney, 1999). This is the tendency to record only profitable recommendations and ignore or minimize unprofitable recommendations after the fact. Since the AgMAS project subscribes to all of the services that are followed and records recommendations on a real time basis, the recommendation database should not be subject to hindsight bias.
5
Between 1995 and 2004 at least twenty-three services were tracked by the AgMAS project. Nine of these services provided consistent recommendations in the live cattle futures market. Of this subset, eight provided recommendations on hedging feeder calves and seven alsoprovided recommendations for purchasing corn and soybean meal. The nine services providing live cattle recommendations only were included for the entirety of the time period and there were no additions or deletions to the service list during the study. Hedging recommendations on the input side were not available until the first quarter of 1999 when all marketing services’ recommendations were recorded electronically. The time period for evaluation of marginhedging recommendations runs from 1999 to 2004. Unlike recommendations in grain and hogmarkets, services only recommended one distinct marketing program. There were no separate programs for basic or aggressive hedging as was the case in grains (Irwin et al., 2006; Batts, Irwin and Good, 2009; Webber et al., 2012).
Unlike grain, livestock are non-storable. Few marketing advisory services give recommendations on cash marketing and those recommendations that are made are very short run in nature and are ignored in this analysis. As in Webber et al. (2012), this analysis assumesthat the feedlot manager will employ a cash marketing (or cash buying) strategy that results in obtaining the average cash price over the quarter.
Eight services gave recommendations for feeder cattle purchases and seven gave recommendations for feed purchases. Most services that gave feed recommendations issued both cash and futures recommendations. One service gave specific cash advice for purchase of feeders. To increase the sample of available recommendation forward cash contractrecommendations for feed and feeders were converted to futures recommendations. Only specific cash advice, such as “forward contract January corn needs in the cash market tomorrow” was followed. Vague recommendations such as “stay hand to mouth on corn needs” were not tracked.
When recording recommendations of each advisory program, specific attention is paid to which marketing quarter’s production or purchases are being hedged, the amount of production to be sold (or inputs to be purchased), which futures and/or options contract to use, and any price targets that are mentioned. An example of a complete recommendation is as follows: Sell 25% of fourth quarter (2004) marketings at $86.00/cwt or better. The pricing target given in a recommendation like this example would be considered “good-till-canceled” and noted until either the recommendation is filled, canceled, or the contract expires.
Several procedures are used to check the recorded recommendations for accuracy and completeness. Whenever possible, recorded recommendations are cross-checked against later status reports provided by the relevant advisory program. Also, at the completion of the marketing quarter, it is confirmed that all futures positions are offset, all options positions have been offset or expired and that all spot cash sales add up to 100%.
The final set of recommendations attributed to each advisory service represents the best effort of the AgMAS project staff to accurately interpret information made available by each
6
advisory program. In cases where a recommendation is considered vague or unclear, some judgment is used as to whether or not the recommendation should be included or how it should be implemented. Because some recommendations are subject to interpretation, it is acknowledged that the AgMAS track record of recommendations for a given program may differ from that of the advisory program, or from that recorded by another subscriber.
Services Included
Nine advisory services were included in this study. The services all met the five criterion established above and gave recommendations for live cattle marketing. All services were included for the entirety of the evaluation. A short summary of each service follows.
� Ag Line by Doane: Ag Line by Doane has a hedging program for live and feeder cattle using futures only. Ag Line by Doane is located in St. Louis, Missouri, and their website is: http://www.doane.com.
� Ag Resource: Ag Resource uses both futures and option for its live cattle recommendations and uses futures only for feeder cattle, corn and soybean meal. It is based in Chicago, Illinois. Ag Resource’s website is http://www.agresource.com.
� Ag Review: Ag Review used both futures and options for live cattle, feeder cattle, and corn recommendations. Futures only are used for soybean meal. Ag Review is an email service based in Morton, Illinois.
� AgriVisor: AgriVisor uses both futures and options for live cattle hedge recommendations. Futures only are used for corn and soybeans. AgriVisor is located in Bloomington, Illinois. Their website is http://www.agrivisor.com.
� Brock: Brock Associates uses both futures and options for live cattle, corn and soybean meal recommendations. Futures only are used for feeder cattle. Brock is based in Milwaukee, Wisconsin, and their website is http://www.agmarketing.com.
� Pro Farmer: Pro Farmer is based in Cedar Falls, Iowa, and uses both futures and options for live cattle hedging recommendations. Futures only recommendations are given for feeder cattle and corn. Their website is http://www.profarmer.com.
� Stewart-Peterson: Stewart-Peterson uses both futures and options for live cattle hedging recommendations. Options only are used for feeder cattle. Stewart-Peterson is located in West Bend, Wisconsin, and their website is http://www.stewart-peterson.com
� Top Farmer Intelligence: Top Farmer Intelligence uses a combination of futures and options for live cattle, corn and soybean meal recommendations. Only futures are used for feeder cattle hedging. Like Stewart-Peterson, Top Farmer is also based in West Bend, Wisconsin. It is a separate service from Stewart-Peterson but recommendations are compiled by the Stewart Peterson group. Top Farmer’s website is: http://www.topfarmer.com.
� Utterback Marketing Services: Utterback Marketing Services uses a combination of futures and options for live cattle, feeder cattle, corn and soybean meal. They are located in West Lafayette, Indiana. Their website is http://www.utterbackmarketing.com.
7
Geographic Location
The simulation of advisory service recommendations is designed to characterize conditions facing a feedlot in western Kansas. This area corresponds to the Kansas direct slaughter cattle market, the Kansas direct feeder cattle market, the western Kansas corn marketand the Kansas City soybean meal market. Price series for these markets are published by the Agricultural Marketing Service of the USDA. While the volume of slaughter cattle sold in cash markets has decreased substantially, the Kansas direct slaughter market represents an area with a large population of feedlots and is widely followed. According to the January 1 Cattle on Feed report published by the National Agricultural Statistics Service, Kansas ranks second behind Texas for the number of cattle and calves on feed. Over the 1995-2004 period of this study, Kansas had on average 2.3 million head on feed for the January 1st report.
Marketing Window
The time period over which a feedlot manager normally makes pricing decisions is termed the “marketing window.” It can also be referred to as the pricing “decision horizon” or “timeline” of the feedlot. The marketing window does not necessarily equal the time of observed market activity. The reason is that not taking action (e.g., not hedging prior to purchasing input or marketing live cattle) is one type of decision that can be made during a marketing window.
In the present context, the objective is to define the marketing window of a representative feedlot manager who subscribes to the advisory programs tracked by the AgMAS project. Good, Hieronymus, and Hinton (1980) provide a useful starting point for the conceptual framework. Here, the authors stated that the marketing window for a grain farmer should begin at initial production planning and continue until the end of the storage season. In livestock where there is no storage, the marketing window will end once the input is purchased or the output is sold.
The marketing window concept may be applied to feedlots as well. Production planning begins prior to the feeder calves being purchased. The marketing window for this study is nine months, including three months prior to the placement of cattle on feed and six months in the feedlot. This same three months prior to placement is used for input purchases of feeder cattle and feed. In both cases, the marketing window ends on the last day of the quarter for a total duration of nine months (Table 1).
As stated earlier, the marketing window does not necessarily perfectly encompass thetime of market activity as recommendations may begin before the marketing window starts. For example, in July, 1997 Ag Resource recommended that 50% of the following March and April live cattle marketing be hedged at $75.00. This was filled July 16, 1997. Typically, the marketing window for Q2 marketings begins in October, but in this example, hedges were recommended, and therefore assumed executed, prior to the start of the marketing window. Because the marketing window is defined as the average, “normal” window, it is argued that a representative feedlot operator would approach the marketing window with some flexibility, particularly for recommendations that do not extend far outside the limits of the window. A common exception to the marketing window parameters occurs when programs have open positions after the date of the last cash sales for the quarter. This occurs because futures contracts
8
are often used to hedge for more than one quarter. If no specific recommendation is given to exit the position as cash sales are made, the live cattle output hedges are held until there is a recommendation to lift the hedges or the contract expires. Due to the nature of input hedges, all input hedges are liquidated on the Wednesday closest to the 15th of the month in which purchases are made, regardless of whether or not a recommendation is made to do so.
Net Advisory Price Computation
The methodology used to determine net price received from each advisory service is similar to the procedure used in other AgMAS reports (Irwin et al., 2006; Batts, Irwin, and Good, 2009; Webber et al., 2012). The stream of collected recommendations is aligned in chronological order and returns to each futures and options hedging recommendation are calculated to arrive at a weighted average net price received or paid by the feedlot manager whoprecisely follows the marketing advice, as recorded by the AgMAS project. As mentioned earlier, the same cash marketing strategy is assumed for all services.
The net advisory price in the live cattle hedging analysis is computed as the average cash sales price plus or minus gains/losses and brokerage costs associated with the futures and options transactions. In the margin hedging analysis, the net advisory price is computed as the net advisory price for live cattle plus or minus gains/losses and brokerage costs associated with feeder cattle and feed hedging recommendations. A comparison of the net advisory price/marginwill be made to the quarterly average cash price benchmarks. The following sections discuss specific aspects of computing the net price of each advisory service.
Feedlot Model
The feedlot model used in this study is based on the Focus on Feedlots dataset created by Kansas State University to provide basic feedlot information. Production in the theoretical model feedlot is assumed to be four hundredweights per year. In actual feedlots annual marketings are not evenly distributed among quarters. The most marketings occurs in the third quarter and the fewest in the fourth quarter due to weather conditions and feedstock sources available during the time the cattle are placed on feed. The seasonality of feedlot marketings is reflected in this production model and quarterly marketings are weighted using data from the Focus on Feedlots dataset. The third quarter receives the heaviest weight and the fourth quarter the lightest weight. Quarterly marketing weights for fed cattle are found in Table 2. If an advisory service gives a recommendation for a feedlot to hedge 50% of fourth quarter marketings, this translates to 0.39 hundredweights (50% * 4th quarter weight of 0.7833). This allows total gains and losses associated with futures and options to be comparable to estimated cash sales.
Input usage for each quarter is based on the production model of four hundred weights per year. Feeder cattle, corn and soybean meal purchases are weighted to reflect the quarterly weighted amount of fed cattle marketings. The average rate of gain is based on the Focus on Feedlots dataset. The average market weight of a live fed steer between 1995 and 2004 was 1,250 pounds. The average start weight per head over this same time period was near 650pounds. For simplicity of calculation this study markets on average one hundredweight per
9
quarter as opposed to one head. To market one hundredweight of fed cattle, 0.61 (650/1,250) hundredweight of feeder cattle must be put on feed.
In this hypothetical feedlot, each hundredweight is on feed for six months. If placed on feed January 15, it is marketed on July 15. As discussed previously 1/3 of each quarter’s marketings are made on the Wednesday closest to the 15th of the month, each month in the quarter. The placement for fed cattle marketed in Quarter 3 began January 15 and continued February 15 and March15. Quarterly marketing percentages may be found in Table 2. The low percentages for feeder cattle as an input in Quarters 2 and 3 correspond to the low marketing of fed cattle in Q4.
Feed consumption for the hypothetical one hundredweight of marketed animal is calculated in the same manner as feeder calf placement. For this model, it was assumed that in the first month a feeder calf was on feed it consumed 7 bushels of corn and for each subsequent month, 11 bushels of corn were consumed, with 200 pounds of soybean meal were consumed equally each month. Quarterly weights for both corn and soybean meal purchases are found in Table 2.
Cash Marketing Strategy and Quantity Sold
The representative feedlot in this example is assumed to be large enough that the lumpiness of futures contracts is not an issue and therefore the manager can hedge the exact amount needed for both input and output hedges. Specifically, if a recommendation is given to hedge 25% of 4th quarter production, a feedlot is expected to hedge exactly 25%. Furthermore, a constant production schedule is assumed, which assures that the representative feedlot will receive the quarterly average spot price for their cash purchases and marketings.
Occasionally, recommendations are given to “lift hedges as cattle are sold.” This recommendation is interpreted as lifting hedges on the Wednesday closest to the 15th of the month the hedge targets. It is also assumed the feedlot markets fed cattle continuously throughout the quarter and therefore a recommendation for hedging 25% of fourth quarter marketings lifting hedges as cattle are sold would have one-third of 25% lifted on the Wednesday closest the 15th of October, November and December.
In addition to continuous production, there is also no production risk assumed in the calculations for net price received. It is assumed the feedlot manager will know the exact number of head that will be marketed in a given quarter and will back out the number of feeder cattle and quantities of corn and soybeans to purchase
Prices
There is no consistent Kansas live cattle cash price series from 1995 through 2004 because of the mandatory price reporting system which caused complications in the collection of prices in 2001. Boxed beef average prices and select carcass prices were substituted during the period from March 2001 to February 2002, when no live cattle prices were available. A dressing percentage of 62% was used to convert the carcass price to live-weight. The Kansas direct
10
slaughter price series represents a flat price agreed upon upfront between feedlot and packer. No slaughter cattle auction prices are included. Input prices for feeder cattle, corn and soybean meal were available in consistent series over the 1995-2004 time period.
Fill prices for futures and options transactions generally are the prices reported by the advisory programs. When a program did not report a specific fill price, the open for the day is used if the recommendation was given before the open and if the recommendation was given during the trading day, the settle price was used. Open and settlement prices from the Chicago Board of Trade and Chicago Mercantile Exchange from www.barchart.com were used. Liquidity costs are incurred when non-floor traders open or close positions on an exchange and are not accounted for in this analysis. These costs reflect that the non-floor trader must generally buy at the ask and sell at the bid price. This difference, the bid-ask spread, is the return earned by floor traders for “making the market.”
Brokerage Costs
Brokerage cost or commission charges are incurred when a feedlot manager opens or closes positions on an exchange. In this study brokerage costs are assumed as $50 per contract for round turn futures contract and $30 per contract to enter or exit an options contract. Further, it is assumed that live cattle contracts, which have a contract size of 40,000 pounds (400 cwt)and feeder cattle contracts at 50,000 pounds (500 cwt) are used from the CME. Brokerage costs for one round-turn futures position are $0.125/cwt for live cattle and $0.10/cwt for feeder cattle contracts. Brokerage costs for each options transaction are $0.075 and $0.06, respectively. Corn contracts at 5,000 bushels and soybean meal contracts at 100 short tons are used from the CBOT. Brokerage costs for one round-turn futures position are one cent per bushel for corn and fifty cents per ton for soybean meal. Brokerage costs for each options position were $0.006 per bushel for corn and $0.30 per ton for soybean meal.
Marketing Behavior of Advisory Services
There are a variety of tools that an advisory service may recommend in marketing programs and before evaluating a service’s performance it is useful to understand what methods were used to produce program results. Differences can exist between advisory service recommendations from various services by the timing of the recommendation, the frequency of recommended transactions and the pricing tool used, whether it is futures, options or a combination of both. While two services may have similar net prices, the marketing behavior which results in these prices may vary significantly.
In order to compare the marketing behavior of different advisory programs, behavior is analyzed in two steps. The first step describes the frequency of recommended transactions and the pricing tools recommended. In the second step, a daily index of the net amount sold (or purchased) by each marketing advisory service is developed. These “marketing profiles” may be used to summarize marketing behavior of individual programs.
11
Marketing Tools
The purpose of this section is to describe the frequency of use of various marketing tools by advisory programs in live cattle, feeder cattle, corn and soybean meal. There are four possible marketing tools which an advisory service may use. They include futures only, options only, a combination of futures and options, and no future or options. A count of the frequency of use of each tool is made for each marketing advisory service. In order for a program to be counted in a quarter as using a combination of futures and options, at least one futures and one options contract must be entered into during the marketing window, although they need not be open during the same time.
The frequency count for each marketing advisory service is shown in Table 3 for live cattle and Tables 4 through 6 for feeder cattle, corn and soybean meal, respectively. “Futures only” was the most common recommendation strategy for live cattle. On average, a futures only strategy was used in 48% of quarters. The second most common strategy was to use no futures or options. Either options only or a combination of futures and options were used during very few quarters. The most common strategy for feeder cattle, corn and soybean meal was to use no futures or options. On average, 81% of quarters used no futures or options for feeder cattle. For corn and soybean meal, no futures or options was used in 56% and 72% of quarters, respectively.
Frequency counts of advisory services recommending futures or options use by quarter are shown in Tables 7 through 9 and percentage counts in Tables 10 through 12. These tables show that a “futures only” marketing regime was used by the majority of live cattle marketing services. For feed and feeder cattle purchases, using no futures or options was the most frequently recommended action. A few similarities may be seen for the feed and feeder hedges,with hedging activity increasing in 2002 and 2003 in both commodities. However, no long term patterns are seen across commodities.
Construction of Marketing Profiles
While the frequency of marketing tools does provide insight into the risk management recommendations of an advisory service, it is pertinent to also examine the magnitude and timingof hedges which are recommended. The daily index of the net amount sold or purchased is calculated to provide a measure of the magnitude and timing of hedges. To construct this index, the amount of live cattle sold (or feeder cattle or feed bought) each day in futures or options is calculated and aligned chronologically. The price exposure of a portfolio is a weighted average of the price exposure of individual positions where the weights are the “deltas” of the individual positions (e.g., Hull, 1997). For each marketing quarter, a daily index is computed for each advisory service. The service’s marketing profile is created when the daily values of the index are plotted for the entire marketing quarter.
A weighting process is used when calculating net amount sold or purchased for an advisory service. This weight, known as delta, is the dollar amount the value of a position changes when the underlying commodity price increases one dollar. Deltas are generally computed assuming positive price changes and the value of delta for the current price is validonly for “small” price changes.
12
When a prospective hedger faces downside price risk, as a marketer of fed cattle would, the delta is no longer computed assuming a positive price change. In this case, the delta of a short futures position is typically regarded as being -1. Downside risk is eliminated from one hundred pounds of finished steers by short selling 100 pounds of live cattle futures when basis is ignored. It is appropriate to reverse the sign on the delta to a positive however, which at most times makes more sense to a fed cattle marketer. When signs are reversed long futures will have a delta of negative one because long futures will add downside risk to a feedlot when hedging live cattle marketings.
While futures positions generally have +1 or -1 deltas, the deltas of options positions are more complicated. In the case of an options position, the underlying instrument is the futures position. Here, delta represents the change in the option premium given a one dollar increase in the futures position. When examined from a fed cattle marketer’s position, options represent a future intention to sell the underlying commodity through a long put or sold call. These deltas have positive values. Options that represent the acquisition of the underlying commodity, such as purchasing feeder calves, corn and soybean meal in the form of sold puts or bought calls, have negative delta values. In addition to the change in underlying position, the value of an option’s delta also takes into account the relationships between strike price, futures price, time to expiration and whether the option is short or long. Unlike a delta value for a futures contract, deltas for options values change daily as these variables change.
For example, assume a call option is sold with a $70/cwt. strike price. If the futures were initially at $75/cwt. and then decreases by $1.00/cwt. the delta will decrease by less than $1.00/cwt. as the futures price nears the strike price and the uncertainty that the call will remain in the money grows. While options deltas change frequently unlike futures contracts they are similar in that long puts and short calls have positive deltas and short puts and long calls have negative deltas. Long puts and short calls have deltas in the range of 0������������ �����������long calls have deltas ranging from -1�����
In this study, options deltas are calculated each day a market advisory service recommends an options strategy or when an option position is open. FINCAD financial softwarepackage was used for delta calculations. The first step in computing option deltas is computing theoretical option value (Bertoli et al., 1999). Black’s model,
(6) � = ������() ������� ���
(7) � = ������() + ������( �� )is used to derive theoretical option value because of its use among options traders and in academia (McDonald, 2002). In Black’s model, U represents the value of the current futures contract, r is the risk free rate, t is the time to expiration expresses as the portion of a year, N(x)
is the cumulative normal density function, = �� (��)
��� + ���� , E is the option’s exercise price, e is
the exponential function and ln() is the natural logarithmic function. C is the theoretical value of a call and P is the theoretical value of a put.
13
Options premiums, exercise prices and time to expiration for each option were collected from barchart.com. The risk free interest rate is the secondary market daily three-month Treasury bill rate, as quoted by the Federal Reserve. Implied volatility of the option is calculated daily, and this estimate should result in an accurate estimation of “true” option delta.
The option delta is calculated by differentiating the call or put formula by the underlying futures price. Therefore, the formula used for deriving put and call deltas is,
(8) ��= ���� = �()
(9) ��= ���� = �()
�� ��C ��������������������������P denotes the delta of a put option. As the underlying futures price, time to expiration, and implied volatility change daily, deltas must be recalculated daily for each underlying option.
Net Amount Sold/Bought
The method for computing net amount of live cattle sold (feed or feeder cattle bought) across all daily positions of each advisory service may be computed as (e.g., Hull, p.320, 1997),
(10) ��= � ������
�
�!"
where �� is the net amount sold across all (m) marketing positions with open on date t, expressed as percent of actual production. ��� is the percentage sold (bought) of marketing service i ondate t and ��� represents the delta position of i on t.
Spot cash marketings (purchases) are made on the Wednesday closest to the 15th of the month for each of the three months in the marketing quarter in each advisory service marketing profile. Therefore, 33.33% of sales (purchases) are made each month totaling to 100% in the last month of the marketing quarter.
The following example demonstrates how an advisory service net amount sold is calculated. A marketing advisory service recommends to hedge 25% of 2004 Q1 fed cattle marketings. Using equation (10), the net amount sold is 25%, (.25 *1). Suppose now, the marketing advisory service recommends using a long put to hedge an additional 50% of 2004 Q1 marketings and the option has a delta of -.27. The delta value of this option implies that for a one dollar upward move in the underlying futures contract, the value of the option will increase by 27 cents. The negative value of the delta shows that this option involves buying, and if using equation (10), the net amount sold for the service is 11.5% (.25+ (.50*-.27)).
14
If the option becomes more out of the money, the delta will become less negative and the net amount sold will approach 25%. This reflects the fact that the option will be worth less or nothing as it nears expiration. If the option becomes more in the money, the delta’s value will approach negative one and the net amount sold will approach -25% (25%-50%). This reflects that as an option becomes more in the money the option is more likely to be exercised and may be seen as a long futures hedge. Calculations for this example may also be applied to hedges for input purchases of feed and feeder cattle.
Marketing Profiles
Marketing profiles for hedging live cattle begin 6 months prior to the start of the marketing quarter to include three months before feeder cattle are placed and three months in the feedlot prior to the marketing quarter. Input marketing profiles for feed and feeder cattle purchases also begin 6 months prior to the marketing quarter. Marketing profiles are used to show the net position of advisory service recommendations during each day of the marketing window. A graph of the net advisory position shows the magnitude and timing of sales (purchases) over the marketing window. For multiple marketing windows an average may be taken across each day to arrive at the average net amount sold (bought) for the marketing advisory service throughout the given marketing window.
To arrive at the average net amount sold for a given program, the days are aligned so the average on a specific date may be calculated. Because of the seasonality in live cattle marketings, each quarter’s marketings are weighted and thus the net amount sold of any service may only be compared with other net amounts sold of the same quarter, i.e. 2004Q1 may only be compared with other Q1 marketing profiles and not a Q2, 3, or 4 marketing profile. Averaging the net amount sold across marketing quarters and graphing this averaged amount sold allows seasonality trends within an advisory service to be seen at a quick glance.
In addition to averaging the net amount sold for a given marketing advisory service, an average across all services may also be calculated. Again, only like quarters may be compared due to the seasonality in fed cattle sales. This average across all programs and all years depicts the net amount sold of a ‘typical’ advisory service for a given quarter. In addition to the average, minimum and maximum net amounts sold are also computed to give a perspective of the industry. Similar averages may be computed for input hedges of feed and feeder cattle to gain a perspective on typical advisory service marketing profiles.
Figures 2 through 10 show the live cattle quarterly average marketing profiles for each individual marketing advisory service. Figure 11 shows the average live cattle quarterly marketing profile across all services. Figures 12 through 19 show the feed quarterly average marketing profiles. Figure 20 shows the average feed quarterly marketing profile across all services. Figures 21 through 27 show the feeder cattle quarterly average marketing profiles, and Figure 28 shows the average feeder cattle quarterly marketing profile across all services. Most of the averages of, minimum and maximum marketing profile stay between zero and 100%, but there are some instances where the marketing profile may be negative. In these instances, such as Top Farmer’s third quarter live cattle marketing profile in Figure 9, Panel C, the negative amount represents that a hedger would be holding a net long position. Feed and feeder cattle
15
marketing profiles that are negative are net short. Instances where the marketing profile is over 100%, indicates that hedges exceed 100% of marketings. All live cattle advisory services and some feed and feeder advisory services are over hedged at some point within the averagemarketing window.
Prior to the start of the marketing window, most advisory services had no hedges in placeand as the marketing period progressed hedging reached 100%. There are instances where an advisory service begins making hedging recommendations prior to the start of the average marketing window. An example of this is seen in Figure 5 Panel C, Agrivisor’s 3rd quarter average marketing profile. On day one of the marketing window, Agrivisor is approximately 25% hedged. Similarly, an advisory service may be over hedged at the end of the average marketing window, this implies that an advisory service has marketed 100% of cash marketings and still has additional hedges open at the end of the marketing window. All quarterly average live cattle marketing profiles (Figures 2 through 10) have greater than 100% hedged at the end of the marketing window.
In addition to the percent hedged at the beginning and end of the marketing window, it is also important to examine the percent hedged at various points in the marketing window. Tables 13 through 15 show the amount hedged 6-months, 3-months and one day before the start of the marketing quarter, averaged across all quarters and all years for each advisory service. Six months prior the marketing quarter advisory programs in feeder cattle, live cattle, and feed had hedged small amounts but as the start of the marketing quarter approached most advisory services have a higher percent sold (or bought for feed and feeders). Table 13 shows hedged levels for live cattle. Six-months prior to the start of the marketing quarter advisory services had 0.36% hedged on average. Several companies had no hedges in place and Agrivisor had the highest percent sold at 25% hedged. At 3-months prior to the start of the marketing quarter, there were still several companies with no hedges in place but on average, marketing advisory services had hedged 5.26%. Top Farmer had the maximum amount hedged at 100% sold.
The day before the marketing quarter began advisory services had 14.6% marketed on average. As with the 6- and 3- month time frames, there were still advisory services with no hedges in place at this time. Stewart Peterson, Top Farmer, and Utterback had 100% or greater hedged. Top Farmer had the most hedged, at 108.63%. Overall, in the months leading up to the marketing quarter there was on average very little hedging and hedged levels were highly variable at all stages of the marketing window, often ranging from 0% to 100% hedged.
Tables 14 and 15 display the net amount bought for feeder cattle and feed respectively. Similarly to live cattle, amounts bought were small 6-months prior to the start of the marketing quarter and increased as the marketing window progressed. On average 0.37% of purchases were hedged 6-months prior and 2.55% of purchases were hedged the day prior to the start of the marketing quarter in feeder cattle. Utterback held the largest hedged position on the day prior to the start of the marketing quarter with 66.67% hedged. Overall, very few hedges for feeder cattle were entered into throughout the time period of this study.
For feed purchases, average coverage 6-months prior to the start of the quarter was -0.39% due to a net long position held by Utterback for several quarters. The day prior to the
16
start of the marketing quarter 19.15% of feed purchases were hedged. Agrivisor had the most hedged prior to the start of the marketing quarter with 149.88% hedged. Hedges the day prior to the start of the marketing quarter were greater in feed than either feeder or live cattle.
Benchmark Formulation and Performance Evaluation
After an advisory service’s net price received is calculated, it can be compared to a benchmark to determine the relative performance of the service’s recommendations. In this section the properties of a benchmark are developed, and benchmarks are defined and calculated for live cattle sales, feeder cattle purchases, feed purchases and for the three factors on a margin. Then, the benchmark will be used in combination with the results of services’ recommendations to compare performance across four indicators.
Benchmark Specification
While benchmarking originated in the financial literature, it is commonly used across many disciplines. Good, Irwin, and Jackson (1998) referred to the market benchmark price as the standard to which market advisory services were compared for corn and soybeans in the AgMAS Project. Irwin et al. (2006) describe the function of a benchmark or market benchmark prices as a comparison of prices generated by an advisory service and prices a representative producer could have received by using an alternative strategy. Additional properties of market benchmarks, from a practical perspective, are that a benchmark should be simple to understand and calculate, represent returns from a strategy that can be implemented by producers and should be directly comparable to net advisory prices (Jackson, Irwin, and Good, 1998).
The alternative strategy used assumes the representative producer or market participant is rational and that competition eliminates all arbitrage opportunities. Also, it is assumed that the market is efficient (Fama, 1970). In its strongest form, the efficient market hypothesis posits that market prices always reflect all available public and private information. This would imply that no strategy, from an advisory service or otherwise, could beat the market. In the context of the AgMAS study, a market benchmark should measure the average price offered by the live cattle, feeder cattle, or feed markets over the marketing quarter. Average price is computed to reflect returns and purchases of a naïve strategy of marketing equal portions of live cattle sales and feeder cattle and feed purchases each month during the marketing quarter. At the end of the marketing quarter, 100% of sales or purchases will be complete with this strategy. The efficient market hypothesis suggests the difference between these market benchmarks and other marketing strategies should be equal to zero on average.
Cash Benchmark
The simplest pricing strategy feedlot managers have available is pricing with spot price cash sales. Feedlot managers who purchase inputs and then market live cattle on a constant production schedule would receive, over the period, the quarterly average spot price. In this study, the spot price received for live cattle marketings is the Kansas Daily Direct Slaughter Cattle, Negotiated Purchases price. The Kansas Daily Direct Slaughter Cattle, Negotiated Purchases price series reflects a weighted average cash price that is agreed to upfront between
17
the feeder and packer. Formula or grid based prices are not included in this series nor are auction prices included. Data is collected twice daily from packers in regards to purchases of finished cattle from feedlots with finished cattle sales of over 125,000 head per year. Approximately 85% of finished cattle are accounted for in this price survey. This price series dates back to 1993, but prior to 2001 the reporting of price information was on a voluntary basis. Difficulties related to the Livestock Mandatory Reporting Act (1999) after implementation in 2001 resulted in a lack of information from March 31, 2001, to February 25, 2002. After implementation of the act, packers are now audited at least three times per year to insure reliability of data.
Because no slaughter cattle prices are available for 2001-2002, the National Daily Boxed Beef Cutout and Boxed Beef Cuts-Negotiated Sales price has been used as a proxy during this time period. On average, approximately 65% of a carcass can be processed into boxed beef (Rincker, 2009) and as a result the daily boxed beef value is divided by 0.65 to arrive at a proxy for the value of the entire carcass.
The Kansas Direct Feeder Cattle Summary price series is the simple spot cash price market benchmark for feeder cattle purchases. Unlike the slaughter series, this report is not mandatory. Weekly data is collected from feedlots, order buyers and auction barns for feeders that were either purchased from Kansas producers or brought into Kansas feedlots. Because this report is voluntary and has no strict guidelines, there is great variability in what is reported from feedlot to feedlot and only approximately 3% of cattle traded are accounted for in this series. Another caveat related to this price series is that prices are reported as delivered prices and not free on board from the auction barn or preconditioning lot the feeder calf was purchased from.Transportation costs to the feedlot are included in the overall price.
The soybean meal benchmark is derived from the 48% soybean meal price reported in the Kansas City Daily Feed report. Daily, the two Kansas soybean meal processors report soybean meal basis bids after futures trading has closed. The basis value is then added to the nearby futures contract close to determine a soybean meal cash price. This report is not mandatory but does accurately represent the Kansas soybean meal market due to the small number of meal processors in Kansas.
The final price series used in this study is the #2 Yellow Corn price from the Western Kansas Grain Market daily price report. Nine Western Kansas grain elevator closing bids are voluntarily reported daily for this report. For use in this study, the simple average of these nine elevators is used to derive a single daily price.
For ease of comparison, a weighted average feed cost was created that combines soybean meal and corn into one price in $/pound. On average, 93% of a feeder calf’s diet is corn and 7% is soybean meal. The weighted average cost was constructed by multiplying the monthly average corn price, in $/pound, by 93% and adding this to 7% of the monthly average soybean meal also measured in $/pound. The quarterly average price for the weighted average cost is derived by averaging the monthly feed indexes for each of the three months in the quarter.
18
For the live cattle and feeder cattle price series, the quarterly average price is derived by averaging each of the weekly average prices in the quarter. Each quarter is then weighted to account for the seasonality of fed cattle marketings. As previously described, the third quarter has the highest number of marketings and fewest fed cattle are marketed in the fourth quarter. These weights flow down to feed and feeder purchases such that sufficient amounts of feed are purchased in the preceding quarters for the increased Q3 marketings.
The difference between the weighted cash spot market benchmark and a market advisory service’s net advisory price is easily calculated. As stated above, a feedlot manager who purchases inputs and markets cattle on a consistent schedule receives the average quarterly spot price. Futures gains and losses are added to the average weighted quarterly spot price to determine the net advisory price for live cattle recommendations. Futures gains and losses are subtracted from the average weighted quarterly spot price of inputs to determine the net advisory price because the futures gains lower net advisory purchase price. As an example, suppose the quarterly weighted average cash price for feeder steers is $50.00 per cwt. Futures loss was $0.06 per cwt. and brokerage charges were $0.03 per cwt. The futures loss and brokerage charge are added to the quarterly cash price to reflect an increase in the cost. The net price received is $50.09 per cwt. (50.00 + 0.06+0.03)
If an advisory program made no recommendations during a quarter their net advisory price is simply the average quarterly spot price. This was most common in feeder cattle recommendations, although there were quarters in both live cattle and feed that a company made no recommendations. Table 16 shows the cash benchmark for each quarter for live cattle, feeder cattle and feed. The large fluctuations from quarter-to-quarter reflect the underlying variability in the price series.
Performance Evaluation of Services
Four indicators are used to evaluate the performance of marketing advisory services in live cattle and margin hedging recommendations. The first indicator is directional performance, the proportion of advisory services that beat the respective market benchmarks. The secondindicator is the magnitude of the difference between the marketing advisory service’s average price and the benchmark or average price performance. The third measure of performance will take into account the average price and riskiness of an advisory program in comparison to the market benchmark, known as E-V analysis. The final measure of performance will be the predictability of an advisory service’s results across time. Performance evaluations were completed for live cattle, feeder cattle, feed and margin recommendations.
Net Advisory Prices and Benchmarks for 1995-2004
The net advisory price for a service giving live cattle marketing recommendations is found by combining the net cash sales price plus futures/options gain (loss) minus brokerage costs. Margin advisory prices are found by taking the live cattle net advisory price for a specific quarter less the weighted net advisory prices for feed and feeder purchases corresponding with cattle marketed in that quarter.
19
Table 17 summarizes the average net advisory price received per quarter across services for live cattle. The highest net advisory price received for live cattle, $102.71/cwt, over the entire 40 quarters was by Ag Review in Q3 of 2004. The lowest net advisory price over the 40 quarters, $47.35/cwt, was in the fourth quarter of 1998 also by Ag Review. Q3 of 2004 also had the highest average net advisory price at $100.18/cwt and the highest market benchmark price of $101.71/cwt. Both the lowest average net advisory price ($47.65/cwt) and the lowest market benchmark price ($47.79/cwt) occurred in 2001 Q4. Net price received over the 1995 Q1 through 2004 Q4 period averaged $69.79/cwt. Standard deviations of live cattle net price received varied greatly over the entire 10 year period. The standard deviation averaged $1.37over all quarters from 1995 to 2004 and ranged from a low of $0.07 in 2000 Q2 to $6.75 in 2001Q3.
Table 18 summarizes average net advisory price paid per quarter across all services for feeder cattle. The lowest price paid was $40.52/cwt in 1999 Q4 by Utterback. The highest price paid across all quarters, $65.39/cwt, was by Top Farmer in 2004 Q2. Both the lowest average net price paid ($40.81/cwt) and the lowest market benchmark ($40.86/cwt) occurred in 1999 Q4. The highest average net price paid ($64.93.cwt) and the highest benchmark ($65.19/cwt) were in 2004 Q2. Over the entire 22 quarter period, net price paid averaged $52.30/cwt, while the benchmark averaged $52.37. On average, the average advisory service price paid for feeder cattle was $.07 lower than the benchmark. Standard deviation over this time period was very low due to the low number of executed trades and averaged $0.25/cwt and ranged from $0.02/cwt in 1999 Q3 to $0.80/cwt in 2004 Q2.
Table 19 summarizes average net advisory prices paid per quarter across all services for feed. The lowest price paid for feed was $9.77/cwt in 2000 Q1. This price was achieved by executing no trades and thus receiving the benchmark. During this quarter no trades wereexecuted and the benchmark was paid by all services except Ag Review and Brock. The highest net price paid ($20.41/cwt) was paid in 2004 Q by Top Farmer. Both the lowest average price ($9.85/cwt) and the lowest benchmark price ($9.77/cwt) were paid in 2000 Q1, while the highest average price ($19.70/cwt) and the highest benchmark price ($19.91/cwt) were paid in 2004 Q3.Over the entire 22 quarter period, the average price paid was $13.49/cwt and the average market benchmark was $13.37/cwt. Standard deviation ranged from $0.04/cwt in 2000 Q3 to $1.76/cwt in 2002 Q1 and averaged $0.43/cwt over the entire period.
Net advisory service performance for margin hedging varied much more than net advisory performance for live cattle due to the interaction of the three markets. Twenty-two periods are included in this segment of the research due to data availability and results are displayed in Table 20. The highest price margin was $29.56/cwt. in the third quarter of 2003, obtained by Brock. The lowest margin, $-12.94/cwt was obtained in 2001 Q4 by Ag Review.The highest average margin ($23.68/cwt) occurred in 2003 Q3, and the highest market benchmark margin also occurred in 2003 Q3 ($28.54/cwt). The lowest average margin ($-11.00/cwt) occurred in 2004 Q4 and the lowest market benchmark margin ($-11.31/cwt)occurred in 2004 Q4. Overall, net margin averaged $8.14/cwt. The standard deviation averaged $1.76/cwt over all quarters, ranging from $0.38/cwt in 2002 Q3 to $7.29 in 2003 Q3.
20
Table 21 summarizes the average net advisory price received by advisory service across all quarters for live cattle recommendations. On average, Ag Resource had the highest net advisory price ($70.58/cwt) and Top Farmer had the lowest ($68.98/cwt) over the 40 quarter period.
Table 22 summarizes the average net advisory price received per advisory service across all quarters for feeder cattle recommendations. On average, services that executed no trades over the 22 quarters and as such paid the market benchmark had the highest average price paid ($52.37/cwt). Utterback had the lowest average price paid ($52.19/cwt) over the 22 quarter period. It is important to note that, on average, the highest price paid is the benchmark. Anyservice that made recommendations that were executed paid a lower average price for its feeder cattle than the benchmark.
Table 23 summarizes the average net advisory price paid per advisory service across all quarters for feed recommendations. Across the 22 quarter period, Ag Resource paid the lowest price ($13.21/cwt) on average for feed needs. Ag Review paid the highest, at $14.00/cwt.
Table 24 summarizes the average margin received per advisory service across all quarters for margin hedging. On average, Ag Line had the highest net margin ($9.46/cwt) and AgReview had the lowest ($6.72/cwt) over the 22 quarter period. Ag Review beat the benchmark in feeder cattle hedging, but fell short in live cattle and feed hedging.
Two important points should be stressed prior to considering performance results. First,feedlot managers subscribe to market advisory services for a variety of reasons (Irwin et. al., 2006). The most likely reason for service subscription is for market information. While it may seem that an advisory service with high quality information would give marketing recommendations that provided positive gains, this may not always be the case. Second, another cost which is not included in calculations for net advisory price is the cost of subscription for each advisory service. A typical subscription fee for an advisory service’s information wasbetween $350 and $500 annually. As noted above, feedlots subscribe to advisory services for many reasons, and the fee is not specifically split between cost for market information and cost for hedging recommendations. The annual subscription fee is not included in net price received calculations since it so small and because it is most often seen as an overhead expense and does not tie specifically to the price a feedlot receives for its live cattle or cost of inputs.
Directional Performance
The first indicator of performance measures the direction of a service’s net price in relation to the benchmark. It measures the proportion of services that beat the benchmark and is not influenced by extremely high or low advisory prices. Positive performance is shown if more than 50% of services beat the market benchmark, what one would expect based on the flip of a fair coin.
Table 25 shows the percentage of services that beat the benchmark with their live cattle and margin recommendations for 1995 Q1 through 2004 Q4 and 1999 Q3 through 2004 Q4,respectively. Table 26 shows the proportion of quarters that each advisory service beat the
21
benchmark for live cattle, feeder cattle, feed and margin hedging. Average results are also presented, but it should be noted that the averages presented in this table do not necessarily equal the average of the individual averages listed. The average from the table equally weights each net advisory price in the sample where the average of the individual quarters equally weights the quarters.
The results in Table 25 reveal similarities in the proportion of services which beat the benchmark in live cattle and margin hedging. For live cattle in Table 25, the maximum proportion of programs for any one given quarter is 78%, and the minimum is 0%. During the 1995-2004 period, advisory services beat the benchmark 28% of the time with live cattle recommendations. Over the 1999 Q3-2004 period, this percentage dropped to 22%. During this same period, margin performance was higher at 28%. The better performance of margin recommendations may be explained by companies who met, but did not exceed the benchmark in live cattle (thus not contributing to the percent that exceeded the benchmark) and also exceeded the benchmark in either feed or feeder cattle. Advisory services beat the benchmark 19% and 14% of the time for feeder and feed, respectively. While this percentage is small, there were cases where the amount that an advisor was below the benchmark in live cattle was offset by gains in either feed or feeder.
Ag Resource had the highest proportion of quarters outperforming the benchmark (45%) across all quarters for live cattle. Pro Farmer beat the benchmark the smallest percent of the time at 13% in the 1995-2004 time period. The average proportion of programs above the benchmark for the 1995-2004 period for live cattle was 27%. This percentage dropped to 22% during the 1999 Q3-2004 period. During 1999 Q3-2004, Ag Resource’s performance dropped to 14%, the second lowest among all services. Ag Line had the best performance (41%) and Pro Farmer beat the benchmark the smallest percent of quarters (5%).
Ag Line beat the margin benchmark in 45% of quarters during 1999Q3 and 2004Q4. Pro Farmer beat the margin benchmark the smallest percent of the quarters (9%). The average proportion of programs above the benchmark during this period was 28%. On average, both live cattle and margin recommendations fell short of exhibiting positive (greater than 50%) performance.
The directional performance analysis discussed in this section showed an underperformance for both live cattle and margin hedging. The average proportion of services outperforming the live cattle benchmark (27%) and margin benchmark (28%) was below the performance of other crops or livestock evaluated by AgMAS.
Average Price Performance
The second pricing performance indicator takes into account both direction and magnitude of advisory service price/margin relative to the benchmarks. Here, the average net price/margin received by an advisory service is compared to the market benchmark. Performance is measured by net price received minus the benchmark for each service. A positive difference indicates that an advisory service received a price above the benchmark. Next, these differences
22
are averaged across each quarter for a program and then within each quarter across all advisory programs.
Unlike grains that may only have evaluations conducted yearly, performance for live cattle and margin hedging may be computed on a quarterly basis in conjunction with the quarterly marketing windows. In comparison to grains, this results in a larger sample size with 40 marketing quarters available for observation in live cattle and 22 marketing quarters in margin hedging.
A matched sample t-test of zero difference is used to assess statistical significance. The t-statistic is,
(11) � = #$�%% (&'/*,)-
where #$�%% is the average difference across n marketing quarters. &' is the estimated standarddeviation of the differences across n marketing quarters in the sample. This t-statistic follows a t-distribution with n-1 degrees of freedom. The two-tail p-value represents the probability of observing the absolute value of the t-statistic or higher across many random samples. With a p-value of 0.05 or smaller one may conclude that the average differences are not equal to zero.
Table 27 presents results on the average price performance for each quarter averaged across all programs for live cattle, feeder cattle, feed and margin hedging. For live cattle, average price performance ranged from $3.52/cwt below the benchmark (2003 Q4) to $1.91/cwt above the benchmark in 2004 Q1. Over 1995-2004, the average price performance was $0.29/cwt below the benchmark. During this same time frame, standard deviation was $0.91/cwt, resulting in a p-value of 0.05, signifying that this pricing performance is statistically different from than the market benchmark.
The price performance decreased to $0.58/cwt below the benchmark over 1999 Q3-2004,and the standard deviation increased to $1.21/cwt, resulting in a p-value of 0.04. Similarly to 1995-2004, performance was significantly different from the market benchmark.
For feeder cattle, pricing performance ranged from $0.26 below the benchmark (2004Q2) to $0.04 above the benchmark (2000 Q4), and the average price paid was $0.06/cwt belowthe market benchmark. The p-value for feeder cattle prices was 0.00, signifying feeder cattle prices paid were significantly lower than the benchmark.
In contrast to the positive performance of feeder cattle recommendations, the net advisory service price paid for feed was significantly higher than the benchmark. Prices ranged from $0.60/cwt above the benchmark (2002 Q1) to $0.21/cwt below the benchmark (2004 Q3), and averaged $0.12/cwt above the benchmark. The standard deviation was $0.17/cwt, resulting in a p-value of 0.00.
Pricing performance for margin recommendations was also significantly worse than the benchmark. The average margin ranged from $4.87/cwt below the benchmark (2003 Q3) to $1.49/cwt above the benchmark (2004 Q1) and averaged $0.76/cwt below the benchmark, across
23
all services and all quarters. The standard deviation of the margin was $1.32/cwt, resulting in a p-value of 0.01.
Because results are statistically significant, it is useful to more closely examine the financial impact to a feedlot. Suppose a large Kansas feedlot markets 12,000 head per quarter at 1,250 pounds, or 150,000 cwt. marketed per quarter. If the margin for this feedlot was below the market benchmark by $0.76/cwt, the feedlot lost $114,000 for one quarter. Over the course of a year, the feedlot would lose $456,000. This difference is both statistically significant and may play an important role in the financial viability of the feedlot.
Table 28 presents the average price performance for individual programs for live cattle, feeder cattle, feed and margin hedging by advisory service. Two advisory services, AgLine and AgResource produced average net advisory prices that outperformed the market benchmark in live cattle from 1995-2004. AgResource was the only advisory service that produced an average net price received that was statistically significantly higher than the benchmark at the 90% confidence level. Seven advisory services produced an average price that underperformed the market benchmark. Three advisory services, Ag Review, Stewart-Peterson and Top Farmer had average prices that were statistically lower than the benchmark at the 90% confidence level.
In feeder cattle, six advisory services outperformed the benchmark but only one service, Utterback, produced results that were statistically significant. No advisory serviceunderperformed when compared to the benchmark.
Two advisory services had average net advisory prices that outperformed the benchmarkin feed hedging. However, neither AgResource nor Agrivisor results were statistically different from the benchmark. Five advisory services produced a net price paid that was higher than the benchmark, and four of these services, Ag Review, Brock, Pro Farmer, and Top Farmer, had a net price paid that exhibited statistically significant underperformance compared to the benchmark at the 90% confidence level.
Similar to live cattle hedging, AgLine and AgResource both had results that were better than the benchmark for margin hedging. However, neither of these differences was statistically significant. The remaining seven advisory services produced results that were inferior to the benchmark. Four services, Brock, Pro Farmer, Stewart-Peterson and Top Farmer had a netmargin that was statistically lower than the benchmark at the 90% confidence level.
For margin hedging, two services produced results better than the market benchmark, three services produced results that were not statistically different from the benchmark and four services produced results worse than the benchmark.
24
Risk/Return Analysis
While the direction and magnitude of net prices received in relation to the market benchmark is an important indicator of performance, it may not give the complete picture. Another important indicator to examine in this analysis is the riskiness of a program. Two programs may end up having the same net advisory price for a quarter but one may have much higher risk than the other. These differences in risk may come from the type of pricing tool, the timing of actions and variations in implementing complex strategies. E-V, or mean variance, analysis is the most common method used to analyze decision making risk. Often, standard deviation is substituted for variance because of its ease of interpretation.
In this analysis, risk may be described as the chance that participants fail to achieve the market benchmark price because the participant followed an advisory service’s recommendations. Based on this definition, risk is not just limited to losses but also refers to the likelihood that what is expected to happen actually fails. A realized price that varies often from its expected price carries greater risk than price that does not vary often although the two mayhave the same average net price.
Tables 21 through 24 contain the data required for E-V analysis for live cattle and margin hedging. Mean and standard deviation of performance per quarter for each advisory service are presented in the tables. Standard deviation for live cattle performance during 1995-2004 ranges from a low of $12.55/cwt to a high of $13.34/cwt among advisory services. The standard deviation of the market benchmark over the 1995-2004 time period was $13.12/cwt. The benchmark’s standard deviation from 1999 Q3-2004 increased to $13.82/cwt and ranged from $13.03/cwt to $14.24/cwt.
Standard deviation for margin hedging performance ranges from a low of $9.07/cwt to a high of $10.14/cwt among all quarters. The standard deviation of the cash benchmark averaged $9.79/cwt.
This range in standard deviations illustrates the wide range of riskiness present among various advisory programs’ recommendations. Although more variables are taken into account in margin hedging, the standard deviation of the margin performance is lower than for live cattle.This may be attributed to the low number of trades executed in feeder and feed.
E-V analysis is demonstrated through a graph of the average net price received versus the standard deviation of that price. The benchmark’s price and standard deviation is used to divide the graph into four quadrants. The top left quadrant of the graph is the most desirable as it depicts higher return and lower risk in comparison to the benchmark. The bottom right is least desirable because of the higher risk and lower return when compared to the benchmark.
Figures 29 and 30 show E-V analysis results. Two programs demonstrated superior results in relation to the benchmark with higher prices and a lower standard deviation than the benchmark for live cattle. Two programs fall into the inferior category of higher risk and lower price in the bottom right, while the other five programs fall in categories of moderate risk and
25
return. In the case of margin performance, one program dominated the cash benchmark while two were inferior, falling in the bottom right quadrant.
When comparing performance in relation to price only, 27% of the advisory programs outperformed the cash benchmark in live cattle. Once risk was taken into account, this percent was reduced to 22%. In comparison, 28% programs beat the margin market benchmark based on average margin alone and 11% when risk was considered. The results are consistent with results from other AgMAS studies (e.g., Webber, 2004, Jirik, et. al, 2001, Irwin, Martines-Filho, and Good, 2002). In each of the previous AgMAS studies, performance also dropped once risk was accounted for.
Predictability Tests
Even though n advisory service may perform positively in a given quarter, there may be a wide range of performances among the quarters. This raises a question of whether or not advisory service performance exhibits predictability from quarter to quarter. Within a single quarter, the net advisory price received among programs may vary by as much as $19 per cwt. Financial investment research has used a study of the correlations of program rank across quarters to measure the degree of predictability present within a set of marketing periods (Irwin, Zulauf and Ward, 1994; Malkiel, 1995).
To test predictability, all active programs are first aligned by quarter. Predictability of performance is then tested between two adjacent quarters (e.g., 1995 Q1 versus 1995 Q2). For the first quarter of the pair (t=1995 Q1), advisory services are ranked in descending order based on net advisory price received. Advisory programs in the second quarter of the pair are also ranked (t + 1= 1995 Q2). Finally, the correlation coefficient between the ranks of the two adjacent quarters is computed. Unpredictable performance is demonstrated through a correlation coefficient near zero. The standard error of the correlation coefficient is approximately equal to 1/�. and as thus the Z-test is appropriate.
Results of the predictability test for live cattle are found in Table 29. Correlation coefficients for live cattle recommendations ranged from 0.85 to -0.55 while average rank correlation over 1995-2004 was 0.25. Five of the thirty-nine comparisons showed statistical significance at the 95% confidence level or higher.
In summary, rank correlations in live cattle performance found little evidence of predictable performance from year to year. The rank correlation coefficient for live cattle was lower than previous AgMAS studies in corn, soybeans, and hogs (Irwin, et. al., 2006; Webber et al., 2012), but higher than in wheat (Batts, Irwin, and Good, 2009).
Advisory Service Performance Comparison
The performance of each advisory service in live cattle and margins may be compared to the other advisory services, and may also be compared to the performance of the advisory service’s performance in corn, soybeans, wheat and hogs. This section examines the behavior of advisory services within the scope of this study and also across all AgMAS studies.
26
Table 29 ranks each service’s performance within the group of advisory services for each inputs, output and margin. A rank of 1 is given to the advisory service with the bestperformance. For live cattle and margin, a rank of 1 is given to the advisory service with the highest net price received and for feed and feeder cattle, a rank of 1 is given to the advisory service with the lowest net price paid. It is interesting to note the change in rank in live cattle from the 1995-2004 period to the 1999 Q3-2004 period. Ag Resource was the top performing program from 1995-2004 and the fifth performing from 1999 Q3-2004. Utterback was the fifth performing service from 1995-2004 and the top performing service from 1999 Q3-2004.Utterback was also the top performing service in feeder cattle. Ag Resource was the top performing service in feed and Ag Line was the top performing service in the overall margin. Ag Line ranked second in both live cattle for both periods, second in feeder cattle and tied for third in feed.
Ag Line, the top ranked company in margin performance gave no recommendations for feed and tied for third in feed, along with the other services who gave no feed recommendations. Ag Line gave a total of four recommendations over the 1999-2004 time period. Recommendations were given in the fourth quarter of 2003 and the first quarter of 2004. Ag Line gave more frequent recommendation for live cattle. Recommendations were given in 65% of quarters. Ag Line gave as many as nine recommendations per quarter and averaged 2.3 recommendations per quarter, during quarters where recommendations were given.
Similarly, Ag Resource, the second ranked service in margins also gave recommendations in 65% of quarters, and gave a maximum of nine recommendations in a single quarter. Among quarters with recommendations, Ag Resource gave an average of 3.5recommendations per quarter.
An advisory service’s performance in hog marketing may be the most similar to live cattle because both are non-storable, livestock commodities. Results from Webber et al. (2012)are shown in Tables 30 and 31. Table 30 presents the ranking of each advisory service’s net price received over a given time frame. Top Farmer had the highest net price received for hogs.However, for all live cattle related classes, Top Farmer placed near or at the bottom. Ag Line, which ranked first for the margin performance in this study ranked seventh in hogs. Ag Resource performed similarly across live cattle first (1995-2004), margin (second) and hogs (second). Other than Ag Resource, advisory services did not perform similarly across hogs and live cattle.
E-V Analysis results for hogs are presented in Table 31. Only one service had an average net price received above the cash benchmark and standard deviations below the average standard deviation of the cash benchmark. This compares to two companies outperforming the benchmark in live cattle and one service outperforming the margin benchmark.
It is useful to compare the results of this study to the results of prior AgMAS studies to determine if a service outperforms the benchmark across commodities or perhaps has a strength or weakness in a specific area. Performance results for wheat, corn and soybeans are presentedin Table 30 which displays the rank of each advisory service. More advisory services gave recommendations for corn and soybeans than those listed, but results are only presented for
27
services who also gave recommendation for live cattle. Rankings for Utterback are not available. Similar to live cattle, Ag Resource was the top ranked advisory service for corn and soybeans. Ag Resource came in near the middle in wheat. Ag Line, who was the top ranked advisory service for cattle margin performance came in near the middle to low end for corn, soybeans and soft red winter wheat. Ag Review and Top Farmer placed near or at the bottom for live cattle and margin results and similarly these two services placed in the bottom half for corn, soybeans and wheat. The one exception is Ag Review, which placed third in corn. Overall, Ag Resource exhibited positive performance across most commodities.
The E-V analysis reported for corn, soybeans and wheat in Table 31 reveals substantial differences from live cattle performance. For both corn and soybeans, six of the eight advisory services listed exhibited positive performance with respect to the benchmark. As a group advisory service performance for corn and soybean exceeded that for live cattle. For wheat however, the opposite is true. Only one advisory service beat the benchmark with respect to net price and risk in soft red winter wheat and no advisory services beat the benchmark in hard red winter wheat. While underperformance was seen in both wheat and live cattle, performance for live cattle was marginally better than for wheat.
Summary and Conclusions
Among the largest risks a cattle feedlot may face is price risk associated with the sales of fed cattle and the purchase of feeder calves and feed. The feedlot may follow the advice of a market advisory service to manage these risks. Advisory services provide feedlots with market information and also provide hedging recommendations.
While it is common for feedlot managers to subscribe to advisory services, there has been no previous research analyzing the effectiveness of the service’s hedging recommendations. In 1994 the AgMAS Project was started at the University of Illinois. The purpose of the AgMAS project was to provide objective, nonbiased evaluations of advisory services. Under the AgMAS project, the recommendations given by advisory services have been studied for corn, soybeans, wheat and hogs. Under each of these commodities, only the output hedge was studied. In contrast, many advisory services gave both input and output recommendations for live cattle. Many services gave recommendations on feeder cattle, corn and soybean meal purchases as input hedges and live cattle sales as output hedges.
Following Irwin et. al. (2006), two key research questions were addressed in this study:
� Do marketing advisory service hedging recommendations in live cattle-related markets produce results different from a market benchmark? The null hypothesis is that advisory services do not produce results different from the benchmark. The alternative hypothesis is that advisory services do produce results statistically better or worse than the benchmark.
� Is there predictability of advisory service performance from quarter-to-quarter? The null hypothesis is that advisory services do not exhibit predictability of performance from quarter-to-quarter. The alternative hypothesis is that advisory services do exhibit predictability of returns.
28
Through the AgMAS project, recommendations were recorded for at least 23 advisoryservices from 1995 through 2004. Nine advisory services gave recommendations deemed clear and concise for live cattle hedging, eight gave recommendations for feeder cattle and seven gave recommendations for feed. Using these recommendations, a feedlot model was developed to be representative of an actual feedlot located in Western Kansas
The marketing window for live cattle hedges began three months prior to placing the cattle on feed and extends through the time when cattle are slaughtered, totaling nine months. Marketing windows for feeder cattle and feed were the same nine months to mirror the live cattle marketing window. To analyze an advisory service’s margin hedging recommendations, net price received from live cattle, and net price paid for feeder cattle and feed for preceding quarters was combined.
Prior to reviewing the net price received for the group of services, it is useful to understand the behavior of the advisory services. Two advisory services may have the same net price received, but they may arrive at the prices in entirely different ways. Differences existed between the timing and frequency of recommendations and the pricing tools that were used.
To compare the marketing behavior, each service was analyzed in two steps. First, the frequency of recommendations and the pricing tool used is described. The most frequently used tool by advisor services for live cattle recommendations was a futures only approach. For feed and feeder recommendations, no futures or options were used the majority of the time and overall, no trends in the use of tools for live cattle, feeder cattle or feed were seen over the time period of this study.
Second, a daily index of net amount sold/purchased by each service during the marketing window is developed. These “marketing profiles” were used to summarize the timing and magnitude of recommended sales or purchases. On average, most services gave recommendations within the marketing quarter and hedged between 0 and 100% during the marketing quarter. On the day prior to the start of the marketing quarter, advisory services had on average 14.66% of live cattle sales, 2.55% of feeder purchases and 19.15% of feed purchases hedged. However, at various times some services were over or under hedged or had hedges in place prior to the start or after the completion of the marketing window.
The net price received by an advisory service for each commodity was compared to the market benchmark. The benchmark used for each commodity in this study was the spot cash benchmark averaged over a quarter and then weighted to account for seasonality.
Four performance indicators were applied to the net advisory service live cattle pricesand net margins received. The first performance indicator was directional performance, which measured whether or not a service beat the market benchmark. 27% of services beat the benchmark for live cattle hedges and 28% beat the benchmark for margin hedging. Because lessthan 50% of services beat the benchmark, this performance measure indicates that, on average,advisory services do not outperform the market.
29
The second performance measure captured both the direction and magnitude of the net price/margin received in comparison to the benchmark. On average for the 40 quarter period across all services, net price received for live cattle was $0.37/cwt lower than the benchmark.Average price received, when averaged across all quarters, was not statistically different from the benchmark for all services. Over the 22 quarter period for margin hedging, the net marginreceived was $0.76/cwt below the benchmark. When averaged across all services, the differencefrom the benchmark was statistically significant in all commodity classes. Feeder recommendations were the only class that exhibited positive price performance. A feedlot would be worse off if it had followed the advice of an average advisory service for live cattle or margin hedging.
The third performance measure, risk/return analysis, took into account direction, magnitude and the riskiness of the advisory service performance. Mean variance, also known as E-V analysis, was used in this study to analyze risk. Net price received in combination with standard deviation is compared to the market benchmark. A four-quadrant graph was used to display the relationships between the average performance and riskiness of performance for all advisory services and the benchmarks across all quarters. Two advisory programs exhibited positive performance results compared to the benchmark for live cattle. One advisory program exhibited positive performance results for margin hedging. For both live cattle and margin hedging, less than 50% of services beat the benchmark and as such the advisory services on average did not outperform the benchmark.
Predictability was the final performance measure used. Live cattle rank correlations showed little predictability of performance from quarter to quarter. While predictability increased slightly for margin hedging, this may have been because a small number of input hedges were recommended.
Across the four performance measures, advisory services underperformed with respect to the benchmark for live cattle and margin. Not only did the services underperform compared to the benchmark when risk, direction and magnitude were taken into account, the services did not outperform the benchmark even with respect to direction only. Also, the low predictability suggests that although an advisory service may beat the market in one quarter, the probability of them outperforming in the following quarter is very low.
Overall, these results are consistent with results found for corn, soybeans, wheat and hogs, although advisory services performed better as a group in corn and soybeans than for live cattle. After all performance measures were analyzed, the null and alternative hypothesis presented earlier may be revisited. The null hypothesis is that the market advisory services do not produce results different from the market benchmark. The alternative hypothesis is that the market advisory services perform significantly better or worse than the market benchmark. The null hypothesis is rejected. As a group advisory services perform statistically worse than the benchmark for live cattle, feed and margin hedging. Advisory services performed statistically better than the benchmark for feeder cattle purchases.
This research found that a feedlot did not benefit from following the recommendations of advisory services during the study period. The average margin performance of the advisory

30
services was of $0.76.cwt less than the market benchmark margin resulting in a significant negative impact on the profitability of a feedlot.
31
References
Batts, R.M., S.H. Irwin, and D.L. Good. “The Pricing Performance of Market Advisory Services in Wheat Over 1995-2004,” AgMAS Project Research Report 2009-01, Department of Agricultural and Consumer Economics, University of Illinois at Urbana-Champaign, December 2009. (http://www.farmdoc.illinois.edu/marketing/agmas/reports/09_01/Agmas0901.pdf)
Bertoli, R., C.R. Zulauf, S.H. Irwin, T.E. Jackson, and D.L. Good. “The Marketing Style of Advisory Services for Corn and Soybeans in 1995.” AgMAS Project Research Report 1999-02, August 1999. (http://www.farmdoc.illinois.edu/marketing/agmas/reports/1999-02/agmas_1999-02.pdf)
Brown, S. J., W. Goetzmann, R.G. Ibbotson, and S.A. Ross. “Survivorship Bias in Performance Studies.” Review of Financial Studies 5(1992):553:580.
Carpenter, J.N. and A.W. Lynch. “Survivorship Bias and Attrition Effects in Measures of Performance Persistence.” Journal of Financial Economics 54(1999):337-374.
Fama, E. "Efficient Capital Markets: A Review of Theory and Empirical Work." Journal of Finance 30(1970):1043-1053.
Good, D.L., S.H. Irwin, and T.E. Jackson. “Development of a Market Benchmark Price for AgMAS Performance Evaluations.” AgMAS Project Research Report 1998-02,December 1998. (http://www.farmdoc.illinois.edu/marketing/agmas/reports/1998-02/agmas_1998-02.pdf)
Good, D.L., T.A. Hieronymus, and R.A. Hinton. Price Forecasting and Sales Management: Corn, Soybeans, Cattle, and Hogs. Cooperative Extension Service, College of Agriculture, University of Illinois at Urbana-Champaign, 1980.
Hull, J. Options, Futures, and Other Derivatives. Prentice Hall: Upper Saddle River, New Jersey, 1997.
Irwin, S.H., C.R. Zulauf, and B.L. Ward. “Predictability of Managed Futures Returns.” Journal of Derivatives 2 (1994):20-27.
Irwin, S.H., D.L. Good, J. Martines-Filho, and R.M. Batts. “The Pricing Performance of Market Advisory Services in Corn and Soybeans Over 1995-2004.” AgMAS Project Research Report 2006-02, April 2006. (http://www.farmdoc.illinois.edu/marketing/agmas/reports/06_02/AgMAS06_02.pdf)
Jaffe, J.F. and J.M. Mahoney. “Performance of Investment Newsletters.” Journal of Financial Economics 53(1999):289-307.
32
Malkiel, B.G. “Returns from Investing in Equity Mutual Funds from 1971 to 1991.” Journal of Finance 50 1995):549-572.
McDonald, R. Derivatives Markets. Prentice Hall: Boston, Massachusetts, 2002.
Rincker, P. “Personal Communication,” January 20, 2009
Webber, R.L., R.M. Batts, S. H. Irwin, and D. L. Good. “The Pricing Performance of Market Advisory Services in Hogs Over 1995-2004,” AgMAS Project Research Report 2012-01,Department of Agricultural and Consumer Economics, University of Illinois at Urbana-Champaign, June 2012. (http://www.farmdoc.illinois.edu/pubs/agmas_search_all.asp)
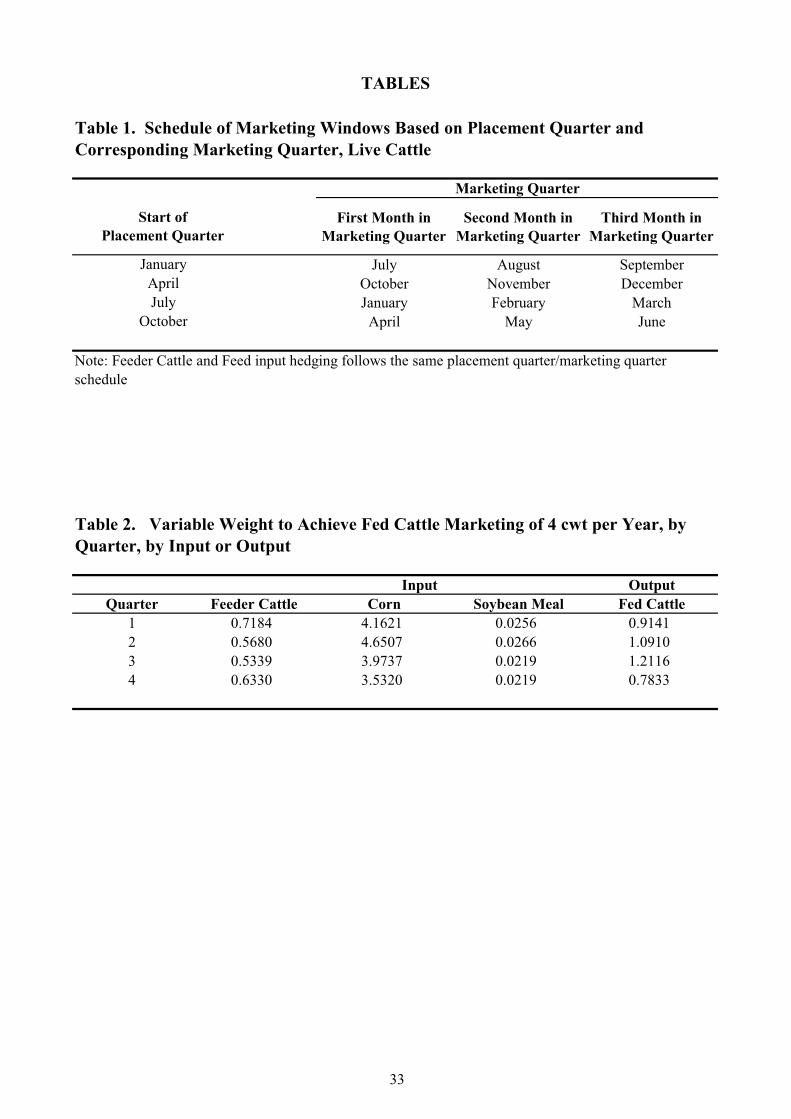
33
First Month in Marketing Quarter
Second Month in Marketing Quarter
Third Month in Marketing Quarter
July August SeptemberOctober November DecemberJanuary February March
April May June
OutputQuarter Corn Soybean Meal Fed Cattle
1 4.1621 0.0256 0.91412 4.6507 0.0266 1.09103 3.9737 0.0219 1.21164 3.5320 0.0219 0.7833
Feeder Cattle0.71840.56800.53390.6330
Start of Placement Quarter
JanuaryAprilJuly
TABLES
Marketing Quarter
Note: Feeder Cattle and Feed input hedging follows the same placement quarter/marketing quarter schedule
Table 1. Schedule of Marketing Windows Based on Placement Quarter and Corresponding Marketing Quarter, Live Cattle
Input
Table 2. Variable Weight to Achieve Fed Cattle Marketing of 4 cwt per Year, by Quarter, by Input or Output
October
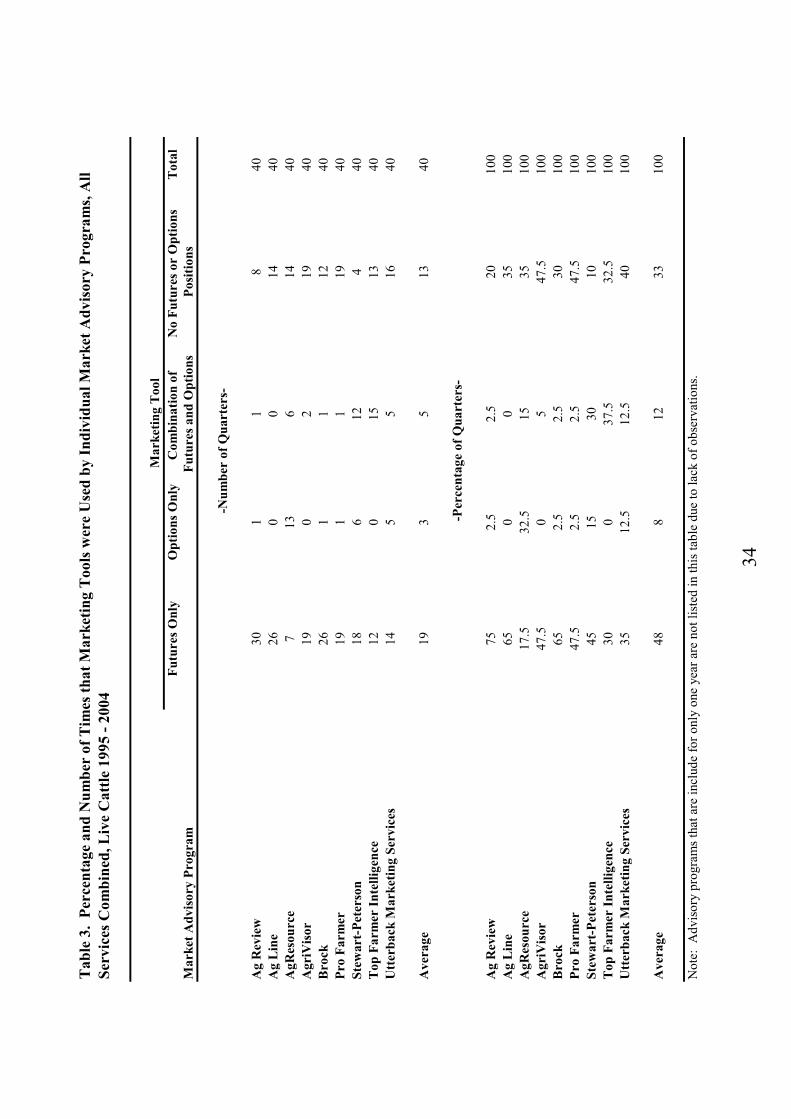
34
Futu
res O
nly
Opt
ions
Onl
yC
ombi
natio
n of
N
o Fu
ture
s or
Opt
ions
T
otal
Mar
ket A
dviso
ry P
rogr
amFu
ture
s and
Opt
ions
Posit
ions
Ag
Rev
iew
301
18
40A
g L
ine
260
014
40A
gRes
ourc
e7
136
1440
Agr
iVis
or19
02
1940
Bro
ck26
11
1240
Pro
Farm
er19
11
1940
Stew
art-
Pete
rson
186
124
40T
op F
arm
er In
telli
genc
e12
015
1340
Utt
erba
ck M
arke
ting
Serv
ices
145
516
40
Ave
rage
193
513
40
Ag
Rev
iew
752.
52.
520
100
Ag
Lin
e65
00
3510
0A
gRes
ourc
e17
.532
.515
3510
0A
griV
isor
47.5
05
47.5
100
Bro
ck65
2.5
2.5
3010
0Pr
o Fa
rmer
47.5
2.5
2.5
47.5
100
Stew
art-
Pete
rson
4515
3010
100
Top
Far
mer
Inte
llige
nce
300
37.5
32.5
100
Utt
erba
ck M
arke
ting
Serv
ices
3512
.512
.540
100
Ave
rage
488
1233
100
Tab
le 3
. Pe
rcen
tage
and
Num
ber
of T
imes
that
Mar
ketin
g T
ools
wer
e U
sed
by In
divi
dual
Mar
ket A
dvis
ory
Prog
ram
s, A
ll Se
rvic
es C
ombi
ned,
Liv
e C
attle
199
5 - 2
004
Mar
ketin
g To
ol
-Num
ber
of Q
uart
ers-
-Per
cent
age
of Q
uart
ers-
Not
e: A
dvis
ory
prog
ram
s tha
t are
incl
ude
for o
nly
one
year
are
not
list
ed in
this
tabl
e du
e to
lack
of o
bser
vatio
ns.

35
Futures Only Options Only Combination of No Futures or Options TotalMarket Advisory Program Futures and Options Positions
Ag Review 15 1 0 8 24Ag Line 2 0 0 22 24Ag Resource 2 0 0 22 24AgriVisor 0 0 0 24 24Brock 4 0 0 20 24Pro Farmer 2 0 0 22 24Stewart-Peterson 0 2 0 22 24Top Farmer Intelligence 4 0 0 20 24Utterback Marketing Services 8 0 2 14 24
Average 4 0 0 19 24
Ag Review 63 4 0 33 100Ag Line 8 0 0 92 100AgResource 8 0 0 92 100AgriVisor 0 0 0 100 100Brock 17 0 0 83 100Pro Farmer 8 0 0 92 100Stewart-Peterson 0 8 0 92 100Top Farmer Intelligence 17 0 0 83 100Utterback Marketing Services 33 0 8 58 100
Average 17 1 1 81 100
Table 4. Percentage and Number of Times that Marketing Tools were Used by Individual Market Advisory Programs, All Services Combined, Feeder Cattle 1999- 2004
Marketing Tool
-Number of Quarters-
-Percentage of Quarters-
Note: Advisory programs that are include for only one year are not listed in this table due to lack of observations.

36
Futures Only Options Only Combination of No Futures or Options TotalMarket Advisory Program Futures and Options Positions
Ag Review 19 1 2 2 24Ag Line 0 0 0 24 24Ag Resource 5 0 0 19 24AgriVisor 14 0 0 10 24Brock 11 0 1 12 24Pro Farmer 16 0 0 8 24Stewart-Peterson 0 0 0 24 24Top Farmer Intelligence 6 8 4 6 24Utterback Marketing Services 1 3 5 15 24
Average 8 1 1 13 24
Ag Review 79 4 8 8 100Ag Line 0 0 0 100 100AgResource 21 0 0 79 100AgriVisor 58 0 0 42 100Brock 46 0 4 50 100Pro Farmer 67 0 0 33 100Stewart-Peterson 0 0 0 100 100Top Farmer Intelligence 25 33 17 25 100Utterback Marketing Services 4 13 21 63 100
Average 33 6 6 56 100
Table 5. Percentage and Number of Times that Marketing Tools were Used by Individual Market Advisory Programs, All Services Combined, Corn 1999- 2004
Marketing Tool
-Number of Quarters-
-Percentage of Quarters-
Note: Advisory programs that are include for only one year are not listed in this table due to lack of observations.
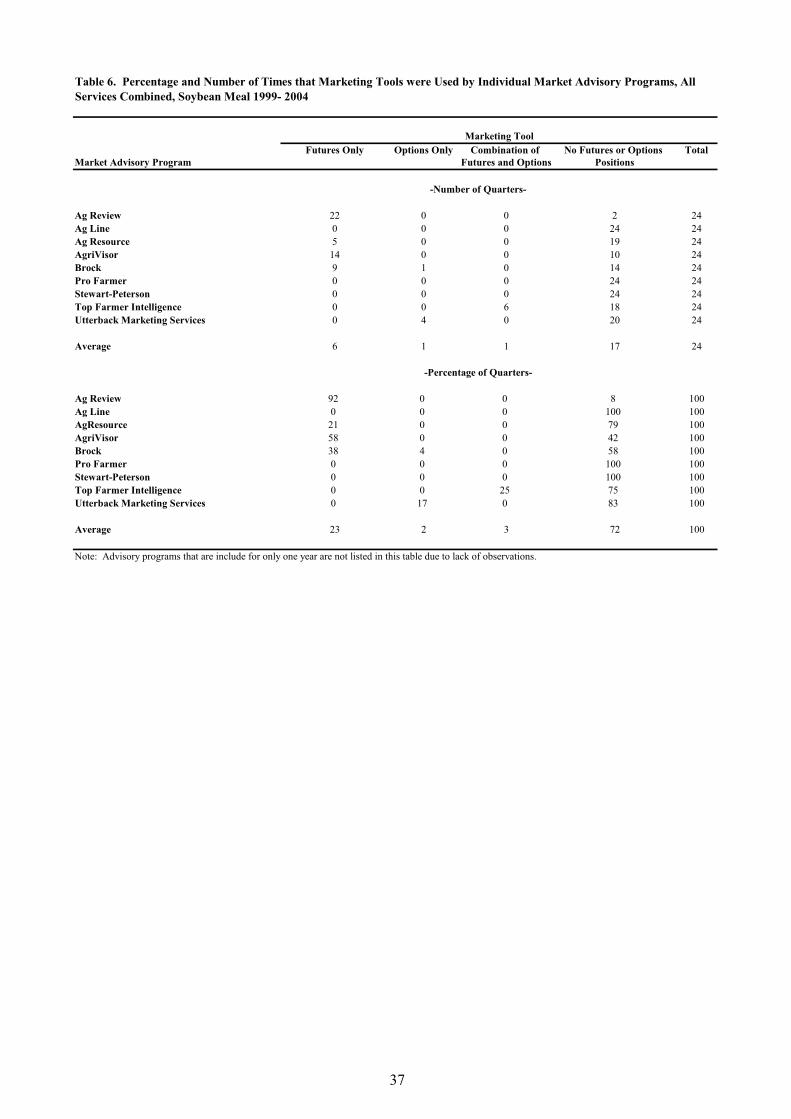
37
Futures Only Options Only Combination of No Futures or Options TotalMarket Advisory Program Futures and Options Positions
Ag Review 22 0 0 2 24Ag Line 0 0 0 24 24Ag Resource 5 0 0 19 24AgriVisor 14 0 0 10 24Brock 9 1 0 14 24Pro Farmer 0 0 0 24 24Stewart-Peterson 0 0 0 24 24Top Farmer Intelligence 0 0 6 18 24Utterback Marketing Services 0 4 0 20 24
Average 6 1 1 17 24
Ag Review 92 0 0 8 100Ag Line 0 0 0 100 100AgResource 21 0 0 79 100AgriVisor 58 0 0 42 100Brock 38 4 0 58 100Pro Farmer 0 0 0 100 100Stewart-Peterson 0 0 0 100 100Top Farmer Intelligence 0 0 25 75 100Utterback Marketing Services 0 17 0 83 100
Average 23 2 3 72 100
Table 6. Percentage and Number of Times that Marketing Tools were Used by Individual Market Advisory Programs, All Services Combined, Soybean Meal 1999- 2004
Marketing Tool
-Number of Quarters-
-Percentage of Quarters-
Note: Advisory programs that are include for only one year are not listed in this table due to lack of observations.
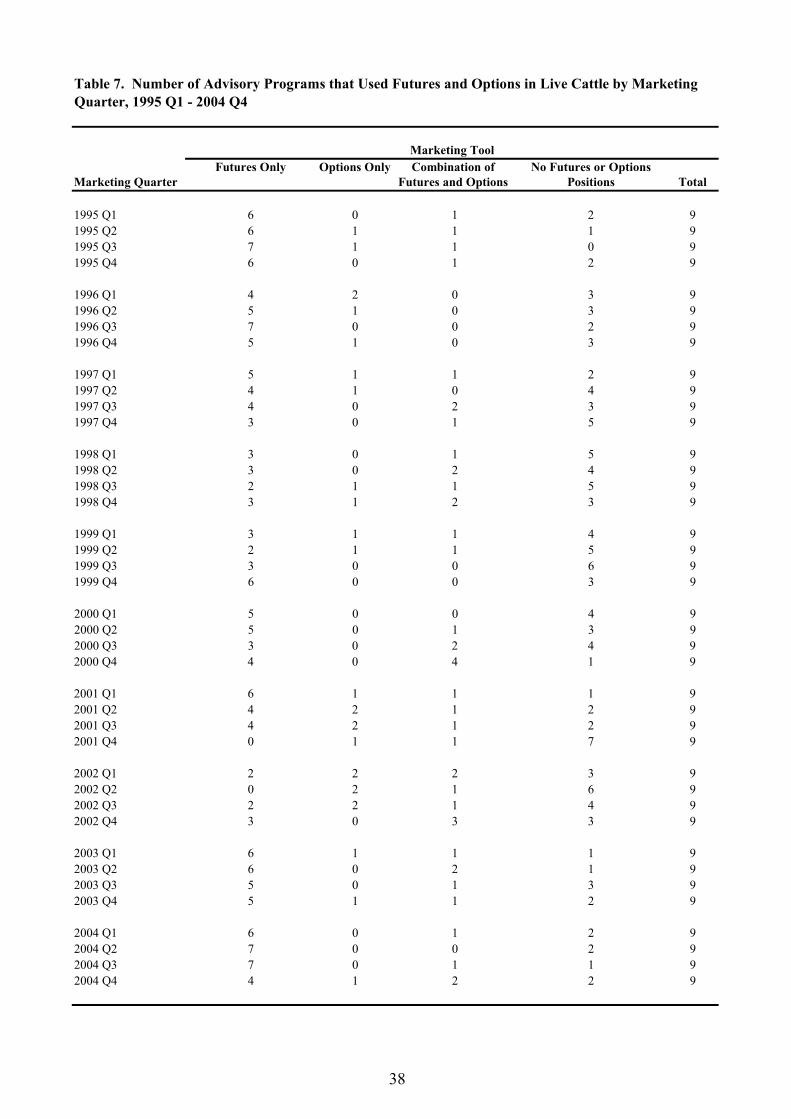
38
Futures Only Options Only Combination of No Futures or OptionsMarketing Quarter Futures and Options Positions Total
1995 Q1 6 0 1 2 91995 Q2 6 1 1 1 91995 Q3 7 1 1 0 91995 Q4 6 0 1 2 9
1996 Q1 4 2 0 3 91996 Q2 5 1 0 3 91996 Q3 7 0 0 2 91996 Q4 5 1 0 3 9
1997 Q1 5 1 1 2 91997 Q2 4 1 0 4 91997 Q3 4 0 2 3 91997 Q4 3 0 1 5 9
1998 Q1 3 0 1 5 91998 Q2 3 0 2 4 91998 Q3 2 1 1 5 91998 Q4 3 1 2 3 9
1999 Q1 3 1 1 4 91999 Q2 2 1 1 5 91999 Q3 3 0 0 6 91999 Q4 6 0 0 3 9
2000 Q1 5 0 0 4 92000 Q2 5 0 1 3 92000 Q3 3 0 2 4 92000 Q4 4 0 4 1 9
2001 Q1 6 1 1 1 92001 Q2 4 2 1 2 92001 Q3 4 2 1 2 92001 Q4 0 1 1 7 9
2002 Q1 2 2 2 3 92002 Q2 0 2 1 6 92002 Q3 2 2 1 4 92002 Q4 3 0 3 3 9
2003 Q1 6 1 1 1 92003 Q2 6 0 2 1 92003 Q3 5 0 1 3 92003 Q4 5 1 1 2 9
2004 Q1 6 0 1 2 92004 Q2 7 0 0 2 92004 Q3 7 0 1 1 92004 Q4 4 1 2 2 9
Table 7. Number of Advisory Programs that Used Futures and Options in Live Cattle by Marketing Quarter, 1995 Q1 - 2004 Q4
Marketing Tool
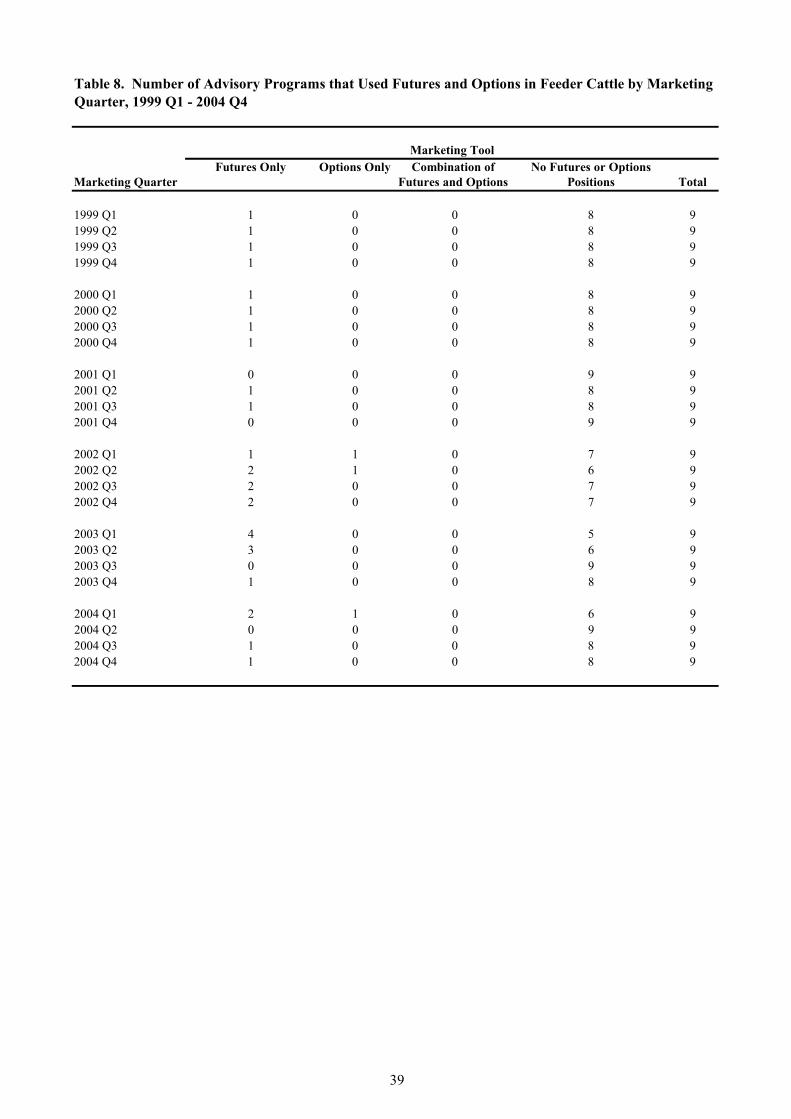
39
Futures Only Options Only Combination of No Futures or OptionsMarketing Quarter Futures and Options Positions Total
1999 Q1 1 0 0 8 91999 Q2 1 0 0 8 91999 Q3 1 0 0 8 91999 Q4 1 0 0 8 9
2000 Q1 1 0 0 8 92000 Q2 1 0 0 8 92000 Q3 1 0 0 8 92000 Q4 1 0 0 8 9
2001 Q1 0 0 0 9 92001 Q2 1 0 0 8 92001 Q3 1 0 0 8 92001 Q4 0 0 0 9 9
2002 Q1 1 1 0 7 92002 Q2 2 1 0 6 92002 Q3 2 0 0 7 92002 Q4 2 0 0 7 9
2003 Q1 4 0 0 5 92003 Q2 3 0 0 6 92003 Q3 0 0 0 9 92003 Q4 1 0 0 8 9
2004 Q1 2 1 0 6 92004 Q2 0 0 0 9 92004 Q3 1 0 0 8 92004 Q4 1 0 0 8 9
Table 8. Number of Advisory Programs that Used Futures and Options in Feeder Cattle by Marketing Quarter, 1999 Q1 - 2004 Q4
Marketing Tool
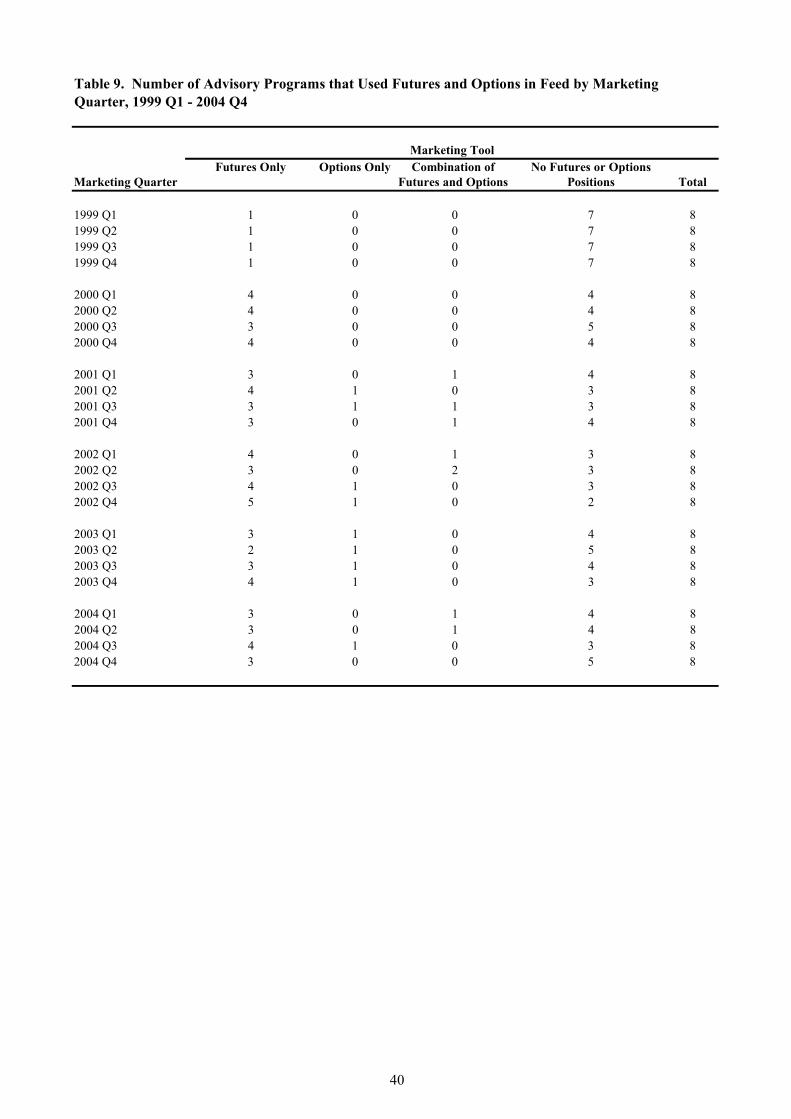
40
Futures Only Options Only Combination of No Futures or OptionsMarketing Quarter Futures and Options Positions Total
1999 Q1 1 0 0 7 81999 Q2 1 0 0 7 81999 Q3 1 0 0 7 81999 Q4 1 0 0 7 8
2000 Q1 4 0 0 4 82000 Q2 4 0 0 4 82000 Q3 3 0 0 5 82000 Q4 4 0 0 4 8
2001 Q1 3 0 1 4 82001 Q2 4 1 0 3 82001 Q3 3 1 1 3 82001 Q4 3 0 1 4 8
2002 Q1 4 0 1 3 82002 Q2 3 0 2 3 82002 Q3 4 1 0 3 82002 Q4 5 1 0 2 8
2003 Q1 3 1 0 4 82003 Q2 2 1 0 5 82003 Q3 3 1 0 4 82003 Q4 4 1 0 3 8
2004 Q1 3 0 1 4 82004 Q2 3 0 1 4 82004 Q3 4 1 0 3 82004 Q4 3 0 0 5 8
Table 9. Number of Advisory Programs that Used Futures and Options in Feed by Marketing Quarter, 1999 Q1 - 2004 Q4
Marketing Tool
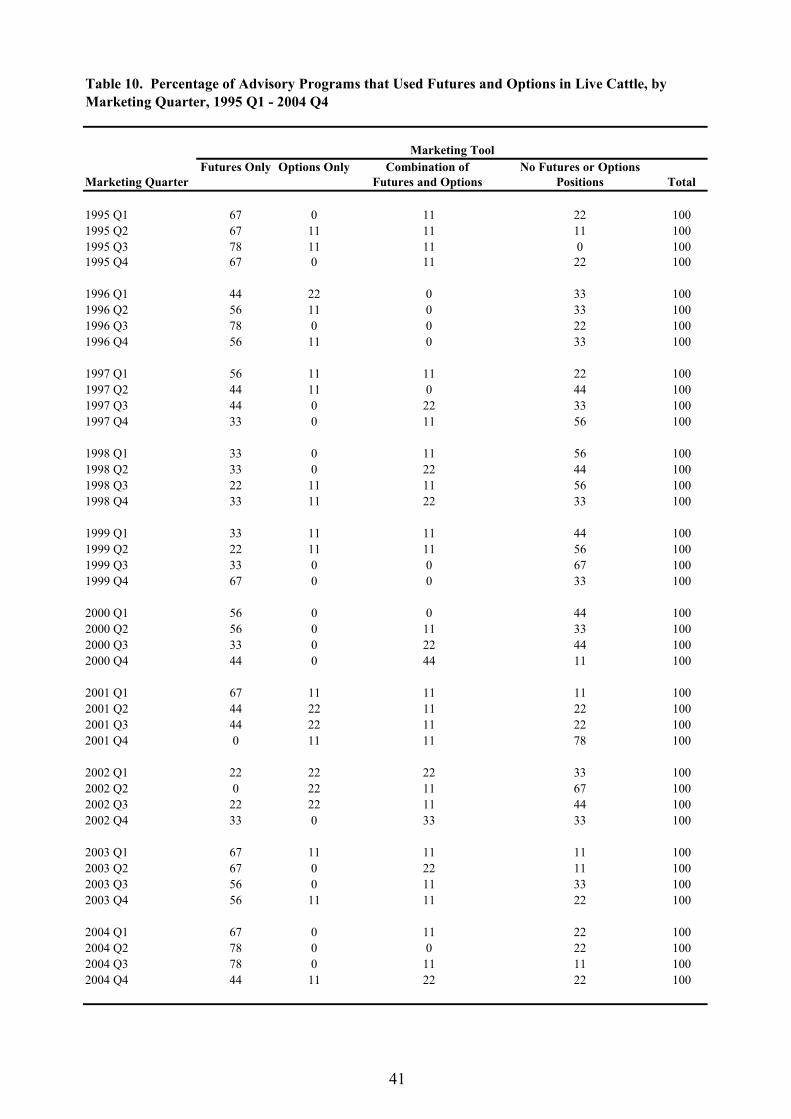
41
Futures Only Options Only Combination of No Futures or OptionsMarketing Quarter Futures and Options Positions Total
1995 Q1 67 0 11 22 1001995 Q2 67 11 11 11 1001995 Q3 78 11 11 0 1001995 Q4 67 0 11 22 100
1996 Q1 44 22 0 33 1001996 Q2 56 11 0 33 1001996 Q3 78 0 0 22 1001996 Q4 56 11 0 33 100
1997 Q1 56 11 11 22 1001997 Q2 44 11 0 44 1001997 Q3 44 0 22 33 1001997 Q4 33 0 11 56 100
1998 Q1 33 0 11 56 1001998 Q2 33 0 22 44 1001998 Q3 22 11 11 56 1001998 Q4 33 11 22 33 100
1999 Q1 33 11 11 44 1001999 Q2 22 11 11 56 1001999 Q3 33 0 0 67 1001999 Q4 67 0 0 33 100
2000 Q1 56 0 0 44 1002000 Q2 56 0 11 33 1002000 Q3 33 0 22 44 1002000 Q4 44 0 44 11 100
2001 Q1 67 11 11 11 1002001 Q2 44 22 11 22 1002001 Q3 44 22 11 22 1002001 Q4 0 11 11 78 100
2002 Q1 22 22 22 33 1002002 Q2 0 22 11 67 1002002 Q3 22 22 11 44 1002002 Q4 33 0 33 33 100
2003 Q1 67 11 11 11 1002003 Q2 67 0 22 11 1002003 Q3 56 0 11 33 1002003 Q4 56 11 11 22 100
2004 Q1 67 0 11 22 1002004 Q2 78 0 0 22 1002004 Q3 78 0 11 11 1002004 Q4 44 11 22 22 100
Table 10. Percentage of Advisory Programs that Used Futures and Options in Live Cattle, by Marketing Quarter, 1995 Q1 - 2004 Q4
Marketing Tool
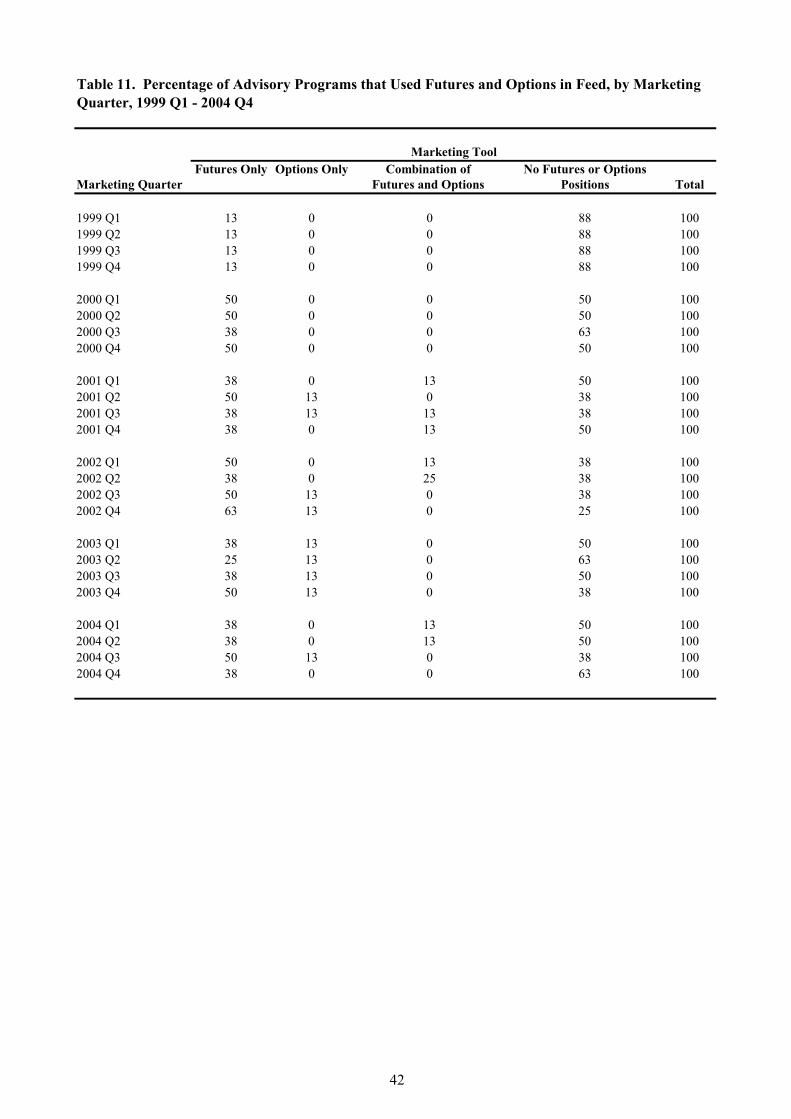
42
Futures Only Options Only Combination of No Futures or OptionsMarketing Quarter Futures and Options Positions Total
1999 Q1 13 0 0 88 1001999 Q2 13 0 0 88 1001999 Q3 13 0 0 88 1001999 Q4 13 0 0 88 100
2000 Q1 50 0 0 50 1002000 Q2 50 0 0 50 1002000 Q3 38 0 0 63 1002000 Q4 50 0 0 50 100
2001 Q1 38 0 13 50 1002001 Q2 50 13 0 38 1002001 Q3 38 13 13 38 1002001 Q4 38 0 13 50 100
2002 Q1 50 0 13 38 1002002 Q2 38 0 25 38 1002002 Q3 50 13 0 38 1002002 Q4 63 13 0 25 100
2003 Q1 38 13 0 50 1002003 Q2 25 13 0 63 1002003 Q3 38 13 0 50 1002003 Q4 50 13 0 38 100
2004 Q1 38 0 13 50 1002004 Q2 38 0 13 50 1002004 Q3 50 13 0 38 1002004 Q4 38 0 0 63 100
Table 11. Percentage of Advisory Programs that Used Futures and Options in Feed, by Marketing Quarter, 1999 Q1 - 2004 Q4
Marketing Tool
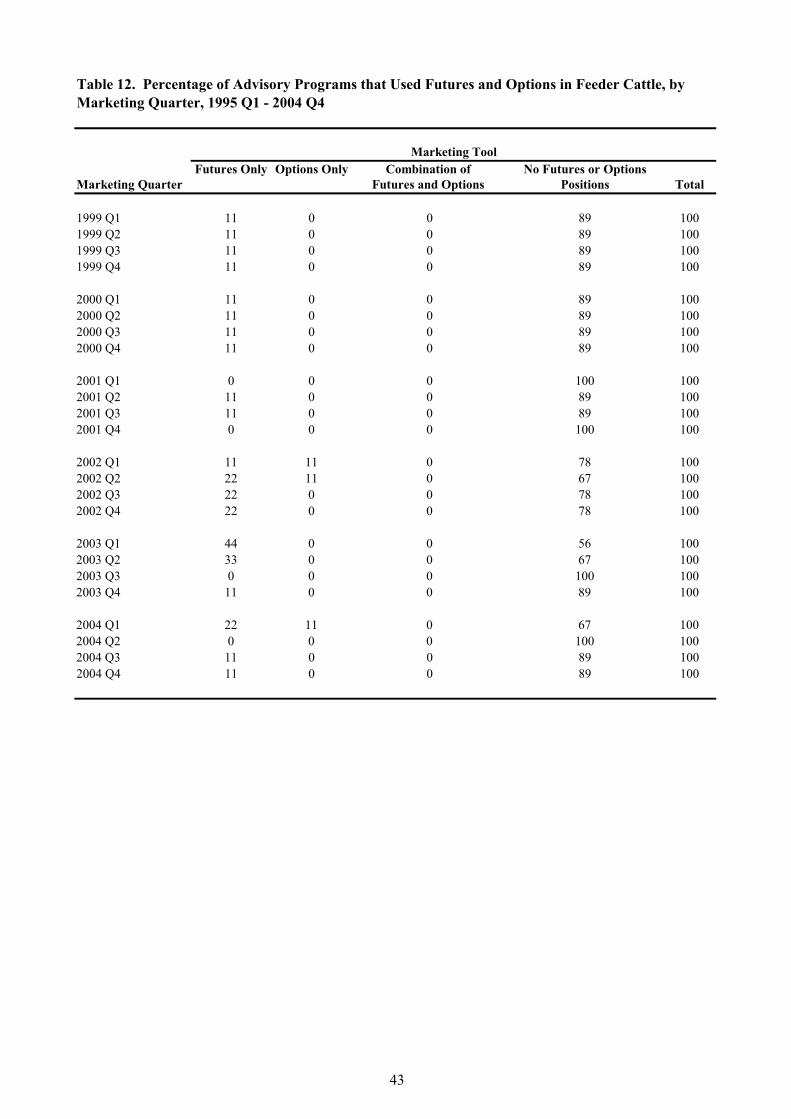
43
Futures Only Options Only Combination of No Futures or OptionsMarketing Quarter Futures and Options Positions Total
1999 Q1 11 0 0 89 1001999 Q2 11 0 0 89 1001999 Q3 11 0 0 89 1001999 Q4 11 0 0 89 100
2000 Q1 11 0 0 89 1002000 Q2 11 0 0 89 1002000 Q3 11 0 0 89 1002000 Q4 11 0 0 89 100
2001 Q1 0 0 0 100 1002001 Q2 11 0 0 89 1002001 Q3 11 0 0 89 1002001 Q4 0 0 0 100 100
2002 Q1 11 11 0 78 1002002 Q2 22 11 0 67 1002002 Q3 22 0 0 78 1002002 Q4 22 0 0 78 100
2003 Q1 44 0 0 56 1002003 Q2 33 0 0 67 1002003 Q3 0 0 0 100 1002003 Q4 11 0 0 89 100
2004 Q1 22 11 0 67 1002004 Q2 0 0 0 100 1002004 Q3 11 0 0 89 1002004 Q4 11 0 0 89 100
Table 12. Percentage of Advisory Programs that Used Futures and Options in Feeder Cattle, by Marketing Quarter, 1995 Q1 - 2004 Q4
Marketing Tool

44
Market Advisory Program 6-months 3-months 0-months
Average Net Amount SoldAg Review 0.00 6.54 14.09AgLine by Doane 0.63 6.11 19.80AgResource 0.10 1.25 9.24AgriVisor 2.40 7.00 16.86Brock 0.00 5.25 14.81Pro Farmer 0.00 6.35 12.55Stewart-Peterson (0.06) 1.02 10.77Top Farmer Intelligence 0.20 11.36 23.07Utterback Marketing Services 0.00 2.57 12.44
All Programs 0.36 5.27 14.85
Minimum Net Amount SoldAg Review 0.00 (16.32) (51.56)AgLine by Doane 0.00 0.00 0.00AgResource (13.78) (42.81) (61.85)AgriVisor 0.00 0.00 0.00Brock 0.00 0.00 0.00Pro Farmer 0.00 0.00 0.00Stewart-Peterson (2.48) (10.76) (32.64)Top Farmer Intelligence 0.00 0.00 (2.90)Utterback Marketing Services 0.00 (32.64) 0.00
All Programs (1.81) (11.39) (16.55)
Maximum Net Amount SoldAg Review 0.00 51.56 88.12AgLine by Doane 16.32 52.55 52.55AgResource 16.32 85.94 54.15AgriVisor 26.27 52.55 59.67Brock 0.00 26.27 52.55Pro Farmer 0.00 52.55 78.82Stewart-Peterson 0.00 40.29 105.10Top Farmer Intelligence 8.16 96.22 106.37Utterback Marketing Services 0.00 66.67 105.10
All Programs 7.45 58.29 78.05
Months Prior to Start of Marketing Quarter
--percent--
Table 13. Magnitude of Net Amount Sold by Market Advisory Programs, Live Cattle, Selected Dates 1995-2004
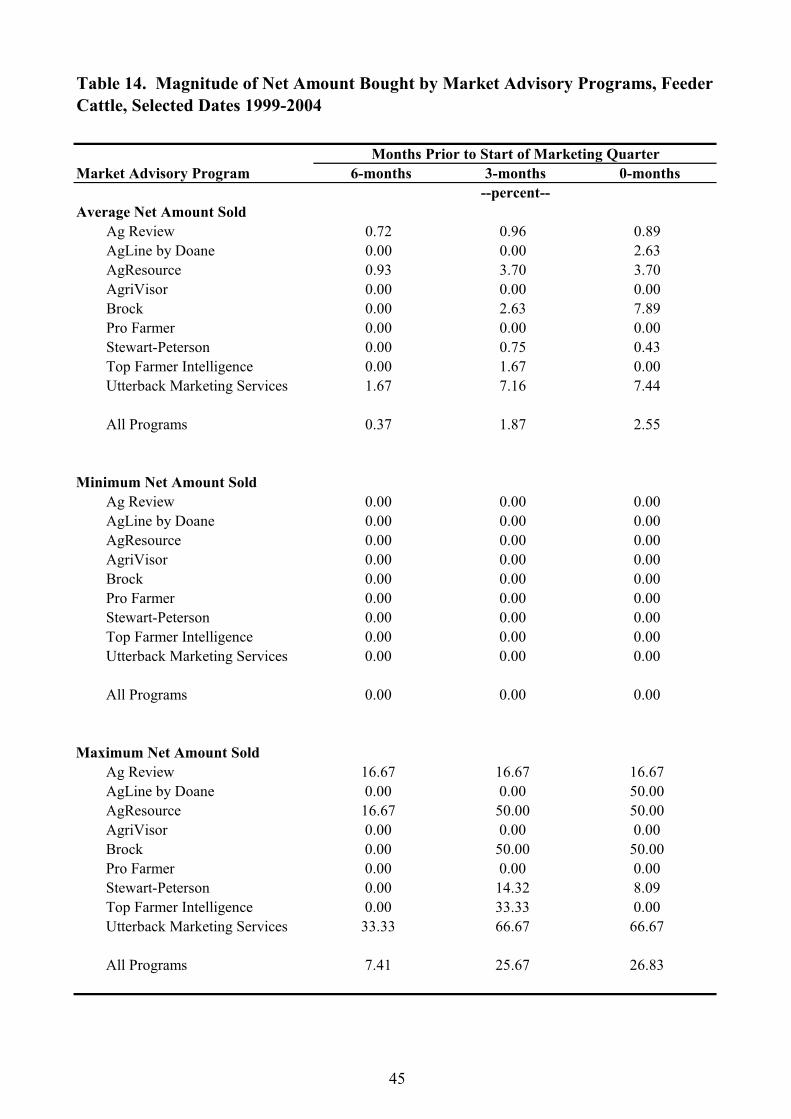
45
Market Advisory Program 6-months 3-months 0-months
Average Net Amount SoldAg Review 0.72 0.96 0.89AgLine by Doane 0.00 0.00 2.63AgResource 0.93 3.70 3.70AgriVisor 0.00 0.00 0.00Brock 0.00 2.63 7.89Pro Farmer 0.00 0.00 0.00Stewart-Peterson 0.00 0.75 0.43Top Farmer Intelligence 0.00 1.67 0.00Utterback Marketing Services 1.67 7.16 7.44
All Programs 0.37 1.87 2.55
Minimum Net Amount SoldAg Review 0.00 0.00 0.00AgLine by Doane 0.00 0.00 0.00AgResource 0.00 0.00 0.00AgriVisor 0.00 0.00 0.00Brock 0.00 0.00 0.00Pro Farmer 0.00 0.00 0.00Stewart-Peterson 0.00 0.00 0.00Top Farmer Intelligence 0.00 0.00 0.00Utterback Marketing Services 0.00 0.00 0.00
All Programs 0.00 0.00 0.00
Maximum Net Amount SoldAg Review 16.67 16.67 16.67AgLine by Doane 0.00 0.00 50.00AgResource 16.67 50.00 50.00AgriVisor 0.00 0.00 0.00Brock 0.00 50.00 50.00Pro Farmer 0.00 0.00 0.00Stewart-Peterson 0.00 14.32 8.09Top Farmer Intelligence 0.00 33.33 0.00Utterback Marketing Services 33.33 66.67 66.67
All Programs 7.41 25.67 26.83
Table 14. Magnitude of Net Amount Bought by Market Advisory Programs, Feeder Cattle, Selected Dates 1999-2004
Months Prior to Start of Marketing Quarter
--percent--
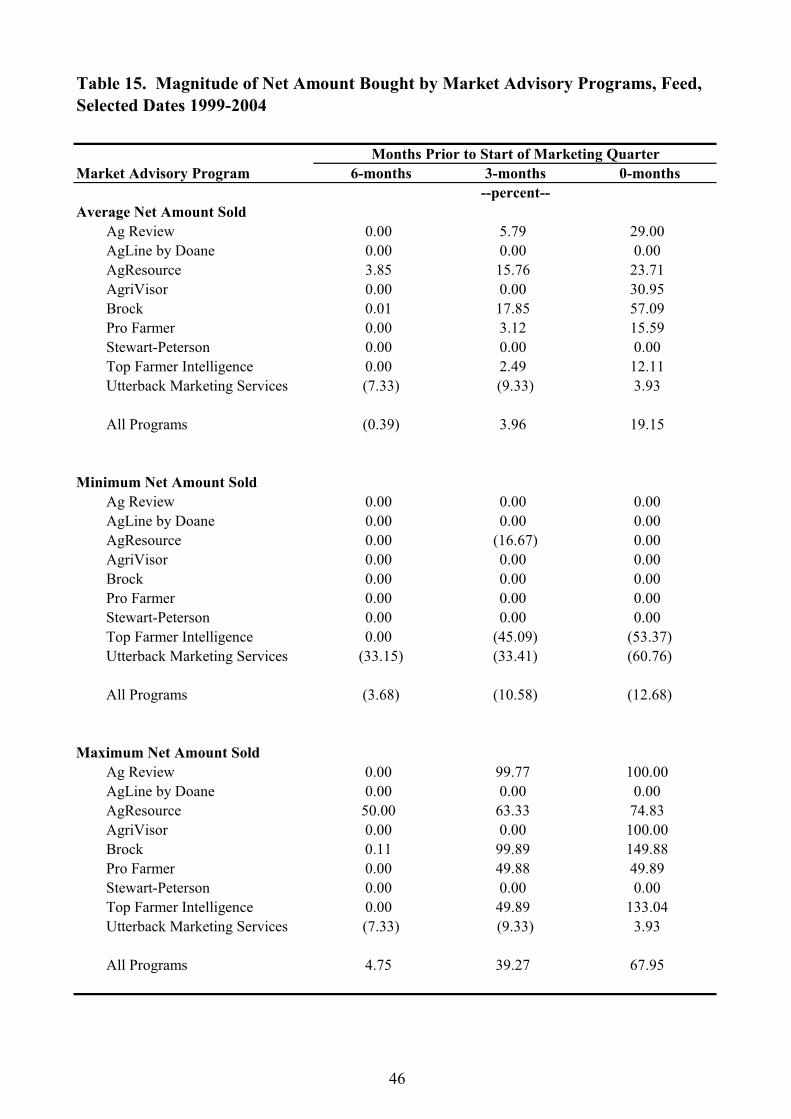
46
Market Advisory Program 6-months 3-months 0-months
Average Net Amount SoldAg Review 0.00 5.79 29.00AgLine by Doane 0.00 0.00 0.00AgResource 3.85 15.76 23.71AgriVisor 0.00 0.00 30.95Brock 0.01 17.85 57.09Pro Farmer 0.00 3.12 15.59Stewart-Peterson 0.00 0.00 0.00Top Farmer Intelligence 0.00 2.49 12.11Utterback Marketing Services (7.33) (9.33) 3.93
All Programs (0.39) 3.96 19.15
Minimum Net Amount SoldAg Review 0.00 0.00 0.00AgLine by Doane 0.00 0.00 0.00AgResource 0.00 (16.67) 0.00AgriVisor 0.00 0.00 0.00Brock 0.00 0.00 0.00Pro Farmer 0.00 0.00 0.00Stewart-Peterson 0.00 0.00 0.00Top Farmer Intelligence 0.00 (45.09) (53.37)Utterback Marketing Services (33.15) (33.41) (60.76)
All Programs (3.68) (10.58) (12.68)
Maximum Net Amount SoldAg Review 0.00 99.77 100.00AgLine by Doane 0.00 0.00 0.00AgResource 50.00 63.33 74.83AgriVisor 0.00 0.00 100.00Brock 0.11 99.89 149.88Pro Farmer 0.00 49.88 49.89Stewart-Peterson 0.00 0.00 0.00Top Farmer Intelligence 0.00 49.89 133.04Utterback Marketing Services (7.33) (9.33) 3.93
All Programs 4.75 39.27 67.95
Table 15. Magnitude of Net Amount Bought by Market Advisory Programs, Feed, Selected Dates 1999-2004
Months Prior to Start of Marketing Quarter
--percent--
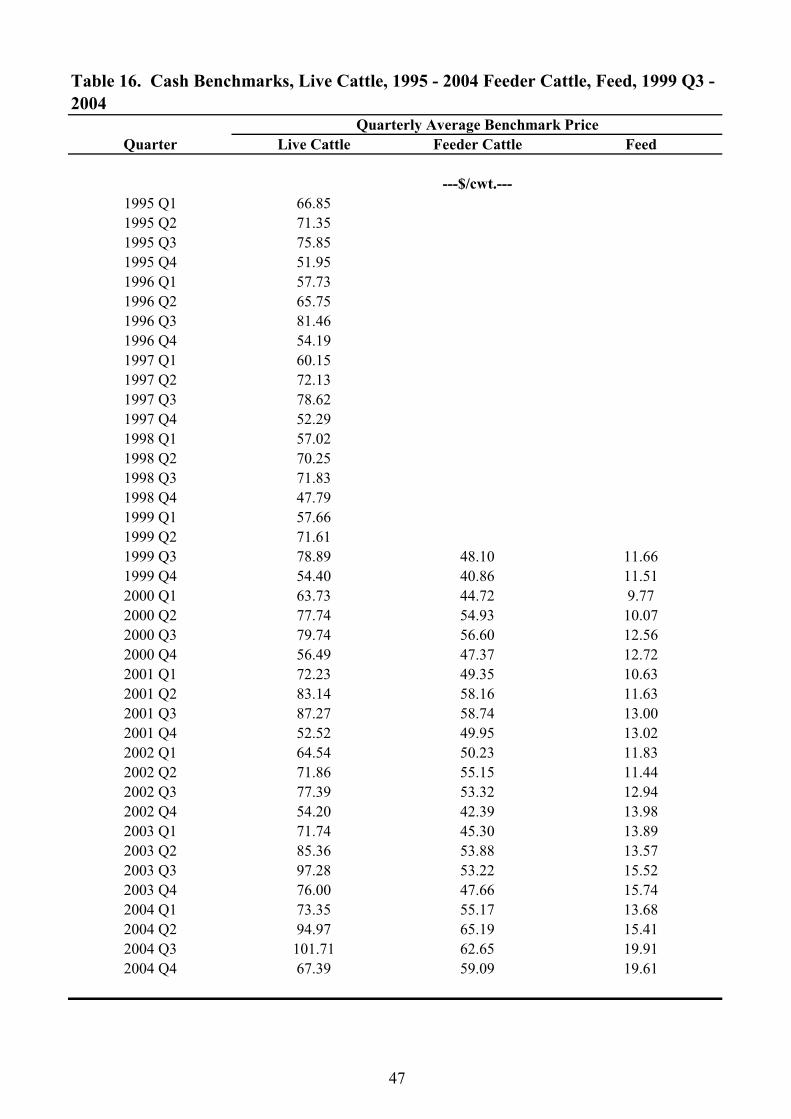
47
Quarter Live Cattle Feeder Cattle Feed
1995 Q1 66.851995 Q2 71.351995 Q3 75.851995 Q4 51.951996 Q1 57.731996 Q2 65.751996 Q3 81.461996 Q4 54.191997 Q1 60.151997 Q2 72.131997 Q3 78.621997 Q4 52.291998 Q1 57.021998 Q2 70.251998 Q3 71.831998 Q4 47.791999 Q1 57.661999 Q2 71.611999 Q3 78.89 48.10 11.661999 Q4 54.40 40.86 11.512000 Q1 63.73 44.72 9.772000 Q2 77.74 54.93 10.072000 Q3 79.74 56.60 12.562000 Q4 56.49 47.37 12.722001 Q1 72.23 49.35 10.632001 Q2 83.14 58.16 11.632001 Q3 87.27 58.74 13.002001 Q4 52.52 49.95 13.022002 Q1 64.54 50.23 11.832002 Q2 71.86 55.15 11.442002 Q3 77.39 53.32 12.942002 Q4 54.20 42.39 13.982003 Q1 71.74 45.30 13.892003 Q2 85.36 53.88 13.572003 Q3 97.28 53.22 15.522003 Q4 76.00 47.66 15.742004 Q1 73.35 55.17 13.682004 Q2 94.97 65.19 15.412004 Q3 101.71 62.65 19.912004 Q4 67.39 59.09 19.61
Table 16. Cash Benchmarks, Live Cattle, 1995 - 2004 Feeder Cattle, Feed, 1999 Q3 -2004
Quarterly Average Benchmark Price
---$/cwt.---
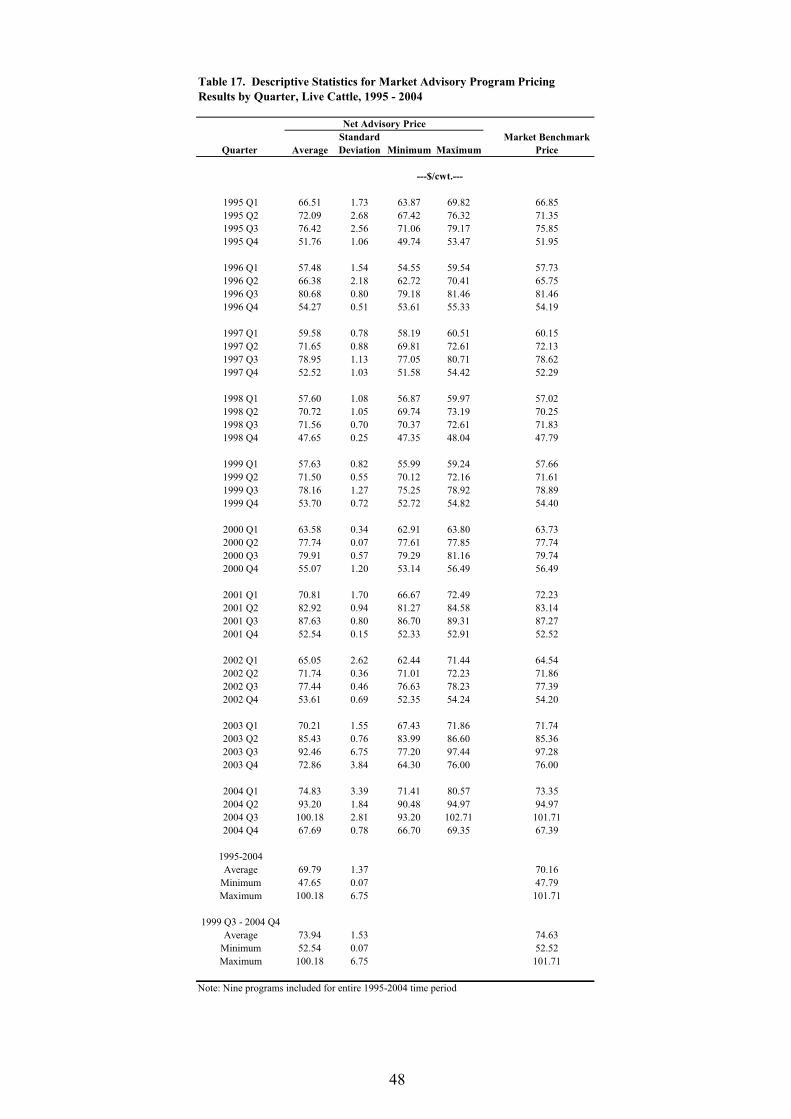
48
StandardQuarter Average Deviation Minimum Maximum
1995 Q1 66.51 1.73 63.87 69.82 ## 66.851995 Q2 72.09 2.68 67.42 76.32 ## 71.351995 Q3 76.42 2.56 71.06 79.17 ## 75.851995 Q4 51.76 1.06 49.74 53.47 ## 51.95
##1996 Q1 57.48 1.54 54.55 59.54 ## 57.731996 Q2 66.38 2.18 62.72 70.41 ## 65.751996 Q3 80.68 0.80 79.18 81.46 ## 81.461996 Q4 54.27 0.51 53.61 55.33 ## 54.19
##1997 Q1 59.58 0.78 58.19 60.51 ## 60.151997 Q2 71.65 0.88 69.81 72.61 ## 72.131997 Q3 78.95 1.13 77.05 80.71 ## 78.621997 Q4 52.52 1.03 51.58 54.42 ## 52.29
##1998 Q1 57.60 1.08 56.87 59.97 ## 57.021998 Q2 70.72 1.05 69.74 73.19 ## 70.251998 Q3 71.56 0.70 70.37 72.61 ## 71.831998 Q4 47.65 0.25 47.35 48.04 ## 47.79
##1999 Q1 57.63 0.82 55.99 59.24 ## 57.661999 Q2 71.50 0.55 70.12 72.16 ## 71.611999 Q3 78.16 1.27 75.25 78.92 ## 78.891999 Q4 53.70 0.72 52.72 54.82 ## 54.40
##2000 Q1 63.58 0.34 62.91 63.80 ## 63.732000 Q2 77.74 0.07 77.61 77.85 ## 77.742000 Q3 79.91 0.57 79.29 81.16 ## 79.742000 Q4 55.07 1.20 53.14 56.49 ## 56.49
##2001 Q1 70.81 1.70 66.67 72.49 ## 72.232001 Q2 82.92 0.94 81.27 84.58 ## 83.142001 Q3 87.63 0.80 86.70 89.31 ## 87.272001 Q4 52.54 0.15 52.33 52.91 ## 52.52
##2002 Q1 65.05 2.62 62.44 71.44 ## 64.542002 Q2 71.74 0.36 71.01 72.23 ## 71.862002 Q3 77.44 0.46 76.63 78.23 ## 77.392002 Q4 53.61 0.69 52.35 54.24 ## 54.20
##2003 Q1 70.21 1.55 67.43 71.86 ## 71.742003 Q2 85.43 0.76 83.99 86.60 ## 85.362003 Q3 92.46 6.75 77.20 97.44 ## 97.282003 Q4 72.86 3.84 64.30 76.00 ## 76.00
##2004 Q1 74.83 3.39 71.41 80.57 ## 73.352004 Q2 93.20 1.84 90.48 94.97 ## 94.972004 Q3 100.18 2.81 93.20 102.71 ## 101.712004 Q4 67.69 0.78 66.70 69.35 ## 67.39
1995-2004Average 69.79 1.37 70.16
Minimum 47.65 0.07 47.79Maximum 100.18 6.75 101.71
1999 Q3 - 2004 Q4Average 73.94 1.53 74.63
Minimum 52.54 0.07 52.52Maximum 100.18 6.75 101.71
Note: Nine programs included for entire 1995-2004 time period
Net Advisory PriceMarket Benchmark
Price
Table 17. Descriptive Statistics for Market Advisory Program Pricing Results by Quarter, Live Cattle, 1995 - 2004
---$/cwt.---
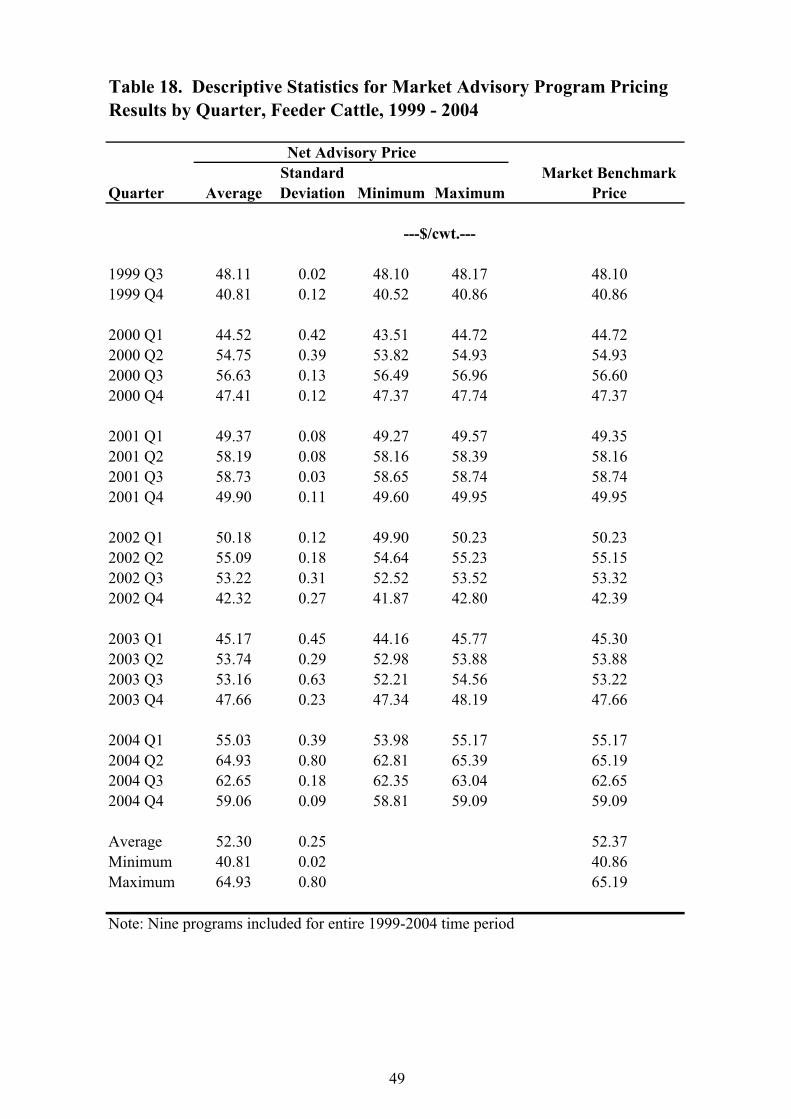
49
StandardQuarter Average Deviation Minimum Maximum
1999 Q3 48.11 0.02 48.10 48.17 48.101999 Q4 40.81 0.12 40.52 40.86 40.86
2000 Q1 44.52 0.42 43.51 44.72 44.722000 Q2 54.75 0.39 53.82 54.93 54.932000 Q3 56.63 0.13 56.49 56.96 56.602000 Q4 47.41 0.12 47.37 47.74 47.37
2001 Q1 49.37 0.08 49.27 49.57 49.352001 Q2 58.19 0.08 58.16 58.39 58.162001 Q3 58.73 0.03 58.65 58.74 58.742001 Q4 49.90 0.11 49.60 49.95 49.95
2002 Q1 50.18 0.12 49.90 50.23 50.232002 Q2 55.09 0.18 54.64 55.23 55.152002 Q3 53.22 0.31 52.52 53.52 53.322002 Q4 42.32 0.27 41.87 42.80 42.39
2003 Q1 45.17 0.45 44.16 45.77 45.302003 Q2 53.74 0.29 52.98 53.88 53.882003 Q3 53.16 0.63 52.21 54.56 53.222003 Q4 47.66 0.23 47.34 48.19 47.66
2004 Q1 55.03 0.39 53.98 55.17 55.172004 Q2 64.93 0.80 62.81 65.39 65.192004 Q3 62.65 0.18 62.35 63.04 62.652004 Q4 59.06 0.09 58.81 59.09 59.09
Average 52.30 0.25 52.37Minimum 40.81 0.02 40.86Maximum 64.93 0.80 65.19
Note: Nine programs included for entire 1999-2004 time period
Table 18. Descriptive Statistics for Market Advisory Program Pricing Results by Quarter, Feeder Cattle, 1999 - 2004
Net Advisory PriceMarket Benchmark
Price
---$/cwt.---
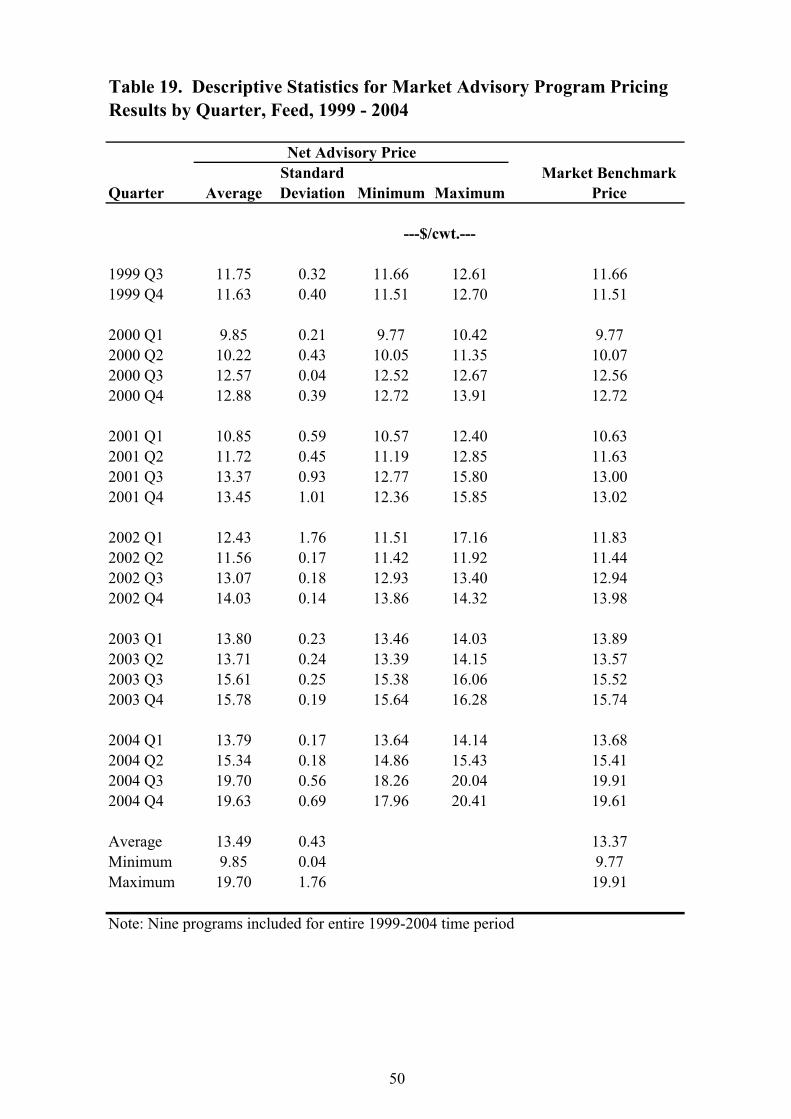
50
StandardQuarter Average Deviation Minimum Maximum
1999 Q3 11.75 0.32 11.66 12.61 11.661999 Q4 11.63 0.40 11.51 12.70 11.51
2000 Q1 9.85 0.21 9.77 10.42 9.772000 Q2 10.22 0.43 10.05 11.35 10.072000 Q3 12.57 0.04 12.52 12.67 12.562000 Q4 12.88 0.39 12.72 13.91 12.72
2001 Q1 10.85 0.59 10.57 12.40 10.632001 Q2 11.72 0.45 11.19 12.85 11.632001 Q3 13.37 0.93 12.77 15.80 13.002001 Q4 13.45 1.01 12.36 15.85 13.02
2002 Q1 12.43 1.76 11.51 17.16 11.832002 Q2 11.56 0.17 11.42 11.92 11.442002 Q3 13.07 0.18 12.93 13.40 12.942002 Q4 14.03 0.14 13.86 14.32 13.98
2003 Q1 13.80 0.23 13.46 14.03 13.892003 Q2 13.71 0.24 13.39 14.15 13.572003 Q3 15.61 0.25 15.38 16.06 15.522003 Q4 15.78 0.19 15.64 16.28 15.74
2004 Q1 13.79 0.17 13.64 14.14 13.682004 Q2 15.34 0.18 14.86 15.43 15.412004 Q3 19.70 0.56 18.26 20.04 19.912004 Q4 19.63 0.69 17.96 20.41 19.61
Average 13.49 0.43 13.37Minimum 9.85 0.04 9.77Maximum 19.70 1.76 19.91
Note: Nine programs included for entire 1999-2004 time period
Table 19. Descriptive Statistics for Market Advisory Program Pricing Results by Quarter, Feed, 1999 - 2004
Net Advisory PriceMarket Benchmark
Price
---$/cwt.---
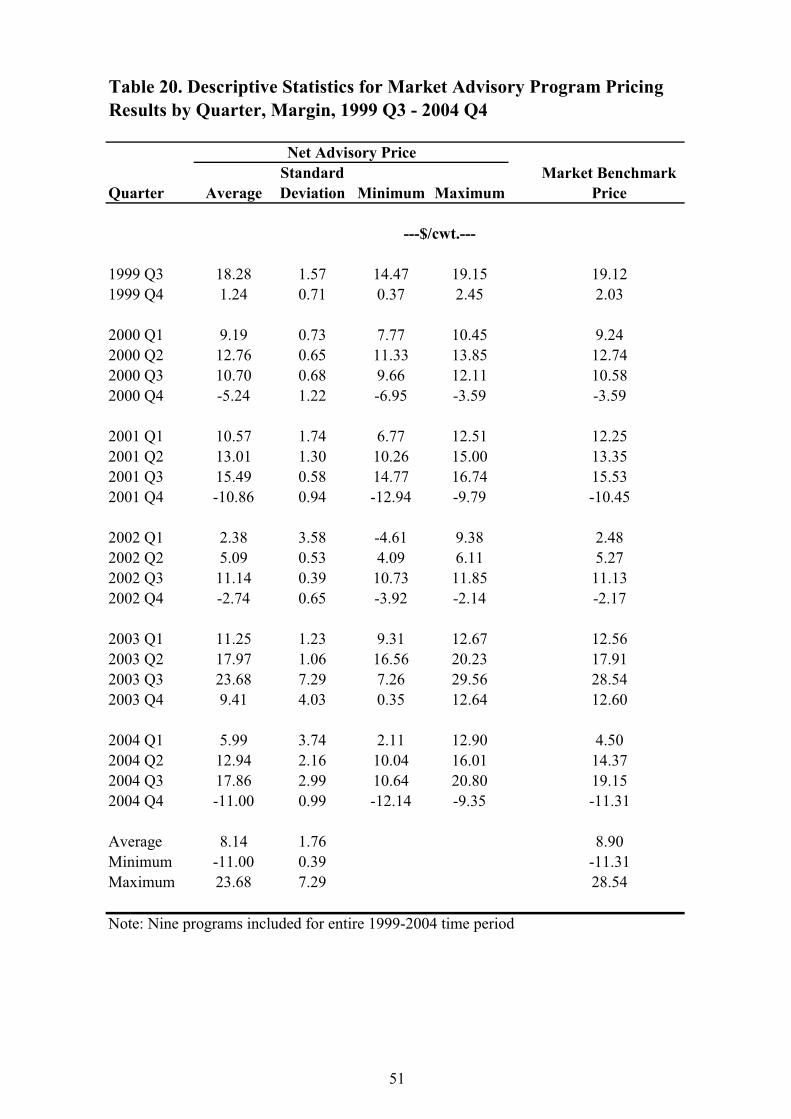
51
StandardQuarter Average Deviation Minimum Maximum
1999 Q3 18.28 1.57 14.47 19.15 19.121999 Q4 1.24 0.71 0.37 2.45 2.03
2000 Q1 9.19 0.73 7.77 10.45 9.242000 Q2 12.76 0.65 11.33 13.85 12.742000 Q3 10.70 0.68 9.66 12.11 10.582000 Q4 -5.24 1.22 -6.95 -3.59 -3.59
2001 Q1 10.57 1.74 6.77 12.51 12.252001 Q2 13.01 1.30 10.26 15.00 13.352001 Q3 15.49 0.58 14.77 16.74 15.532001 Q4 -10.86 0.94 -12.94 -9.79 -10.45
2002 Q1 2.38 3.58 -4.61 9.38 2.482002 Q2 5.09 0.53 4.09 6.11 5.272002 Q3 11.14 0.39 10.73 11.85 11.132002 Q4 -2.74 0.65 -3.92 -2.14 -2.17
2003 Q1 11.25 1.23 9.31 12.67 12.562003 Q2 17.97 1.06 16.56 20.23 17.912003 Q3 23.68 7.29 7.26 29.56 28.542003 Q4 9.41 4.03 0.35 12.64 12.60
2004 Q1 5.99 3.74 2.11 12.90 4.502004 Q2 12.94 2.16 10.04 16.01 14.372004 Q3 17.86 2.99 10.64 20.80 19.152004 Q4 -11.00 0.99 -12.14 -9.35 -11.31
Average 8.14 1.76 8.90Minimum -11.00 0.39 -11.31Maximum 23.68 7.29 28.54
Note: Nine programs included for entire 1999-2004 time period
Table 20. Descriptive Statistics for Market Advisory Program Pricing Results by Quarter, Margin, 1999 Q3 - 2004 Q4
Net Advisory PriceMarket Benchmark
Price
---$/cwt.---

52
StandardProgram Average Deviation Minimum Maximum
Ag Review 69.17 12.55 47.35 102.71 ##Ag Line 70.40 12.92 47.79 101.64 ##Ag Resource 70.58 13.02 47.87 101.71 ##AgriVisor 69.99 12.92 48.04 99.71 ##Brock 70.03 13.13 47.79 99.86 ##Pro Farmer 69.66 12.63 47.41 101.92 ##Stewart Peterson 69.44 12.62 47.47 97.28 ##Top Farmer 68.98 12.66 47.79 100.64 ##Utterback 69.88 13.34 47.37 100.26 ##
##Average 69.79 12.86Minimum 68.98 12.55Maximum 70.58 13.34
Market Benchmark 70.16 13.12 47.79 101.71
Note: Each program was included for forty quarters during 1995-2004
Table 21. Descriptive Statistics for Market Advisory Program Pricing Results by Program, Live Cattle, 1995 - 2004
Net Advisory Price
---$ per cwt.---
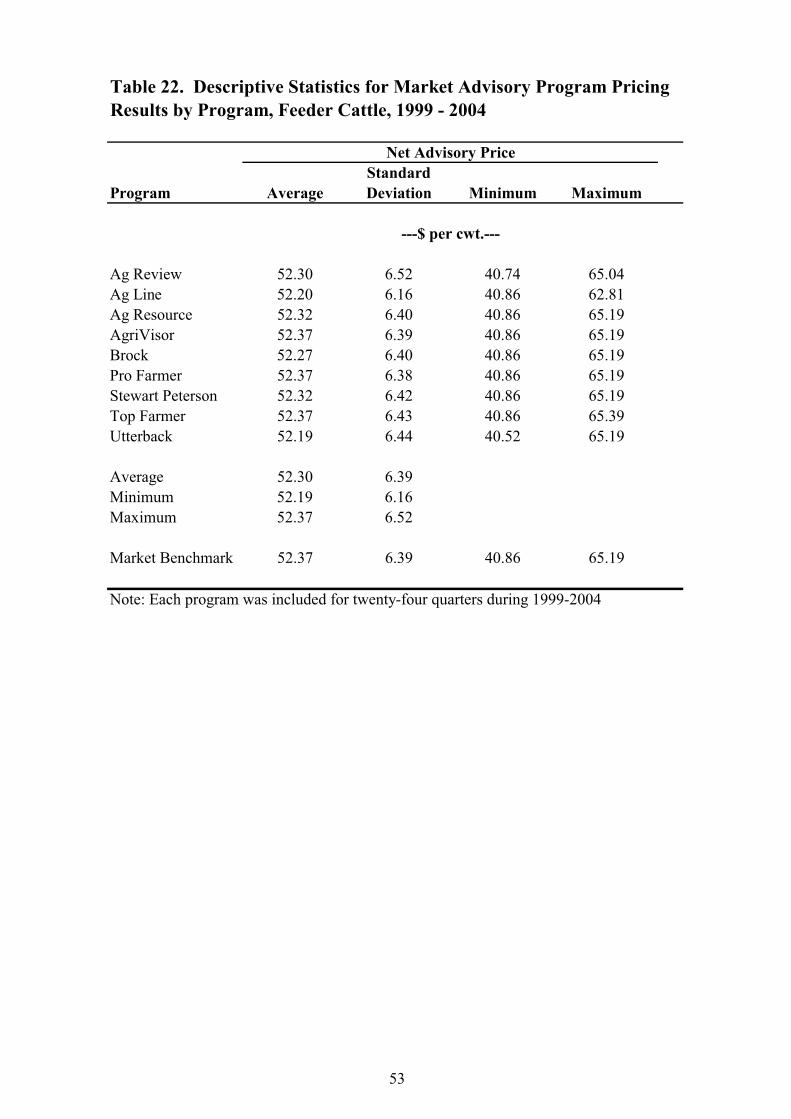
53
StandardProgram Average Deviation Minimum Maximum
Ag Review 52.30 6.52 40.74 65.04 ##Ag Line 52.20 6.16 40.86 62.81 ##Ag Resource 52.32 6.40 40.86 65.19 ##AgriVisor 52.37 6.39 40.86 65.19 ##Brock 52.27 6.40 40.86 65.19 ##Pro Farmer 52.37 6.38 40.86 65.19 ##Stewart Peterson 52.32 6.42 40.86 65.19 ##Top Farmer 52.37 6.43 40.86 65.39 ##Utterback 52.19 6.44 40.52 65.19 ##
##Average 52.30 6.39Minimum 52.19 6.16Maximum 52.37 6.52
Market Benchmark 52.37 6.39 40.86 65.19
Note: Each program was included for twenty-four quarters during 1999-2004
Table 22. Descriptive Statistics for Market Advisory Program Pricing Results by Program, Feeder Cattle, 1999 - 2004
Net Advisory Price
---$ per cwt.---
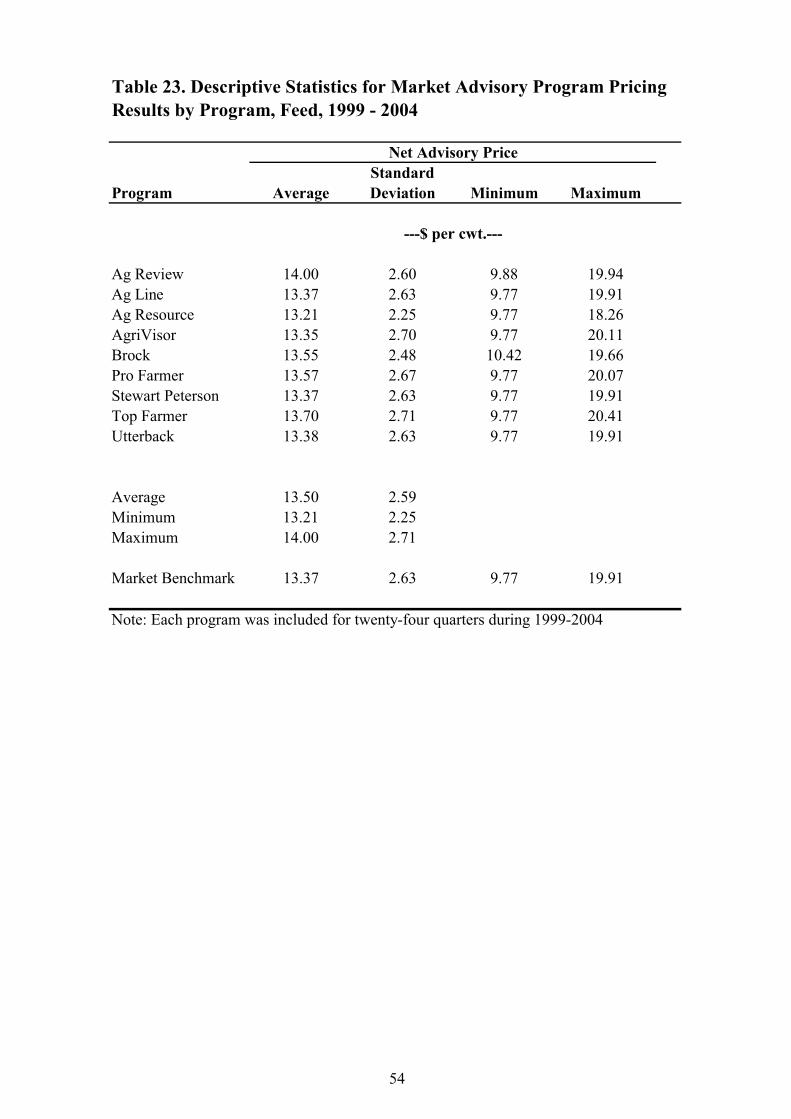
54
StandardProgram Average Deviation Minimum Maximum
Ag Review 14.00 2.60 9.88 19.94 ##Ag Line 13.37 2.63 9.77 19.91 ##Ag Resource 13.21 2.25 9.77 18.26 ##AgriVisor 13.35 2.70 9.77 20.11 ##Brock 13.55 2.48 10.42 19.66 ##Pro Farmer 13.57 2.67 9.77 20.07 ##Stewart Peterson 13.37 2.63 9.77 19.91 ##Top Farmer 13.70 2.71 9.77 20.41 ##Utterback 13.38 2.63 9.77 19.91 ##
##
Average 13.50 2.59Minimum 13.21 2.25Maximum 14.00 2.71
Market Benchmark 13.37 2.63 9.77 19.91
Note: Each program was included for twenty-four quarters during 1999-2004
Table 23. Descriptive Statistics for Market Advisory Program Pricing Results by Program, Feed, 1999 - 2004
Net Advisory Price
---$ per cwt.---
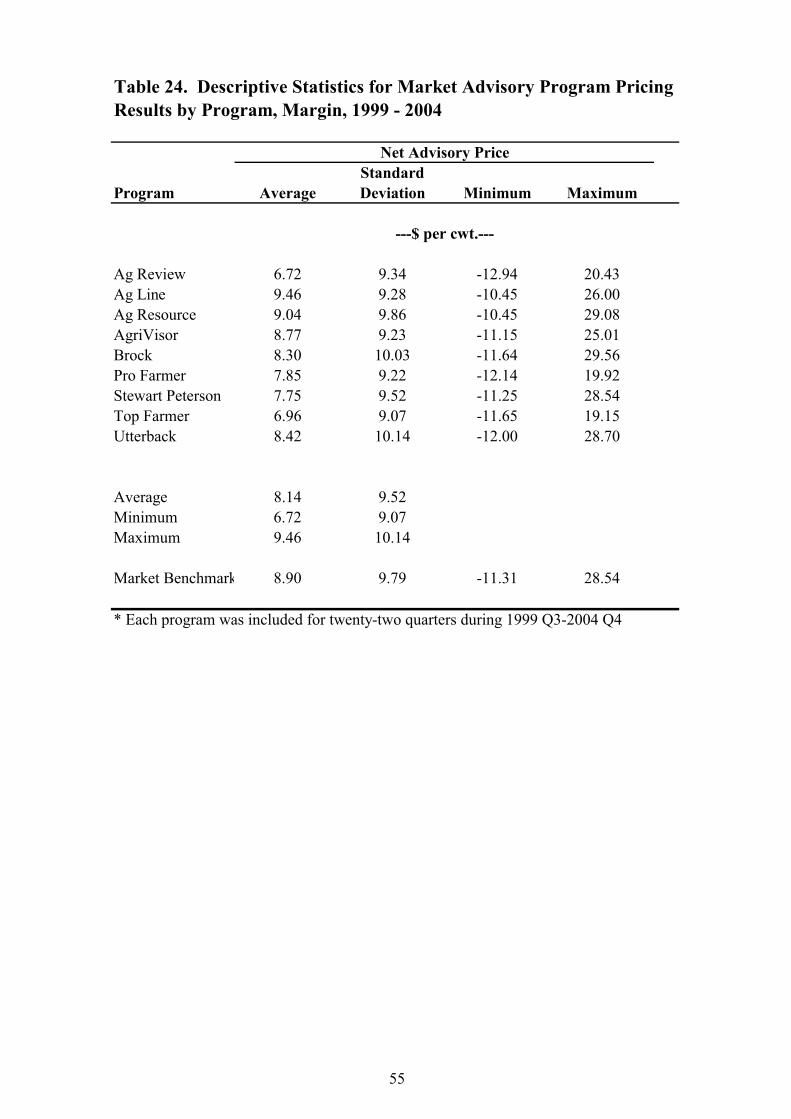
55
StandardProgram Average Deviation Minimum Maximum
Ag Review 6.72 9.34 -12.94 20.43 ##Ag Line 9.46 9.28 -10.45 26.00 ##Ag Resource 9.04 9.86 -10.45 29.08 ##AgriVisor 8.77 9.23 -11.15 25.01 ##Brock 8.30 10.03 -11.64 29.56 ##Pro Farmer 7.85 9.22 -12.14 19.92 ##Stewart Peterson 7.75 9.52 -11.25 28.54 ##Top Farmer 6.96 9.07 -11.65 19.15 ##Utterback 8.42 10.14 -12.00 28.70 ##
##
Average 8.14 9.52Minimum 6.72 9.07Maximum 9.46 10.14
Market Benchmark 8.90 9.79 -11.31 28.54
* Each program was included for twenty-two quarters during 1999 Q3-2004 Q4
Table 24. Descriptive Statistics for Market Advisory Program Pricing Results by Program, Margin, 1999 - 2004
Net Advisory Price
---$ per cwt.---
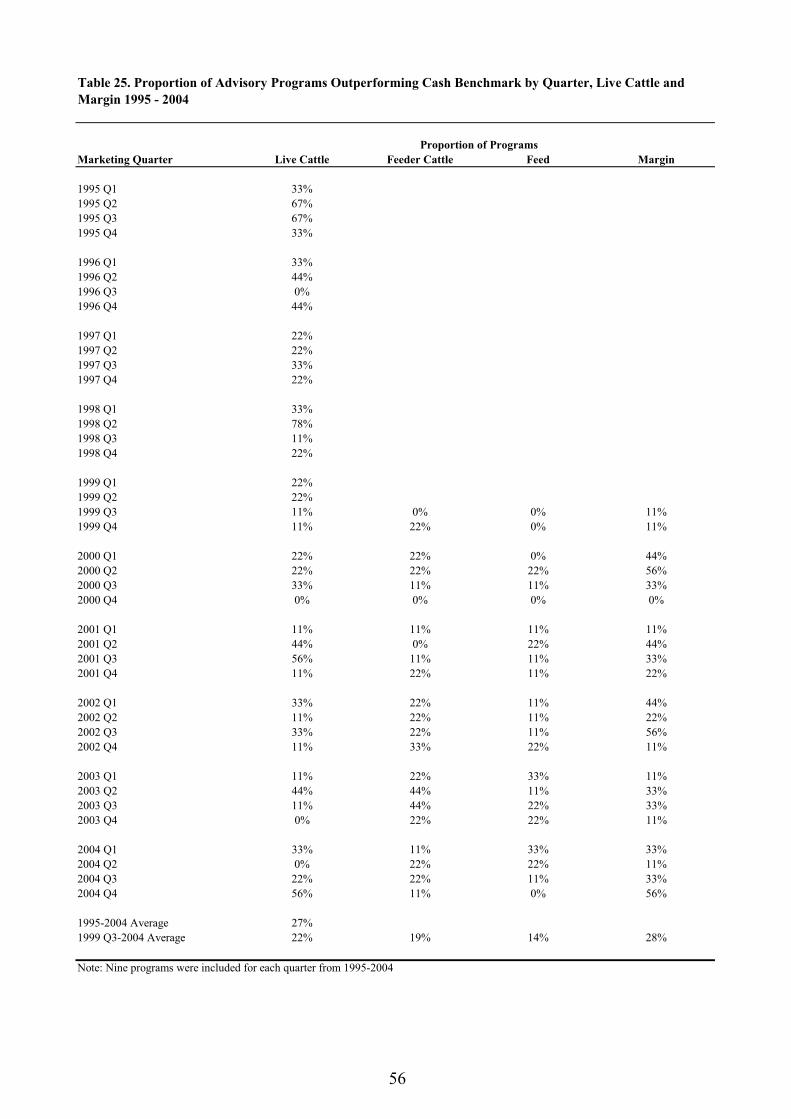
56
Marketing Quarter Live Cattle Feeder Cattle Feed Margin
1995 Q1 33%1995 Q2 67%1995 Q3 67%1995 Q4 33%
1996 Q1 33%1996 Q2 44%1996 Q3 0%1996 Q4 44%
1997 Q1 22%1997 Q2 22%1997 Q3 33%1997 Q4 22%
1998 Q1 33%1998 Q2 78%1998 Q3 11%1998 Q4 22%
1999 Q1 22%1999 Q2 22%1999 Q3 11% 0% 0% 11%1999 Q4 11% 22% 0% 11%
2000 Q1 22% 22% 0% 44%2000 Q2 22% 22% 22% 56%2000 Q3 33% 11% 11% 33%2000 Q4 0% 0% 0% 0%
2001 Q1 11% 11% 11% 11%2001 Q2 44% 0% 22% 44%2001 Q3 56% 11% 11% 33%2001 Q4 11% 22% 11% 22%
2002 Q1 33% 22% 11% 44%2002 Q2 11% 22% 11% 22%2002 Q3 33% 22% 11% 56%2002 Q4 11% 33% 22% 11%
2003 Q1 11% 22% 33% 11%2003 Q2 44% 44% 11% 33%2003 Q3 11% 44% 22% 33%2003 Q4 0% 22% 22% 11%
2004 Q1 33% 11% 33% 33%2004 Q2 0% 22% 22% 11%2004 Q3 22% 22% 11% 33%2004 Q4 56% 11% 0% 56%
1995-2004 Average 27%1999 Q3-2004 Average 22% 19% 14% 28%
Note: Nine programs were included for each quarter from 1995-2004
Table 25. Proportion of Advisory Programs Outperforming Cash Benchmark by Quarter, Live Cattle and Margin 1995 - 2004
Proportion of Programs
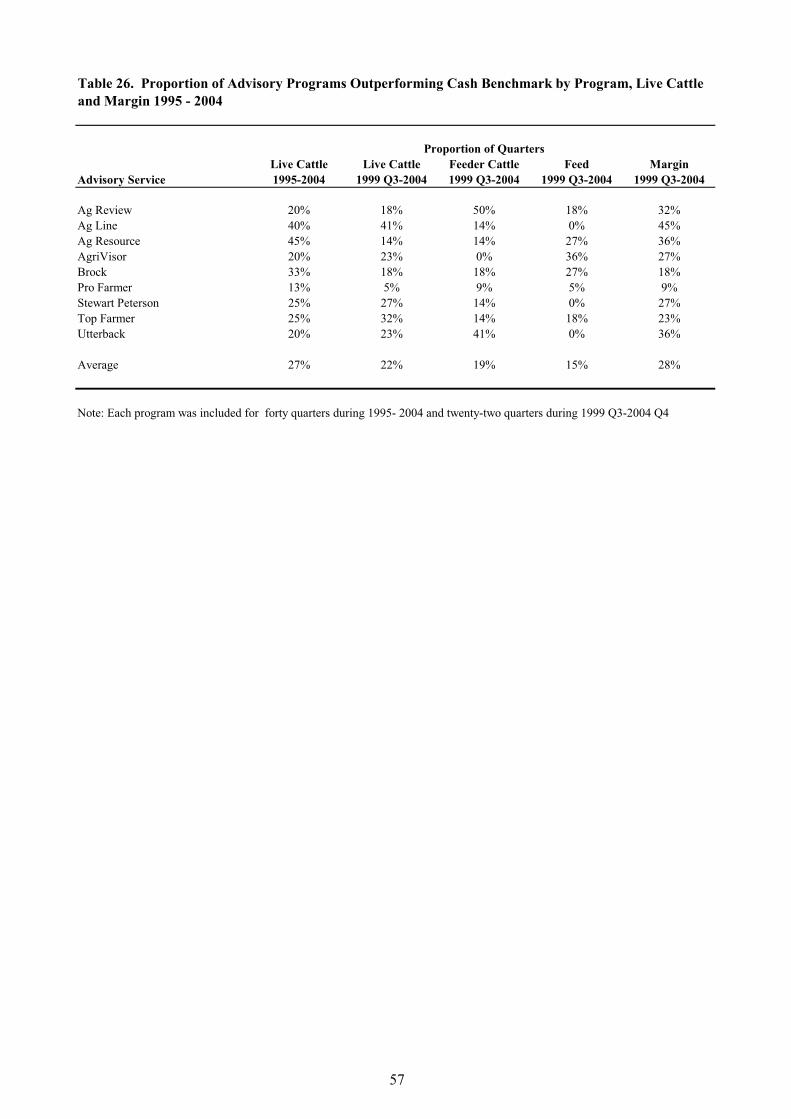
57
Live Cattle Live Cattle Feeder Cattle Feed MarginAdvisory Service 1995-2004 1999 Q3-2004 1999 Q3-2004 1999 Q3-2004 1999 Q3-2004
Ag Review 20% 18% 50% 18% 32%Ag Line 40% 41% 14% 0% 45%Ag Resource 45% 14% 14% 27% 36%AgriVisor 20% 23% 0% 36% 27%Brock 33% 18% 18% 27% 18%Pro Farmer 13% 5% 9% 5% 9%Stewart Peterson 25% 27% 14% 0% 27%Top Farmer 25% 32% 14% 18% 23%Utterback 20% 23% 41% 0% 36%
Average 27% 22% 19% 15% 28%
Table 26. Proportion of Advisory Programs Outperforming Cash Benchmark by Program, Live Cattle and Margin 1995 - 2004
Note: Each program was included for forty quarters during 1995- 2004 and twenty-two quarters during 1999 Q3-2004 Q4
Proportion of Quarters
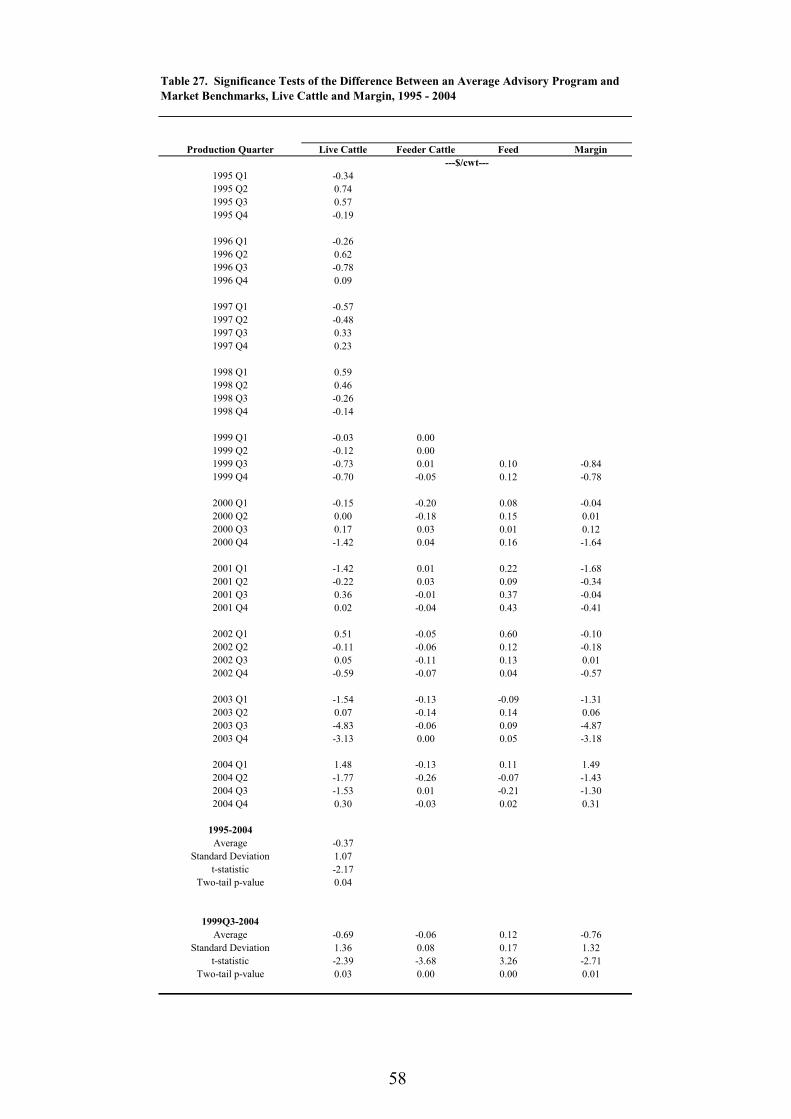
58
Production Quarter Live Cattle Feeder Cattle Feed Margin
1995 Q1 -0.341995 Q2 0.741995 Q3 0.571995 Q4 -0.19
1996 Q1 -0.261996 Q2 0.621996 Q3 -0.781996 Q4 0.09
1997 Q1 -0.571997 Q2 -0.481997 Q3 0.331997 Q4 0.23
1998 Q1 0.591998 Q2 0.461998 Q3 -0.261998 Q4 -0.14
1999 Q1 -0.03 0.001999 Q2 -0.12 0.001999 Q3 -0.73 0.01 0.10 -0.841999 Q4 -0.70 -0.05 0.12 -0.78
2000 Q1 -0.15 -0.20 0.08 -0.042000 Q2 0.00 -0.18 0.15 0.012000 Q3 0.17 0.03 0.01 0.122000 Q4 -1.42 0.04 0.16 -1.64
2001 Q1 -1.42 0.01 0.22 -1.682001 Q2 -0.22 0.03 0.09 -0.342001 Q3 0.36 -0.01 0.37 -0.042001 Q4 0.02 -0.04 0.43 -0.41
2002 Q1 0.51 -0.05 0.60 -0.102002 Q2 -0.11 -0.06 0.12 -0.182002 Q3 0.05 -0.11 0.13 0.012002 Q4 -0.59 -0.07 0.04 -0.57
2003 Q1 -1.54 -0.13 -0.09 -1.312003 Q2 0.07 -0.14 0.14 0.062003 Q3 -4.83 -0.06 0.09 -4.872003 Q4 -3.13 0.00 0.05 -3.18
2004 Q1 1.48 -0.13 0.11 1.492004 Q2 -1.77 -0.26 -0.07 -1.432004 Q3 -1.53 0.01 -0.21 -1.302004 Q4 0.30 -0.03 0.02 0.31
1995-2004Average -0.37
Standard Deviation 1.07t-statistic -2.17
Two-tail p-value 0.04
1999Q3-2004Average -0.69 -0.06 0.12 -0.76
Standard Deviation 1.36 0.08 0.17 1.32t-statistic -2.39 -3.68 3.26 -2.71
Two-tail p-value 0.03 0.00 0.00 0.0140.00 24.00
---$/cwt---
Table 27. Significance Tests of the Difference Between an Average Advisory Program and Market Benchmarks, Live Cattle and Margin, 1995 - 2004
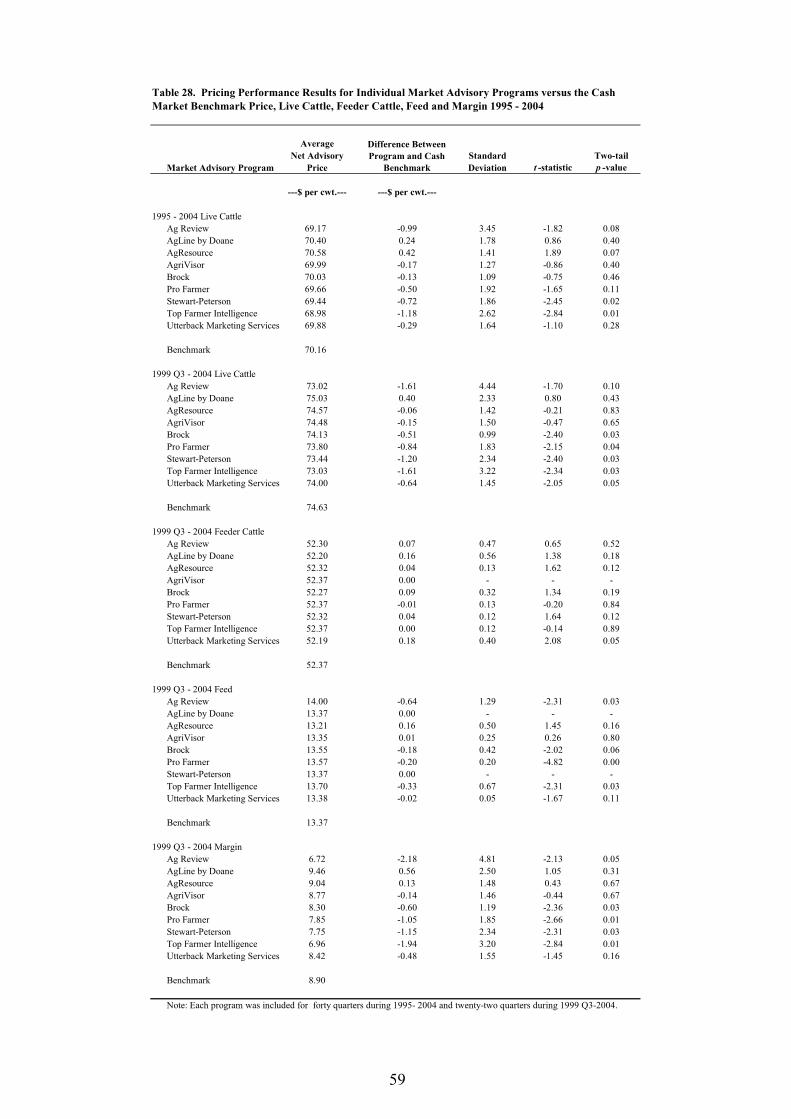
59
AverageNet Advisory Standard Two-tail
Market Advisory Program Price Deviation t -statistic p -value
---$ per cwt.--- ---$ per cwt.---
1995 - 2004 Live Cattle 40Ag Review 69.17 -0.99 3.45 -1.82 0.08AgLine by Doane 70.40 0.24 1.78 0.86 0.40AgResource 70.58 0.42 1.41 1.89 0.07AgriVisor 69.99 -0.17 1.27 -0.86 0.40Brock 70.03 -0.13 1.09 -0.75 0.46Pro Farmer 69.66 -0.50 1.92 -1.65 0.11Stewart-Peterson 69.44 -0.72 1.86 -2.45 0.02Top Farmer Intelligence 68.98 -1.18 2.62 -2.84 0.01Utterback Marketing Services 69.88 -0.29 1.64 -1.10 0.28
Benchmark 70.16
1999 Q3 - 2004 Live Cattle 22Ag Review 73.02 -1.61 4.44 -1.70 0.10AgLine by Doane 75.03 0.40 2.33 0.80 0.43AgResource 74.57 -0.06 1.42 -0.21 0.83AgriVisor 74.48 -0.15 1.50 -0.47 0.65Brock 74.13 -0.51 0.99 -2.40 0.03Pro Farmer 73.80 -0.84 1.83 -2.15 0.04Stewart-Peterson 73.44 -1.20 2.34 -2.40 0.03Top Farmer Intelligence 73.03 -1.61 3.22 -2.34 0.03Utterback Marketing Services 74.00 -0.64 1.45 -2.05 0.05
Benchmark 74.63
1999 Q3 - 2004 Feeder CattleAg Review 52.30 0.07 0.47 0.65 0.52AgLine by Doane 52.20 0.16 0.56 1.38 0.18AgResource 52.32 0.04 0.13 1.62 0.12AgriVisor 52.37 0.00 - - -Brock 52.27 0.09 0.32 1.34 0.19Pro Farmer 52.37 -0.01 0.13 -0.20 0.84Stewart-Peterson 52.32 0.04 0.12 1.64 0.12Top Farmer Intelligence 52.37 0.00 0.12 -0.14 0.89Utterback Marketing Services 52.19 0.18 0.40 2.08 0.05
Benchmark 52.37
1999 Q3 - 2004 FeedAg Review 14.00 -0.64 1.29 -2.31 0.03AgLine by Doane 13.37 0.00 - - -AgResource 13.21 0.16 0.50 1.45 0.16AgriVisor 13.35 0.01 0.25 0.26 0.80Brock 13.55 -0.18 0.42 -2.02 0.06Pro Farmer 13.57 -0.20 0.20 -4.82 0.00Stewart-Peterson 13.37 0.00 - - -Top Farmer Intelligence 13.70 -0.33 0.67 -2.31 0.03Utterback Marketing Services 13.38 -0.02 0.05 -1.67 0.11
Benchmark 13.37
1999 Q3 - 2004 Margin 22Ag Review 6.72 -2.18 4.81 -2.13 0.05AgLine by Doane 9.46 0.56 2.50 1.05 0.31AgResource 9.04 0.13 1.48 0.43 0.67AgriVisor 8.77 -0.14 1.46 -0.44 0.67Brock 8.30 -0.60 1.19 -2.36 0.03Pro Farmer 7.85 -1.05 1.85 -2.66 0.01Stewart-Peterson 7.75 -1.15 2.34 -2.31 0.03Top Farmer Intelligence 6.96 -1.94 3.20 -2.84 0.01Utterback Marketing Services 8.42 -0.48 1.55 -1.45 0.16
Benchmark 8.90
Table 28. Pricing Performance Results for Individual Market Advisory Programs versus the Cash Market Benchmark Price, Live Cattle, Feeder Cattle, Feed and Margin 1995 - 2004
Difference Between Program and Cash
Benchmark
Note: Each program was included for forty quarters during 1995- 2004 and twenty-two quarters during 1999 Q3-2004.
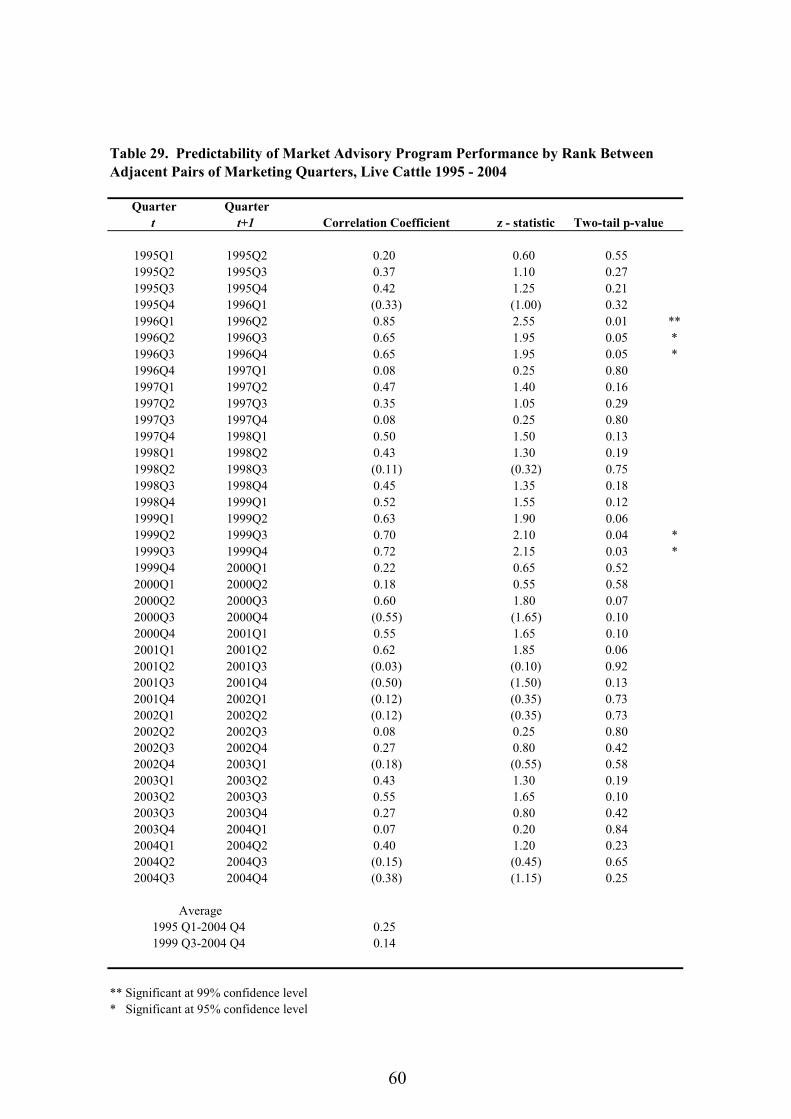
60
Quarter Quartert t+1 Correlation Coefficient z - statistic Two-tail p-value
1995Q1 1995Q2 0.20 0.60 0.551995Q2 1995Q3 0.37 1.10 0.271995Q3 1995Q4 0.42 1.25 0.211995Q4 1996Q1 (0.33) (1.00) 0.321996Q1 1996Q2 0.85 2.55 0.01 **1996Q2 1996Q3 0.65 1.95 0.05 *1996Q3 1996Q4 0.65 1.95 0.05 *1996Q4 1997Q1 0.08 0.25 0.801997Q1 1997Q2 0.47 1.40 0.161997Q2 1997Q3 0.35 1.05 0.291997Q3 1997Q4 0.08 0.25 0.801997Q4 1998Q1 0.50 1.50 0.131998Q1 1998Q2 0.43 1.30 0.191998Q2 1998Q3 (0.11) (0.32) 0.751998Q3 1998Q4 0.45 1.35 0.181998Q4 1999Q1 0.52 1.55 0.121999Q1 1999Q2 0.63 1.90 0.061999Q2 1999Q3 0.70 2.10 0.04 *1999Q3 1999Q4 0.72 2.15 0.03 *1999Q4 2000Q1 0.22 0.65 0.522000Q1 2000Q2 0.18 0.55 0.582000Q2 2000Q3 0.60 1.80 0.072000Q3 2000Q4 (0.55) (1.65) 0.102000Q4 2001Q1 0.55 1.65 0.102001Q1 2001Q2 0.62 1.85 0.062001Q2 2001Q3 (0.03) (0.10) 0.922001Q3 2001Q4 (0.50) (1.50) 0.132001Q4 2002Q1 (0.12) (0.35) 0.732002Q1 2002Q2 (0.12) (0.35) 0.732002Q2 2002Q3 0.08 0.25 0.802002Q3 2002Q4 0.27 0.80 0.422002Q4 2003Q1 (0.18) (0.55) 0.582003Q1 2003Q2 0.43 1.30 0.192003Q2 2003Q3 0.55 1.65 0.102003Q3 2003Q4 0.27 0.80 0.422003Q4 2004Q1 0.07 0.20 0.842004Q1 2004Q2 0.40 1.20 0.232004Q2 2004Q3 (0.15) (0.45) 0.652004Q3 2004Q4 (0.38) (1.15) 0.25
0.250.14
** Significant at 99% confidence level* Significant at 95% confidence level
Table 29. Predictability of Market Advisory Program Performance by Rank Between Adjacent Pairs of Marketing Quarters, Live Cattle 1995 - 2004
1995 Q1-2004 Q4 Average
1999 Q3-2004 Q4
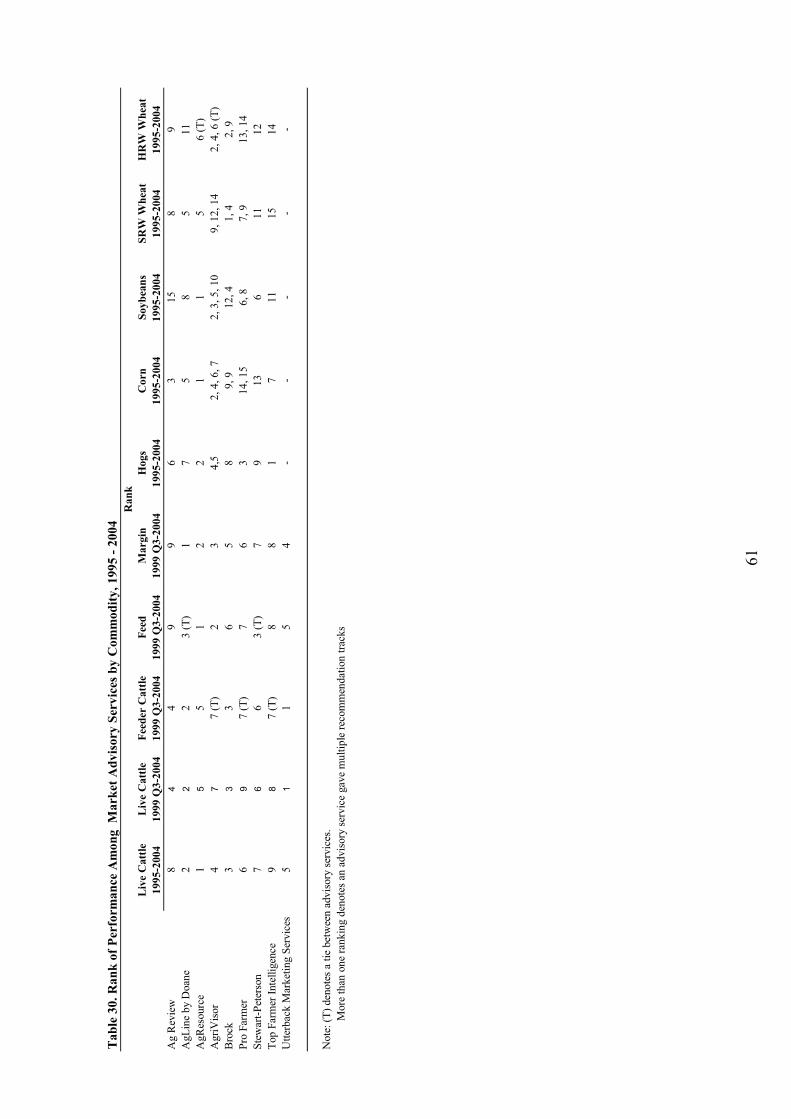
61
Liv
e C
attle
Liv
e C
attle
Feed
er C
attle
Feed
Mar
gin
Hog
sC
orn
Soyb
eans
SRW
Whe
atH
RW
Whe
at19
95-2
004
1999
Q3-
2004
1999
Q3-
2004
1999
Q3-
2004
1999
Q3-
2004
1995
-200
419
95-2
004
1995
-200
419
95-2
004
1995
-200
4A
g R
evie
w8
44
99
63
158
9A
gLin
e by
Doa
ne2
22
3 (T
)1
75
85
11A
gRes
ourc
e1
55
12
21
15
6 (T
)A
griV
isor
47
7 (T
)2
34,
52,
4, 6
, 72,
3, 5
, 10
9, 1
2, 1
42,
4, 6
(T)
Broc
k3
33
65
89,
912
, 41,
42,
9Pr
o Fa
rmer
69
7 (T
)7
63
14, 1
56,
87,
913
, 14
Stew
art-P
eter
son
76
63
(T)
79
136
1112
Top
Farm
er In
telli
genc
e9
87
(T)
88
17
1115
14U
tterb
ack
Mar
ketin
g Se
rvic
es5
11
54
--
--
-
Not
e: (T
) den
otes
a ti
e be
twee
n ad
viso
ry se
rvic
es.
M
ore
than
one
rank
ing
deno
tes a
n ad
viso
ry se
rvic
e ga
ve m
ultip
le re
com
men
datio
n tra
cks
Ran
kT
able
30.
Ran
k of
Per
form
ance
Am
ong
Mar
ket A
dvis
ory
Serv
ices
by
Com
mod
ity, 1
995
- 200
4
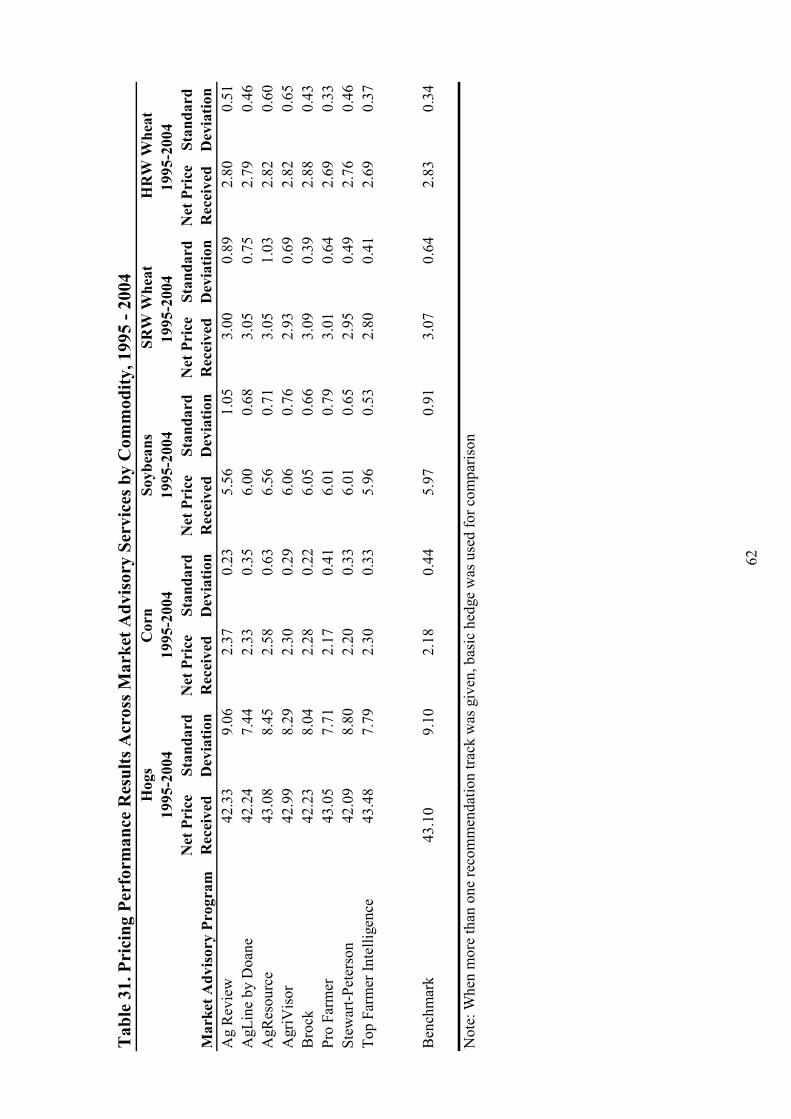
62
Mar
ket A
dvis
ory
Prog
ram
Net
Pri
ce
Rec
eive
dSt
anda
rd
Dev
iatio
nN
et P
rice
R
ecei
ved
Stan
dard
D
evia
tion
Net
Pri
ce
Rec
eive
dSt
anda
rd
Dev
iatio
nN
et P
rice
R
ecei
ved
Stan
dard
D
evia
tion
Net
Pri
ce
Rec
eive
dSt
anda
rd
Dev
iatio
nA
g R
evie
w42
.33
9.06
2.37
0.23
5.56
1.05
3.00
0.89
2.80
0.51
AgL
ine
by D
oane
42.2
47.
442.
330.
356.
000.
683.
050.
752.
790.
46A
gRes
ourc
e43
.08
8.45
2.58
0.63
6.56
0.71
3.05
1.03
2.82
0.60
Agr
iVis
or42
.99
8.29
2.30
0.29
6.06
0.76
2.93
0.69
2.82
0.65
Bro
ck42
.23
8.04
2.28
0.22
6.05
0.66
3.09
0.39
2.88
0.43
Pro
Farm
er43
.05
7.71
2.17
0.41
6.01
0.79
3.01
0.64
2.69
0.33
Stew
art-P
eter
son
42.0
98.
802.
200.
336.
010.
652.
950.
492.
760.
46To
p Fa
rmer
Inte
llige
nce
43.4
87.
792.
300.
335.
960.
532.
800.
412.
690.
37
Ben
chm
ark
43.1
09.
102.
180.
445.
970.
913.
070.
642.
830.
34
Not
e: W
hen
mor
e th
an o
ne re
com
men
datio
n tra
ck w
as g
iven
, bas
ic h
edge
was
use
d fo
r com
paris
on
Hog
s19
95-2
004
Cor
nSo
ybea
ns19
95-2
004
1995
-200
4
Tab
le 3
1. P
rici
ng P
erfo
rman
ce R
esul
ts A
cros
s Mar
ket A
dvis
ory
Serv
ices
by
Com
mod
ity, 1
995
- 200
4 S
RW
Whe
at19
95-2
004
HR
W W
heat
1995
-200
4
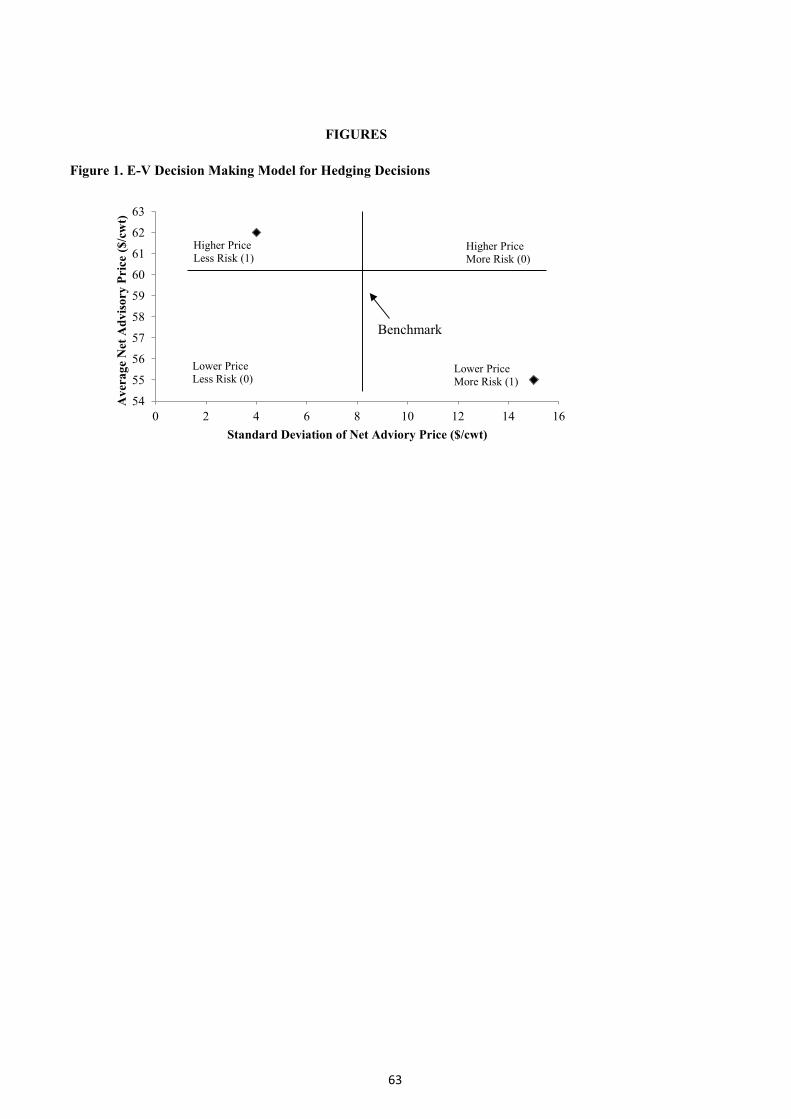
63
Figure 1. E-V Decision Making Model for Hedging Decisions
FIGURES
54
55
56
57
58
59
60
61
62
63
0 2 4 6 8 10 12 14 16
Ave
rage
Net
Adv
isor
y Pr
ice
($/c
wt)
Standard Deviation of Net Adviory Price ($/cwt)
Higher PriceLess Risk (1)
Lower PriceLess Risk (0)
Higher PriceMore Risk (0)
Lower PriceMore Risk (1)
Benchmark
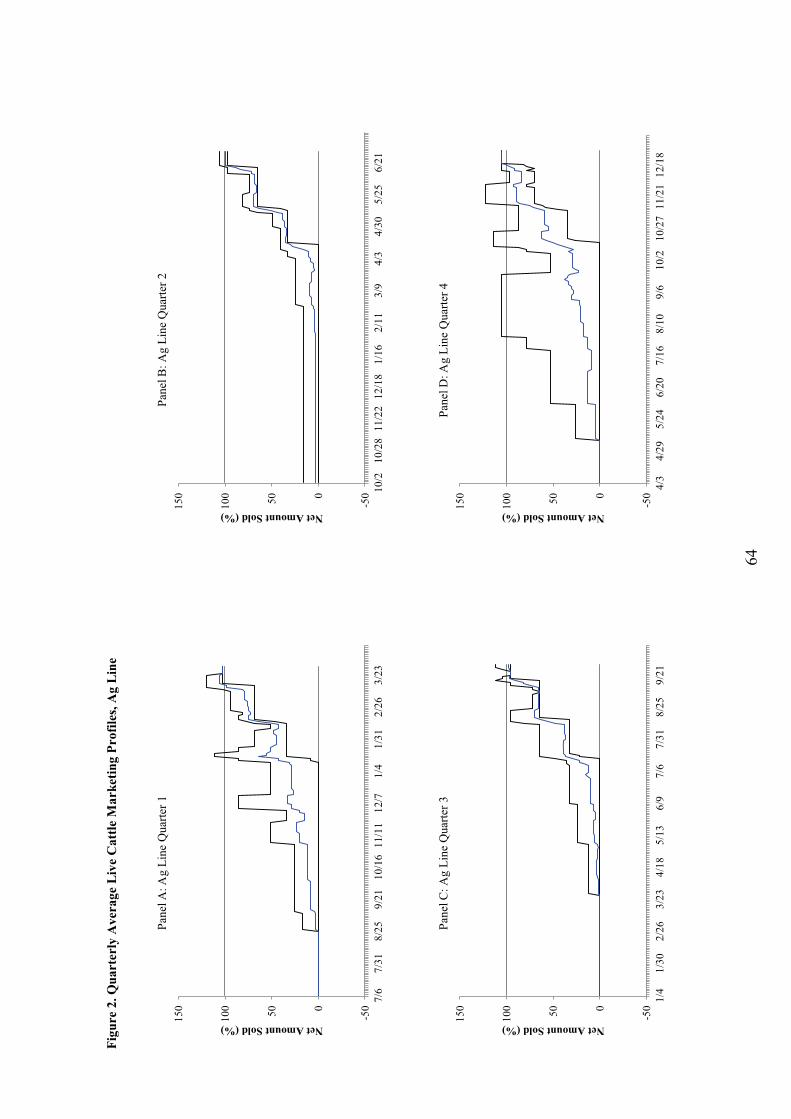
64
Figu
re 2
. Qua
rter
ly A
vera
ge L
ive
Cat
tle M
arke
ting
Prof
iles,
Ag
Line
Pane
l A: A
gLi
ne Q
uarte
r 1Pa
nel B
: Ag
Line
Qua
rter 2
Pane
l C: A
g Li
ne Q
uarte
r 3Pa
nel D
: Ag
Line
Qua
rter 4
-50050100
150
7/6
7/31
8/25
9/21
10/1
611
/11
12/7
1/4
1/31
2/26
3/23
Net Amount Sold (%)
-50050100
150 10
/210
/28
11/2
212
/18
1/16
2/11
3/9
4/3
4/30
5/25
6/21
Net Amount Sold (%)
-50050100
150
1/4
1/30
2/26
3/23
4/18
5/13
6/9
7/6
7/31
8/25
9/21
Net Amount Sold (%)
-50050100
150
4/3
4/29
5/24
6/20
7/16
8/10
9/6
10/2
10/2
711
/21
12/1
8
Net Amount Sold (%)
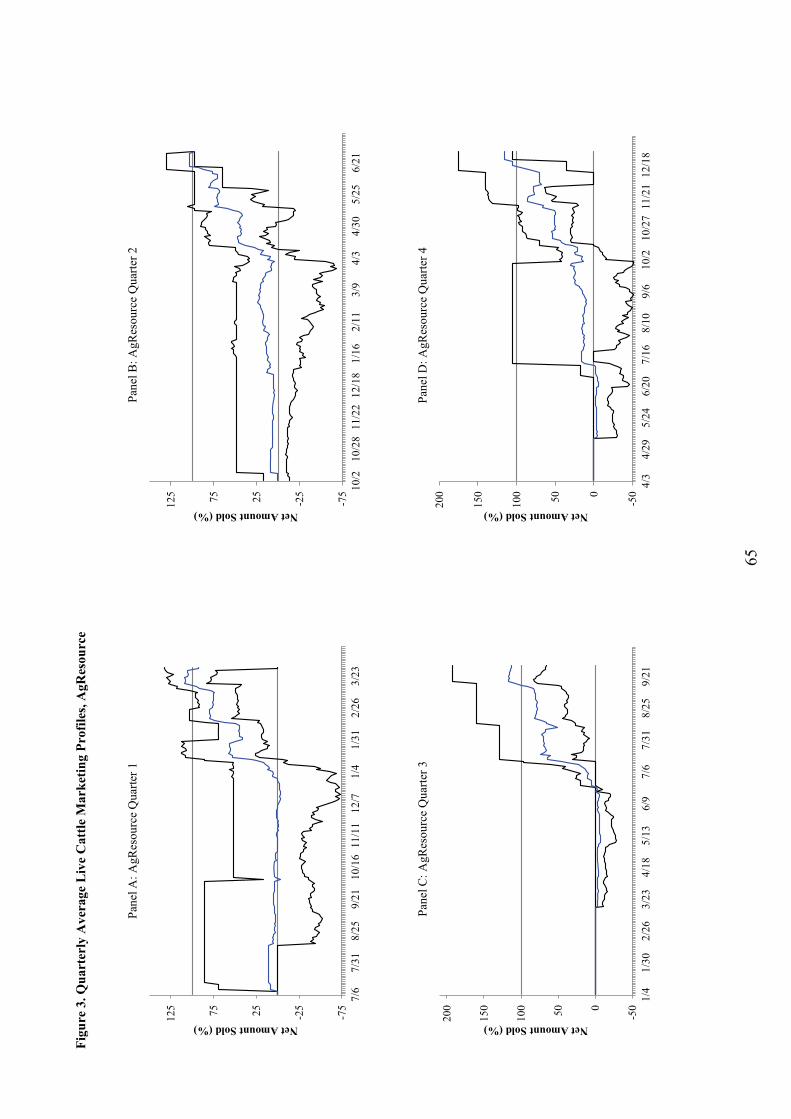
65
Figu
re 3
. Qua
rter
ly A
vera
ge L
ive
Cat
tle M
arke
ting
Prof
iles,
AgR
esou
rce
Pane
l A: A
gRes
ourc
e Q
uarte
r 1Pa
nel B
: AgR
esou
rce
Qua
rter 2
Pane
l C: A
gRes
ourc
e Q
uarte
r 3Pa
nel D
: AgR
esou
rce
Qua
rter 4
-75
-252575125
7/6
7/31
8/25
9/21
10/1
611
/11
12/7
1/4
1/31
2/26
3/23
Net Amount Sold (%)
-75
-252575125 10
/210
/28
11/2
212
/18
1/16
2/11
3/9
4/3
4/30
5/25
6/21
Net Amount Sold (%)
-50050100
150
200
1/4
1/30
2/26
3/23
4/18
5/13
6/9
7/6
7/31
8/25
9/21
Net Amount Sold (%)
-50050100
150
200
4/3
4/29
5/24
6/20
7/16
8/10
9/6
10/2
10/2
711
/21
12/1
8
Net Amount Sold (%)
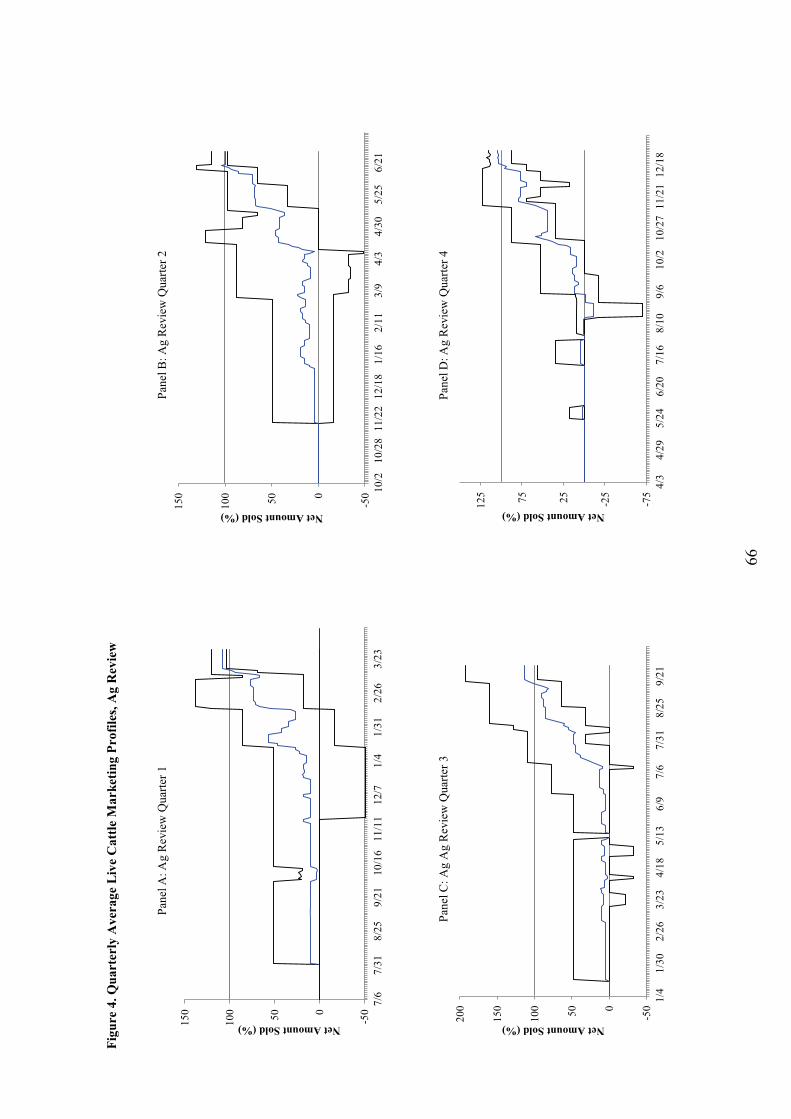
66
Figu
re 4
. Qua
rter
ly A
vera
ge L
ive
Cat
tle M
arke
ting
Prof
iles,
Ag
Rev
iew
Pane
l A: A
gR
evie
w Q
uarte
r 1Pa
nel B
: Ag
Rev
iew
Qua
rter 2
Pane
l C: A
g A
g R
evie
w Q
uarte
r 3Pa
nel D
: Ag
Rev
iew
Qua
rter 4
-50050100
150
7/6
7/31
8/25
9/21
10/1
611
/11
12/7
1/4
1/31
2/26
3/23
Net Amount Sold (%)
-50050100
150 10
/210
/28
11/2
212
/18
1/16
2/11
3/9
4/3
4/30
5/25
6/21
Net Amount Sold (%)
-50050100
150
200
1/4
1/30
2/26
3/23
4/18
5/13
6/9
7/6
7/31
8/25
9/21
Net Amount Sold (%)
-75
-252575125
4/3
4/29
5/24
6/20
7/16
8/10
9/6
10/2
10/2
711
/21
12/1
8
Net Amount Sold (%)
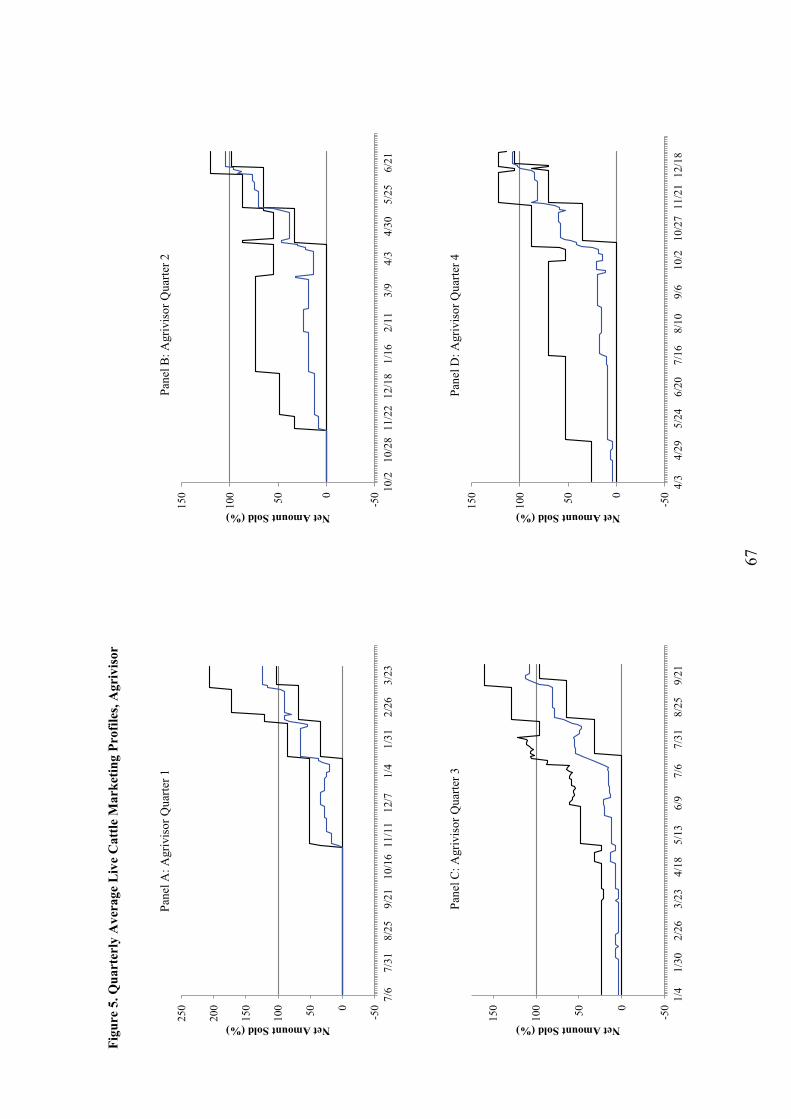
67
Figu
re 5
. Qua
rter
ly A
vera
ge L
ive
Cat
tle M
arke
ting
Prof
iles,
Agr
ivis
or
Pane
l A: A
griv
isor
Qua
rter 1
Pane
l B: A
griv
isor
Qua
rter 2
Pane
l C: A
griv
isor
Qua
rter 3
Pane
l D: A
griv
isor
Qua
rter 4
-50050100
150
200
250
7/6
7/31
8/25
9/21
10/1
611
/11
12/7
1/4
1/31
2/26
3/23
Net Amount Sold (%)
-50050100
150 10
/210
/28
11/2
212
/18
1/16
2/11
3/9
4/3
4/30
5/25
6/21
Net Amount Sold (%)
-50050100
150
1/4
1/30
2/26
3/23
4/18
5/13
6/9
7/6
7/31
8/25
9/21
Net Amount Sold (%)
-50050100
150
4/3
4/29
5/24
6/20
7/16
8/10
9/6
10/2
10/2
711
/21
12/1
8
Net Amount Sold (%)
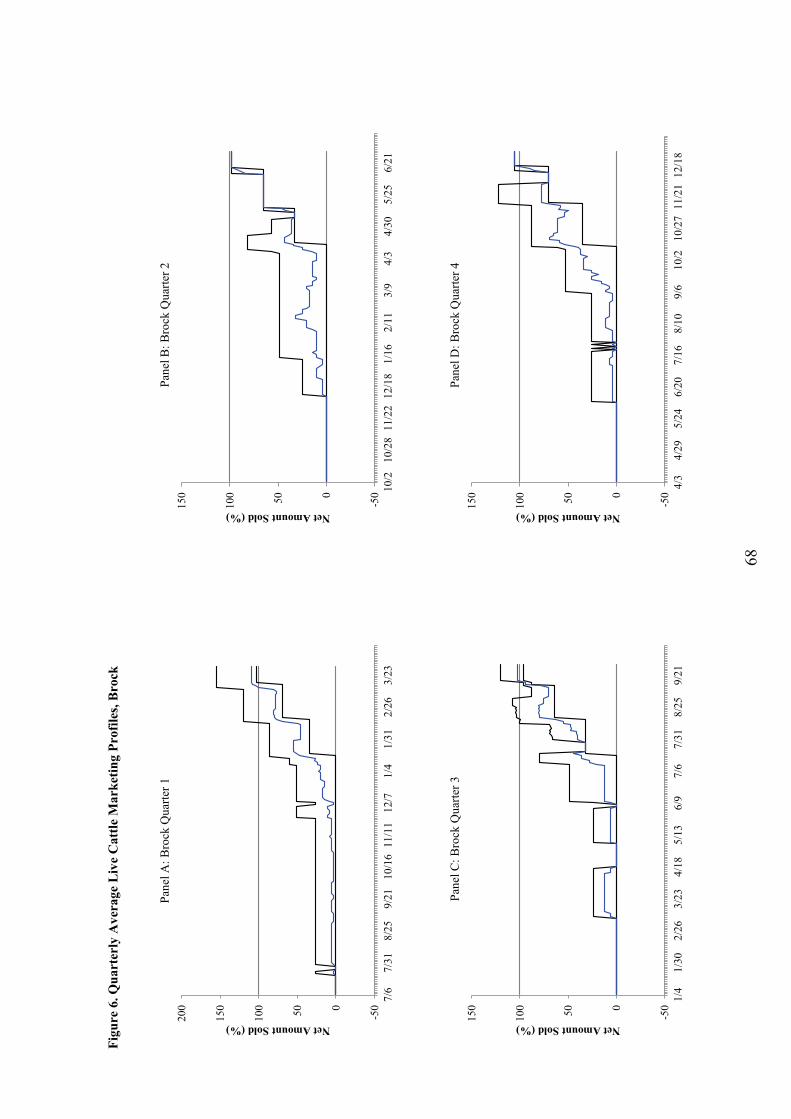
68
Figu
re 6
. Qua
rter
ly A
vera
ge L
ive
Cat
tle M
arke
ting
Prof
iles,
Bro
ck
Pane
l A: B
rock
Qua
rter 1
Pane
l B: B
rock
Qua
rter 2
Pane
l C: B
rock
Qua
rter 3
Pane
l D: B
rock
Qua
rter 4
-50050100
150
200
7/6
7/31
8/25
9/21
10/1
611
/11
12/7
1/4
1/31
2/26
3/23
Net Amount Sold (%)
-50050100
150 10
/210
/28
11/2
212
/18
1/16
2/11
3/9
4/3
4/30
5/25
6/21
Net Amount Sold (%)
-50050100
150
1/4
1/30
2/26
3/23
4/18
5/13
6/9
7/6
7/31
8/25
9/21
Net Amount Sold (%)
-50050100
150
4/3
4/29
5/24
6/20
7/16
8/10
9/6
10/2
10/2
711
/21
12/1
8
Net Amount Sold (%)
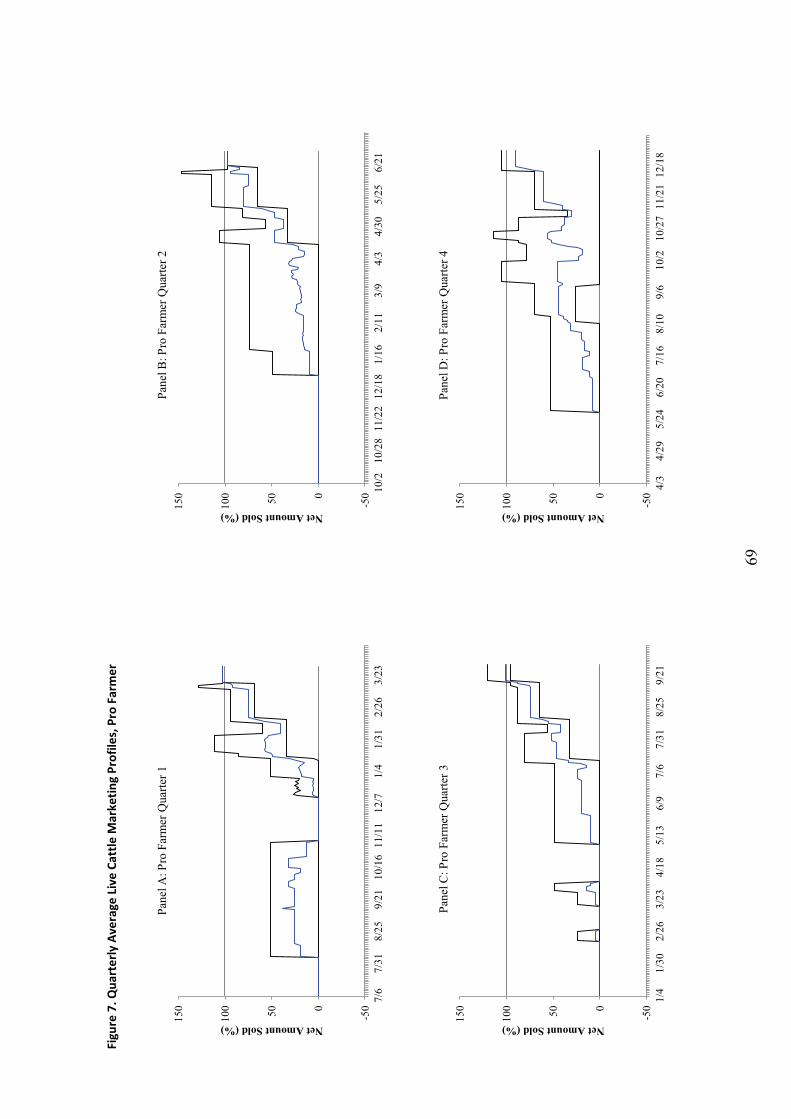
69
Figu
re 7
. Qua
rter
ly A
vera
ge L
ive
Catt
le M
arke
ting
Prof
iles,
Pro
Far
mer
Pane
l A: P
ro F
arm
er Q
uarte
r 1Pa
nel B
: Pro
Farm
erQ
uarte
r 2
Pane
l C: P
roFa
rmer
Qua
rter 3
Pane
l D: P
roFa
rmer
Qua
rter 4
-50050100
150
7/6
7/31
8/25
9/21
10/1
611
/11
12/7
1/4
1/31
2/26
3/23
Net Amount Sold (%)
-50050100
150 10
/210
/28
11/2
212
/18
1/16
2/11
3/9
4/3
4/30
5/25
6/21
Net Amount Sold (%)
-50050100
150
1/4
1/30
2/26
3/23
4/18
5/13
6/9
7/6
7/31
8/25
9/21
Net Amount Sold (%)
-50050100
150
4/3
4/29
5/24
6/20
7/16
8/10
9/6
10/2
10/2
711
/21
12/1
8
Net Amount Sold (%)
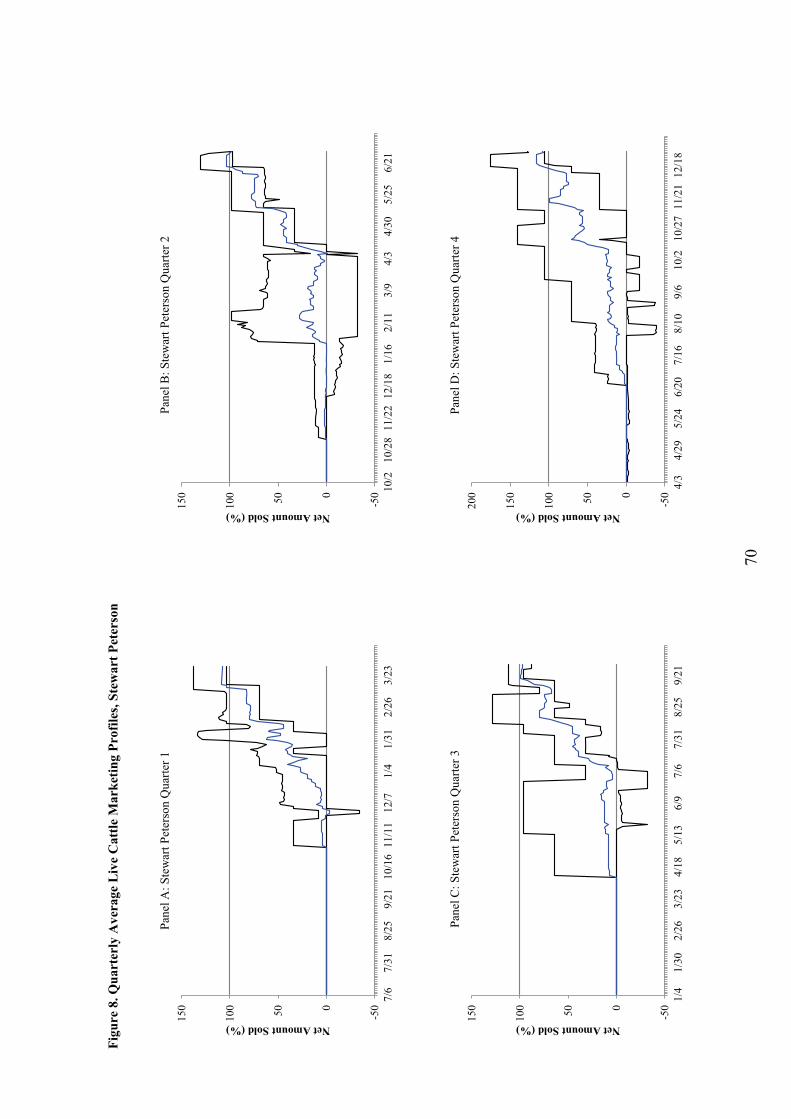
70
Figu
re 8
. Qua
rter
ly A
vera
ge L
ive
Cat
tle M
arke
ting
Prof
iles,
Stew
art P
eter
son
Pane
l A: S
tew
artP
eter
son
Qua
rter 1
Pane
l B: S
tew
artP
eter
son
Qua
rter 2
Pane
l C: S
tew
artP
eter
son
Qua
rter 3
Pane
l D: S
tew
artP
eter
son
Qua
rter 4
-50050100
150
7/6
7/31
8/25
9/21
10/1
611
/11
12/7
1/4
1/31
2/26
3/23
Net Amount Sold (%)
-50050100
150 10
/210
/28
11/2
212
/18
1/16
2/11
3/9
4/3
4/30
5/25
6/21
Net Amount Sold (%)
-50050100
150
1/4
1/30
2/26
3/23
4/18
5/13
6/9
7/6
7/31
8/25
9/21
Net Amount Sold (%)
-50050100
150
200
4/3
4/29
5/24
6/20
7/16
8/10
9/6
10/2
10/2
711
/21
12/1
8
Net Amount Sold (%)
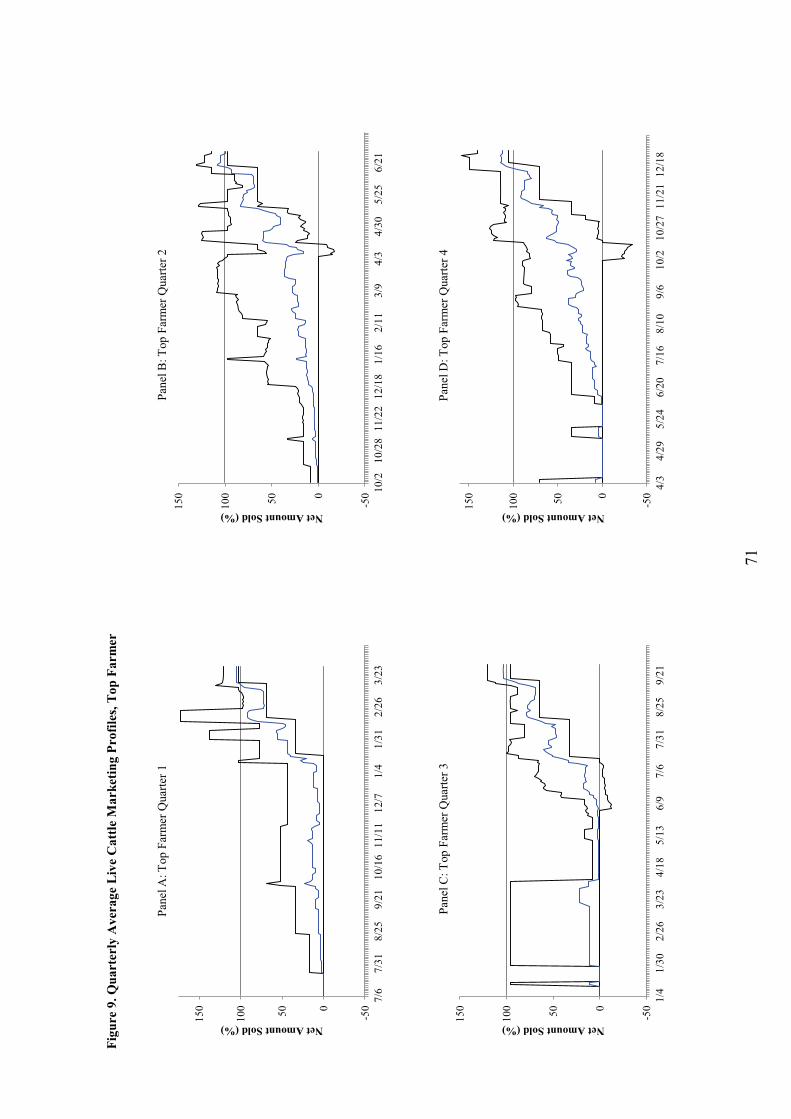
71
Figu
re 9
. Qua
rter
ly A
vera
ge L
ive
Cat
tle M
arke
ting
Prof
iles,
Top
Farm
er
Pane
l A: T
opFa
rmer
Qua
rter 1
Pane
l B: T
opFa
rmer
Qua
rter 2
Pane
l C: T
opFa
rmer
Qua
rter 3
Pane
l D: T
opFa
rmer
Qua
rter 4
-50050100
150
7/6
7/31
8/25
9/21
10/1
611
/11
12/7
1/4
1/31
2/26
3/23
Net Amount Sold (%)
-50050100
150 10
/210
/28
11/2
212
/18
1/16
2/11
3/9
4/3
4/30
5/25
6/21
Net Amount Sold (%)
-50050100
150
1/4
1/30
2/26
3/23
4/18
5/13
6/9
7/6
7/31
8/25
9/21
Net Amount Sold (%)
-50050100
150
4/3
4/29
5/24
6/20
7/16
8/10
9/6
10/2
10/2
711
/21
12/1
8
Net Amount Sold (%)
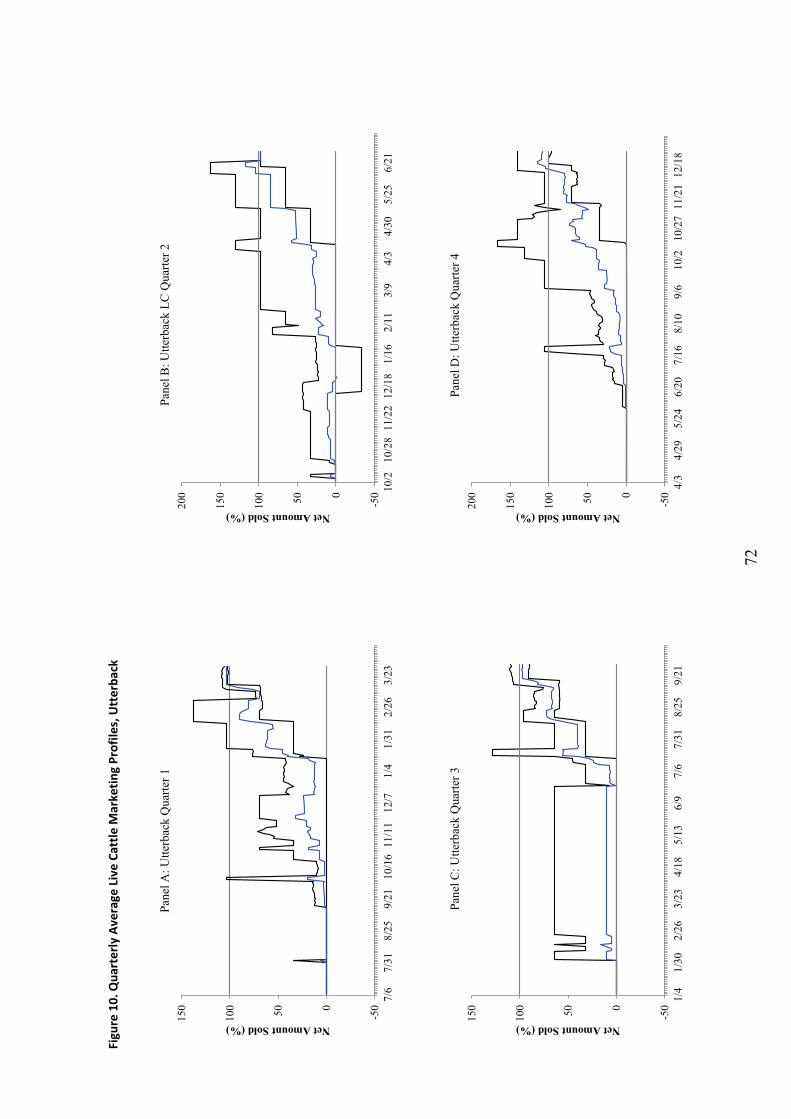
72
Figu
re 1
0. Q
uart
erly
Ave
rage
Liv
e Ca
ttle
Mar
ketin
g Pr
ofile
s, U
tter
back
Pane
l A: U
tterb
ack
Qua
rter 1
Pane
l B: U
tterb
ack
LC Q
uarte
r 2
Pane
l C: U
tterb
ack
Qua
rter 3
Pane
l D: U
tterb
ack
Qua
rter 4
-50050100
150
7/6
7/31
8/25
9/21
10/1
611
/11
12/7
1/4
1/31
2/26
3/23
Net Amount Sold (%)
-50050100
150
200 10
/210
/28
11/2
212
/18
1/16
2/11
3/9
4/3
4/30
5/25
6/21
Net Amount Sold (%)
-50050100
150
1/4
1/30
2/26
3/23
4/18
5/13
6/9
7/6
7/31
8/25
9/21
Net Amount Sold (%)
-50050100
150
200
4/3
4/29
5/24
6/20
7/16
8/10
9/6
10/2
10/2
711
/21
12/1
8
Net Amount Sold (%)
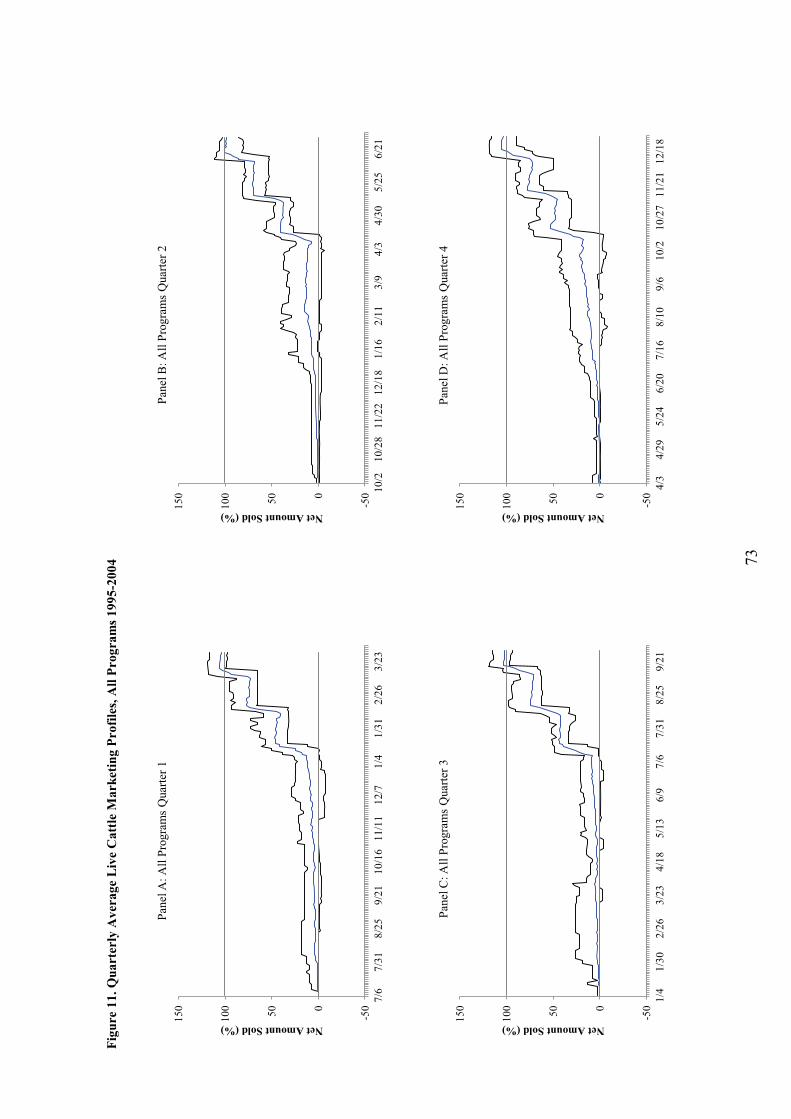
73
Figu
re 1
1. Q
uart
erly
Ave
rage
Liv
e C
attle
Mar
ketin
g Pr
ofile
s, A
ll Pr
ogra
ms 1
995-
2004
Pane
l A: A
ll Pr
ogra
ms
Qua
rter 1
Pane
l B: A
llPr
ogra
ms
Qua
rter 2
Pane
l C: A
llPr
ogra
ms
Qua
rter 3
Pane
l D: A
llPr
ogra
ms
Qua
rter 4
-50050100
150
7/6
7/31
8/25
9/21
10/1
611
/11
12/7
1/4
1/31
2/26
3/23
Net Amount Sold (%)
-50050100
150 10
/210
/28
11/2
212
/18
1/16
2/11
3/9
4/3
4/30
5/25
6/21
Net Amount Sold (%)
-50050100
150
1/4
1/30
2/26
3/23
4/18
5/13
6/9
7/6
7/31
8/25
9/21
Net Amount Sold (%)
-50050100
150
4/3
4/29
5/24
6/20
7/16
8/10
9/6
10/2
10/2
711
/21
12/1
8
Net Amount Sold (%)
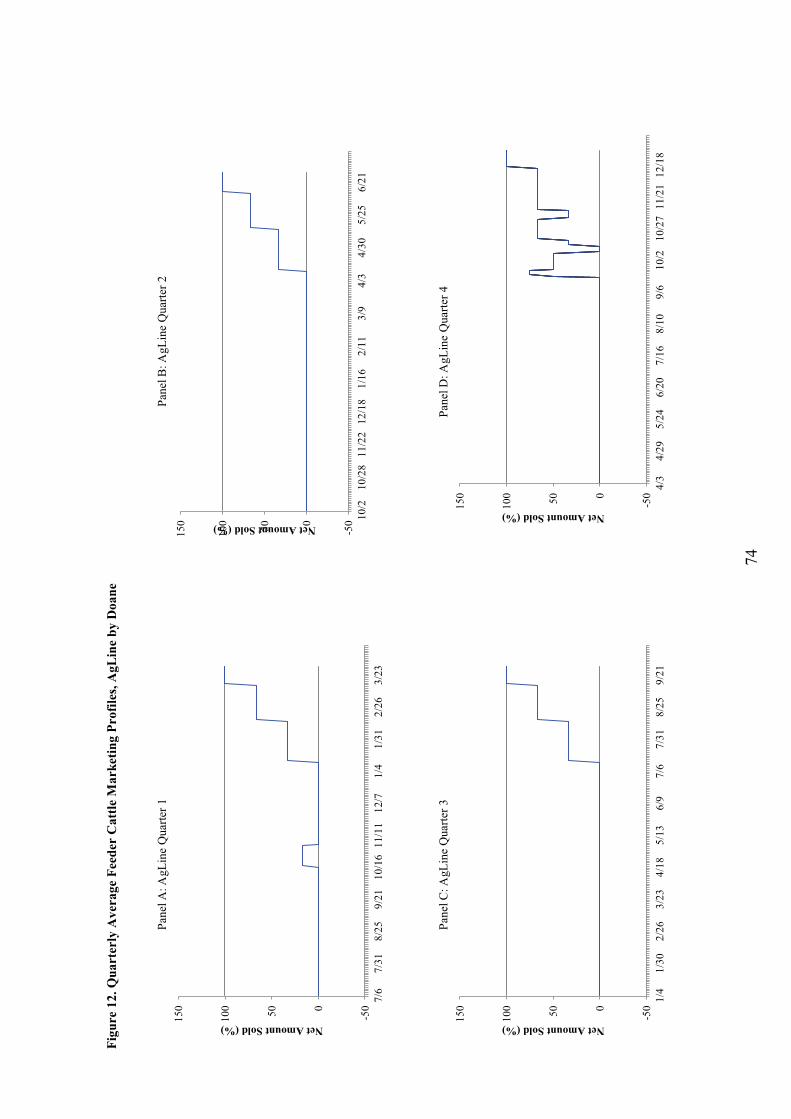
74
Figu
re 1
2. Q
uart
erly
Ave
rage
Fee
der
Cat
tle M
arke
ting
Prof
iles,
AgL
ine
by D
oane
-50050100
150
7/6
7/31
8/25
9/21
10/1
611
/11
12/7
1/4
1/31
2/26
3/23
Net Amount Sold (%)
Pane
l A: A
gLin
eQ
uarte
r 1
-50050100
150 10
/210
/28
11/2
212
/18
1/16
2/11
3/9
4/3
4/30
5/25
6/21
Net Amount Sold (%)
Pane
l B: A
gLin
eQ
uarte
r 2
-50050100
150
1/4
1/30
2/26
3/23
4/18
5/13
6/9
7/6
7/31
8/25
9/21
Net Amount Sold (%)
Pane
l C: A
gLin
eQ
uarte
r 3
-50050100
150
4/3
4/29
5/24
6/20
7/16
8/10
9/6
10/2
10/2
711
/21
12/1
8
Net Amount Sold (%)
Pane
l D: A
gLin
eQ
uarte
r 4
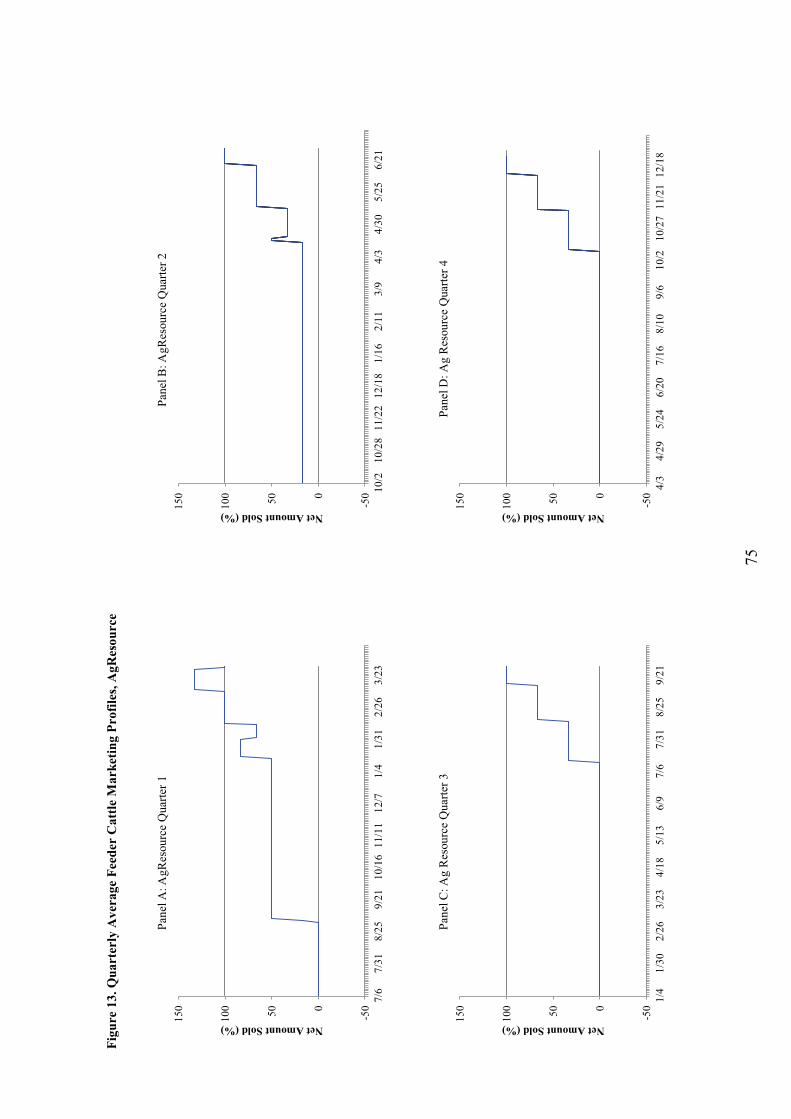
75
Figu
re 1
3. Q
uart
erly
Ave
rage
Fee
der
Cat
tle M
arke
ting
Prof
iles,
AgR
esou
rce
Pane
l A: A
gRes
ourc
eQ
uarte
r 1Pa
nel B
: AgR
esou
rce
Qua
rter 2
-50050100
150
1/4
1/30
2/26
3/23
4/18
5/13
6/9
7/6
7/31
8/25
9/21
Net Amount Sold (%)
Pane
l C: A
gR
esou
rce
Qua
rter 3
-50050100
150
4/3
4/29
5/24
6/20
7/16
8/10
9/6
10/2
10/2
711
/21
12/1
8
Net Amount Sold (%)
Pane
l D: A
g R
esou
rce
Qua
rter 4
-50050100
150
7/6
7/31
8/25
9/21
10/1
611
/11
12/7
1/4
1/31
2/26
3/23
Net Amount Sold (%)
-50050100
150 10
/210
/28
11/2
212
/18
1/16
2/11
3/9
4/3
4/30
5/25
6/21
Net Amount Sold (%)
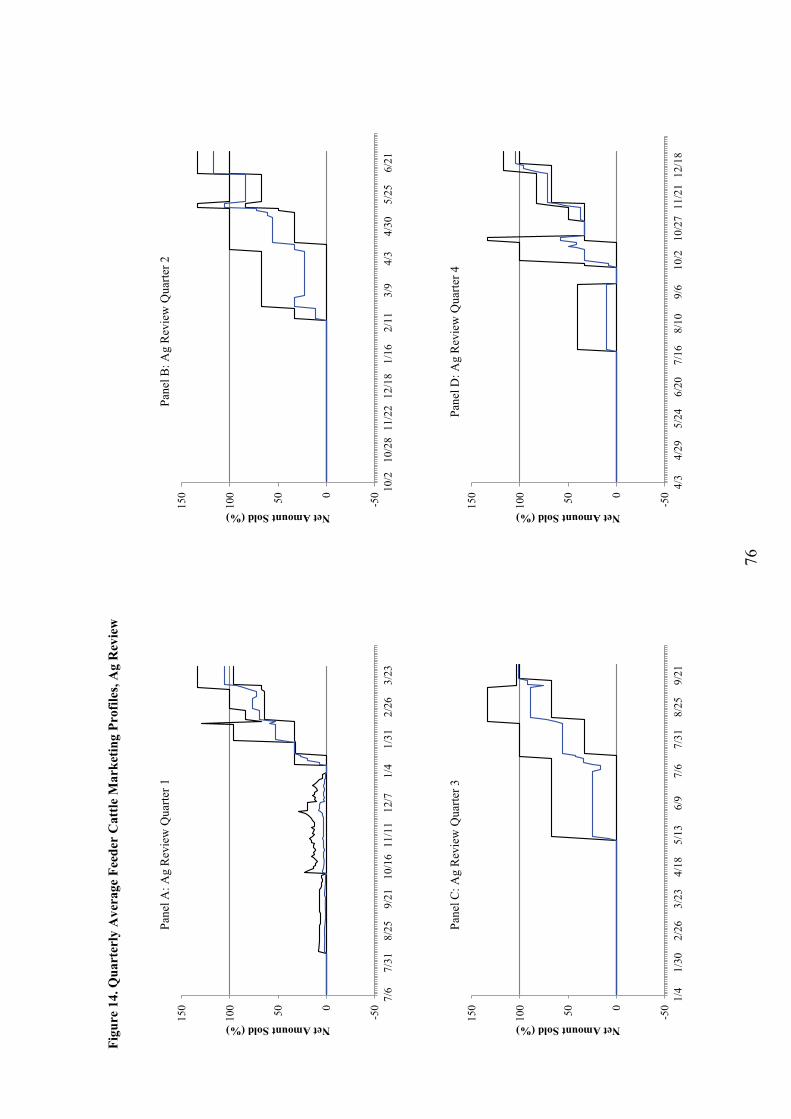
76
Figu
re 1
4. Q
uart
erly
Ave
rage
Fee
der
Cat
tle M
arke
ting
Prof
iles,
Ag
Rev
iew
Pane
l A: A
gR
evie
w Q
uarte
r 1Pa
nel B
: Ag
Rev
iew
Qua
rter 2
Pane
l C: A
g R
evie
wQ
uarte
r 3Pa
nel D
: Ag
Rev
iew
Qua
rter 4
-50050100
150 10
/210
/28
11/2
212
/18
1/16
2/11
3/9
4/3
4/30
5/25
6/21
Net Amount Sold (%)
-50050100
150
1/4
1/30
2/26
3/23
4/18
5/13
6/9
7/6
7/31
8/25
9/21
Net Amount Sold (%)
-50050100
150
4/3
4/29
5/24
6/20
7/16
8/10
9/6
10/2
10/2
711
/21
12/1
8
Net Amount Sold (%)
-50050100
150
7/6
7/31
8/25
9/21
10/1
611
/11
12/7
1/4
1/31
2/26
3/23
Net Amount Sold (%)
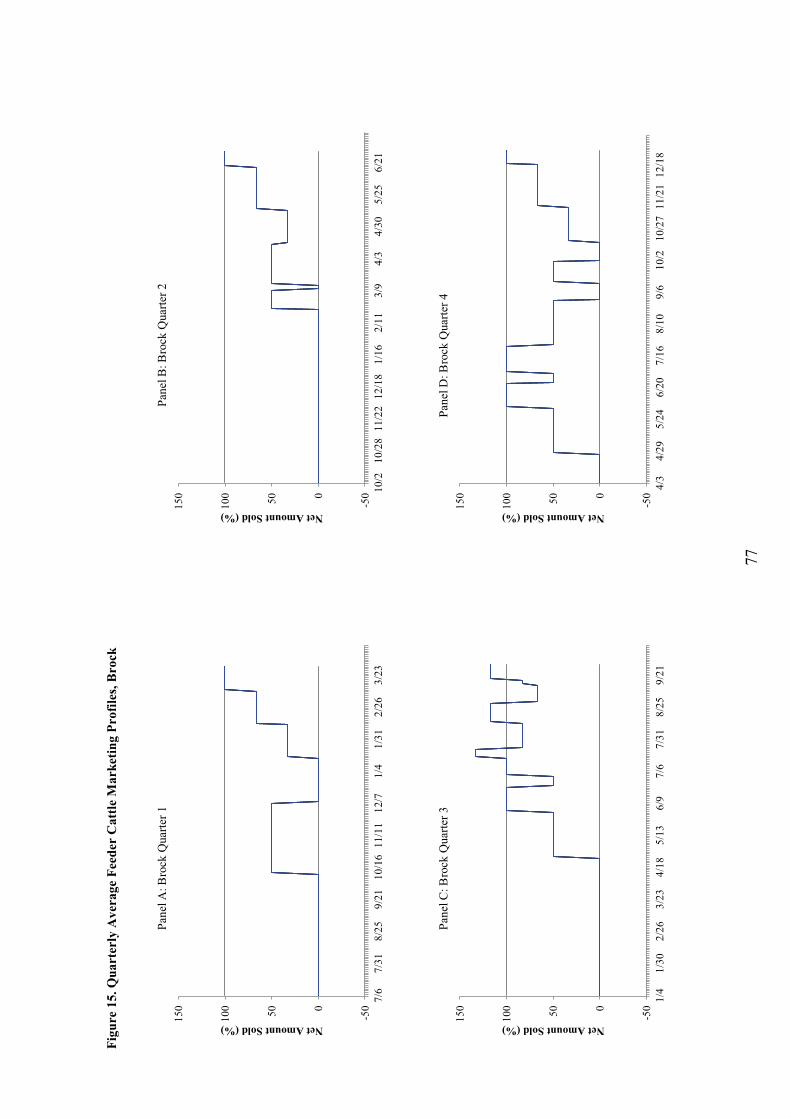
77
Figu
re 1
5. Q
uart
erly
Ave
rage
Fee
der
Cat
tle M
arke
ting
Prof
iles,
Bro
ck
Pane
l A: B
rock
Qua
rter 1
Pane
l B: B
rock
Qua
rter 2
Pane
l C: B
rock
Qua
rter 3
Pane
l D: B
rock
Qua
rter 4
-50050100
150 10
/210
/28
11/2
212
/18
1/16
2/11
3/9
4/3
4/30
5/25
6/21
Net Amount Sold (%)
-50050100
150
1/4
1/30
2/26
3/23
4/18
5/13
6/9
7/6
7/31
8/25
9/21
Net Amount Sold (%)
-50050100
150
4/3
4/29
5/24
6/20
7/16
8/10
9/6
10/2
10/2
711
/21
12/1
8
Net Amount Sold (%)
-50050100
150
7/6
7/31
8/25
9/21
10/1
611
/11
12/7
1/4
1/31
2/26
3/23
Net Amount Sold (%)
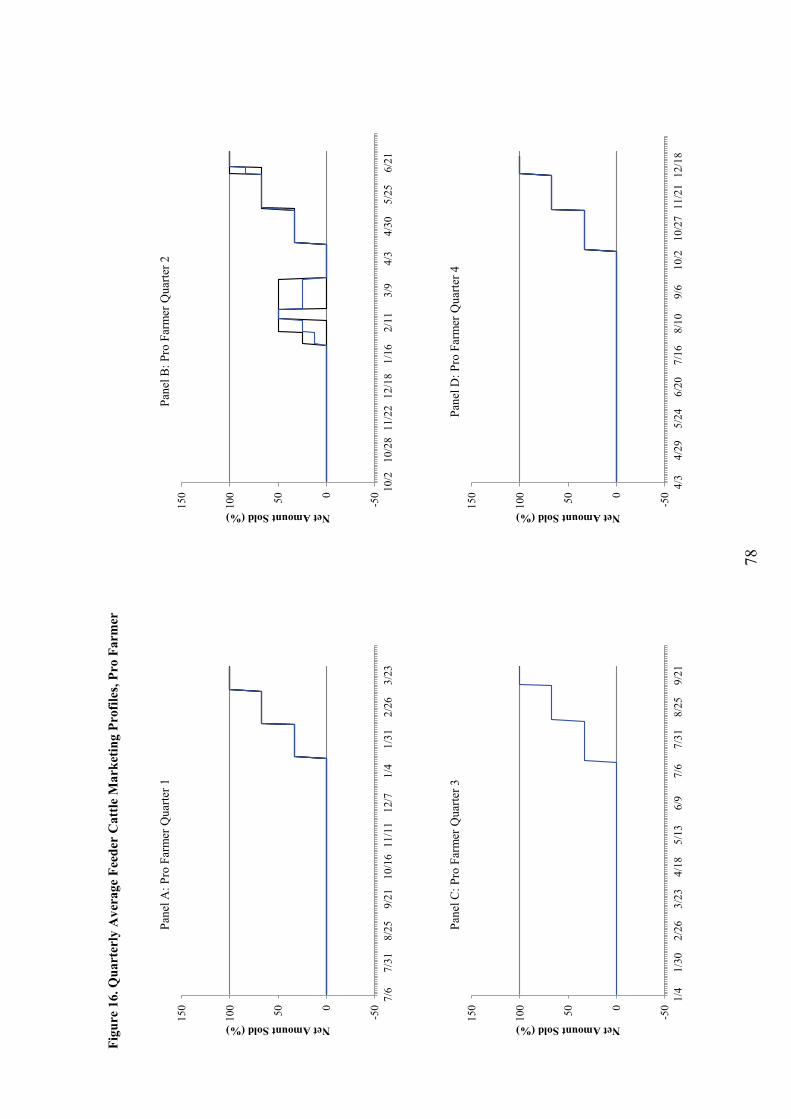
78
Figu
re 1
6. Q
uart
erly
Ave
rage
Fee
der
Cat
tle M
arke
ting
Prof
iles,
Pro
Farm
er
Pane
l A: P
ro F
arm
er Q
uarte
r 1Pa
nel B
: Pro
Farm
er Q
uarte
r 2
Pane
l C: P
roFa
rmer
Qua
rter 3
Pane
l D: P
roFa
rmer
Qua
rter 4
-50050100
150 10
/210
/28
11/2
212
/18
1/16
2/11
3/9
4/3
4/30
5/25
6/21
Net Amount Sold (%)
-50050100
150
7/6
7/31
8/25
9/21
10/1
611
/11
12/7
1/4
1/31
2/26
3/23
Net Amount Sold (%)
-50050100
150
1/4
1/30
2/26
3/23
4/18
5/13
6/9
7/6
7/31
8/25
9/21
Net Amount Sold (%)
-50050100
150
4/3
4/29
5/24
6/20
7/16
8/10
9/6
10/2
10/2
711
/21
12/1
8
Net Amount Sold (%)
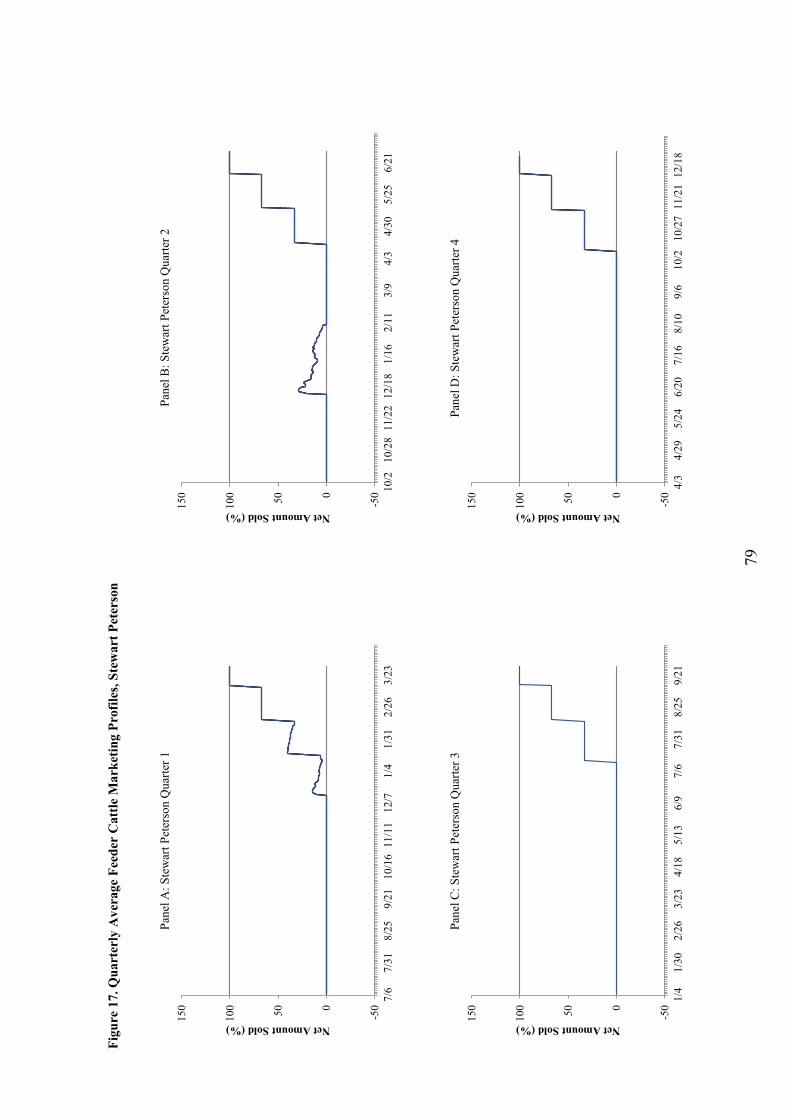
79
Figu
re 1
7. Q
uart
erly
Ave
rage
Fee
der
Cat
tle M
arke
ting
Prof
iles,
Stew
art P
eter
son
Pane
l A:S
tew
art P
eter
son
Qua
rter 1
Pane
l B: S
tew
artP
eter
son
Qua
rter 2
Pane
l C: S
tew
artP
eter
son
Qua
rter 3
Pane
l D: S
tew
artP
eter
son
Qua
rter 4
-50050100
150 10
/210
/28
11/2
212
/18
1/16
2/11
3/9
4/3
4/30
5/25
6/21
Net Amount Sold (%)
-50050100
150
7/6
7/31
8/25
9/21
10/1
611
/11
12/7
1/4
1/31
2/26
3/23
Net Amount Sold (%)
-50050100
150
4/3
4/29
5/24
6/20
7/16
8/10
9/6
10/2
10/2
711
/21
12/1
8
Net Amount Sold (%)
-50050100
150
1/4
1/30
2/26
3/23
4/18
5/13
6/9
7/6
7/31
8/25
9/21
Net Amount Sold (%)
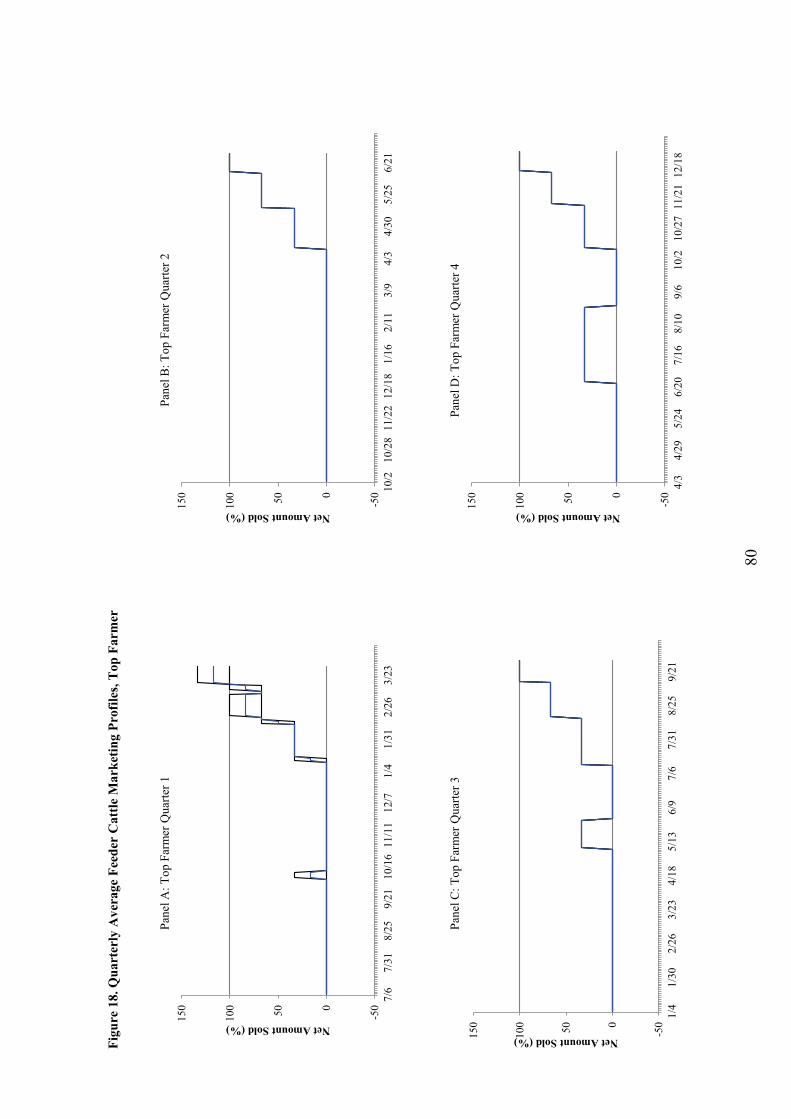
80
Figu
re 1
8. Q
uart
erly
Ave
rage
Fee
der
Cat
tle M
arke
ting
Prof
iles,
Top
Far
mer
Pane
l A: T
opFa
rmer
Qua
rter 1
Pane
l B: T
opFa
rmer
Qua
rter 2
Pane
l C: T
opFa
rmer
Qua
rter 3
Pane
l D: T
opFa
rmer
Qua
rter 4
-50050100
150
1/4
1/30
2/26
3/23
4/18
5/13
6/9
7/6
7/31
8/25
9/21
Net Amount Sold (%)
-50050100
150
4/3
4/29
5/24
6/20
7/16
8/10
9/6
10/2
10/2
711
/21
12/1
8
Net Amount Sold (%)
-50050100
150 10
/210
/28
11/2
212
/18
1/16
2/11
3/9
4/3
4/30
5/25
6/21
Net Amount Sold (%)
-50050100
150
7/6
7/31
8/25
9/21
10/1
611
/11
12/7
1/4
1/31
2/26
3/23
Net Amount Sold (%)
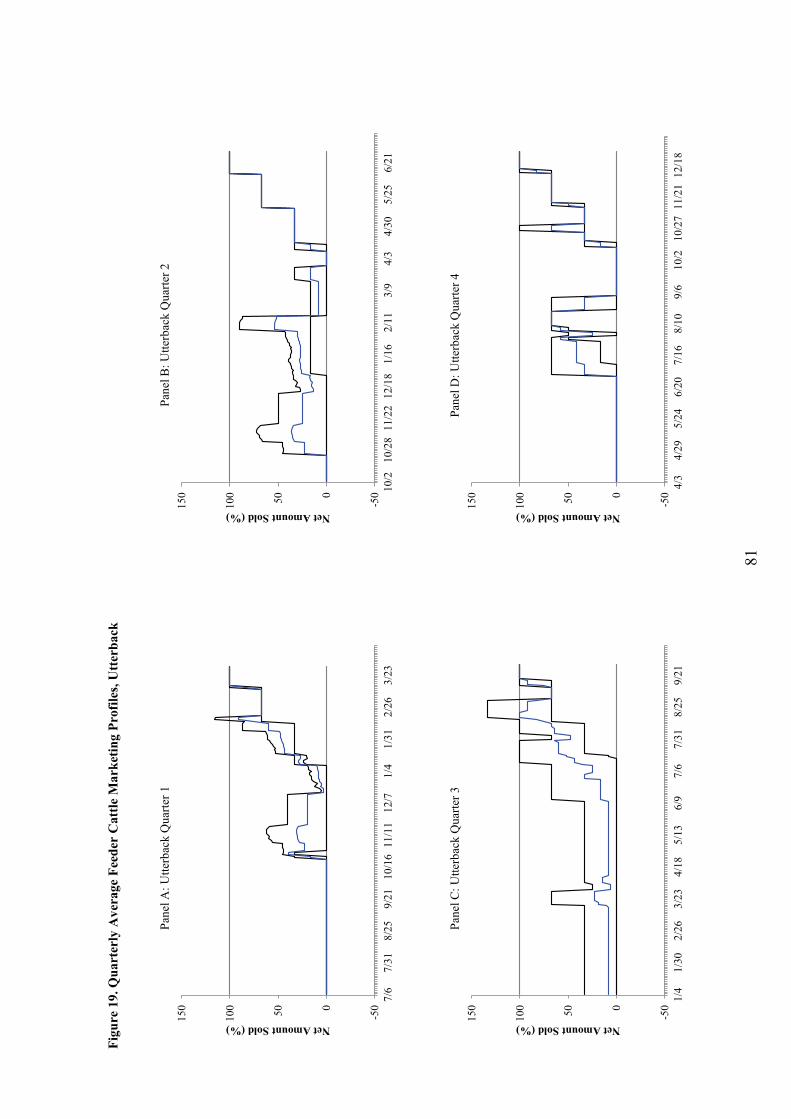
81
Figu
re 1
9. Q
uart
erly
Ave
rage
Fee
der
Cat
tle M
arke
ting
Prof
iles,
Utte
rbac
k
Pane
l A: U
tterb
ack
Qua
rter 1
Pane
l B: U
tterb
ack
Qua
rter 2
Pane
l C: U
tterb
ack
Qua
rter 3
Pane
l D: U
tterb
ack
Qua
rter 4
-50050100
150 10
/210
/28
11/2
212
/18
1/16
2/11
3/9
4/3
4/30
5/25
6/21
Net Amount Sold (%)
-50050100
150
1/4
1/30
2/26
3/23
4/18
5/13
6/9
7/6
7/31
8/25
9/21
Net Amount Sold (%)
-50050100
150
4/3
4/29
5/24
6/20
7/16
8/10
9/6
10/2
10/2
711
/21
12/1
8
Net Amount Sold (%)
-50050100
150
7/6
7/31
8/25
9/21
10/1
611
/11
12/7
1/4
1/31
2/26
3/23
Net Amount Sold (%)
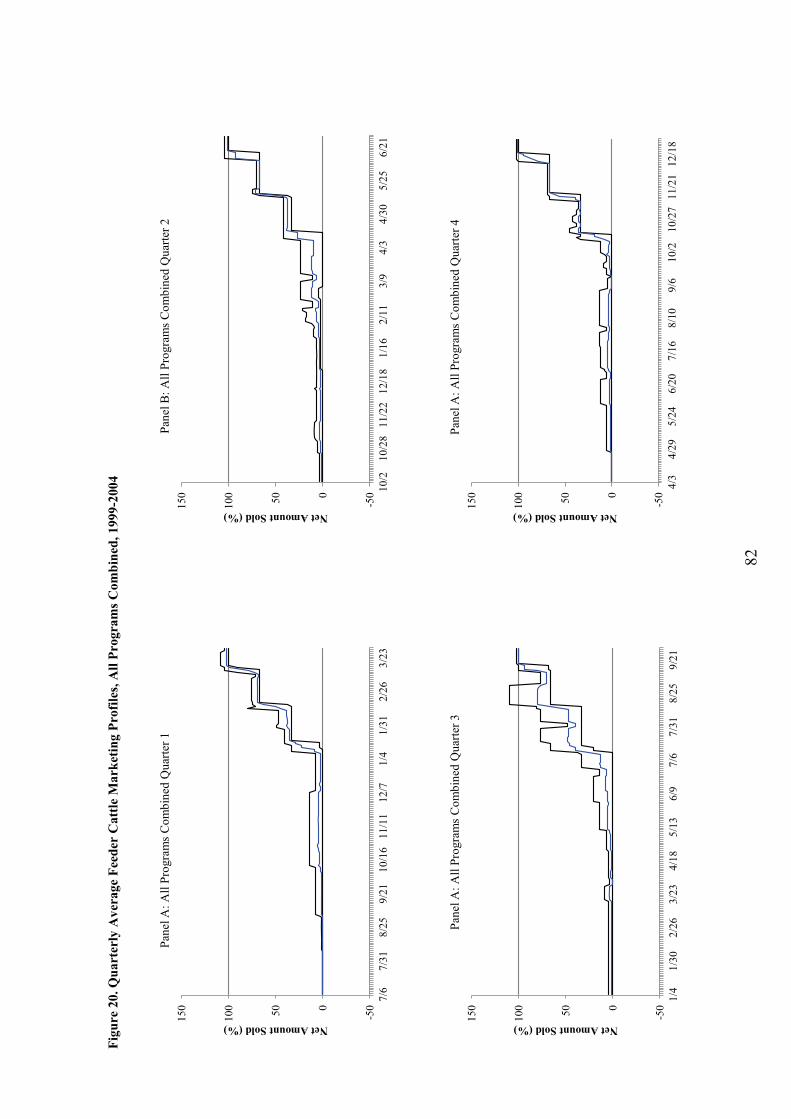
82
Figu
re 2
0. Q
uart
erly
Ave
rage
Fee
der
Cat
tle M
arke
ting
Prof
iles,
All
Prog
ram
s Com
bine
d, 1
999-
2004
Pane
l A: A
ll Pr
ogra
ms
Com
bine
d Q
uarte
r 1Pa
nel B
: All
Prog
ram
s Com
bine
d Q
uarte
r 2
Pane
l A: A
ll Pr
ogra
ms
Com
bine
d Q
uarte
r 3Pa
nel A
: All
Prog
ram
s C
ombi
ned
Qua
rter 4
-50050100
150
7/6
7/31
8/25
9/21
10/1
611
/11
12/7
1/4
1/31
2/26
3/23
Net Amount Sold (%)
-50050100
150 10
/210
/28
11/2
212
/18
1/16
2/11
3/9
4/3
4/30
5/25
6/21
Net Amount Sold (%)
-50050100
150
1/4
1/30
2/26
3/23
4/18
5/13
6/9
7/6
7/31
8/25
9/21
Net Amount Sold (%)
-50050100
150
4/3
4/29
5/24
6/20
7/16
8/10
9/6
10/2
10/2
711
/21
12/1
8
Net Amount Sold (%)
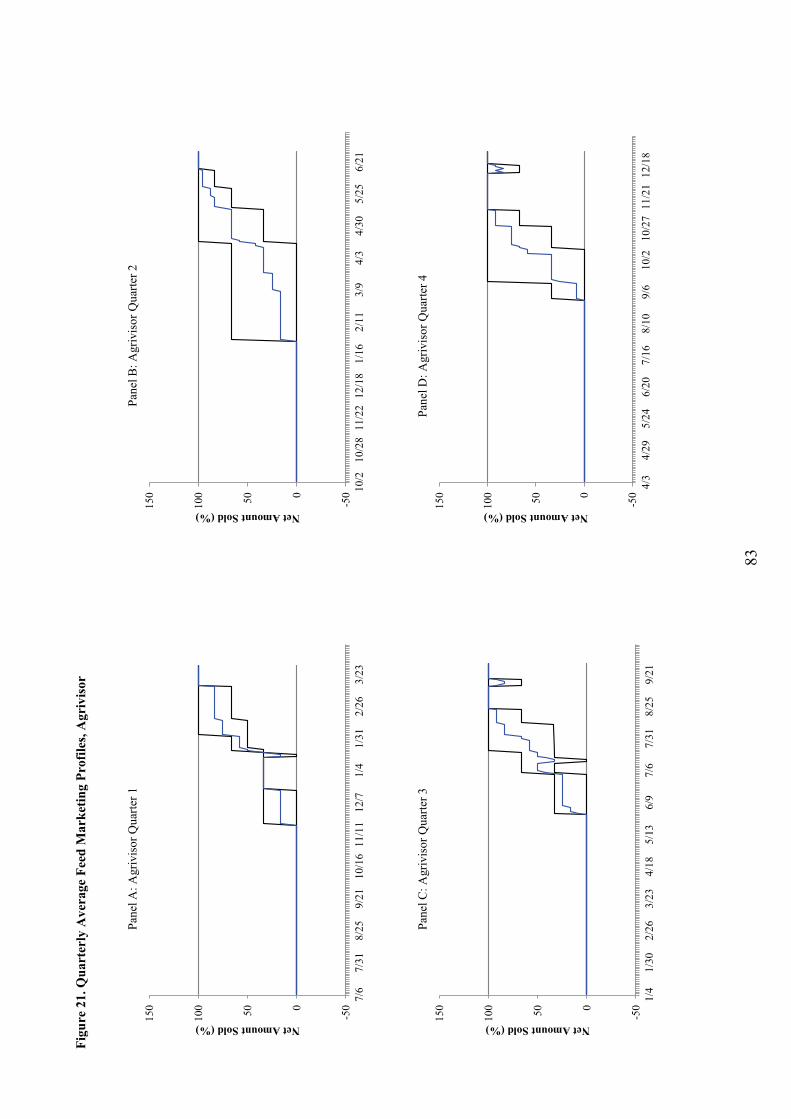
83
Figu
re 2
1. Q
uart
erly
Ave
rage
Fee
d M
arke
ting
Prof
iles,
Agr
ivis
or
Pane
l A: A
griv
isor
Qua
rter 1
Pane
l B: A
griv
isor
Qua
rter 2
Pane
l C: A
griv
isor
Qua
rter 3
Pane
l D: A
griv
isor
Qua
rter 4
-50050100
150 10
/210
/28
11/2
212
/18
1/16
2/11
3/9
4/3
4/30
5/25
6/21
Net Amount Sold (%)
-50050100
150
1/4
1/30
2/26
3/23
4/18
5/13
6/9
7/6
7/31
8/25
9/21
Net Amount Sold (%)
-50050100
150
4/3
4/29
5/24
6/20
7/16
8/10
9/6
10/2
10/2
711
/21
12/1
8
Net Amount Sold (%)
-50050100
150
7/6
7/31
8/25
9/21
10/1
611
/11
12/7
1/4
1/31
2/26
3/23
Net Amount Sold (%)
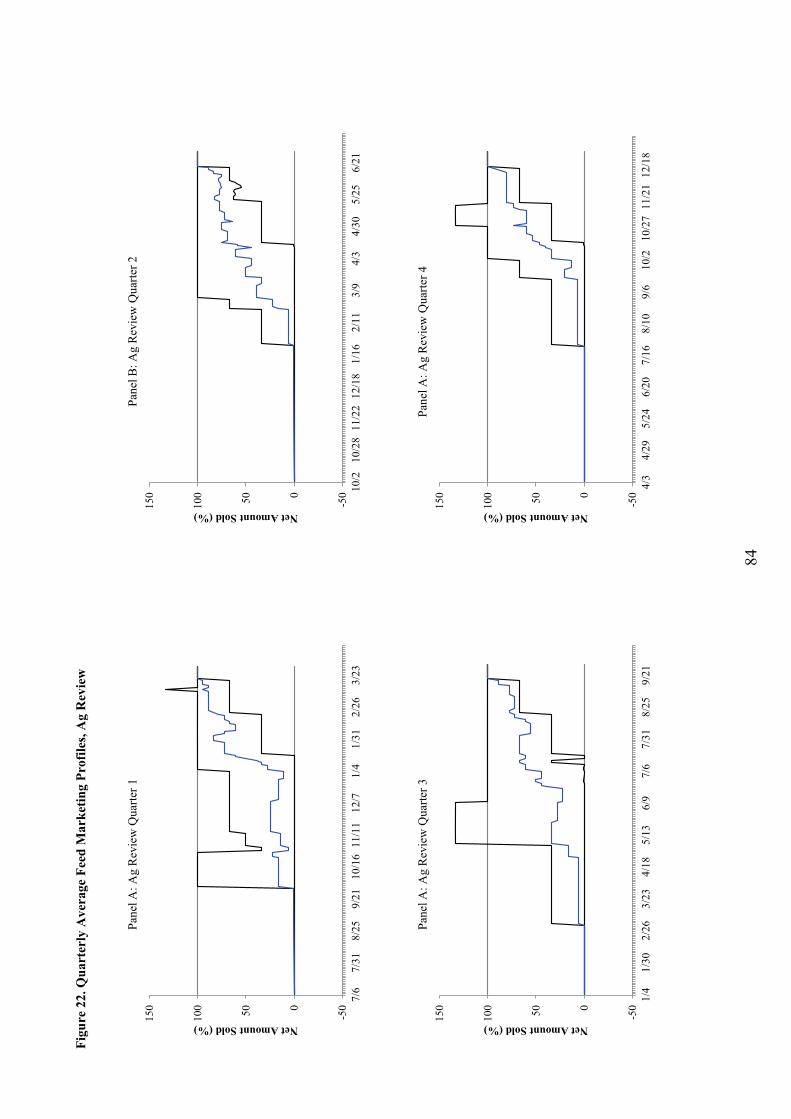
84
Figu
re 2
2. Q
uart
erly
Ave
rage
Fee
d M
arke
ting
Prof
iles,
Ag
Rev
iew
Pane
l A: A
gR
evie
w Q
uarte
r 1Pa
nel B
: Ag
Rev
iew
Qua
rter 2
Pane
l A: A
g R
evie
wQ
uarte
r 3Pa
nel A
: Ag
Rev
iew
Qua
rter 4
-50050100
150 10
/210
/28
11/2
212
/18
1/16
2/11
3/9
4/3
4/30
5/25
6/21
Net Amount Sold (%)
-50050100
150
1/4
1/30
2/26
3/23
4/18
5/13
6/9
7/6
7/31
8/25
9/21
Net Amount Sold (%)
-50050100
150
4/3
4/29
5/24
6/20
7/16
8/10
9/6
10/2
10/2
711
/21
12/1
8
Net Amount Sold (%)
-50050100
150
7/6
7/31
8/25
9/21
10/1
611
/11
12/7
1/4
1/31
2/26
3/23
Net Amount Sold (%)
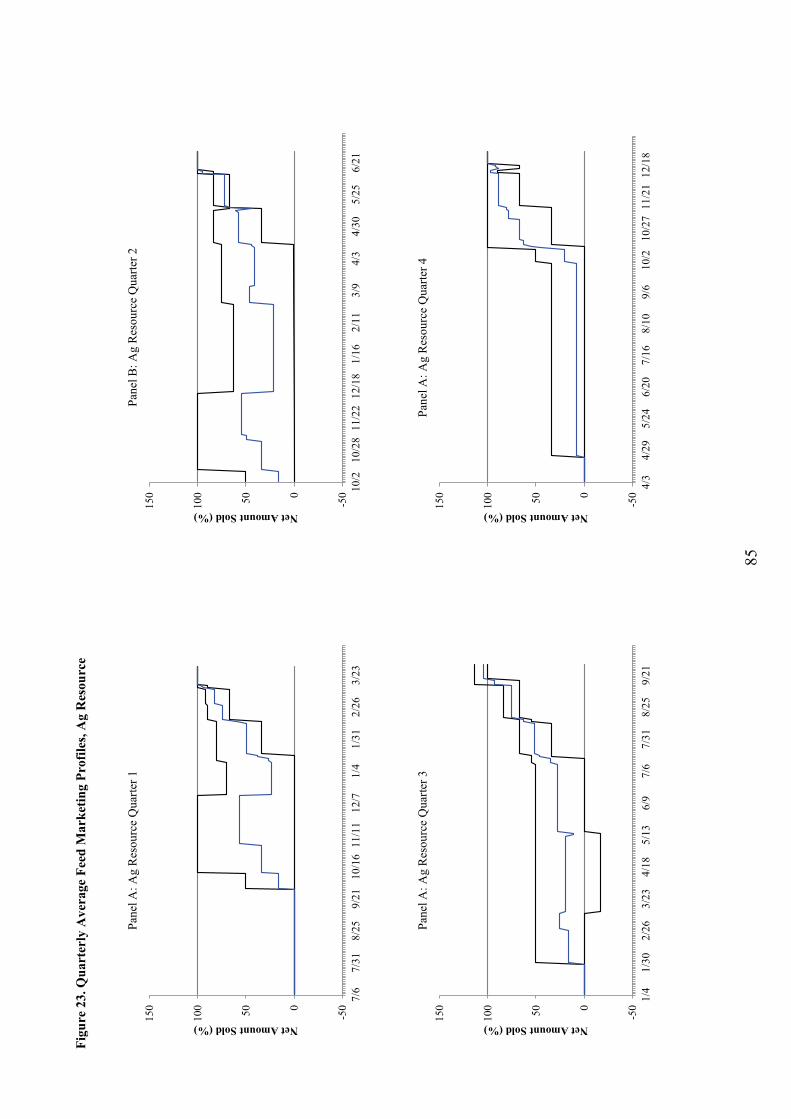
85
Figu
re 2
3. Q
uart
erly
Ave
rage
Fee
d M
arke
ting
Prof
iles,
Ag
Res
ourc
e
Pane
l A: A
gR
esou
rce
Qua
rter 1
Pane
l B: A
g R
esou
rce
Qua
rter 2
Pane
l A: A
g R
esou
rce
Qua
rter 3
Pane
l A: A
gR
esou
rce
Qua
rter 4
-50050100
150 10
/210
/28
11/2
212
/18
1/16
2/11
3/9
4/3
4/30
5/25
6/21
Net Amount Sold (%)
-50050100
150
1/4
1/30
2/26
3/23
4/18
5/13
6/9
7/6
7/31
8/25
9/21
Net Amount Sold (%)
-50050100
150
4/3
4/29
5/24
6/20
7/16
8/10
9/6
10/2
10/2
711
/21
12/1
8
Net Amount Sold (%)
-50050100
150
7/6
7/31
8/25
9/21
10/1
611
/11
12/7
1/4
1/31
2/26
3/23
Net Amount Sold (%)
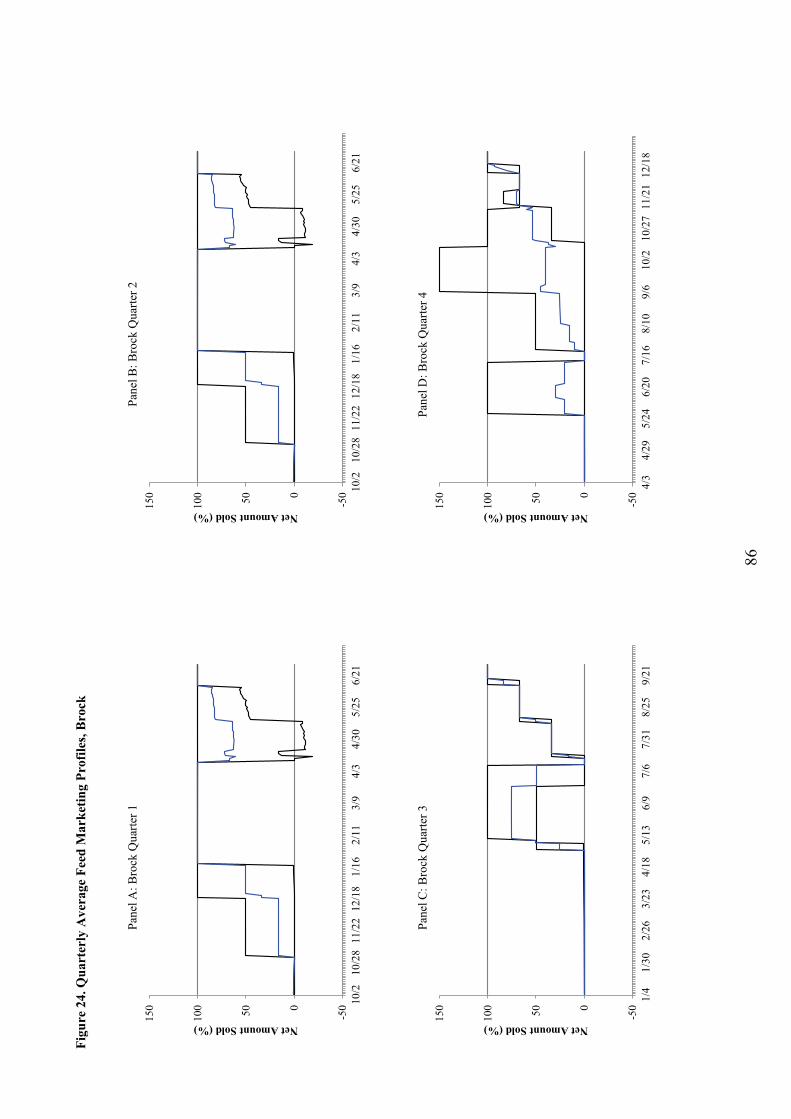
86
Figu
re 2
4. Q
uart
erly
Ave
rage
Fee
d M
arke
ting
Prof
iles,
Bro
ck
Pane
l A: B
rock
Qua
rter 1
Pane
l B: B
rock
Qua
rter 2
Pane
l C: B
rock
Qua
rter 3
Pane
l D: B
rock
Qua
rter 4
-50050100
150 10
/210
/28
11/2
212
/18
1/16
2/11
3/9
4/3
4/30
5/25
6/21
Net Amount Sold (%)
-50050100
150
1/4
1/30
2/26
3/23
4/18
5/13
6/9
7/6
7/31
8/25
9/21
Net Amount Sold (%)
-50050100
150
4/3
4/29
5/24
6/20
7/16
8/10
9/6
10/2
10/2
711
/21
12/1
8
Net Amount Sold (%)
-50050100
150 10
/210
/28
11/2
212
/18
1/16
2/11
3/9
4/3
4/30
5/25
6/21
Net Amount Sold (%)
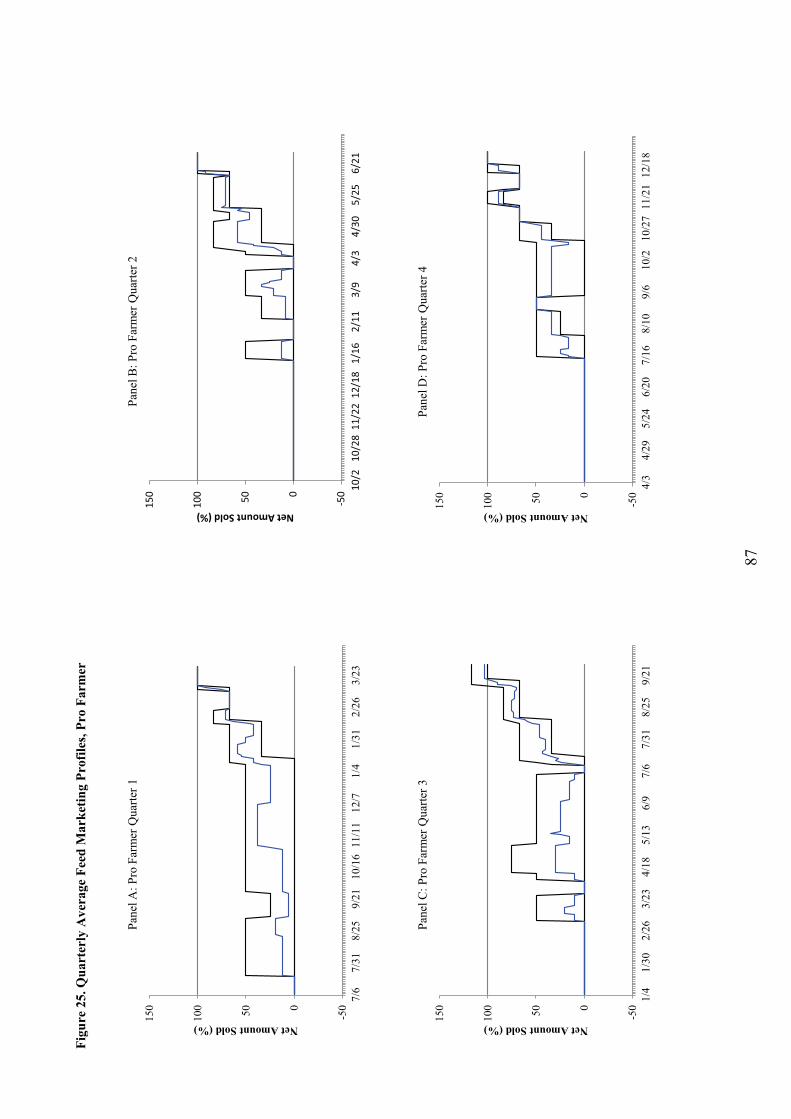
87
Figu
re 2
5. Q
uart
erly
Ave
rage
Fee
d M
arke
ting
Prof
iles,
Pro
Farm
er
Pane
l A: P
ro F
arm
er Q
uarte
r 1Pa
nel B
: Pro
Far
mer
Qua
rter 2
Pane
l C: P
ro F
arm
er Q
uarte
r 3Pa
nel D
: Pro
Far
mer
Qua
rter 4
-50 0 50
100
150 10
/2
10/2
8 11
/22
12/1
8 1/
16
2/11
3/
9 4/
3 4/
30
5/25
6/
21
Net Amount Sold (%)
-50050100
150
1/4
1/30
2/26
3/23
4/18
5/13
6/9
7/6
7/31
8/25
9/21
Net Amount Sold (%)
-50050100
150
4/3
4/29
5/24
6/20
7/16
8/10
9/6
10/2
10/2
711
/21
12/1
8
Net Amount Sold (%)
-50050100
150
7/6
7/31
8/25
9/21
10/1
611
/11
12/7
1/4
1/31
2/26
3/23
Net Amount Sold (%)
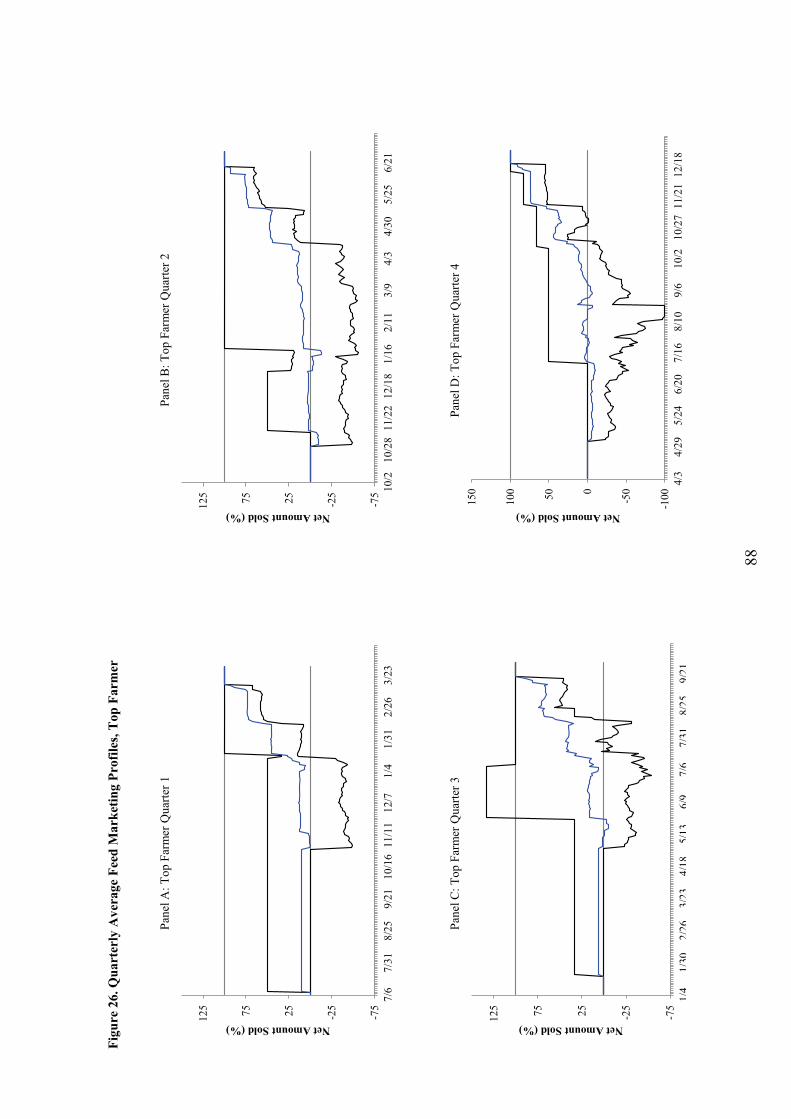
88
Figu
re 2
6. Q
uart
erly
Ave
rage
Fee
d M
arke
ting
Prof
iles,
Top
Far
mer
Pane
l A: T
op F
arm
er Q
uarte
r 1Pa
nel B
: Top
Far
mer
Qua
rter 2
Pane
l C: T
op F
arm
er Q
uarte
r 3Pa
nel D
: Top
Far
mer
Qua
rter 4
-75
-252575125 10
/210
/28
11/2
212
/18
1/16
2/11
3/9
4/3
4/30
5/25
6/21
Net Amount Sold (%)
-75
-252575125
1/4
1/30
2/26
3/23
4/18
5/13
6/9
7/6
7/31
8/25
9/21
Net Amount Sold (%)
-100-5
0050100
150
4/3
4/29
5/24
6/20
7/16
8/10
9/6
10/2
10/2
711
/21
12/1
8
Net Amount Sold (%)
-75
-252575125
7/6
7/31
8/25
9/21
10/1
611
/11
12/7
1/4
1/31
2/26
3/23
Net Amount Sold (%)
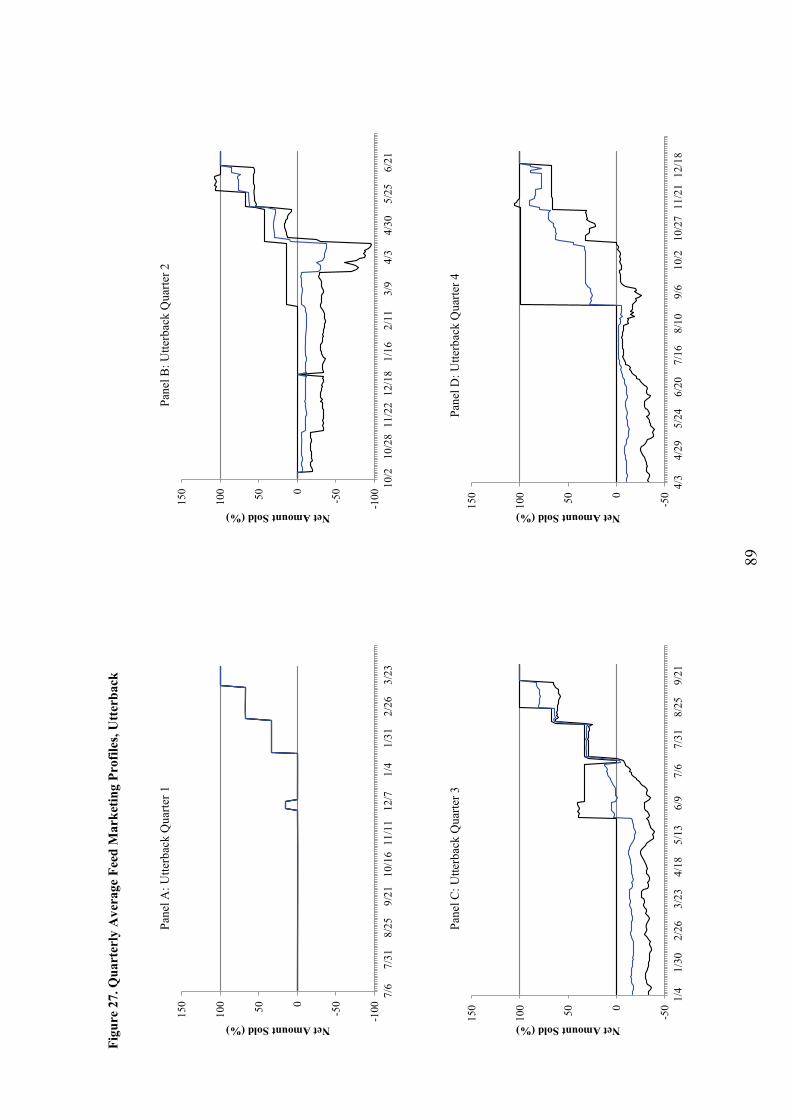
89
Figu
re 2
7. Q
uart
erly
Ave
rage
Fee
d M
arke
ting
Prof
iles,
Utte
rbac
k
Pane
l A: U
tterb
ack
Qua
rter 1
Pane
l B: U
tterb
ack
Qua
rter 2
Pane
l C: U
tterb
ack
Qua
rter 3
Pane
l D: U
tterb
ack
Qua
rter 4
-100-5
0050100
150 10
/210
/28
11/2
212
/18
1/16
2/11
3/9
4/3
4/30
5/25
6/21
Net Amount Sold (%)
-50050100
150
1/4
1/30
2/26
3/23
4/18
5/13
6/9
7/6
7/31
8/25
9/21
Net Amount Sold (%)
-50050100
150
4/3
4/29
5/24
6/20
7/16
8/10
9/6
10/2
10/2
711
/21
12/1
8
Net Amount Sold (%)
-100-5
0050100
150
7/6
7/31
8/25
9/21
10/1
611
/11
12/7
1/4
1/31
2/26
3/23
Net Amount Sold (%)
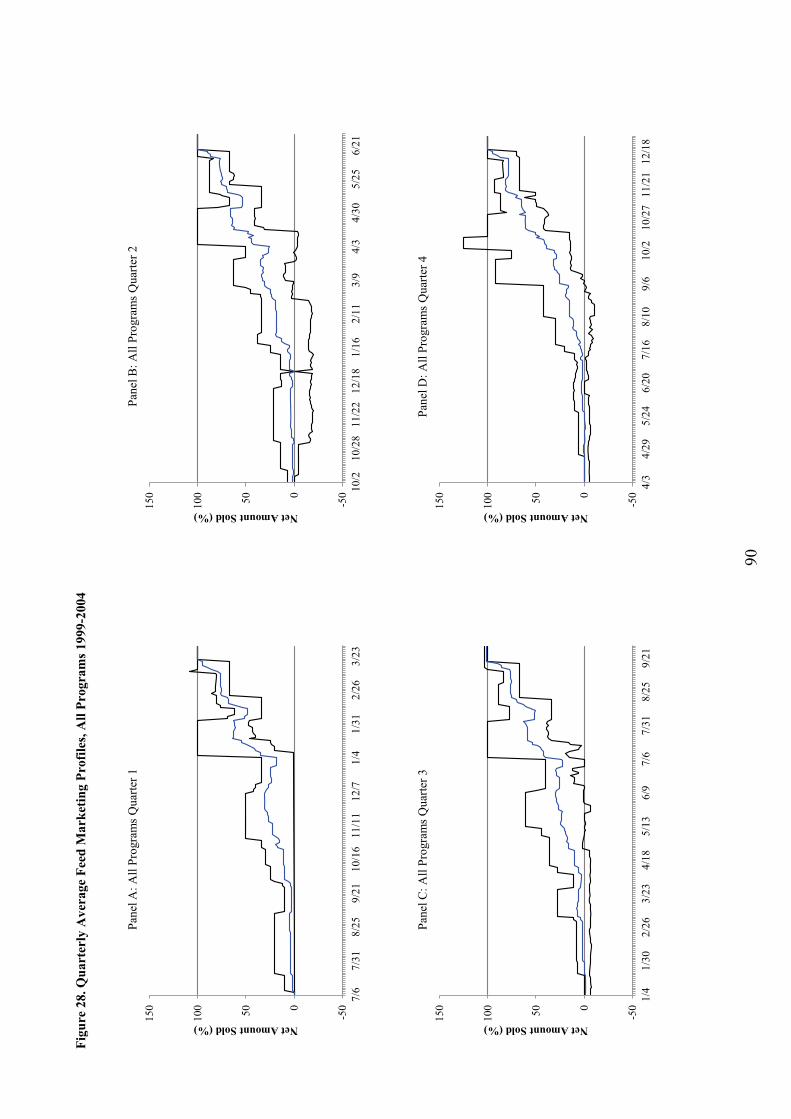
90
Figu
re 2
8. Q
uart
erly
Ave
rage
Fee
d M
arke
ting
Prof
iles,
All
Prog
ram
s 199
9-20
04
Pane
l A: A
ll Pr
ogra
ms
Qua
rter 1
Pane
l B: A
ll Pr
ogra
msQ
uarte
r 2
Pane
l C: A
ll Pr
ogra
msQ
uarte
r 3Pa
nel D
: All
Prog
ram
sQ
uarte
r 4
-50050100
150
7/6
7/31
8/25
9/21
10/1
611
/11
12/7
1/4
1/31
2/26
3/23
Net Amount Sold (%)
-50050100
150 10
/210
/28
11/2
212
/18
1/16
2/11
3/9
4/3
4/30
5/25
6/21
Net Amount Sold (%)
-50050100
150
1/4
1/30
2/26
3/23
4/18
5/13
6/9
7/6
7/31
8/25
9/21
Net Amount Sold (%)
-50050100
150
4/3
4/29
5/24
6/20
7/16
8/10
9/6
10/2
10/2
711
/21
12/1
8
Net Amount Sold (%)
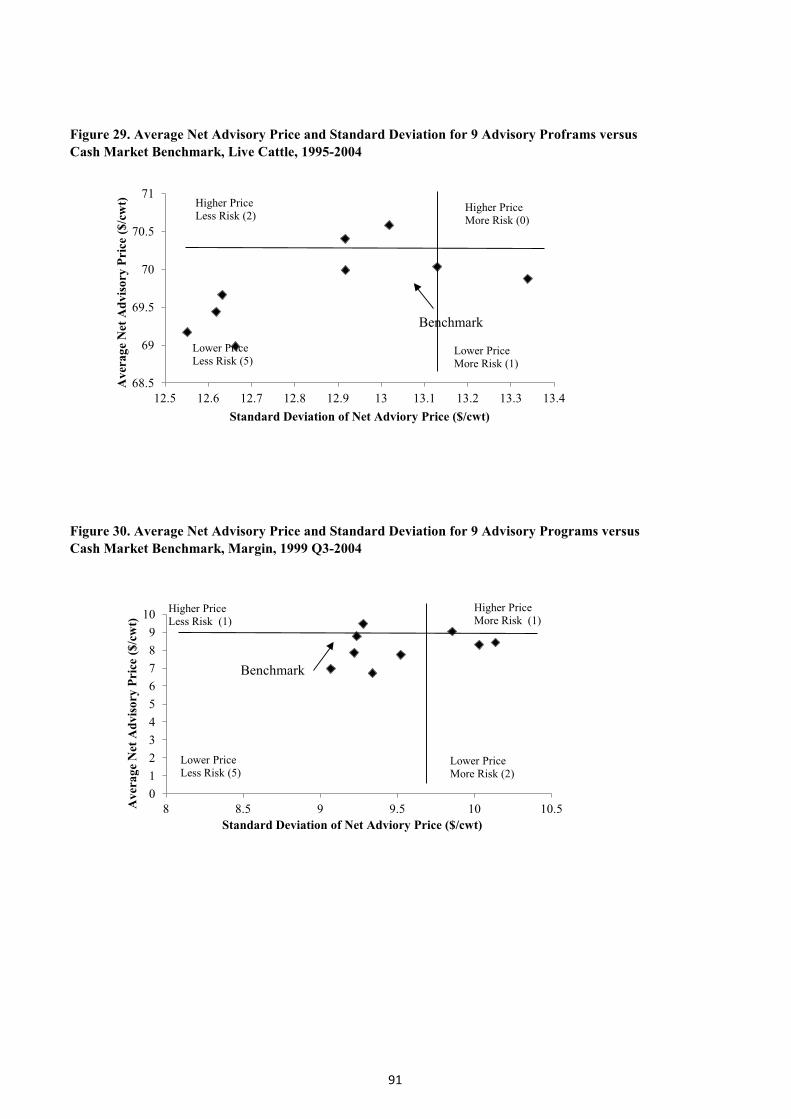
91
Figure 29. Average Net Advisory Price and Standard Deviation for 9 Advisory Proframs versus Cash Market Benchmark, Live Cattle, 1995-2004
Figure 30. Average Net Advisory Price and Standard Deviation for 9 Advisory Programs versus Cash Market Benchmark, Margin, 1999 Q3-2004
68.5
69
69.5
70
70.5
71
12.5 12.6 12.7 12.8 12.9 13 13.1 13.2 13.3 13.4
Ave
rage
Net
Adv
isor
y Pr
ice
($/c
wt)
Standard Deviation of Net Adviory Price ($/cwt)
Higher PriceLess Risk (2)
Lower PriceLess Risk (5)
Higher PriceMore Risk (0)
Lower PriceMore Risk (1)
Benchmark
0123456789
10
8 8.5 9 9.5 10 10.5Ave
rage
Net
Adv
isor
y Pr
ice
($/c
wt)
Standard Deviation of Net Adviory Price ($/cwt)
Higher PriceLess Risk (1)
Lower PriceLess Risk (5)
Higher PriceMore Risk (1)
Lower PriceMore Risk (2)
Benchmark


![Super Market Pricing Stretegy[1]](https://img.pdfslide.us/doc/110x75/577d36461a28ab3a6b92ad9c/super-market-pricing-stretegy1.jpg)