Embed Size (px)
Citation preview
The Price Effects of Codeshare Products Under the
United-Continental Airline Merger
By
Vinayak Balasubramanian
Honors Thesis
Department of Economics
University of North Carolina
April 14, 2014
Approved:
________________________________
Dr. Tiago Pires
[2]
Acknowledgements
I would like to thank my advisor, Dr. Tiago Pires, for his invaluable insight and advice in
the formulation of my question and econometric methods, as well as his assistance in interpreting
my results. I would also like to thank Dr. Geetha Vaidyanathan, the economics department
honors thesis director, for the support and direction she provided me in developing my thesis.
Finally, I would like to thank my parents, Shuba and Venkataraman Balasubramanian, for their
ongoing support of my education at the University of North Carolina at Chapel Hill.
[3]
Abstract
The existence of operational inefficiency in the U.S. airline industry, combined with
rising costs and financial problems, has long prompted airlines to find ways to consolidate
through mergers, and to cooperate through codeshare agreements and alliances. While the price
and competition effects of mergers and codeshare agreements are well documented by existing
research, there is comparatively little literature over a merger’s impact on the codeshare products
between the merging firms, and on markets abundant in codeshare passengers. This paper seeks
to fill this research gap by analyzing price data for 75 million passengers from four consecutive
quarters before and four consecutive quarters after the United-Continental Airline merger. The
results show a statistically significant price increase in former codeshare products in markets,
and a statistically significant price decrease for codeshare products in highly concentrated
markets. The data also shows a statistically significant price increase for non-concentrated
markets that are abundant in codeshare passengers, and a statistically significant price decrease
highly concentrated markets that are abundant in codeshare passengers. These findings indicate
that antitrust authorities should pay more attention to markets that aren’t concentrated when
making future merger decisions, particularly as the number of passengers taking advantage of
codeshare tickets continues to increase.
[4]
1. Introduction
While airline mergers have long been a hallmark feature of the airline industry since it
was deregulated in 1978, the mergers that have taken place over the past 6 years – Delta &
Northwest Airlines (2008), United & Continental Airlines (2010), and US Airways & American
Airlines (2013) – amount to an especially significant consolidation of the U.S. airline industry. A
study using data from the U.S. Department of Transportation found that the recently-approved
US Airways – American Airline merger would cause 75% of the domestic market to be
dominated by just 3 airlines – half the number of airlines holding this market share just 10 years
ago.1 This level of consolidation means that airlines frequently overtake each other as the largest
airline after each merger. United Airlines is currently the world’s largest airline in terms of
passenger-revenue miles, having overtaken Delta Airlines in 2011 following the 2010 United-
Continental merger. Delta Airlines was previously the world’s largest airline because of its 2008
merger with Northwest Airlines.2 American Airlines is expected to overtake United Airlines after
it has operationally integrated with U.S. Airways.3 This level of consolidation has resulted in
greater market concentration, and the data shows that market concentration increased by an
average of 12 percent across all city markets between the pre- and post-merger periods of the
United-Continental Airline merger.
Mergers have been sought after by many airlines because they present the opportunity for
greater operational efficiency. Among other benefits, they enlarge the number of destinations
1 Rowell, David. “The Collapse of Airline Competition – A Visual Analysis.” The Travel Insider. 7 Mar
2013. http://blog.thetravelinsider.info/2013/03/the-collapse-of-airline-competition-a-visual-analysis.html 2 “United ends 2011 as world's largest airline as Emirates encroaches on the number three spot.” Centre for
Aviation. 9 Dec 2011. http://centreforaviation.com/blogs/aviation-blog/united-ends-2011-as-worlds-
largest-airline-as-emirates-encroaches-on-the-number-three-spot-64324 3 Martin, Hugo. “American Airlines – US Airways Merger Formally Announced.” The Los Angeles Times.
14 Feb 2013. http://articles.latimes.com/2013/feb/14/business/la-fi-mo-american-us-airways-merger-
announced-20130214
[5]
reached by the airline and increased the frequency of flights between destinations, all without
requiring additional investment. In addition, they allow the airlines to streamline their operations
in a more flexible and cost-effective manner as they struggle to deal with cost-related issues from
high fuel prices and salaries (Carbaugh and Ghosh 2010). These high costs, combined with
relatively limited demand and competition from low-cost carriers, have posed challenges for
airlines trying to maintain profitability, and the four largest U.S. legacy carriers– US Airways,
American Airlines, United Airlines and Delta Airlines – were all forced to declare bankruptcy at
some point over the past 15 years. Airlines that have merged have been more profitable, and
many have argued that the increased efficiency and profitability that result from mergers will be
passed on to consumers through lower prices and better efficiency.
However, there are concerns that such horizontal mergers, which decrease competition,
can increase the market power of the newly merged airline, resulting in price increases and a
drop in consumer welfare. Previous studies, such as Beautel and McBride (1992) and Kwoka and
Shumilkina (2010) have found that the greatest price effects are likely to be felt on flights
between cities where both merging airlines used to hold substantial market power and were the
main competitors, and in cities where the market share of the merging airline is high and there
are barriers to entry for other airlines. Moreover, the fact that a very small number of airlines
dominate most of the industry could change the manner in which they compete against each
other, and has the potential to undermine competition altogether. Decisions to allow a merger at
a given point in time can potentially encourage future mergers within the industry, as airlines
often see mergers as a way of remaining competitive with their newly-merged competitors. It
also becomes challenging for antitrust authorities to deny a future merger after having already
approved a similar one in the past. Airlines are more likely to engage in anticompetitive and
[6]
exploitative behavior when there is significant market concentration, and when potential
competitors face barriers to entry (some of which can be erected by firms that control the
market). While consolidation may have not yielded significant price increases for many previous
mergers, questions have been raised as to how much longer this can hold as the number of
competitors continues to dwindle.
The potential benefits and drawbacks of mergers are weighed by the U.S. Department of
Justice when it reviews airline mergers. The Clayton Act prohibits mergers that substantially
reduce competition or create monopolies, and federal authorities are tasked with carefully
analyzing the potential effects of mergers to prevent those that might violate this law. In recent
years, the Department of Justice has tended to permit mergers if the merging airlines agree to
exchange their slots at populous and concentrated airports. The government agreed not to contest
the United-Continental Airline merger after Continental Airlines agreed to lease 18 slots at
Newark Liberty International Airport (a major hub for both United and Continental Airlines) to
Southwest Airlines. The Department of Justice later took a similar approach in 2013 to the U.S.
Airways – American Airlines merger, when it dropped its antitrust lawsuit after the merging
airlines agreed to give slots at Washington Reagan National Airport (a U.S. Airways hub) to
Southwest Airlines.
The other dimension that has relevance to the United-Continental Airline merger is the
fact that United and Continental Airlines had a codeshare agreement for two years prior to their
merger. This agreement effectively allowed both airlines to sell seats on each other’s flights and
cross-honor membership in frequent-flyer programs. While previous research has found
codeshare agreements to decrease prices, particularly when the codesharing airlines are
competing against each other on a given aircraft for the most price-sensitive passengers, it is not
[7]
immediately clear that this is the case among all codeshare agreements, and between all city
pairs. Concerns have been raised over the impact of such agreements on the prices of itineraries
between hubs of the partners, as well as the use of agreements that allow unfettered sales of seats
on the planes of partners.4 Moreover, while codeshare agreements offer consumers many of the
advantages that mergers provide, they also have drawbacks similar to those outlined. Unlike
mergers, codeshare agreements do not need prior approval, although the U.S. Department of
Transportation reviews major codeshare agreements to guard against unapproved cooperation
between the airlines involved.
While codeshare agreements and mergers parallel each other in some of their benefits and
drawbacks, there are some tradeoffs between each of them. On the one hand, codeshare
agreements have the potential to be more anticompetitive than mergers because they are attract
less scrutiny than antitrust authorities, and because the cost of implementing a codeshare
agreement is substantially lower than the cost of merging. On the other hand, codeshare
agreements do not allow cooperating airlines to capture the type of market power that is possible
with a merger. As a result of this tradeoff, it is not immediately clear whether codeshare
agreements are more anticompetitive than mergers. While mergers are traditionally believed to
be have greater potential for anticompetitive behavior than codeshare agreements, it could be the
case that diminished enforcement enables codeshare airlines to take greater advantage of their
market power gains than would be possible with a merger. The overall effects cannot be solely
determined using a theoretical framework; an empirical analysis is needed to identify how the
competing effects balance when a codeshare arrangement is replaced with a merger.
4 Leandro, Solange and Ruttley, Philippe. “European Union: Code Sharing Come under Commission
Scrutiny.” Mondaq. 12 July 2012.
http://www.mondaq.com/x/186372/Aviation/Code+Shares+Come+Under+The+Commissions+Scrutiny
[8]
A preliminary look at the data suggests some reasons to be concerned about the effects of
the United-Continental Airline merger. Between the four months preceding the merger and four
months after the merger, the average market experienced a 21.02% increase in prices. Markets
dominated by United and Continental Airlines (where more than 80% of passengers flew on
either airline) experienced an average price increase of 27.8%. Although the average price
change was the same for markets ticketed by both United and Continental Airlines and markets
lacking a joint presence, the median price change was a 19.49% increase in joint-ticketed
markets (compared to a 13.54% increase in markets lacking such a joint presence). Markets with
United/Continental codeshare products also experienced a greater median increase in prices
(18.85%) than those lacking codeshare products (11.41%).
The goal of this paper is to contribute to recent literature that evaluates the mergers.
While there have been several papers which examine the anticipated price effects, there are
relatively few papers that have looked at the effect of a merger on both the fares in markets
where codeshare itineraries exist, and on the price of products. To my knowledge, this would be
the first paper to evaluate the impact of the United-Continental merger on codeshare itineraries,
and to analyze the role that pre-merger market concentration plays in the merger’s effect on
codeshare itineraries. This would likely be the first paper to evaluate a merger’s effects on
codeshare products by using actual pre- and post-merger data.
The information yielded by this analysis is likely to be of relevance to the Department of
Justice in its review of future mergers, since it sheds light on the empirical effects that a merger
might have on cooperative ventures between merging firms. These effects are likely to increase
in magnitude as more passengers take advantage of the lower prices that codeshare agreements
offer. A close look at these effects can provide insight into markets that are most likely to
[9]
experience adverse effects, and this information can be used to direct the type of remedial action
that the Department of Justice can require of merging firms.
2. Literature Review
Many intuitions and aspects surrounding the questions posed in this paper, and the
econometric methods used to answer these questions, stem from previous research. Hence, a
review of relevant literature is provided individually for mergers and codesharing, as well as for
previous attempts to understand the effects of mergers on codeshare agreements.
MERGERS
Ever since the airline industry was deregulated in the late 1970s, the number of airlines
competing against each has fallen as many airlines have found that it is often inefficient and
unprofitable to operate alone. This has led to the rise of mergers and other forms of cooperative
arrangements, such as codeshare agreements, antitrust immunity, and alliances. Beutel and
McBride (1992) point out that, among other effects, mergers allowed airlines to create hub-and-
spoke systems of air travel, thus increasing efficiency by allowing airlines to expand their
networks in a more cost effective manner, and also ensuring that more seats were likely to be
purchased on each flight. At the same time, Beutel and McBride notes that mergers also led to
increased market concentration, both due to the smaller number of competing firms and also due
to the fact that airlines were able to dominate in markets to and from their hubs.
Citing these effects, Beautel and McBride sought to clarify the effect of carrier market
power on post-merger fares, arguing that it is the increase of the carrier’s market power that will
determine whether or not the airline might have anticompetitive effects. Using the Northwest-
[10]
Republic Airline merger, the paper used pre-merger data to estimate the market power effects at
one of their hubs. The paper found that the merger would increase the market power of Republic
Airlines at the airport, and that the ability of Northwest Airlines to set fares would decrease.
Kwoka and Shumilkina (2010) further explored the potential competition effects by
evaluating the fare impact in cases where a merging firm was, as a result of the merger, able to
prevent its partner firm from entering markets that it was capable of entering. It found that in the
case of the US Airways (then known as USAir) and Piedmont Airline merger – a merger which
had plenty of entrance opportunities for both merging firms, according to the authors – fares
increased by 5 to 6 percent in such cases of blocked competition, and that the fare increase was
greater on routes where both firms had actually competed prior to the merger.
Morrison (1996) also evaluated the USAir and Piedmont Airline merger, in addition to
two other mergers, but instead used data for a much longer time span (7 years before the merger
and 8 years after the merger), and found that while the mergers did decrease competition on
many routes, any price increases caused by them in the short run tended to lessen in the long-run,
and mergers tended to yield positive benefits overall (with the notable exception of the US
Airways and Piedmont Airlines merger, arguably for the reasons outlined in Kwoka and
Shumilkina (2010)). This result is noteworthy since it shows that the true impact of a merger,
including the United-Continental Airline merger, may not necessarily be known for years to
come. That being said, Morrison (1996) does acknowledge that it is difficult to attribute long-run
data to the merger itself, given that plenty of time would have elapsed since the merger and
events unrelated to the merger may have transpired.
Based on the literature presented so far, and the merger literature that will be presented
later in this paper, it is clear that while mergers can lower prices due to improved efficiency,
[11]
price increases may also be experienced in certain markets, particularly where the merging
airlines used to compete, where they are now barred from competing, and where it is difficult for
other airlines to enter. These differentiated effects mean that a merger analysis will have to
incorporate some variables to understand the level of competition in a given market and for a
given product in order to understand how the merger might influence some markets and some
products differently.
It is finally worth noting the distinction in how mergers have been analyzed. Beautel and
McBride (1992) analyzed mergers by conducting merger simulations. This method involves
preparing a supply and demand model to predict firm and market behavior. The method also
might involve a counterfactual study (i.e. to see what would happen if the merger did not occur).
Peters (2006) conducted an analysis to examine merger simulation methods commonly used. In
his analysis, he used pre-merger data to predict the price effects of five mergers that occurred
from 1986-1987 (including those evaluated by the papers mentioned earlier), and compared the
predicted effects under standard simulation methods with the actual post-merger data effects,
finding that standard models are generally inaccurate in their merger predictions. He argued that
more flexible models of firm conduct should be incorporated into models analyzing mergers,
since deviations from the conduct that is presumed under the standard models accounted for the
largest differences between estimated and actual post-merger data.
Following Morrison (1996) & Kwoka and Shumilkina (2010), this paper will not
incorporate a theoretical model, and will instead consist of a before-and-after analysis by
analyzing both post-merger data and pre-merger data. This method has the benefit of allowing
the actual effects of the merger to be examined, as opposed to the predicted effects. Although
such data only emerges after a merger has taken place, the analysis is nevertheless still valuable
[12]
in providing insight for antitrust authorities in the process of approving future mergers, as well as
in critiquing any theoretical pre-merger analyses which may have been conducted.
CODESHARING
Over the past 15 years, codesharing and codeshare alliances have greatly increased in
prevalence, sparking interest into their competitive effects. Most literature evaluating them
initially focused on codeshare agreements in international markets, and there was plenty of
evidence to suggest that such arrangements were beneficial. Brueckner (2003) evaluated the
effect of cooperative measures, such as codesharing and antitrust immunity (a government-
endorsed arrangement which allows airlines to collaborate in setting prices on international
trips), on airline fares, finding that both cooperative measures resulted in fare decreases, although
the decrease was smaller when both were combined. This cross-sectional study was expanded in
Whalen (2007), which conducted a panel data analysis on this question and found that the price
difference, while lower in markets with cooperation, was not as great as that found under a cross-
sectional study of this question.
The lower prices on international codeshare agreements have been frequently attributed
to the elimination of double-marginalization that would ordinarily exist when two different
airlines were setting prices independently for separate portions of the same trip. As a result, it has
been assumed that codeshare agreements led to greater product efficiency, and the benefits of
these were passed down in the form of consumer benefits. This assumption was challenged by
Chen and Gayle (2007), which found that double marginalization was not eliminated in markets
where each codeshare partner was competing against each other.
[13]
In recent years, literature has emerged on the changing nature of codeshare agreements.
While codeshare agreements traditionally involved flying on a flight operated by the ticketing
airline for a portion of the trip, newer codeshare agreements meant that it was possible to never
travel on a flight operated by the ticketing airline. This was because traditional codeshare
agreements always involved a layover, while the “virtual” agreements did not necessarily
involve one (Ito and Lee (2007) claims that the vast majority do not). As a result of this
development, it was not clear whether the benefits of codeshare agreements, such as the
elimination of double-marginalization actually applied to the virtual agreements. In spite of this,
Ito and Lee (2007) found that virtual codeshare itineraries had lower prices than itineraries that
were operated by the ticketing airline (i.e. “online” trips). They concluded by stating that
codeshare agreements may be used by airlines as a mechanism to compete for passengers on a
given operating flight. Moreover, since passengers travelling with a codeshare ticket are often
ineligible for certain travel perks that are extended to those travelling on a flight operated by the
ticketing carrier, such as free upgrades, codeshare products are often regarded as an inferior
product.
Given that United and Continental Airlines had a codeshare agreement for two years
prior to their merger – the agreement was signed in June 2008 – and given that codeshare
products are deemed to be inferior to online products, the question over how their prices will
change subsequent to a merger is raised, as is the question over how the change will be different
from that of an online product. The research in this paper will primarily focus on virtual
codesharing, rather than traditional codesharing, since virtual codesharing is more prevalent in
the domestic airline industry.
[14]
MERGERS, ALLIANCES, AND CODESHARING
The question of how codeshare agreements are influenced by the merger of the partner
airlines was first raised and explored by Brown (2010), which conducted a series of
counterfactual experiments (measuring varying degrees of possible efficiency gains) to analyze
the anticipated effect of the Delta – Northwest Airline merger, based on demand estimates that
were determined using pre-merger data, as well as product-level marginal costs that were
determined based on these demand estimates and by assuming price-setting behavior. Like the
United-Continental merger, the Delta- Northwest Airline merger also involved two airlines that
had a codeshare agreement with each other. Unlike other papers, which have tended to look only
at city-market pairs, Brown (2010) also looked at products, which were specific by origin,
destination, operating airline, ticketing airline, and number of stops, as well as the price effect of
changes in codeshare arrangements (or lack of such changes).
Ultimately, Brown (2010) found that price increases would be largely contained in
markets with high concentration of Delta and Northwest Airlines, as well as on Delta &
Northwest Airline products. It also found that Delta-Northwest codeshare products would likely
have a higher price increase than online products, and that codeshare products which become
online products will have a higher price increase than codeshare products that do not change
after the merger. Brown (2010) attributed these results to the fact that codeshare products tend to
cost less than their online counterparts, and therefore would see a larger price increase (when
they become online) than online products which remain online after the merger. Brown (2010)
also noted that the fact that the elimination (or reduction) of codeshare opportunities which
accompanies mergers might reduce competition on a given flight and in a given market, thus
making it more profitable for airlines to raise fares on those respective flights and markets.
[15]
In a more recent paper, Luo (2013) attempted to further explore the question raised by
Brown (2010) with pre- and post-merger data for the Delta – Northwest Airline merger, but only
on a city-market level. Luo (2013) conducted a series of difference-in-differences regressions of
the price changes against variables accounting for changes in the markets between the pre- and
post-merger periods, such as changes in the numbers of legacy and low-cost carrier and dummy
variables accounting for changes in the presence of Delta and Northwest Airlines. Ultimately,
Luo (2013) found that the merger would generate statistically significant (albeit small) price
increases across city markets, and that these increases were especially high in markets with high
Delta – Northwest Airline concentration. In addition to evaluating the effects of the merger, Luo
(2013) also separately evaluated the changes in prices in markets that formerly contained
codeshare products between Delta and Northwest Airlines, but subsequently only contain Delta
Airlines. The research findings in Luo’s paper indicate that fares in these markets rose by a
greater amount than in all markets containing both Delta & Northwest Airlines prior to the
merger and only Delta Airlines after the merger.
While the results of Luo (2013) address merger-induced market fare changes to see how
they vary based on the presence of Delta-Northwest codeshare products in those markets, they do
not look at the merger’s impact on such products themselves. The study does conduct a
disaggregated analysis to see how Delta/Northwest Airline fares are changed by market-specific
variables, but the analysis does not account for any product specific variables.
The econometric methods that will be used in this paper are adopted in part from
Bamberger, Carlton, and Neumann (2004), which explored the effect of the two airline alliances
on price and competition effects. These methods were later used in Gayle (2008) in evaluating
the Delta-Continental-Northwest Airline alliance. In constructing the model, Bamberger,
[16]
Carlton, and Neumann (2004) used a dependent variable involving the natural logarithm of the
new price divided by the old price. The paper notes that such a definition controls for specific
effects that do not vary by time. Although the paper does not point this out, it also appears that
this definition would also control for price variations that do vary by time, but affect all markets
equally, such as inflation and rising fixed costs. On of the explanatory variables used by
Bamberger, Carlton, and Neumann (2004) was market concentration, as determined through the
Herfindahl-Herschman Index. The paper also looked at the change in the proportion of
passengers flying in non-alliance airlines, and the change in market concentration of non-
merging airlines. The intuition behind looking at non-merging airlines, the paper points out, is to
reduce potential endogeneity that may result if the changes were evaluated using the merging
airlines instead. In deciding to adopt this methodology, Gayle (2008) clarifies that these
endogeneity problems occur due to the possibility that both passenger preference and thus
market concentration could be influenced by one of the alliance airlines simply being more
effective than others in a given market. Both studies found that the domestic alliances resulted in
declining airline fares and had yielded other consumer benefits (such as air traffic increases).
The econometric model used by Bamberger, Carlton, and Neumann (2004) and Gayle
(2008) has yet to be applied specifically to a merger. Given that mergers also involve a supposed
tradeoff between improved product efficiency and reduced competition, it would make sense for
this econometric method to be applied to this scenario. However, this paper will adapt those
methods in order to control for fare changes that might be caused by non-market changes.
Moreover, since the method was used in both papers to analyze changes at the market-level, it
will have to be further modified in order to analyze changes at the product level.
[17]
3. Data
The data is gathered from the Airline Origin and Destination Survey (DB1B), which is a
10% sample of all flight itineraries nationwide and is provided to the U.S. Department of
Transportation directly by airlines on a quarterly basis.5 The data consists of the trip fare, origin,
destination, distance travelled, number of passengers, operating carrier, and ticketing carrier.
The United-Continental merger was publically announced on May 3, 2010. After it was
approved by the U.S. Department of Justice in August 2010 and by shareholders of both
companies in September 2010, the acquisition was finalized in October 2010. However, the
airlines were not fully integrated in their ticketing and operational capacity until March 2012.
Therefore, the pre-merger data will consist of the 4th
quarter data of 2009, and the 1st, 2
nd and 3
rd
quarter data of 2010. The post-merger data will consist of the 3rd
and 4th
quarter data of 2012,
and the 1st and 2
nd quarter data of 2013. The purpose of combining four consecutive quarters of
data in each data period is to ensure that typical seasonal fluctuations in prices and product
offerings are accounted for. A two-year separation between pre- and post-merger periods is used
to account for the time necessary to achieve full operational integration. Many studies evaluating
airline mergers and alliances with pre- and post-merger data (Luo, 2013; Bamberger, Carlton and
Neumann, 2004; and Peter, 2006) also allow approximately 1-2 years between their pre- and
post-merger time periods.
The data was originally presented as a list of market itineraries, which consist of
transactional details of the entire trip purchased by an individual. Trips with layovers were
placed in the same market as trips without them, but trips that truncated in the middle were
recorded in each separate market, based on truncation. For example, a round trip between New
York and Los Angeles would be recorded in two markets; once from New York to Los Angles 5 Data is available at http://www.transtats.bts.gov/Tables.asp?DB_ID=125
[18]
and once from Los Angeles to New York. If the fare was paid in bulk for trips with multiple
truncations, the fare paid for each truncated trip was recorded in proportion to the relative
distance of that trip. If $500 was paid for a round trip between New York and Los Angeles, the
data will indicate that $250 was paid in each market. If there were multiple passengers flying on
the trip, the total amount paid was divided by the number of passengers.
The analysis in this paper was conducted on both a market and product level. A market
consists of an origin and a destination city pair, and is direction-specific. Data for cities located
in metropolitan areas with multiple airports were combined, since the presence of nearby airports
can influence a buyer’s decision in choosing flights. For example, since Baltimore, MD and
Washington, DC are part of the same combined statistical area, data for airports serving both
cities are combined and they are treated as one city. Products consist of specific ticketing and
operating carriers, and specific number of layovers, operating within a specified origin and
destination pair. Itineraries were aggregated into products, and products were aggregated into
city markets.
In order to ensure that the analysis could proceed with minimal complication, several
observations, markets, and products were dropped. All itineraries with market fares that are less
than $25 were dropped because of the increased possibility that alternative means of purchasing
the tickets, such as frequent flyer miles, were used. Itineraries that were ticketed or operated by
either foreign airlines or more than one airline are dropped. Itineraries that were ticketed by very
small carriers (ones that did not issue at least 500 tickets in at least one data period) were
dropped in order to exclude airlines that may not exist to actively compete with most commercial
carriers. As a result, the analysis was restricted to the 19 largest ticketing carriers (or 97% of all
ticketed passengers). Operating carriers that were subsidiaries or sole operators of a ticketing
[19]
carrier were recoded to match that ticketing carrier. At the city market level, all city markets (and
products within those city markets) lacking a United or Continental Airline presence either
before or after the merger, but not both before and after the merger, were dropped. This was to
avoid endogeneity problems that might arise if the market gains or loses a United or Continental
Airline presence between the data periods. Moreover, this ensured that markets lacking a United
or Continental Airline presence in both time periods would still be included, effectively allowing
them to act as control observations. All products located in dropped city markets were likewise
dropped from the product-level analysis. Furthermore, products that did not appear both before
and after the merger were dropped.
In analyzing the effect of the merger on the prices of products, a notable problem arose:
the Continental Airline products that this paper intends to study would disappear after the
merger, due to the disappearance of flights that are ticketed or operated by Continental Airlines.
Therefore, the United Airline equivalence of these products after the merger were paired with the
products operated by Continental Airlines before the merger for the before-and-after regression,
under the theory that flights formerly operated by Continental Airlines would be combined with
United Airlines operations after the merger. Flights ticketed by Continental Airlines but operated
on an airline other than United Airlines were dropped.
VARIABLES
Given the inherently complex and seemingly incomprehensible pricing mechanism used
by airlines, the lack of data on all factors that influences prices, and the amount of variation in
supply and demand pricing factors that are present among different airlines, itineraries, products,
[20]
and markets, it would be nearly impossible to devise an econometric model that can explain
much of the pricing variation. No prior research in this field has succeeded at doing so, and this
paper is unlikely to be the first to do this. That said, this paper incorporates as many relevant
supply and demand factors as possible while attempting to avoid endogeneity problems
associated with the inclusion of certain variables. Fortunately, much of the variation that exists in
both time periods was differenced out by virtue of the econometric methods used. Also, the price
definition used accounts for changes that affect all markets equally (for example, inflation). As a
result, it is the variation in changes between time periods or within only one of the time periods
that risks not being accounted for. Ultimately, the presence of unexplained variation is not
expected to undermine the results.
The data from the Airline Origin and Destination Survey was used to construct a variable
to detect for the presence of either United or Continental Airlines in both time periods, and a
variable to detect for the joint presence of United and Continental Airlines before the merger.
Since the United-Continental Airline merger was among the most significant of aviation events
during the time period between the data sets, these variables were necessary to capture the effects
of the merger as differentiated by firm participation in the market. In the product-level only, a
series of variables were created to indicate whether the merging firms operated or ticketed the
product. A codeshare dummy variable was constructed for each passenger travelling on flights
that were ticketed by United Airlines and operated by Continental Airlines, or on flights that
were ticketed by Continental Airlines and operated by United Airlines. This variable was used to
identify formerly codeshare products in the product-analysis. A separate proportion variable was
used in both the market and product analysis to indicate the percent of passengers travelling on
such a ticket. A market concentration variable was created by adding the squared passenger
[21]
proportion of each market participant (in effect, calculating the Herfindahl-Herschman Index).
Endogeneity was controlled for by separately calculating the change in non United-Continental
Airline market concentration, and the change in the proportion of non United-Continental Airline
passengers. The values for both variables were recoded to 0 in markets completely dominated by
United or Continental Airlines in both time periods.
The dependent variable in both the market and product models was the natural logarithm
of the post-merger price divided by the pre-merger price. The intuition behind using this method
was to control for price changes likely to affect all markets, such as inflation and industry-wide
shocks. The price in each data period was determined by calculating the total revenue yielded by
each market/product, and dividing this by the number of passengers in that market/product.
In order to account for extraneous variables that might influence demand changes for
products and markets, population and income data for city markets was collected respectively
from the U.S. Census Bureau and the U.S. Bureau of Economic Analysis. The data was collected
on four levels in decreasing order: Combined Statistical Area, Metropolitan Statistical Area,
Micropolitan Statistical Area, and county. Each city market was paired with the highest level of
data available to that market. City markets located in multiple statistical areas or counties (at the
highest level of available data) were paired with the highest-level data of the most populous
statistical area or county in that area. The 2010 data was used for the pre-merger period, and the
2012 data for the post-merger period. For each data period, the origin and destination data of
each market were averaged, and the percent change of these averages was calculated.
Data on the price of fuel per distance was collected in order to account for potential
supply changes for products and markets. According to the U.S. Department of Transportation,
[22]
the cost of domestic airline fuel was $2.27 per gallon in 2010, and $3.18 per gallon in 2012.6 The
difference in the cost of fuel between the data periods (or 91 cents) was multiplied by the
distance between each city pair to determine the change in fuel cost associated with each market
in each data period (assuming that each airplane consumes a roughly equivalent amount of
gallons per mile).
SUMMARY STATISTICS
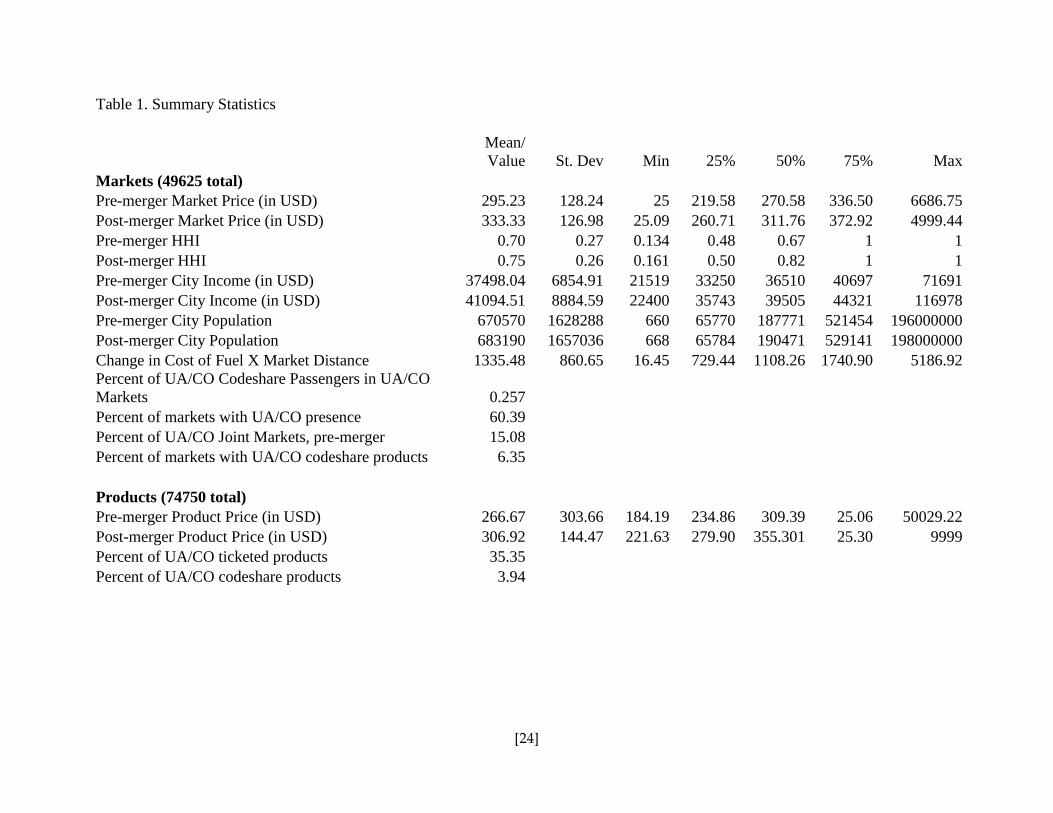
The summary statistics for the variables used in estimation are shown in Table 1. Most
markets experienced an increase in their average prices between the pre- and post-merger data
periods. The average prices increased from $292.23 to $333.33, reflecting a 21.02% increase.
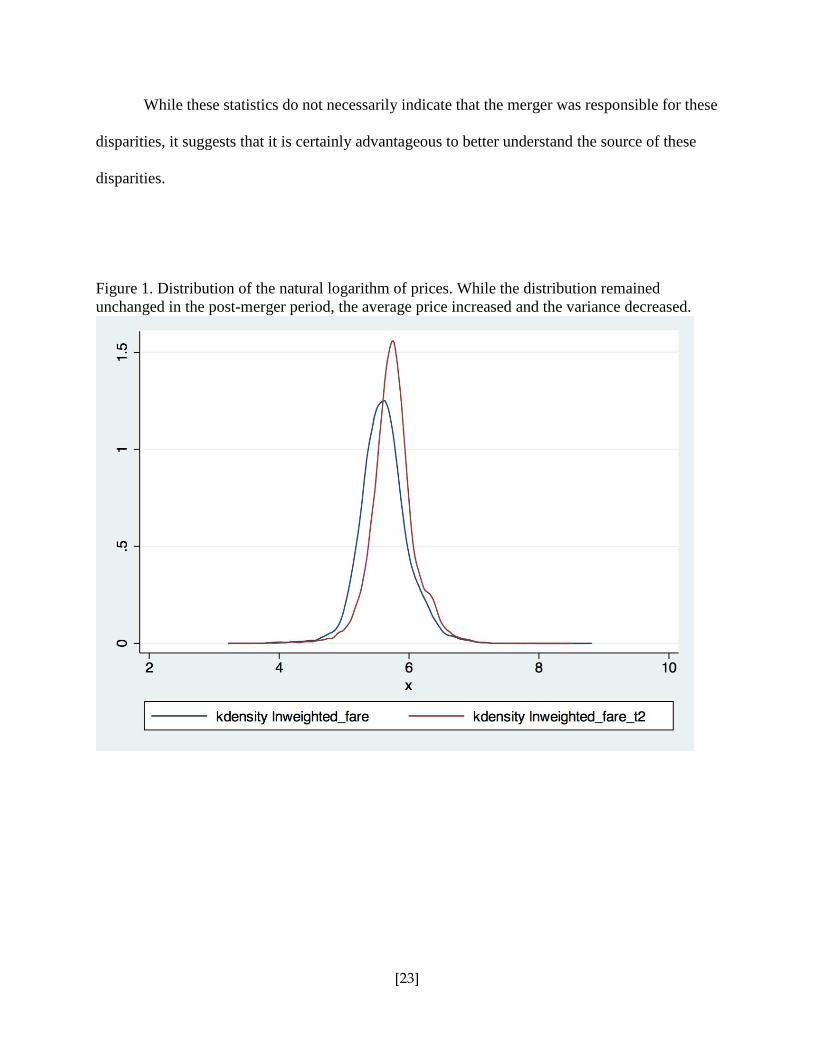
Figure 1 shows that the logarithm of the price distribution is well approximated by a normal
distribution during both merger periods. Although the average price change was the same for
markets ticketed by both United and Continental Airlines and markets lacking a joint presence,
the median price change was a 19.49% increase in joint-ticketed markets (compared to a 13.54%
increase in markets lacking such a joint presence). Markets with United/Continental codeshare
products also experienced a greater median increase in prices (18.85%) than those lacking
codeshare products (11.41%). A similar disparity can be observed in market concentration
changes. While markets lacking a joint presence of United and Continental Airlines prior to the
merger experienced an average 11% increase in market concentration, markets with such a joint
presence saw an average 14% increase, and markets with United/Continental codeshare products
saw an average 13% increase.7
6 “Airline Fuel Cost and Consumption (U.S. Carriers – Scheduled).” Bureau of Transportation Statistics.
http://www.transtats.bts.gov/fuel.asp 7 Statistics for the joint presence of United and Continental Airlines, or for the presence of United-
Continental codeshare products, are not reflected in Table 1.
[23]
While these statistics do not necessarily indicate that the merger was responsible for these
disparities, it suggests that it is certainly advantageous to better understand the source of these
disparities.
Figure 1. Distribution of the natural logarithm of prices. While the distribution remained
unchanged in the post-merger period, the average price increased and the variance decreased.
[24]
Table 1. Summary Statistics
Mean/
Value St. Dev Min 25% 50% 75% Max
Markets (49625 total)
Pre-merger Market Price (in USD) 295.23 128.24 25 219.58 270.58 336.50 6686.75
Post-merger Market Price (in USD) 333.33 126.98 25.09 260.71 311.76 372.92 4999.44
Pre-merger HHI 0.70 0.27 0.134 0.48 0.67 1 1
Post-merger HHI 0.75 0.26 0.161 0.50 0.82 1 1
Pre-merger City Income (in USD) 37498.04 6854.91 21519 33250 36510 40697 71691
Post-merger City Income (in USD) 41094.51 8884.59 22400 35743 39505 44321 116978
Pre-merger City Population 670570 1628288 660 65770 187771 521454 196000000
Post-merger City Population 683190 1657036 668 65784 190471 529141 198000000
Change in Cost of Fuel X Market Distance 1335.48 860.65 16.45 729.44 1108.26 1740.90 5186.92
Percent of UA/CO Codeshare Passengers in UA/CO
Markets 0.257
Percent of markets with UA/CO presence 60.39
Percent of UA/CO Joint Markets, pre-merger 15.08
Percent of markets with UA/CO codeshare products 6.35
Products (74750 total)
Pre-merger Product Price (in USD) 266.67 303.66 184.19 234.86 309.39 25.06 50029.22
Post-merger Product Price (in USD) 306.92 144.47 221.63 279.90 355.301 25.30 9999
Percent of UA/CO ticketed products 35.35
Percent of UA/CO codeshare products 3.94
[25]
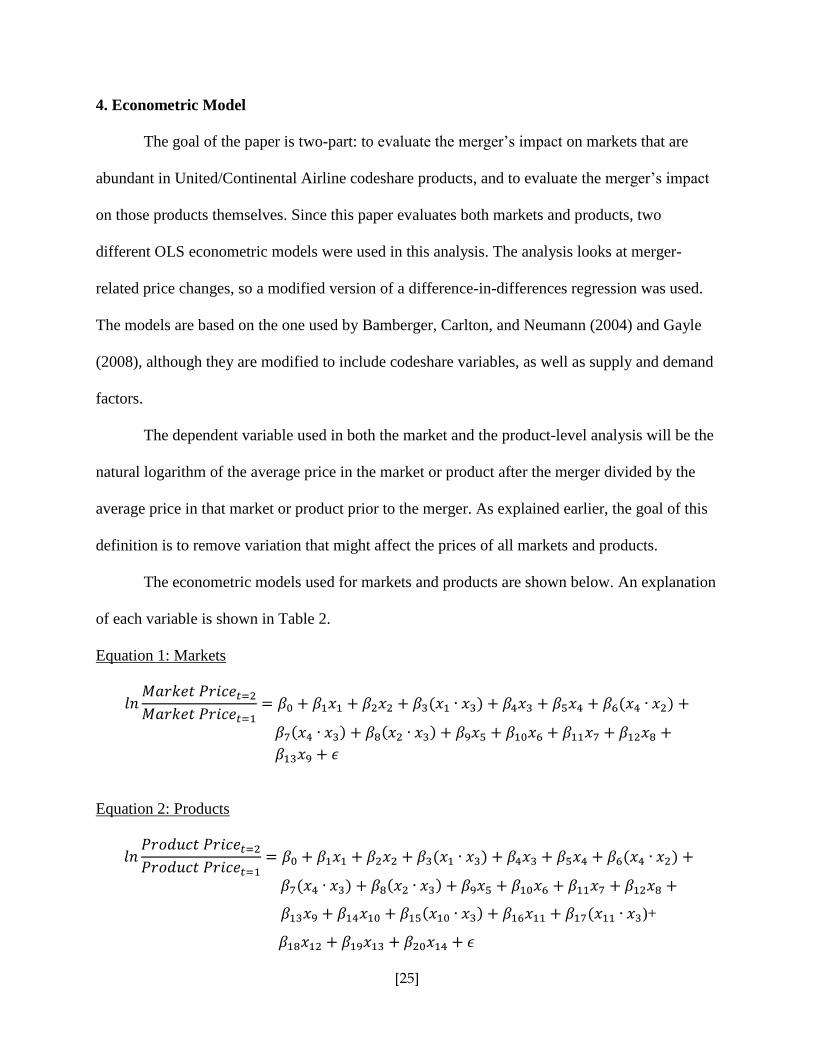
4. Econometric Model
The goal of the paper is two-part: to evaluate the merger’s impact on markets that are
abundant in United/Continental Airline codeshare products, and to evaluate the merger’s impact
on those products themselves. Since this paper evaluates both markets and products, two
different OLS econometric models were used in this analysis. The analysis looks at merger-
related price changes, so a modified version of a difference-in-differences regression was used.
The models are based on the one used by Bamberger, Carlton, and Neumann (2004) and Gayle
(2008), although they are modified to include codeshare variables, as well as supply and demand
factors.
The dependent variable used in both the market and the product-level analysis will be the
natural logarithm of the average price in the market or product after the merger divided by the
average price in that market or product prior to the merger. As explained earlier, the goal of this
definition is to remove variation that might affect the prices of all markets and products.
The econometric models used for markets and products are shown below. An explanation
of each variable is shown in Table 2.
Equation 1: Markets
Equation 2: Products
)+
[26]
Most of the variables in Equation 2 are the same as those from Equation 1, since changes
in market-level characteristics are likely to play a significant role in product price changes. The
disaggregated nature of Equation 2 means that the merger’s effects can be observed on an even
more localized level than in Equation 1; variables accounting for the nature of each product are
included in Equation 2.
In order to detect for potential heterogeneous effects, I interacted all of the market and
product presence variables with the HHI, and all of the market presence variables with the
codeshare proportion variable. I also included an interaction between the codeshare proportion
and HHI variables in order to check for heterogeneity in the codeshare proportion variable.
[27]
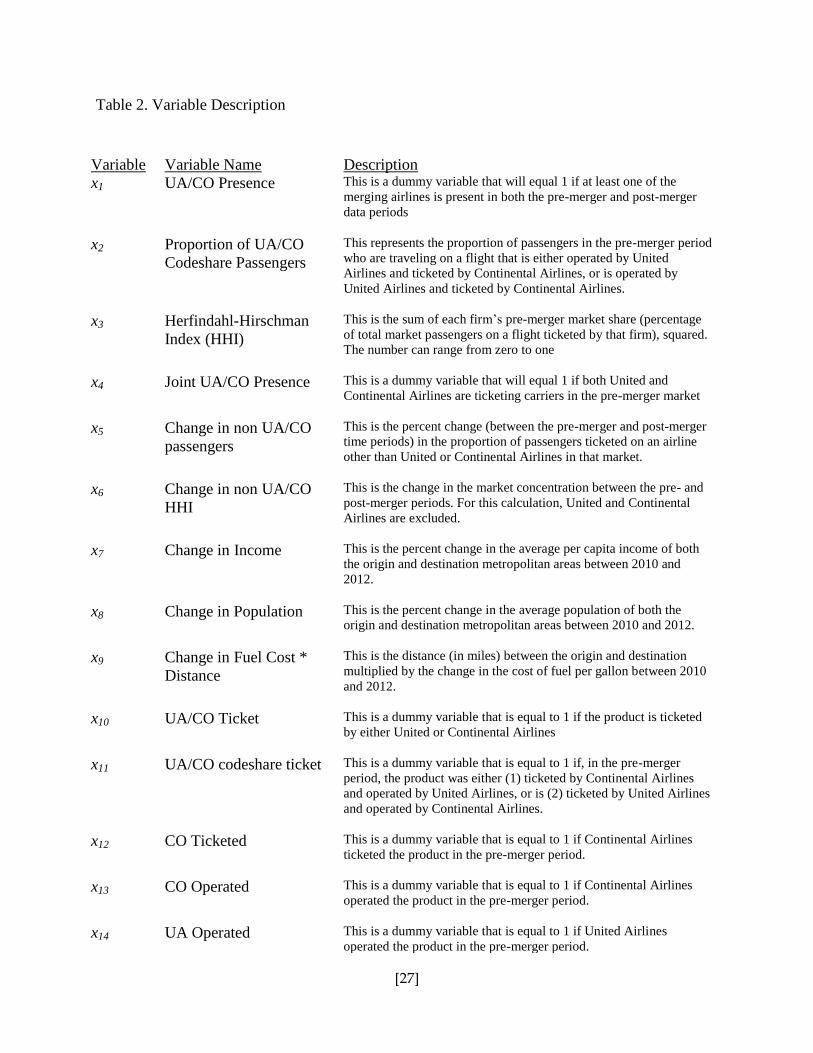
Table 2. Variable Description
Variable Variable Name Description
x1 UA/CO Presence This is a dummy variable that will equal 1 if at least one of the
merging airlines is present in both the pre-merger and post-merger
data periods
x2 Proportion of UA/CO
Codeshare Passengers
This represents the proportion of passengers in the pre-merger period
who are traveling on a flight that is either operated by United
Airlines and ticketed by Continental Airlines, or is operated by
United Airlines and ticketed by Continental Airlines.
x3 Herfindahl-Hirschman
Index (HHI)
This is the sum of each firm’s pre-merger market share (percentage
of total market passengers on a flight ticketed by that firm), squared.
The number can range from zero to one
x4 Joint UA/CO Presence This is a dummy variable that will equal 1 if both United and
Continental Airlines are ticketing carriers in the pre-merger market
x5 Change in non UA/CO
passengers
This is the percent change (between the pre-merger and post-merger
time periods) in the proportion of passengers ticketed on an airline
other than United or Continental Airlines in that market.
x6 Change in non UA/CO
HHI
This is the change in the market concentration between the pre- and
post-merger periods. For this calculation, United and Continental
Airlines are excluded.
x7 Change in Income This is the percent change in the average per capita income of both
the origin and destination metropolitan areas between 2010 and
2012.
x8 Change in Population This is the percent change in the average population of both the
origin and destination metropolitan areas between 2010 and 2012.
x9 Change in Fuel Cost *
Distance
This is the distance (in miles) between the origin and destination
multiplied by the change in the cost of fuel per gallon between 2010
and 2012.
x10 UA/CO Ticket This is a dummy variable that is equal to 1 if the product is ticketed
by either United or Continental Airlines
x11 UA/CO codeshare ticket This is a dummy variable that is equal to 1 if, in the pre-merger
period, the product was either (1) ticketed by Continental Airlines
and operated by United Airlines, or is (2) ticketed by United Airlines
and operated by Continental Airlines.
x12 CO Ticketed This is a dummy variable that is equal to 1 if Continental Airlines
ticketed the product in the pre-merger period.
x13 CO Operated This is a dummy variable that is equal to 1 if Continental Airlines
operated the product in the pre-merger period.
x14 UA Operated This is a dummy variable that is equal to 1 if United Airlines
operated the product in the pre-merger period.
[28]
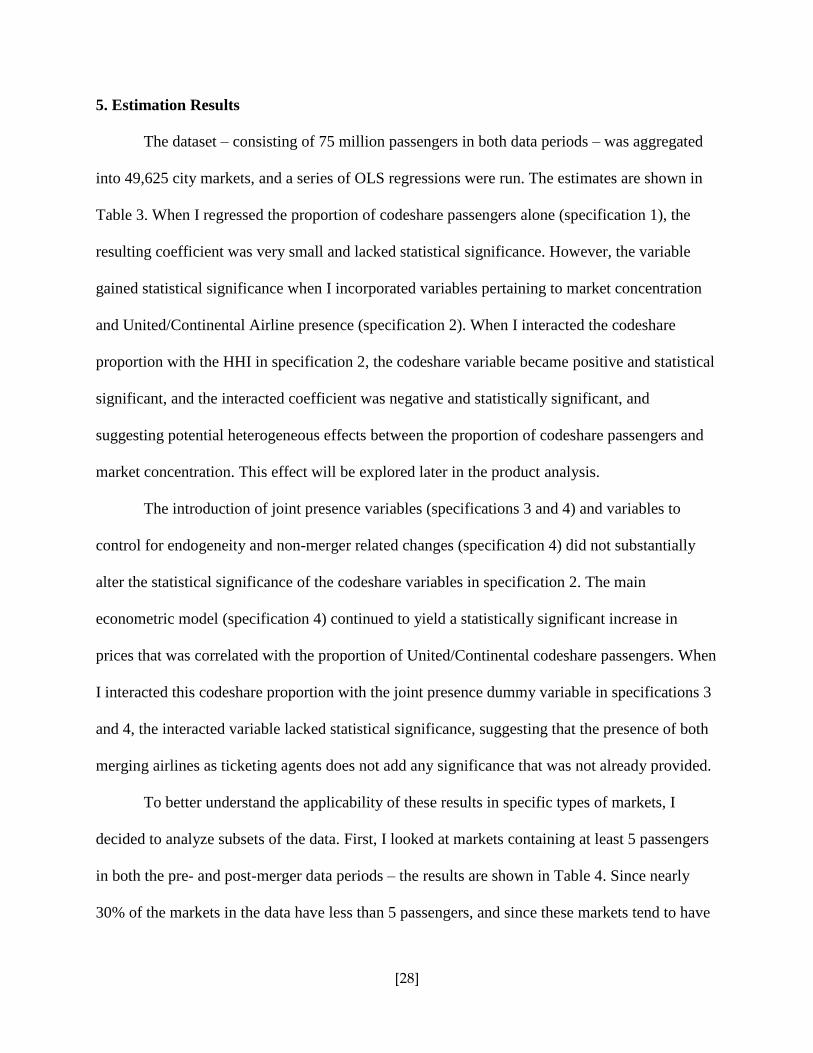
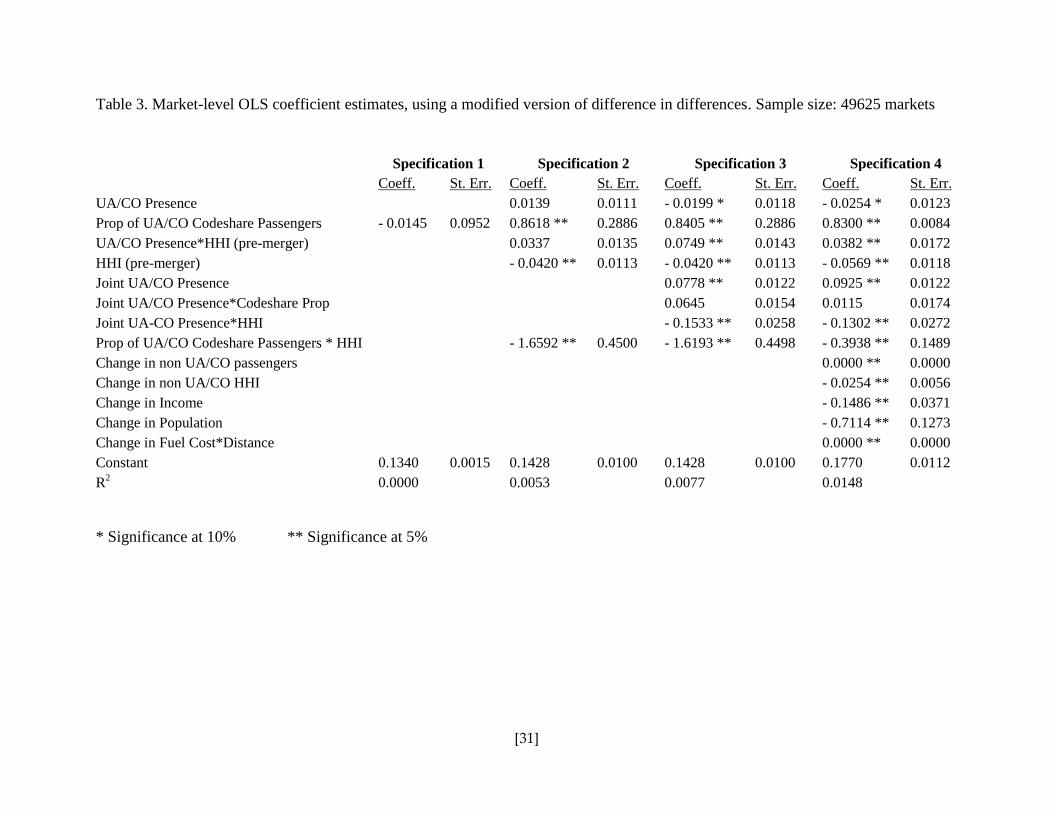
5. Estimation Results
The dataset – consisting of 75 million passengers in both data periods – was aggregated
into 49,625 city markets, and a series of OLS regressions were run. The estimates are shown in
Table 3. When I regressed the proportion of codeshare passengers alone (specification 1), the
resulting coefficient was very small and lacked statistical significance. However, the variable
gained statistical significance when I incorporated variables pertaining to market concentration
and United/Continental Airline presence (specification 2). When I interacted the codeshare
proportion with the HHI in specification 2, the codeshare variable became positive and statistical
significant, and the interacted coefficient was negative and statistically significant, and
suggesting potential heterogeneous effects between the proportion of codeshare passengers and
market concentration. This effect will be explored later in the product analysis.
The introduction of joint presence variables (specifications 3 and 4) and variables to
control for endogeneity and non-merger related changes (specification 4) did not substantially
alter the statistical significance of the codeshare variables in specification 2. The main
econometric model (specification 4) continued to yield a statistically significant increase in
prices that was correlated with the proportion of United/Continental codeshare passengers. When
I interacted this codeshare proportion with the joint presence dummy variable in specifications 3
and 4, the interacted variable lacked statistical significance, suggesting that the presence of both
merging airlines as ticketing agents does not add any significance that was not already provided.
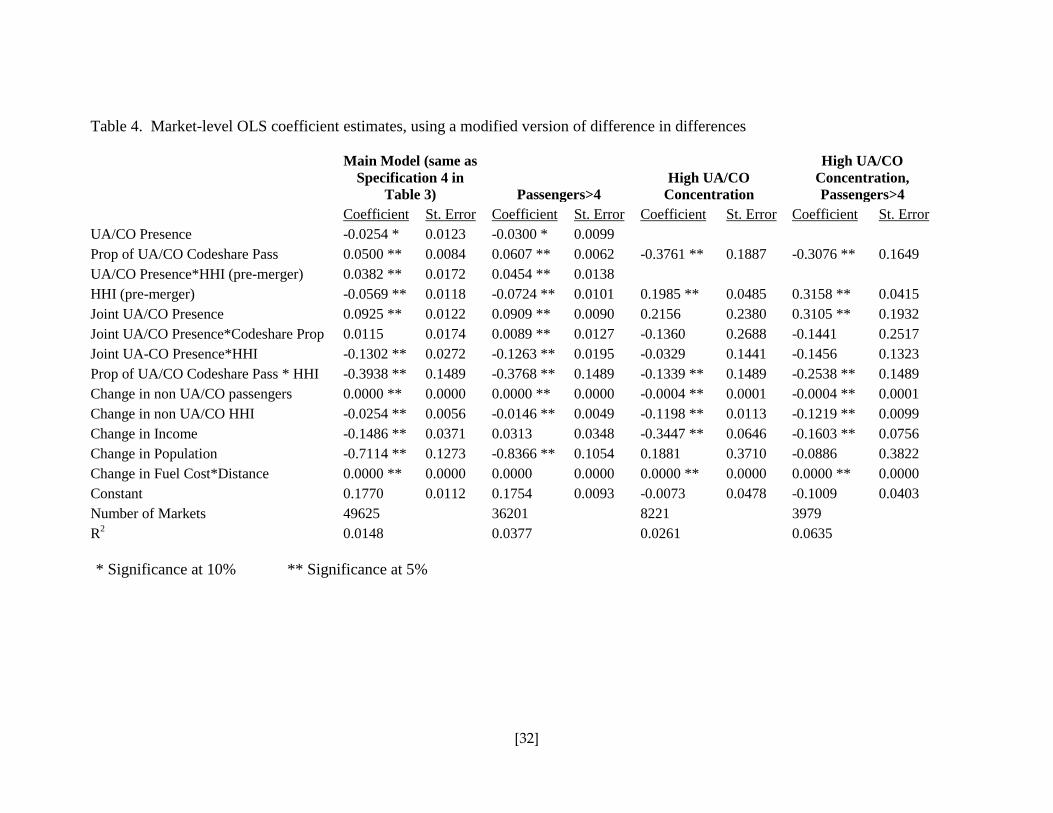
To better understand the applicability of these results in specific types of markets, I
decided to analyze subsets of the data. First, I looked at markets containing at least 5 passengers
in both the pre- and post-merger data periods – the results are shown in Table 4. Since nearly
30% of the markets in the data have less than 5 passengers, and since these markets tend to have
[29]
large amounts of concentration by sole virtue of the lack of passengers (and corresponding lack
of diversity in flight options), I wanted to see if a different trend would be observed when these
markets were removed from the dataset. Ultimately, the coefficients remained largely unchanged
and no variable lost or gained statistical significance under this specification. I ultimately
declined to use this specification due to the lack of any appreciable difference in results.
Next, I looked at markets where more than 80% of passengers flew on either United or
Continental Airlines prior to the merger, in order to see if the merger’s effects on codeshare-
abundant markets and markets with joint competition would be further pronounced. The results
for this specification are shown in Table 4. Previous studies on airline mergers have shown the
merger’s effects to be especially significant in markets where the merging airlines used to both
simultaneously dominate the market and compete with each other, since the landscape of such
markets is more vulnerable to changes. Indeed, much of the current focus by the U.S.
Department of Justice and the U.S. Department of Transportation tends to be on these markets.
The results indicated higher coefficients and stronger significance for the joint presence variable,
which would corroborate the need to remain vigilant about these markets. Interestingly, however,
there was a negative and statistically significant relationship between the abundance of codeshare
passengers and prices in these markets. In light of the potential effect that market concentration
might play in the relationship between codeshare abundance and prices, it is likely that markets
abundant in codeshare products benefit in highly concentrated markets (such as the ones in this
specification). The same results were observed when I restricted my analysis to markets with at
least 5 passengers in both data sets.
While not immediately related to the focus this paper, the estimation results shed light on
some other aspects of this particular merger that have not been documented and are worth briefly
[30]
mentioning. While the presence of either (or both) United or Continental Airlines was correlated
with a statistically significant, albeit very mild, price decrease, the presence of both airlines prior
to the merger was strongly correlated with a price increase (see Table 4, specification 4). These
results, especially when taken with the stronger significance observed in markets dominated by
the merging firms, would corroborate prior research suggesting that it is the markets with former
joint presence that are especially susceptible to price increases, most likely due to the elimination
of a competitor.
The income and population variables were statistically negative in all four specifications,
suggesting that their decreases are correlated with increases in prices. Population and income
decreases were likely to reduce both the demand for flights in the market and the amount that
passengers were willing to spend in that market. While I had initially expected that this would
result in airlines reducing fares to compete for these passengers, the data suggests that airlines
are not likely to take such a measure (presumably out of the risk of incurring losses). It is likely
that population and income decreases profitability in these markets, potentially forcing them to
increase fares.
[31]
Table 3. Market-level OLS coefficient estimates, using a modified version of difference in differences. Sample size: 49625 markets
Specification 1 Specification 2 Specification 3 Specification 4
Coeff. St. Err. Coeff. St. Err. Coeff. St. Err. Coeff. St. Err.
UA/CO Presence
0.0139 0.0111 - 0.0199 * 0.0118 - 0.0254 * 0.0123
Prop of UA/CO Codeshare Passengers - 0.0145 0.0952 0.8618 ** 0.2886 0.8405 ** 0.2886 0.8300 ** 0.0084
UA/CO Presence*HHI (pre-merger)
0.0337 0.0135 0.0749 ** 0.0143 0.0382 ** 0.0172
HHI (pre-merger)
- 0.0420 ** 0.0113 - 0.0420 ** 0.0113 - 0.0569 ** 0.0118
Joint UA/CO Presence
0.0778 ** 0.0122 0.0925 ** 0.0122
Joint UA/CO Presence*Codeshare Prop
0.0645 0.0154 0.0115 0.0174
Joint UA-CO Presence*HHI
- 0.1533 ** 0.0258 - 0.1302 ** 0.0272
Prop of UA/CO Codeshare Passengers * HHI
- 1.6592 ** 0.4500 - 1.6193 ** 0.4498 - 0.3938 ** 0.1489
Change in non UA/CO passengers
0.0000 ** 0.0000
Change in non UA/CO HHI
- 0.0254 ** 0.0056
Change in Income
- 0.1486 ** 0.0371
Change in Population
- 0.7114 ** 0.1273
Change in Fuel Cost*Distance
0.0000 ** 0.0000
Constant 0.1340 0.0015 0.1428 0.0100 0.1428 0.0100 0.1770 0.0112
R2 0.0000 0.0053 0.0077 0.0148
* Significance at 10% ** Significance at 5%
[32]
* Significance at 10% ** Significance at 5%
Table 4. Market-level OLS coefficient estimates, using a modified version of difference in differences
Main Model (same as
Specification 4 in
Table 3) Passengers>4
High UA/CO
Concentration
High UA/CO
Concentration,
Passengers>4
Coefficient St. Error Coefficient St. Error Coefficient St. Error Coefficient St. Error
UA/CO Presence -0.0254 * 0.0123 -0.0300 * 0.0099
Prop of UA/CO Codeshare Pass 0.0500 ** 0.0084 0.0607 ** 0.0062 -0.3761 ** 0.1887 -0.3076 ** 0.1649
UA/CO Presence*HHI (pre-merger) 0.0382 ** 0.0172 0.0454 ** 0.0138
HHI (pre-merger) -0.0569 ** 0.0118 -0.0724 ** 0.0101 0.1985 ** 0.0485 0.3158 ** 0.0415
Joint UA/CO Presence 0.0925 ** 0.0122 0.0909 ** 0.0090 0.2156 0.2380 0.3105 ** 0.1932
Joint UA/CO Presence*Codeshare Prop 0.0115 0.0174 0.0089 ** 0.0127 -0.1360 0.2688 -0.1441 0.2517
Joint UA-CO Presence*HHI -0.1302 ** 0.0272 -0.1263 ** 0.0195 -0.0329 0.1441 -0.1456 0.1323
Prop of UA/CO Codeshare Pass * HHI -0.3938 ** 0.1489 -0.3768 ** 0.1489 -0.1339 ** 0.1489 -0.2538 ** 0.1489
Change in non UA/CO passengers 0.0000 ** 0.0000 0.0000 ** 0.0000 -0.0004 ** 0.0001 -0.0004 ** 0.0001
Change in non UA/CO HHI -0.0254 ** 0.0056 -0.0146 ** 0.0049 -0.1198 ** 0.0113 -0.1219 ** 0.0099
Change in Income -0.1486 ** 0.0371 0.0313 0.0348 -0.3447 ** 0.0646 -0.1603 ** 0.0756
Change in Population -0.7114 ** 0.1273 -0.8366 ** 0.1054 0.1881 0.3710 -0.0886 0.3822
Change in Fuel Cost*Distance 0.0000 ** 0.0000 0.0000 0.0000 0.0000 ** 0.0000 0.0000 ** 0.0000
Constant 0.1770 0.0112 0.1754 0.0093 -0.0073 0.0478 -0.1009 0.0403
Number of Markets 49625 36201 8221 3979
R2
0.0148 0.0377 0.0261 0.0635
[33]
PRODUCTS
A subset of the passenger data was collapsed into 74,750 products. Products that were
operated by Continental Airlines before the merger were recoded to United Airlines in the post-
merger data for the purpose of matching pre- and post-merger data. Many itineraries that were
analyzable in the market-level analysis could not be analyzed at the product-level due to
incomprehensive and unanalyzable information surrounding the operating carrier. This was
especially true for itineraries where the operating carrier changed within the market.
Nevertheless, the products that were analyzed constitute a representative sample of those that
were included in the market-level analysis.
All of the market-level variables were retained in the product-level analysis, since price
changes experienced by products are likely to be attributed to the market it is located in, as well
as characteristics pertaining to the product. The market-level variables remained largely
consistent with those seen in the market-level analysis. Although there were some minor
deviations in coefficient magnitudes and occasionally in statistical significance, this can be
attributed to the fact that the data is being observed on a different level. The estimation results
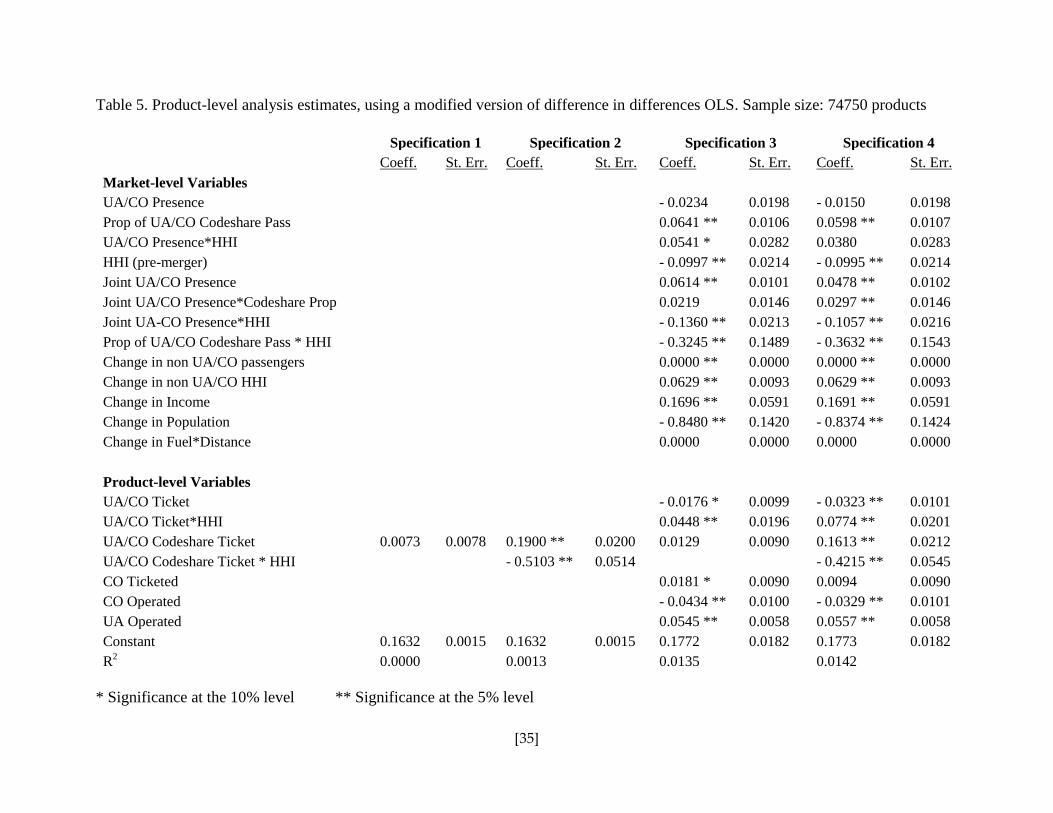
are shown in Table 5.
The most important variable in this analysis was the codeshare variable, which is equal to
1 if the product was (in the pre-merger period) either ticketed by United Airlines and operated by
Continental Airlines, or ticketed by Continental Airlines and operated by United Airlines. Other
product-specific variables were meant to account for varying combinations of potential product
involvement by the merging firms. Specifications 1 and 3 indicated a lack of statistical
significance in the relationship between price and products that were formerly code-shared
between United and Continental Airlines. This was observed when the codeshare variable was
[34]
viewed without any other variable and when it was not interacted with any variable. However,
when I interacted the codeshare variable with the pre-merger HHI of the product’s market, the
codeshare variable became significantly positive while the interacted variable became
significantly negative in all of the product-level specifications – a result that held when the
codeshare and interacted variables were the only ones in the estimation (specification 2), and
when all other variables were incorporated (specification 4). All of these estimations suggest that
codeshare products in highly concentrated markets experienced price decreases while those in
less concentrated markets saw price increases, with the effect that the “average” codeshare
product saw no effect.
[35]
* Significance at the 10% level ** Significance at the 5% level
Specification 1 Specification 2 Specification 3 Specification 4
Coeff. St. Err. Coeff. St. Err. Coeff. St. Err. Coeff. St. Err.
Market-level Variables
UA/CO Presence
- 0.0234 0.0198 - 0.0150 0.0198
Prop of UA/CO Codeshare Pass
0.0641 ** 0.0106 0.0598 ** 0.0107
UA/CO Presence*HHI
0.0541 * 0.0282 0.0380 0.0283
HHI (pre-merger)
- 0.0997 ** 0.0214 - 0.0995 ** 0.0214
Joint UA/CO Presence
0.0614 ** 0.0101 0.0478 ** 0.0102
Joint UA/CO Presence*Codeshare Prop
0.0219 0.0146 0.0297 ** 0.0146
Joint UA-CO Presence*HHI
- 0.1360 ** 0.0213 - 0.1057 ** 0.0216
Prop of UA/CO Codeshare Pass * HHI
- 0.3245 ** 0.1489 - 0.3632 ** 0.1543
Change in non UA/CO passengers
0.0000 ** 0.0000 0.0000 ** 0.0000
Change in non UA/CO HHI
0.0629 ** 0.0093 0.0629 ** 0.0093
Change in Income
0.1696 ** 0.0591 0.1691 ** 0.0591
Change in Population
- 0.8480 ** 0.1420 - 0.8374 ** 0.1424
Change in Fuel*Distance 0.0000 0.0000 0.0000 0.0000
Product-level Variables
UA/CO Ticket
- 0.0176 * 0.0099 - 0.0323 ** 0.0101
UA/CO Ticket*HHI
0.0448 ** 0.0196 0.0774 ** 0.0201
UA/CO Codeshare Ticket 0.0073 0.0078 0.1900 ** 0.0200 0.0129 0.0090 0.1613 ** 0.0212
UA/CO Codeshare Ticket * HHI
- 0.5103 ** 0.0514
- 0.4215 ** 0.0545
CO Ticketed
0.0181 * 0.0090 0.0094 0.0090
CO Operated
- 0.0434 ** 0.0100 - 0.0329 ** 0.0101
UA Operated
0.0545 ** 0.0058 0.0557 ** 0.0058
Constant 0.1632 0.0015 0.1632 0.0015 0.1772 0.0182 0.1773 0.0182
R2
0.0000 0.0013 0.0135 0.0142
Table 5. Product-level analysis estimates, using a modified version of difference in differences OLS. Sample size: 74750 products
[36]
HETEROGENEITY
The heterogeneity between codeshare products and market concentration, especially
when taken with the market-level results that also found heterogeneity between codeshare
abundance and market concentration, suggests that the effect that market concentration has on
the prices of codeshare products might be one to further explore. Since the market-level analysis
revealed a statistically significant negative relationship between market concentration and prices,
and this relationship was maintained even after the codeshare abundance variable was interacted
with the market concentration variable, it is likely that the effect of market concentration on the
prices of that market’s products might be different for products that were formerly codeshared
between the merging firms than for other types of products.
To better understand this phenomenon, I looked at the relationship between market
concentration and prices, separating United/Continental Airline codeshare products from other
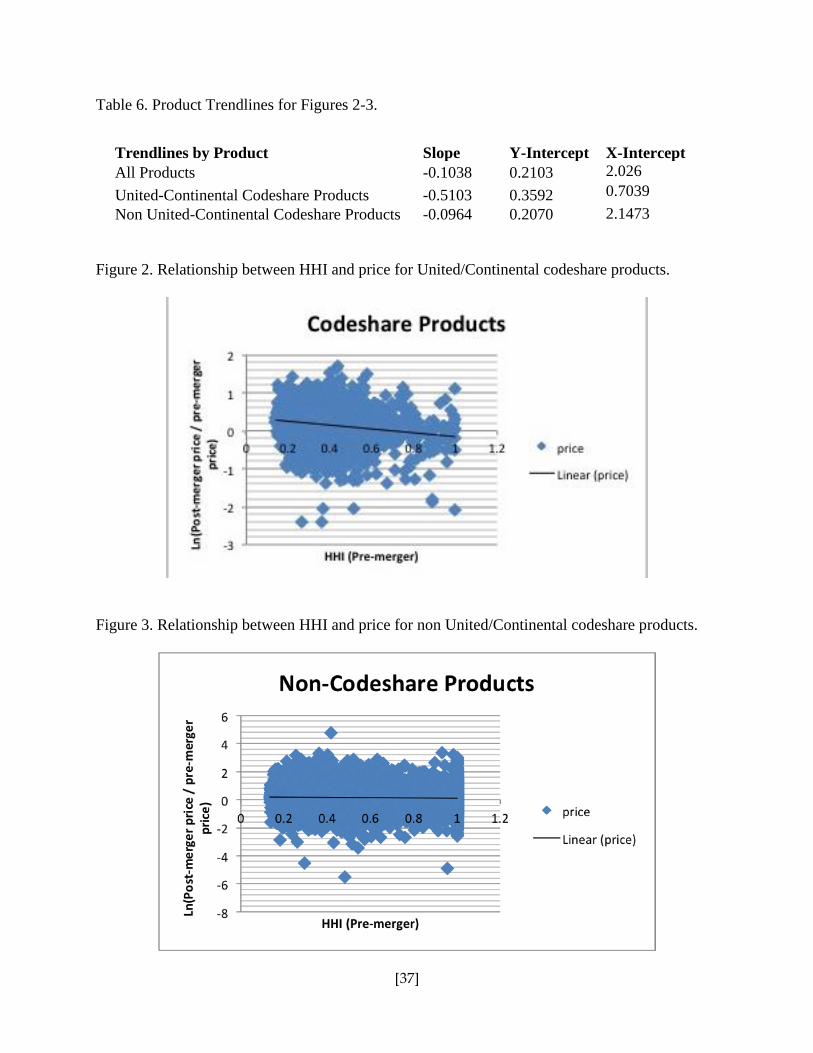
types of products; the results are shown in Figures 2 and 3, as well as in Table 6. I constructed
two-way plots to examine the effect of market concentration on prices. While statistical
significance was observed in both linear relationships, the slope was significantly more negative
for the codeshare products than for non-codeshare products, suggesting that market concentration
plays a greater role in how the prices of codeshare products are affected than in how non-
codeshare products are affected. Unlike in the non-codeshare graph, there actually exists a point
where the line crosses the x-axis, indicating that codeshare products with an HHI level above
0.704 (the x-intercept for the United/Continental Codeshare Product graph, shown in Table 6)
are likely to see price decreases when the merger occurs and the product becomes a United
Airline product.
[37]
Table 6. Product Trendlines for Figures 2-3.
Figure 2. Relationship between HHI and price for United/Continental codeshare products.
Figure 3. Relationship between HHI and price for non United/Continental codeshare products.
Trendlines by Product Slope Y-Intercept X-Intercept
All Products -0.1038 0.2103 2.026
United-Continental Codeshare Products -0.5103 0.3592 0.7039
Non United-Continental Codeshare Products -0.0964 0.2070 2.1473
[38]
6. Conclusion
Overall, the results indicate that products formerly codeshared between the merging
airlines experienced price increases in less concentrated markets after the merger, while their
counterparts in more concentrated markets saw price decreases. Moreover, although markets
with a higher proportion of codeshare passengers experienced an overall price increase after the
merger, a decrease was observed in markets with higher amounts of market concentration. This
finding was observed in the main model, and was corroborated when the data was restricted to
markets dominated by United and Continental Airlines.
These results support the hypothesis that the competition between the merging airlines is
more likely to be significant in markets that aren’t concentrated, and that it loses its significance
in concentrated markets. As such, the elimination of a competitor in non-concentrated markets is
more likely to result in price increases, while the opposite effect may be observed in already
concentrated markets. Codeshare agreements are a form of competition between airlines,
although airlines don’t necessarily compete against each other in every market. The statistically
significant negative effect of joint presence markets interacted with market concentration
provides additional support to this hypothesis.
The findings presented in this paper are among the first to understand a merger’s effects
on codeshare products, and to explore the relationship between codeshare products and market
concentration. As such, they will assist the U.S. Department of Transportation and the U.S.
Department of Justice in their monitoring of codeshare agreements and in their approval of future
mergers. Current evaluation methods tend to focus on highly concentrated markets, such as the
hubs for the merging airlines. The results suggest that they should continue to do so, given the
overall positive relationship between joint merging airline presence and prices, and given the
[39]
stronger coefficient for joint presence that was observed in markets highly concentrated with
United and Continental Airline products. However, the increasing prevalence of codeshare
passengers and products means that non-concentrated markets should receive more attention due
to the potential harm to consumer welfare in these markets.
[40]
Works Cited
Bamberger, Gustavo; Carlton, Dennis; and Neumann, Lynette. “An Empirical Investigation of
the Competitive Effects of Domestic Airline Alliances. Journal of Law and Economics.
Vol. 47, pp. 195-222.
Beutel, Phillip and Bride, Mark. “Market Power and the Northwest-Republic Merger: A Residual
Demand Approach.” Southern Economic Journal, Vol. 58, No. 3, pp. 709-720. January
1992. http://www.jstor.org/stable/1059837
Brown, Dave. “Analyzing the Effects of Mergers between Airline Codeshare Partners.” Three
Essays in Industrial Organization: Alliances, Mergers, and Pricing in Commercial
Aviation. Dissertation. Kansas State University, 2010.
Brueckner, Jan. International airfares in the age of alliances: The effects of codesharing and
antitrust immunity. Review of Economics and Statistics, Vol. 85, No. 1, 105–118.
February 2003.
Carbaugh, Robert and Ghosh, Koushik. “United-Continental Merger.” Journal of Industrial
Organization. Vol. 5, No. 1 (2010).
Chen, Yongmin, and Gayle, Philip. “Vertical Contracting Between Airlines: An Equilibrium
Analysis of Codeshare Alliances.” International Journal of Industrial Organization. Vol.
25, No. 5, pp. 1046-1060.
Gayle, Philip. “An Empirical Analysis of the Competitive Effects of the
Delta/Continental/Northwest Code‐ Share Alliance.” Journal of Law and Economics,
Vol. 51, No. 4, pp. 743-766. November 2008.
http://www.jstor.org/stable/10.1086/595865
Ito, Harumi and Lee, Darin. “Domestic Code Sharing, Alliances, and Airfares in the U.S. Airline
Industry.” Journal of Law and Economics , Vol. 50, No. 2 May 2007, pp. 355-380.
http://www.jstor.org/stable/10.1086/511318
Luo, Dan. “The Price Effects of the Delta/Northwest Merger.” Review of Industrial
Organization. 28 Feb 2013. http://link.springer.com/article/10.1007%2Fs11151-013-
9380-1
Morrison, Steven. “Airline Mergers: A Longer View.” Journal of Transport Economics and
Policy, Vol. 30, No. 3. September 1996. http://www.jstor.org/stable/20053705
Kwoka, John and Shumilkina, Evgenia. “The price effect of eliminating potential competition:
Evidence from an airline merger.” Journal of Industrial Economics, Vol 58, No. 4, 767–
793. 2010.

[41]
Peters, Craig. Evaluating the performance of merger simulation: Evidence from the U.S. airline
industry.” Journal of Law and Economics, Vol 49, No 2, 627–649. October 2006.
http://www.jstor.org/stable/10.1086/505369
Whalen, W. Tom. “A Panel Data Analysis of Code-Sharing, Antitrust Immunity, and Open Skies
Treaties in International Aviation Markets.” Review of Industrial Organization, Vol. 30,
pp. 39-61. February 2007.