Embed Size (px)
Citation preview

The Prevalence of Cybersecurity Misinformation on SocialMedia: Case Studies on Phishing Reports and Zoom’s Threats
Mohit Singhal, Nihal Kumarswamy, Shreyasi Kinhekar, Shirin NilizadehThe University of Texas at Arlington
Arlington, Texas, USA(mohit.singhal,nihal.kumarswamy,shreyasi.kinhekar)@mavs.uta.edu,[email protected]
ABSTRACTRecently, threat intelligence and security tools have been aug-mented to use the timely and relevant security information ex-tracted from social media. However, both ordinary users and mali-cious actors may spread misinformation, which can misguide notonly the end-users but also the threat intelligence tools. In this work,for the first time, we study the prevalence of cybersecurity and pri-vacy misinformation on social media, focusing on two differenttopics: phishing websites and Zoom’s security & privacy. We collectedTwitter posts that were warning users about phishing websites andtried to verify these claims. We found about 22% of these tweetsto be not valid claims. We then investigated posts about Zoom’ssecurity and privacy on multiple platforms, including Instagram,Reddit, Twitter, and Facebook. To detect misinformation relatedto Zoom, we first created a groundtruth dataset and a taxonomyof misinformation and identified the textual and contextual fea-tures to be used for training classifiers to detect posts that discussthe security and privacy of Zoom and detect misinformation. Ourclassifiers showed great performance, e.g., Reddit and Facebookmisinformation classifier reached an accuracy of 99% while Twitterand Instagram reached an accuracy of 98%. Employing these classi-fiers on the posts from Instagram, Facebook, Reddit, and Twitter,we found that respectively about 3%, 10%, 4% and 0.4% of Zoom’ssecurity and privacy posts as misinformation. This highlights theneed for social media platforms to dedicate resources to curb thespread of misinformation, and for data-driven security tools to pro-pose methods to minimize the impact of such misinformation ontheir performance.
CCS CONCEPTS• Security and privacy; • Information systems → Social net-working sites;World Wide Web; • Social and professional top-ics→ Phishing;
KEYWORDSPhishing, Misinformation, Zoom, Security & Privacy, Classification
Permission to make digital or hard copies of all or part of this work for personal orclassroom use is granted without fee provided that copies are not made or distributedfor profit or commercial advantage and that copies bear this notice and the full citationon the first page. Copyrights for components of this work owned by others than ACMmust be honored. Abstracting with credit is permitted. To copy otherwise, or republish,to post on servers or to redistribute to lists, requires prior specific permission and/or afee. Request permissions from [email protected]’17, July 2017, Washington, DC, USA© 2021 Association for Computing Machinery.ACM ISBN 978-x-xxxx-xxxx-x/YY/MM. . . $15.00https://doi.org/10.1145/nnnnnnn.nnnnnnn
ACM Reference Format:Mohit Singhal, Nihal Kumarswamy, Shreyasi Kinhekar, Shirin Nilizadeh. 2021. The Prevalence of Cybersecurity Misinformation on Social Media:Case Studies on Phishing Reports and Zoom’s Threats. In Proceedings ofACM Conference (Conference’17). ACM, New York, NY, USA, 12 pages. https://doi.org/10.1145/nnnnnnn.nnnnnnn
1 INTRODUCTIONRecently, cybersecurity experts use social media to publish thethreat information in real-time. For example, recent research hasshown that 25% of vulnerabilities appear on social media beforethe National Vulnerability Database (NVD) [6]. As a result, socialmedia is seen as a source for extracting timely and relevant securityinformation, and numerous threat intelligence tools, such as Spider-Foot [21] and IntelMQ [19], collect open source intelligence fromthem. Scholars [25, 60, 63, 64, 77, 84, 87] have also proposedmethodsfor identifying new vulnerabilities from social media and updatingsecurity databases.
Additionally, social media is used by non-cybersecurity expertsto express their concerns over the security and privacy of newtechnologies. For example, with the surge in the use of video con-ferencing tools, such as Zoom [7] during the pandemic, came theconcerns about the company handling of security and privacy ofits user base. Users discuss issues, such as Zoombombing [14], andprivate Zoom meetings that can be available to the public [8]. Suchdiscussions can affect how users use these technologies, and howcompanies address these concerns [50].
Prior work has extensively studied misinformation related to po-litical news [59, 74, 83, 86, 104] and public health [31, 51, 54, 62, 68].While the spread of political and health related posts might haveroots in people’s political and cultural views and beliefs, in this pa-per, we investigate if misinformation on technological topics, suchas emerging security and privacy threats, are prevalent. Misinforma-tion in general, can misguide end users, but misinformation aboutcybersecurity and privacy can also mislead data-driven securitytools, such as anti-phishing and malware detection tools.
In this work, for the first time, we examine the correctness ofTwitter posts about newly detected phishing websites. We define aclaim about phishing website misinformation if the phishing linkprovided in the tweet refers to a benign website, and therefore thereport is false. We chose to examine inaccurate reports about phish-ing websites, because: first, phishing is one of the most commonthreats on the web [4, 20], second, many of the anti-phishing toolsrely on reports provided by Internet users [1, 5, 15, 17]. False reportsabout websites can have various consequences, but the most imme-diate effect is the decrease in the websites’ visits, especially if thesewebsites are added to blocklists used by anti-phishing websites. Forinvestigating the correctness of such phishing reports on social
arX
iv:2
110.
1229
6v2
[cs
.CY
] 2
6 O
ct 2
021
Conference’17, July 2017, Washington, DC, USA Mohit Singhal, Nihal Kumarswamy, Shreyasi Kinhekar, Shirin Nilizadeh
media, we employ a multi-step approach, which includes obtainingtweets about phishing, extracting unique URLs, and then regularlychecking them via VirusTotal [11], on PhishTank [5] and manually.
As a second case study, we examine the correctness of Instagram,Reddit, Facebook & Twitter posts about Zoom’s security and privacythreats. During the global outbreak of the COVID-19 pandemic,society has found ways to connect via online video calling apps,such as Zoom, Microsoft Teams, Skype, etc. During this time, we
Figure 1: Claim about Zoom
also observed a great number of discussions on the security andprivacy threats of these technological tools. Not all the discussionswere accurate. We define a post about Zoom’s security and privacythreats as misinformation if it fails the criteria of providing any sup-porting evidence from trusted sources, or if it provides informationthat is fully or partially in contrast with that of trusted sources. Forexample, Figure 1 shows a claim that Zoom is a “Chinese spyingtool.” However, the author has not provided any supporting evi-dence, also, the tweet claims that Zoom does not use any encryptionservice, which is not true on the date this tweet was posted (seethis article [12]). For investigating the correctness of such claims,we employed a multi-step approach, by first obtaining posts fromFacebook, Instagram, Reddit, and Twitter, second, creating a groundtruth dataset, third, identifying the features that make misinforma-tion posts distinguishable from accurate posts, and finally usingthe features to build a classifier that detects misinformation. Toidentify features, we first created a taxonomy of misinformationin our groundtruth dataset using the open coding technique [41],analyzed the meta-data obtained from the posts and authors, andexamined the textual and linguistic features.
With these two case studies,our goal is to understand if thisis a real problem that needs to be considered and mitigated bydata-driven security tools that try to enhance their systems usingdata obtained from social media, and by social media platforms tominimize the spread of misinformation.
Thus, in this paper, we have the following contributions:
(1) For the first time, we studied the problem of misinformationabout phishing claims on social media and showed that theyare prevalent on Twitter.
(2) We presented a new annotated groundtruth dataset for se-curity & privacy issues regarding Zoom, and a Zoom misin-formation taxonomy based on the open source coding.
(3) We developed classifiers that detect misinformation aboutZoom’s security and privacy on four different social mediaplatforms and they all showed very good performances.
(4) Through our analysis, we found that misinformation aboutZoom’s security and privacy is prevalent on Twitter, Face-book, Instagram, and Reddit.
2 RELATEDWORKObtaining new cyberecurity threats from social media. Re-cently, some works have proposed using social media, such asTwitter and Facebook, as the main source of identifying new vul-nerabilities. Alves et al. [25] introduced a Twitter streaming threatmonitor that generates a continuously updated summary of thethreat landscape related to a monitored infrastructure. Okutan etal. [77] integrated tweets with posts from the GDELT news serviceand Hackmageddon to detect new threats related to one of threetopics: Defacement, Denial of Service, and Malicious Email/URL.Sabottke et al. [87] performed a qualitative and quantitative analy-sis of the vulnerability-related information disseminated on Twitter.Sapienza et al. [89] introduced a system that leverages the commu-nication of malicious actors on the darkweb, as well as activity ofcyber security experts on Twitter to automatically generate warn-ings of imminent or current cyber-threats.
Misinformation Detection in Social Media. A large body ofwork has tried detecting fake political news [40, 96, 97, 111], investi-gating various linguistic features [44, 52, 69] as well as deep neuralnetworks [37, 58, 59, 105]. In recent months, scholars have analyzedmisinformation related to COVID-19 [53, 62, 67, 91, 98]. Brennenet al. [31] identified some of the main types, sources, and claimsof COVID-19 misinformation. The authors found that the majorityof misinformation on social media came from ordinary people. Tothe best of our knowledge, our work is the first longitudinal & datadriven study to find misinformation about security claims madeon Twitter about a website being “phishing” and claims made onsocial media that “Zoom” is a security and privacy threat.
Phishing websites. Researchers have extensively addressedphishing attacks by: (1) studying several techniques used by theattackers [24, 28, 32, 34, 42, 46, 47, 66, 100], (2) determining howphishing detection measures fare against these attacks [26, 35, 45,61, 76, 81, 85, 88, 94, 103, 106, 110], and, 3) investigating a myriad ofobfuscation strategies used by the attackers to prevent detection bythese prevention tools. For detecting phishing websites, researchershave proposed mechanisms that rely on URL blocklists [23, 27, 70,75, 95, 99, 101] , and machine learning [48, 80, 82, 88, 108].
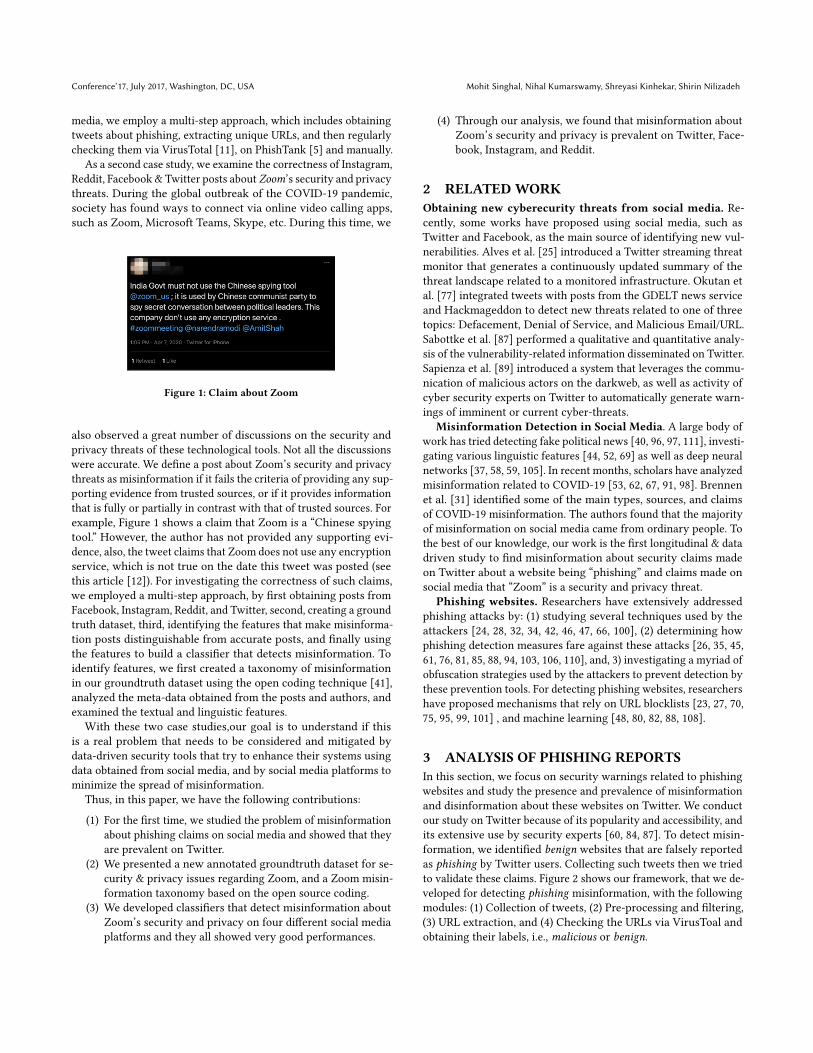
3 ANALYSIS OF PHISHING REPORTSIn this section, we focus on security warnings related to phishingwebsites and study the presence and prevalence of misinformationand disinformation about these websites on Twitter. We conductour study on Twitter because of its popularity and accessibility, andits extensive use by security experts [60, 84, 87]. To detect misin-formation, we identified benign websites that are falsely reportedas phishing by Twitter users. Collecting such tweets then we triedto validate these claims. Figure 2 shows our framework, that we de-veloped for detecting phishing misinformation, with the followingmodules: (1) Collection of tweets, (2) Pre-processing and filtering,(3) URL extraction, and (4) Checking the URLs via VirusToal andobtaining their labels, i.e., malicious or benign.

The Prevalence of Cybersecurity Misinformation on Social Media Conference’17, July 2017, Washington, DC, USA
1. Collection of Tweets with keyword "Phishing"
Daily After Data Collection is Done
2. Preprocessing & filtering collected Tweets
3. Extraction of URLs 4. Check unique URLs via VirusTotal
5. Check benign URLs on Phishtank
6. Manually inspect the benign URL
Figure 2: The framework developed for detecting phishing misinformation on Twitter
(1) Collection of tweets: First module using the Twitter streamingAPI [9] collected 1% sample of daily tweets on Twitter that includethe keyword phishing, from January 11, 2021, to April 11, 2021. (2)Pre-processing and filtering: Second module filtered tweets toobtain those that were posted on the same day, as the Twitter APIprovides tweets posted over the last 7 days. (3) URL extraction:After manually inspecting a random sample of 100 tweets, we foundthat many “phishing” tweets are educational, and are about phishingthreats in general, or provide some stories about phishing events.We also found that the tweets with phishing reports usually includethe obfuscated URL of the potential phishing website, e.g., using“hxxps[:]//xyz[.]com,” or “hXXp:[//]xyz[dot]com.” Therefore, thethird module employed regular expressions to retrieve the tweetswith obfuscated URLs and obtain those tweets claiming about spe-cific websites being phishing websites. We manually checked theobtained tweets and found that the precision of this module is 1,and our final dataset only includes tweets with phishing claims.Finally, we extracted the URLs from these tweets to be validated.
Final Dataset: Our aggregated dataset includes about 165Ktweets with the keyword “phishing,” from which 17,770 tweetsare phishing claims. Since we obtained only phishing claims withobfuscated URLs, our analysis provides an estimate of the preva-lence of misinformation regarding phishing websites on Twitter.
After data collection, onMay 3, 2021, the followingmodules wereemployed: (4) Checking unique URLs via VirusToal: This mod-ule evaluated the URLs daily by passing them through VirusTotalAPI [10]. VirusTotal provides aggregated results for an URL ob-tained from 80 scan engines by third-party security vendors. Givena particular URL, the API [11] returns the labels from all the ven-dors, and it shows the number of scan engines that detected theURL as malicious and benign. Previous work [56, 79] has pointedout that VirusTotal is slow in updating its database and hence thereis a high probability that a website that was flagged as benign onthe first day, be flagged malicious later on. To overcome this limi-tation, the module employed VirusTotal three weeks after the lastday of data collection. Using the results from VirusTotal, the mod-ule labeled each URL either as benign or malicious. (5) Checkingbenign URLs on PhishTank: Since anti-phishing engines canmisclassify malicious URLs as benign, this module further passedall the URLs labeled as benign to PhishTank. PhishTank [5] is afree community-based site, where anyone can submit phishing re-ports. These reports are then validated by some human verifiers,and added to/ removed from the database.
We assume that if a website is active, benign, and not reportedto Phishtank, then with a high probability they are misinformation.(6) Manual inspection of benign URLs: Since it is also possiblethat the malicious URLs have not been reported to the PhishTank,additionally, we manually checked the benign URLs. Particularly,on a virtual machine, we checked whether the URL is mimicking a
login page or prompting users to download something (commonlyknown as Drive-by-Download).
Final Results: Table 1 shows our final dataset.We found a unionset of 11,472 users who posted 17,770 phishing reports on Twitter.In total, among 10,578 unique URLs, we identified 9,603 asmaliciousand 975 (about 9%) as benign, which are corresponding to 13,875 and3,895 tweets, respectively. Therefore, we can conclude that about 9%of all obfuscated URLs, and about 22% of tweets, aremisinformation.We also found that 11,472 unique users with true and 148 uniqueusers with false claims, with 124 users posting a mix of true andfalse claims.
Our results show that the spread of misinformation about phish-ing websites in social media is very comparable with that of mis-information in other domains, specifically health misinformation.For example, previous scholarships [29, 39, 71] have found a similarprevalence of misinformation about vaccines (24%, 25%, and 25%,respectively).
3.1 Accounts and Campaign CharacterizationWe study the visibility of false phishing claims in terms of thenumber of followers and retweets. We also identify and characterizecampaigns against benign websites that are claimed to be phishing.
3.1.1 Descriptive Statistics. Table 2 statistically describes the useraccounts with true and false claims, i.e., those whose claims aboutphishing websites were labeled as true or false, accordingly. If auser had posted both true and false claims, we considered themin both sets. We compared the account characteristics of userswith true claims vs. false claims. To compare features, such asFollowers, Friends, & Tweets, we ran Mann-Whitney U tests becausethey do not follow a normal distribution. We could not reject thenull hypothesis that users with false and true claims have the samedistribution of followers counts, friends count, and tweet counts.We ran chi-square test for the verified variable, and could not rejectthe null hypothesis. We also compared the account characteristicsof these users with random Twitter users and found users postingabout phishing have different characteristics than random users.The results are presented in Appendix A.1.
3.1.2 Spread of Misinformation: Followers Count. The first view-ers of misinformation are followers of the accounts posting falseclaims. From Table 2, you can see that a user with false claims hashad about 35K followers on the date of collection, and the meannumber of followers is about 2K. On May 3rd, we obtained the listof followers. We could not obtain the union set of all followers,because about 34 accounts have made their profiles protected sinceour data collection. In total, these accounts have 172K followers.Interestingly, we found that most accounts posting misinformationare following each other, and only 40 of such accounts were notfollowing other accounts in our false claim dataset. For example,

Conference’17, July 2017, Washington, DC, USA Mohit Singhal, Nihal Kumarswamy, Shreyasi Kinhekar, Shirin Nilizadeh
Table 1: We found 22% of phishing reports to be misinformation, as they were inaccurately reported as phishing websites.
No. ofTweets
UniqueUsers
UniqueURLs
MaliciousURLs
BenignURLs
MaliciousTweets
Benign Tweets(Misinformation)
Accounts withtrue claims
Accounts withfalse claims
17,770 11,472 10,578 9,603 975 (9%) 13,875 3,895 (22%) 11,200 148
Table 2: Descriptive statistics of our final datasets.
Users with true claims Users with false claims
Feature Mean Min Max Median Mean Min Max Median
Followers 6,210 0 ∼ 12𝑀 302 2,049 0 ∼ 35𝐾 426Friends 1,347 0 ∼ 275𝐾 416 1,264 0 ∼ 22𝐾 458Tweets 29,972 1 ∼ 3.4𝑀 4,883 60,293 6 ∼ 2.2𝑀 5,426Verified 0.02 0 1 NA 0.01 0 1 NA
Figure 3: Communities detected in false claim dataset
one such account was following 37 other accounts with false claimswhich was the highest count. Our analysis showed that a lot ofaccounts (about 3%) echoed the false claim (misinformation) andhence further increasing the dissemination of misinformation.
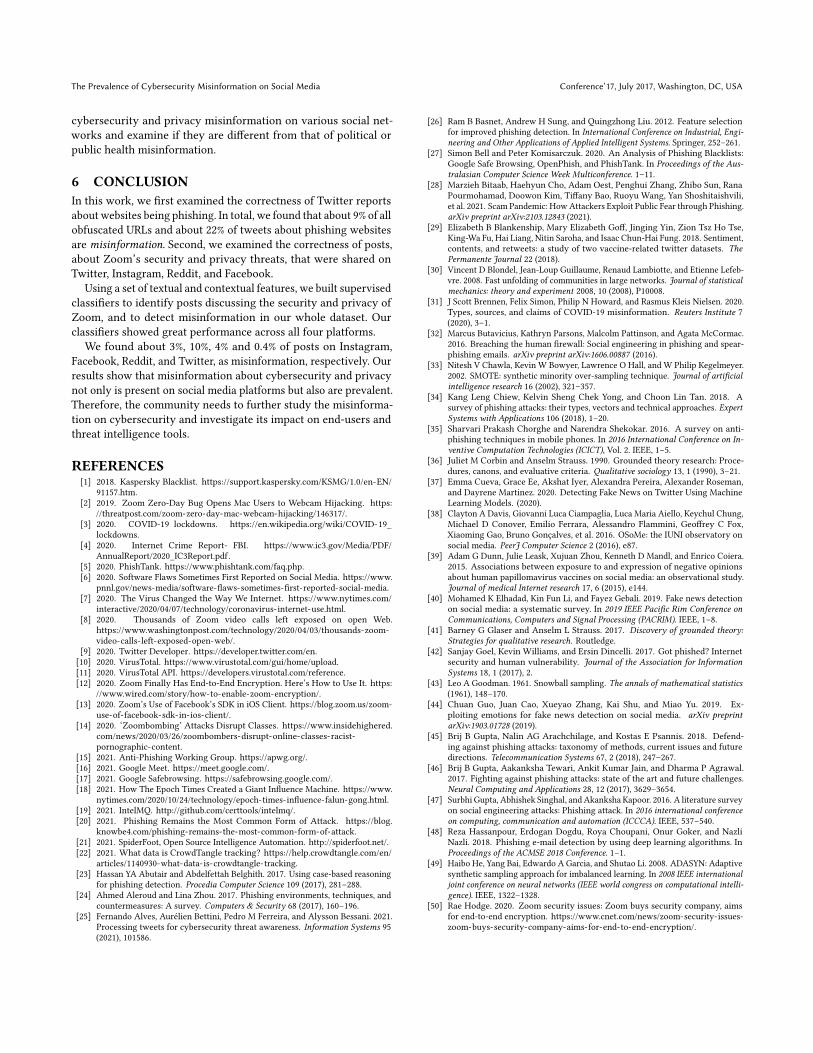
3.1.3 Spread of Misinformation: Campaigns. We constructed a net-work based on following relationships between all users in our falseclaim dataset using the Louvain Community Detection method [30].We considered a directed graph as (x,y) ∈ E does not necessarilymean that (y,x) ∈ E. Figure 3 shows the communities that weredetected. In total, our network has 121 nodes and 618 edges. Thisis only a subset of the users, as we were not able to obtain thefollowers of 34 accounts. The average weighted degree is 5.1. Thelongest shortest path or network diameter between nodes is 9, andthe average path length from one randomly selected node to an-other is 2.47. In total, we were able to obtain 6 communities whichare shown in different colors such as, pink (37 nodes), green (34nodes), purple (22 nodes), red (22 nodes), blue (4 nodes), and lightgreen (2 nodes).
The biggest community shown in pink has 30.58% of all thenodes, while the smallest community shown in light green has only2 nodes. Interestingly, we found that 66 accounts posted the samefalse claims in their community. Also, the community shown inpink contributes to about 51% of the false claims.
3.1.4 Spread of Misinformation: Retweets Count. To capture thespread of false phishing claims beyond an account’s followers, westudied retweet counts for each false claim. Retweets can indicateagreement, endorsement, and even trust [72], therefore retweeting
0 1 2 3 4 5 6 7 8 9 100100200300400500600700800
Num
ber o
f URL
s 642764
233136
69 32 20 12 2 9 9
(a) Retweet counts
1 2 3 4 5 6 7 8 90100200300400500600700800900
Num
ber o
f URL
s
820
12328 10 4 2 1 1 2
(b) Tweet counts
Figure 4: Histogram of retweets and tweets for false claims.
0.0 0.2 0.4 0.6 0.8 1.00
2000
4000
6000
8000
10000
Num
ber o
f Use
rs 9017
550 635 1056 214
Figure 5: Histogram of users based on false claim rate
the false claims can even cause higher damage, as people might trustthe content more. Figure 4a shows the histogram of the number ofretweets for URLs with false claims. Interestingly, we found that764 (67%) of all URLs with false claims were retweeted more thanonce. This can show that: first, some Twitter users have already hadsome level of trust in the accounts posting the false phishing claims,and second, the followers of users, who retweeted the claims, mighttrust the content even more as two accounts have posted it.
3.1.5 Campaign Detection: Campaigns against Specific Websites.Figure 4b shows the histogram of tweet counts for all the websitesin our false claimed dataset. While most of the websites have beenfalsely reported in only one tweet, there are some campaigns wherea phishing claim against a specific website has been tweeted multi-ple times. We identified 32 URLs, that were tweeted more than 3times, by a total of 24 unique users. This suggests the existence ofcampaigns against specific websites.
3.1.6 Campaign Detection: Users with Many False Claims. Figure 5shows the histogram of users with false claims divided by their totalnumber of phishing claims. We found that only a small number ofusers have posted many phishing claims. Interestingly, we foundone user with 650 false claims and 3K true claims. About 78% ofthe users in our dataset, i.e., 8,942 users, have only true claims,while 29 users have only false claims. Also, 502 (4.37%) users havea false claim rate of around 0.5. Almost all of these users have anequal amount of tweets, i.e., one true claim and one false claim (310users) or two true claims and two false claims (174 users). Usersthat have only posted false claims are suspicious and they mighthave maliciously and deliberately sent these tweets.

The Prevalence of Cybersecurity Misinformation on Social Media Conference’17, July 2017, Washington, DC, USA
4 ANALYSIS OF SOCIAL MEDIA DISCUSSIONSABOUT ZOOM’S SECURITY AND PRIVACY
In this section, we focus on social media discussions around Zoom’ssecurity and privacy during the COVID-19 pandemic and studythe presence and prevalence of misinformation regarding it onFacebook, Instagram, Twitter, and Reddit. Analyzing public datafrom multiple social media platforms can help us to investigate howmisinformation is circulated differently on these platforms.
To detect misinformation posts in each social media platform,we developed a binary classifier specific to that platform. Figure 6shows the steps that were employed for building such classifiers: (1)Data collection, (2) Groundtruth and taxonomy creation, (3) Featureselection, (4) Training and testing classifiers, and (5) Detecting themisinformation in each platform.
4.1 Data CollectionIn order to collect data from Facebook, Instagram, Reddit, andTwitter, we used the “posts/search” endpoint of the CrowTangleAPI [102]. The CrowdTangle API provides about 2% of all publicFacebook groups and pages, 2M+ public Instagram pages, and about20K+ of most active sub-reddits [22].
using the Observatory on Social Media API [38], which allowsus to search tweets from the Decahose, a 10% random sample ofpublic tweets.
We restricted our data to English and from June 1, 2019, to Nov.30, 2020, because we wanted to see if users were discussing securityand privacy issues of Zoom before the pandemic, and how the dis-cussions changed when the pandemic started. We initially obtainedposts that include the keyword Zoom.
Table 3: The number of posts in each platform
Platform 2019 2020 After filteringInstagram 42,639 422,874 6,885Facebook 167,718 4,537,280 74,590Reddit 21,250 134,866 9,167Twitter 4,051 114,420 8,127
Pre-processing and filtering: Table 3 shows the data collected fromthe four platforms. Since we collected the posts that included thekeyword “Zoom,” our dataset contained many posts not talkingabout security and privacy. To find additional keywords, we usedthe snowball sampling technique [43]. We started by using a cou-ple of seed keywords, including Zoom, Security, and Privacy. Wethen extracted posts from our dataset for the month of March foreach respective platform. Using the seed keywords, we iterativelyidentified potential keywords that frequently co-occur with theseeds, adding them to our seed list only after manually ensuringthey are closely related to our topic. After saturation was reached,we manually combined keywords into composites. In total, we iden-tified 18 such keywords, namely, Zoom Malware, Zoom Phishing,Zoom Virus, Zoom Security, Zoom Exploit, Zoom Hijacking, ZoomBug, Zoom Hackers, Zoom Privacy, Zoom Backdoor, Zoom Hacked,Zoom Security Bug, Zoom Windows, Zoom Passwords, Zoom Win-dows Steal, Zoombombing, and Zoom Data. We then used our newexpanded keyword list, to filter out the posts. The last column ofTable 3 shows the final dataset that was obtained after our filtering.
4.2 Groundtruth Dataset4.2.1 Groundtruth Creation. For training the classifiers, we firstmanually labeled a subset of the posts on each platform to createa groundtruth dataset. Creating a groundtruth is not a trivial taskbecause we need to verify the correctness of claims and discussions.We used the following three criteria to label the posts: (a) The post istalking about “Zoom,” (b) The post is talking about Zoom’s securityor privacy, and (c) The post is either providing some evidence, i.e.,links, videos, etc., from reputable blogs or articles that are verifiable,or not providing supporting evidence, but we could verify the claimsby cross-checking them with the reputable sources. For that, wechecked the post context and ran a Google search to determine ifthe post context is already addressed by the company or reputablesources and if the claim can be validated. Using these criteria, wedefined three labels: (1) Zoom’s security and privacy: if a post satisfiesall of the above mentioned criteria, (2) Misinformation: if the thirdcriteria is not satisfied, and (3) Irrelevant: if it fails to satisfy eitherfirst or second criteria.
Some examples of the posts that were labeled are shown inTable 11 in Appendix A.2.
4.2.2 Annotation Process. To hand-label the posts, two authorsannotated 13,200 posts (3,300 randomly chosen posts from each ofTwitter, Instagram, Facebook & Reddit). For inconsistent results,coders discussed how to resolve disagreements. To assess the inter-coder reliability, we performed a Cohen-Kappa test [90]. The inter-rater agreementmeasuredwith Kappa scorewas 0.972, which showsalmost perfect agreement. Table 4 shows the groundtruth datasetthat was obtained after the annotation. We can observe that thereare a significant number of irrelevant posts in our dataset, however,we do find evidence of misinformation in our dataset. We found 23instances of users inviting other users to “Zoombomb” their classesor meetings. We found that 20 of these targets were for the platformZoom, while the remaining three were for Google Meet [16].
Table 4: The size of groundtruth datasets per platform.
Platform Zoom security & privacy Misinformation IrrelevantInstagram 545 15 2,740Facebook 560 42 2,734Reddit 1,045 16 2,234Twitter 1,865 36 1,468
4.3 Taxonomy CreationTaxonomies help in understanding and representing data into cate-gories and subcategories. Prior work has successfully implementedtaxonomies to better understand the targets and the types of fakenews and hate speech in the online discourse [57, 73, 109]. This mo-tivates our research to build a taxonomy for misinformation aboutZoom’s security and privacy threats, so that we can understandtheir types and targets, and also can use the information about theircategories and properties as features for classifying the posts.
We created a taxonomy of misinformation about Zoom’s securityand privacy threats, applying the open coding process [41]. Fol-lowing this process, one of the authors coded the misinformationposts identified in the previous subsection until no new categories

Conference’17, July 2017, Washington, DC, USA Mohit Singhal, Nihal Kumarswamy, Shreyasi Kinhekar, Shirin Nilizadeh
3. Textual and contextual feature extraction
2. Pre-process of data1. . Data collection from 4 platforms
Creating a groundtruth dataset
Pre-processing of data
Creating a taxonomy of misinformation posts
Textual features:TF-IDF
Contextual features:Taxonomy based: WC, No. of Nouns, and Verified,etc.Account based:Tweet count, &Account age etc.Reaction based:
Likes, and Comments etc.
Build the model, K-cross validation
5. Detecting misinformation in
each platform
4. Building the classifiers
Train and classify Zoom security and privacy posts
Classify misinformation posts for each platform
Misinformation growth in platform
Campaigns detection
Apply classifer on real world data to detect misinformation
Figure 6: The framework developed for detecting Zoom security & privacy misinformation.
emerged. To improve the quality of the categories, we used an iter-ative process [36], so that new categories were added, or existingones were reorganized. To create the taxonomy, we followed certainguidelines: (1) Read through the posts, and identify themes andsub-themes; (2) While creating the categories, identify the motiveand meaning of the post; and (3) Consider various features that canhelp in the identification of categories.
Table 5: Description of Categories in Taxonomy
Category DescriptionAccusation Accusing various countries and/or businesses of wrong-
doing without relevant evidence.
Misleading Misleading the audience, promoting and solidifying amyth that rejects accepted narrative, is aligned towardsone way of thinking and draws conclusions based on alimited number of facts.
Sources Providing altered videos or photos that are not in thecontext to create confusion; posting URLs that are in-valid or are redirected to a third party site.
Structural Post has all CAPS headline and content, andmisspellingin the content.
Network Has a large audience, is verified by the platform. Twoor more sources show the same news with the samecontext over time.
Security Post is about fake Zoombombing attacks, sponsors no-tion that using Zoom leads to hacking, data theft, leadsto the backdoor for NSA, is malware and suggests noencryption used for chats and using Zoom leads tophishing attacks.
Privacy Post suggests that users are being watched by govern-ment, promotes that user data is being mined by othercompanies, and sponsors the notion that since no en-cryption, anyone can read your chats.
Figure 7 shows the hierarchical structure of the taxonomy. Thetaxonomy has 4 main classes (sources, structural, network & posttype), 4 sub-classes for post type class, i.e., accusation, misleading,security & privacy, and 22 subcategories in total. Table 5 gives ahigh level overview of the description of each of the classes. We dis-covered 4 main topics: (i) Sources: Posts which provide misleadingsources videos, URLs or invalid links to other sites, (ii) Structural:Posts containing irregularities in the content like misspellings or
written in capitalization, (iii) Network: Relates to the reach or per-ceived audience of the author, and (iv) Post Type: subdivided into 3categories talking about security related or privacy terms and textcontaining logic flaws, biased authors, or propagating conspiracy.
After saturation, two authors coded the 206 posts that werelabeled as misinformation. To find the agreement score, we gave avalue of 1, if two or more coders had a perfect agreement, otherwise,we divided the number of labels where two or more coders agreedby the number of possible values. Using this methodology, we founda substantial agreement of 72.3%.
The distribution of these posts among different classes are: Sources(78), Structural (56), Network (12), Accusation (69), Misleading (65),Security (194), and Privacy (98). Note that one post could be as-signed to multiple classes.
Interestingly, during our manual labeling, we found that twoaccounts, i.e., NTD News & Epoch Times, were constantly sharingthe same news, with the same content. New York Times in aninvestigation found that The publication and its affiliates employed anovel strategy that involved creating dozens of Facebook pages, fillingthem with feel-good videos and viral clickbait, and using them to sellsubscriptions and drive traffic back to its partisan news coverage [18].
4.4 Detecting Posts about Zoom’s Security andPrivacy Threats
Initially, we tried to use a multi label classifier to classify posts aseither irrelevant, security and privacy related, or misinformation.We noticed mediocre results with this classifier, possibly due tothe unbalanced nature of our dataset when comparing the numberof misinformation posts with irrelevant posts. We then tried touse a binary classifier to differentiate misinformation posts fromother irrelevant or security and privacy related posts. Similar tothe first classifier model, this also yielded mediocre results due toan unbalanced dataset. We then built a binary classifier to detectZoom’s security and privacy posts.We used the groundtruth datasetcreated in Section 4.2, where we combined the misinformation postswith Zoom’s security and privacy set and labeled them as “0,” andlabeled irrelevant posts as “1.” We built one classifier for each ofthe four platforms as each platform gives a different style of data,e.g., Twitter allows up to 280 characters while there is no constrainton that of Facebook posts. To build our supervised classifiers, weused n-gram features. We found that a mix of uni-gram & bi-gramfeatures provide a better result compared to uni-gram, bi-gram or tri-gram. Before extracting the features, we performed pre-processing

The Prevalence of Cybersecurity Misinformation on Social Media Conference’17, July 2017, Washington, DC, USA
Propgates Consipiracy
Biased
Invalid URLs
Similar Source
URL Redirection
Specific businesses
Hacking Data Theft NSA Backdoor
EncryptionMalware Phishing
Data Mining Encryption
Zoom Misinformation Taxonomy
Sources
Structural
Network
Post Type
Altered Videos/Photos
Post Lingustic
Authors Reach
Verified?
Accusation Specific Nation(s)
Misleading Logic Flaws
Security Zoombombing
Privacy Survillance
Figure 7: Zoom Misinformation Taxonomy
Table 6: Performance of classifiers detecting posts aboutZoom security and privacy.
Platform Accuracy F1-Score Precision Recall
Instagram 0.94(+/- 0.02)
0.93(+/- 0.02)
0.93(+/- 0.04)
0.94(+/- 0.01)
Facebook 0.91(+/- 0.02)
0.91(+/- 0.02)
0.91(+/- 0.02)
0.91(+/- 0.04)
Reddit 0.93(+/- 0.01)
0.93(+/- 0.02)
0.93(+/- 0.02)
0.93(+/- 0.03)
Twitter 0.81(+/- 0.02)
0.81(+/- 0.01)
0.81(+/- 0.03)
0.81(+/- 0.01)
Table 7: Percentage of Zoom’s security and privacy posts.
Platform Zoom’s security & privacy IrrelevantInstagram 551 (15%) 3,034Facebook 11,400 (16%) 59,890Reddit 627 (11%) 5,240Twitter 2,927 (61%) 1,900
on our dataset, removed stop words, emojis, hashtags, and URLs.We vectorized our data using the TF-IDF [55].
Since our groundtruth dataset for each platform was unbalanced(see Table 4), we employed several oversampling techniques, such asRandomOversampler, SyntheticMinority Over-sampling Technique(SMOTE) [33], and Adaptive Synthetic Sampling (ADASYN) [49]using the imbalanced-learn library [65] and we tested multiple clas-sification algorithms such as Random Forests, SVM, Naive-Bayes& Multi-Layer neural network using the scikit-learn library [78].To evaluate our classifiers, we used k-cross validation, where 𝑘 = 3.From our analysis we found that RandomOversampler was the bestfor Instagram, however, SMOTE provides better results for Face-book and Reddit. We did not oversample Twitter data because thegroundtruth for this platform was already balanced. Table 6 showsthe classification performance of Random Forrest classifier as itprovided the best accuracy across all four platforms.
After developing classifiers that can detect posts related to Zoom’ssecurity and privacy, we ran the classifier on the whole datasetobtained from all the platforms. Table 7 shows the number andpercentage of posts that discuss Zoom’s security and privacy. Asyou can see, the percentage of security and privacy-related postsin our Instagram, Facebook, Reddit, and Twitter datasets are 15%,16%, 11%, and 61%.
4.5 Detecting Misinformation about Zoom’sSecurity and Privacy Threats
To estimate the prevalence ofmisinformation about Zoom’s securityand privacy issues, we developed another classifier, which receivesposts related to Zoom’s security and privacy and detect if theyare misinformation. We trained a new binary classifier for eachplatform, using our already labeled groundtruth dataset.
4.5.1 Textual and Contextual Feature Selection. Textual Features:For each platform, we extracted bi-grams and uni-grams from all theposts and considered the top 100 of them with the highest values ofTF-IDF, which resulted in 37 uni-grams and 63 bi-grams. We tested
our classifiers with 100, 500, 1000, 1500, and 2000 top n-grams, andacross all platforms but Instagram, 100 provided the best results,while 500 provided the best results for Instagram. ContextualFeatures: Along with the textual features obtained from the posts,we extracted a set of contextual features from the meta-data, whichinclude: (1) Taxonomy-inspired features: Creating the taxonomy,we found some features that are more apparent in misinformationposts. For example, in terms of post linguistics, they tend to haveall CAPS content, in terms of network structure, they tend to havea large audience, and are verified, or in terms of sources, tend toprovide altered videos or photos. Inspired by these properties, weused the following contextual features: word counts, noun counts,pronouns counts, number of all CAPS words, misspelled words count,verified account, followers count, has a photo/video and has a URL.(2) Reaction-inspired features: Posts can get some reaction, e.g., likes,retweets/shares, comments, etc. We used appropriate statistical tests,such as Mann-Whitney U test, T-Test, & Chi-Square test, to examineif such features are statistically different across the classes.
Based on the test results, we used the following features: forInstagram, likes count, for Facebook, the number of likes, comments,and shares, for Reddit, the number of likes, and comments, for Twit-ter, we did not find the number of likes and retweets significant,therefore we did not use them. (3) Features based on account charac-teristics: Having access to Twitter account meta-data, we examinedif any of the account characteristics can distinguish misinforma-tion posters. We used the following features: tweets count, profiledescription length, account age, listed count, and has a profile image.
4.5.2 Classifiers. Since our dataset is highly unbalanced, we usedseveral oversampling techniques mentioned in the previous section,and we found RandomOverSampler provides the best results for In-stagram and Reddit classifiers, and SMOTE provides the best resultsfor Facebook and Twitter classifiers. Also, we found that out of thefive machine learning algorithms, Random Forest provides the bestaccuracy across the four platforms. We compared the results of thedifferent algorithms after performing hyperparameter tuning using

Conference’17, July 2017, Washington, DC, USA Mohit Singhal, Nihal Kumarswamy, Shreyasi Kinhekar, Shirin Nilizadeh
the GridSearchCV feature from sklearn in Python. Hyperparametertuning conducts an exhaustive search over the parameters to findthe best combination of parameters. Table 8 shows all classifiers,using k-cross validation (𝑘 = 3), have great performance.
We further verified if our classifiers show consistent performanceby randomly choosing 100 posts from each platform, manuallylabeling them, and computing the accuracy on these testing tests.We found that about 98% accuracy in the case of Instagram, 97% inthe case of Reddit, 97% for Facebook, and 98% for Twitter, which issimilar to those obtained during cross-validation.
We examined feature importance in the trained Random For-est model to understand which of the features have a higher im-portance in the classification tasks. The top 10 features and theirscores for each model are: Facebook: no. of all CAPS words (0.083),word count (0.081), company (0.052), behind (0.046), hey (0.045), live(0.037), police (0.036), state (0.036), data (0.035), and set (0.035). Red-dit: company (0.116), China (0.087), no. of likes (0.066), word count(0.060), security (0.050), make (0.047), privacy (0.043), use (0.042),Zoom (0.040), and No. of all CAPS words (0.039). Instagram: Zoom(0.084), No. of all CAPS words (0.034), word count (0.033), security(0.029), away (0.029), would (0.029), virus (0.028), say (0.028), no. oflikes (0.026), and news (0.023). Twitter: Has photo/video (0.072),URL in Tweet (0.070), account age (0.049), say (0.043), has a profileimage (0.042), privacy (0.041), window (0.038), tweets count (0.036),Zoom (0.031), and followers count (0.030). As you can see, the topfeatures for each platform span a variety of feature categories, in-cluding textual features such as n-grams, and contextual features,consisting of taxonomy-, reaction-, and account- inspired features.
Table 8: The performance of misinformation detection classifiers
Platform Accuracy F1 Score Precision Recall
Instagram 0.98(+/- 0.01)
0.98(+/- 0.02)
0.98(+/- 0.01)
0.98(+/- 0.02)
Facebook 0.99(+/- 0.00)
0.99(+/- 0.01)
0.99(+/- 0.00)
0.99(+/- 0.01)
Reddit 0.99(+/- 0.01)
0.99(+/- 0.01)
0.99(+/- 0.00)
0.99(+/- 0.01)
Twitter 0.98(+/- 0.01)
0.98(+/- 0.02)
0.98(+/- 0.02)
0.98(+/- 0.01)
Table 9: The percentage of misinformation in each platform.
Platform Misinformation Unique usersInstagram 16 (3%) 9Facebook 2,115 (10%) 1,517Reddit 25 (4%) 22Twitter 10 (0.4%) 8
4.5.3 Results. Finally, we employed our trained classifiers on theposts that are related to security and privacy to detect those that aremisinformation. Table 9 shows the percentage of misinformationposts per platform. About 3% of posts on Instagram, 10% of themon Facebook and 4% and 0.4% of them on Reddit and Twitter aremisinformation. When comparing our results with groundtruthdataset, we find that we are at par for Instagram and Facebook
06/1907/19
08/1909/19
10/1911/19
12/1901/20
02/2003/20
04/2005/20
06/2007/20
08/2009/20
10/2011/20
0.000
0.005
0.010
0.015
0.020
0.025
Misi
nfor
mat
ion
rate
InstagramTwitterFacebookReddit
Figure 8: Misinformation growth rate.
with the ratio of misinformation posts: total security and privacyposts (3% vs 3% & 10% vs 10%). For Reddit, we found a little moremisinformation than our groundtruth (4% vs. 2%), while for Twitterwe obtained fewer misinformation posts than our groundtruthdataset (0.4% vs 2%). These amounts of misinformation per platformhighlight that individual platforms should dedicate resources tocurb the spread of misinformation about cybersecurity & privacy.
4.5.4 Growth of Misinformation. To understand the growth of mis-information about Zoom security and privacy issues, Figure 8 showsthe percentages of posts that our classifiers detected as misinforma-tion over time. The black line represents the time when multiplestates in the US went into COVID-19 lockdown [3]. As you can see,Twitter, Instagram, & Reddit follow similar patterns. However, inthe case of Facebook, there are posts that were in 2019, informingusers about Zoom’s security and privacy threats. We then manuallyinspected the posts, to understand what issues were being talkedabout Zoom. Our analysis revealed that, in the month of July 2019,users were discussing Zoom hit by DoS, however, we found thatZoom had a new zero-day vulnerability and not a DoS attack [2].We see a sudden spike, in the number of misinformation posts firston Facebook around February 2020, and then subsequent spikesin Instagram, Twitter, and Reddit after March 2020. Our analysisrevealed that users were claiming that Zoom is malware, a toolby the Chinese Communist party to spy on people, etc., however,these claims have been refuted [12, 13]. The plot shows a higherpercentage of misinformation posted on Facebook when comparedto other platforms. This might be because misinformation news iseasier to be spread on Facebook due to a number of factors such asthe users of Facebook, their moderation policies and also postingtechniques.
5 LIMITATIONS AND FUTUREWORKThe analysis on phishing misinformation gives a lower bound ofthe misinformation on Twitter because we had access to a 1% sam-ple of Twitter data. Similarly, in our second study, the size of ourdatasets was restricted by CrowdTangle. Also, not having access tothe followers and friends of users, we could not detect and analyzepossible campaigns. In the future, we would extend our study to un-derstand the impact of these misinformation websites on businessesand anti-phishing tools. We would also investigate the diffusion of
The Prevalence of Cybersecurity Misinformation on Social Media Conference’17, July 2017, Washington, DC, USA
cybersecurity and privacy misinformation on various social net-works and examine if they are different from that of political orpublic health misinformation.
6 CONCLUSIONIn this work, we first examined the correctness of Twitter reportsabout websites being phishing. In total, we found that about 9% of allobfuscated URLs and about 22% of tweets about phishing websitesare misinformation. Second, we examined the correctness of posts,about Zoom’s security and privacy threats, that were shared onTwitter, Instagram, Reddit, and Facebook.
Using a set of textual and contextual features, we built supervisedclassifiers to identify posts discussing the security and privacy ofZoom, and to detect misinformation in our whole dataset. Ourclassifiers showed great performance across all four platforms.
We found about 3%, 10%, 4% and 0.4% of posts on Instagram,Facebook, Reddit, and Twitter, as misinformation, respectively. Ourresults show that misinformation about cybersecurity and privacynot only is present on social media platforms but also are prevalent.Therefore, the community needs to further study the misinforma-tion on cybersecurity and investigate its impact on end-users andthreat intelligence tools.
REFERENCES[1] 2018. Kaspersky Blacklist. https://support.kaspersky.com/KSMG/1.0/en-EN/
91157.htm.[2] 2019. Zoom Zero-Day Bug Opens Mac Users to Webcam Hijacking. https:
//threatpost.com/zoom-zero-day-mac-webcam-hijacking/146317/.[3] 2020. COVID-19 lockdowns. https://en.wikipedia.org/wiki/COVID-19_
lockdowns.[4] 2020. Internet Crime Report- FBI. https://www.ic3.gov/Media/PDF/
AnnualReport/2020_IC3Report.pdf.[5] 2020. PhishTank. https://www.phishtank.com/faq.php.[6] 2020. Software Flaws Sometimes First Reported on Social Media. https://www.
pnnl.gov/news-media/software-flaws-sometimes-first-reported-social-media.[7] 2020. The Virus Changed the Way We Internet. https://www.nytimes.com/
interactive/2020/04/07/technology/coronavirus-internet-use.html.[8] 2020. Thousands of Zoom video calls left exposed on open Web.
https://www.washingtonpost.com/technology/2020/04/03/thousands-zoom-video-calls-left-exposed-open-web/.
[9] 2020. Twitter Developer. https://developer.twitter.com/en.[10] 2020. VirusTotal. https://www.virustotal.com/gui/home/upload.[11] 2020. VirusTotal API. https://developers.virustotal.com/reference.[12] 2020. Zoom Finally Has End-to-End Encryption. Here’s How to Use It. https:
//www.wired.com/story/how-to-enable-zoom-encryption/.[13] 2020. Zoom’s Use of Facebook’s SDK in iOS Client. https://blog.zoom.us/zoom-
use-of-facebook-sdk-in-ios-client/.[14] 2020. ‘Zoombombing’ Attacks Disrupt Classes. https://www.insidehighered.
com/news/2020/03/26/zoombombers-disrupt-online-classes-racist-pornographic-content.
[15] 2021. Anti-Phishing Working Group. https://apwg.org/.[16] 2021. Google Meet. https://meet.google.com/.[17] 2021. Google Safebrowsing. https://safebrowsing.google.com/.[18] 2021. How The Epoch Times Created a Giant Influence Machine. https://www.
nytimes.com/2020/10/24/technology/epoch-times-influence-falun-gong.html.[19] 2021. IntelMQ. http://github.com/certtools/intelmq/.[20] 2021. Phishing Remains the Most Common Form of Attack. https://blog.
knowbe4.com/phishing-remains-the-most-common-form-of-attack.[21] 2021. SpiderFoot, Open Source Intelligence Automation. http://spiderfoot.net/.[22] 2021. What data is CrowdTangle tracking? https://help.crowdtangle.com/en/
articles/1140930-what-data-is-crowdtangle-tracking.[23] Hassan YA Abutair and Abdelfettah Belghith. 2017. Using case-based reasoning
for phishing detection. Procedia Computer Science 109 (2017), 281–288.[24] Ahmed Aleroud and Lina Zhou. 2017. Phishing environments, techniques, and
countermeasures: A survey. Computers & Security 68 (2017), 160–196.[25] Fernando Alves, Aurélien Bettini, Pedro M Ferreira, and Alysson Bessani. 2021.
Processing tweets for cybersecurity threat awareness. Information Systems 95(2021), 101586.
[26] Ram B Basnet, Andrew H Sung, and Quingzhong Liu. 2012. Feature selectionfor improved phishing detection. In International Conference on Industrial, Engi-neering and Other Applications of Applied Intelligent Systems. Springer, 252–261.
[27] Simon Bell and Peter Komisarczuk. 2020. An Analysis of Phishing Blacklists:Google Safe Browsing, OpenPhish, and PhishTank. In Proceedings of the Aus-tralasian Computer Science Week Multiconference. 1–11.
[28] Marzieh Bitaab, Haehyun Cho, Adam Oest, Penghui Zhang, Zhibo Sun, RanaPourmohamad, Doowon Kim, Tiffany Bao, Ruoyu Wang, Yan Shoshitaishvili,et al. 2021. Scam Pandemic: HowAttackers Exploit Public Fear through Phishing.arXiv preprint arXiv:2103.12843 (2021).
[29] Elizabeth B Blankenship, Mary Elizabeth Goff, Jinging Yin, Zion Tsz Ho Tse,King-Wa Fu, Hai Liang, Nitin Saroha, and Isaac Chun-Hai Fung. 2018. Sentiment,contents, and retweets: a study of two vaccine-related twitter datasets. ThePermanente Journal 22 (2018).
[30] Vincent D Blondel, Jean-Loup Guillaume, Renaud Lambiotte, and Etienne Lefeb-vre. 2008. Fast unfolding of communities in large networks. Journal of statisticalmechanics: theory and experiment 2008, 10 (2008), P10008.
[31] J Scott Brennen, Felix Simon, Philip N Howard, and Rasmus Kleis Nielsen. 2020.Types, sources, and claims of COVID-19 misinformation. Reuters Institute 7(2020), 3–1.
[32] Marcus Butavicius, Kathryn Parsons, Malcolm Pattinson, and Agata McCormac.2016. Breaching the human firewall: Social engineering in phishing and spear-phishing emails. arXiv preprint arXiv:1606.00887 (2016).
[33] Nitesh V Chawla, Kevin W Bowyer, Lawrence O Hall, and W Philip Kegelmeyer.2002. SMOTE: synthetic minority over-sampling technique. Journal of artificialintelligence research 16 (2002), 321–357.
[34] Kang Leng Chiew, Kelvin Sheng Chek Yong, and Choon Lin Tan. 2018. Asurvey of phishing attacks: their types, vectors and technical approaches. ExpertSystems with Applications 106 (2018), 1–20.
[35] Sharvari Prakash Chorghe and Narendra Shekokar. 2016. A survey on anti-phishing techniques in mobile phones. In 2016 International Conference on In-ventive Computation Technologies (ICICT), Vol. 2. IEEE, 1–5.
[36] Juliet M Corbin and Anselm Strauss. 1990. Grounded theory research: Proce-dures, canons, and evaluative criteria. Qualitative sociology 13, 1 (1990), 3–21.
[37] Emma Cueva, Grace Ee, Akshat Iyer, Alexandra Pereira, Alexander Roseman,and Dayrene Martinez. 2020. Detecting Fake News on Twitter Using MachineLearning Models. (2020).
[38] Clayton A Davis, Giovanni Luca Ciampaglia, Luca Maria Aiello, Keychul Chung,Michael D Conover, Emilio Ferrara, Alessandro Flammini, Geoffrey C Fox,Xiaoming Gao, Bruno Gonçalves, et al. 2016. OSoMe: the IUNI observatory onsocial media. PeerJ Computer Science 2 (2016), e87.
[39] Adam G Dunn, Julie Leask, Xujuan Zhou, Kenneth D Mandl, and Enrico Coiera.2015. Associations between exposure to and expression of negative opinionsabout human papillomavirus vaccines on social media: an observational study.Journal of medical Internet research 17, 6 (2015), e144.
[40] Mohamed K Elhadad, Kin Fun Li, and Fayez Gebali. 2019. Fake news detectionon social media: a systematic survey. In 2019 IEEE Pacific Rim Conference onCommunications, Computers and Signal Processing (PACRIM). IEEE, 1–8.
[41] Barney G Glaser and Anselm L Strauss. 2017. Discovery of grounded theory:Strategies for qualitative research. Routledge.
[42] Sanjay Goel, Kevin Williams, and Ersin Dincelli. 2017. Got phished? Internetsecurity and human vulnerability. Journal of the Association for InformationSystems 18, 1 (2017), 2.
[43] Leo A Goodman. 1961. Snowball sampling. The annals of mathematical statistics(1961), 148–170.
[44] Chuan Guo, Juan Cao, Xueyao Zhang, Kai Shu, and Miao Yu. 2019. Ex-ploiting emotions for fake news detection on social media. arXiv preprintarXiv:1903.01728 (2019).
[45] Brij B Gupta, Nalin AG Arachchilage, and Kostas E Psannis. 2018. Defend-ing against phishing attacks: taxonomy of methods, current issues and futuredirections. Telecommunication Systems 67, 2 (2018), 247–267.
[46] Brij B Gupta, Aakanksha Tewari, Ankit Kumar Jain, and Dharma P Agrawal.2017. Fighting against phishing attacks: state of the art and future challenges.Neural Computing and Applications 28, 12 (2017), 3629–3654.
[47] Surbhi Gupta, Abhishek Singhal, andAkanksha Kapoor. 2016. A literature surveyon social engineering attacks: Phishing attack. In 2016 international conferenceon computing, communication and automation (ICCCA). IEEE, 537–540.
[48] Reza Hassanpour, Erdogan Dogdu, Roya Choupani, Onur Goker, and NazliNazli. 2018. Phishing e-mail detection by using deep learning algorithms. InProceedings of the ACMSE 2018 Conference. 1–1.
[49] Haibo He, Yang Bai, Edwardo A Garcia, and Shutao Li. 2008. ADASYN: Adaptivesynthetic sampling approach for imbalanced learning. In 2008 IEEE internationaljoint conference on neural networks (IEEE world congress on computational intelli-gence). IEEE, 1322–1328.
[50] Rae Hodge. 2020. Zoom security issues: Zoom buys security company, aimsfor end-to-end encryption. https://www.cnet.com/news/zoom-security-issues-zoom-buys-security-company-aims-for-end-to-end-encryption/.

Conference’17, July 2017, Washington, DC, USA Mohit Singhal, Nihal Kumarswamy, Shreyasi Kinhekar, Shirin Nilizadeh
[51] Robert Hornik, Ava Kikut, Emma Jesch, Chioma Woko, Leeann Siegel, andKwanho Kim. 2021. Association of COVID-19 misinformation with face maskwearing and social distancing in a nationally representative US sample. Healthcommunication 36, 1 (2021), 6–14.
[52] Seyedmehdi Hosseinimotlagh and Evangelos E Papalexakis. 2018. Unsupervisedcontent-based identification of fake news articles with tensor decompositionensembles. In Proceedings of the Workshop on Misinformation and MisbehaviorMining on the Web (MIS2).
[53] Binxuan Huang and Kathleen M Carley. 2020. Disinformation and misin-formation on twitter during the novel coronavirus outbreak. arXiv preprintarXiv:2006.04278 (2020).
[54] Fang Jin, Edward Dougherty, Parang Saraf, Yang Cao, and Naren Ramakrishnan.2013. Epidemiological modeling of news and rumors on twitter. In Proceedingsof the 7th workshop on social network mining and analysis. 1–9.
[55] Karen Sparck Jones. 1972. A statistical interpretation of term specificity and itsapplication in retrieval. Journal of documentation (1972).
[56] Alex Kantchelian, Michael Carl Tschantz, Sadia Afroz, Brad Miller, VaishaalShankar, Rekha Bachwani, Anthony D Joseph, and J Doug Tygar. 2015. Bettermalware ground truth: Techniques for weighting anti-virus vendor labels. InProceedings of the 8th ACM Workshop on Artificial Intelligence and Security.45–56.
[57] Eleni Kapantai, Androniki Christopoulou, Christos Berberidis, and VassiliosPeristeras. 2020. A systematic literature review on disinformation: Toward aunified taxonomical framework. new media & society (2020), 1461444820959296.
[58] Hamid Karimi, Proteek Roy, Sari Saba-Sadiya, and Jiliang Tang. 2018. Multi-source multi-class fake news detection. In Proceedings of the 27th internationalconference on computational linguistics. 1546–1557.
[59] Hamid Karimi and Jiliang Tang. 2019. Learning hierarchical discourse-levelstructure for fake news detection. arXiv preprint arXiv:1903.07389 (2019).
[60] Rupinder Paul Khandpur, Taoran Ji, Steve Jan, Gang Wang, Chang-Tien Lu,and Naren Ramakrishnan. 2017. Crowdsourcing cybersecurity: Cyber attackdetection using social media. In Proceedings of the 2017 ACM on Conference onInformation and Knowledge Management. 1049–1057.
[61] Mahmoud Khonji, Youssef Iraqi, and Andrew Jones. 2013. Phishing detection:a literature survey. IEEE Communications Surveys & Tutorials 15, 4 (2013),2091–2121.
[62] Ramez Kouzy, Joseph Abi Jaoude, Afif Kraitem, Molly B El Alam, Basil Karam,Elio Adib, Jabra Zarka, Cindy Traboulsi, Elie W Akl, and Khalil Baddour. 2020.Coronavirus goes viral: quantifying the COVID-19 misinformation epidemic onTwitter. Cureus 12, 3 (2020).
[63] Ba Dung Le, Guanhua Wang, Mehwish Nasim, and Ali Babar. 2019. Gatheringcyber threat intelligence from Twitter using novelty classification. arXiv preprintarXiv:1907.01755 (2019).
[64] Quentin Le Sceller, ElMouatez Billah Karbab, Mourad Debbabi, and FarkhundIqbal. 2017. Sonar: Automatic detection of cyber security events over thetwitter stream. In Proceedings of the 12th International Conference on Availability,Reliability and Security. 1–11.
[65] Guillaume Lemaître, Fernando Nogueira, and Christos K. Aridas. 2017.Imbalanced-learn: A Python Toolbox to Tackle the Curse of Imbalanced Datasetsin Machine Learning. Journal of Machine Learning Research 18, 17 (2017), 1–5.http://jmlr.org/papers/v18/16-365.html
[66] Tian Lin, Daniel E Capecci, Donovan M Ellis, Harold A Rocha, Sandeep Dom-maraju, Daniela S Oliveira, and Natalie C Ebner. 2019. Susceptibility to spear-phishing emails: Effects of internet user demographics and email content. ACMTransactions on Computer-Human Interaction (TOCHI) 26, 5 (2019), 1–28.
[67] Sahil Loomba, Alexandre de Figueiredo, Simon J Piatek, Kristen de Graaf, andHeidi J Larson. 2021. Measuring the impact of COVID-19 vaccinemisinformationon vaccination intent in the UK and USA. Nature human behaviour 5, 3 (2021),337–348.
[68] Jennifer S Love, Adam Blumenberg, and Zane Horowitz. 2020. The parallelpandemic: Medical misinformation and COVID-19: Primum non nocere. Journalof general internal medicine 35 (2020), 2435–2436.
[69] David MMarkowitz and Jeffrey T Hancock. 2014. Linguistic traces of a scientificfraud: The case of Diederik Stapel. PloS one 9, 8 (2014), e105937.
[70] Sourena Maroofi, Maciej Korczyński, and Andrzej Duda. 2020. Are You Hu-man? Resilience of Phishing Detection to Evasion Techniques Based on HumanVerification. In Proceedings of the ACM Internet Measurement Conference. 78–86.
[71] Philip M Massey, Amy Leader, Elad Yom-Tov, Alexandra Budenz, Kara Fisher,and Ann C Klassen. 2016. Applying multiple data collection tools to quantifyhuman papillomavirus vaccine communication on Twitter. Journal of medicalInternet research 18, 12 (2016), e318.
[72] Panagiotis Metaxas. 2017. Retweets indicate agreement, endorsement, trust:A meta-analysis of published Twitter research. Arxiv. Retrieved from http://cs.wellesley. edu/˜ pmetaxas/WorkingPapers/Retweet-meaning. pdf (2017).
[73] Maria D Molina, S Shyam Sundar, Thai Le, and Dongwon Lee. 2019. “Fake news”is not simply false information: a concept explication and taxonomy of onlinecontent. American behavioral scientist (2019), 0002764219878224.
[74] Federico Monti, Fabrizio Frasca, Davide Eynard, Damon Mannion, andMichael M Bronstein. 2019. Fake news detection on social media using geometricdeep learning. arXiv preprint arXiv:1902.06673 (2019).
[75] Adam Oest, Yeganeh Safaei, Penghui Zhang, Brad Wardman, Kevin Tyers, YanShoshitaishvili, and Adam Doupé. 2020. Phishtime: Continuous longitudinalmeasurement of the effectiveness of anti-phishing blacklists. In 29th {USENIX}Security Symposium ({USENIX} Security 20). 379–396.
[76] Adam Oest, Yeganeh Safei, Adam Doupé, Gail-Joon Ahn, Brad Wardman, andGary Warner. 2018. Inside a phisher’s mind: Understanding the anti-phishingecosystem through phishing kit analysis. In 2018 APWG Symposium on ElectronicCrime Research (eCrime). IEEE, 1–12.
[77] Ahmet Okutan, Shanchieh Jay Yang, and Katie McConky. 2017. Predicting cyberattacks with bayesian networks using unconventional signals. In Proceedings ofthe 12th Annual Conference on Cyber and Information Security Research. 1–4.
[78] F. Pedregosa, G. Varoquaux, A. Gramfort, V. Michel, B. Thirion, O. Grisel, M.Blondel, P. Prettenhofer, R. Weiss, V. Dubourg, J. Vanderplas, A. Passos, D.Cournapeau, M. Brucher, M. Perrot, and E. Duchesnay. 2011. Scikit-learn:Machine Learning in Python. Journal of Machine Learning Research 12 (2011),2825–2830.
[79] Peng Peng, Limin Yang, Linhai Song, and Gang Wang. 2019. Opening theblackbox of virustotal: Analyzing online phishing scan engines. In Proceedingsof the Internet Measurement Conference. 478–485.
[80] Tianrui Peng, Ian Harris, and Yuki Sawa. 2018. Detecting phishing attacks usingnatural language processing andmachine learning. In 2018 ieee 12th internationalconference on semantic computing (icsc). IEEE, 300–301.
[81] Pawan Prakash, Manish Kumar, Ramana Rao Kompella, and Minaxi Gupta. 2010.Phishnet: predictive blacklisting to detect phishing attacks. In 2010 ProceedingsIEEE INFOCOM. IEEE, 1–5.
[82] Routhu Srinivasa Rao and Alwyn Roshan Pais. 2019. Detection of phishingwebsites using an efficient feature-based machine learning framework. NeuralComputing and Applications 31, 8 (2019), 3851–3873.
[83] Hannah Rashkin, Eunsol Choi, Jin Yea Jang, Svitlana Volkova, and Yejin Choi.2017. Truth of varying shades: Analyzing language in fake news and politicalfact-checking. In Proceedings of the 2017 conference on empirical methods innatural language processing. 2931–2937.
[84] Alan Ritter, Evan Wright, William Casey, and Tom Mitchell. 2015. Weaklysupervised extraction of computer security events from twitter. In Proceedingsof the 24th International Conference on World Wide Web. 896–905.
[85] Sayak Saha Roy, Unique Karanjit, and Shirin Nilizadeh. 2021. What RemainsUncaught?: Characterizing SparselyDetected Malicious URLs on Twitter. https://madweb.work/preprints/madweb21-paper28-pre_print_version.pdf. Madwebpreprint 2021 (2021).
[86] Natali Ruchansky, Sungyong Seo, and Yan Liu. 2017. Csi: A hybrid deepmodel forfake news detection. In Proceedings of the 2017 ACM on Conference on Informationand Knowledge Management. 797–806.
[87] Carl Sabottke, Octavian Suciu, and Tudor Dumitras. 2015. Vulnerability Disclo-sure in the Age of Social Media: Exploiting Twitter for Predicting Real-WorldExploits. In 24th USENIX Security Symposium (USENIX Security 15). USENIX As-sociation, Washington, D.C., 1041–1056. https://www.usenix.org/conference/usenixsecurity15/technical-sessions/presentation/sabottke
[88] Ozgur Koray Sahingoz, Ebubekir Buber, Onder Demir, and Banu Diri. 2019.Machine learning based phishing detection from URLs. Expert Systems withApplications 117 (2019), 345–357.
[89] Anna Sapienza, Alessandro Bessi, Saranya Damodaran, Paulo Shakarian,Kristina Lerman, and Emilio Ferrara. 2017. Early warnings of cyber threatsin online discussions. In 2017 IEEE International Conference on Data MiningWorkshops (ICDMW). IEEE, 667–674.
[90] Christof Schuster. 2004. A note on the interpretation of weighted kappa and itsrelations to other rater agreement statistics for metric scales. Educational andPsychological Measurement 64, 2 (2004), 243–253.
[91] Gautam Kishore Shahi, Anne Dirkson, and Tim A Majchrzak. 2021. An ex-ploratory study of covid-19 misinformation on twitter. Online Social Networksand Media 22 (2021), 100104.
[92] Chengcheng Shao, Giovanni Luca Ciampaglia, Onur Varol, Alessandro Flammini,and Filippo Menczer. 2017. The spread of fake news by social bots. arXiv preprintarXiv:1707.07592 96 (2017), 104.
[93] Chengcheng Shao, Giovanni Luca Ciampaglia, Onur Varol, Kai-Cheng Yang,Alessandro Flammini, and Filippo Menczer. 2018. The spread of low-credibilitycontent by social bots. Nature communications 9, 1 (2018), 1–9.
[94] Himani Sharma, Er Meenakshi, and Sandeep Kaur Bhatia. 2017. A compara-tive analysis and awareness survey of phishing detection tools. In 2017 2ndIEEE International Conference on Recent Trends in Electronics, Information &Communication Technology (RTEICT). IEEE, 1437–1442.
[95] Hossein Shirazi, Bruhadeshwar Bezawada, and Indrakshi Ray. 2018. " Kn0wThy Doma1n Name" Unbiased Phishing Detection Using Domain Name BasedFeatures. In Proceedings of the 23nd ACM on Symposium on Access Control Modelsand Technologies. 69–75.

The Prevalence of Cybersecurity Misinformation on Social Media Conference’17, July 2017, Washington, DC, USA
[96] Kai Shu, Amy Sliva, Suhang Wang, Jiliang Tang, and Huan Liu. 2017. Fake newsdetection on social media: A data mining perspective. ACM SIGKDD explorationsnewsletter 19, 1 (2017), 22–36.
[97] Kai Shu, Suhang Wang, and Huan Liu. 2019. Beyond news contents: The roleof social context for fake news detection. In Proceedings of the twelfth ACMinternational conference on web search and data mining. 312–320.
[98] Lisa Singh, Shweta Bansal, Leticia Bode, Ceren Budak, Guangqing Chi, Korn-raphop Kawintiranon, Colton Padden, Rebecca Vanarsdall, Emily Vraga, andYanchen Wang. 2020. A first look at COVID-19 information and misinformationsharing on Twitter. arXiv preprint arXiv:2003.13907 (2020).
[99] Gunikhan Sonowal and KS Kuppusamy. 2020. PhiDMA–A phishing detectionmodel with multi-filter approach. Journal of King Saud University-Computerand Information Sciences 32, 1 (2020), 99–112.
[100] Alex Sumner and Xiaohong Yuan. 2019. Mitigating Phishing Attacks: AnOverview. In Proceedings of the 2019 ACM Southeast Conference. 72–77.
[101] Choon Lin Tan, Kang Leng Chiew, KokSheik Wong, et al. 2016. PhishWHO:Phishing webpage detection via identity keywords extraction and target domainname finder. Decision Support Systems 88 (2016), 18–27.
[102] CrowdTangle Team. 2020. CrowdTangle. Facebook, Menlo Park, California,United States.
[103] Aakanksha Tewari, AK Jain, and BB Gupta. 2016. Recent survey of variousdefense mechanisms against phishing attacks. Journal of Information Privacyand Security 12, 1 (2016), 3–13.
[104] William Yang Wang. 2017. " liar, liar pants on fire": A new benchmark datasetfor fake news detection. arXiv preprint arXiv:1705.00648 (2017).
[105] Yaqing Wang, Fenglong Ma, Zhiwei Jin, Ye Yuan, Guangxu Xun, Kishlay Jha,Lu Su, and Jing Gao. 2018. Eann: Event adversarial neural networks for multi-modal fake news detection. In Proceedings of the 24th acm sigkdd internationalconference on knowledge discovery & data mining. 849–857.
[106] Colin Whittaker, Brian Ryner, and Marria Nazif. 2010. Large-scale automaticclassification of phishing pages. (2010).
[107] Ellery Wulczyn, Nithum Thain, and Lucas Dixon. 2017. Ex machina: Personalattacks seen at scale. In Proceedings of the 26th International Conference on WorldWide Web. 1391–1399.
[108] Ping Yi, Yuxiang Guan, Futai Zou, Yao Yao, Wei Wang, and Ting Zhu. 2018. Webphishing detection using a deep learning framework. Wireless Communicationsand Mobile Computing 2018 (2018).
[109] Savvas Zannettou, Michael Sirivianos, Jeremy Blackburn, and Nicolas Kourtellis.2019. The web of false information: Rumors, fake news, hoaxes, clickbait, andvarious other shenanigans. Journal of Data and Information Quality (JDIQ) 11,3 (2019), 1–37.
[110] Yue Zhang, Jason I Hong, and Lorrie F Cranor. 2007. Cantina: a content-basedapproach to detecting phishing web sites. In Proceedings of the 16th internationalconference on World Wide Web. 639–648.
[111] Xinyi Zhou, Jindi Wu, and Reza Zafarani. 2020. SAFE: Similarity-Aware Multi-Modal Fake News Detection. arXiv preprint arXiv:2003.04981 (2020).
A APPENDIXA.1 Comparison of Account Characteristics of
Users Posting Phishing ReportsTable 10 statistically describes the user accounts with true and falseclaims,
as well as those in our random dataset. If a user had posted bothtrue and false claims, we considered them in both sets. To havea baseline for comparing accounts’ characteristics, we collected arandom set of 1.1M tweets, using the Twitter streaming API fromOctober 5th 2021 to October 11th 2021.
To minimize the bias towards users with higher posting rates,we randomly sampled 20K users out of 789K unique users.
Followers and listed counts can indicate the visibility of accounts.Twitter listed counts can indicate that the user is known for
some topic or expertise. These two variables do not follow a normaldistribution, and therefore, to compare users, we ranMann-WhitneyU tests. The results
show that accounts who post true claims about phishingwebsites,on average have lower number of followers (𝑀𝑒𝑑 = 302 vs.𝑀𝑒𝑑 =
321, 𝑝 < 0.05) compared to those in the random dataset. However,we could not reject the null hypothesis that users with false and
true claims have the same distribution of followers counts, and thatusers with false claims and random users have the same distributionof followers counts.
The results also show that accounts who post false and trueclaims about phishing websites, on average have been listed more(𝑀𝑒𝑑𝑓 𝑎𝑙𝑠𝑒 = 10 vs. 𝑀𝑒𝑑𝑟𝑎𝑛𝑑 = 1, 𝑀𝑒𝑑𝑡𝑟𝑢𝑒 = 6 vs. 𝑀𝑒𝑑𝑟𝑎𝑛𝑑 = 1,𝑝 < 0.001) compared to those in the random dataset. This indi-cates that users with false and true claims are known for moreexpertise compared to random users. Also, accounts who post falseclaims about phishing websites, on average have been listed more(𝑀𝑒𝑑𝑓 𝑎𝑙𝑠𝑒 = 10 vs.𝑀𝑒𝑑𝑡𝑟𝑢𝑒 = 6, 𝑝 < 0.001) compared to those whopost true claims. Interestingly this suggests that accounts with falseclaims are more likely to be known for some expertise.
We also compared other account characteristics related to iden-tifiability of accounts, including: verified, profile image, account age,length of profile description, and URL. Depending on the type ofvariable, we ran t-test or chi-square tests to compare the distribu-tions. We found that on average users with true and false claimshave older accounts than random users (𝑀𝑡𝑟𝑢𝑒 = 7 vs𝑀𝑟𝑎𝑛𝑑 = 4)(𝑡 = 65.05, 𝑝 < 0.001), and (𝑀𝑓 𝑎𝑙𝑠𝑒 = 6 vs 𝑀𝑟𝑎𝑛𝑑 = 4) (𝑡 = 7.50,𝑝 < 0.001), respectively, and users with false and true claims havea longer profile description than random users (𝑀𝑓 𝑎𝑙𝑠𝑒 = 84 vs𝑀𝑟𝑎𝑛𝑑 = 69) (𝑡 = 3.87, 𝑝 < 0.001), and (𝑀𝑡𝑟𝑢𝑒 = 87 vs𝑀𝑟𝑎𝑛𝑑 = 69)(𝑡 = 29.82, 𝑝 < 0.001), respectively.
Running chi-square tests for the binary variables, we foundthat users who post false and true claims are more likely to havea URL compared to random users, (𝑀𝑓 𝑎𝑙𝑠𝑒 = 0.42 vs. 𝑀𝑟𝑎𝑛𝑑 =
0.29) (𝑋 2 = 11.72, 𝑝 < 0.001) and (𝑀𝑡𝑟𝑢𝑒 = 0.46 vs. 𝑀𝑟𝑎𝑛𝑑 =
0.29) (𝑋 2 = 849.81, 𝑝 < 0.001), respectively. In addition, userswho post false and true claims are more likely to have a profileimage compared to random users (𝑀𝑓 𝑎𝑙𝑠𝑒 = 0.48 vs.𝑀𝑟𝑎𝑛𝑑 = 0.76)(𝑋 2 = 64.80, 𝑝 < 0.001) and (𝑀𝑡𝑟𝑢𝑒 = 0.47 vs. 𝑀𝑟𝑎𝑛𝑑 = 0.76)(𝑋 2 = 2, 576.58, 𝑝 < 0.001), respectively. Moreover, accounts whopost true claims are more likely to be verified compared to randomusers (𝑀𝑡𝑟𝑢𝑒 = 0.02 vs. 𝑀𝑟𝑎𝑛𝑑 = 0.008) (𝑋 2 = 216.84, 𝑝 < 0.001).However, we could not reject the null hypotheses that users withfalse and true claims have the same distributions of the identifiabilitycharacteristics. Interestingly, this result is not consistent with thatof other works that show less identifiable accounts tend to sendmalicious content and misinformation [92, 93, 107]. This can bebecause these accounts are more likely to post technical content,and have already established themselves as experts in some domain.
A.2 Zoom Post ExamplesTable 11 gives some examples of the posts that were manually la-beled. The first row talks about how Zoom is a privacy disaster andis corrupt, the tweet provides a link that goes to the Guardian web-site, hence we labeled it as Zoom’s security and privacy. The secondexample is saying that “No end-to-end encryption for call,” whichis not true because Zoom addressed this issue back in February of2020 (check this article [12]), and this post was tweeted on April24th. Hence, we labeled this post as misinformation. The last row isdiscussing a Japanese fashion brand now sells T-shirts for #Zoom,which is irrelevant.

Conference’17, July 2017, Washington, DC, USA Mohit Singhal, Nihal Kumarswamy, Shreyasi Kinhekar, Shirin Nilizadeh
Table 10: Descriptive statistics of our final datasets.
Users with true claims Users with false claims Random Users
Feature Type Mean Min Max Median Mean Min Max Median Mean Min Max Median
Followers Count 6,210 0 12,000,344 302 2,049 0 35,241 426 3,628 0 2,148,896 321Friends Count 1,347 0 274,824 416 1,264 0 21,700 458 1,210 0 963,934 420Tweets Count 29,972 1 3,427,366 4,883 60,293 6 2,233,656 5,426 32,244 1 5,982,184 8,921Listed Count Count 101 0 14,432 6 110 0 6,785 10 19 0 18,863 1Profile Descr. Count 87 0 229 98 84 0 175 81 69 1 200 57Account Age Count 7 0 15 8 6 0 14 6 4 0 14 3URL in Profile Bool. 0.46 0 1 NA 0.42 0 1 NA 0.29 0 1 NAProfile Image Bool. 0.47 0 1 NA 0.48 0 1 NA 0.76 0 1 NAVerified Bool. 0.02 0 1 NA 0.01 0 1 NA 0.008 0 1 NA
Table 11: Examples of posts and assigned labels.
No. Post Label Reason
1 Security researchers have called Zoom “a privacy disas-ter” and “fundamentally corrupt” as allegations of thecompany mishandling user data snowball #Data #Breach#Zoom https://t.co/r3NcjsmuAB
Zoom’s security & privacy Satisfies all the criteria and link goes to“Guardian” website
2 @XXXCEO@XXX:With the popularity of #Zoom, somesecurity concerns have come to light-No end-to-end en-cryption for call- Sale of user data and analytics withoutdisclosing or proper authorization. #UpskillGang #Mil-imaCyberAwareness @XXX’ [Tweeted on April 24th2020]
Misinformation Fails to provide evidence and that no end-to end encryption is false (check this arti-cle [12]) and that it sells user data (checkthis article [13])
3 [#coronavirus] Japanese fashion brand now sells T-shirtsfor #Zoom mtg. Change the color and design but basi-cally only simple green T-shirts. Using the technologyof virtual back ground and change as you like See belownews. Seems to be nice! https://t.co/8lTMxtzKZb
Irrelevant Not about cybersecurity