Embed Size (px)
Citation preview
Proceedings of the 59th Annual Meeting of the Association for Computational Linguisticsand the 11th International Joint Conference on Natural Language Processing, pages 617–631
August 1–6, 2021. ©2021 Association for Computational Linguistics
617
Structurizing Misinformation Stories via Rationalizing Fact-Checks
Shan Jiang and Christo WilsonNortheastern University, USA
{sjiang, cbw}@ccs.neu.edu
Abstract
Misinformation has recently become a well-documented matter of public concern. Exist-ing studies on this topic have hitherto adopteda coarse concept of misinformation, which in-corporates a broad spectrum of story typesranging from political conspiracies to misin-terpreted pranks. This paper aims to struc-turize these misinformation stories by leverag-ing fact-check articles. Our intuition is thatkey phrases in a fact-check article that identifythe misinformation type(s) (e.g., doctored im-ages, urban legends) also act as rationales thatdetermine the verdict of the fact-check (e.g.,false). We experiment on rationalized modelswith domain knowledge as weak supervisionto extract these phrases as rationales, and thencluster semantically similar rationales to sum-marize prevalent misinformation types. Us-ing archived fact-checks from Snopes.com, weidentify ten types of misinformation stories.We discuss how these types have evolved overthe last ten years and compare their prevalencebetween the 2016/2020 US presidential elec-tions and the H1N1/COVID-19 pandemics.
1 Introduction
Misinformation has raised increasing public con-cerns globally, well-documented in Africa (Ahinko-rah et al., 2020), Asia (Kaur et al., 2018), and Eu-rope (Fletcher et al., 2018). In the US, “fake news”accounted for 6% of all news consumption dur-ing the 2016 US presidential election (Grinberget al., 2019). Years later, 29% of US adults in asurvey believed that the “exaggerated threat” of theCOVID-19 pandemic purposefully damaged for-mer US president Donald Trump (Uscinski et al.,2020), and 77% of Trump’s supporters believed“voter fraud” manipulated the 2020 US presiden-tial election in spite of a complete lack of evi-dence (Pennycook and Rand, 2021).
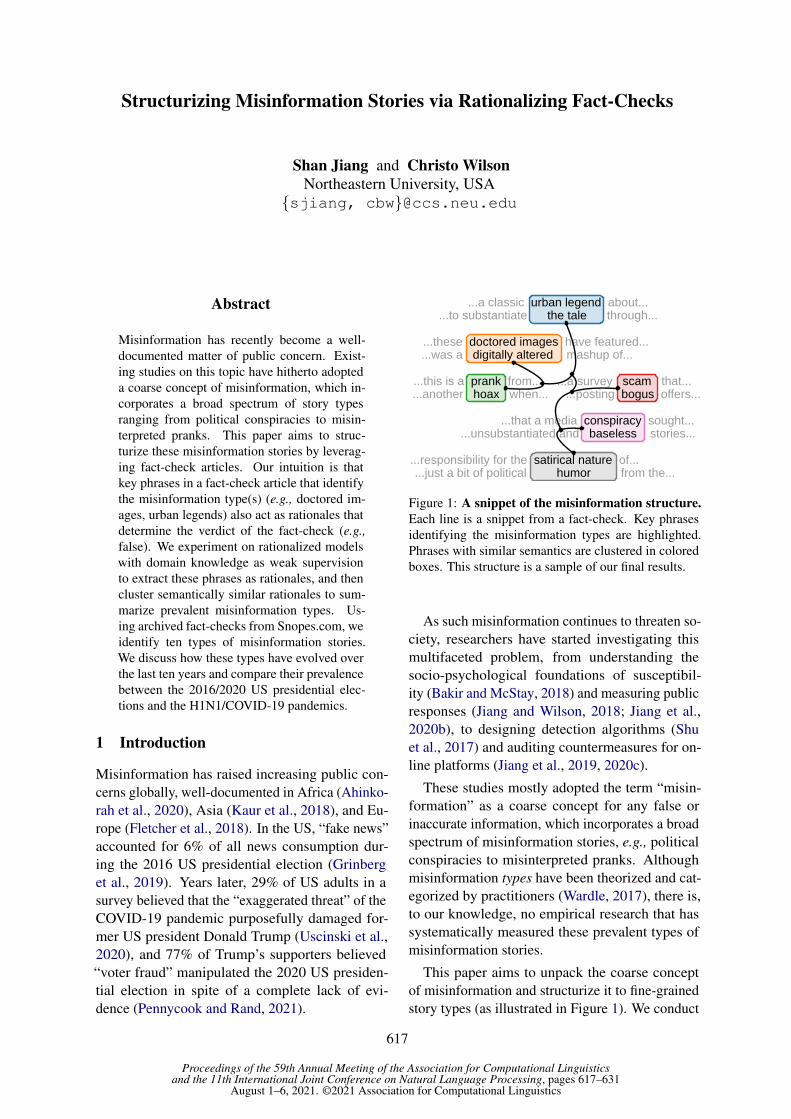
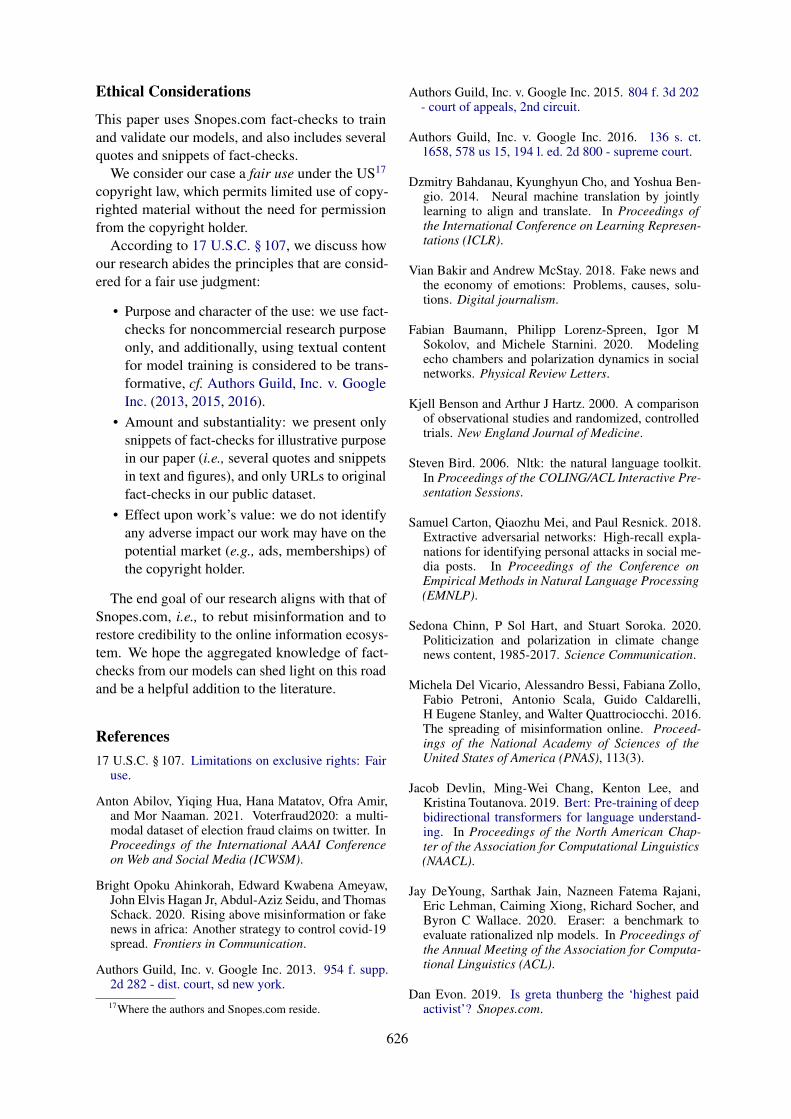
...a classic urban legend about......to substantiate the tale through...
...these doctored images have featured......was a digitally altered mashup of...
...this is a prank from......another hoax when...
...a survey scam that......posting bogus offers...
...that a media conspiracy sought......unsubstantiated and baseless stories...
...responsibility for the satirical nature of......just a bit of political humor from the...
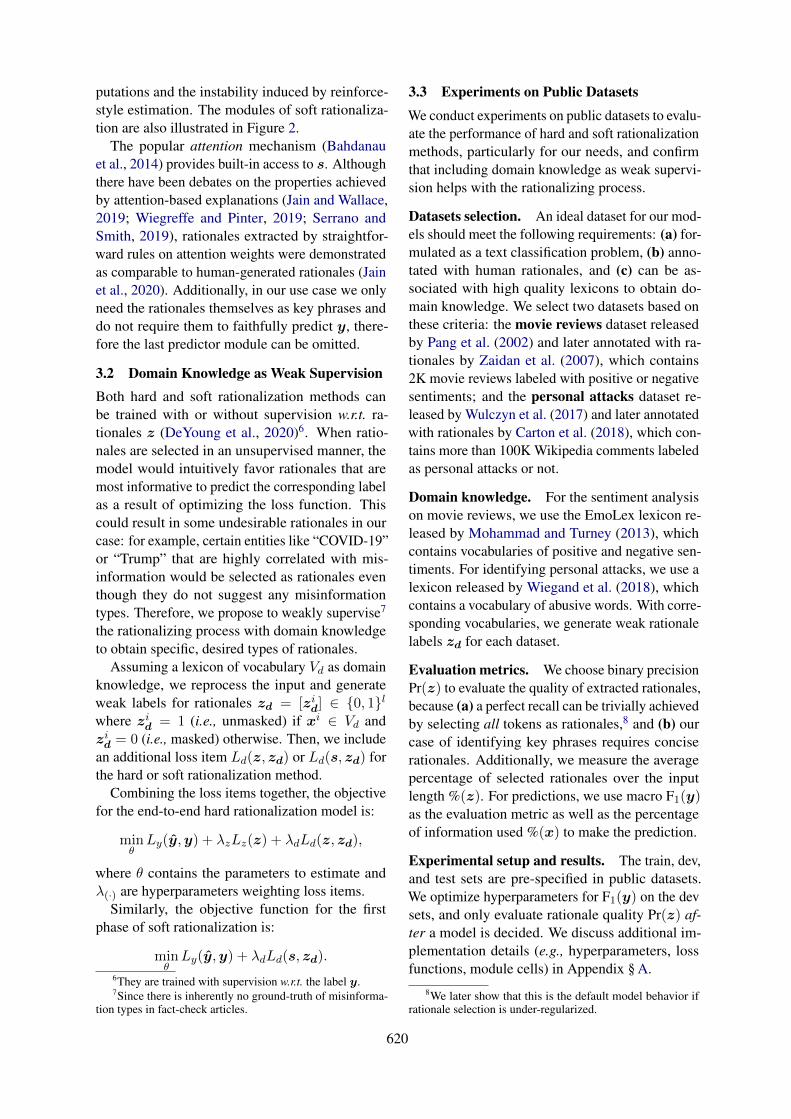
Figure 1: A snippet of the misinformation structure.Each line is a snippet from a fact-check. Key phrasesidentifying the misinformation types are highlighted.Phrases with similar semantics are clustered in coloredboxes. This structure is a sample of our final results.
As such misinformation continues to threaten so-ciety, researchers have started investigating thismultifaceted problem, from understanding thesocio-psychological foundations of susceptibil-ity (Bakir and McStay, 2018) and measuring publicresponses (Jiang and Wilson, 2018; Jiang et al.,2020b), to designing detection algorithms (Shuet al., 2017) and auditing countermeasures for on-line platforms (Jiang et al., 2019, 2020c).
These studies mostly adopted the term “misin-formation” as a coarse concept for any false orinaccurate information, which incorporates a broadspectrum of misinformation stories, e.g., politicalconspiracies to misinterpreted pranks. Althoughmisinformation types have been theorized and cat-egorized by practitioners (Wardle, 2017), there is,to our knowledge, no empirical research that hassystematically measured these prevalent types ofmisinformation stories.
This paper aims to unpack the coarse conceptof misinformation and structurize it to fine-grainedstory types (as illustrated in Figure 1). We conduct

618
this query through an empirical lens and ask thequestion: what are the prevalent types of misinfor-mation stories in the US over the last ten years?
The answer to our question is buried in archivedfact-checks, which are specialized news articlesthat verify factual information and debunk falseclaims by presenting contradictory evidence (Jianget al., 2020a). As a critical component of theirsemi-structured journalistic style, fact-checks oftenembed the (mis)information type(s) within theirsteps of reasoning. For example, consider the fol-lowing snippet from a Snopes.com fact-check witha verdict of false (Evon, 2019):
“...For instance, some started sharing adoctored photograph of Thunberg withalt-right boogeyman George Soros (theoriginal photograph featured former VicePresident Al Gore)...”
The key phrase doctored photograph in the snip-pet identifies the misinformation type of the fact-checked story. Additional example phrases arehighlighted in Figure 1. With a large corpus offact-checks, these phrases would accumulate andreveal prevalent types of misinformation stories.
Extracting these phrases is a computational task.Our intuition is that such phrases in a fact-checkalso act as rationales that determine the verdictof the fact-check. In the previous example, theverdict is false in part because the story contains adoctored photograph. Therefore, a neural modelthat predicts the verdict of a fact-check would alsouse the misinformation types as rationales.
To realize this intuition, we experiment on ex-isting rationalized neural models to extract thesephrases (Lei et al., 2016; Jain et al., 2020), and, totarget specific kinds of rationales, we additionallypropose to include domain knowledge as weak su-pervision in the rationalizing process. Using publicdatasets as validation (Zaidan et al., 2007; Cartonet al., 2018), we evaluate the performance variationof different rationalized models, and show that in-cluding domain knowledge consistently improvesthe quality of extracted rationales.
After selecting the most appropriate method, weconduct an empirical investigation of prevalentmisinformation types. Using archived fact-checksfrom Snopes.com, spanning from its founding in1994 to 2021, we extract rationales by applyingthe selected model with theorized misinformationtypes for weak supervision (Wardle, 2017), and
then cluster rationales based on their semantic simi-larity to summarize prevalent misinformation types.We identify ten types of misinformation stories, apreview of which are shown in Figure 1.
Using our derived lexicon of these clustered mis-information stories, we then explore the evolutionof misinformation types over the last ten years.Our key findings include: increased prevalence ofconspiracy theories, fabricated content, and digitalmanipulation; and decreased prevalence of legendsand tales, pranks and jokes, mistakes and errors,etc. We also conducted two case studies on notableevents that involve grave misinformation. Fromthe case study of US presidential elections, we ob-serve that the most prevalent misinformation typefor both the 2016 and 2020 elections is fabricatedcontent, while the 2016 election has more hoaxesand satires. From the case study of pandemics,our results show that the H1N1 pandemic in 2009has more legends and tales, while the COVID-19pandemic attracts more conspiracy theories.
The code and data used in the paper are availableat: https://factcheck.shanjiang.me.
2 Related Work
There is a rich literature that has studied the on-line misinformation ecosystem from multiple per-spectives (Del Vicario et al., 2016; Lazer et al.,2018). Within the computational linguistics com-munity, from an audiences’ perspective, Jiang andWilson (2018) found that social media users ex-pressed different linguistic signals when respond-ing to false claims, and the authors later usedthese signals to model and measure (dis)beliefsin (mis)information (Jiang et al., 2020b; Metzgeret al., 2021). From a platforms’ perspective, re-searchers have assisted platforms in designingnovel misinformation detection methods (Wu et al.,2019; Lu and Li, 2020; Vo and Lee, 2018, 2020),as well as audited existing misinformation interven-tion practices (Robertson et al., 2018; Jiang et al.,2019, 2020c; Hussein et al., 2020).
In this work, we study another key player in themisinformation ecosystem, storytellers, and inves-tigate the prevalent types of misinformation toldto date. From the storytellers’ perspective, Wardle(2017) theorized several potential misinformationtypes (e.g., satire or parody, misleading content,and false connection), yet no empirical evidencehas been connected to this typology. Additionally,researchers have investigated specific types of mis-

619
information as case studies, e.g., state-sponsoreddisinformation (Starbird et al., 2019; Wilson andStarbird, 2020), fauxtography (Zannettou et al.,2018; Wang et al., 2021), and conspiracy theo-ries (Samory and Mitra, 2018; Phadke et al., 2021).In this paper, we aim to structurize these misinfor-mation stories to theorized or novel types.
3 Rationalized Neural Models
Realizing our intuition (as described in § 1) re-quires neural models to (at least shallowly) reasonabout predictions. In this section, we introduceexisting rationalized neural models and propose toinclude domain knowledge as weak supervision inthe rationalizing process. We then experiment withpublic datasets and lexicons for evaluation.
3.1 Problem Formulation
In a standard text classification problem, each in-stance is in a form of (x,y). x = [xi] ∈ V l
x isthe input token sequence of length l, where Vx isthe vocabulary of the input and i is the index ofeach token xi. y ∈ {0, 1}m is the binary labelof length m. Rationalization requires a model tooutput the prediction y together with a binary maskz = [zi] ∈ {0, 1}l of input length l, indicatingwhich tokens are used (i.e., zi = 1) to make thedecision. These tokens are called rationales.
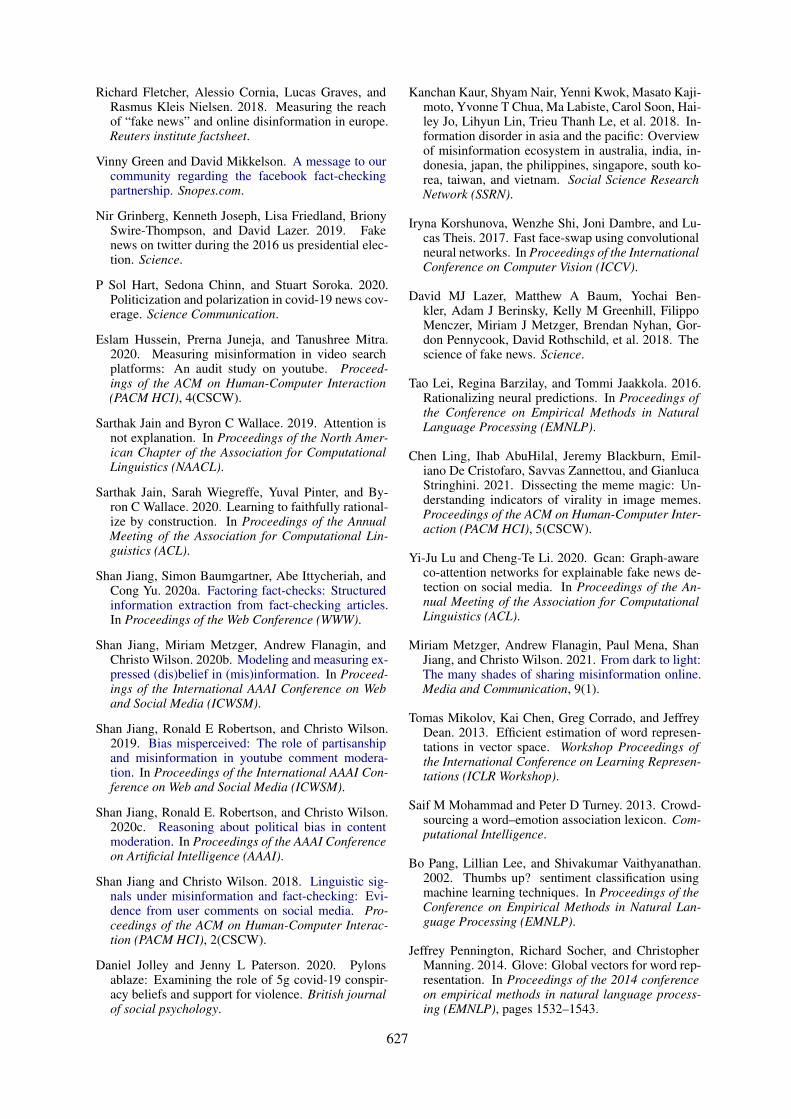
Hard rationalization requires a model to di-rectly output z. Initially proposed by Lei et al.(2016), the model first passes the input x to a tag-ger1 module and samples a binary mask z froma Bernoulli distribution, i.e., z ∼ Tagger(x), andthen uses only unmasked tokens to make a predic-tion of y, i.e., y = Predictor(z,x).2
The loss function of this method contains twoparts. The first part is a standard loss for the pre-diction Ly(y,y), which can be realized using com-mon classification loss, e.g., cross entropy. The sec-ond part is a loss Lz(z)3 aiming to regularize z andencourage conciseness and contiguity of rationaleselection, formulated by Lei et al. (2016). Recentwork proposed to improve the initial model withan adversarial component (Yu et al., 2019; Cartonet al., 2018). Combining these parts together, the
1This module was named generator by Lei et al. (2016).We name it tagger to distinguish it from the NLG problem.
2This module was named encoder by Lei et al. (2016).We name it predictor, consistent with Yu et al. (2019), todistinguish it from the encoder-decoder framework.
3Lz(z) is a simplified term; we discuss its detailed imple-mentation in Appendix § A.
Rationalez
Outputy
Scores
Inputx
Supporter Tagger Predictor
if .. : ..else ..
Hard
Soft
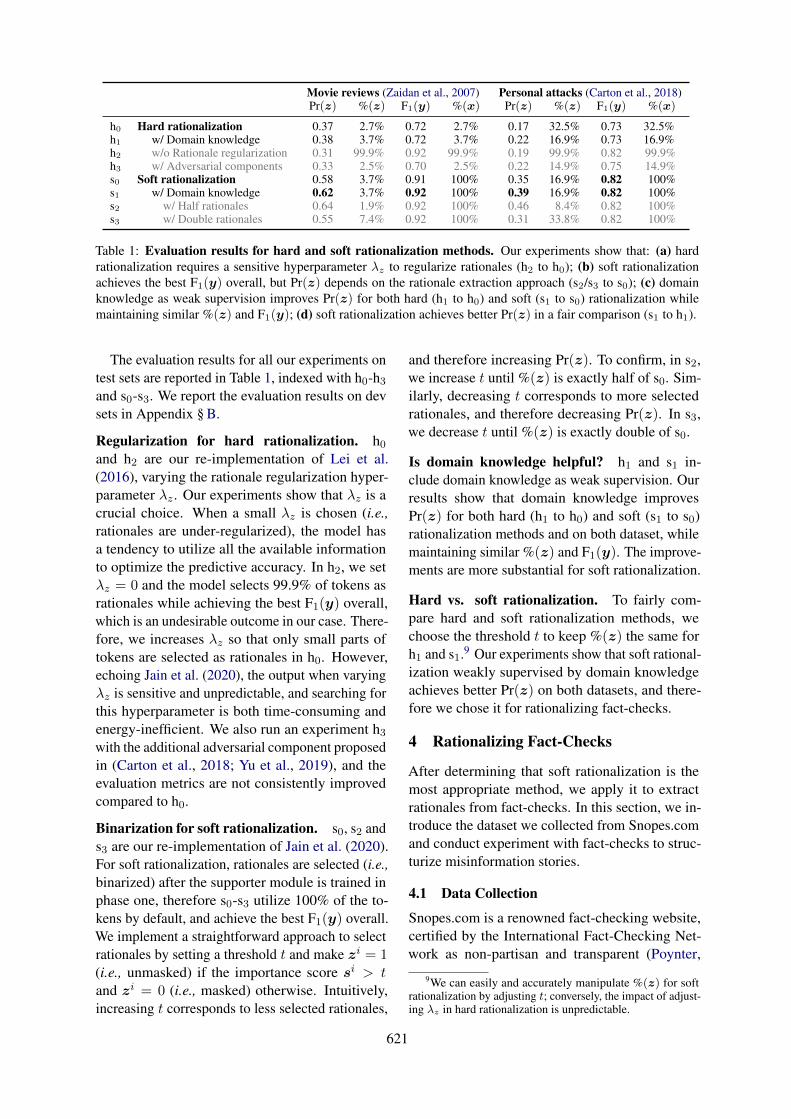
Differentiable computationNon-differentiable computationReinforce-style estimationDomain knowledge semi-supervision
Figure 2: Hard and soft rationalization methods.Hard rationalization is an end-to-end model that firstuses input x to generate rationales z, and then uses un-masked tokens to predict y. Soft rationalization is athree-phased model that first uses input x to predict yand outputs importance scores s, then binarizes s to ra-tionales z, and finally uses unmasked tokens to predicty again as evaluation for faithfulness.
model is trained end-to-end using reinforce-styleestimation (Williams, 1992), as sampling rationalesis a non-differentiable computation. The modulesof hard rationalization are illustrated in Figure 2.
Soft rationalization, in contrast, allows a modelto first output a continuous version of importancescores s = [si] ∈ Rl, and then binarize it to getz. Initially formalized by Jain et al. (2020) as amultiphase method, the model first conducts a stan-dard text classification using a supporter moduley = Supporter(x) and outputs importance scoress, then binarizes s using a tagger module, i.e.,z = Tagger(s), and finally uses only unmaskedtokens of x to make another prediction y to evalu-ate the faithfulness of selected rationales.4
These three modules are trained separately inthree phases.5 Since the supporter and predictor arestandard text classification modules the only lossneeded is for the prediction Ly(y,y). This methodis more straightforward than the hard rationaliza-tion method, as it avoids non-differentiable com-
4The second and third modules were named extractor andclassifier by Jain et al. (2020). We continue using tagger andpredictor to align with the hard rationalization method.
5Tagger is often flexibly designed as a rule-based algo-rithm, therefore no training is needed.
620
putations and the instability induced by reinforce-style estimation. The modules of soft rationaliza-tion are also illustrated in Figure 2.
The popular attention mechanism (Bahdanauet al., 2014) provides built-in access to s. Althoughthere have been debates on the properties achievedby attention-based explanations (Jain and Wallace,2019; Wiegreffe and Pinter, 2019; Serrano andSmith, 2019), rationales extracted by straightfor-ward rules on attention weights were demonstratedas comparable to human-generated rationales (Jainet al., 2020). Additionally, in our use case we onlyneed the rationales themselves as key phrases anddo not require them to faithfully predict y, there-fore the last predictor module can be omitted.
3.2 Domain Knowledge as Weak SupervisionBoth hard and soft rationalization methods canbe trained with or without supervision w.r.t. ra-tionales z (DeYoung et al., 2020)6. When ratio-nales are selected in an unsupervised manner, themodel would intuitively favor rationales that aremost informative to predict the corresponding labelas a result of optimizing the loss function. Thiscould result in some undesirable rationales in ourcase: for example, certain entities like “COVID-19”or “Trump” that are highly correlated with mis-information would be selected as rationales eventhough they do not suggest any misinformationtypes. Therefore, we propose to weakly supervise7
the rationalizing process with domain knowledgeto obtain specific, desired types of rationales.
Assuming a lexicon of vocabulary Vd as domainknowledge, we reprocess the input and generateweak labels for rationales zd = [zid] ∈ {0, 1}lwhere zid = 1 (i.e., unmasked) if xi ∈ Vd andzid = 0 (i.e., masked) otherwise. Then, we includean additional loss item Ld(z, zd) or Ld(s, zd) forthe hard or soft rationalization method.
Combining the loss items together, the objectivefor the end-to-end hard rationalization model is:
minθLy(y,y) + λzLz(z) + λdLd(z, zd),
where θ contains the parameters to estimate andλ(·) are hyperparameters weighting loss items.
Similarly, the objective function for the firstphase of soft rationalization is:
minθLy(y,y) + λdLd(s, zd).
6They are trained with supervision w.r.t. the label y.7Since there is inherently no ground-truth of misinforma-
tion types in fact-check articles.
3.3 Experiments on Public Datasets
We conduct experiments on public datasets to evalu-ate the performance of hard and soft rationalizationmethods, particularly for our needs, and confirmthat including domain knowledge as weak supervi-sion helps with the rationalizing process.
Datasets selection. An ideal dataset for our mod-els should meet the following requirements: (a) for-mulated as a text classification problem, (b) anno-tated with human rationales, and (c) can be as-sociated with high quality lexicons to obtain do-main knowledge. We select two datasets based onthese criteria: the movie reviews dataset releasedby Pang et al. (2002) and later annotated with ra-tionales by Zaidan et al. (2007), which contains2K movie reviews labeled with positive or negativesentiments; and the personal attacks dataset re-leased by Wulczyn et al. (2017) and later annotatedwith rationales by Carton et al. (2018), which con-tains more than 100K Wikipedia comments labeledas personal attacks or not.
Domain knowledge. For the sentiment analysison movie reviews, we use the EmoLex lexicon re-leased by Mohammad and Turney (2013), whichcontains vocabularies of positive and negative sen-timents. For identifying personal attacks, we use alexicon released by Wiegand et al. (2018), whichcontains a vocabulary of abusive words. With corre-sponding vocabularies, we generate weak rationalelabels zd for each dataset.
Evaluation metrics. We choose binary precisionPr(z) to evaluate the quality of extracted rationales,because (a) a perfect recall can be trivially achievedby selecting all tokens as rationales,8 and (b) ourcase of identifying key phrases requires conciserationales. Additionally, we measure the averagepercentage of selected rationales over the inputlength %(z). For predictions, we use macro F1(y)as the evaluation metric as well as the percentageof information used %(x) to make the prediction.
Experimental setup and results. The train, dev,and test sets are pre-specified in public datasets.We optimize hyperparameters for F1(y) on the devsets, and only evaluate rationale quality Pr(z) af-ter a model is decided. We discuss additional im-plementation details (e.g., hyperparameters, lossfunctions, module cells) in Appendix § A.
8We later show that this is the default model behavior ifrationale selection is under-regularized.
621
Movie reviews (Zaidan et al., 2007) Personal attacks (Carton et al., 2018)Pr(z) %(z) F1(y) %(x) Pr(z) %(z) F1(y) %(x)
h0 Hard rationalization 0.37 2.7% 0.72 2.7% 0.17 32.5% 0.73 32.5%h1 w/ Domain knowledge 0.38 3.7% 0.72 3.7% 0.22 16.9% 0.73 16.9%h2 w/o Rationale regularization 0.31 99.9% 0.92 99.9% 0.19 99.9% 0.82 99.9%h3 w/ Adversarial components 0.33 2.5% 0.70 2.5% 0.22 14.9% 0.75 14.9%s0 Soft rationalization 0.58 3.7% 0.91 100% 0.35 16.9% 0.82 100%s1 w/ Domain knowledge 0.62 3.7% 0.92 100% 0.39 16.9% 0.82 100%s2 w/ Half rationales 0.64 1.9% 0.92 100% 0.46 8.4% 0.82 100%s3 w/ Double rationales 0.55 7.4% 0.92 100% 0.31 33.8% 0.82 100%
Table 1: Evaluation results for hard and soft rationalization methods. Our experiments show that: (a) hardrationalization requires a sensitive hyperparameter λz to regularize rationales (h2 to h0); (b) soft rationalizationachieves the best F1(y) overall, but Pr(z) depends on the rationale extraction approach (s2/s3 to s0); (c) domainknowledge as weak supervision improves Pr(z) for both hard (h1 to h0) and soft (s1 to s0) rationalization whilemaintaining similar %(z) and F1(y); (d) soft rationalization achieves better Pr(z) in a fair comparison (s1 to h1).
The evaluation results for all our experiments ontest sets are reported in Table 1, indexed with h0-h3and s0-s3. We report the evaluation results on devsets in Appendix § B.
Regularization for hard rationalization. h0and h2 are our re-implementation of Lei et al.(2016), varying the rationale regularization hyper-parameter λz . Our experiments show that λz is acrucial choice. When a small λz is chosen (i.e.,rationales are under-regularized), the model hasa tendency to utilize all the available informationto optimize the predictive accuracy. In h2, we setλz = 0 and the model selects 99.9% of tokens asrationales while achieving the best F1(y) overall,which is an undesirable outcome in our case. There-fore, we increases λz so that only small parts oftokens are selected as rationales in h0. However,echoing Jain et al. (2020), the output when varyingλz is sensitive and unpredictable, and searching forthis hyperparameter is both time-consuming andenergy-inefficient. We also run an experiment h3with the additional adversarial component proposedin (Carton et al., 2018; Yu et al., 2019), and theevaluation metrics are not consistently improvedcompared to h0.
Binarization for soft rationalization. s0, s2 ands3 are our re-implementation of Jain et al. (2020).For soft rationalization, rationales are selected (i.e.,binarized) after the supporter module is trained inphase one, therefore s0-s3 utilize 100% of the to-kens by default, and achieve the best F1(y) overall.We implement a straightforward approach to selectrationales by setting a threshold t and make zi = 1(i.e., unmasked) if the importance score si > tand zi = 0 (i.e., masked) otherwise. Intuitively,increasing t corresponds to less selected rationales,
and therefore increasing Pr(z). To confirm, in s2,we increase t until %(z) is exactly half of s0. Sim-ilarly, decreasing t corresponds to more selectedrationales, and therefore decreasing Pr(z). In s3,we decrease t until %(z) is exactly double of s0.
Is domain knowledge helpful? h1 and s1 in-clude domain knowledge as weak supervision. Ourresults show that domain knowledge improvesPr(z) for both hard (h1 to h0) and soft (s1 to s0)rationalization methods and on both dataset, whilemaintaining similar %(z) and F1(y). The improve-ments are more substantial for soft rationalization.
Hard vs. soft rationalization. To fairly com-pare hard and soft rationalization methods, wechoose the threshold t to keep %(z) the same forh1 and s1.9 Our experiments show that soft rational-ization weakly supervised by domain knowledgeachieves better Pr(z) on both datasets, and there-fore we chose it for rationalizing fact-checks.
4 Rationalizing Fact-Checks
After determining that soft rationalization is themost appropriate method, we apply it to extractrationales from fact-checks. In this section, we in-troduce the dataset we collected from Snopes.comand conduct experiment with fact-checks to struc-turize misinformation stories.
4.1 Data Collection
Snopes.com is a renowned fact-checking website,certified by the International Fact-Checking Net-work as non-partisan and transparent (Poynter,
9We can easily and accurately manipulate %(z) for softrationalization by adjusting t; conversely, the impact of adjust-ing λz in hard rationalization is unpredictable.
622
2018). We collect HTML webpages of fact-checkarticles from Snopes.com, spanning from its found-ing in 1994 to the beginning of 2021.
Preprocess and statistics. We first preprocesscollected fact-checks by extracting the main articlecontent and verdicts from HTML webpages using acustomized parser, and tokenizing the content withNLTK (Bird, 2006). The preprocessing script isincluded in our released codebase.
After preprocessing, the median sequence lengthof fact-checks is 386 tokens, and 88.6% of fact-checks containing ≤1,024 tokens. Jiang et al.(2020a) found that the most informative contentin fact-checks tended to be located at the head orthe tail of the article content. Therefore, we set themaximum sequence length to 1,024 and truncateover-length fact-checks.
Next, we label each fact-check with a binary la-bel depending on its verdict: (truthful) informationif the verdict is at least mostly true and misinfor-mation otherwise, which results in 2,513 informa-tion and 11,183 misinformation instances.
Additionally, we preemptively mask tokens thatare the exact words as its verdict (e.g., “rate itas false” to “rate it as [MASK]”),10 otherwise pre-dicting the verdict would be trivial and the modelwould copy overlapping tokens as rationales.
Domain knowledge for misinformation types.The domain knowledge comes from two sources:(a) the misinformation types theorized by Wardle(2017), e.g., misleading or fabricated content; and(b) certain variants of verdicts from Snopes.comsuch as satire or scam (Snopes.com, 2021a). Wecombine these into a small vocabulary Vd contain-ing 12 words, listed in Appendix § A.
4.2 Experiments and ResultsWe randomly split the fact-checks to 80% train,10% dev, and 10% test sets, and adjust hyperparam-eters to optimize F1(y) on dev set. For initializa-tion, we train word embeddings using Gensim (Re-hurek and Sojka, 2011) on the entire corpus. Thefinal model achieves F1(y) = 0.75/0.74 on thetest set with/without domain knowledge.
Clustering rationales. To systematically under-stand extracted rationales, we cluster these ratio-nales based on semantic similarity. For each ra-tionale, we average word embeddings to represent
10Verdicts from Snopes.com are structured HTML fieldsthat can be easily parsed.
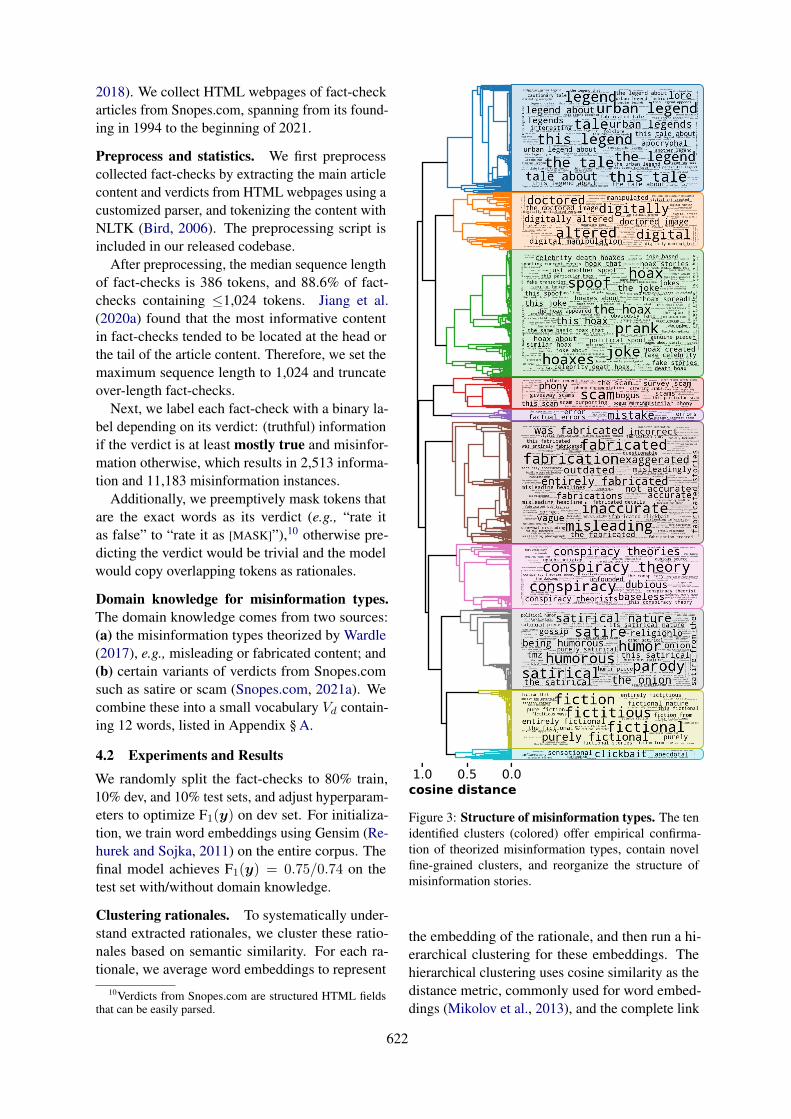
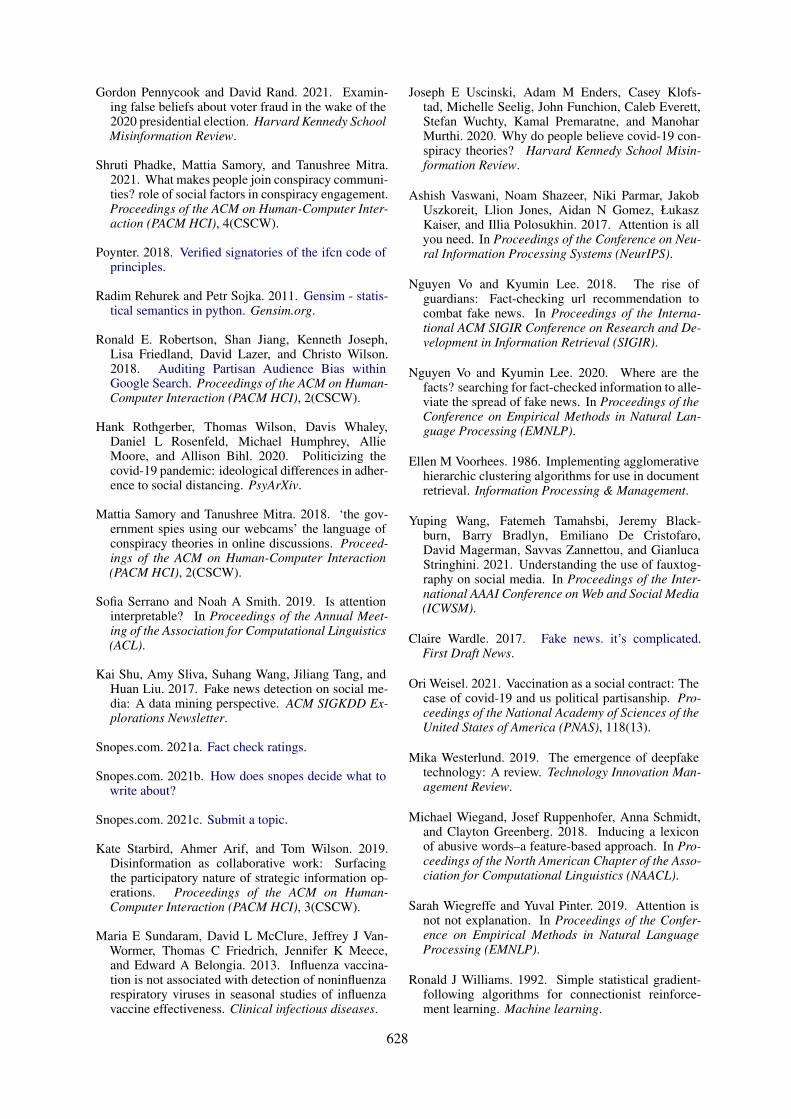
Figure 3: Structure of misinformation types. The tenidentified clusters (colored) offer empirical confirma-tion of theorized misinformation types, contain novelfine-grained clusters, and reorganize the structure ofmisinformation stories.
the embedding of the rationale, and then run a hi-erarchical clustering for these embeddings. Thehierarchical clustering uses cosine similarity as thedistance metric, commonly used for word embed-dings (Mikolov et al., 2013), and the complete link
623
method (Voorhees, 1986) to obtain a relatively bal-anced linkage tree.
The results from the clustering are shown in Fig-ure 3. From the root of the dendrogram, we cantraverse its branches to find clusters until we reacha sensible threshold of cosine distance, and cate-gorize the remaining branches and leaf nodes (i.e.,rationales) to multiple clusters. Figure 3 shows anexample visualization that contains ten clusters ofrationales that are semantically similar to the do-main knowledge, and leaf nodes in each cluster areaggregated to plot a word cloud, with the frequencyof a node encoded as the font size of the phrase.
Note that rationales extracted from soft ratio-nalization are dependent on the chosen thresholdt to binarize importance scores. The example inFigure 3 uses a threshold of t = 0.01. Varyingthe threshold would affect extracted rationales butmostly the ones with low prevalence, and these rarerationales also correspond to small font sizes in theword cloud. Therefore, the effect from varying twould be visually negligible in Figure 3.
Structure of misinformation stories. We makethe following observations from the ten clusters ofmisinformation types identified in Figure 3.
First, the clusters empirically confirm existingdomain knowledge in Vd. Certain theorized mis-information types, such as satires and parodies �from (Wardle, 2017), are identified as individualclusters from fact-checks.
Second, the clusters complement Vd with ad-ditional phrases describing (semantically) similarmisinformation types. For example, our resultsadd “humor” and “gossip” to the same category assatires and parodies � and add “tales” and “lore”to the same category as legends �. This helps usgrasp the similarity between misinformation types,and also enriches the lexicon Vd, which proves use-ful for subsequent analysis in § 5.
Third, we discover novel, fine-grained clustersthat are not highlighted in Vd. There are multiplepossible explanations as to why these misinforma-tion types form their own clusters. Conspiracy theo-ries � are often associated with intentional politicalcampaigns (Samory and Mitra, 2018) which can af-fect their semantics when referenced in fact-checks.In contrast, digital alteration � is a relatively re-cent misinformation tactic that has been enabled bytechnological developments such as FaceSwap (Ko-rshunova et al., 2017) and DeepFake (Westerlund,2019). Hoaxes and pranks � often have a mis-
chievous intent that distinguishes them from otherclusters. Other new clusters include clickbait withinflammatory and sensational language � and en-tirely fictional content �.
Fourth, the clusters reorganize the structure ofthese misinformation types based on their seman-tics, e.g., fabricated and misleading content � be-longs to two types of misinformation in (Wardle,2017), while in our results they are clustered to-gether. This suggests that the semantic distancebetween fabricated and misleading content is lessthan the chosen similarity threshold, at least whenthese misinformation types are referred to by fact-checkers when writing articles.
Finally, the remaining words in Vd are also foundin our rationales. However, due to low prevalence,they are not visible in Figure 3 and do not formtheir own clusters.
5 Evolution of Misinformation
In this section, we leverage the clusters of misinfor-mation types identified by our method as a lexiconand apply it back to the our original fact-checkdataset. Specifically, we analyze the evolution ofmisinformation types over the last ten years andcompare misinformation trends around major real-world events.
Evolution over the last ten years. We first ex-plore the evolution of misinformation over time.We map each fact-check article with one or morecorresponding misinformation types identified byour method, and then aggregate fact-checks by yearfrom before 201011 to the end of 2020 to estimatethe relative ratio of each misinformation type.
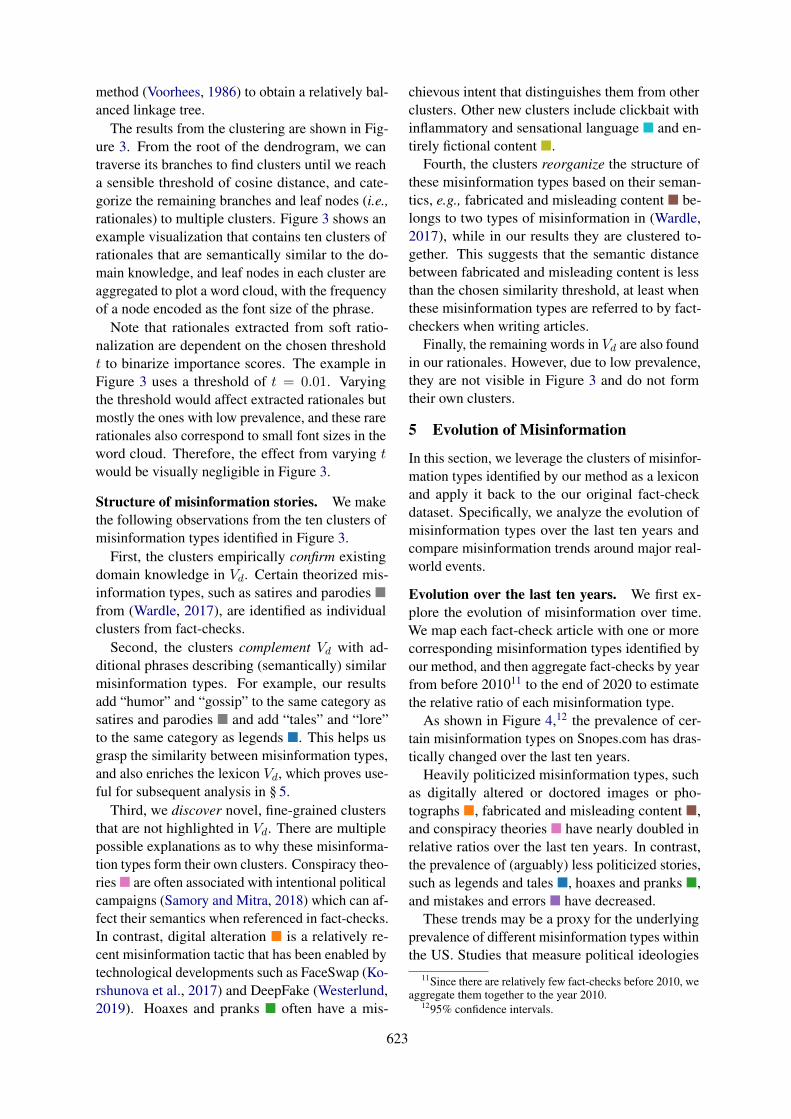
As shown in Figure 4,12 the prevalence of cer-tain misinformation types on Snopes.com has dras-tically changed over the last ten years.
Heavily politicized misinformation types, suchas digitally altered or doctored images or pho-tographs �, fabricated and misleading content �,and conspiracy theories � have nearly doubled inrelative ratios over the last ten years. In contrast,the prevalence of (arguably) less politicized stories,such as legends and tales �, hoaxes and pranks �,and mistakes and errors � have decreased.
These trends may be a proxy for the underlyingprevalence of different misinformation types withinthe US. Studies that measure political ideologies
11Since there are relatively few fact-checks before 2010, weaggregate them together to the year 2010.
1295% confidence intervals.

624
till ’10 ’15 ’20
legend, etc.0
.2
.4
till ’10 ’15 ’20
altered, etc.
till ’10 ’15 ’20
hoax, etc.
till ’10 ’15 ’20
scam, etc.
till ’10 ’15 ’20
mistake, etc.
fabricated, etc.0
.2
.4
conspiracy, etc. satire, etc. fiction, etc. clickbait, etc.
Figure 4: Evolution of misinformation over the last ten years. Conspiracy theories, fabricated content, and dig-ital manipulation have increased in prevalence. The prevalence of (arguably) less politicized stories (e.g., legendsand tales, pranks and jokes, mistakes and errors) has decreased. (95% confidence intervals.)
expressed online have documented increasing po-larization over time (Chinn et al., 2020; Baumannet al., 2020), which could explain increased ratiosof such heavily politicized misinformation. Addi-tionally, the convenience offered by modern digitalalteration software and applications (Korshunovaet al., 2017; Westerlund, 2019) provides a gatewayto proliferating manipulated images or photographsin the misinformation ecosystem.
Alternatively, these trends may reflect shifts inSnopes.com’s priorities. The website, launched in1994, was initially named Urban Legends Refer-ence Pages. Since then it has grown to encompassa broad spectrum of subjects. Due to its limited re-sources, fact-checkers from Snopes.com only covera subset of online misinformation, and their priorityis to “fact-check whatever items the greatest num-ber of readers are asking about or searching for atany given time (Snopes.com, 2021b).”13 Given therising impact of political misinformation in recentyears (Zannettou et al., 2019, 2020), such misin-formation could reach an increasing number ofSnopes.com readers, and therefore the website maydedicate more resources to fact-checking relatedtypes of misinformation. Additionally, Snopes.comhas established collaborations with social mediaplatforms, e.g., Facebook (Green and Mikkelson),to specifically target viral misinformation circu-lating on these platforms, where the rising memeculture could also attract Snopes.com’s attentionand therefore explain a surge of digitally alteredimages (Ling et al., 2021; Wang et al., 2021).
13Users can submit a topic to Snopes.com on its contactpage (Snopes.com, 2021c), the results from which may affectSnopes.com’s priorities.
2016 vs. 2020 US presidential election. Wenow compare misinformation types between the2016 and 2020 elections. To filter for relevance, weconstrain our analysis to fact-checks that (1) werepublished in the election years and (2) included thenames of the presidential candidates and/or theirrunning mates (e.g., “Joe Biden” and “Kamala Har-ris”). This results in 2,586 fact-checks for the 2016election and 2,436 fact-checks for 2020.
The prevalence of each misinformation type isshown in Figure 5. We observe that the relativeratios of many misinformation types are similar be-tween the two elections, e.g., legends and tales �and bogus scams �, while the 2016 election hasmore hoaxes �, satires �, etc. The most prevalenttype during both elections is fabricated and mis-leading content �, next to conspiracy theories �.
H1N1 vs. COVID-19. Finally, we compare mis-information types between the H1N1 pandemic in2009 and the COVID-19 pandemic. For H1N1 re-lated fact-checks, we search for keywords “flu”,“influenza”, and “H1N1” in fact-checks and con-strain the publication date until the end of 2012.14
For COVID-19 related fact-checks, we search forkeywords “COVID-19” and “coronavirus”, andonly consider fact-checks published in 2019 orlater, which results in 833 fact-checks for the H1N1pandemic and 656 fact-checks for COVID-19.
The relative ratio of each misinformation typeis also shown in Figure 5. We observe that theprevalence of some misinformation types are sig-
14WHO declared an end to the global 2009 H1N1 pandemicon August 10, 2010, yet misinformation about H1N1 contin-ues to spread (Sundaram et al., 2013), therefore we extend thetime window by two more years.

625
0 .2 .4 clickbait, etc.
fiction, etc.
satire, etc.
conspiracy, etc.
fabricated, etc.
mistake, etc.
scam, etc.
hoax, etc.
altered, etc.
legend, etc.
’16 US election’20 US election
0 .3 .6
H1N1COVID-19
Figure 5: Misinformation between notable events.The most prevalent misinformation type for both USpresidential elections is fabricated content, while the2016 election has more hoaxes and satires. The H1N1pandemic in 2009 has more legends and tales, while theCOVID-19 pandemic attracts more conspiracy theories.(95% confidence intervals.)
nificantly different between two pandemics, e.g.,hoaxes �, mistakes �. Notably, the H1N1 pan-demic has many more legends and tales �, whileCOVID-19 has more conspiracy theories �. Theincreased prevalence of COVID-19 related conspir-acies aligns with recent work measuring the samephenomena (Uscinski et al., 2020; Jolley and Pater-son, 2020), especially as the COVID-19 pandemicbecomes increasingly politicized (Hart et al., 2020;Rothgerber et al., 2020; Weisel, 2021).
6 Discussion
In this section, we discuss limitations of our workand future directions, and finally conclude.
Limitations and future directions. We adopteda computational approach to investigate our re-search question, and this method inherently sharescommon limitations with observational studies,e.g., prone to bias and confounding (Benson andHartz, 2000). Specifically, our corpus containsfact-checks from Snopes.com, one of the mostcomprehensive fact-checking agencies in the US.
Snopes.com covers a broader spectrum of top-ics than politics-focused fact-checkers (e.g., Politi-Fact.com, FactCheck.org),15 and thus we argue thatit covers a representative sample of misinforma-tion within the US. However, Snopes.com may notbe representative of the international misinforma-tion ecosystem (Ahinkorah et al., 2020; Kaur et al.,2018; Fletcher et al., 2018). In the future, we hopethat our method can help characterize misinforma-tion comparatively on a global scale when morestructured fact-checks become available.16 Addi-tionally, fact-checkers are time constrained, as thusthe misinformation stories they cover tend to behigh-profile. Therefore low-prevalence, long-tailmisinformation stories may not be observed in ourstudy. Understanding low-volume misinformationtypes may require a different collection of corporaother than fact-checks, e.g., a cross-platform inves-tigation on social media conversations (Wilson andStarbird, 2020; Abilov et al., 2021).
Lastly, the misinformation types we extract fromour weakly supervised approach are not validatedwith ground-truth labels. This is largely due tothe lack of empirical knowledge on misinforma-tion types, and therefore we are unable to providespecific guidance to annotators. Although the clus-ters in Figure 3 provide straightforward structure ofmisinformation stories, in future work, we plan toleverage these results to construct annotation guide-lines and obtain human-identified misinformationtypes for further analysis.
Conclusion. In this paper, we identify ten preva-lent misinformation types with rationalized modelson fact-checks and analyze their evolution overthe last ten years and between notable events. Wehope that this paper offers an empirical lens tothe systematic understanding of fine-grained mis-information types, and complements existing workinvestigating the misinformation problem.
Acknowledgments
This research was supported in part by NSF grantIIS-1553088. Any opinions, findings, and conclu-sions or recommendations expressed in this mate-rial are those of the authors and do not necessarilyreflect the views of the NSF.
15Also note that including these additional fact-checkers inthe corpus would lead to oversampling of overlapping topics(e.g., politics).
16Less-structured and under-represented fact-checks aredifficult for computational modeling (Jiang et al., 2020a).
626
Ethical Considerations
This paper uses Snopes.com fact-checks to trainand validate our models, and also includes severalquotes and snippets of fact-checks.
We consider our case a fair use under the US17
copyright law, which permits limited use of copy-righted material without the need for permissionfrom the copyright holder.
According to 17 U.S.C. § 107, we discuss howour research abides the principles that are consid-ered for a fair use judgment:
• Purpose and character of the use: we use fact-checks for noncommercial research purposeonly, and additionally, using textual contentfor model training is considered to be trans-formative, cf. Authors Guild, Inc. v. GoogleInc. (2013, 2015, 2016).
• Amount and substantiality: we present onlysnippets of fact-checks for illustrative purposein our paper (i.e., several quotes and snippetsin text and figures), and only URLs to originalfact-checks in our public dataset.
• Effect upon work’s value: we do not identifyany adverse impact our work may have on thepotential market (e.g., ads, memberships) ofthe copyright holder.
The end goal of our research aligns with that ofSnopes.com, i.e., to rebut misinformation and torestore credibility to the online information ecosys-tem. We hope the aggregated knowledge of fact-checks from our models can shed light on this roadand be a helpful addition to the literature.
References17 U.S.C. § 107. Limitations on exclusive rights: Fair
use.
Anton Abilov, Yiqing Hua, Hana Matatov, Ofra Amir,and Mor Naaman. 2021. Voterfraud2020: a multi-modal dataset of election fraud claims on twitter. InProceedings of the International AAAI Conferenceon Web and Social Media (ICWSM).
Bright Opoku Ahinkorah, Edward Kwabena Ameyaw,John Elvis Hagan Jr, Abdul-Aziz Seidu, and ThomasSchack. 2020. Rising above misinformation or fakenews in africa: Another strategy to control covid-19spread. Frontiers in Communication.
Authors Guild, Inc. v. Google Inc. 2013. 954 f. supp.2d 282 - dist. court, sd new york.17Where the authors and Snopes.com reside.
Authors Guild, Inc. v. Google Inc. 2015. 804 f. 3d 202- court of appeals, 2nd circuit.
Authors Guild, Inc. v. Google Inc. 2016. 136 s. ct.1658, 578 us 15, 194 l. ed. 2d 800 - supreme court.
Dzmitry Bahdanau, Kyunghyun Cho, and Yoshua Ben-gio. 2014. Neural machine translation by jointlylearning to align and translate. In Proceedings ofthe International Conference on Learning Represen-tations (ICLR).
Vian Bakir and Andrew McStay. 2018. Fake news andthe economy of emotions: Problems, causes, solu-tions. Digital journalism.
Fabian Baumann, Philipp Lorenz-Spreen, Igor MSokolov, and Michele Starnini. 2020. Modelingecho chambers and polarization dynamics in socialnetworks. Physical Review Letters.
Kjell Benson and Arthur J Hartz. 2000. A comparisonof observational studies and randomized, controlledtrials. New England Journal of Medicine.
Steven Bird. 2006. Nltk: the natural language toolkit.In Proceedings of the COLING/ACL Interactive Pre-sentation Sessions.
Samuel Carton, Qiaozhu Mei, and Paul Resnick. 2018.Extractive adversarial networks: High-recall expla-nations for identifying personal attacks in social me-dia posts. In Proceedings of the Conference onEmpirical Methods in Natural Language Processing(EMNLP).
Sedona Chinn, P Sol Hart, and Stuart Soroka. 2020.Politicization and polarization in climate changenews content, 1985-2017. Science Communication.
Michela Del Vicario, Alessandro Bessi, Fabiana Zollo,Fabio Petroni, Antonio Scala, Guido Caldarelli,H Eugene Stanley, and Walter Quattrociocchi. 2016.The spreading of misinformation online. Proceed-ings of the National Academy of Sciences of theUnited States of America (PNAS), 113(3).
Jacob Devlin, Ming-Wei Chang, Kenton Lee, andKristina Toutanova. 2019. Bert: Pre-training of deepbidirectional transformers for language understand-ing. In Proceedings of the North American Chap-ter of the Association for Computational Linguistics(NAACL).
Jay DeYoung, Sarthak Jain, Nazneen Fatema Rajani,Eric Lehman, Caiming Xiong, Richard Socher, andByron C Wallace. 2020. Eraser: a benchmark toevaluate rationalized nlp models. In Proceedings ofthe Annual Meeting of the Association for Computa-tional Linguistics (ACL).
Dan Evon. 2019. Is greta thunberg the ‘highest paidactivist’? Snopes.com.
627
Richard Fletcher, Alessio Cornia, Lucas Graves, andRasmus Kleis Nielsen. 2018. Measuring the reachof “fake news” and online disinformation in europe.Reuters institute factsheet.
Vinny Green and David Mikkelson. A message to ourcommunity regarding the facebook fact-checkingpartnership. Snopes.com.
Nir Grinberg, Kenneth Joseph, Lisa Friedland, BrionySwire-Thompson, and David Lazer. 2019. Fakenews on twitter during the 2016 us presidential elec-tion. Science.
P Sol Hart, Sedona Chinn, and Stuart Soroka. 2020.Politicization and polarization in covid-19 news cov-erage. Science Communication.
Eslam Hussein, Prerna Juneja, and Tanushree Mitra.2020. Measuring misinformation in video searchplatforms: An audit study on youtube. Proceed-ings of the ACM on Human-Computer Interaction(PACM HCI), 4(CSCW).
Sarthak Jain and Byron C Wallace. 2019. Attention isnot explanation. In Proceedings of the North Amer-ican Chapter of the Association for ComputationalLinguistics (NAACL).
Sarthak Jain, Sarah Wiegreffe, Yuval Pinter, and By-ron C Wallace. 2020. Learning to faithfully rational-ize by construction. In Proceedings of the AnnualMeeting of the Association for Computational Lin-guistics (ACL).
Shan Jiang, Simon Baumgartner, Abe Ittycheriah, andCong Yu. 2020a. Factoring fact-checks: Structuredinformation extraction from fact-checking articles.In Proceedings of the Web Conference (WWW).
Shan Jiang, Miriam Metzger, Andrew Flanagin, andChristo Wilson. 2020b. Modeling and measuring ex-pressed (dis)belief in (mis)information. In Proceed-ings of the International AAAI Conference on Weband Social Media (ICWSM).
Shan Jiang, Ronald E Robertson, and Christo Wilson.2019. Bias misperceived: The role of partisanshipand misinformation in youtube comment modera-tion. In Proceedings of the International AAAI Con-ference on Web and Social Media (ICWSM).
Shan Jiang, Ronald E. Robertson, and Christo Wilson.2020c. Reasoning about political bias in contentmoderation. In Proceedings of the AAAI Conferenceon Artificial Intelligence (AAAI).
Shan Jiang and Christo Wilson. 2018. Linguistic sig-nals under misinformation and fact-checking: Evi-dence from user comments on social media. Pro-ceedings of the ACM on Human-Computer Interac-tion (PACM HCI), 2(CSCW).
Daniel Jolley and Jenny L Paterson. 2020. Pylonsablaze: Examining the role of 5g covid-19 conspir-acy beliefs and support for violence. British journalof social psychology.
Kanchan Kaur, Shyam Nair, Yenni Kwok, Masato Kaji-moto, Yvonne T Chua, Ma Labiste, Carol Soon, Hai-ley Jo, Lihyun Lin, Trieu Thanh Le, et al. 2018. In-formation disorder in asia and the pacific: Overviewof misinformation ecosystem in australia, india, in-donesia, japan, the philippines, singapore, south ko-rea, taiwan, and vietnam. Social Science ResearchNetwork (SSRN).
Iryna Korshunova, Wenzhe Shi, Joni Dambre, and Lu-cas Theis. 2017. Fast face-swap using convolutionalneural networks. In Proceedings of the InternationalConference on Computer Vision (ICCV).
David MJ Lazer, Matthew A Baum, Yochai Ben-kler, Adam J Berinsky, Kelly M Greenhill, FilippoMenczer, Miriam J Metzger, Brendan Nyhan, Gor-don Pennycook, David Rothschild, et al. 2018. Thescience of fake news. Science.
Tao Lei, Regina Barzilay, and Tommi Jaakkola. 2016.Rationalizing neural predictions. In Proceedings ofthe Conference on Empirical Methods in NaturalLanguage Processing (EMNLP).
Chen Ling, Ihab AbuHilal, Jeremy Blackburn, Emil-iano De Cristofaro, Savvas Zannettou, and GianlucaStringhini. 2021. Dissecting the meme magic: Un-derstanding indicators of virality in image memes.Proceedings of the ACM on Human-Computer Inter-action (PACM HCI), 5(CSCW).
Yi-Ju Lu and Cheng-Te Li. 2020. Gcan: Graph-awareco-attention networks for explainable fake news de-tection on social media. In Proceedings of the An-nual Meeting of the Association for ComputationalLinguistics (ACL).
Miriam Metzger, Andrew Flanagin, Paul Mena, ShanJiang, and Christo Wilson. 2021. From dark to light:The many shades of sharing misinformation online.Media and Communication, 9(1).
Tomas Mikolov, Kai Chen, Greg Corrado, and JeffreyDean. 2013. Efficient estimation of word represen-tations in vector space. Workshop Proceedings ofthe International Conference on Learning Represen-tations (ICLR Workshop).
Saif M Mohammad and Peter D Turney. 2013. Crowd-sourcing a word–emotion association lexicon. Com-putational Intelligence.
Bo Pang, Lillian Lee, and Shivakumar Vaithyanathan.2002. Thumbs up? sentiment classification usingmachine learning techniques. In Proceedings of theConference on Empirical Methods in Natural Lan-guage Processing (EMNLP).
Jeffrey Pennington, Richard Socher, and ChristopherManning. 2014. Glove: Global vectors for word rep-resentation. In Proceedings of the 2014 conferenceon empirical methods in natural language process-ing (EMNLP), pages 1532–1543.
628
Gordon Pennycook and David Rand. 2021. Examin-ing false beliefs about voter fraud in the wake of the2020 presidential election. Harvard Kennedy SchoolMisinformation Review.
Shruti Phadke, Mattia Samory, and Tanushree Mitra.2021. What makes people join conspiracy communi-ties? role of social factors in conspiracy engagement.Proceedings of the ACM on Human-Computer Inter-action (PACM HCI), 4(CSCW).
Poynter. 2018. Verified signatories of the ifcn code ofprinciples.
Radim Rehurek and Petr Sojka. 2011. Gensim - statis-tical semantics in python. Gensim.org.
Ronald E. Robertson, Shan Jiang, Kenneth Joseph,Lisa Friedland, David Lazer, and Christo Wilson.2018. Auditing Partisan Audience Bias withinGoogle Search. Proceedings of the ACM on Human-Computer Interaction (PACM HCI), 2(CSCW).
Hank Rothgerber, Thomas Wilson, Davis Whaley,Daniel L Rosenfeld, Michael Humphrey, AllieMoore, and Allison Bihl. 2020. Politicizing thecovid-19 pandemic: ideological differences in adher-ence to social distancing. PsyArXiv.
Mattia Samory and Tanushree Mitra. 2018. ‘the gov-ernment spies using our webcams’ the language ofconspiracy theories in online discussions. Proceed-ings of the ACM on Human-Computer Interaction(PACM HCI), 2(CSCW).
Sofia Serrano and Noah A Smith. 2019. Is attentioninterpretable? In Proceedings of the Annual Meet-ing of the Association for Computational Linguistics(ACL).
Kai Shu, Amy Sliva, Suhang Wang, Jiliang Tang, andHuan Liu. 2017. Fake news detection on social me-dia: A data mining perspective. ACM SIGKDD Ex-plorations Newsletter.
Snopes.com. 2021a. Fact check ratings.
Snopes.com. 2021b. How does snopes decide what towrite about?
Snopes.com. 2021c. Submit a topic.
Kate Starbird, Ahmer Arif, and Tom Wilson. 2019.Disinformation as collaborative work: Surfacingthe participatory nature of strategic information op-erations. Proceedings of the ACM on Human-Computer Interaction (PACM HCI), 3(CSCW).
Maria E Sundaram, David L McClure, Jeffrey J Van-Wormer, Thomas C Friedrich, Jennifer K Meece,and Edward A Belongia. 2013. Influenza vaccina-tion is not associated with detection of noninfluenzarespiratory viruses in seasonal studies of influenzavaccine effectiveness. Clinical infectious diseases.
Joseph E Uscinski, Adam M Enders, Casey Klofs-tad, Michelle Seelig, John Funchion, Caleb Everett,Stefan Wuchty, Kamal Premaratne, and ManoharMurthi. 2020. Why do people believe covid-19 con-spiracy theories? Harvard Kennedy School Misin-formation Review.
Ashish Vaswani, Noam Shazeer, Niki Parmar, JakobUszkoreit, Llion Jones, Aidan N Gomez, ŁukaszKaiser, and Illia Polosukhin. 2017. Attention is allyou need. In Proceedings of the Conference on Neu-ral Information Processing Systems (NeurIPS).
Nguyen Vo and Kyumin Lee. 2018. The rise ofguardians: Fact-checking url recommendation tocombat fake news. In Proceedings of the Interna-tional ACM SIGIR Conference on Research and De-velopment in Information Retrieval (SIGIR).
Nguyen Vo and Kyumin Lee. 2020. Where are thefacts? searching for fact-checked information to alle-viate the spread of fake news. In Proceedings of theConference on Empirical Methods in Natural Lan-guage Processing (EMNLP).
Ellen M Voorhees. 1986. Implementing agglomerativehierarchic clustering algorithms for use in documentretrieval. Information Processing & Management.
Yuping Wang, Fatemeh Tamahsbi, Jeremy Black-burn, Barry Bradlyn, Emiliano De Cristofaro,David Magerman, Savvas Zannettou, and GianlucaStringhini. 2021. Understanding the use of fauxtog-raphy on social media. In Proceedings of the Inter-national AAAI Conference on Web and Social Media(ICWSM).
Claire Wardle. 2017. Fake news. it’s complicated.First Draft News.
Ori Weisel. 2021. Vaccination as a social contract: Thecase of covid-19 and us political partisanship. Pro-ceedings of the National Academy of Sciences of theUnited States of America (PNAS), 118(13).
Mika Westerlund. 2019. The emergence of deepfaketechnology: A review. Technology Innovation Man-agement Review.
Michael Wiegand, Josef Ruppenhofer, Anna Schmidt,and Clayton Greenberg. 2018. Inducing a lexiconof abusive words–a feature-based approach. In Pro-ceedings of the North American Chapter of the Asso-ciation for Computational Linguistics (NAACL).
Sarah Wiegreffe and Yuval Pinter. 2019. Attention isnot not explanation. In Proceedings of the Confer-ence on Empirical Methods in Natural LanguageProcessing (EMNLP).
Ronald J Williams. 1992. Simple statistical gradient-following algorithms for connectionist reinforce-ment learning. Machine learning.

629
Tom Wilson and Kate Starbird. 2020. Cross-platformdisinformation campaigns: lessons learned and nextsteps. Harvard Kennedy School Misinformation Re-view.
Lianwei Wu, Yuan Rao, Haolin Jin, Ambreen Nazir,and Ling Sun. 2019. Different absorption from thesame sharing: Sifted multi-task learning for fakenews detection. In Proceedings of the Conferenceon Empirical Methods in Natural Language Process-ing (EMNLP).
Ellery Wulczyn, Nithum Thain, and Lucas Dixon. 2017.Ex machina: Personal attacks seen at scale. In Pro-ceedings of the Web Conference (WWW).
Mo Yu, Shiyu Chang, Yang Zhang, and TommiJaakkola. 2019. Rethinking cooperative rationaliza-tion: Introspective extraction and complement con-trol. In Proceedings of the Conference on EmpiricalMethods in Natural Language Processing (EMNLP).
Omar Zaidan, Jason Eisner, and Christine Piatko. 2007.Using “annotator rationales” to improve machinelearning for text categorization. In Proceedings ofthe North American Chapter of the Association forComputational Linguistics (NAACL).
Savvas Zannettou, Tristan Caulfield, Jeremy Black-burn, Emiliano De Cristofaro, Michael Sirivianos,Gianluca Stringhini, and Guillermo Suarez-Tangil.2018. On the origins of memes by means of fringeweb communities. In Proceedings of the ACM Inter-net Measurement Conference (IMC).
Savvas Zannettou, Tristan Caulfield, Barry Bradlyn,Emiliano De Cristofaro, Gianluca Stringhini, andJeremy Blackburn. 2020. Characterizing the use ofimages in state-sponsored information warfare oper-ations by russian trolls on twitter. In Proceedingsof the International AAAI Conference on Web andSocial Media (ICWSM).
Savvas Zannettou, Tristan Caulfield, William Setzer,Michael Sirivianos, Gianluca Stringhini, and JeremyBlackburn. 2019. Who let the trolls out? towards un-derstanding state-sponsored trolls. In Proceedingsof the ACM Web Science Conference (WebSci).
A Implementation Details
In this section, we discuss additional implementa-tion details that we omitted in the main paper.
Loss functions. For the predictive loss Ly(y,y),we use a common cross entropy loss function.
For the rationale regularization loss Lz(z), weintroduced it as a single item in the main paperfor simplicity, but it actually contains two parts asimplemented by Yu et al. (2019). The first part isto encourage conciseness:
Lzk(z) = max
{∑i
zi − k, 0
},
where∑
i zi represents the number of selected to-
kens, and k is a hyperparameter defining a loss-freeupper-bound for it. The second part is to encouragecontiguity:
Lzl(z) = max
{∑i
∣∣zi − zi−1∣∣− l, 0} ,
where zi − zi−1 denotes a transition betweenzi = 0 and zi−1 = 1 or vice versa, therefore∑
i
∣∣zi − zi−1∣∣ represents the number of rationale
phrases, and l is another hyperparameter defining aloss-free upper-bound for it.
Combining these two parts together, we can fur-ther specify λzLz(z) as λzkLzk(z) + λzlLzl(z).
For domain knowledge weak supervision, wedefine Ld(z, zd) as:
Ld(z, zd) = −∑i
zizid,
which decreases loss by 1 if both zi = 1 andzid = 1, i.e., selecting a token in the domain knowl-edge vocabulary Vd, and has no effect on the lossotherwise. Similarly, we define Ld(s, zd) as:
Ld(s, zd) = −∑i
sizid,
which decreases loss by si if zid = 1, and hasno effect on the loss if zid = 0. This encouragesthe training to increase the importance score si ondomain knowledge to reduce the loss.
With this implementation, there are five hyper-parameters to search for the hard rationalizationmethod: λzk, k, λzl, l and λd, and only one hy-perparameter to search for the soft rationalizationmethod: λd.
Module cells. Each module in soft and hard ra-tionalization methods can be implemented withdifferent neural cells. Here, we consider two com-mon types of choices: RNN cells, e.g., LSTM,and transformer cells (Vaswani et al., 2017), e.g.,BERT (Devlin et al., 2019).
For hard rationalization, the rationale selectionprocess is actively regularized by Lz(z), thereforewe simply choose the cell type that optimizes F1(y)on dev sets, i.e., transformers.
For soft rationalization, the rationale selectionprocess is based on passively generated importancescores (i.e., attention), therefore the inherent be-havioral difference between RNN and transformercells would significantly impact our choice.

630
Test set evaluation Dev set evaluationPr(z) %(z) F1(y) Ac(y) %(x) Pr(z) %(z) F1(y) Ac(y) %(x)
Movie reviews (Zaidan et al., 2007)Hard rationalization 0.37 2.7% 0.72 0.72 2.7% 0.12 3.2% 0.71 0.71 3.5%
w/ Domain knowledge 0.38 3.7% 0.72 0.72 3.7% 0.14 3.9% 0.71 0.71 4.2%w/o Rationale regu. 0.31 99.9% 0.92 0.92 99.9% 0.08 99.9% 0.91 0.91 99.9%w/ Adversarial comp. 0.33 2.5% 0.70 0.70 2.5% 0.13 4.1% 0.70 0.70 3.7%
Soft rationalization 0.58 3.7% 0.91 0.91 100% 0.30 3.9% 0.90 0.90 100%w/ Domain knowledge 0.62 3.7% 0.92 0.92 100% 0.33 3.9% 0.91 0.91 100%
Personal attacks (Carton et al., 2018)Hard rationalization 0.17 32.5% 0.73 0.73 32.5% 0.19 30.2% 0.74 0.74 30.2%
w/ Domain knowledge 0.22 16.9% 0.73 0.73 16.9% 0.23 15.7% 0.74 0.74 15.8%w/o Rationale regu. 0.19 99.9% 0.82 0.82 99.9% 0.20 99.9% 0.84 0.84 99.9%w/ Adversarial comp. 0.22 14.9% 0.75 0.75 14.9% 0.23 15.2% 0.76 0.76 15.2%
Soft rationalization 0.35 16.9% 0.82 0.82 100% 0.37 15.7% 0.84 0.84 100%w/ Domain knowledge 0.39 16.9% 0.82 0.82 100% 0.40 15.7% 0.85 0.85 100%
Fact-checksSoft rationalization - - 0.74 0.83 100% - - 0.72 0.83 100%
w/ Domain knowledge - - 0.75 0.85 100% - - 0.73 0.85 100%
Table 2: Evaluation results on both test and dev sets for hard and soft rationalization methods. An additionalaccuracy metric Ac(y) is included, as well as results for the fact-checks dataset. The results on dev sets align withour findings on test sets in the main paper.
In our experiments, we observe that transformercells often assign strong importance to a single to-ken, but assign near zero weights to its neighboringtokens (possibly as a result of its multi-head atten-tion mechanism), while RNN cells assign strongimportance to a single token, but also some residue,fading weights to its neighboring tokens.
Consider the following example, which showsthe distribution of importance scores generated bytransformer cells, with darker text representinghigher importance scores and lighter text scoringnear zero. In the following example, only the tokenconspiracy is selected as rationale:
“...Furthermore, claims that COVID-19was “manufactured,” or that it “escapedfrom” this Chinese lab, are nothing morethan baseless conspiracy theories...”
In contrast, the following example shows the dis-tribution of importance scores generated by RNNcells for the same snippet, i.e., the token conspir-acy has the strongest importance score, but itsneighboring tokens are also assigned some weightabove the threshold, and therefore the phrase base-less conspiracy theories is selected as rationale:
“...Furthermore, claims that COVID-19was “manufactured,” or that it “escapedfrom” this Chinese lab, are nothing morethan baseless conspiracy theories...”
As we prefer to obtain phrases (i.e., one or moretokens) for rationales, we choose between RNN
cells. After optimizing F1(y) on dev set, we choosebidirectional LSTM initialized with GloVe embed-dings (Pennington et al., 2014) for the soft rational-ization method.
Hyperparameters. As discussed in the paper,we optimize hyperparameters for F1(y) on the devsets.
Since the size of dev sets is relatively small inour experiments, a rigorous grid search for hyper-parameters might overfit to several instances in thedev set, therefore we tune the hyperparameters man-ually starting from the hyperparameters releasedby (Yu et al., 2019) and (Carton et al., 2018).
For movie reviews (Zaidan et al., 2007), thebest-performing model for hard rationalization usesλzk = 5.0, k = 240, λzl = 5.0, l = 10, andλd = 8.0 with domain knowledge as weak supervi-sion, and the best-performing model for soft ratio-nalization uses λd = 0.5.
For personal attacks (Carton et al., 2018), thebest-performing model for hard rationalization usesλzk = 5.0, k = 7, λzl = 5.0, l = 1, and λd = 10.0with domain knowledge as weak supervision, andthe best-performing model for soft rationalizationuses λd = 0.5.
For fact-checks, the best-performing model forsoft rationalization uses λd = 1.0.
Domain knowledge for fact-checks. Vd con-tains the following words, in which the first 5are from Wardle (2017) and the remaining 7 are

631
from Snopes.com (2021a):
“fabricated, manipulated, imposter, mis-leading, parody, satire, unproven, out-dated, scam, legend, miscaptioned, mis-attributed.”
B Additional Results
In this section, we record additional results fromour experiments that we omitted in the main paper.
Validation performance. The evaluation resultsfor all our experiments on both test and dev setsare reported in Table 2. We also include accuracymetric Ac(y) in the table18, and the evaluationresults for fact-checks. Note that evaluation for zis empty for fact-checks, since there are no ground-truth rationales. As shown in Table 2, the resultson dev sets align with our findings on test setsdiscussed in the main paper.
Model size, computing machine and runtime.The number of parameters is 325K for hard ra-tionalization models, and 967K for soft rationaliza-tion models. All experiments were conducted ona 12GB Nvidia Titan X GPU node, and finishedtraining within an hour per experiment.
C Rationale Examples
In this section, we list additional examples of ex-tracted rationales for ten identified misinformationtypes.
For urban legends and tales �:
“...the 1930 Colette short story La Chi-enne (The Bitch) has become an urbanlegend in that its plot is often now relatedas a string of events that...”
For altered or doctored images �:
“...magazine covers of “highest paid”people. These doctored images havefeatured celebrities such as John Legend,Chuck Norris, Bob Dylan, Susan Boyle,and...”
For hoaxes and pranks �:
“...This meme is a hoax. Nobody is (orwas) licking toilets as a form of protestagainst Donald Trump. The imagesshown in the meme were taken from...”
18Our public dataset has balanced positive and negativelabels therefore Ac(y) = F1(y).
For bogus scams �:
“...In October 2019, we came across adecidedly bizarre version of the scam.This time, Nigerian astronaut AbachaTunde was reportedly stuck in spaceand...”
For mistakes and errors �:
“...noted that reports of missing children(which are typically resolved quickly)are often mistakenly confused by thepublic with relatively rare instances of...”
For fabricated content �:
“...The Neon Nettle report was “unusual”because it was completely fabricated:Bono said nothing during his RollingStone interview about “colluding withelites”...”
For baseless conspiracies �:
“...Furthermore, claims that COVID-19was “manufactured,” or that it “escapedfrom” this Chinese lab, are nothing morethan baseless conspiracy theories...”
For satires and parodies �:
“...This item was not a factual recount-ing of real-life events. The article orig-inated with a website that describes itsoutput as being humorous or satiricalin nature...”
For fictitious content �:
“...However, both of these shockingquotes, along with the rest of article inwhich they are found, are completely fic-titious. As the name of the web site im-plies...”
For sensational clickbait �:
“...And Breitbart regurgitated some ofthe pictures as viral clickbait under theheadline “Armed Black Panthers Lobbyfor Democrat Gubernatorial CandidateStacey Abrams”...”