Embed Size (px)
Citation preview

Western Kentucky University Western Kentucky University
TopSCHOLAR® TopSCHOLAR®
Dissertations Graduate School
8-2011
The Preferred Principal: Leadership Traits, Behaviors, and Gender The Preferred Principal: Leadership Traits, Behaviors, and Gender
Characteristics School Teachers Desire in a Building Leader Characteristics School Teachers Desire in a Building Leader
Troy Dan Costellow Western Kentucky University, [email protected]
Follow this and additional works at: https://digitalcommons.wku.edu/diss
Part of the Elementary and Middle and Secondary Education Administration Commons
Recommended Citation Recommended Citation Costellow, Troy Dan, "The Preferred Principal: Leadership Traits, Behaviors, and Gender Characteristics School Teachers Desire in a Building Leader" (2011). Dissertations. Paper 9. https://digitalcommons.wku.edu/diss/9
This Dissertation is brought to you for free and open access by TopSCHOLAR®. It has been accepted for inclusion in Dissertations by an authorized administrator of TopSCHOLAR®. For more information, please contact [email protected].


ii
THE PREFERRED PRINCIPAL: LEADERSHIP TRAITS, BEHAVIORS, AND GENDER CHARACTERISTICS SCHOOL TEACHERS DESIRE IN A
BUILDING LEADER
A Dissertation Presented to
The Faculty of the Educational Leadership Doctoral Program Western Kentucky University
Bowling Green, Kentucky
In Partial Fulfillment Of the Requirements for the Degree
Doctor of Education
By Troy Dan Costellow
August 2011


I dedicate this to my family.
Jenny, you have supported me throughout this journey through your patience, kindness,
and understanding. I love you, and I thank you for being such a wonderful wife and
mother.
Ali and Gavin, I hope one day you will understand why daddy was away so much. We
now have time to make up for time lost. Thank you for asking me stop to dance with
you, play ball, say prayers, or rock you to sleep. I love you both more than you will ever
know.

iv
ACKNOWLEDGEMENTS
First, I give thanks to Jesus for how he has blessed my life. May he use this to
bless others.
I next want to convey my sincere gratitude and appreciation to Dr. Chris Wagner
who has served as my chair, my mentor, my teacher, and my role model for many years
through my journey of becoming a school leader. Through him I have learned not only
how to be an effective administrator, but how to appropriately balance it with the other
important aspects of my life.
To the other members of my committee, I appreciate the countless hours each of
you have spent to ensure I not only complete this degree, but to do so with quality and
rigor. Dr. Bud Schlinker, I thank you for holding me to a very high standard, and for
making me better because of it. Dr. Kyong Hee Chon, though I may never become fully
fluent in statistics, I now can “order off the menu,” and hope to continue learning and
experiencing more. Thank you for your time and patience with me. Dr. Toby Daniel, I
appreciate the support and guidance you have provided to me over many years.
Dr. Elmer Gray was the first person in my life to suggest that I should think about
getting a doctorate. Throughout my earliest graduate coursework in the Department of
Agriculture he encouraged me go for it, though I never considered it possible. Thank
you, Dr. Gray, for planting and watering a seed.
Dr. Jay Fiene, you taught me how to be both smart and tough as an administrator,
characteristics that served you well as you worked tirelessly to help establish this doctoral
program at Western Kentucky University. I am in debt to you for your influence and
diligence.
v
There are so many others to thank for their various contributions. Dr. Winnie
Cohron provided endless encouragement and advice. Amy Wilk spent countless hours
chasing down resources when I had no idea where to start. Bob Cobb generated piles of
data from my research and explained it all in a way that was easy to understand. Emily
Dillard kept the paperwork flowing and always knew the next step I needed to take.
To the superintendents, principals, and teachers who participated in the study, this
certainly would not have happened without you. To the administration and my
colleagues in the Warren County School system, thank you for your support and
encouragement. To the twenty-three other members of the Vanguard cohort, I cannot
imagine completing this journey without you. You have been my friends, my teachers,
and my comrades. You helped prove that learning can be fun!
To my parents, Troy and Ann, I appreciate your support, your sacrifices, and the
value of education you instilled in me. Dad, thanks for teaching me to work hard. Mom,
thanks for bringing your English teaching skills out of retirement to proof my
dissertation.
To my teachers and students, both young and not so much: never, ever stop
learning.
vi
Table of Contents
List of tables……………………………………………………………………………ix
Abstract…………………………………………………………………….………….xii
CHAPTER I: INTRODUCTION……………………………………………………. 1
Gender in School Administration………………………………………………. 3
Gender and Leadership Style…………………………………………………… 5
Transactional and Transformational Leadership……………………………….. 6
Transformational Leadership and Education…………………………………… 9
Purpose of Study………...…….………………………………………………..11
Gender Preferences……….…………………………………………….12
Traits of Leaders………….…………………………………………….12
Transactional and Transformational Leadership…………… …………12
Use of Results…………………………………………………………………. 13
Summary………………………………………………………………………. 14
CHAPTER II: REVIEW OF LITERATURE……………………………………… 15
Introduction……………………………………………………………………. 15
Standards for Leaders…………………………………………………………. 15
Teachers’ Perceptions of Leadership…………………………………………..18
Teachers’ Expectations of School Leaders……………………………………. 23
Cognitive Compatibility………………………………………………………..24
Females in School Administration…………………………………………….. 26
Historical Perspective…………………………………………………………. 27
Gender Preferences……………………………………………………………. 30
Gender Barriers………………………………………………………………... 32
Perceptions of Females in Administration…………………………………….. 33
Differences Between Males and Females.…………………………………….. 34
Organizational Culture………………………………………………………… 35
Changes in Structure and Preparation…………………………………………. 39
The Advancement of Transformational Leadership…………………………... 42
Transactional Leadership…………………………………………………….... 43
Employee’s Hierarchy of Needs………………………………………………. 45
vii
Dimensions of Transformational Leadership………………………………….. 47
Transformational Leadership in Education……………………………………. 48
The Effect of Gender on Transformational Leadership………...……………... 53
Responsibilities of School Leaders……………………………………………. 60
Summary………………………………………………………………………. 68
CHAPTER III: METHOD………………………………………………………….. 71
Introduction……………………………………………………………………. 71
Research Questions……………………………………………………………. 71
Research Design……………………………………………………………...... 72
Participants…………………………………………………………………….. 74
Pilot Test………………………………………………………………………. 76
Measures………………………………………………………………………. 78
Procedures……………………………………………………………………... 81
Data Analysis………………………………………………………………….. 82
Summary………………………………………………………………………. 82
CHAPTER IV – RESULTS…………………………………………………………. 84
Test for Reliability…………………………………………………………….. 87
Analysis of Research Question 1……………………………………………… 87
Analysis of Research Question 2……………………………………………… 88
Analysis of Research Question 3……………………………………………… 92
Analysis of Research Question 4……………………………………………… 96
Analysis of Research Question 5……………………………………………… 98
Summary………………………………………………………………………. 99
CHAPTER V: DISCUSSION……………………………………………………... 101
Introduction…………………………………………………………………... 101
Discussion of Research Question 1…………………………………………... 102
Discussion of Research Question 2…………………………………………... 104
Discussion of Research Question 3…………………………………………... 105
Discussion of Research Question 4…………………………………………... 106
Discussion of Research Question 5…………………………………………... 107
Most Highly-Rated Traits by Teachers and Administrators………………… 110

viii
Further Exploring the Top Five……………………………………………… 112
Communication………………………………………………………. 112
Discipline…………………………………………………………….. 113
Culture………………………………………………………………... 114
Visibility……………………………………………………………... 115
Focus…………………………………………………………………. 116
Other Significant Findings…………………………………………………… 118
Limitations of Study…………………………………………………………. 120
Implications for Practice……………………………………………………... 122
Recommendations for Further Research……………………………………... 123
Conclusion…………………………………………………………………… 125
References….………………………………………………………………… 127
Appendices…………………………………………………………………… 141

ix
List of Tables
Table 1: List and Description of the Responsibilities of School Leaders in Order of Correlation with Student Academic Achievement………………………. 62
Table 2: Demographics of Cluster Sample…………………………………………… 76
Table 3: Participant Information………………………………………………….…... 84
Table 4: Demographic Information of Participating Teachers…...……........................85
Table 5: Demographic Information of Participating Administrators………...…….…. 86
Table 6: Teacher’s Gender Preference For a Principal…………………………….…. 88
Table 7: Rank Order for Male Teachers’ Most Preferred Responsibilities of School Leaders……………………………………………………………..... 89
Table 8: Rank Order for Female Teachers’ Most Preferred Responsibilities of School Leaders……………………………………………………………... 90
Table 9: Differences Between Genders for the Preferred Responsibilities of School Leaders……………………………………………………………..... 91
Table 10: Rank Order for Male Teachers’ Most Highly Preferred Behaviors of Principals…………………..…………………………………………...…... 93
Table 11: Rank Order for Female Teachers’ Most Highly Preferred Behaviors of Principals…………………………………………..…………………...…... 94
Table 12: Differences Between Genders for Teachers’ Preferred Transformational Transformational Behaviors of School Leaders…….…………………...….95
Table 13: Differences Between Genders for Teachers’ Preferred Transactional Behaviors of School Leaders……………………………………………..... 96
Table 14: Principals’ Preferences for the Responsibilities of School Leaders……….. 97
Table 15: Principal’s Self-Rating of Their Frequency of Transformational Behaviors……………………………………………………………………98
Table 16: Principal’s Self-Rating of Their Frequency of Transactional Behaviors.......99
Table 17: Principals’ Most Highly Preferred Responsibilities of School Leaders and Their Correlation with Student Academic Achievement……….......... 107
Table 18: Leadership Behaviors Self-Perceived by Principals as Practiced Frequently to Very Frequently…………………………………………..... 109
Table 19: Top Leadership Traits in Common Between Teachers and Principals….... 110
Table C1: Demographics of Sample Compared to Demographics of Population…... 155
Table K1: Teachers’ Gender Preference of Administrators and their Experience with Each Gender……………………………………………………….... 165

x
Table K2: Teacher’s Preference for Minimal Education Level of Administrators by Teacher Gender……………………………………………………..… 166
Table K3: Teachers’ Mean Ratings of Leadership Traits Showing Significant Differences, Based on Years of Teaching Experience……………...……. 167
Table K4: Teachers’ Mean Ratings of Leadership Behaviors Showing Significant Differences, Based on Years of Teaching Experience……….................... 168
Table K5: Teachers’ Mean Ratings of Leadership Traits Showing Significant Differences, Based on Teachers’ Education Level………………………. 169
Table K6: Teachers’ Mean Ratings of Leadership Behaviors Showing Significant Differences, Based on Teachers’ Education Level…………..................... 170
Table K7: Teachers’ Mean Ratings of Leadership Traits Showing Significant Differences, Based on Leadership Experience…………………...……….171
Table K8: Teachers’ Mean Ratings of Leadership Behaviors Showing Significant Differences, Based on Leadership Experience…………..………………..172
Table K9: Teachers’ Mean Ratings of Leadership Traits Showing Significant Differences, Based on Teacher Gender…………………………..…...…..173
Table K10: Teachers’ Mean Ratings of Leadership Behaviors Showing Significant Differences, Based on Teacher Gender……………...…...….. 174
Table K11: Teachers’ Mean Ratings of Leadership Traits Showing Significant Differences, Based on Teachers’ Preferred Gender of a Principal…...…...175
Table K12: Teachers’ Mean Ratings of Leadership Behaviors Showing Significant Differences, Based on Teachers’ Preferred Gender of Principal…..…………………………………………………………..….. 176
Table K13: Teachers’ Mean Ratings of Leadership Traits Showing Significant Differences, Based on Grade Level Taught………………………..…….. 177
Table K14: Teachers’ Mean Ratings of Leadership Behaviors Showing Significant Differences, Based on Grade Level Taught…………......…... 178
Table K15: Teachers’ Mean Ratings of Leadership Traits Showing Significant Differences, Based on Teachers’ Desired Minimal Education Level for a Principal……………………………………………………….……. 179
Table K16: Teachers’ Mean Ratings of Leadership Behaviors Showing Significant Differences, Based on Teachers’ Desired Minimal Education Level for a Principal ……………….……………..…………...180
Table K17: Principals’ Mean Ratings of their Frequency of Leadership Behaviors Showing Significant Differences, Based on Principals’ Education Level.. 181
Table K18: Gender Differences Among Principals’ Mean Ratings of Leadership Traits………………………………………………………………...….... 182

xi
Table K19: Principals’ Mean Ratings of Leadership Traits Showing Significant Differences, Based on Years of Experience in Administration………..… 183
Table K20: Principals’ Mean Ratings of Frequency of Leadership Behaviors Showing Significant Differences, Based on Years of Experience in School Administration……………………………………...……......…... 184
Table K21: Principals’ Mean Ratings of Frequency of Leadership Behaviors Showing Significant Differences, Based on the Minimal Education Level They Believe a Principal Should Have………………………..…... 185
Table K22: Principals’ Mean Ratings of Leadership Traits Showing Significant Differences, Based on the Minimal Education Level They Believe a Principal Should Have…………………………………………….……... 186
Table K23: Teachers’ and Administrators’ Ordinal Rank of the Responsibilities of School Leaders in Order of Correlation With Student Academic Achievement……………………………………………………..………. 187

xii
THE PREFERRED PRINCIPAL: LEADERSHIP TRAITS, BEHAVIORS, AND
GENDER CHARACTERISTICS SCHOOL TEACHERS DESIRE IN A
BUILDING LEADER
Dan Costellow August 2011 194 Pages
Directed by: Christopher Wagner, Kyong Chon, Tabitha Daniel, and William Schlinker
Educational Leadership Doctoral Program Western Kentucky University
This study of 2,802 teachers and 129 school administrators sought to determine the
gender, leadership traits, and leadership behaviors most preferred by teachers in Kentucky.
Principals were also surveyed to establish which traits they felt were most important for a
school leader to possess, and to determine the frequency at which they practiced various
leadership behaviors.
Participants were from 194 public elementary, middle, and high schools in thirty-
two Kentucky school districts. Leadership traits were based on Marzano, Waters, and
McNulty’s (2005) twenty-one responsibilities of school leaders. Teachers and principals
were asked to indicate the level of importance for school administrators to practice each of
the twenty-one traits. The leadership behaviors portion of the surveys included eight
transactional and eight transformational behaviors, which were not identified in the survey
as such. Teachers were asked to determine how important it was for principals to exhibit
the behaviors, while principals self-assessed the frequency at which they practiced each of
the leadership behaviors.
Results indicated that while the majority of male and female teachers had no
preference in regard to their principal’s gender, each group had a significantly higher
preference for males. Teachers and administrators in nearly every demographic category

xiii
(gender, years of experience, grade level of school, leadership experience, and education
level) chose communication as the most important trait for a principal to possess. Other
traits, including discipline, culture, visibility, and focus, were among those deemed most
important by both teachers and principals. Teachers generally had a higher preference for
transformational behaviors rather than transactional behaviors, and principals indicated that
the behaviors they practiced were more often transformational.
Implications for practice include opportunities for school leaders to analyze their
own traits and behaviors and compare them to those most highly preferred by teachers.
University preparation programs can present the findings to aspiring administrators.
Schools and districts can use the survey format for principal selection and to evaluate
whether principals’ traits and behaviors match those desired by faculty.

1
CHAPTER I: INTRODUCTION
The public education system of the United States is undergoing immense
transformation. The business of educating our youth has become more prominent in our
political, social, and moral debates. Demands placed on teachers and administrators
continue to escalate as standards and expectations increase. Changing technology, high
accountability, financial woes, achievement gaps, and diversity are but a few of the issues
that challenge and complicate the system. The need for exceptional school leaders has
never been greater.
Federal, state, and local educational standards have heightened the bar for those
wishing to enter the principalship. Marginal leadership is no longer acceptable in
education. Gone are the days of simply managing the school facility and operations
while passing out directives. Today’s school leaders must wear many hats while working
cooperatively with various stakeholders to achieve common goals.
As education evolves, so do the expectations and perceptions of the school
principal. The picture of the ideal school leader that individuals paint in their mind is
formed from each person’s individual beliefs, experiences, and needs. This image may
involve a number of variables including race, gender, personality, leadership traits, and
leadership style. We are faced with the dilemma of each person wanting something just a
little different from the next.
In this time of high-stakes accountability, the school board and superintendent of
schools may desire an instructionally-minded principal who has a grasp on standards and
initiatives set forth by the federal, state, and local government. Parents may prefer a
leader who is capable of ensuring high-quality instruction and safety for children, while

2
supporting extracurricular and community events. Students need a principal who can
address their social and emotional developmental needs to help them develop life-skills
and “become better learners” (Kress, Norris, Schoenholz, Elias, & Seigle, 2004, p. 70).
When selecting a school principal, basic qualifications for the job and input from parents,
district administrators, and the community are often considered. However, the needs and
preferences of teachers may sometimes go overlooked.
Teachers have long been recognized as having the most significant impact on
student learning (Wright, Horn, & Sanders, 1997; Rivkin, Hanushek, & Kain, 2005).
They have a variety of needs that must be met in order for them to successfully carry out
their duties. Yet many principals fail to recognize the responsibility they have to serve
teachers in a way that makes them more satisfied with their job, willing to work harder,
and striving to continually develop themselves as professionals.
Teachers need strong leadership and organizational management. Kouzes and
Posner (2007) found leaders who are at their personal best “challenge the process, inspire
a shared vision, enable others to act, model the way, and encourage the heart” (p. 14).
Blasé and Blasé (2000) found that when principals have effective interactions with
teachers with regard to instruction, “processes such as inquiry, reflection, exploration,
and experimentation result; teachers build repertoires of flexible alternatives rather than
collecting rigid teaching procedures and methods” (p. 132). March and Simon (1993)
concluded that the behaviors exhibited by the leader influence the behavior of the
followers throughout the organization. Sheppard (1996) discovered that when
administrators value their beliefs and contributions, teachers are more likely to support
school goals. Although the principal is considered the “head” of the school, Lambert

3
(2002) indicated that the concept of the principal being the sole instructional leader
leaves the talents of teachers untapped and the school leaderless if the principal were to
depart. In order for a school to be an interdependent and effective learning community,
teachers must be empowered with leadership capacity. To achieve this, Lambert states
that principals must be transformative leaders. A transformative, or transformational
leader is one who looks toward a higher purpose, motivating followers to achieve more
than they ever imagined or thought possible (Bass & Bass, 2008).
Melton (2007) similarly reported that beginning teachers become contributing,
developing members of the learning community when they are treated as partners in the
process. Principals who move past the assumption that “hierarchy equals expertise” (p.
27) recognize the true expertise and leadership potential of their staff. They are then able
to lead in a manner essential for learning communities to be effective. Horng and Loeb
(2010) found that strong instructional leadership is necessary for a school to be
successful. “However, defined narrowly only in terms of curriculum and classroom
instruction, instructional leadership is unlikely to result in increased student learning or
other desirable outcomes. . . .School leaders influence classroom teaching, and
consequently student learning, by staffing schools with highly effective teachers and
supporting those teachers with effective teaching and learning environments, rather than
by focusing too narrowly on their own contributions to classroom instruction” (p. 69).
Gender in School Administration
In 1909, Ella Flagg Young declared that "Women are destined to rule the schools
of every city . . . she is no longer satisfied to do the greatest part of the work and yet be
denied leadership" (Blount, 1998, p. 1). While they may not rule the school in every city,
4
they appear to be making progress toward it. Gender in school leadership has garnered
attention in recent years as the percentage of school administrators becomes increasingly
female. Historically viewed as a man’s domain, women have made tremendous gains in
obtaining positions in school administration. This may be due to the evolution of cultural
norms for women in the workplace, or to the shift for school leaders to be less of a
building manager and more of a relationship and culture-building mentor.
Throughout history, a number of factors have contributed to a delay in women
achieving equity in school administration employment. Shakeshaft (1998) pointed out
that in the late 1970’s, the majority of school administrators at every level were males,
most of the students in preparation programs were men, and nearly all school
administration professors were male. Sinclair (1998) discusses the “absence argument”
(p. 17), suggesting that the lack of females obtaining leadership positions is due to the
lack of women in leadership positions. She further explains that when minimal efforts
are made to recruit women into leadership positions, there are fewer role models for other
females to follow. In her interviews with chief executives, she found that the absence of
women from executive levels is not regarded as a major problem or core business issue,
and that some executives feel the solution lies in women learning to adapt to male norms.
Eckman and Kelber (2010) found that many females experience internal conflict
when it comes to considering the principalship. While they desire a successful career in
school administration, they also value their role as a mother and often choose to
experience that ahead of career goals. Said one principal, “Being away from home and
doing all these things and being everything to everybody except your own children or
family is something that moves a lot of professionals ahead. I wasn’t willing to do that at

5
the time that I had children at home” (p. 215). Rosener (1990) discovered that both men
and women experience work-family conflict, but that women experience it at a higher
level. Sinclair (1998) found that “rather than enjoying societal endorsement and
recognition, women [in leadership roles] frequently encounter censure and disapproval”
(p. 93). Instead of taking time to enjoy the early days of bonding following childbirth,
Sinclair stated that many feel pressure from peers to not “let down” the organization by
taking an extended maternity leave.
Gender and Leadership Style
The leadership traits or styles exhibited by women often differ greatly from those
of male school administrators. Reynolds, White, Brayman, and Moore (2008) discovered
that administrators perceive women to generally display a particular set of distinctive
female leadership traits, attitudes, and behaviors that distinguish them from male leaders.
Namely, women leaders are more socially “intuitive,” “collaborative,” “collegial,” and
“consultative,” as well as “emotionally responsive,” “nurturing,” and “motherly” (p. 43).
Rosener's (1990) study of female and male executives with similar backgrounds
found that women are realizing that the “command and control” method of management,
typically perceived as a male management style, is not the only way to successfully
manage an organization. Women are able to draw on the skills and attitudes they develop
as women. Rosener discovered that while men typically exhibited leadership traits
characteristic of “transactional leadership”, female executives used more of a
“transformational” style; shifting from a culture of self-interest into one that pursues
organizational and mutual goals by enhancing others’ feelings of self-worth, encouraging
active participation in decision-making, and sharing of power and information.
6
Bass (1998) found that women leaders were rated significantly higher than men
by their subordinates on several factors that could be considered critical to educational
organizations. These female leaders were rated higher than men in idealized influence,
inspirational motivation, intellectual stimulation, and individual consideration, resulting
in more effective subordinates who expressed greater satisfaction in the workplace.
These qualities can successfully influence a student’s learning ability, which may explain
the success of women leaders in educational organizations.
Transactional and Transformational Leadership
Leadership styles over the last few decades have shifted from top-down, task
driven authoritarian styles to a more hands-on, shared, active approach to leadership.
Educational mandates since the early 1990’s have played a significant role in this shift.
In fact, the opening paragraph of the Kentucky Educational Reform Act of 1990 (KERA)
states: “The General Assembly recognizes that public education involves shared
responsibilities. State government, local communities, parents, students and school
employees must work together to create an efficient public school system” (Western
Kentucky University Libraries, 2006, p. 1).
Additionally, the need to retain federal monies for school programs and meet
academic expectations in the midst of growth, reform, and economic constraints has
forced institutions to pay greater attention to the role school administrators play in the
success of the school. Nearly 40 years ago in its report to Congress, the Senate Select
Committee on Equal Educational Opportunity (U.S. Congress, 1970) had this to say
about the principal:

7
In many ways the school principal is the most important and influential individual
in any school. . . . It is his leadership that sets the tone of the school, the climate
for learning, the level of professionalism and morale of teachers and the degree of
concern for what students may or may not become. He is the main link between
the school and community and the way he performs in that capacity largely
determines the attitudes of students and parents about the school. If a school is a
vibrant, innovative, child-centered place; if it has a reputation for excellence in
teaching; if students are performing to the best of their ability one can almost
always point to the principal’s leadership as the key to success. (p. 56)
Leadership can take on many forms. But what style best leads to student success?
It is obvious that the leadership of the principal is paramount to the success of the school.
While an individual’s leadership style can inspire followers to achieve greater outcomes,
it can also discourage followers to the point of underachievement. As this nation’s
educational system evolves, those who lead must include, encourage, and activate those
being led.
Two enduring styles of leadership that have garnered much attention in business
and education, especially over the last 25 years, are transactional and transformational
leadership. Through his research of rebel and revolutionary leadership in the early
1970’s Downton (1973) developed the early concept of transformational leadership
through his characterizations of charismatic and transcendental leadership. Recognized
as one of the early experts on the topic, James McGregor Burns explored the concept of
transformational leaders in his book Leadership. In his studies of mostly political and
military figures, he described it as a process by which "leaders and followers raise one

8
another to higher levels of motivation and morality" (Burns, 1978, p. 20). He contrasted
this with transactional leadership, which he said occurs when an individual “takes the
initiative in making contact with others for the purpose of an exchange of valued things”
(p. 19). These things could include goods or money, political favor, or hospitality. Each
person is conscious of what is being transacted and the general motives of the parties
involved. Burns concluded that while this may be recognized as an act of leadership, its
nature virtually ensures it will not endure. There is nothing that binds those participating
in it together, nor is there a continued quest for a higher purpose.
Bernard M. Bass is another prominent author on the topic of transformational and
transactional leadership. He contrasts the two by stating, “in exchanging promises for
votes, the transactional leader works within the framework of the self-interests of his or
her constituency, whereas the transformational leader moves to change the framework”
(Bass & Bass, 2008, p. 41). Bass (1985b) suggests that higher-order improvement can
only come from transformational leadership. Leaders who practice it motivate their
followers to do more than they “originally intended” and “even more than they thought
possible" (p. 4). While he overwhelmingly lauded transformational leadership as
generally the most effective, Bass (1999) stated “the best leaders are both
transformational and transactional” (p. 21). Leithwood (1992b) recognized that some
feel transactional leadership practices help people recognize what needs to be done in
order to reach a desired outcome and may also increase their confidence and motivation.
Bass (1985a) considered transactional practices as sometimes essential for carrying out
the daily routines of the organization, but that they fail to stimulate improvement. He
stated that transformational leadership provides an incentive for people to attempt

9
improvements in their practices, enabling “second-order change” in areas such as vision,
empowerment, and collaborative decision-making. Robertson, Wohlstetter, and
Mohrman (1995) found that shared leadership and empowerment leads to high
innovation, enhancement of knowledge, better sharing of information, a stronger vision
for the school, and the development of new ideas. Ayman, Korabik, and Morris (2009)
discovered that transformational leadership not only transforms the leader, but the
subordinate as well. Transformational leaders challenge their followers to learn new
skills and abilities, while approaching situations differently from how they had in the
past.
Transformational Leadership and Education
The characteristics of transformational leadership seem to reflect current trends in
school leadership. Leithwood (1993) stated that transformational leadership approaches
should be advocated more strongly to practicing school administrators and presented
much more prominently in principalship preparation programs. He called for
“commitment” rather than “control” strategies for developing, trying out, and refining
new practices that help achieve the purposes set forth for change. He felt the concept of
“instructional leadership” was a fitting concept for many schools throughout the 1980’s
and early 1990’s, but that it no longer satisfies today’s standards for school leadership;
“transformational leadership” is the model for the next generation of school leadership, as
it “capture[s] the heart of what school administration will have to become (Leithwood,
1992a, p. 1).
Lucas and Valentine (2002) reported that principals who practiced
transformational leadership had a significant influence on the development of teachers

10
and teacher leaders. Their behaviors influenced school leadership teams to also practice
transformational leadership. This impacted school culture by raising teachers’ level of
awareness of outcomes and caused teachers to transcend their own self-interests to work
toward the greater good of the school as a whole. In their research study on school
culture, Engels, Hotton, Devos, Bouckenooghe, and Aelterman (2008) found that schools
with extremely positive school cultures had principals who identified with a role as
mentor or mentor/innovator, which is characteristic of transformational leadership. They
stated that mentors know how to motivate and support employees, and innovators plan
for the future, are creative, and are prepared to take risks. Schools with very positive
school cultures had principals with high achievement orientation “who focus on creating
a flexible, stimulating, participative and supportive environment, who do not only
identify with roles of mentor or innovator but manage to devote most of their time to their
preferred role” (p. 170). Principals at schools with a poor culture held in common some
discrepancies “between the role they want to identify with, their priorities and/or what
they actually do with their time” (p. 170). They tended to focus on stability, control and
predictability but generally felt “overwhelmed with administrative tasks and the constant
buzz of incidents and problems” (p. 171).
Quinn (2005) reported that principals in schools with high rates of discipline
referrals were generally transactional leaders, while schools with transformational
principals were most often associated with low and medium referral rates. The norms
and values of the schools’ organizational cultures influence the rate at which students are
referred for behavior problems. She also reported that school administrators’ leadership
style is central to school outcomes and their influence impacts each layer of the school

11
community. Their capacity for leadership has a direct correlation on the culture of the
school and the level of stress that teachers experience.
Judkins and Rudd (as cited by Barker, 2007) found in their evaluation of twenty
high performing schools that rather than implementing a shopping list of improvements,
successful multi-skilled leaders encouraged a greater “interconnectedness.” A vision that
relied on inputs from various stakeholders resulted in “superb student-teacher relations,”
“a shared sense of vision,” and a “genuine working together” which generated excitement
(p. 31). “Energetic, visionary leadership, a focus on the individual student, the active use
of performance data, a broad and flexible curriculum, and enhanced status and resources
contributed to a climate where teachers were prepared to go ‘the extra mile’” (p. 24).
These behaviors are characteristic of transformational leadership.
Purpose of Study
The intended outcome of this study is to determine what teachers want in a school
leader in regard to gender, leadership traits, and leadership behaviors. “Teachers are
thought to provide the most valid information [in regard to principal leadership
behaviors] because they are closest to the day-to-day operations of the school and the
behaviors of the principal” (Ebmeier; Heck, Larsend, & Marcoulides, as cited by
Marzano et al., 2005, p. 30). In order for principals to effectively lead their staff, it is
essential for them to be knowledgeable of not only the traits that existing research has
identified as necessary for student achievement, but to also keep in mind the preferences
of their faculty. This study will determine which leadership traits principals deem most
important and which leadership behaviors they most often exhibit.
12
Gender Preferences. In consideration of gender preferences, this study seeks to
discover if teachers prefer a male or female school leader. While gender alone is not a
direct indicator of leadership capacity or predictor of leadership style, research evidence
suggests some distinction between men and women’s approaches to management (Logan,
1998; Hackney, 1998, Powell & Graves, 2002; Atwater, Brett, Waldman, DiMare, &
Hayden, 2004; Bass & Bass, 2008; Ayman et al., 2009). This distinction will be explored
more thoroughly in chapter 2.
Traits of Leaders. Utilizing the 21 essential responsibilities of school leaders set
forth by Marzano et al. (2005), this study will establish which of the 21 responsibilities
(or traits) teachers deem most important for principals to possess in order to effectively
lead a school. The researchers reviewed 30 years of data on schools and school
leadership. Their analysis of the findings yielded 21 responsibilities of effective school
leaders that are essential to student academic achievement. Considering the 21
responsibilities individually, teachers will be asked to what extent it is important for their
principal to practice those traits as a school leader. Principals and assistant principals
will also be asked to determine the level of importance each is for an administrator to
possess. The analysis will indicate what similarities may exist between teachers and their
leaders when considering which responsibilities each group most highly values.
Transactional and Transformational Leadership. The third component of this
study is to determine if teachers prefer leadership behaviors that are more transactional or
transformational, and which style their principal most often demonstrates. Based on
leadership studies by Bass and Bass (2008), Burns (1978), Yukl (1987), and Kouzes and
Posner (1987, 2007), teachers will be provided a list of transformational and transactional

13
leadership practices. They will be asked to rate their level of preference for each
behavior. Likewise, principals will be given the same list of behaviors and asked to
indicate how often they exhibit each. A comparison can then be made between the
behaviors teachers desire and those practiced by their administrators. The data can also
be analyzed to determine if teachers prefer more of a transformational or transactional
style, then compared to the style their principals believe they most often use.
There are other variables contained in the survey that may come into play for both
the teachers and administrators, including years of experience, grade level of their school,
highest level of education achieved, and what minimal level of education they think a
principal should have. Additionally, teachers will be asked if they hold a current
leadership role in their school or district. It is possible that teachers who practice
leadership in their profession may have a different perspective on what leadership style or
behaviors are most important for a principal to model.
Use of Results
Results from this study can be used by principal preparation programs to make
students aware of the gender, leadership traits, and leadership style teachers feel are most
important for a school leader to practice. The survey instrument may be useful to a Site-
Based Decision Making (SBDM) council’s or district’s selection of building-level
principals to determine the degree to which the characteristics the candidate possesses
matches with those desired by the faculty. Once utilized by a school, principals and
district-level leaders can employ the findings to plan professional development for
administrators whose leadership traits or style do not match up to the behaviors identified
by research and this study as contributing to both student success and teacher satisfaction.

14
Summary
As expectations of school leaders increase, so must the leadership capacity of
school principals. Years of research have indicated that simply managing the day-to-day
operations of the school is insufficient. Although school administrators must meet the
needs of a variety of the stakeholders, the outcomes of student achievement goals are a
school’s number one priority. While the principal’s leadership affects the culture and
success of a school, it is the teacher who has the greatest level of influence on a student’s
ability to learn. Therefore, the needs of the teacher must be addressed. Principals should
be knowledgeable of the leadership traits and style most highly valued by their teachers
in order to increase instructional effectiveness.

15
CHAPTER II: REVIEW OF LITERATURE
Introduction
Expectations of educational leaders have increased in recent years. Before the
days of high-stakes accountability and national standards tied to sanctions, the school
principal was mostly viewed as simply a building manager. The role of today’s school
leader has expanded to include much more. No longer can a principal be judged solely
on how well he or she handles the daily administrative duties of a school. “We expect
both leadership and management from the same individual” (Manasse, 1985, p. 153). We
also expect them to be the instructional leader of the school, modeling what is expected
for the teachers they lead.
The quality of the principal must relate to a school’s capacity to ensure
achievement for all children (National Association of Elementary School Principals,
2001). The principal must serve the needs of several groups and individuals, including
students, teachers, parents, and officials at the district, state, and national levels. To be
effective, principals must understand what all stakeholders desire from their school
administrator.
Standards for Leaders
The Council of Chief State School Officers (CCSSO, 1996) spent two years
developing a set of model standards for school leaders. The Interstate School Leaders
Licensure Consortium (ISLLC) was formed by personnel from 24 state education
agencies and representatives from various professional associations. The standards they
developed represent a common core of knowledge, dispositions, and performances that
are expected of school leaders. Many states, as part of school administrator certification,

16
require written exams based on these standards:
Standard 1: A school administrator is an educational leader who promotes the
success of all students by facilitating the development, articulation,
implementation, and stewardship of a vision of learning that is shared and
supported by the school community.
Standard 2: A school administrator is an educational leader who promotes the
success of all students by advocating, nurturing, and sustaining a school culture
and instructional program conducive to student learning and staff professional
growth.
Standard 3: A school administrator is an educational leader who promotes the
success of all students by ensuring management of the organization, operations,
and resources for a safe, efficient, and effective learning environment.
Standard 4: A school administrator is an educational leader who promotes the
success of all students by collaborating with families and community members,
responding to diverse community interests and needs, and mobilizing community
resources.
Standard 5: A school administrator is an educational leader who promotes the
success of all students by acting with integrity, fairness, and in an ethical manner.
Standard 6: A school administrator is an educational leader who promotes the
success of all students by understanding, responding to, and influencing the larger
political, social, economic, legal, and cultural context (pp. 10-21).
The National Association of Elementary School Principals (NAESP,
2001) also set out to develop a set of standards for school leaders. According
17
to their publication, Standards for What Principals Should Know and Be Able to Do, the
concept of standards has broad appeal.
“Educators, policymakers, parents, business leaders and others seem to like the
notion of making public our expectations for students and adults, and then holding
people accountable to those expectations. The atmosphere of high-stakes
accountability and testing has created significant political pressure to deliver on
the standards movement’s promise of improved student achievement. . . it’s
meaningless to set high expectations for student performance unless we also set
high expectations for the performance of adults. . . we must improve the
environment in which teaching and learning occur. Principals can no longer
simply be administrators and managers. They must be leaders in improving
instruction and student achievement. They must be the force that creates
collaboration and cohesion around school learning goals and the commitment to
achieve those goals” (p. 1).
NAESP’s (2001) expectations, like those of the CCSSO (1996), give specific
direction to school principals in several areas of leadership that are essential for student
success:
Standard 1: Lead schools in a way that places student and adult learning at the center.
Standard 2: Set high expectations and standards for the academic and social
development of all students and the performance of adults.
Standard 3: Demand content and instruction that ensure student achievement of
agreed-upon academic standards.

18
Standard 4: Create a culture of continuous learning for adults tied to student
learning and other school goals.
Standard 5: Use multiple sources of data as diagnostic tools to assess, identify
and apply instructional improvement.
Standard 6: Actively engage the community to create shared responsibility for
student and school success (pp. 5-10).
While the standards conceived by the CCSSO (1996) and NAESP (2001) seek to
guide administrators, the ultimate outcome is student learning. Central to that outcome is
the teacher. To be effective school leaders, it is important to consider their needs, their
expectations of leadership, and the perceptions they have of school leaders. We must
recognize what they believe constitutes effective leadership.
Teachers’ Perceptions of Leadership
Perhaps R. D. Laing (as cited in Avolio, 1999) was onto something when he said,
“The range of what we think and do is limited by what we fail to notice. And because we
fail to notice that we fail to notice, there is little we can do to change; until we notice how
failing to notice shapes our thoughts and deeds” (p. 3). Regardless of how
knowledgeable a leader may think they are of their own leadership capabilities or which
instrument they use to measure it, leaders are limited by what they see by their own self-
analysis. Considering the perceptions of others is essential to having a complete profile
of leadership capacity.
According to Bass (1990), leadership is often regarded as the single most
important factor in the success or failure of institutions such as schools. A school leader
must be viewed as competent, visionary, and empowering to his or her teachers. While

19
the principal must acknowledge the expectations of other stakeholders in the educational
process, it is the teacher who looks daily to their school administrator to be their leader;
the primary influence on their actions and attitudes.
Unless they have some training or experience in the area, most teachers base their
ideas of effective leadership on perception. School leaders are not likely to provide
teachers with a list of leadership attributes by which to judge their performance. School
districts rarely provide teachers with tools to effectively analyze leadership capability.
Therefore, perceptions of leadership are critical to the success of an organization. Halpin
and Croft (1963) stated, “. . . how a leader really behaves is less important than how the
members of his group perceive that he behaves. It is their perception of his behavior that
will determine the behavior of the group members, and will hence define the
organizational climate” (p. 13).
In her study of teacher perceptions of principal leadership, Manders (2008) found
that teachers intuitively know what they want in an effective leader, but this is rarely
communicated to the principal. She stated that by using survey tools such as a 360
degree analysis, teachers are able to give principals useful feedback on their leadership
style, but that this seldom happens. As Eshbach (2008) discovered, there is often a
significant difference in principal’s self-perception of leadership compared to teacher’s
perceptions of their leadership. Teachers may derive these perceptions from a number of
things, including the leader’s actions, the performance of the organization, external
conditions, stereotypes, and past experience with other school principals (Oplatka &
Tako, 2009). It is important therefore, for principals to realize that while meaningful data
can be gleaned from self-analysis, teachers’ perceptions are likely to be more accurate.

20
In a study involving classroom teachers in a university principal preparation
course, Newton, Fiene, and Wagner (1999) asked teachers to describe their perceptions of
the principalship and to identify factors that influenced the development of those
perceptions. Written narratives of 45 teachers were analyzed using the constructivist
theory of knowledge and learning as a framework to understand the process the teachers
used to develop their perceptions of leadership.
Teachers described principals as having “monumental” influence, being “the top
authority in the school,” and the “vital force” in the lives of others. They believed that
principals have more influence than anyone else on the school, its climate, and on public
education. This influence can be either positive or negative, dramatically affecting all
who are a part of the school (Newton et al., 1999).
They also recognized the responsibilities, rewards, and challenges associated with
the principalship. Positive attributes such as intrinsic rewards, diverse responsibilities,
and feelings of fulfillment were listed, as well as less positive characteristics such as
stress, time constraints, and difficulties faced (Newton et al., 1999).
These teachers recognized a number of personal characteristics or talents as
essential to effective leadership. Principals should be moral, principled, diligent, and
dedicated, possessing common sense and a strong work ethic. They need to be open-
minded, understand imperfections in others, have emotional intelligence, know their
strengths, and be willing to ask for help in areas of weakness. Additionally, these
teachers felt principals should have people skills, social skills, and organizational skills.
They are expected to manage the school, foster a positive school culture that is conducive
to learning, improve student learning, promote the school’s image in the community, and
21
to influence the larger community. To achieve this, principals should be trusting, firm,
fair, and consistent, and not dictate to others (Newton et al., 1999).
Just as Oplatka and Tako (2009) discovered in their study of desirable
constructions of educational leadership, Newton et al. (1999) found that many teachers’
perceptions of principals began with their own grade school experiences. As children,
many of these teachers were affected in either positive or negative ways by their own
principals. One African American teacher who participated in the study recalled her
early perceptions of the treatment of students with a lower socio-economic status by
principals as always negative. Throughout her life she envisioned serving as an
administrator, using those negative perceptions as a reminder that a principal has to be
firm, fair, and consistent with all students. It was only when she became an adult that she
began to develop positive perceptions of the principalship.
Most of the participants in the study reported having few opportunities to engage
in dialogue with principals. Only one of the teachers reported learning about the
experiences faced by principals through friends who were school administrators. Others
learned through attending conferences and assisting with administrative duties within
their schools. It was through these opportunities that they gained a better understanding
of the responsibilities and decision-making processes that principals endured in the
course of their jobs (Newton et al., 1999). It is likely then, that teachers who complete
coursework in school administration and then continue to teach often have a better
understanding of the challenges a principal faces. They may, therefore, be more likely to
support decisions of school leaders on all levels and have more accurate perceptions than
teachers who lack training in school leadership.

22
Pingle and Cox (2007) surveyed elementary principals and teachers in South
Carolina from academically successful and unsuccessful schools to assess leadership
practices, and to compare the difference in principal’s self-perception of leadership with
that of their teachers. Schools included in the survey were categorized as successful or
not based on their academic achievement as measured by the schools’ state report card.
Schools rated excellent, good, or average on their 2003 public school report cards were
grouped into the successful category, and those rated below average or unsatisfactory
were grouped into the less successful category. Pingle and Cox used the Leadership
Practices Inventory (LPI) developed by Kouzes and Posner (1987) to survey randomly
selected elementary principals and their teachers. The LPI is based on the five Kouzes
and Posner tenets of leadership presented in their leadership model. Those five tenets
are: (a) Modeling the Way, (b) Inspiring a Shared Vision, (c) Challenging the Process, (d)
Enabling Others to Act, and (e) Encouraging the Heart.
The principals assessed their own leadership practices using the LPI – Self, and
the teachers assessed the leadership practices of their principal using the LPI – Observer.
Eighty-four elementary principals participated. Of these, fifty also returned three
teachers’ assessments of the principal’s leadership behaviors.
Based on the results of their study, Pingle and Cox (2007) found no statistically
significant difference between the leadership practices of elementary principals of
academically successful schools and unsuccessful schools, as perceived by the principal.
However, an analysis of the results of the teachers’ surveys indicated there was a
statistically significant difference between the leadership practices of elementary
principals in academically successful schools and academically unsuccessful schools.

23
They further determined that principals of academically successful schools embraced the
five leadership practices espoused by Kouzes and Posner (1987). Teachers’ assessments
of the principal’s behavior generally paralleled principal’s self-assessments in
academically successful schools. In the less successful schools they clearly did not, and
scored their principal much lower.
Pingle and Cox (2007) believe that the principals in unsuccessful schools did not
link their leadership practices to their school’s lack of academic success, and that many
of today’s elementary principals have not made that connection. In fact, on four of the
five leadership tenets principals in less successful schools actually rated themselves
higher than principals in more academically successful schools. The authors stated that
many recent theories of leadership, such as Kouzes and Posner’s model (1987), suggest
that behaviors, rather than management, have the greatest effect on school achievement.
Teachers’ Expectations of School Leaders
Richardson and Lane (1996) polled 1,225 teachers from four states and asked:
“What are the characteristics of principals that make them leaders?” Using Kouzes and
Posner’s (1987) book, The Leadership Challenge, Richardson and his colleagues
compared the answers given by the teachers to the twenty characteristics listed in their
book that business managers thought leaders should possess. Business managers felt the
five most important traits of leaders were honesty, competency, forward-looking,
inspiring, and intelligent.
The results of the survey showed that teachers and business managers valued most
of the same characteristics of a leader. Four of the top five attributes chosen by teachers
for a principal are identical to those chosen by those working in business. The only

24
difference was that teachers chose caring as the fifth most important attribute for
principals to have, compared with intelligent valued fifth highest for business managers.
Richardson and Lane (1996) explain that the attribute of caring could be expected to rank
high among educators, as teachers and principals generally feel care and compassion as a
normal part of their job. Business managers, on the other hand, feel pressure to be
competitive; thus, intelligent ranked fifth on their list.
Richardson and Lane (1996) also noted that regardless of the high level of
similarity there were several exceptions. For example, business employees gave more
value to broad-mindedness (ordinal rank of 7) than did teachers (ordinal rank of 14), and
while teachers desired that their principal have the attribute of caring (ordinal rank of 5),
business managers believed it was less important (ordinal rank of 13). Similarly, teachers
wanted principals to be supportive (ordinal rank of 6), while business managers classified
this trait as less important (ordinal rank of 11).
The results of Richardson and Lane’s (1996) survey are important for principals
to consider. For years, educators have looked to successful models in the business world
for leadership perspectives. The findings of this study indicate a correlation between
traits that are valued in both business and education. They also reflect the findings of
other studies that cite leadership characteristics that impact student achievement, lead to
positive school cultures, and help teachers be successful.
Cognitive Compatibility
Kagan (1989), utilizing Fielder’s 1973 contingency model, looked at leadership
effectiveness as it relates to the cognitive style of the followers. The researcher
hypothesized that if leadership matches the follower’s cognitive style, it could be inferred

25
that the leader would be more effective. A considerable number of studies empirically
support the idea that this exists between a number of supervisor-follower combinations:
teachers and students, supervisors and pre-service professionals, and counselors and their
clients. Kagan sought to determine the relationship between the cognitive styles of
teachers and the leadership styles they preferred in a school principal. Cognitive style
was defined as an individual’s characteristic way of perceiving and organizing
information about people and events. The researchers were most interested in examining
a dimension of cognitive style focusing on the way individuals attend to data, assess
problems, and choose alternatives. Kagan referred to Harrison and Bramson’s (1977,
1982) definition of this as “inquiry mode.”
Kagan (1989) used Harrison and Bramson’s instrument, the Inquiry Mode
Questionnaire (1977, 1982) to survey 70 elementary school teachers employed by a
public school district in metropolitan Omaha, Nebraska. Eighty percent were females
with professional experience ranging from 1 to 20 years. Cognitive style was measured
with the Inquiry Mode Questionnaire, which consists of 18 hypothetical situations
followed by five possible responses representing each of Churchman’s (1971) five modes
of thinking: the synthesist focuses on underlying assumptions and on abstract concepts;
the idealist focuses on process, values, and aspirations; the analyst considers method and
plan, seeks predictability through data, and attends to concrete detail; the realist points to
available resources and considers variability and immediately apprehensible facts; and
the pragmatist looks for immediate payoffs for him- or herself and tends to use
incremental thinking (Harrison & Bramson, 1977, 1982). Teachers’ preferred leadership

26
style was assessed by Kagan using the Leadership Behavior Description Questionnaire
(Brown, 1967).
Teachers whose cognitive style tended to be more non-analytic preferred a
principal with a process approach. Analytic teachers appeared to want a more task-
oriented principal. Pragmatists (who tend to evaluate situations in terms of personal costs
and benefits) also desired a process-oriented leadership. Kagan (1989) suggested that it
could be inferred that the more objective and analytical a teacher tended to be, the more
he or she appreciated a principal whose priority was the accomplishment of tasks.
Kagan (1989) determined that compatibility with a principal’s leadership style
might depend, in part, on how closely the style matches a teacher's fundamental affective
and cognitive characteristics. Generally, relatively non-analytic teachers preferred
principals who stressed process rather than task. A more analytic and realistic teacher is
likely to match best with a more task-oriented principal. Kagan stated that these analytic
teachers are better able to back up and view data objectively; making their decision on
the basis of what is effective rather than comfortable. Principals who are sensitive and
responsive to interpersonal processes appeared to be a good match for pragmatists, who
tend to evaluate situations subjectively. Kagan’s findings were consistent with prior
empirical studies relating to cognitive styles of subordinates to their preferences in
leadership style, and suggested that the results may offer insight into why teachers in the
same school may evaluate their principal in significantly different ways.
Females in School Administration
When one mentions the changing face of school leadership, a number of things
related to instructional supervision, management, and best practice may come to mind.

27
Literally, however, the faces are changing; in some regards females are overtaking males
in obtaining positions in school leadership. Between 1999 and 2008, the percentage of
female principals in public schools increased from 52% to 59% at the elementary level
and from 22% to 29% in secondary schools. When you include private schools, women
take the lead among all schools at 51% (Battle, 2009; U.S. Department of Education,
2010). A number of factors are contributing to this surge in female administrators.
Historical Perspective
The framework of the state-mandated, locally controlled schools in the United
States today took on its earliest forms in the mid-nineteenth century. A decisive policy
decision was made in each individual state in the northeast in the 1840’s, and in the
southern states by the turn of the century. It was called "the Common School Movement"
(Kaestle, 2007).
Prior to this event, the teaching population was overwhelmingly dominated by
men. The need for an enormous supply of teachers necessary to accomplish the
ambitious goals of the Common School Movement presented an economic dilemma to
communities. To meet this demand, officials began to realize that the economic saving
potential in hiring women, who were paid much less for the same work, easily
outweighed traditional resistance to women’s public employment (Blount, 1999).
As the number of female teachers increased, the work was modified to align more
closely with traditionally accepted duties and roles of women. Training programs for
teachers in the mid-to late-1800’s began to shift their curricular emphasis from subject
matter to pedagogy. Therefore, women were selected more for their ability to teach and
manage children than for their knowledge of subject matter, perhaps enlarging the pool of
28
viable candidates.
Certification requirements also expanded and changed in a way that the author
maintains was likely designed to increase the percentage of women teachers. For
example, many boards of education held weekend and summer programs for teacher
certification. Men were not as willing to participate in these meetings because it
interfered with the agricultural work that they typically performed in order to supplement
their rather low teaching wages. Additionally, the resulting compensation men would
receive for participation in these preparation programs was not worth the expense they
had to endure to receive the certification. While employment opportunities were limited
to women, many were willing to accept this expense as necessary for them to enter one of
the few public occupations that was gaining social approval for females.
Though some school districts were willing to pay two or three times as much to
hire male teachers, others chose to save money by employing women (Blount, 1999).
Without female teachers on low salaries it would have been almost impossible to finance
the development of the great public school systems across the country prior to 1860
(Davis & Samuelson, 1950).
School administrators employed in the mid-to late-1800’s were increasingly
chosen from among the college-educated, as this kind of education was determined to be
more fitting for persons who possessed the intellectual authority to run schools (Blount,
1999). Since the number of women admitted to colleges at the time was very low and
social mores restricted leadership opportunities for women, females were at a tremendous
disadvantage when it came to positions in school administration.
This trend continued throughout the twentieth century, as more opportunities for

29
roles in administration were made available almost exclusively to men. Although women
made significant gains in school leadership until World War II, a number of factors soon
shifted the balance again in favor of males (Blount, 1999).
First, schools launched aggressive campaigns to recruit men for the classroom,
especially at the elementary level. Once the war was over, millions of veterans flooded
the civilian job market. At the same time, school enrollments swelled from the baby
boom, and many women who had previously taught were not returning to the classroom
after leaving to earn more in military-related industrial jobs. Many in education and
government believed that both the post-war shortage of teachers and the high rate of
unemployment among veterans were problems that could be solved simultaneously by
encouraging veterans to teach. One stigma that had to be overcome was that education
was viewed as a “woman’s field.” School districts resolved this difficulty by recruiting
veterans to enter the classroom with the promise that they would be rapidly promoted into
positions of administration (Barter, 1959; Blount, 1999).
Following World War II, however, the University Council for Educational
Administration (UCEA) pushed for the creation of graduate-level credentialing programs
in school administration that changed the way people moved into administration. Instead
of rising through the ranks, school administrators were now required to obtain graduate
certification from university educational administration preparation programs. While a
number of these programs did not admit women at all, some that did set low quotas on
the number of women who were accepted, at least in part to ensure there were enough
spots for veterans (Blount, 1999; Davis & Samuelson, 1950).
One of the most significant advantages for men at this time was the generous

30
scholarship endowments provided by the U. S. Government in the form of the G.I. Bill.
Since women were rarely permitted military employment during the war, men stood to
benefit from this more significantly. More and more men utilized the G.I. Bill to fund
these mandated university school administration programs (Blount, 1999). This is
evident from the results of a 1971 survey conducted by the American Association of
School Administrators (AASA) that indicated nearly 70% of all superintendents who
served that year had benefitted from the G.I. Bill (Knezevich, 1971).
Gender Preferences
Despite challenges faced over the years, women in management and
administration are increasing in both number and perceived competency. A number of
surveys in recent years indicate a greater acceptance of female leadership. However, a
significant preference for male leadership among both women and men still seems to
prevail.
Since 1953, the Gallup organization has asked the following question: “If you
were taking a new job and had your choice of a boss, would you prefer to work for a man
or a woman?” Gallup's Work and Education survey (Carroll, 2006) reported that while
Americans prefer a male boss (37%) over a female (19%), an even higher percentage of
participants (43%) indicated that gender makes no difference (1% had no opinion).
While most men (56%) said they had no preference for a male or female boss, 34% prefer
a man and 10% desire a female leader. Most women (40%) prefer a male boss compared
to 26% who would rather have a woman. Thirty-two percent of females say it makes no
difference, and 2% have no opinion.
These results are markedly different from Gallup’s December 2000 poll
31
(Simmons, 2001) that showed that 48% of Americans said they would prefer to work for
a man, 22% would choose a female boss, and 28% do not care one way or the other.
Gallup has found the public to prefer male bosses for more than 50 years, although the
margin has steadily declined. Their first survey in 1953 indicated that 66% of Americans
said they would prefer to work for a man, while only 5% preferred working for a woman.
The poll was again conducted in 1975 with little change in results; Americans still
preferred a male to a female boss by a 62% to 7% margin. By 1982 however, preference
for a male boss had declined while preference for a female boss began a slow ascent.
While there is still a minority of Americans (22%) who say they would prefer to work for
a woman, the change is significant from the 5% of Americans who voiced a preference
for a female boss in 1953.
As female leadership begins to take hold across many career areas and the
disparity between the numbers of women and men in school administration is beginning
to diminish, teachers are becoming more accepting of females in administration.
Preconceived notions about women’s actions, feelings, or abilities often prevent them the
opportunity to serve in that capacity. Once they have an opportunity to work for a female
administrator, teachers who may have been resistant before realize that women are indeed
as capable as men, and some may actually prefer female leadership.
A poll by Barter (1959) at the University of Michigan in the late 1950’s reinforces
this. Barter, an assistant professor in the Department of Education found:
(1) Women teachers were more favorable toward women principals than men
teachers; (2) Women interested in the principalship as a career were more
favorable toward women principals than women not interested in that career; (3)

32
Men teachers who had teaching experience with women principals were more
favorable toward them than men having had no experience with them; and (4) The
majority of teachers rated men and women principals equal in abilities and
personal qualities. (p. 41)
Gender Barriers
There are often personal and professional barriers that prevent women from
taking the step from certification into administration. As stated in chapter 1, a lack of
females in both administration and preparatory programs for school leadership has had
some effect on women’s entrance to the profession (Shakeshaft, 1998; Sinclair, 1998).
Family obligations and the guilt associated with it have also discouraged women from
stepping into these roles (Eckman & Kelber, 2010; Rosener, 1990; Sinclair, 1998).
Myths about women in leadership often have to be dispelled in order for doors to open.
Fagenson-Eland and Baugh (2000) posed the question, “Given all the barriers women
face in their careers one might ask, do women have to work harder and smarter to get
ahead?” (p. 148). They found the simple answer is yes. Some of the female leaders
interviewed felt they had to consistently exceed expectations and work harder, and that
men questioned their credibility simply because they were women.
Sinclair (1998) found a number of issues which cause tension in the work place
for women, including: the traditional “look” of leadership; pressures for conformity and
blending in; sexualization of women in the workplace; maternalisation of women in
authority; getting administrative support; responses from family and friends; and loss of
self, body, and sexuality. Other studies have found that men are sometimes able to spend
significantly more time looking for a job and preparing for interviews than women

33
because of traditional gender roles in the household (Jones, 1989; Ensminger &
Celentano, 1990; Hanson & Pratt, 1991).
Perceptions of Females in Administration
Adams and Hambright (2004) gave students in the teacher leader program at
Wright State University an anonymous written survey to find out their perceptions of the
administrator role and the possible reasons why many female teacher leader program
graduates do not become principals.
Sixteen percent of respondents either currently or previously worked under a
female administrator, with most of them viewing it as a positive experience. Some
praised female administrators, saying they were great elementary level leaders and that
schools needed more of them. Fewer than 5 percent had never worked with a female
principal (Adams & Hambright, 2004).
Some respondents felt that females administrators were just as effective as males.
Others believed females were more supportive, approachable, sensitive, understanding,
nurturing, organized, creative, and receptive than male principals. Some stated that
female principals expect more, are tougher with the students, and they understand
students better (Adams & Hambright, 2004).
There were negative thoughts that arose regarding female administrators as well.
Some felt that women were not as highly respected as men in the profession, and could
be difficult to work with. Other teachers felt their female leaders needed to be more
authoritative, strict, and assertive, and less emotional, unpredictable, and moody. A few
respondents believed that some females appear to be hungry for power by constantly
trying to prove themselves and looking for opportunities to advance. Once these

34
positions were obtained, some felt it appeared their power had gone to their head (Adams
& Hambright, 2004).
Some of the teachers surveyed expressed concerns about women administrators
working harder than comparably positioned men. They classified females as being
“overachievers” and having to work extremely hard in positions of leadership (Adams &
Hambright, 2004). This could be due to the idea that the path to higher leadership
positions is more difficult for women to reach, thus women must work harder in order to
prove themselves capable (Ayman et al., 2009).
Differences Between Males and Females
Sex differences, mores, and cultural differences are likely to influence the kinds
of jobs that men and women obtain. Yamauchi (1995) found that in Japan, female
employees attach more importance to factors such as working hours, commute, location,
salary, benefits, and job security than do male employees. In contrast, male employees
are more concerned about their future prospects for advancement with the organization.
Part of this may be due to the fact that women typically leave the workforce after
marriage in Japan. Across the globe, women usually fill the role of caring for the home
and children, so there is often less ambition to rise within organizations.
Tolbert and Moen (1998) analyzed data from the General Social Survey (GSS) for
the years 1973 to 1994 and found differences among married men and women that are
consistent with similar studies. Tolbert and Moen examined gender differences in job
attribute preferences in the areas of meaningful work, promotion opportunities, and job
security and found that meaningful work is more likely to be ranked highest by women,
while men appear to prefer promotion opportunities and security. However, this gap is

35
widest among younger workers. As they age, both men and women begin to assign less
importance to extrinsic rewards, such as getting promoted and greater importance on
intrinsic rewards, such as meaningful content and interactions with others.
Many teachers may also be discouraged by the additional time required of
positions in school leadership. The U.S. Department of Education (2007) found that
public school teachers in the United States spend an average of 52.8 hours per week
teaching and engaging in other school-related activities. Public school principals on all
grade levels spend an average of 59.0 hours each week on school-related activities.
Additionally, most principals have extended contracts that employ them throughout the
summer months. This could be prohibitive to many women who serve the traditional
roles within the household, including caring for their children who are at home during the
summer.
Gender roles and preferences seem to also affect job search behavior. Powell and
Graves (2002) found that men might devote more time and effort to their searches.
According to traditional gender roles, men, who are viewed as the primary wage earners
should work harder at finding employment than women. Men may also have more time
available to devote to their job searches because they have fewer household
responsibilities. If men devote more time and effort to job seeking, they may have better
alternatives from which to choose.
Organizational Culture
Historically, the organizational culture and societal expectations of school
administrators tends to favor males. While men are expected to be strong and assertive,
women may feel discouraged to express their feelings and professional needs, as it may

36
taint others’ image of them as a confident and competent leader. This was discovered by
Powell (1999) who found that women leaders who behave in the same way as men are
often evaluated differently.
Hackney (1998) examined the effects of organizational culture on women’s
professional lives. Twenty-four participants for the survey were selected from 135
women enrolled in the educational administration leadership preparation programs at a
large, Southeastern university. Participants were initially chosen through an earlier study
which examined the relationship between their stages of epistemological position
(knowledge) and their performance self-esteem. Epistemological position analysis was
determined using the Women’s Ways of Knowing interview, presented in 1986 by
Belenky, Clinchy, Goldberger, and Tarule. Performance self-esteem was measured using
Stake’s (1979) Performance Self-Esteem Scale (PSES) (Hackney, 1998).
The purpose of this study was to examine the organizational culture as it affected
the professional lives of these women at entry levels of educational administration. The
researcher was especially interested in the interaction of organizational attitudes and
expectations with the participants’ personalities, epistemological positions, work needs,
performance self-esteem, and sense of power over their own professional lives (Hackney,
1998).
Ten of the twenty-four women were selected to participate in the last rounds of
interviews. These women served in multiple positions, offering a larger variation among
the participants. They each held entry level positions in education administration at ten
various sites or districts in the metropolitan area of the university in which they were
enrolled. The researcher chose this group because although they were seen and
37
considered to be serving in positions of administration, they were essentially without
meaningful power, limited by hierarchy and bureaucracy to make meaningful decisions
for their organizations (Hackney, 1998).
The positions of the study’s participants were: high school assistant principal;
coordinator of a specialized curriculum area in a large consolidated school district;
middle school assistant principal; special area curriculum supervisor for a large county
school district; a doctoral student who had just been promoted to high school assistant
principal; junior high school assistant principal; curriculum coordinator of a large county
school district who was responsible for curriculum, staff development, co-curricular
activities, and textbook adoption; a central office administrator in charge of coordinating
state standards, accreditation, and staff development, also a doctoral student; assistant
principal in a large urban high school; and an instructional coordinator in an elementary
school (Hackney, 1998).
The strategy employed for the study was a semi-structured, ethnographic (study of
groups and/or cultures over a period of time) interview to examine the events, beliefs,
attitudes, and policies which had shaped, and were shaping organizational culture as it
related to these women. Data from the interviews was triangulated with the results of the
earlier epistemological position interview, scores on the PSES, participants’ job
descriptions, performance reviews, and resumes (Hackney, 1998).
Interview questions examined participants’ perceptions of organizational culture
in terms of personality-organizational congruence, organizational attitudes toward
aspiring women, the participants’ feelings of performance-self-esteem, compromises
necessary for success, power, organizational control, inclusion, exclusion, equity, and
38
discrimination (Hackney, 1998).
Three major themes emerged from the data analysis: validation (their perception
of the organization’s recognition of their importance); inclusion (sense of belonging,
involvement in planning and decision-making, and ability to communicate with persons
at all levels), and authenticity (the organization’s practicing what it professed to believe).
Hackney (1998) found that when these conditions are present, they “nurture the
individual's professional and personal development, contribute to feelings of community,
encourage aspiration toward higher level position, and generally promote positive
feelings toward the organization” (p. 8).
Another set of significant findings about these women also emerged. First of all,
this group of women had a strong sense of self. They believed in the value of their work,
their importance to children, and their worth as educators. These beliefs helped them
overcome the inauthentic, non-validating, and exclusive conditions in their work
situations. Second, the participants felt a sense of mission. They believed that they were
doing and enduring what they had to for the benefit of children. Lastly, the sense of a
need to develop “inroads” into the organization emerged. Because of real or perceived
barriers to advancement in administration, the women of this study had to take measures
to increase their perceived value or worth. One was quoted as needing to “work twice as
hard and be twice as good” (Hackney, 1998, p. 10) as their male counterparts. Others
mentioned exceeding expectations, taking on additional tasks, and aligning themselves
with “bright, creative people.” (p. 10).
Hackney (1998) also discovered that these women found the need to take
alternative, proactive measures toward future positions. Becoming known for a particular

39
expertise, knowledge, or ability was one strategy employed to increase their perceived
worth in the organization.
Lastly, all of the women in the study acknowledged the need for advanced
degrees. They felt that if they were to be considered for a position for which a male
might only need a master’s degree, they might need a doctorate. All participants were
enrolled in either a specialist’s or doctoral program at the time of the study and regularly
participated in conferences, seminars, and professional development meetings (Hackney,
1998).
Changes in Structure and Preparation
Logan (1998) identified six conditions that are resulting in increased gender
equity in hiring practices for school principals and superintendents. They are:
1. School-site governance structures emphasize local accountability for student
achievement (Hallinger, 1992; Harvey, 1991; Wohlstetter & Mohrman, 1994).
2. Essential leadership skills in restructured schools promote collaboration,
consensus building, and empowerment of others (Common & Grimmit, 1992;
Cuban, 1988; Leithwood, 1995; Murphy, 1995).
3. Nationally, an increasing number of vacancies and a dwindling applicant pool
for positions of principal and superintendent create high-demand conditions for
qualified aspirants for these positions (American Association of School
Administrators [AASA], 1988; Brockett, 1996; Klauke, 1990).
4. Antidiscrimination legislation has fostered a more open environment for hiring
women in nontraditional roles (Flansburg & Hanson, 1993; Gupton & Del
Rosario, 1997; National Women's Law Center, 1997).

40
5. Women have made up at least half of educational administration program
enrollments since the mid-80s (Bell & Chase, 1993; Logan, 1998; National
Association of Secondary School Principals [NASSP], 1998; Tingley, 1996).
6. An increase in the percentage of women in the educational administration
professorate (McCarthy & Kuh, 1997), as well as mentoring programs for women
administrators, provide role models that validate school and school system
administration as a career choice for women (Wesson, 1997) (Changes and
Challenges, para. 1).
Training programs for school administrators are also changing. Barber and
Meyerson (2007) found that as school leader preparation programs across the country are
educating principals to become instructional leaders to meet the needs of students and
state and national standards, the role of the principal has evolved from a management
model that typically suited males, to one of an instructional leader that often builds upon
years of success as a classroom teacher; a role that is most often filled by females. As
school leadership programs begin to transform into instructional leadership programs,
women are filling the gap.
In their study, Barber and Meyerson (2007) looked into the dimensions of gender
and leadership from the findings of the Stanford University School Leadership Study.
This study of eight school leadership preparation programs analyzed how the context,
design, and delivery of each compared to the leadership practices and improvement goals
of program participants. They found that the programs prepared higher proportions of
women as principals than was represented in a national comparison group of elementary
and secondary principals.

41
The researchers used qualitative and quantitative data to examine the design and
delivery features of each program through individual and group interviews and
observations. Graduates of pre-service programs, in-service program participants, and a
national comparison group of principals were used for the quantitative data collection
(Barber & Meyerson, 2007).
The School Leadership Study (SLS) programs focused on instructional expertise
and instructional leadership, which is emphasized through recruitment and selection of
candidates, and through the design and implementation of the program (Barber &
Meyerson, 2007).
The SLS and comparison groups had similar years of teaching experience (13.4
years for SLS graduates and 14.7 years for the comparison group). However, The SLS
graduates had most often held roles as literacy coaches and grade level or subject area
leaders, and were not as likely to have been athletic coaches or physical education
teachers. There were significant differences between genders. SLS graduates were more
likely to hold instructional roles than those in the comparison group. Additionally,
women were more likely than men in both the SLS program and the comparison groups
to have been in these positions (Barber & Meyerson, 2007).
This study recommended that allowing teachers to assume roles in school
leadership before they take on roles as administrator may better prepare them for the
position. With the expectation of school leaders to be more of an instructional leader,
females who have gained instructional leadership experience as teachers within their
building can much more easily make the transition into the principalship.

42
The Advancement of Transformational Leadership
Transformational leadership has gained significant credit in recent years as
leading to increased productivity, higher job satisfaction, and loyalty to the organization
and its objectives. One of the first authors to study transformational and transactional
leadership in great detail was James MacGregor Burns. In his book Leadership, Burns
(1978) cites numerous examples of both successful and unsuccessful leaders, mostly in
political realms. He categorized leaders as either ordinary (transactional) leaders, who
exchanged tangible rewards for performance and loyalty, with extraordinary
(transformational) leaders, who engaged with their followers to raise their consciousness
about the goals and outcomes of the organization, and how to discover new ways of
achieving them. He described it as the ability to comprehend not only the existing needs
of followers, but to mobilize within them newer motivations and aspirations that would
create a foundation for [transformational] leadership. In contrast, Burns described the
transactional leader and follower as “bargainers seeking to maximize their political and
psychic profits” (p. 258). He compared it to the classic “exchange theory” of sociology
and believed that this type of relationship is short-lived; sellers and buyers cannot repeat
the identical exchange for a long period of time; both must move on to new types and
levels of gratifications. Additionally, the transactional gratification itself may be
superficial and trivial (Burns, 1978).
Bernard Bass, another early expert on transformational leadership, spent a great
deal of time studying leadership in business and military settings. In comparing
transactional and transformational leadership styles, Bass (1985b) referred to
transactional leadership as lower order improvement. Managers who are transactional
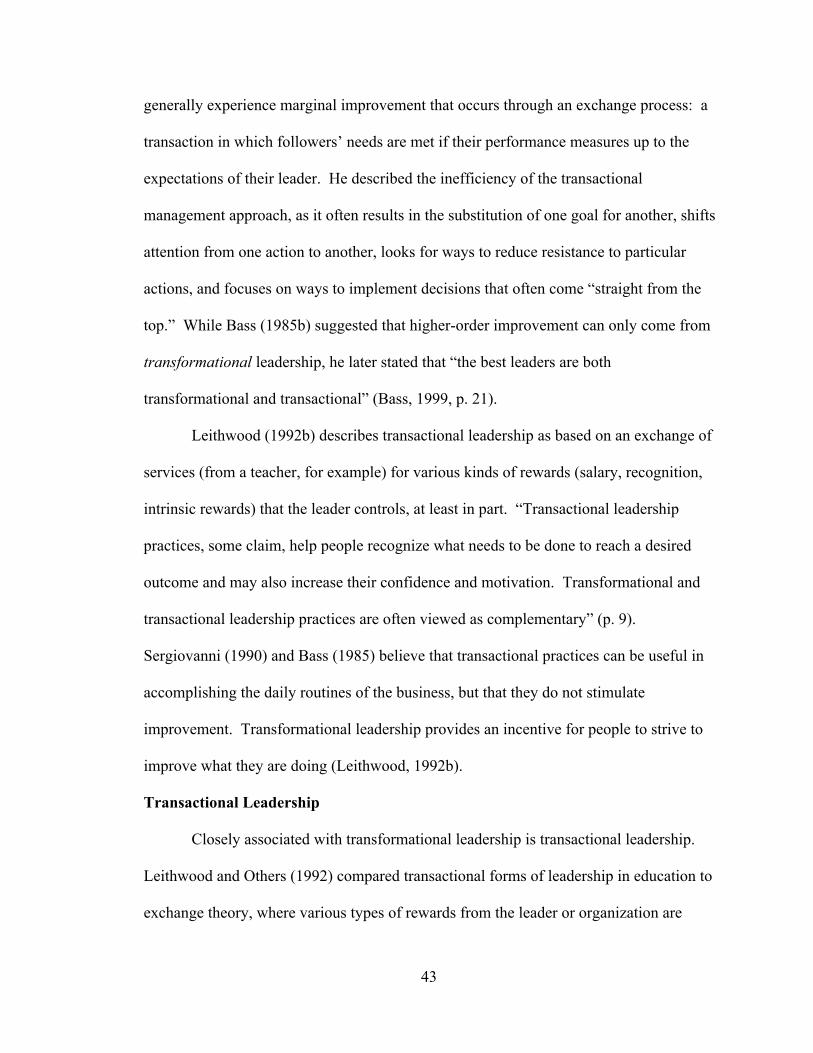
43
generally experience marginal improvement that occurs through an exchange process: a
transaction in which followers’ needs are met if their performance measures up to the
expectations of their leader. He described the inefficiency of the transactional
management approach, as it often results in the substitution of one goal for another, shifts
attention from one action to another, looks for ways to reduce resistance to particular
actions, and focuses on ways to implement decisions that often come “straight from the
top.” While Bass (1985b) suggested that higher-order improvement can only come from
transformational leadership, he later stated that “the best leaders are both
transformational and transactional” (Bass, 1999, p. 21).
Leithwood (1992b) describes transactional leadership as based on an exchange of
services (from a teacher, for example) for various kinds of rewards (salary, recognition,
intrinsic rewards) that the leader controls, at least in part. “Transactional leadership
practices, some claim, help people recognize what needs to be done to reach a desired
outcome and may also increase their confidence and motivation. Transformational and
transactional leadership practices are often viewed as complementary” (p. 9).
Sergiovanni (1990) and Bass (1985) believe that transactional practices can be useful in
accomplishing the daily routines of the business, but that they do not stimulate
improvement. Transformational leadership provides an incentive for people to strive to
improve what they are doing (Leithwood, 1992b).
Transactional Leadership
Closely associated with transformational leadership is transactional leadership.
Leithwood and Others (1992) compared transactional forms of leadership in education to
exchange theory, where various types of rewards from the leader or organization are

44
exchanged for the services of the teacher who is viewed as acting at least partly out of
self-interest. They stated that transactional leadership practices help teachers recognize
what needs to be done in order to reach a desired outcome while increasing confidence
and enhancing motivation. They also cited Bass’ formulation of the theory, adapted to
school contexts, as:
! Contingent Reward: the school leader tells teachers what to do in order to be
rewarded for their efforts.
! Management-By-Exception: the school leader intervenes with teachers only if
standards are not being met (p. 9).
Bass (1985b) suggests that transactional leadership often fails because leaders
lack the reputation for being able to deliver rewards. Transactional leaders who fulfill the
self-interested expectations of their subordinates gain and maintain the reputation for
being able to deliver pay, promotions, and recognition. Those that fail to deliver lose
their reputation and are not considered to be effective leaders. Also, transactional
practices do not motivate people to do their best or to maintain a high level of effort.
Bass (1985b) explained that in a transactional leadership situation, employees
might take shortcuts to complete the exchange of reward for compliance. “For instance,
quality may suffer if the leader does not monitor it as closely as he or she does the quality
of output. The employee may begin to react defensively rather than adequately. In some
cases, reaction formation, withdrawal, hostility, or ‘game playing’ may result” (p. 31).
Teachers may be less likely to take on leadership roles or to seek ways to satisfy
themselves, rather than do what is best for the organization.
Judge and Piccolo (2004) took Bass’ theory and divided management by

45
exception into two parts, resulting in three dimensions of transactional leadership:
contingent reward; management by exception-active; and management by exception-
passive. Contingent reward is the degree to which the leader sets up constructive
transactions or exchanges with followers: the leader clarifies expectations and
establishes the rewards for meeting these expectations. With management by exception-
active, leaders monitor follower behavior, anticipate problems, and take corrective
actions before the behavior creates serious difficulties. In the case of management by
exception-passive, leaders wait until the behavior has created problems before taking
action.
Employee’s Hierarchy of Needs
In contrast to the transactional style of leadership, Bass (1985b) explains how the
transformational leader motivates workers to do more than they realized they were
capable of. Transformational leaders accomplish this by:
! Raising employee’s level of consciousness about the importance and value of
designated outcomes and how these outcomes will be reached;
! Getting employees to transcend their own self interests for the sake of the
team, organization, or greater good; and
! Raising employee’s need level on Abraham Maslow's hierarchy from, say, the
need for security to the need for recognition, or expanding our portfolio of
needs by, for example, adding the need for self-actualization to the need for
recognition (p. 31).
On his hierarchy of needs, Maslow (1943) suggests the need for safety ranks just
above physiological needs such as food, air, shelter, warmth, and sex. He further states

46
that in a person’s occupation, a job with tenure and protection, financial security, and
insurance can satisfy the rung of safety. If this level is not met, workers will never
progress toward the level of esteem. Self-respect, sense of achievement, admiration,
recognition, and appreciation are a result of achieving esteem. The author explained that
“satisfaction of the self-esteem need leads to feelings of self-confidence, worth, strength,
capability, and a sense of being useful and necessary in the world. But thwarting of these
needs produces feelings of inferiority, of weakness and of helplessness. These feelings in
turn give rise to either basic discouragement or else compensatory or neurotic trends” (p.
382). The behaviors of managers who practice transformational leadership provide that
level of safety. Individuals are driven to pursue the vision of the organization instead of
having fear of being terminated or punished. Anxiety is replaced with excitement.
In one of his studies, Bass (1985a) asked 70 male senior industrial executives to
describe characteristics of a transformational leader they had encountered during their
career. Bass described a transformational leader as “someone who raised their awareness
about issues of consequence, shifted them to higher-level needs, and influenced them to
transcend their own self-interests for the good of the group or organization and to work
harder than they originally had expected they would” (p. 29). Respondents produced a
number of descriptions for this person, including leading them to work “ridiculous”
hours; to satisfy the leaders expectations and give them all the support they asked for;
produced a desire to emulate the leader; increased awareness; higher quality
performance; greater innovativeness; readiness to extend and further develop themselves;
total commitment; belief in the organization; and heightened self-confidence. These
executives further stated:

47
The transformational leader they could identify in their own careers was like a
benevolent father who remained friendly and treated the respondent as an equal
despite the leader’s greater knowledge and experience. The leader provided a
model of integrity and fairness and also set clear and high standards of
performance. He encouraged followers with advice, help, support, recognition,
and openness. He gave followers a sense of confidence in his intellect, yet was a
good listener. He gave autonomy to his followers and encouraged their self-
development. He was willing to share his greater knowledge and expertise with
them. Yet he could be formal at work when and if necessary. He was seen to be
firm and would reprimand subordinates when necessary. However, most
respondents were inclined to see the transforming leader as informal and close.
Such a leader could be counted on to stand up for his followers. (Bass, 1985a, p.
30)
Dimensions of Transformational Leadership
There are four dimensions of transformational leadership: charisma, inspirational
motivation, intellectual stimulation, and individualized consideration. Judge and Piccolo
(2004) described each in their study of transformational leadership:
Charisma, or idealized influence, is the degree to which the leader behaves in
admirable ways that cause followers to identify with the leader. Charismatic
leaders display conviction, take stands, and appeal to followers on an emotional
level. Inspirational motivation is the degree to which the leader articulates a
vision that is appealing and inspiring to followers. Leaders with inspirational
motivation challenge followers with high standards, communicate optimism about

48
future goal attainment, and provide meaning for the task at hand. Intellectual
stimulation is the degree to which the leader challenges assumptions, takes risks,
and solicits followers’ ideas. Leaders with this trait stimulate and encourage
creativity in their followers. Individualized consideration is the degree to which
the leader attends to each follower’s needs, acts as a mentor or coach to the
follower, and listens to the follower’s concerns and needs. (p. 1)
Transformational Leadership in Education
With the onslaught of reforms and initiatives that have come about over the last
twenty or so years, the principalship has made a shift from building management to
instructional leadership with the expectation that principals would set the tone for
teaching and learning through their words and actions. Leithwood (1992a) described
“instructional leadership” as a concept that served schools well throughout the 1980’s and
early 1990’s. He said, however, due to the current wave of restructuring initiatives, this
term does not fully depict what school administration should be and that it no longer
captures “the heart of what school administration will have to become.
‘Transformational leadership’ evokes a more appropriate range of practice…” (p. 8).
Education often looks to replicate successful processes of the business
community. Leithwood (1992a) describes the typical school as a Type A organization
with centralized and controlling leadership. He describes it as a “carrot and stick”
management style that often leads to a lack of success. Maintaining differences in status
among staff and administrators, and retaining the right to decide how employees,
resources, and professional development activities are managed is often the norm, but has
been shown to decrease productivity. Despite its proven ineffectiveness, the author

49
declared that many managers or administrators resort to this behavior because for some it
is natural, easy, or it satisfies the need for power.
Leithwood (1992a) contrasted Type A organizations with Type Z, in which
transformational ideals with strong cultures utilize participative decision making as much
as possible. He said their style of power “is ‘consensual’ and ‘facilitative’ in nature-a
form of power manifested through other people, not over other people” (p. 9). Non-
educational organizations that have undertaken the shift from Type A to Type Z
management, according to Leithwood, have usually done so not out of concern for
individuals, but because it increases productivity.
Across the globe, countries are recognizing the role education and leadership play
in their viability. The government of Tanzania strongly believes in the power of
education as a means for survival in the world economy. Reforms of the educational
system there began in 1995 with several objectives: ensure growing and equitable access
to high quality formal education and adult literacy through facilities expansion; achieve
efficiency gains and quality improvement; and have an efficient supply and use of
resources. In early 1997 the Tanzanian Government developed a Basic Education Master
Plan (BEMP) to guide these reforms and to shift responsibility to local school committees
(United Republic of Tanzania, 2010). Nguni, Sleegers, and Denessen (2006) suggested
that transformational leadership could be an effective catalyst in the country’s
reform process.
Nguni et al. (2006) examined the effects of transformational and transactional
leadership on teachers’ job satisfaction, teachers’ organizational commitment, and
organizational citizenship behavior. The study’s participants included 700 primary

50
school teachers from 70 schools in the eastern educational zone of Tanzania.
Measurement of Transformational and Transactional Leadership was measured
using Avolio, Bass, and Jung’s (1999) Multifactor Leadership Questionnaire (MLQ,
version 1, plus some additional items from version 5X) for teachers’ rating of their
headteacher’s leadership. Measurement of Organizational Commitment was measured
using the Organizational Commitment Questionnaire (OCQ) developed by Mowday,
Steers, and Porter (1979). The 15 items of the OCQ are designed to assess respondents’
loyalty and desire to remain with the organization, their belief in and acceptance of the
values and goals of the organization, and their willingness to put in extra effort to help
the organization succeed. Organizational Citizenship Behavior (OCB) was measured
using a16-item questionnaire instrument developed by Smith, Organ, and Near (1983)
that assesses citizenship gestures through items such as ‘‘helping others who have been
absent’’, ‘‘volunteers for things that are not required’’, and ‘‘does not take unnecessary
time off” (p. 156). Lastly, job satisfaction was measured using the Minnesota
Satisfaction Questionnaire (MSQ) (Nguni et al., 2006).
Results of the study show that both transformational and transactional leadership
factors influence the outcome variables. Transformational leadership behaviors had
strong to moderate positive effects on value commitment, organizational citizenship
behavior, and job satisfaction. Transactional leadership behaviors, on the other hand, had
no significant and weak aggregate effects on value commitment, organizational
citizenship behavior, and job satisfaction, and had a strong positive effect only on
commitment to stay. These results match those found previously in studies conducted in
both non-educational and educational settings. These studies also found that although

51
transactional and transformational leadership are strongly related theories,
transformational leadership factors had a stronger positive influence on the outcome
variables, including job satisfaction, organization commitment, and organizational
citizenship behavior than the group of transactional leadership factors (Nguni et al.,
2006).
In the case of transformational leadership dimensions, charismatic leadership had
the greatest influence and affected variations found in value commitment, organizational
citizenship behavior, and teachers’ job satisfaction. Individualized consideration had a
surprisingly very weak and insignificant influence on job satisfaction, organizational
commitment, and organizational citizenship behavior.
The factor of intellectual stimulation had a weak influence on job satisfaction, but
no significant influence on organizational citizenship behavior and organizational
commitment. Nguni et al. (2006) stated,
Although intellectual stimulation may produce desirable effect in the long run, in
the short run, leaders who continually urge or exhort followers to search for new
and better methods of doing things create ambiguity, conflicts, or other forms of
stress in the minds of the followers. . . .It may be that this process is dissatisfying,
and that leaders who continually do this are trusted less because they are
perceived as being less predictable and/or dependable. (p. 169)
In consideration of transactional leadership dimensions, contingent reward
showed a moderate positive influence on job satisfaction, and a strong negative influence
on commitment to stay. Active management by exception moderately influenced
commitment to stay and organizational citizenship behavior in a positive way. The

52
transactional leadership dimensions of passive management by exception and laissez-
faire showed mostly strong negative effects on commitment to stay. Passive management
by exception had a weak positive effect on job satisfaction. Nguni et al. (2006) suggest
the main explanation of the unexpected negative influence of contingent reward on
commitment to stay might be due to the fact that headteachers in Tanzania primary
schools have no power in providing contingent reward to teachers related to salary,
promotion, and status. All of these are controlled by the central government and the
District Education Office. Therefore, headteachers have few opportunities to
acknowledge individual performance by providing rewards. Also, since teachers in
Tanzania do not choose schools in which they would like to teach and may be transferred
at any time to another school, contingent reward may not necessarily play a significant
role in increasing higher levels of teachers’ commitment to stay in their present schools.
The survey also set out to determine the extent to which job satisfaction mediates
the influence of transformational and transactional leadership on teachers’ organizational
commitment and organizational citizenship behavior. Results indicated the relationship
between transformational and transactional leadership on teachers’ organizational
commitment and organizational citizenship behavior is partially affected by job
satisfaction. In this study, job satisfaction partially mediated the effects of all dimensions
of transformational leadership, as well as the transactional dimensions of contingent
reward and active management by exception on value commitment. Job satisfaction also
partially mediated the relationship of the transformational factor of intellectual
stimulation and the transactional factors of contingent reward and active management by
exception on commitment to stay. It did not impact the effects of charismatic leadership

53
and individualized consideration on commitment to stay. These two factors (charismatic
leadership and individualized consideration) had only direct effects on commitment to
stay. Job satisfaction also partially mediated the effects of transformational leadership
and transactional contingent reward and active management by exception on
organizational citizenship behavior, but did not affect the influence of passive
management by exception and laissez-faire leadership, because these factors had no
influence on job satisfaction (Nguni et al., 2006).
Nguni et al. (2006) found that the individual leadership dimensions have varying
degrees of influence on teachers’ work attitudes and behavior, including organizational
commitment, organizational citizenship behavior, and job satisfaction. They suggest that
in order to be effective, school leaders need to use a combination of transformational and
transactional leadership behaviors to increase job satisfaction. This will cause teachers to
be more enthusiastic about teaching, which should, in turn, positively affect learning.
The Effect of Gender on Transformational Leadership
Ayman et. al (2009) examined the impact of gender had on leader-subordinate
pairings when looking at leaders’ transformational leadership behavior and their
subordinates’ ratings of the leaders’ effectiveness. Their study paired 109 leaders (58
male, 51 female) with a subordinate who may or may not have been of the same gender.
They felt this issue was important because other research has shown that women who use
a transformational style of leadership may be evaluated as less effective than males who
use the same style.
Ayman et al. (2009) predicted that the relationship between transformational
leadership behavior and leadership performance would be affected by the gender
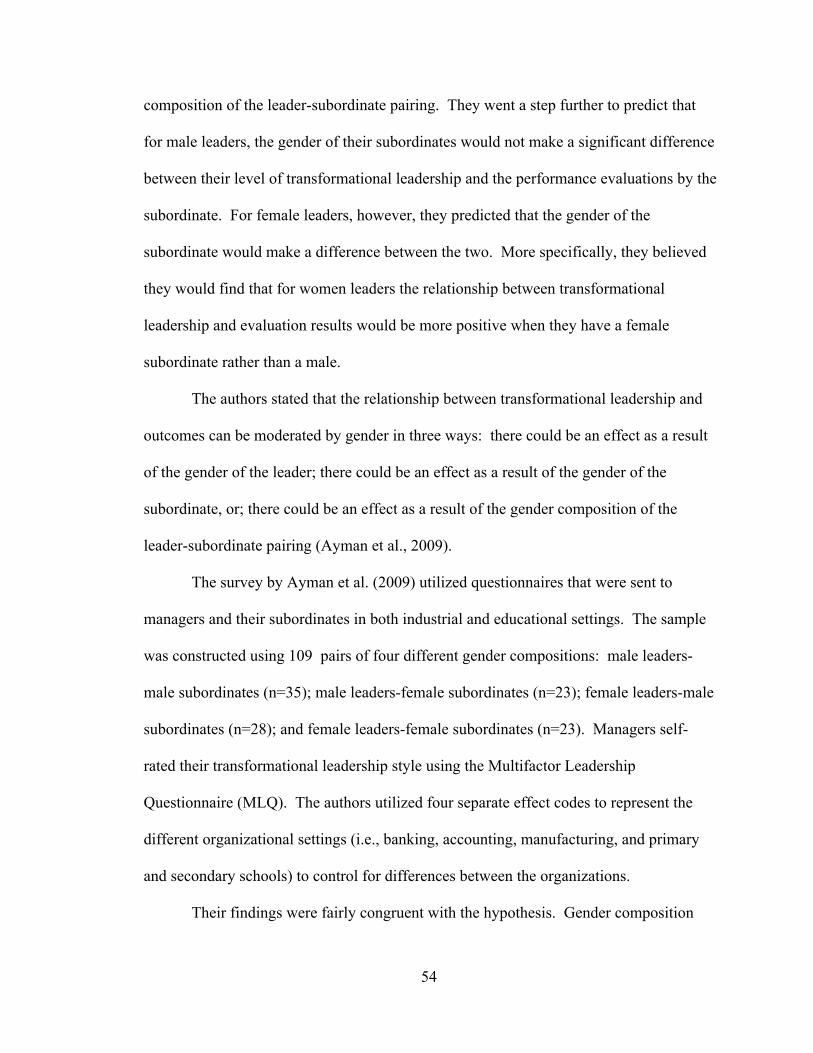
54
composition of the leader-subordinate pairing. They went a step further to predict that
for male leaders, the gender of their subordinates would not make a significant difference
between their level of transformational leadership and the performance evaluations by the
subordinate. For female leaders, however, they predicted that the gender of the
subordinate would make a difference between the two. More specifically, they believed
they would find that for women leaders the relationship between transformational
leadership and evaluation results would be more positive when they have a female
subordinate rather than a male.
The authors stated that the relationship between transformational leadership and
outcomes can be moderated by gender in three ways: there could be an effect as a result
of the gender of the leader; there could be an effect as a result of the gender of the
subordinate, or; there could be an effect as a result of the gender composition of the
leader-subordinate pairing (Ayman et al., 2009).
The survey by Ayman et al. (2009) utilized questionnaires that were sent to
managers and their subordinates in both industrial and educational settings. The sample
was constructed using 109 pairs of four different gender compositions: male leaders-
male subordinates (n=35); male leaders-female subordinates (n=23); female leaders-male
subordinates (n=28); and female leaders-female subordinates (n=23). Managers self-
rated their transformational leadership style using the Multifactor Leadership
Questionnaire (MLQ). The authors utilized four separate effect codes to represent the
different organizational settings (i.e., banking, accounting, manufacturing, and primary
and secondary schools) to control for differences between the organizations.
Their findings were fairly congruent with the hypothesis. Gender composition

55
of the leader-subordinate pair did affect followers’ judgments of women leaders who
used a transformational style. As they had predicted, this was more apparent for women
leaders compared to men. Women who assessed themselves as leading in a
transformational manner were rated lower by males on leadership performance, as
compared to female leaders who rated themselves as less of a transformational leader.
These findings were similar to other studies that indicated different reactions by male and
female subordinates toward female leaders who exhibited transformational tendencies.
Further, Ayman et al. (2009) found that neither the gender of the leader nor the gender of
the subordinates was directly related to transformational leadership tendencies.
One aspect of transformational leadership involves intellectual stimulation.
Ayman et al. (2009) suggested that because this behavior invites subordinates to question
assumptions and to explore alternatives, male leaders are more often granted authority to
inquire about the work of their subordinates than are women leaders. When a female
leader questions a subordinate regarding work issues, her authority for doing so may be
questioned by male subordinates. Haslett, Geis, and Carter (1996) and Ridgeway (1992)
stated that women leaders’ lack of legitimacy originates from two sources: women
generally have lower status in society than do men, and there is a stereotypical belief that
women should not have a higher status than men. Therefore, a male subordinate may see
himself to be of higher status than females and not approve of a woman leader
questioning his judgment. Alternatively, a female subordinate who views female leaders
as capable might be more open to a woman leader challenging her views.
Another aspect of transformational leadership that Ayman et al. (2009) found had
an effect on performance evaluations was that of Individualized consideration. In this

56
behavior, the leader demonstrates concern for each of his or her subordinates. Being
considerate and sympathetic is part of a traditionally feminine stereotype (Atwater et al.,
2004; (Hackman, Furniss, Hills, & Paterson, 1992). The researcher suggested that when
a male leader goes against the gender stereotype and displays individualized
consideration it will not lower subordinate’s view of him as a leader. Caring is a positive
attribute that that may be viewed as paternalistic. However, if a woman demonstrates this
behavior she could appear weak, particularly to male subordinates. Men also view this as
a type of maternal behavior that conflicts with their views of women in leadership, and
may be uncomfortable or unaccepting of it.
The results of this study provided some support to the idea that women may have
to work harder than men for the same recognition, and that women who are
transformational leaders can sometimes face a lack of support from male subordinates.
Males may evaluate a female leader’s behavior differently than do female subordinates.
To be perceived as an effective leader, females must be aware of these tendencies and
consider utilizing tools such as the 360-degree feedback to analyze their leadership
effectiveness and image (Ayman et al., 2009).
Mandell and Pherwani (2003) studied the predictive relationship between
emotional intelligence and transformational leadership style, and gender differences in
these two areas between male and female managers. Emotional intelligence was defined
by Mayer and Salovey (1997) as “the ability to perceive accurately, appraise, and express
emotion; the ability to understand emotion and emotional knowledge; and the ability to
reflectively regulate emotions in ways that promote emotional and intellectual growth”
(p. 23).

57
The subjects were volunteers (n=32, 13 male and 19 female) who were managers
or supervisors in mid- to large-sized organizations in the northeastern United States in the
areas of business, medicine, education, finance, and high tech. The mean age of the
participants was 39 years, and the leadership or supervisory experience of the participants
ranged from 1 to 40 years. Participants used the Multi-factor Leadership Questionnaire
(MLQ, 5x-Revised) self-rating form to determine their leadership style. The Bar-On
Emotional Quotient Inventory (EQ-i) was used to obtain the emotional intelligence scores
of leaders (Mandell & Pherwani, 2003).
The researchers used hierarchical regression analysis to examine the predictive
relationship between emotional intelligence and transformational leadership style. The
analysis was also used to examine interaction of gender with emotional intelligence and
transformational leadership style, and to identify gender differences in the relationship
between emotional intelligence and transformational leadership style. Emotional
intelligence, gender and interaction of gender and emotional intelligence were the
predictor variables, and transformational leadership style was the criterion variable in the
study. Independent-samples t tests were performed to determine gender differences in
both the emotional intelligence scores and leadership styles of male and female
managers.
Based on the analyses, it was determined that a significant relationship between
transformational leadership style and emotional intelligence exists. The regression
analysis suggested that transformational leadership style of managers could be predicted
from their emotional intelligence scores (Mandell & Pherwani, 2003).
Mandell and Pherwani (2003) found no difference in the relationship between
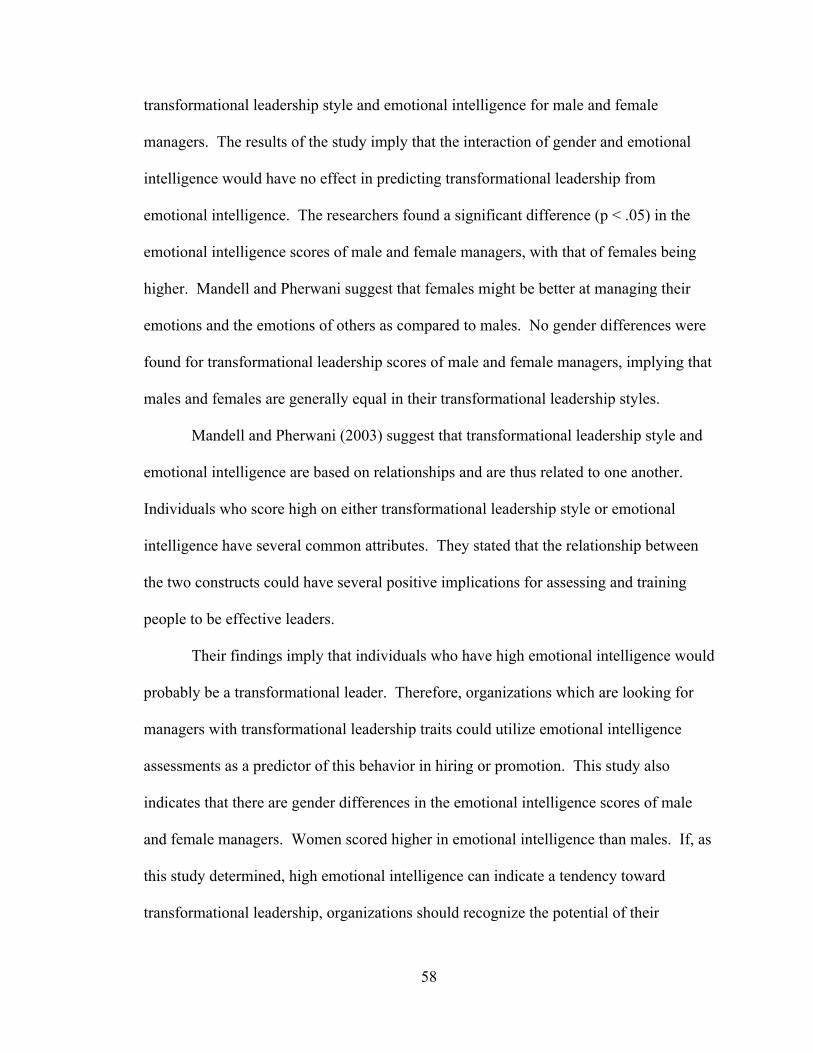
58
transformational leadership style and emotional intelligence for male and female
managers. The results of the study imply that the interaction of gender and emotional
intelligence would have no effect in predicting transformational leadership from
emotional intelligence. The researchers found a significant difference (p < .05) in the
emotional intelligence scores of male and female managers, with that of females being
higher. Mandell and Pherwani suggest that females might be better at managing their
emotions and the emotions of others as compared to males. No gender differences were
found for transformational leadership scores of male and female managers, implying that
males and females are generally equal in their transformational leadership styles.
Mandell and Pherwani (2003) suggest that transformational leadership style and
emotional intelligence are based on relationships and are thus related to one another.
Individuals who score high on either transformational leadership style or emotional
intelligence have several common attributes. They stated that the relationship between
the two constructs could have several positive implications for assessing and training
people to be effective leaders.
Their findings imply that individuals who have high emotional intelligence would
probably be a transformational leader. Therefore, organizations which are looking for
managers with transformational leadership traits could utilize emotional intelligence
assessments as a predictor of this behavior in hiring or promotion. This study also
indicates that there are gender differences in the emotional intelligence scores of male
and female managers. Women scored higher in emotional intelligence than males. If, as
this study determined, high emotional intelligence can indicate a tendency toward
transformational leadership, organizations should recognize the potential of their

59
employees, both male and female (Mandell & Pherwani, 2003).
Rice (1993) examined whether transformational and transactional leadership
differ on the basis of gender within the school administrative population. Participants
included randomly selected male and female employees of elementary and secondary
schools in New Castle County, Delaware. Rice (1993) sent the Multifactor Leadership
Questionnaire (MLQ) and a demographic survey to 24 male and 24 female elementary
and secondary school administrators. Rice also sent packets to 240 teachers who worked
with those administrators (120 male and 120 female).
Both male and female administrators viewed themselves as being more
transformational than transactional. Indicators of leadership style in this study were the
participants’ self-perceived levels of charisma, inspiration, intellectual stimulation,
individual consideration, contingent reward, and management by exception. The only
area in which men scored higher was management by exception. In this management
style, administrators only step in if the objective or goal is not being met. In other words,
subordinates are left to do their job until there is a need to intervene.
When considering teachers’ scores of the administrators, Rice (1993) found that
teacher perceptions were lower than those of their administrators on the transformational
and transactional factors with one exception: teacher ratings of management by exception
were higher than what the administrators perceived of themselves.
In analyzing subordinates responses, Rice (1993) found that men generally rated
women somewhat lower than men on the intellectual stimulation factor. Women were
rated higher in the areas of communication, vision, trust, and in conveying the mission to
subordinates. Male and female administrators received similar scores on the transactional

60
factor of contingent reward. Scores on the other transactional factor, management by
exception, as well as scores on the organizational outcome factors were closely tied to the
gender of the rater. Women rated women higher, while men rated men better than
women. Mean scores on items related to administrator effectiveness, teacher job
satisfaction, and willingness for extra effort, as well as organizational goal items,
indicated that gender was linked to perceptions.
Female elementary school teachers were generally more satisfied and perceived
their administrators more positively than did male elementary teachers (Rice, 1993). In
addition, female elementary and secondary teachers scored their administrators at higher
levels in the use of status quo leadership and management by exception. The researcher
also found that women were more satisfied with female administrators than male
administrators, and men were more satisfied with male administrators than female
administrators. However, female teacher scores indicated more dissatisfaction with male
administrators than male teacher scores did with female administrators. Interestingly, the
researcher discovered from the demographic data that while the male participants spent
an average of 7.5 hours per day on the job, the female teachers in the study spent an
average of 9 hours per day working.
Responsibilities of School Leaders
A significant part of this study will be based on research of Marzano et al. (2005).
In their book School Leadership that Works, the authors set out to determine the
leadership traits that most highly correlated with student achievement. They considered
any and all studies from 1970 to the time of the study that met these conditions:

61
! the study involved K-12 students in U.S. schools, or situations that closely
mirrored the culture of U.S. schools;
! the study directly or indirectly examined the relationship between the leadership
of the building principal and student academic achievement;
! academic achievement was measured by a standardized achievement test or a
state test, or a composite index based on one or both of them; and
! effect sizes in correlation form were reported or could be computed (p. 28).
After reviewing over 5,000 titles, Marzano et al. (2005) found 69 studies that fit
the criteria, dating from 1978 to 2001. Over 2,800 schools were involved, as were an
estimated 14,000 teachers and 1,400,000 students. The typical study in the meta-analysis
used some type of questionnaire asking teachers about their perceptions of the principal’s
leadership behaviors. The average score for the teacher’s responses in each school was
then correlated with the average achievement of students in that school and was found to
be .25. The authors determined that a principal who was at the 50th percentile in
leadership ability at a school whose achievement was also at the 50th percentile might be
considered to be an average principal at an average school. If something were to occur,
such as leadership training that raised his leadership one standard deviation to the 84th
percentile, it would increase the achievement of the school to the 60th percentile. Raise
that principal’s leadership capacity to the 99th percentile and you could predict the
average student achievement of the school would jump to the 72nd percentile.
Marzano et al. (2005) examined the 69 studies looking for specific behaviors
related to principal leadership and identified 21 categories of behaviors that they refer to
as “responsibilities.” They explain that these are not new findings on leadership, but are

62
similar to the findings of many other leadership theorists. These leadership
responsibilities are listed in Table 1.
Table 1
List and Description of the Responsibilities of School Leaders in Order of Correlation with Student Academic Achievement
Responsibility Correlation The extent to which the principal …
Situational Awareness 0.33 Is aware of the details & undercurrents in the running of the school & uses this information to address current & potential problems
Flexibility 0.28 Adapts his or her leadership behavior to the needs of the current situation & is comfortable with dissent
Discipline 0.27 Protects teachers from issues & influences that would detract from their teaching time or focus.
Monitoring/Evaluating 0.27 Monitors the effectiveness of school practices & their impact on student learning
Outreach 0.27 Is an advocate and spokesperson for the school to all stakeholders
Change Agent 0.25 Is willing to & actively challenges the status quo
Culture 0.25 Fosters shared beliefs & a sense of community & cooperation.
Input 0.25 Involves teachers in the design & implementation of important decisions & policies
Knowledge of curriculum, instruction, & assessment
0.25 Is knowledgeable about current curriculum, instruction, & assessment practices.
Order 0.25 Establishes a set of standard operating procedures & routines.
Resources 0.25 Provides teachers with the material & professional development necessary for the successful execution of their jobs.
Contingent Rewards 0.24 Recognizes & rewards individual accomplishments
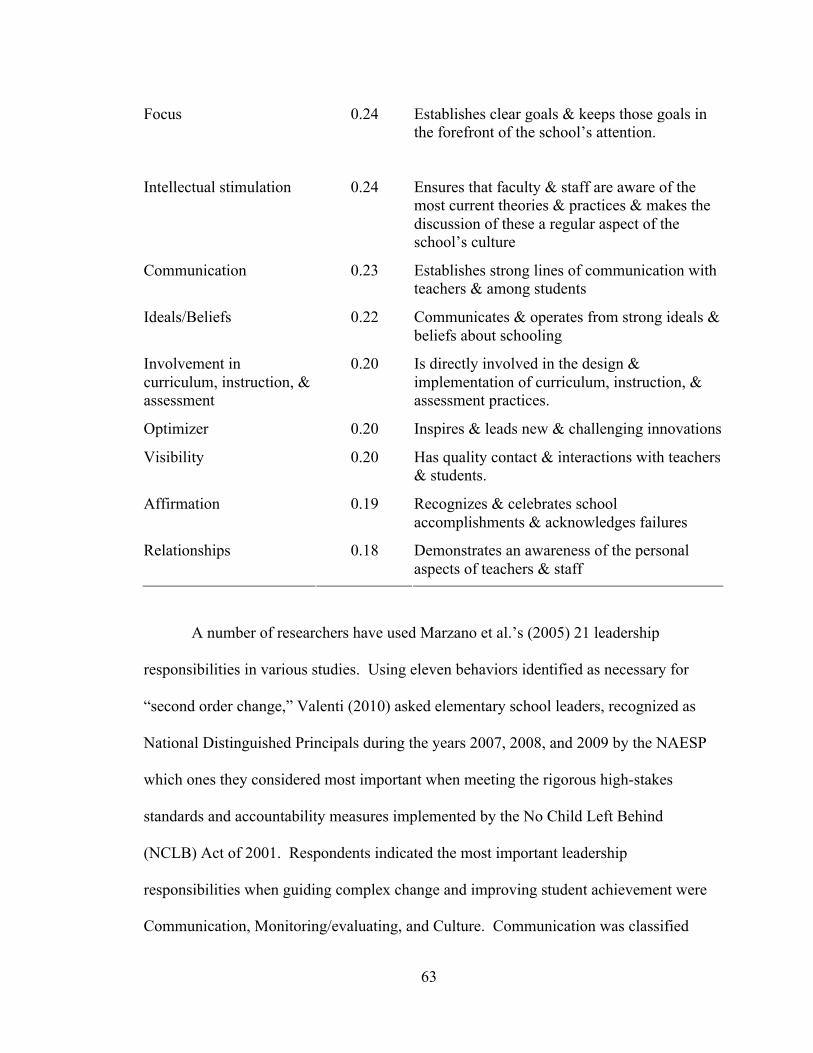
63
Focus 0.24 Establishes clear goals & keeps those goals in the forefront of the school’s attention.
Intellectual stimulation 0.24 Ensures that faculty & staff are aware of the most current theories & practices & makes the discussion of these a regular aspect of the school’s culture
Communication 0.23 Establishes strong lines of communication with teachers & among students
Ideals/Beliefs 0.22 Communicates & operates from strong ideals & beliefs about schooling
Involvement in curriculum, instruction, & assessment
0.20 Is directly involved in the design & implementation of curriculum, instruction, & assessment practices.
Optimizer 0.20 Inspires & leads new & challenging innovations
Visibility 0.20 Has quality contact & interactions with teachers & students.
Affirmation 0.19 Recognizes & celebrates school accomplishments & acknowledges failures
Relationships 0.18 Demonstrates an awareness of the personal aspects of teachers & staff
A number of researchers have used Marzano et al.’s (2005) 21 leadership
responsibilities in various studies. Using eleven behaviors identified as necessary for
“second order change,” Valenti (2010) asked elementary school leaders, recognized as
National Distinguished Principals during the years 2007, 2008, and 2009 by the NAESP
which ones they considered most important when meeting the rigorous high-stakes
standards and accountability measures implemented by the No Child Left Behind
(NCLB) Act of 2001. Respondents indicated the most important leadership
responsibilities when guiding complex change and improving student achievement were
Communication, Monitoring/evaluating, and Culture. Communication was classified

64
"Very Important" by 88.3% of respondents. Monitoring/Evaluating was identified very
similarly to Communication with 84.5%. Culture was also recognized as important with
83.5% of participants in agreement. No respondents designated Communication,
Monitoring/Evaluating, or Culture as "Somewhat Important" or "Not Important." Four of
the leadership responsibilities were classified as "Very Important" by approximately 70%
of participants. These behaviors were Communication (77.7%), Knowledge of
Curriculum, Instruction, and Assessment (74.8%), Change Agent (74.8%), and Input
(73.8%). None of the participants classified any of the 11 behaviors as "Not Important."
There were, however, several responsibilities marked as "Somewhat Important". These
behaviors include Order (7.8%), Optimizer (6.8%), Intellectual Stimulation (3.9%), and
Flexibility (2.9%).
Williams (2006) surveyed teachers and principals at three schools that raised their
achievement status from “underperforming” to “performing and “performing plus, based
on Arizona’s accountability and rating system (AZ LEARNS) for the state’s public
schools, designed to ensure the state school system’s compliance with NCLB. Williams
also looked at 11 of Marzano et al.’s (2005) 21 responsibilities to determine which
characteristics were present in the improving schools, to what degree they were present,
and to what degree teachers and principals agree that the 11 second-order change
responsibilities are present in the improving schools. She found that overall, the teacher
perceptions of principal leadership behaviors were closely aligned to the principals’
perspectives. Also, there was a high level of teamwork between teachers and principals,
resulting in these strongly aligned perceptions and improved student achievement. Two
of the three faculties rated Communication as their principals’ highest quality. The other

65
ranked Order as number one, as there was an immediate need to establish consistency and
structure to the environment. Teachers involved in the study overwhelmingly agreed
with the principals in that principal leadership was the reason their school had improved
its achievement and was no longer identified as “underperforming.”
McKinney (2008) investigated the influence of NCLB and AZ LEARNS on
middle-school principal leadership responsibilities and behavior based on Marzano et
al.’s (2005) work. In addition, the relationship between the academic accountability
measures and adherence to the middle school philosophy was explored. The participants
consisted of 56 Arizona middle-school principals.
Principals were asked, “To what extent has NCLB influenced your leadership
behaviors and responsibilities?” Responses possible were: 5–Increased Greatly; 4–
Increased; 3–No Difference; 2–Decreased; and 1–Decreased Greatly. Based on the 21
responsibilities of leaders, middle school principals in the survey said that being a
“Change Agent” had been most highly influenced by NCLB requirements (mean score of
3.73). Approximately 66% of principals indicated that NCLB has increased this
behavior. This was followed by Knowledge of Curriculum, Instruction, and Assessment
(mean score of 3.68). Approximately 63% of principals had indicated that NCLB had
influenced their performance of this leadership responsibility. These behaviors were
followed by: Order (3.66); Optimizer (3.63); Focus (3.46); Involvement in Curriculum,
Instruction, and Assessment (3.46); Contingent Rewards (3.45); Communication (3.43);
and Affirmation (3.41) (McKinney, 2008).
McKinney (2008) concluded that principals reported NCLB contributed to a slight
increase in their ability to execute 20 of the 21 leadership behaviors/ responsibilities. The

66
behavior/responsibility that showed the most increase was Change Agent. On the other
hand, middle school principals responded that NCLB influenced the most decrease in
their behavior of Visibility, with a mean score of 2.89. Behaviors tied to this
responsibility include making systematic and frequent visits to classrooms, making
contact with students often, and being highly visible. This mean score for visibility was
lower than the “No Difference” score of 3, indicating that principals believed NCLB had
resulted in a decrease in their ability to practice this particular behavior.
Wolf (2010) examined the perceptions of rural school administrators, teachers and
school board members in relation to the effectiveness of curriculum development,
implementation and evaluation, and the impact these practices have on the vision of
student learning in school districts both with and without a curriculum administrator.
The qualitative study was comprised of six small, rural school districts across
Pennsylvania: three districts with a curriculum administrator and three without.
Participants (n=33) included superintendents, secondary and elementary principals,
teacher leaders, school board members, and curriculum administrators. Superintendents,
principals, and curriculum administrators in both types of districts rated themselves by
indicating their top eight areas of strength from Marzano et al.’s (2005) 21
responsibilities. Wolf’s (2010) perception was that all team members would have
strengths in different areas, making it likely that all 21 would be covered.
Wolf (2010) found that administrators in districts without curriculum
administrators share more leadership responsibilities across the team, leading to a greater
gap and less balance in responsibilities than districts with curriculum administrators.
When the strengths of superintendents and principals in both types of districts were

67
evenly compared, 13 responsibilities in each type of district were not chosen at all. The
curriculum administrator typically has unique strengths compared to other administrators.
Therefore, when the strengths of the curriculum administrator were factored in, the
leadership profile of the district team changed leaving only eight areas vacant, compared
to the 13 vacant areas for the team without a curriculum administrator. Wolf concluded
that districts that had curriculum administrators on the administrative team covered an
additional five of the 21 leadership responsibilities. She also suggested that in districts
with a curriculum administrator, the position had a positive impact on the district’s
curriculum and academic program, and that the vision of student learning was achieved at
a higher level in districts with curriculum administrators than districts without.
Rammer (2007) polled 200 Wisconsin public school superintendents to discover
to what extent they considered the 21 responsibilities important when they hire
principals. In addition, the study explored what systematic methods superintendents use
to assess these responsibilities when they consider principal candidates and what subsets
of the 21 responsibilities superintendents look for in principal candidates.
For the first question, Rammer (2007) used descriptive analyses. Numeric values
for the four responses were assigned: 1–strongly agree; 2–agree; 3–disagree; 4–strongly
disagree. The respondents’ mean scores for strongly agree, agree, disagree, or strongly
disagree for each of the 21 responsibilities were calculated to determine the extent to
which the sample group of superintendents considered the 21 responsibilities important.
Ninety-two percent of the superintendents’ responses indicated that they either strongly
agreed or agreed that the 21 responsibilities were important when hiring a principal.
Only 7.8% of the responses disagreed and 0.01% of the responses strongly disagreed that

68
any of the responsibilities were important to consider.
In trying to determine what systematic methods superintendents use to assess
these responsibilities when they consider principal candidates or what subsets of the 21
responsibilities superintendents look for in principal candidates, Rammer (2007) found
that the superintendents gathered this information about the candidates passively.
Although superintendents felt the 21 responsibilities were important for principals to
possess, none of them specifically sought to identify if candidates had strengths in the 21
responsibilities. Instead, superintendents used information from references, interviews,
and job applications to determine if principals had those abilities.
Rammer (2007) suggested that considering the validity of the 21 responsibilities
of school leaders study and the impact the behaviors have on student achievement,
superintendents could benefit from actively assessing whether or not principal candidates
possessed them. Superintendents could also use the 21 behaviors as the foundation for
principal evaluations.
Summary
As the role of the public school principal evolves, so should school leadership.
Today’s leaders are expected to be more of a facilitator, empowering those who work
with and for them. They should inspire, challenge, and empower others to do what they
do best. Standards developed by groups such as the Council of Chief State School
Officers (1996) and the NAESP (2001) serve as a guideline, but dynamic leadership in a
time of high-stakes accountability demands much more. As expectations increase,
perceptions of teachers and others is also an important consideration.
While the stigma of being a female in leadership or the barriers that prevent them
69
from reaching this pinnacle may vary by location, overall, women are becoming less
relegated to the traditional roles of housewife or classroom teacher. As our society
begins to view many of the duties of men and women as being more ambiguous, it is
likely that this trend will continue and opportunities for women to assume leadership
roles will continue to increase. Cultural and societal barriers are beginning to dissolve
and society is beginning to see that many of the most outstanding schools in this country
are run by women. As more females are accepted into roles of school administration,
they will serve as a role model and change cultural norms, causing even more women to
advance.
Today’s expectations of school leaders require a principal who empowers others
to achieve more than they ever believed possible. A principal who helps others move
beyond the basic needs of safety, belonging, and self-esteem, to feelings of self-
confidence, worth, strength, capability, and a sense of being useful and necessary in the
world is a necessity (Maslow, 1943). Transformational leadership has been proven by
numerous authors and researchers to be effective in helping employees advance in their
capabilities and talents. Burns (1978) stated that it occurs “when one or more persons
engage with others in such a way that leaders and followers raise one another to higher
levels of motivation and morality” (p. 20). This level of cooperation toward a higher
common goal is essential in leading today’s complex schools.
Marzano et al. (2005) identified 21 responsibilities of school leaders that lead to
high student achievement. The authors provide practical applications for exercising each
within a school and guidance for first and second-order change. While it is highly
unlikely that most school principals would be gifted with proficiency in all 21 areas,

70
research has indicated that distributed leadership within the school and professional
development for school administrators can increase the likelihood that more of these
responsibilities would be effectively utilized.

71
CHAPTER III: METHOD
Introduction
This study was designed to determine what public school teachers prefer in a
school principal in regard to gender, leadership traits, and transformational or
transactional leadership style. It also seeks to compare teacher’s rating of those
leadership traits with the preferences of their principals and to compare teachers’
preferred leadership style with the behaviors practiced by their building leader.
School administrators must be knowledgeable of the leadership traits and
behaviors their staff desires of them. While administrators set the tone and culture of the
school, teachers have been recognized as having the most significant impact on student
learning (Rivkin et al., 2005; Wright et al., 1997). Their feelings about affective
leadership are worthy of consideration.
Numerous studies over the years have examined the impact of particular
leadership traits and behaviors on student achievement. It is important for successful
leaders to increase their leadership capability in both the areas that most highly correlate
with student academic achievement as well as those desired by their faculty. District
administrators should be knowledgeable of the preferences their teachers have for a
school principal, especially when assisting in the search for a new school leader.
This chapter presents the rationale, research questions, instrument design, a description of
the participants, details of the pilot study, measures, procedures, and data analysis.
Research Questions
The following research questions will be explored:
1. What gender preferences of building-level leaders exist among teachers?

72
a. Do male teachers prefer male or female leadership?
b. Do female teachers prefer male or female leadership?
2. What is the relationship between teachers’ gender and their preferred responsibilities
of a school leader?
a. Which responsibilities are most preferred by male teachers?
b. Which responsibilities are most preferred by female teachers?
3. What is the relationship between teachers’ gender and their preferred leadership style?
a. Do male teachers prefer a transactional or transformational leadership style?
b. Do female teachers prefer a transactional or transformational leadership style?
4. Which of the 21 leadership responsibilities do principals feel are most important?
5. Which transactional or transformational leadership behaviors do principals most often
exhibit?
Research Design
This study involves descriptive and comparative research designs using survey
data. Specifically, the survey instrument was designed to determine the preferences
public K-12 classroom teachers had of school administrators in regard to gender,
leadership traits, and transformational versus transactional leadership style (see
Appendix A).
A similar secondary instrument was created following the pilot to determine
which traits the participating schools’ principals believed were most important to possess.
It also asked principals to select from a list of transformational and transactional
behaviors the ones they most often exhibit (see Appendix B).
As a new instrument, there was no existing validity or reliability. Slavin (2006)

73
stated that content validity can be established through the use of an expert panel (such as
teachers, curriculum supervisors, professionals, etc.) to determine if the instruments
actually measure what they were intended to measure. The instrument was first
distributed to six faculty members from within the university’s Educational Leadership
and Education and Behavioral Sciences departments. Following the University faculty
review, the online survey was given to four colleagues (fellow school teachers) and local
school district leaders for feedback on the design and instrumentation. Following the
reviews by the afore mentioned groups, three structural/organizational changes were
made to the pilot study and a number of questions were identified for revision or
clarification.
The question regarding years of experience was modified. It originally asked,
“How many years of teaching experience do you have?” Choices included 0-4, 5-9, 10-
14, 15,-19, and 20+ or more. The question was changed to, “Including this year, how
many years of teaching experience do you have?” Choices were changed to 1-5, 6-10,
11-15, 16-20, and 20+.
The question “Do you hold a leadership role in your school or district? (i.e.,
SBDM council member, significant committee leadership or chair, department head,
curriculum coordinator, or others)” was changed to, “Within the past three years, have
you held a leadership role in your school or district (i.e., SBDM council member,
significant committee leadership or chair, department head, curriculum coordinator, or
others)?” This would allow teachers who may have recently held positions of leadership
but had chosen to take a year or so off from that responsibility to still be included in the
cluster sample of those who held leadership roles.

74
A question asking teachers their highest level of education was added to the
survey. While this, like some of the other demographic questions did not provide data
directly related to the research questions, it provided demographic information that could
be analyzed for significant findings or lead to further research.
Finally, the option of “No preference” was added to the question which asked
teachers’ preference for the minimal preferred education level for their administrator.
An internal consistency test for reliability was performed on the 21 leadership
traits using the pilot data. Chronbach’s Alpha measure was found to be .870, indicating a
high internal consistency among the 21 items.
Participants
The survey participants are a cluster sample of public school classroom teachers
and principals, grades K-12, whose school districts are members of the Green River
Region Educational Cooperative (GRREC). GRREC, which is one of eight educational
cooperatives in the Commonwealth of Kentucky, is comprised of 33 districts in south
central Kentucky serving 114,298 students, and is partnered with Western Kentucky
University. GRREC provides professional development services to educators with a
focus on quality teaching and student learning (M. M. Alexander, personal
communication, January 12, 2011). The GRREC region was chosen as a matter of
convenience, relative to the relationship the researcher and the University had with the
Cooperative and its member schools. Since it is virtually impossible to collect findings
from all public school teachers, cluster samples can provide findings that could generally
be applied to similar groups (Slavin, 2006). The demographics of this sample in regard
to gender, race, and annual earnings are similar to the population demographics for the

75
state of Kentucky, as shown in Table 1 in Appendix C. The findings from this study can
therefore be mostly generalized for teachers statewide.
All participants in the sample were asked to identify their school and district,
gender, years of teaching experience, education level, grade level taught (elementary,
middle, high, and other), and whether or not the participant held a leadership role in their
school or district (such as SBDM Council member, significant committee leadership or
chair, department head, curriculum coordinator, or others).
Thirty-two of the GRREC region’s thirty-three school districts agreed to allow the
survey to be distributed to their teachers and principals via email (see Appendix D).
Principals were emailed first to make them aware that their superintendent had given
permission for the survey to be conducted, to provide a link to the principal survey, and
to let them know that teachers would receive their survey within a week (see Appendix
E). A total of 7,299 public school K-12 teachers in thirty-two districts (79.3% female,
20.7% male; 97.3% Caucasian, 2.7% minority) and 347 principals (41.1% female, 58.9%
male; 95.7% Caucasian, 4.3% minority) (Kentucky Department of Education, 2011) were
surveyed (see Table 2). This sample represents 16.6% of the 44,088 K-12 public school
teachers in Kentucky and 28.5% of the state’s 1,300 K-12 public school administrators.

76
Table 2
Demographics of Cluster Sample
Demographic Teachers Administrators
Race
Caucasian (%) 97.3 95.7
Minority (%) 2.7 4.3
Gender
Male (%) 20.7 58.9
Female (%) 79.3 41.1
Total 7,299 347
The researcher completed a web-based ethics training course through the
Collaborative Institutional Training Initiative (CITI) in order to conduct research with
human or subjects. Following this, permission to conduct the survey, including the initial
design for the pilot was granted by the Western Kentucky University Human Subjects
Review Board (HSRB) (Appendix E).
Participants received a link to the survey via email in March 2011 and were given
two weeks to complete it. A reminder email was sent to teachers and administrators three
days prior to the close of the survey. Participants were informed that their responses
would remain confidential, with results reported as a group. Responses reported in this
study cannot be tied to individual teachers, administrators, schools, or school districts.
Pilot Test
When constructing a new research instrument, it is important to perform a trial
run to test the instrument and determine if any issues need to be addressed before the

77
actual study is conducted. This allows an opportunity for revision or elimination of items
that do not correlate well with the objectives of the instrument (Slavin, 2006). To test
this new instrument, an online pilot survey was administered in March 2010 to teachers at
one elementary, one middle, and one high school within one of the GRREC region’s
participating school districts. These schools were chosen as a matter of convenience both
geographically and logistically, located within the school district of the researcher.
Permission to conduct the pilot was gained from the district’s superintendent and
from the principals of the participating schools. A description of the study and its
purpose was presented by the researcher at faculty meetings at each of the three schools.
Following the meetings, an email was sent to the teachers at the participating schools
describing the procedure and providing a link to the online survey. Of the one hundred
thirty-four teachers who were asked to participate, 102 (76.1%) completed the survey.
To collect suggestions for improving the survey instrument, participants were
encouraged to comment on the survey design. Based on those comments, the only
significant change to the survey was to delete the ranking of the top five responsibilities
of leaders. Participants felt it was too cumbersome to both choose and rank five
responsibilities. Data analysis also indicated that the behaviors that were chosen most
often in the top five were very closely correlated with the behaviors selected as being
“very important”. Because of the participants’ input and the similarities discovered in the
analysis, this question was eliminated.
There was also one addition to the survey: a question about transformational vs.
transactional leadership. Initially, an expert panel of six educational leadership
professionals and professors were asked to decide which of the twenty-one traits were

78
transactional and which were transformational. Only one of the twenty-one was
unanimously identified as being transactional (Order), while nine were unanimously
selected as transformational (Culture, Visibility, Communication, Outreach, Input,
Relationship, Change Agent, Optimizer, and Flexibility). The initial approach was to
determine if the traits teachers most preferred in the survey were transactional or
transformational. Some panelists felt many, if not all of the traits could be either,
depending on the situation. Because of the lack of consensus and the affect of context on
the traits, the survey that will be used for the study was changed to include an additional
page with a random-order list of equal numbers of transactional and transformational
behaviors. These behaviors were derived from the work of noted authors on the subject
(Bass, 2008; Burns, 1978; Kouzes & Posner, 1987, 2007; Yukl, 1987) and were reviewed
by an expert panel of four educational leadership professors for validity. Participants will
be asked to select the behaviors they prefer principals exhibit (see Measures).
Following the pilot, two additional research questions were added to provide
comparison between the traits teachers feel are most important for principals to possess
with the responses of their principals. A similar survey was then designed for principals
and assistant principals, asking them to choose how important each of the 21 leadership
traits or responsibilities are for a principal to possess. It also asked them to select the
leadership traits (transactional and transformational) they most often exhibited. Both
surveys were designed and administered using SurveyMonkey.
Measures
Items in the final version of the principal survey are organized into three sections:
demographics, leadership traits, and leadership style. The teacher survey has an

79
additional section for gender preferences of a school administrator. In regard to this
question, participants were asked if they had worked for a male principal, if they had
worked for a female principal, and which they preferred (male, female, or no preference,
respectively). The purpose of this question was to determine which gender is preferred
(if either) by male and female teachers, and to determine if prior experience with
principals of either gender appeared to affect the participant’s choice.
For the leadership traits portion of the survey, a list of twenty-one responsibilities
of school leaders, based on Marzano et al.’s (2005) research, were used. Those
responsibilities (traits) are: Situational Awareness; Flexibility; Discipline;
Monitoring/Evaluating; Outreach; Change Agent; Culture; Input; Knowledge of
Curriculum, Instruction, and Assessment; Order; Resources; Contingent Rewards; Focus;
Intellectual Stimulation; Communication; Ideals/Beliefs; Involvement In Curriculum,
Instruction, and Assessment; Optimizer, Visibility; and Affirmation.
To develop this list of responsibilities of school leaders, Marzano et al. (2005)
utilized a quantitative, meta-analytic approach to answer the question, “What does the
research tell us about school leadership?” After examining 69 studies spanning 23 years
involving 2,802 schools, approximately 1.4 million students, and 14,000 teachers, they
computed the correlation between the leadership behaviors of the principal in the school
and the average academic achievement of the students in the school. Most of the studies
included in the meta-analysis used some type of questionnaire asking teachers about their
perceptions of the principal’s leadership behaviors. Rather than relying on self-ratings of
principals or ratings by their supervisors, Heck (as cited by Marzano et al., 2005) found
that different respondents provide different ratings regarding principal leadership.

80
Marzano’s (2005) review of key literature led him to conclude that “teachers are thought
to provide the most valid information [in regard to principal leadership behaviors]
because they are closest to the day-to-day operations of the school and the behaviors of
the principal” (p. 30). For this study, participants were asked to rate each of the 21
responsibilities (traits) on a four-point Likert scale as not important, slightly important,
important, or very important traits for a school principal to possess.
Participants were also asked to choose the leadership style behaviors that they
would like for their principal to exhibit as he or she performs their duties as school
leader. The behaviors listed were either transactional or transformational, but were listed
together in random order and not identified as such. Eight descriptors of transformational
leadership included: (a) Employees are given autonomy to manage themselves; (b)
Rewards (tangible or intangible) are given when employees make progress toward goals,
even before they have been met; (c) Leadership works with staff to find answers for
failure to meet goals, expectations, standards, and levels of performance; (d) Boundaries,
procedures, and duties are sometimes flexible or shared; (e) Group accomplishment is
recognized over individual accomplishment; (f) Active, participatory leadership; (g)
Workers are empowered to act and make decisions; and (h) Risk-taking is encouraged.
Eight descriptors of transactional leadership included: (a) Close monitoring/supervision
of employees; (b) Rewards (tangible or intangible) are given only when employees meet
goals, expectations, standards, and levels of performance; (c) Consequences for failure to
meet goals, expectations, standards, and levels of performance; (d) Clear boundaries,
procedures, and duties for all personnel; (e) Individual accomplishment is recognized
over group accomplishment; (f) Hands-off leadership; (g) Workers are given instructions

81
and directions to follow; and (h) Risk-taking is not encouraged (Bass, 2008; Burns, 1978;
Kouzes & Posner, 1987, 2007; Yukl, 1987). Participants were asked to choose the
leadership behaviors they wanted their principal to exhibit. During analysis the traits
were tabulated to determine if teachers generally preferred more transformational or
transactional behaviors.
Results from the survey sent to principals were compared to the results of the
teacher survey to determine if principals, a) valued the same leadership traits as teachers,
and b) if principals felt they exhibited a more transactional or transformational style of
leadership. This survey was also conducted using SurveyMonkey and was sent to
principals a few days before the teacher survey. This provided an opportunity to both
distribute the survey and make principals aware that their teachers would be receiving
one as well.
Procedures
Permission to conduct the survey was obtained at a GRREC superintendent’s
meeting in September 2010. At that meeting, twenty-four of the cooperative’s thirty-two
school districts were represented and all gave their permission. The remaining eight
superintendents were contacted initially by mail and then followed up with via email
and/or phone. All but one superintendent agreed to allow teachers and administrators to
participate. A copy of the permission form used can be found in Appendix F, and the
follow-up letters are found in Appendix G.
A total of 347 principals and assistant principals were contacted via email in
March 2011 to make them aware of the teacher survey and to request their participation
in the principal survey (see Appendix H). Following this email, a description of the

82
teacher survey and an online link were emailed to (7,299) teachers (see Appendix I).
Teachers were given approximately two weeks to complete it. An email reminder was
sent three days prior to the close of the survey (see Appendix J).
Data Analysis
Responses were collected through SurveyMonkey and exported into a Microsoft
Excel spreadsheet. These data were entered into the Statistical Package for the Social
Sciences (SPSS) program and analyzed using descriptive statistics to determine
frequency of response, means, and standard deviation for each variable. Internal
consistency test for reliability was performed on the 21 leadership traits, the eight
transactional behaviors, and the eight transformational behaviors for both teachers and
administrators using Chronbach’s Alpha. Independent-samples t test were used to
determine if significant differences existed among leadership responsibilities and
behaviors between the categories of gender for both teachers and administrators, and
leadership experience for teachers. Analysis of Variance (ANOVA) was utilized to
examine differences between multi-group comparisons such as grade level taught, years
of experience, gender preference for a principal, education level obtained, and education
level desired of a principal.
Summary
The results of this study indicate the preferences that K-12 public school teachers
in thirty-two school districts in Kentucky have for a school principal. Those preferences
are in the areas of gender, leadership traits, and leadership style. Teacher preferences for
leadership traits are compared with the traits their principals most value. A comparison is
also made between the leadership behaviors (transformational or transactional) teachers
83
desire and those actually exhibited by their principals, according to principals’ self-
analysis. Demographic data collected includes participants’ gender, years of experience,
education level, grade level taught, and whether or not the participant holds a leadership
role in their school or district. The study survey was sent via email to nearly 7,300
teachers and approximately 350 school principals and assistant principals within the
GRREC region.

84
CHAPTER IV – RESULTS
The purpose of this study was to determine the preferences K-12 public school
teachers have for a building leader in regard to gender, leadership traits (based on
Marzano et al.’s (2005) 21 responsibilities of school leaders), and leadership behaviors
(transactional or transformational). Teachers and administrators were surveyed to
ascertain preferences. The results of the teacher surveys were compared to surveys
completed by administrators who indicated their preferred value of importance for each
of the 21 traits as well as frequency in which they exhibited either transformational or
transactional behaviors. The classification of these behaviors was not disclosed to
participants prior to the study.
The survey was sent to 7,299 teachers and 347 administrators in thirty-two school
districts via email and was available for participants to take over a two week time period.
A reminder was emailed three days prior to the close of the survey. The total number of
participants was 2,802 teachers and 127 school administrators. Over ninety-six percent
of schools in the sample participated, and all districts had participants (Tables 3-5).
Table 3
Participant Information
Participant Entire Sample Completed Survey Response (%)
Administrators 347 127 36.60
Teachers 7,299 2,802 38.39 Total 7,646 2,929 38.31
Schools 202 194 96.03 School Districts 32 32 100.00

85
Table 4
Demographic Information of Participating Teachers (N = 2,802)
Variable Level Number (%)
Gender Male
Female
482 (17.39)
2,290 (82.61)
Teaching Experience 1 – 5 years
6 – 10 years 11 – 15 years
16 – 20 years 20+ years
652 (23.82)
528 (19.29) 543 (19.84)
425 (15.53) 589 (21.52)
Grade Level Taught Elementary Middle
High Other
1,326 (48.45) 549 (20.06)
782 (28.57) 80 (2.92)
Leadership Role in School/District
Yes No
1,522 (55.91) 1,200 (44.09)
Education Level Bachelor’s (Rank III) Master’s (Rank II)
Rank I Doctorate
466 (17.03) 1,248 (45.06)
1,008 (36.83) 15 (0.55)

86
Table 5
Demographic Information of Participating Administrators (N = 127)
Variable Level Number (%)
Gender Male
Female
74 (59.20)
51 (40.80)
Administrative Experience 1 – 5 years
6 – 10 years 11 – 15 years
16 – 20 years 20+ years
41 (32.80)
41 (32.80) 24 (19.20)
10 (8.00) 9 (7.20)
Grade Level of School Elementary Middle
High Other
61 (48.80) 26 (20.80)
32 (25.60) 6 (4.80)
Education Level Master’s (Rank II) Rank I
Doctorate
16 (12.80) 107 (85.60)
2 (1.60)
As shown in Table 3, the majority of teacher participants were female (82.61%)
with a relatively equal level of participation from participants across all years of teaching
experience categories. The percentage of elementary teachers completing the survey
(48.45%) was nearly equal to the totals of middle and high school teachers combined
(48.63%). Over half (55.91%) had served in leadership positions in their school or
district within the last three years, and 82.98% held a degree higher than a Bachelor’s
(Table 4).
Among principals (Table 5), most (59.20%) were males with the majority

87
(65.60%) having less than 10 years experience. Few participants (N = 19) had been an
administrator for more than 16 years. The majority of participants were elementary
principals (48.80%) compared to middle (20.80%) and high (25.60%). An overwhelming
number of principals in the survey had a Rank I certification (85.60%) with only two
(1.60%) having obtained a Doctorate.
Test for Reliability
Internal consistency test for reliability using Chronbach’s Alpha was performed
on the 21 leadership traits and the sixteen leadership behaviors. Within the teacher
survey, the reliability measure for the 21 traits was found to be .891, indicating a high
internal consistency among the items. The measure for the sixteen leadership behaviors
was .746, indicating an acceptable level of internal consistency.
For the administrator survey, the Chronbach’s Alpha measure was found to be
.890 for the 21 leadership traits, and .700 for the sixteen leadership behaviors.
Analysis of Research Question 1
The first research question explored the possibility of gender preferences of
building-level leaders existing among teachers. Specifically:
• Do male teachers prefer male or female leadership?
• Do female teachers prefer male or female leadership?
Chi Square analysis revealed that a significant majority of male and female
teachers had no preference in regard to their principals’ gender (χ2 = 34.11, p < .05). The
findings are summarized in Table 6.

88
Table 6
Teacher’s Gender Preference For a Principal
Teacher Gender Prefer Female N (%)
Prefer Male N (%)
No Preference N (%)
Male 20 (4.15) 88 (39.0) 274 (56.85)
Female 187 (8.17) 610 (26.64) 1,493 (65.20) Total 207 (7.50) 798 (28.79) 1,767 (63.74)
Analysis of Research Question 2
The second research question was related to the 21 responsibilities (or traits) of
school leaders. It sought to determine the relationship between teacher gender and
preferred responsibilities of a school leader. Specifically:
a. Which responsibilities are most preferred by male teachers?
b. Which responsibilities are most preferred by female teachers?
Teachers were asked to rate each of the responsibilities as: not important (1);
slightly important (2); important (3); and very important (4). To determine which
responsibilities are most preferred by each gender, a mean score was computed for each
group, and those falling at or above this mean value were determined to be the most
highly preferred (for males, M = 3.47; for females, M = 3.60). Results are shown in
Tables 7 and 8. A comparison between gender and each of the twenty-one traits was
made using an independent-samples t test. This analysis indicated that there was a
significant difference between males and females in all but one of the traits
(Relationships). The 21 traits are listed in Table 9 with their mean score, standard
deviation, and t value.

89
Table 7
Rank Order for Male Teachers’ Preference of the Responsibilities of School Leaders
Note. Behaviors falling at or above the grand mean were determined to be the most highly desired. Numbers shown are average mean ratings based on a four-point scale, with four being highly preferred.
Responsibility Mean (SD)
Most highly preferred:
Communication 3.78 (0.42) Discipline 3.76 (0.45)
Culture 3.72 (0.50) Visibility 3.70 (0.50)
Focus 3.67 (0.51) Order 3.64 (0.53)
Situational awareness 3.53 (0.54) Monitoring/evaluating 3.51 (0.57)
Input 3.50 (0.59) Affirmation 3.50 (0.60)
Relationships 3.49 (0.62) Outreach 3.47 (0.62)
Those falling below the grand mean of 3.47: Flexibility 3.46 (0.62)
Resources 3.41 (0.64) Knowledge of curriculum, instruction, & assessment 3.41 (0.64)
Ideals/beliefs 3.39 (0.63)
Change agent 3.26 (0.72) Optimizer 3.26 (0.72)
Contingent rewards 3.18 (0.68) Involvement in Curriculum, Instruction, & Assessment 3.11 (0.79)
Intellectual stimulation 3.06 (0.76)

90
Table 8
Rank Order for Female Teachers’ Preference of the Responsibilities of School Leaders
Responsibility Mean (SD)
Most highly preferred:
Communication 3.87 (0.35) Discipline 3.81 (0.41)
Culture 3.79 (0.43) Visibility 3.76 (0.45)
Order 3.75 (0.46) Focus 3.74 (0.47)
Knowledge of curriculum, instruction, & assessment 3.72 (0.49)
Input 3.66 (0.53) Situational awareness 3.64 (0.53)
Monitoring/evaluating 3.64 (0.52) Resources 3.62 (0.54)
Affirmation 3.61 (0.53) Flexibility 3.61 (0.56)
Outreach 3.60 (0.56) Those falling below the grand mean of 3.60:
Relationships 3.53 (0.68) Ideals/beliefs 3.46 (0.61)
Optimizer 3.45 (0.62) Involvement in Curriculum, Instruction, & Assessment 3.39 (0.68)
Change agent 3.38 (0.64)
Intellectual stimulation 3.33 (0.67) Contingent rewards 3.26 (0.69)
Note. Behaviors falling at or above the grand mean were determined to be the most highly desired. Numbers shown are average mean ratings based on a four- point scale, with four being highly preferred.

91
Table 9
Differences Between Genders for the Responsibilities of School Leaders
21 Responsibilities Male M (SD)
Female M (SD) t Value
Communication 3.78 (0.42) 3.87 (0.35) -4.55*
Discipline 3.76 (0.45) 3.81 (0.41) -2.98* Culture 3.72 (0.50) 3.79 (0.43) -2.98*
Visibility 3.70 (0.50) 3.76 (0.45) -2.59* Order 3.64 (0.53) 3.75 (0.46) -4.29*
Focus 3.67 (0.51) 3.74 (0.47) -2.83* Knowledge of Curriculum, Instruction, & Assessment 3.41 (0.64) 3.72 (0.49) -9.98*
Input 3.50 (0.59) 3.66 (0.53) -5.14*
Situational Awareness 3.53 (0.54) 3.64 (0.53) -4.17*
Monitoring/Evaluating 3.51 (0.57) 3.64 (0.52) -4.54*
Affirmation 3.50 (0.60) 3.61 (0.53) -3.75*
Flexibility 3.46 (0.62) 3.61 (0.56) -4.73*
Resources 3.41 (0.64) 3.62 (0.54) -6.42*
Outreach 3.47 (0.62) 3.60 (0.56) -4.30*
Relationships 3.49 (0.62) 3.53 (0.68) -1.45
Ideals/Beliefs 3.39 (0.63) 3.46 (0.61) -2.29*
Optimizer 3.26 (0.72) 3.45 (0.62) -5.20*
Change Agent 3.26 (0.72) 3.38 (0.64) -3.44*
Involvement in Curriculum, Instruction, & Assessment 3.11 (0.79) 3.39 (0.68) -7.16*
Intellectual Stimulation 3.06 (0.76) 3.33 (0.67) -6.89*
Contingent Rewards 3.18 (0.68) 3.26 (0.69) -2.21*
Note. *p < .05. Numbers shown are average mean ratings based on a four-point scale, with four being highly preferred.

92
Analysis of Research Question 3
The third research question investigated the relationship between teachers’ gender
and their leadership style. Specifically:
a. Do male teachers prefer a transactional or transformational leadership style?
b. Do female teachers prefer a transactional or transformational leadership style?
A total of sixteen leadership behaviors were listed; eight transactional and eight
transformational. Behaviors were not categorized nor identified in the survey.
Therefore, teachers were unaware of which behaviors were transactional and which were
transformational. Participants were asked to rate each behavior as: not preferred (1);
somewhat preferred (2); preferred (3); and highly preferred (4). Participants’ responses
were analyzed using an independent-samples t test. This analysis indicated that both
males and females gave a higher average rating to transformational behaviors.
Behaviors falling at or above the grand mean for each gender (3.03 for males,
2.97 for females) were determined to be the most highly preferred. Results of male
teachers’ preferred leadership behaviors are shown in Table 10, and female teachers’
preferred leadership behaviors are shown in Table 11.

93
Table 10
Rank Order for Male Teachers’ Preferred Behaviors of Principals
Leadership Behavior TA/TF Mean (SD)
Most highly preferred:
Leadership works with staff to find answers for failure to meet goals, expectations, standards, levels of performance TF 3.39 (0.61)
Clear boundaries, procedures, and duties for all personnel TA 3.36 (0.69)
Workers are empowered to act and make decisions TF 3.27 (0.65)
Employees are given autonomy to manage themselves TF 3.20 (0.74)
Active, participatory leadership TF 3.19 (0.76)
Those falling below the grand mean of 3.03:
Risk-taking is encouraged TF 2.96 (0.81)
Group accomplishment is recognized over individual accomplishment TF 2.91 (0.86)
Boundaries, procedures, and duties are sometimes flexible or shared TF 2.91 (0.81)
Rewards are given when employees meet goals, expectations, standards, etc. TA 2.74 (0.85)
Consequences for failure to meet goals, expectations, standards, & levels of performance TA 2.59 (0.81)
Workers are given instructions and directions to follow TA 2.52 (0.87)
Close monitoring/supervision of employees TA 2.42 (0.81)
Rewards are given when employees make progress toward goals, expectations, standards, and levels of performance TF 2.39 (0.92)
Hands-off leadership TA 2.05 (1.02)
Individual accomplishment is recognized over group accomplishment TA 1.98 (0.94)
Risk-taking is not encouraged TA 1.65 (1.57)
Note: TA = Transactional, TF = Transformational. Behaviors falling at or above the grand mean were determined to be the most highly desired. Numbers shown are average mean ratings based on a four-point scale, with four being highly preferred.

94
Table 11
Rank Order for Female Teachers’ Preferred Behaviors of Principals
Leadership Behavior TA/TF Mean (SD)
Most highly preferred:
Clear boundaries, procedures, and duties for all personnel TA 3.44 (0.68)
Leadership works with staff to find answers for failure to meet goals, expectations, standards, levels of performance
TF 3.40 (0.61)
Active, participatory leadership TF 3.39 (0.67)
Workers are empowered to act and make decisions TF 3.23 (0.66)
Boundaries, procedures, and duties are sometimes flexible or shared TF 2.92 (0.86)
Employees are given autonomy to manage themselves TF 2.92 (0.80)
Risk-taking is encouraged TF 2.83 (0.83)
Group accomplishment is recognized over individual accomplishment TF 2.72 (0.88)
Those falling below the grand mean of 2.97:
Rewards are given when employees meet goals, expectations, standards, and levels of performance
TA 2.67 (0.88)
Close monitoring/supervision of employees TA 2.56 (0.80)
Workers are given instructions and directions to follow TA 2.47 (0.89)
Consequences for failure to meet goals, expectations, standards, and levels of performance
TA 2.38 (0.90)
Rewards are given when employees make progress toward goals, expectations, standards, and levels of performance TF 2.34 (0.93)
Individual accomplishment is recognized over group accomplishment TA 2.00 (0.91)
Hands-off leadership TA 1.64 (0.87)
Risk-taking is not encouraged TA 1.56 (0.76)
Note: TA = Transactional, TF = Transformational. Behaviors falling at or above the grand mean were determined to be the most highly desired. Numbers shown are average mean ratings based on a four-point scale, with four being highly preferred.

95
A comparison between gender and each of the sixteen behaviors was made using
an independent-samples t test. Table 12 shows the difference between male and female
teachers’ ranking of preference for transformational leadership behaviors, and Table 13
shows differences between male and female teachers’ ranking of preference for
transactional leadership behaviors.
Table 12
Differences Between Genders for Teachers’ Preferred Transformational Behaviors of School Leaders
Transformational Leadership Behavior
Male Mean (SD)
Female Mean (SD) t Value
Leadership works with staff to find answers for failure to meet goals, expectations, standards, levels of performance
3.39 (0.61) 3.40 (0.61) -0.52
Active, participatory leadership 3.19 (0.76) 3.39 (0.67) -5.26* Workers are empowered to act and make decisions 3.27 (0.65) 3.23 (0.66) 1.29
Employees are given autonomy to manage themselves 3.20 (0.74) 2.92 (0.80) 6.76*
Boundaries, procedures, and duties are sometimes flexible or shared 2.91 (0.81) 2.92 (0.86) -0.32
Risk-taking is encouraged 2.96 (0.81) 2.83 (0.83) 3.13*
Group accomplishment is recognized over individual accomplishment 2.91 (0.86) 2.72 (0.88) 4.34*
Rewards are given when employees make progress toward goals, even before they have been met
2.39 (0.92) 2.34 (0.93) 1.06
Note: Numbers shown are average mean ratings based on a four-point scale, with four being highly preferred. *p < .05.

96
Table 13
Differences Between Genders for Teachers’ Preferred Transactional Behaviors of School Leaders
Transactional Leadership Behavior Male Mean (SD)
Female Mean (SD) t Value
Clear boundaries, procedures, and duties for all personnel 3.36 (0.69) 3.44 (0.68) -2.14*
Rewards are given when employees meet goals, expectations, standards, and levels of performance
2.74 (0.85) 2.67 (0.88) 1.52
Close monitoring/supervision of employees 2.42 (0.81) 2.56 (0.80) -3.44*
Workers are given instructions and directions to follow 2.52 (0.87) 2.47 (0.89) 1.06
Consequences for failure to meet goals, expectations, standards, and levels of performance
2.59 (0.81) 2.38 (0.90) 4.82*
Individual accomplishment is recognized over group accomplishment
1.98 (0.94) 2.00 (0.91) -0.40
Hands-off leadership 2.05 (1.02) 1.64 (0.87) 7.99*
Risk-taking not encouraged 1.65 (1.57) 1.56 (0.76) 2.28*
Note: Numbers shown are average mean ratings based on a four-point scale, with four being highly preferred. *p < .05.
Analysis of Research Question 4
The fourth research question asked which of the 21 leadership responsibilities
(traits) principals feel are most important for school leaders to practice. Participants rated
each leadership responsibility as: not important (1); slightly important (2); important (3);
and very important (4). Traits falling at or above the mean (M = 3.62) were determined
to be principals’ most highly preferred. Results are shown in Table 14.

97
Table 14
Principals’ Preferences for the Responsibilities of School Leaders
Responsibility Mean (SD)
Most highly preferred:
Communication 3.92 (0.28)
Visibility 3.86 (0.35) Culture 3.85 (0.36)
Focus 3.74 (0.48) Discipline 3.73 (0.47)
Situational Awareness 3.71 (0.46) Monitoring/Evaluating 3.69 (0.50)
Affirmation 3.68 (0.47) Knowledge of Curriculum, Instruction, & Assessment 3.63 (0.50)
Relationships 3.63 (0.52)
Those falling below the grand mean of 3.62: Involvement in Curriculum, Instruction, & Assessment 3.59 (0.54)
Resources 3.58 (0.53)
Outreach 3.58 (0.54) Change Agent 3.57 (0.59)
Ideals/Beliefs 3.57 (0.58) Order 3.52 (0.58)
Input 3.52 (0.53) Flexibility 3.52 (0.56)
Optimizer 3.46 (0.53) Contingent Rewards 3.37 (0.61) Intellectual Stimulation 3.28 (0.60)
Note. Behaviors falling at or above the grand mean were determined to be the most highly desired. Numbers shown are average mean ratings based on a four- point scale, with four being highly preferred.

98
Analysis of Research Question 5
The final question in the study sought to determine which transactional or
transformational leadership behaviors principals most often exhibit. Principals were
asked to indicate the frequency at which they exhibited the specified behaviors. Their
choices were: rarely or never (1); occasionally (2); frequently (3); and very frequently
(4). Behaviors falling at or above the overall grand mean in each category (for
transformational, M = 3.06; for transactional, M = 2.37) were determined to be the most
often practiced. Results for principals’ frequency of transformational behaviors is shown
in Table 15, and principals’ frequency of transactional behaviors is exhibited in Table 16.
Table 15
Principal’s Self-Rating of Their Frequency of Transformational Behaviors
Leadership Behavior Mean (SD)
Most frequently practiced:
Active, participatory leadership 3.41 (0.66)
Leadership works with staff to find answers for failure to meet goals, expectations, standards, levels of performance
3.33 (0.64)
Workers are empowered to act and make decisions 3.30 (0.55) Risk-taking is encouraged 3.16 (0.71)
Employees are given autonomy to manage themselves 3.10 (0.64) Those falling below the grand mean of 3.06:
Group accomplishment is recognized over individual accomplishment
3.01 (0.71)
Boundaries, procedures, and duties are sometimes flexible or shared
2.91 (0.77)
Rewards are given when employees make progress toward goals, even before they have been met
2.27 (0.81)
Note. Behaviors falling at or above the grand mean were determined to be the most highly desired. Numbers shown are average mean ratings based on a four-point scale (4=frequently practiced).

99
Table 16
Principal’s Self-Rating of Their Frequency of Transactional Behaviors
Leadership Behavior Mean (SD)
Most frequently practiced: Clear boundaries, procedures, and duties for all personnel 3.22 (0.63)
Close monitoring/supervision of employees 2.97 (0.57) Workers are given instructions and directions to follow 2.61 (0.73)
Rewards are given when employees meet goals, expectations, standards, and levels of performance
2.60 (0.73)
Those falling below the grand mean of 2.37: Individual accomplishment is recognized over group accomplishment
2.18 (0.71)
Consequences for failure to meet goals, expectations, standards, and levels of performance
2.10 (0.74)
Hands-off leadership 1.87 (0.89)
Risk-taking is not encouraged 1.42 (0.57)
Note. Behaviors falling at or above the grand mean were determined to be the most highly desired. Numbers shown are average mean ratings based on a four-point scale (4=frequently practiced).
Summary
Statistical analysis indicated that most teachers as a whole and categorized by
gender have no preference regarding whether they have a male or female principal.
While both genders of teachers had the least preference for a female leader, females had a
significantly higher preference for a female principal, and males had a significantly
higher preference for a male principal.
Teachers and administrators overall both rated Communication as the most
important trait for a principal to possess. Discipline, Culture, and Order were next in
mean score between both genders of teachers. Females rated each of the twenty-one

100
behaviors higher in importance than did males, with significant statistical difference
between genders found in all but one trait (Relationships).
Both male and female teachers mostly gave a higher preference rating to
transformational behaviors. However, the most highly rated behavior was a transactional
one (Clear boundaries, procedures, and duties for all personnel). This behavior was rated
second highest among males.
Following Communication, principals gave the highest ratings to Visibility,
Culture, Focus, and Discipline. These were followed by the behavior Situational
Awareness, which Marzano et al. (2005) rated as the responsibility of school leaders that
most highly correlates with student academic success.
Principals rated themselves as most frequently practicing the transformational
behaviors of Active, participatory leadership; Leadership works with staff to find answers
for failure to meet goals, expectations, standards, levels of performance; and Workers are
empowered to act and make decisions. These behaviors were followed by the teachers’
most highly ranked transactional behavior, Clear boundaries, procedures, and duties for
all personnel.

101
CHAPTER V: DISCUSSION
Introduction
This study of teachers and administrators in the GRREC district of Kentucky
sought to determine teacher’s preferences of school leaders in regard to gender,
leadership traits, and leadership style. Additionally, it sought to determine which
leadership traits principals perceived as most important to them as they lead their schools,
and whether the school leaders who participated in the survey most often exhibit
transactional or transformational leadership style behaviors.
As teachers are closest to the day-to-day operations of the school and the
behaviors of the principal, they are in a unique position to identify which of the
leadership responsibilities (traits) that most likely lead to student learning are important
for them to effectively carry out their duties (Ebmeier, and Heck, Larsend, &
Marcoulides, as cited by Marzano et al., 2005). While gender alone does not determine a
principal’s leadership capacity, the results of this and other studies indicates that there are
some variations in preference for male or female leadership, and preferences for some
leadership traits and behaviors may vary based on gender, position (teacher or principal),
experience, grade level, education, or leadership experience.
Marzano et al. (2005) determined the twenty-one leadership traits utilized in the
survey are the responsibilities of school leaders that have the highest impact on student
academic achievement, based on a meta-analysis study of 69 studies on school leadership
and student learning. Rammer (2007) found that ninety-two percent of superintendents
surveyed either strongly agreed or agreed that the 21 responsibilities were important
when hiring a principal. Effective administrators can benefit by becoming aware of the

102
traits and behaviors most preferred by their teachers, as well as becoming self–aware of
the ones they most often exhibit. A number of assessments are publicly available to help
leaders do this. By becoming aware of what is desired by followers, what is possessed by
the leader, and what research says is most effective, appropriate measures can be taken to
fill the gaps.
Discussion of Research Question 1
The first research question sought to determine if there are gender preferences of
building-level leaders among teachers. Results from surveys completed by participants
revealed that both male and female teachers overwhelmingly had no preference in regard
to their principal’s gender. These findings are consistent with those found by Carroll’s
(2006) Gallup poll of Americans’ gender preference for a boss. Both studies reveal that
the majority of survey participants have no preference. Also, while a female boss is least
preferred by both genders, females have a higher preference for a female leader than for a
male. The major discrepancy between the two studies is that females in the Gallup poll
indicated that their highest preference is for a male boss (40% of respondents), compared
to the high percentage of female teachers in this study who had no preference (65.2%) in
regard to male or female leadership.
While Carroll’s (2006) Gallup poll was the only study found that compared
gender preferences for a boss or leader over time, the literature appears to indicate that 1)
females are becoming more preferred by some to serve as school leaders, and 2) that an
increasing number of employees have no preference. While opinions will likely differ
among various occupations and locations, this is good news to women looking to serve in
roles of leadership. A number of researchers have found that females tend to exhibit

103
specific leadership styles or traits (Rosener, 1990; Bass, 1998; Reynolds et al., 2008).
With survey results showing an increasing preference for either gender, females might
have an advantage if their leadership traits correspond with those needed in a particular
school or setting.
Responses from high school principals indicated that 68.63% of participants were
male. While the disproportionately high percentage of males leading high schools is not
surprising, the reasons behind it are worth looking into. Eckman (2004) examined
aspects related to the effect of gender on the role of the high school principalship. She
found that most of the females in the qualitative sub-sample of her study delayed their
entry into the position because they had children. Interestingly, it actually propelled
several of the males to seek high school administrative positions more quickly. Several
felt like they needed to increase their family’s household income, while another seemed
to just want to get out of the house. Many of the males had served as coaches while they
were teaching, which one female viewed as a leadership role. Another stated that females
couldn’t coach, because when she began her career there were no female sports.
Eckman (2004) also found that the men in her study had planned their career
paths from teaching to administration, while females somewhat “happened into” their
positions. Most of them never considered opportunities in administration until someone
else encouraged them to enter administrative certification programs. She also found
evidence of the “good old boys” network. Most of the males in the qualitative sub-group
had received phone calls or made contacts that helped them land the position, while none
of the females had. Similar findings were reported by Nogay and Beebe (2008).
Recent statistics and research indicate that the trend is shifting favorably toward
104
women in school leadership roles. Additionally, women are currently being recognized
as naturally possessing many characteristics that are suitable to the expectations of
today’s principal in the realms of instructional and transformational leadership.
Discussion of Research Question 2
The second research question examined if a relationship exists between teachers’
gender and their preferred responsibilities of a school leader. Data analysis determined
that there are distinct similarities among both male and female teachers for most
responsibilities, with Communication, Discipline, Culture, and Visibility respectively
placing first through fourth for both genders. In addition, Focus and Order rounded out
the top six, in slightly different order for each gender. These findings are similar to those
found by Valenti (2010) and Williams (2006).
Marzano et al. (2005) identified three of these traits (Communication, Culture,
and Visibility) along with Optimizer, Affirmation, Ideals/Beliefs, Situational Awareness,
Relationships, and Input as essential to the crafting of a “purposeful community.” The
authors define purposeful community as “one with the collective efficacy and capability
to develop and use assets to accomplish goals that matter to all community members
through agreed-upon processes” (p. 99). They also describe collective efficacy as a belief
shared among all members of the group that they can make a difference.
Marzano et al. (2005) also declare these same nine traits to be the most important
of the twenty-one for supporting first-order change in a school. They identify
characteristics of first-order change as: perceived as an extension of the past; fits within
existing paradigms; consistent with prevailing values and norms; capable of being
implemented with existing knowledge and skills; requires resources currently available to

105
those responsible for implementing the innovations; and, may be accepted because of
common agreement that the innovation is necessary.
One interesting finding is that females gave each of the twenty-one traits a higher
average importance rating than did males. This is parallel to Rice’s (1993) study in
which female teachers generally rated administrators higher on leadership behaviors than
did male teachers. The most highly rated traits for all teachers will be further explored
later in this chapter.
Discussion of Research Question 3
The third research question investigated whether male and female teachers had a
higher preference for a transactional or transformational leadership style. An
independent-samples t test was performed. The results indicated that both males and
females gave a higher average rating to transformational behaviors as compared to
transactional behaviors, and that males rated both styles of leadership behaviors higher
than females.
A number of authors (Burns, 1978; Bass, 1985, 1989; Leithwood, 1992a, 1992b;
Nguni et al., 2006) have lauded transformational leadership behaviors as most effective.
Despite this general preference, transactional behaviors may be necessary for carrying out
the day-to-day routines (Bass, 1985). Results of this study found that while teachers most
highly preferred the transactional behavior Clear boundaries, procedures, and duties for
all personnel (mean=3.40), two transformational behaviors: Leadership works with staff
to find answers for failure to meet goals, expectations, standards, levels of performance
(mean = 3.39); and Active, participatory leadership (mean = 3.29) were a close second
and third, respectively. These two behaviors are very applicable to those in education as

106
demands on teachers and accountability for administrators increases. Alternatively, the
behavior Hands-off leadership was given an average rating of 1.84, indicating a relatively
low preference.
It is interesting that while teachers highly prefer that boundaries, procedures, and
duties be clear, educators are now, more than ever, encouraged and willing to working
together with fellow teachers and school administration to advance educational goals.
Many researchers have concluded that this sharing of ideas and resources is essential to
meeting the current needs and mandates of public education. Some of the boundaries,
procedures, and duties are being flexed in many settings to accomplish this.
Discussion of Research Question 4
The fourth research question sought to determine which of the 21 leadership
responsibilities (traits) principals believe are most important. Their top five traits of
Communication, Visibility, Culture, Focus, and Discipline were also the top five traits
chosen by teachers as most highly desired. This will be further discussed later in chapter
five.
Marzano et al. (2005) determined Situational Awareness was the most highly
correlated of the twenty-one leadership responsibilities or traits with student academic
achievement. They described it as an “aware[ness] of the details & undercurrents in the
running of the school & [use of] this information to address current & potential
problems” (p. 43). The mean correlation for the twenty-one traits is .24. Although
Communication ranked highest among all traits, it, as well as Visibility, Affirmation, and
Relationships ranked lower in correlation with student achievement. Flexibility is second
highest in correlation with student academic achievement, yet it was rated significantly

107
lower than most behaviors in this study (3.52).
Despite principal’s rating of the behaviors, it is important to note that each of the
twenty-one traits are valuable to student academic success. Traits rated at or above the
grand mean (3.62) were determined to be the most highly preferred by school
administrators. Those behaviors and their correlations with student achievement are
shown in Table 17.
Table 17
Principals’ Most Highly Preferred Responsibilities of School Leaders and Their Correlation with Student Academic Achievement
Responsibility Rating (SD) Correlation
Communication 3.92 (0.28) .23
Visibility 3.86 (0.35) .20 Culture 3.85 (0.36) .25
Focus 3.74 (0.48) .24 Discipline 3.73 (0.47) .27
Situational Awareness 3.71 (0.46) .33 Monitoring/Evaluating 3.69 (0.50) .27
Affirmation 3.68 (0.47) .19 Knowledge of Curriculum, Instruction, & Assessment 3.63 (0.50) .25
Relationships 3.63 (0.52) .18
Note. Numbers shown are average mean ratings based on a four-point scale, with four being highly preferred.
Discuss of Research Question 5
The final question in the study asked principals to rate themselves on how
frequently they performed a number of leadership style behaviors. Sixteen behaviors

108
were provided; eight transactional, eight transformational. While analysis in chapter four
revealed that four transactional behaviors (Clear boundaries, procedures, and duties for
all personnel; Close monitoring/supervision of employees; Workers are given instructions
and directions to follow; and Rewards are given when employees meet goals,
expectations, standards, and levels of performance) along with five transformational
behaviors (Active, participatory leadership; Leadership works with staff to find answers
for failure to meet goals, expectations, standards, levels of performance; Risk-taking is
encouraged; Workers are empowered to act and make decisions; and Employees are
given autonomy to manage themselves) ranked above the mean score for each category.
Principals ranked only one transactional behavior as practiced frequently (3) to
very frequently (4): Clear boundaries, procedures, and duties for all personnel. This was
the most highly ranked preferred behavior by all teachers (3.43) among both transactional
and transformational behaviors. This correlation between the two groups is interesting to
see in a period of time in education where it seems more of the responsibility for
improvement and instruction is shared, and a push for cooperation and togetherness
sometimes supersedes the real or artificial boundaries that exist in some schools.
A list of the behaviors that principals rated themselves as practicing frequently to
very frequently is shown in Table 18.

109
Table 18
Leadership Behaviors Self-Perceived by Principals as Practiced Frequently to Very Frequently
Leadership Behavior TA/TF Principal
Frequency Mean (SD)
Active, participatory leadership TF 3.41 (0.66)
Leadership works with staff to find answers for failure to meet goals, expectations, levels of standards, performance
TF 3.33 (0.64)
Workers are empowered to act and make decisions
TF 3.30 (0.55)
Clear boundaries, procedures, and duties for all personnel
TA 3.22 (0.63)
Risk-taking is encouraged TF 3.16 (0.71)
Employees are given autonomy to manage themselves
TF 3.10 (0.64)
Group accomplishment is recognized over individual accomplishment
TF 3.01 (0.71)
Note: TA = Transactional; TF = Transformational. Behaviors falling at or above the grand mean were determined to be the most highly desired. Numbers shown are average mean ratings based on a four-point scale (4=frequently practiced).
It is evident from both teachers and administrators that transformational behaviors
are generally most highly preferred and practiced. When comparing Table 18 with
Tables 10 and 11, there are only two behaviors that principals often practice that did not
appear on both of the most highly preferred principal behaviors as rated by male and
female teachers: Risk-taking is encouraged, and Group accomplishment is recognized
over individual accomplishment. Both behaviors are transformational. It was also
discovered that there were two transactional behaviors that were above the grand mean
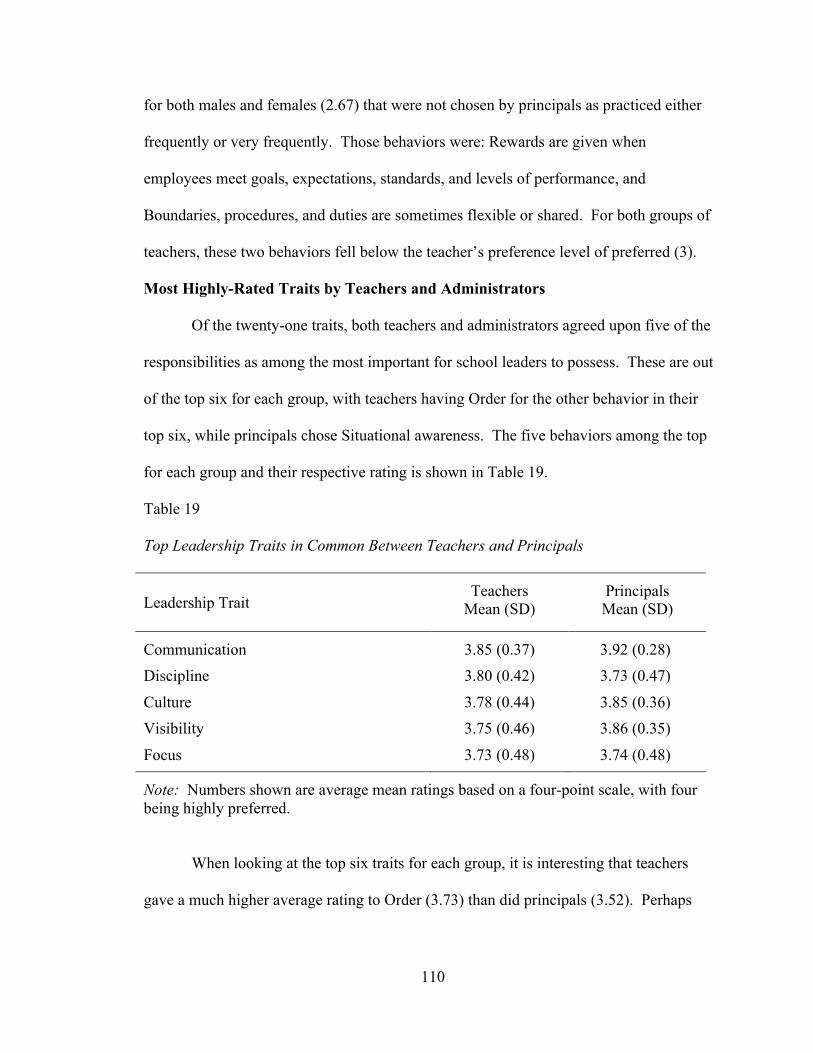
110
for both males and females (2.67) that were not chosen by principals as practiced either
frequently or very frequently. Those behaviors were: Rewards are given when
employees meet goals, expectations, standards, and levels of performance, and
Boundaries, procedures, and duties are sometimes flexible or shared. For both groups of
teachers, these two behaviors fell below the teacher’s preference level of preferred (3).
Most Highly-Rated Traits by Teachers and Administrators
Of the twenty-one traits, both teachers and administrators agreed upon five of the
responsibilities as among the most important for school leaders to possess. These are out
of the top six for each group, with teachers having Order for the other behavior in their
top six, while principals chose Situational awareness. The five behaviors among the top
for each group and their respective rating is shown in Table 19.
Table 19
Top Leadership Traits in Common Between Teachers and Principals
Leadership Trait Teachers
Mean (SD) Principals Mean (SD)
Communication 3.85 (0.37) 3.92 (0.28) Discipline 3.80 (0.42) 3.73 (0.47)
Culture 3.78 (0.44) 3.85 (0.36) Visibility 3.75 (0.46) 3.86 (0.35)
Focus 3.73 (0.48) 3.74 (0.48)
Note: Numbers shown are average mean ratings based on a four-point scale, with four being highly preferred.
When looking at the top six traits for each group, it is interesting that teachers
gave a much higher average rating to Order (3.73) than did principals (3.52). Perhaps

111
teachers, in dealing with students for the majority of their day, focus on order to
accomplish their priority task of student learning. School administrators handle a
multitude of responsibilities related to instruction, discipline, supervision, and
management, many of which “pop up” throughout the day. They understand that
juggling a variety of both planned and unplanned tasks does not necessarily take into
account one’s desire for order and organization.
Comparatively, principals selected situational awareness as among their most
highly important traits. Their rating of 3.71 is compared to a slightly lower rating by
teachers of 3.62. Marzano et al. (2005) describe it as a leader’s “awareness of the details
and the undercurrents regarding the functioning of the school and their use of this
information to address current and potential problems” (p. 60). Some of the specific
behaviors they associate with this trait include:
• Accurately predicting what could go wrong from day to day
• Being aware of informal groups and relationships among the staff
• Being aware of issues in the school that have not surfaced but could create discord
(p. 60).
While teachers are consumed with the task of keeping order and instructing
students, school administrators must look at the bigger picture. Faced with the challenge
of keeping multiple stakeholders engaged and content, ensuring that students are kept
safe and that the building functions as it should, and staying abreast of, and managing the
mandates of district, state, and federal expectations, principals must have a global view of
what is happening in their school. If administrators focus too much on one particular
aspect of their responsibility, be it extra-curriculars, politics, gossip, or even test scores,

112
they can become oblivious to situations that may undermine the very thing they are most
intently focused on.
Further Exploring the Top Five
Communication. Communication was given the highest ranking among nearly
all categories of participants regardless of grade level taught, years of experience,
education received, or leadership roles held. The only exception was principals with
sixteen or more years of experience. Marzano et al. (2005) identified some specific
behaviors and characteristics associated with communication, including:
• Developing effective means for teachers to communicate with each other
• Being easily accessible to teachers
• Maintaining open and effective lines of communication with staff (p. 47).
Scribner, Cockrell, Cockrell, and Valentine (1999) view communication as one of
the most valuable components of the school improvement process. Leithwood and Riehl
(2003) stated, “skillful leaders focus attention on key aspects of the school’s vision and
communicate the vision clearly and convincingly. They invite interchange with multiple
stakeholders through participatory communication strategies. They frame issues in ways
that lead to productive discourse and decision-making” (p. 4). Through her reviews of
the literature and study of women as leaders and learners, Colflesh (2000) cited
communication as essential to the success of an organization, with conflict resolution as a
key component. Washington (2007) found a relationship between principal’s perceived
communication style and teacher morale and job satisfaction. He also discovered that
years of experience and gender did not have a major effect upon teacher’s perceptions of
their principal’s communication style. Utilizing Marzano et al.’s (2005) twenty-one

113
responsibilities of leaders, Valenti (2010) found that elementary school leaders
recognized as National Distinguished Principals by the NAESP classified communication
as the most important leadership responsibility when guiding complex change and
improving student achievement. Williams (2006) found that faculty at two of the three
schools that dramatically raised their school’s achievement status rated communication as
their principals’ highest quality.
An interesting aspect of communication as it relates to principals and teachers is
filtering. Lunenburg and Ornstein (2003) stated that individuals often withhold
information that is passed on to another out of fear of how that information will be used.
They assert that filtering problems often cause problems in school districts, and generally
occur more often in an upward manner than in downward communication. Because
administrators are in a position to give rewards and evaluate staff, subordinates are
sometimes reluctant to fully disclose what they know. Those who have aspirations for
upward mobility or those who distrust their superiors and lack security will often filter
their messages. This can be problematic for administrators as it provides a false sense of
the culture of the school.
Discipline. Discipline was rated the second most important trait for a principal to
possess by both male and female teachers, and was ranked fifth among principals. Of the
top five among all teachers and administrators, discipline is the only one of those that
also falls within Marzano et al.’s (2005) top five of the twenty-one traits in regard to their
impact on student achievement. They define discipline as “protecting teachers from
issues and influences that would detract from their teaching time or focus” (p. 42). They
state that “protecting instructional time from interruptions” and “protecting teachers from

114
internal and external distractions” (p. 49) are core to this concept. Elmore (2000) stated,
“buffering consists of creating structures and procedures around the technical core of
teaching that, at the same time, protects teachers from outside intrusions” (p. 6). He also
states that school leaders are often hired and retained based on their ability to buffer
teachers from outside distractions and in their capacity to support the perception of
confidence in the school system, despite what may be actually occurring on the inside.
School leaders, he asserts, should “buffer teachers from extraneous and distracting non-
instructional issues so as to create an active arena for engaging and using quality
interventions on instructional issues” (p. 24).
Whitaker (2002) discussed the importance of the principal’s filter in regulating
school climate, thus shielding teachers from unnecessary worries or distractions. He
encourages administrators to place a positive spin on situations that warrant attention, and
to ignore trivial or insignificant things that could disrupt instructional quality. He states
that how principals address situations and the way they portray them to others determines
the culture of the school.
Culture. Albert Einstein was once quoted as saying, “Not everything that counts
can be measured, and not everything that can be measured, counts” (Sellers, 2001, p.
107). So it is with school culture. We measure so many things in this competitive,
accountability-driven world of education. NCLB compliance, state required test results,
attendance rates, drop-out rates, college-admission test scores, extracurricular
achievements, and more. There are, however, some things that can’t be measured, but
still count significantly toward stakeholder’s perception of the value of a school (Sellers,
2001). While there are tools available to measure specific components of a school’s

115
culture such as the School Culture Triage survey (Wagner, 2002), those who are in the
building each day can tell you it is a feeling; a consciousness of the vibe of the school.
Culture is characterized in a variety of ways. Phillips (1996) stated that it is
composed of “the beliefs, attitudes, and behaviors which characterize a school” (p. 1).
Wagner’s idea of school culture (as cited by the Center for Improving School Culture,
2004) is “shared experiences both in school and out of school (traditions and
celebrations), a sense of community, of family and team” (p. 1). Marzano et al. (2005)
state that culture is a natural by-product of people working in close proximity, but that it
can positively or negatively influence a school’s effectiveness. They also proclaim an
effective culture to be the primary tool for a leader to instigate change. The specific
behaviors they identified as associated with culture in their meta-analysis include:
• Promoting cohesion among staff
• Promoting a sense of well-being among staff
• Developing an understanding of purpose among staff
• Devloping a shared vision of what the school could be like. (p. 48)
Visibility. For a principal to correctly analyze what is happening in his or her
school, it is essential that they have an accurate perception of what is actually occuring.
While lesson plans, minutes from team meetings, and interviews with teachers can reveal
much about the cultural, instructional, and logistical flow of a school, nothing can take
the place of seeing it all first-hand. To ensure the school is adhering to the vision and
goals set forth by leadership with input from stakeholders, it is imperitive that the
principal be visible within both the building and the community. Maslow (1998) stated,
“Realistic perceiving is prerequisite to realistic behaving, and realistic behaving is

116
prerequisite to good results” (p. 93).
Marzano et al. (2005) described it as “the extent to which the school leader has
contact and interacts with teachers, students, and parents” (p. 61). They suggest that
visibility communicates to staff that the principal is interested and engaged in what is
happening in and around the school, and that it provides an opportunity for them to
interact with teachers and students regarding real issues within the school. Effective
principals who are in teachers’ classrooms each day make it “difficult to draw the line
between observations that have an evaluative intent and those that are part of the
professional support system” (Fink & Resnick, as cited by Marzano et al., 2005, p. 61).
Principals who generally appear only for evaluative purposes lose trust and
approachability from students and staff.
Rosenholtz (1985) found that when principals regularly observe teachers, skill
development results. In her review of a number of studies, she found that skill
acquisition by teachers in reading and math instruction was primarily a function of the
amount of supervision received. Others reported that when teachers are frequently
evaluated, principals are better able to judge the quality of their work, they help teachers
gain instructional skills, and teachers tend to be more satisfied.
Focus. Elmore (2002) explains “the schools that seem to do the best are those
that have a clear idea of what kind of instructional practice they want to produce, and
then design a structure to go with it. . . We put an enormous amount of energy into
changing structures and usually leave instructional practice untouched” (p. 1).
Marzano et al. (2005) suggest that school leaders can maintain focus by ensuring
concrete goals for curriculum, instruction, assessment, and the general practices within

117
the school. Principals should set goals and expectations high, and keep their attention on
the goals that have been established.
Rosenholtz (1985) determined that principals of effective schools have a united
mission of improved student learning and that their actions convey certainty that this goal
can be accomplished. Through the use of a number of strategies, these principals’ efforts
revolve around improving student achievement. The use of specific, measureable,
concrete goals helps everyone know when their efforts have achieved the desired effects.
The researcher stated that an ineffective principal may see no point in setting high
academic goals if teachers or students seem incapable of reaching them. Effective
principals, on the other hand, feel and convey confidence that teachers can improve
student achievement and that the students are indeed capable of learning. Specific
operational goals are communicated to teachers, and are at the forefront of their planning
and action.
School leaders who latch onto each new initiative that comes along, or who buy
into fads which have what I refer to as “high snazzy factors” without relieving their staff
of some of the old, tired initiatives, lose credibility and focus from their staff. Reeves
(2002) effectively described it as “weed pulling…one cannot plant flowers without first
pulling some weeds” (p. 84). He further states that “The Law of Initiative Fatigue states
that as fixed resources (time, resources, physical and emotional energy of staff) are
divided into a growing number of initiatives, the time allowed for each initiative declines
at a constant rate, while the effectiveness of each initiative declines exponentially”
(Reeves, 2002, p. 83). Teachers cannot be expected to maintain any type of worthwhile

118
focus on student learning when they are inundated with more initiatives than they can
effectively manage, and than principals can effectively monitor and assess.
Schmoker (2011) is among the most outspoken when it comes to paring down the
number of initiatives and strategies that are being used today in the name of school
improvement. He suggests that if we would simply focus on essentials, “we can make
swift, dramatic improvements in schools” (p. 1). He suggests that the three essentials for
schools are: a “reasonably coherent curriculum (what we teach); sound lessons (how we
teach); and far more purposeful reading and writing in every discipline, or authentic
literacy (integral to both what and how we teach)” (p. 2). All other initiatives, he
proclaims, shall be put aside until it has been clarified to staff that these three elements
“will have more impact on student success than all other initiatives combined” (p. 3).
Other Significant Findings
Through the analysis of the data, additional findings were discovered. These are
incidental and perhaps interesting findings that relate to the various demographics of the
participants, and are not explicitly related to the research questions. It is important to
note that only the items that showed significant statistical difference between categories
(i. e., gender, grade level taught, years of experience, etc.) for both teachers and
administrators are shown. Therefore, categories that showed no significant difference are
not mentioned.
The following tables can be found in Appendix K:
• Table K1: Teachers’ Gender Preference of Administrators and their Experience
with Each Gender

119
• Table K2: Teacher’s Preference for Minimal Education Level of Administrators
by Teacher Gender
• Table K3: Significant Differences Between Mean Scores of Teachers’ Preferred
Traits and their Years of Experience
• Table K4: Significant Differences Between Mean Scores of Teachers’ Preferred
Behaviors and their Years of Experience
• Table K5: Significant Differences Between Mean Scores of Teachers’ Preferred
Traits and Behaviors and their Education Level
• Table K6: Significant Differences Between Mean Scores of Teachers’ Preferred
Traits and their Leadership Experience
• Table K7: Significant Differences Between Mean Scores of Teachers’ Preferred
Behaviors and their Leadership Experience
• Table K8: Significant Differences Between Mean Scores of Teachers’ Preferred
Traits and their Gender
• Table K9: Significant Differences Between Mean Scores of Teachers’ Preferred
Behaviors and their Gender
• Table K10: Significant Differences Between Mean Scores of Teachers’ Preferred
Traits and their Preferred Gender of Principal
• Table K11: Significant Differences Between Mean Scores of Teachers’ Preferred
Behaviors and their Preferred Gender of Principal
• Table K12: Significant Differences Between Mean Scores of Teachers’ Preferred
Traits and their Grade Level Taught

120
• Table K13: Significant Differences Between Mean Scores of Teachers’ Preferred
Behaviors and their Grade Level Taught
• Table K14: Significant Differences Between Mean Scores of Teachers’ Preferred
Traits and their Desired Minimal Education Level of Principal
• Table K15: Significant Differences Between Mean Scores of Teachers’ Preferred
Behaviors and their Desired Minimal Education Level of a Principal
• Table K16: Significant Differences Between Mean Scores of Principals’ Most
Often Practiced Behaviors and their Education Level
• Table K17: Significant Differences Between Mean Scores of Principals’
Preferred Traits and their Gender
• Table K18: Significant Differences Between Mean Scores of Principals’
Preferred Traits and their Years of Experience
• Table K19: Significant Differences Between Mean Scores of Principals’ Most
Often Practiced Behaviors and their Years of Experience
• Table K20: Significant Differences Between Mean Scores of Principals’ Most
Often Practiced Behaviors and the Minimal Education Level They Believe a
Principal Should Have
• Table K21: Significant Differences Between Mean Scores of Principals’
Preferred Traits and the Minimal Education Level They Believe a Principal
Should Have
• Table K22: Teachers’ and Administrators’ Ordinal Rank of the Responsibilities
of School Leaders in order of Correlation With Student Academic Achievement

121
Limitations of Study
There are a few noted limitations on this study that may have affected the
findings. One is that principals performed a self-analysis of their leadership behaviors
(transactional and transformational). Their own perceptions may not be as accurate as an
assessment by their teachers or supervisors. In fact, Pingle and Cox (2007) found that
when considering their own leadership behaviors, principals in less successful schools
rated themselves higher than principals in more academically successful schools. It could
be more effective to not only have teachers choose the behaviors they would most like to
see, but to evaluate their principal on their frequency and quality of practice of each
behavior.
Another is that through their training and experience, principals should have a
better understanding of what traits and behaviors are most important for principals to
possess, and even which traits and behaviors teachers would most like to see. It would be
interesting to compare the preferences of teachers who hold administrative certification to
those of principals. While this study did collect demographic data on teachers’ leadership
experience, it was left up to teachers to decide if their responsibilities were classified as
“leadership roles,” or what exactly that entailed.
The survey was sent to every classroom teacher in the GRREC district, which
included schools identified by some teachers as “other,” in the category of level taught
(elementary, middle, high, other). Statistical analysis of some items did indicate that this
group did stand apart from others in their rating of some of the traits and behaviors. It is
unclear, however, who this includes. Two likely groups would be alternative schools or
vocational centers. The needs and preferences of teachers in settings where students are

122
sent for discipline or academic reasons, or where there is a more intent focus on
vocational skills rather than core academic areas, would likely be different from other
teachers.
Implications for Practice
Teachers should have in mind the traits and behaviors they would most like to see
in their principal before they apply for a job at a particular school. While it is the
principal who performs these actions, the culture and tradition of the school could also
influence the degree to which particular traits and behaviors are most often practiced and
effectively (or ineffectively) used.
Data gathered from this study should speak loud and clear to principals about
what teachers want. Female aspiring administrators should generally have no fear that
gender may stand in the way of their hiring, although it is daft to assume that gender
would not have some impact on the decision of some selection committees. It was a bit
surprising, but pleasing to see that administrators and teachers were very similar in their
preference and practice level for many of the traits and behaviors, especially among the
most highly-rated. Regardless of the outcome of the survey, principals should be aware
of both their own behaviors and those desired by teachers. Professional development for
principals that equips them with specific knowledge and skills for carrying out the traits
and behaviors that are both highly desired by teachers and most highly related to student
academic achievement can make them more effective as instructional leaders, and more
highly respected by staff.
Preparatory programs for school administrators could use this data to guide
instruction in the area of principal effectiveness and school culture. Regional

123
Universities and/or state educational cooperatives, such as GRREC, could survey staff in
the districts they serve in order to gain an accurate analysis of the specific desires of
teachers in that area, and tailor instruction to meet those needs.
District administrators and SBDM councils can use this survey and/or its results
in the hiring process to determine if a particular principal candidate’s strengths match the
desired traits and behaviors of a school’s teachers. While teacher turnover may have
some impact on an individual school’s exact preferences, the consistencies discovered
within individual school districts may indicate that inclinations would not dramatically
change over a reasonable period of time, and any changes may be moderated to some
extent by the principal’s “situational awareness” that would provide first-hand
understanding of what is needed at a particular school.
Recommendations for Further Research
The demographic factors of race/nationality and socio-economic status were not
addressed in this study. Although the demographics of this group of participants are
generally representative of the entire state, there are likely to be particular schools or
districts with distinct differences in their teacher or administrators’ demographic profiles.
Additionally, some districts could have dozens of ethnicities represented by their student
population or a vast disparity between the socio-economic statuses of its students. These
cultural or situational differences could impact the specific needs of a school or district,
thereby affecting teachers’ desired preferences of their administrator.
Principals could be administered a survey or be rated by their faculty in a way that
measures their proficiency or level of practice in each of the twenty-one traits and the
sixteen behaviors. This could provide more accurate analysis of the of the

124
administrator’s leadership capacity than a self-rating, as was utilized for the leadership
behaviors in this study. Teachers’ ratings of their principals’ behaviors could be
compared to those most highly desired by teachers.
A mirror survey that analyzes the preferences principals have for teachers might
also provide valuable data. While it would be inappropriate to ask for principals’ gender
preference, a group of behaviors, traits, or practices of teachers could be analyzed to
determine which are most highly preferred by administrators. A majority of teachers are
not certified in school administration, and certainly very few, if any, have any level of
experience in school administration. Data from this survey was used to compare
administrators’ preferences to those of teachers who indicated having held leadership
positions in their school or district. Similarities were found among the desired traits and
behaviors, indicating that teachers with leadership training or experience may similarly
view the characteristics needed to lead a school.
It could also be interesting to see how the preferred or practiced leadership traits
and behaviors of principals at schools determined to be “low performing,” based on state
or national standards compare to those at “high performing” schools. An alternative to
this might be to include some type of culture survey to examine the correlation between
culture and the actions of the principal, or the characteristics desired by faculty.
Gender in leadership is a topic that has been extensively explored by many
authors. This study combined the preferences of all school administrators in regard to
their preferred traits and practiced behaviors. However, one which examines the traits
and behaviors of male and female administrators to determine those that are most
frequently practiced by each gender could yield interesting data.

125
There are a multitude of significant categorical differences highlighted in
Appendix K, additional findings. One could further explore the many differences
between years of experience, grade level taught, leadership experience, etc. in regard to
the leadership traits and behaviors discussed in this study.
Conclusion
This study has shown that although specific variations may exist among various
sub-groups, in general, most teachers have no preference in regard to the gender of their
principal. While there may be leadership trait or behavior tendencies generally
associated with one gender or another, the leadership capability of the individual should
outshine any notion that when all other factors are equal, one gender is better suited to be
a principal.
The study of leadership traits has taken many forms over the years. This study
looked at a group of twenty-one leadership traits and determined that among all groups
and sub-groups of participants, Communication was the most highly-rated trait, but it was
followed closely by Discipline, Culture, Visibility, and Focus as five of the top six most
highly preferred traits for both teachers and principals. Situational Awareness was
selected as the most highly desirable trait for school leaders based on the research of
Marzano et al. (2005). It received an ordinal rank of sixth out of twenty-one for
administrators, and ninth for teachers.
Both male and female teachers mostly gave a higher preference rating to
transformational behaviors. A number of researchers and authors feel transformational
behaviors are more highly-desired than transactional ones, leading to more satisfied,
autonomous, and highly engaged employees. However, the most highly overall rated

126
behavior by teachers all teachers was a transactional one: Clear boundaries, procedures,
and duties for all personnel. Although it ranked highest among all teachers, it was rated
second highest among all behaviors for males. It is interesting that Order was the fifth-
highest overall rated behavior for teachers, as some of the tenants of Order fall in line
with this behavior. Principals, however, gave Order an ordinal ranking of sixteen out of
twenty-one.
In regard to principals’ most frequently practiced behaviors, they generally rated
themselves as most frequently practicing transformational behaviors. They also indicated
that they at least frequently perform the transactional leadership that was most highly
preferred by teachers: Clear boundaries, procedures, and duties for all personnel.
Perhaps Richardson and Lane (1996) said it best: “The better a principal
understands teachers' expectations, the more likely a principal can fulfill the expectations
of the role. Valid and reliable data on teacher expectations will assist principals to
understand more thoroughly how those expectations can influence teacher behavior,
which, ultimately, affects student achievement” (p. 292).

127
REFERENCES
Adams, K., & Hambright, W. (2004, May). Encouraged or discouraged? Women teacher
leaders becoming principals. Clearing House, 77(5), 209-211.
Atwater, L., Brett, J., Waldman, D., DiMare, L., & Hayden, M. (2004, February). Men's
and women's perceptions of the gender typing of management subroles. Sex
Roles, 50(3/4), 191-199.
Avolio, B. J. (1999). Full leadership development: Building the vital forces in
organizations (1st ed.). Thousand Oaks, CA: Sage.
Avolio, B. J., Bass, B. M., & Jung, D. J. (1999). Re-examining the components of
transformational and transactional leadership using the multifactor leadership
questionnaire. Journal of Occupational and Organizational Psychology, 72(4),
441-462.
Ayman, R., Korabik, K., & Morris, S. (2009, April). Is transformational leadership
always perceived as effective? Male subordinates' devaluation of female
transformational leaders. Journal of Applied Social Psychology, 39(4), 852-879.
Barber, M. E., & Meyerson, D. (2007). The gendering of school leadership: The
reconceptualization of a role. Paper presented at the annual meeting of the
American Educational Research Association, Chicago, IL. Retrieved from
http://seli.stanford.edu/research/documents/aera_07/barber_meyerson_gender.pdf
Barker, B. (2007). The leadership paradox: Can school leaders transform student
outcomes? School Effectiveness & School Improvement, 18(1), 21-43.
doi:10.1080/09243450601058618

128
Barter, A. (1959, October). The status of women in school administration. Education
Digest, 25, 40-41.
Bass, B. M. (1985a). Leadership and performance beyond expectations. New York: Free
Press.
Bass, B. M. (1985b). Leadership: Good, better, best. Organizational Dynamics,
13(3), 26-40. doi:10.1016/0090-2616(85)90028-2
Bass, B. M. (1990). Bass and Stodgill’s handbook of leadership (3rd ed.). New York:
The Free Press.
Bass, B. M. (1998). Transformational leadership: industrial, military, and educational
impact. Psychology Press.
Bass, B. M. (1999). Two decades of research and development in transformational
leadership. European Journal of Work & Organizational Psychology, 8(1), 9-32.
doi:10.1080/135943299398410
Bass, B. M., & Bass, R. (2008). The Bass handbook of leadership: Theory, research,
and managerial applications (4th ed.). New York: The Free Press.
Battle, D. (2009). Characteristics of Public, Private, and Bureau of Indian Education
Elementary and Secondary School Principals in the United States: Results From
the 2007–08 Schools and Staffing Survey (NCES 2009-323). National Center for
Education Statistics, Institute of Education Sciences, U.S. Department of
Education. Washington, DC.
Belenky, M., Clinchy, B., Golberger, N., & Tarule, J. (1986). Women's ways of knowing.
New York: Basic Books.
129
Blasé, J. [Joseph], & Blasé, J. [Jo] (2000). Effective instructional leadership: Teachers'
perspectives on how principals promote teaching and learning in schools. Journal
of Educational Administration, 38(2), 130-141. doi:10.1108/09578230010320082
Blount, J. (1998). Destined to rule the schools: Women and the superintendency, 1873-
1995. Albany: State University of New York Press.
Blount, J. (1999, June). Manliness and the gendered construction of school administration
in the USA. International Journal of Leadership in Education, 2(2), 55-68.
Brown, A. (1967). Reactions to leadership. Educational Administration Quarterly, 3 62-
73.
Burns, J. M. (1978). Leadership. New York: Harper & Row.
Carroll, J. (2006, September 1). Americans prefer male boss to a female boss. Gallup
News Service. Retrieved from
http://www.gallup.com/poll/24346/Americans-Prefer-Male-Boss-Female-Boss.aspx
Center for Improving School Culture (2004). Retrieved from
http://www.schoolculture.net/whatisit.html
Churchman, C. W. (1971). The design of inquiring systems: Basic concepts of systems
and organization. New York: Basic Books.
Colflesh, N. A. (2000). Women as leaders: Piecing together their reflections on life and
principalship. Advancing Women. Retrieved from
http://www.advancingwomen.com/awl/winter2000/colflesh.html
Council of Chief State School Officers. (1996). Interstate School Leaders Licensure
Consortium (ISLLC) standards for school leaders. Washington, DC: Author.
Retrieved from http://www.csc.vsc.edu/woodruffinstitute/isllcstd.pdf

130
Davis, H., & Samuelson, A. (1950). Women in education. The Journal of Social Issues,
6(3), 25-37.
Downton, J. V. (1973). Rebel leadership: Commitment and charisma in the
evolutionary process. New York: The Free Press.
Eckman, E. W. (2004). Does gender make a difference? Voices of male and female
high school principals. Planning and Changing, 35(3-4), 192-208.
Eckman, E., & Kelber, S. (2010). Female traditional principals and co-principals:
Experiences of role conflict and job satisfaction. Journal of Educational
Change, 11(3), 205-219.
Elmore, R. F. (2000). Building a new structure for school leadership. New York: Albert
Shanker Institute.
Elmore, R. F. (2002, January/February). The limits of change. Harvard Educational
Letter: Online Research. Retrieved from http://www.hepg.org/hel/article/195
Engels, N., Hotton, G., Devos, G., Bouckenooghe, D., & Aelterman, A. (2008).
Principals in schools with a positive school culture. Educational Studies
(03055698), 34(3), 159-174. doi:10.1080/03055690701811263
Ensminger, M. E., & Celentano, D. D. (1990). Gender differences in the effect of
unemployment on psychological distress. Social Science & Medicine, 30(4), 469-
477. doi:10.1016/0277-9536(90)90349-W
Eshbach, E. (2008). The symbiotic relationship between new principals and the climate
of the schools in which they lead (Doctoral dissertation). Duquesne University,
Pennsylvania. Retrieved from Dissertations & Theses: Full Text. (Publication No.
AAT 3303016)

131
Fagenson-Eland, E. A., & Baugh, G. (2000). Career, paths, networking, and mentoring.
In: Women at work: Leadership for the next century, Smith, D. M. (ed.), pp. 145-
161. Upper Saddle River, NJ: Prentice-Hall.
Hackman, M. Z., Furniss, A. H., Hills, M. J., & Paterson, T. J. (1992). Perceptions of
gender-role characteristics and transformational and transactional leadership
behaviors. Perceptual and Motor Skills, 75, 311–319.
Hackney, C. (1998, June 1). Voices of women at entry level positions of educational
administration. Advancing Women in Leadership. Retrieved from
http://www.advancingwomen.com/awl/summer98/HACK.html
Halpin, A., & Croft, D. (1963). The organizational climate of schools. Chicago: The
University of Chicago Midwest Administration Center.
Hanson, S., & Pratt, G. (1991). Job search and the occupational segregation of women.
Annals of the Association of American Geographers, 81(2), 229-253.
Harrison, A. F, & Bramson, R. M. (1977). INQ administration and interpretation
manual. Berkely, CA: Bramson, Parlette, Harrison, & Associates.
Harrison, A. F, & Bramson, R. M. (1982). Relationship between supervisors’ and
trainees’ cognitive styles and the supervision process. Journal of Counseling
Psychology, 29, 508-515.
Haslett, B., Geis, F. L., & Carter, M. R. (1996). The organizational woman: Power and
paradox. Norwood, NJ: Ablex.
Horng, E., & Loeb, S. (2010). New thinking about instructional leadership. Phi Delta
Kappan, 92(3), 66-69.

132
Jones, S. (1989). Job search methods, intensity and effects. Oxford Bulletin of
Economics and Statistics, 51, 277-296.
Judge, T. A., & Piccolo, R. F. (2004). Transformational and transactional leadership: A
meta-analytic test of their relative validity. Journal of Applied Psychology, 89(5),
755-768.
Kaestle, C. F. (2007). Victory of the common school movement: A turning point in
American educational history. In G. Clack & P. Malamud (Eds.), Historians on
America (pp. 22-29). U.S. Department of State, Washington, DC.
Kagan, D. (1989). Inquiry mode, occupational stress, and preferred leadership style
among American elementary school teachers. Journal of Social Psychology,
129(3), 297.
Kentucky Department of Education. (2011). State-wide teacher demographic info.
Retrieved from: http://www.education.ky.gov/KDE/Administrative+Resources/
Finance+and+Funding/School+Finance/District+Personnel+Information/
Certified+and+Classified+Staff+Data.htm
Knezevich, S. (Ed.). (1971). The American school superintendent: An AASA research
study. American Association of School Administrators, Washington, DC.
Kouzes, J. M., & Posner, B. Z. (1987). The leadership challenge: How to get
extraordinary things done in organizations. San Francisco: Jossey-Bass.
Kouzes, J. M. & Posner, B. Z. (2007). The leadership challenge. San Francisco: Jossey-
Bass.

133
Kress, J. S., Norris, J. A., Schoenholz, D. A., Elias, M. J., & Seigle, P. (2004). Bringing
together educational standards and social and emotional learning: Making the
case for educators. American Journal of Education, 111(1), 68-89.
Lambert, L. (2002). A framework for shared leadership. Educational Leadership, 59(8),
37-40.
Leithwood, K. A. (1992a). The move toward transformational leadership. Educational
Leadership, 49(5), 8.
Leithwood, K. A. (1992b). Transformational leadership: Where does it stand? Education
Digest, 58(3) 17.
Leithwood, K. A. (1993, October). Contributions of transformational leadership to
school restructuring. Paper presented at the meeting of the University Council for
Educational Administration, Houston, TX.
Leithwood, K. A., & Others. (1992). Transformational leadership and school
restructuring. Paper presented at the annual meeting of the International
Congress for School Effectiveness and Improvement, Victoria, British Columbia.
Leithwood, K. A., and Riehl, C. (2003). What we know about successful school
leadership. Philadelphia, PA: Laboratory for Student Success, Temple University.
Logan, J. (1998, June 1). School leadership of the 90's and beyond: A window of
opportunity for women educators. Advancing Women in Leadership. Retrieved
from http://www.advancingwomen.com/awl/summer98/LOGAN.html
Lucas, S., & Valentine, J. (2002). Transformational leadership: Principals, leadership
teams, and school culture. Paper presented at the annual meeting of the American
Educational Research Association, New Orleans, LA.

134
Lunenburg, F. C., & Ornstein, A. C. (2003). Educational administration: Concepts and
practices (4th ed.). Belmont, CA: Wadsworth Publishing.
Manasse, A. L. (1985). Vision and leadership: Paying attention to intention. Peabody
Journal of Education, 63(1), 150-173.
Mandell, B., & Pherwani, S. (2003). Relationship between emotional intelligence and
transformational leadership style: A gender comparison. Journal of Business &
Psychology, 17(3), 387-404.
Manders, D. (2008). Characteristics that make principals effective leaders. A study of
teacher perceptions of principal leadership. (Doctoral dissertation). Washington
State University. Retrieved from Dissertations & Theses: Full Text. (Publication
No. AAT 3424730)
March, J. G., & Simon, H. A. (1993). Organizations (2nd ed.). Cambridge, MA:
Blackwell.
Marzano, R. J., Waters, T., & McNulty, B. A. (2005). School leadership that works.
Aurora, CO: McREL.
Maslow, A. (1943, July). A theory of human motivation. Psychological Review, 50(4),
370-396. doi:10.1037/h0054346
Maslow, A. (1998). Maslow on management (1st ed.). New York: Wiley.
Mayer, J. D., & Salovey, P. (1997). What is emotional intelligence? In P. Salovey & D.
Sluyter (Eds.), Emotional development and emotional intelligence (pp. 3-31).
New York: Basic Books.
135
McKinney, S. (2008). An analysis of the influence of No Child Left Behind and Arizona
Learns on middle-school principal leadership behaviors and responsibilities.
(Doctoral dissertation). The University of Arizona. Retrieved from Dissertations
& Theses: Full Text. (Publication No. AAT 3336698)
Melton, A. (2007). An exploratory study of the dyadic relationship of the beginning
teacher and the administrator. (Doctoral dissertation). Michigan State University.
Retrieved from Dissertations & Theses: Full Text. (Publication No. AAT
3298083)
Mowday, R. T., Steers, R. M., & Porter, L. W. (1979). The measurement of
organizational commitment, Journal of Vocational Behaviour, 14(2), 224-247.
National Association of Elementary School Principals. (2001). Leading learning
communities: Standards for what principals should know and be able to do.
National Association of Elementary School Principals, Washington, DC.
Newton, R., Fiene, J., & Wagner, C. (1999, April). Teacher perceptions of leadership:
How do they emerge? Retrieved from ERIC database (ED436817).
Nguni, S., Sleegers, P., & Denessen, E. (2006, June). Transformational and transactional
leadership effects on teachers' job satisfaction, organizational commitment, and
organizational citizenship behavior in primary schools: The Tanzanian case.
School Effectiveness & School Improvement, 17(2), 145-177
Nogay, K., & Beebe, R. J. (2008). Gender and perceptions: females as secondary
principals. Journal of School Leadership, 18(6), 583-602.

136
Oplatka, I., & Tako, E. (2009). Schoolteachers' constructions of desirable educational
leadership: A career-stage perspective. School Leadership & Management,
29(5), 425-444.
Phillips, G. (1996). Classroom rituals for at-risk learners. Vancouver, BC: Educserv,
British Columbia School Trustees Publishing.
Pingle, T., & Cox, E. (2007, April). Leadership practices of elementary school
principals. Academic Leadership, 4. Retrieved from
http://www.academicleadership.org/article/Leadership_Practices_of_Elementary_
School_Principals
Powell, G. N. (Ed.). (1999). Handbook of gender and work. Thousand Oaks, CA: Sage.
Powell, G. N., & Graves, L. M. (2002). Women and men in management (3rd ed.).
Thousand Oaks, CA: Sage.
Quinn, A. J. (2005). School leadership, culture, and teacher stress: Implications for
problem students. Retrieved from http://www4.gu.edu.au:8080/adt- root/ public/
adt-QGU20060308.095357/index.html
Rammer, R. (2007). How do superintendents consider the responsibilities associated
with effective public school principals, as identified in the literature and
correlated with student achievement, when hiring principals? (Doctoral
dissertation). Cardinal Stritch University, Wisconsin. Retrieved from
Dissertations & Theses: Full Text. (Publication No. AAT 3263760)
Reeves, D. (2002). The daily disciplines of leadership: How to improve student
achievement, staff motivation, and personal organization. San Francisco: Jossey-
Bass.

137
Reynolds, C., White, R., Brayman, C., & Moore, S. (2008). Women and secondary
school principal rotation/succession: A study of the beliefs of decision makers
in four provinces. Canadian Journal of Education, 31(1), 32-54.
Rice, J. B. (1993). Transactional and transformational leadership: An analysis of male
and female leadership styles in Delaware public schools. (Doctoral dissertation).
Widener University, Pennsylvania. Retrieved from
http://muse.widener.edu/~egr0001/Dissertations/RiceW.html
Richardson, M., & Lane, K. (1996, May). Teachers' perceptions of principals' attributes.
Clearing House, 69(5), 290-292.
Ridgeway, C. L. (1992). Gender, interaction, and inequality. New York: Springer-
Verlag.
Rivkin, S., Hanushek, E., & Kain, J. (2005, March). Teachers, schools, and academic
achievement. Econometrica, 73(2), 417–458.
Robertson, P., Wohlstetter, P., & Mohrman, S. (1995). Generating curriculum and
instructional innovations through school-based management. Educational
Administration Quarterly, 31(3), 375-404.
Rosener, J. B. (1990). Ways women lead. Harvard Business Review, 68, 119-125.
Rosenholtz, S. J. (1985). Effective schools: Interpreting the evidence. American
Journal of Education, 9, 352-388.
Schmoker, M. (2011). Focus: Elevating the essentials to radically improve student
learning. Alexandria, VA: Association for Supervision & Curriculum
Development.

138
Scribner, J., Cockrell, K., Cockrell, D. H., & Valentine, J. W. (1999). Creating
professional communities in schools through organizational learning: An
evaluation of a school improvement process. Educational Administration
Quarterly, 35(1), 130.
Sellers, N. (2001). Shaping school culture. Excerpts of an interview of Dr. Kent
Peterson. Retrieved from www.smallschoolsproject.org/PDFS/culture.pdf
Sergiovanni, T. J. (1990). Adding value to leadership gets extraordinary results.
Educational Leadership, 47(8), 23.
Shakeshaft, C. (1998). Wild patience and bad fit: Assessing the impact of affirmative
action on women in school administration. Educational Researcher, 27(9), 10-12.
Sheppard, B. (1996). Exploring the transformational nature of instructional leadership.
Alberta Journal of Educational Research, 42(4), 325-344.
Simmons, W. W. (2001, January 11). When it comes to choosing a boss, Americans still
prefer men. Gallup News Service. Retrieved from http://www.gallup.com/poll/
2128/When-Comes-Choosing-Boss-Americans-Still-Prefer-Men.aspx
Sinclair, A. (1998). Doing leadership differently: Gender, power and sexuality in a
changing business culture. Melbourne: Melbourne University Press.
Slavin, R. E. (2006). Educational research in an age of accountability (1st ed.). New
York: Allyn & Bacon.
Smith, C. A., Organ, D. W., & Near, J. P. (1983). Organizational citizenship behaviour:
Its nature and antecedents. Journal of Applied Psychology, 68(4), 653-663.
Stakes, J. (1979). The ability/performance dimension of self-esteem: Implications for
women’s achievement behavior. Psychology of Women Quarterly, 3(4), 365-377.

139
Tolbert, P. S., & Moen, P. (1998, May). Men's and women's definitions of "good" jobs.
Work & Occupations, 25(2), 168-194.
United Republic of Tanzania. (2010). National website. Retrieved from
http://www.tanzania.go.tz/educationf.html
U. S. Congress, Senate Committee on Equal Educational Opportunity. (1970). Toward
equal educational opportunity. Washington, DC: Government Printing Office.
U. S. Department of Education, National Center for Education Statistics. (2010).
Retrieved April 24, 2011 from
http://nces.ed.gov/programs/coe/2010/section4/indicator29.asp
Valenti, M.. (2010). Leadership responsibilities associated with student academic
achievement: A study of the perspectives of national distinguished elementary
school principals in an era of high stakes accountability. (Doctoral dissertation).
Seton Hall University, New Jersey. Retrieved from Dissertations & Theses: Full
Text. (Publication No. AAT 3415837)
Wagner, C. (2002). School culture triage survey. Retrieved from
http://www.schoolculture.net/
Washington, J. (2007). Teachers' perception of the principal's communication style and
its effect on teacher morale and job satisfaction. (Doctoral dissertation). Texas
Southern University. Retrieved from Dissertations & Theses: Full Text.
(Publication No. AAT 3317520)
Western Kentucky University Libraries (2006). Kentucky Education Reform Act of 1990.
Retrieved from: http://www.wku.edu/Library/kera/keralaw/001.pdf

140
Whitaker, T. (2002). What great principals do differently: 15 things that matter most.
Larchmont, NY: Eye On Education.
Williams, K. E. (2006). An examination of building-level leadership
characteristics and their impact on student achievement: A case study. (Doctoral
dissertation). Arizona State University. Retrieved from Dissertations & Theses:
Full Text. (Publication No. AAT 3210235)
Wolf, M. (2010). The perceived impact of the curriculum administrator in facilitating a
vision of learning in small, rural Pennsylvania school districts. (Doctoral
dissertation). Indiana University of Pennsylvania. Retrieved from Dissertations &
Theses: Full Text. (Publication No. AAT 3403208)
Wright, S., Horn, S., & Sanders, W. (1997). Teacher and classroom context effects
on student achievement: Implications for teacher evaluation. Journal of
Personnel Evaluation in Education, 11(1). 57-67.
Yamauchi, H. (1995, December). Factor structure of preferences for job attributes among
Japanese workers. Psychological Reports, 77(3), 787.
Yukl, G. (1987). A new taxonomy for integrating diverse perspectives on managerial
behavior. Paper presented at the American Psychological Association, New York.

141
APPENDICES
Appendix A: Teacher Survey

142

143

144

145
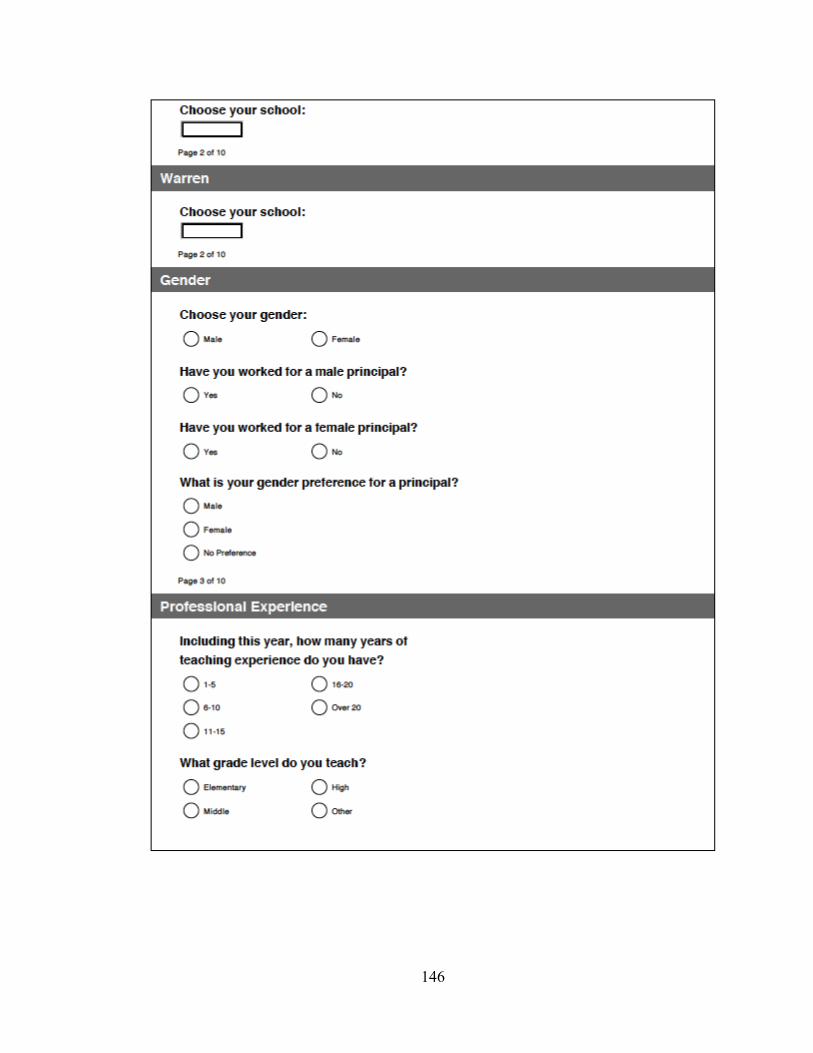
146

147

148
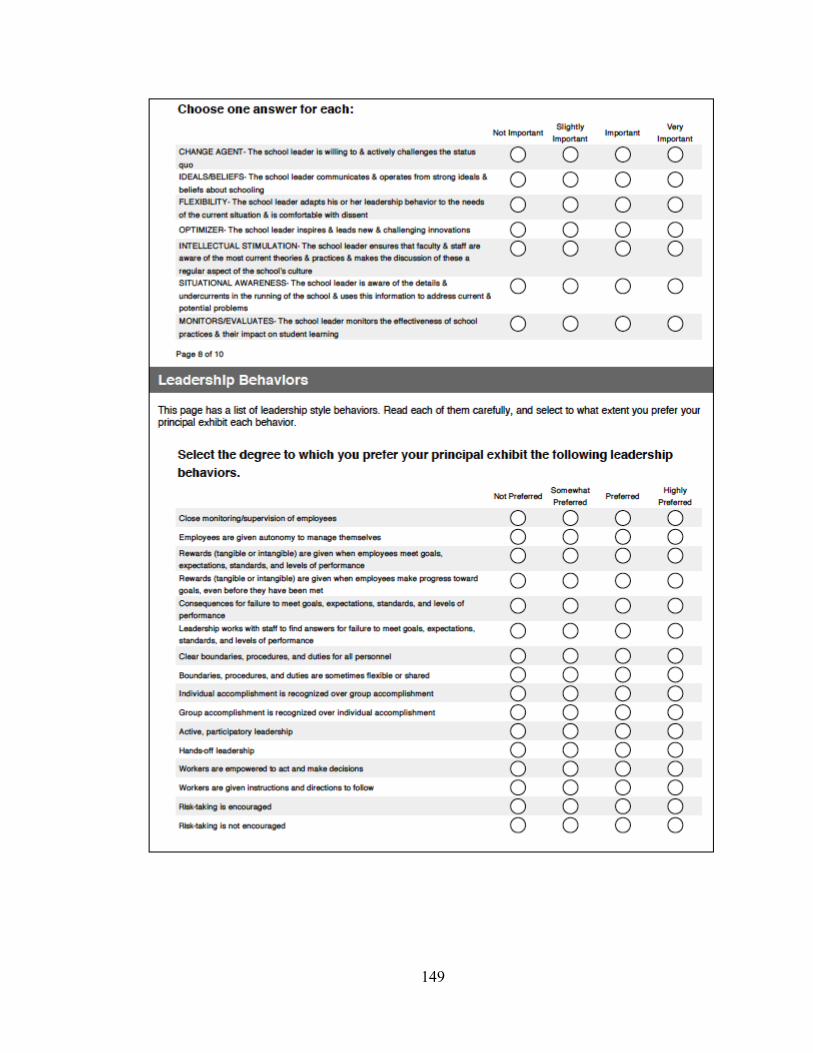
149

150
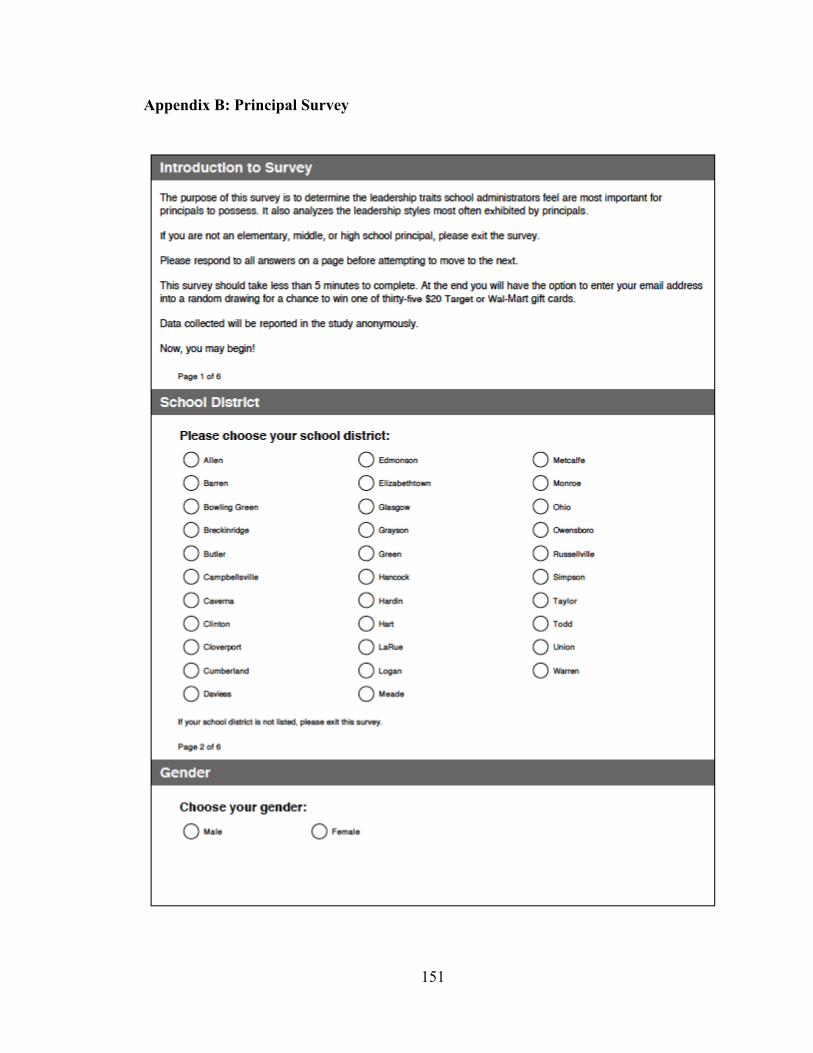
151
Appendix B: Principal Survey
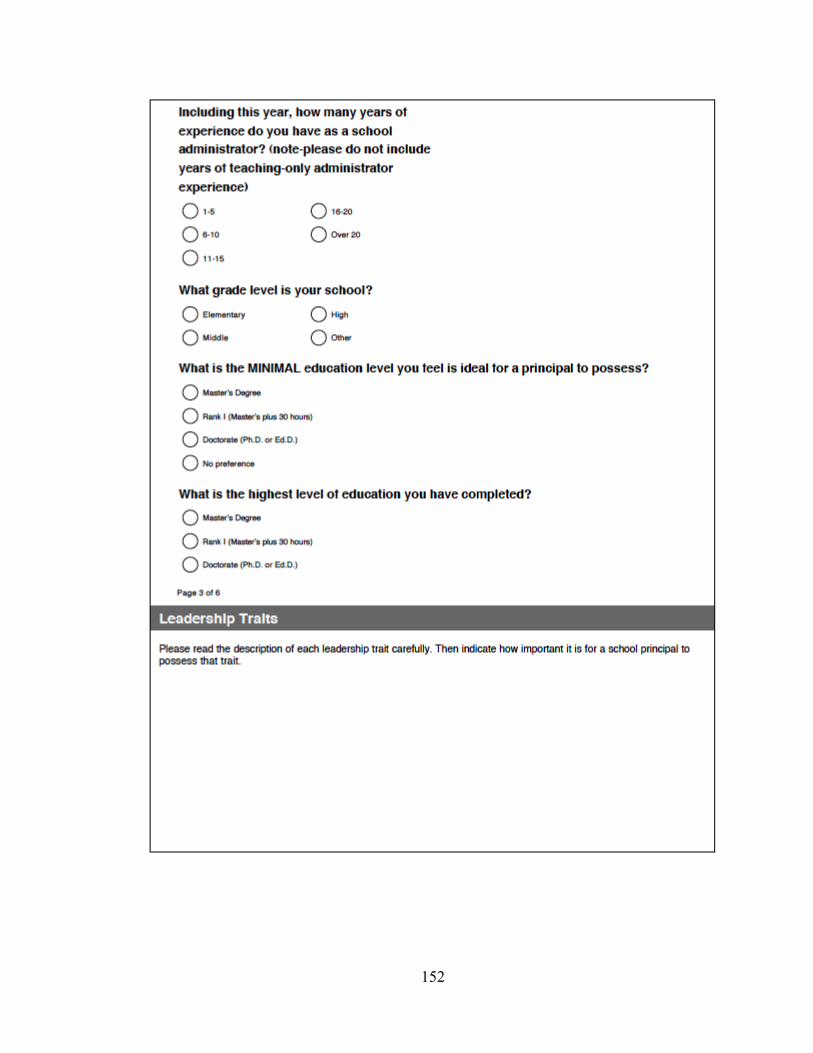
152

153

154

155
Appendix C: Demographic Comparison of Sample to Population
Table C1
Demographics of Sample Compared to Demographics of Population
Category Participants (sample)
Kentucky (population)
Teachers, Male 17.39% 21.4%
Teachers, Female 82.61% 78.6% Administrators, Male 59.20% 53.9%
Administrators, Female 40.80% 46.1% Average Certified Salary $50,459 $52,658
Note: Source: (Kentucky Department of Education, 2011).

156
Appendix D: Participating School Districts
Allen County Barren County Bowling Green Independent Breckinridge County Butler County Campbellsville Independent Caverna Independent Clinton County Cloverport Independent Cumberland County Daviess County Edmonson County Elizabethtown Independent Glasgow Independent Grayson County Green County Hancock County Hardin County Hart County LaRue County Logan County Meade County Metcalfe County Monroe County Ohio County Owensboro Independent Russellville Independent Simpson County Taylor County Todd County Union County Warren County

157
Appendix E: IRB Approval

158
Appendix F: Superintendent Permission
DAN COSTELLOW
3653 SILVER SUN DRIVE • BOWLING GREEN, KY 42104 ________________________________________________________________________
PERMISSION TO CONDUCT SURVEY
As superintendent of the ___________________________________ school district, I (check one): _________ grant permission _________ do not grant permission
for Dan Costellow, an Educational Leadership Doctoral student at Western Kentucky University to conduct a survey of administrators and school teachers in my district regarding gender and leadership preferences of school principals.
Signed: _____________________________________________________
Date: _________________________________________ Please list the name of an individual in the district who can assist me in contacting your district’s teachers via email if necessary: ________________________________________________
Approval for this study has been granted by the Western Kentucky University Human Subjects review board, #HS10-150

159
Appendix G: Follow-up Letters for Superintendents
DAN COSTELLOW 3653 SILVER SUN DRIVE • BOWLING GREEN, KY 42104
________________________________________________________________________
September 23, 2010 Dear Superintendent: I’m sorry that I missed you at the GRECC meeting on September 3. Please take a look at the enclosed letter, permission form, and sample survey. Of the 24 superintendents in attendance that day, all agreed to participate. I hope you will consider allowing me to conduct this study in your district as well. Sincerely, Dan Costellow Ed.D. Candidate Western Kentucky University Enclosures (3)

160
DAN COSTELLOW 3653 SILVER SUN DRIVE • BOWLING GREEN, KY 42104
________________________________________________________________________
September 3, 2010 Dear Superintendent:
I am an assistant principal at South Warren Middle School and Ed.D. candidate in the Western Kentucky University Educational Leadership Doctoral Program. My dissertation research focuses on the preferences of school teachers in the GRREC region with respect to gender and leadership traits of principals.
I am seeking permission to email your teachers and administrators to conduct an online leadership traits survey (copy attached). Your district’s participation will be beneficial to educators across the state that aspire to become a principal, and may be used by current administrators as they serve their schools. The results of the study could also be useful to you and your schools’ SBDM councils in their process of principal selection. If you so desire I will be happy to share the results of the survey with you when the study is finished. The survey should take participants approximately 5 minutes to complete. This project is being completed under the guidance of Dr. Christopher Wagner at Western Kentucky University. If you have questions about the study you may contact him at (270) 745-3061 or [email protected]. I can be reached via email at [email protected] or by phone, (270) 779-8130. Thank you for considering our invitation to participate in this study. Please complete the attached permission form. Sincerely, Dan Costellow Ed.D. Candidate Western Kentucky University

161
Appendix H: Email to Principals
From: Costellow, Dan Sent: Monday, March 21, 2011 3:47 PM To: (Principals) Subject: Leadership study Dear Administrator: I am the Assistant Principal at South Warren Middle School and an Ed.D. candidate in the Western Kentucky University Educational Leadership Doctoral Program. My dissertation research focuses on the preferences of K-12 teachers in the GRREC region with respect to gender and leadership traits of principals. Your superintendent has permitted me to conduct a survey of teachers and administrators in your district. Participation in the survey is voluntary and should only take about five minutes to complete online. Once you finish you can choose to enter into a drawing for one of thirty-five $20 Target or Wal-Mart gift cards. Your opinions, as a practicing principal, would be most helpful in this study. Would you please take a moment to click on the following link in order to participate by April 1? http://www.surveymonkey.com/s/school_administrator_leadership_survey You will be asked to rank the importance of 21 leadership traits for school leaders, and to indicate some of the leadership behaviors you generally practice. Your participation is valuable. Responses will be compared to those of teachers and will be reported anonymously in the study. This project is being completed under the guidance of Dr. Chris Wagner at Western Kentucky University. If you have questions about the study, you may contact him at (270) 745-4890 or [email protected]. I can be reached via email at [email protected] or by phone, (270) 779-8130. Thank you so much for participating, and allowing me to conduct this study in your school! Sincerely, Dan Costellow ____________ Dan Costellow Assistant Principal South Warren Middle School

162
Appendix I: Email to Teachers
From: Costellow, Dan Sent: Monday, March 21, 2011 3:56 PM To: (Teachers) Subject: Your preferred principal Dear (Name of District) Teacher: I am the Assistant Principal at South Warren Middle School and an Ed.D. candidate in the Western Kentucky University Educational Leadership Doctoral Program. My dissertation research focuses on the preferences of K-12 teachers with respect to gender and leadership traits of principals. Your superintendent has permitted me to conduct a survey of teachers in your district. Participation in the survey is voluntary and should only take about five minutes to complete online. Once you finish you can choose to enter into a drawing for one of thirty-five $20 Target or Wal-Mart gift cards. Your opinions will help school leaders across the country understand what you want in your ideal principal. Would you please take a moment to click on the following link in order to participate by April 1? http://www.surveymonkey.com/s/teacher_preferences_of_administrators This project is being completed under the guidance of Dr. Chris Wagner at Western Kentucky University. If you have questions about the study, you may contact him at (270) 745-4890 or [email protected]. I can be reached via email at [email protected] or by phone, (270) 779-8130. Thank you for your participation! Sincerely, Dan Costellow
____________ Dan Costellow Assistant Principal South Warren Middle School

163
Appendix J: Reminder Emails to Administrators and Teachers
From: Costellow, Dan Sent: Wednesday, March 30, 2011 9:33 PM To: (Principals) Subject: Reminder-Leadership survey ends April 1! Administrators- A quick reminder-If you've not had a chance to take the survey for principals/asst. principals, I'd love to have your input. Takes less than five minutes and you might win a $20 gift card. If you wish to participate please do so by Friday, April 1! If you have already taken the survey, please do not do so again. Thanks- Dan _____________________ Dear Administrator: I am the Assistant Principal at South Warren Middle School and an Ed.D. candidate in the Western Kentucky University Educational Leadership Doctoral Program. My dissertation research focuses on the preferences of K-12 teachers in the GRREC region with respect to gender and leadership traits of principals. Your superintendent has permitted me to conduct a survey of teachers and administrators in your district. Participation in the survey is voluntary and should only take about five minutes to complete online. Once you finish you can choose to enter into a drawing for one of thirty-five $20 Target or Wal-Mart gift cards. Your opinions, as a practicing principal, would be most helpful in this study. Would you please take a moment to click on the following link in order to participate by April 1? http://www.surveymonkey.com/s/school_administrator_leadership_survey You will be asked to rank the importance of 21 leadership traits for school leaders, and to indicate some of the leadership behaviors you generally practice. Your participation is valuable. Responses will be compared to those of teachers and will be reported anonymously in the study. This project is being completed under the guidance of Dr. Chris Wagner at Western Kentucky University. If you have questions about the study, you may contact him at (270) 745-4890 or [email protected]. I can be reached via email at [email protected] or by phone, (270) 779-8130. Thank you so much for participating, and allowing me to conduct this study in your school! Sincerely, Dan Costellow ____________ Dan Costellow Assistant Principal South Warren Middle School
164
From: Costellow, Dan Sent: Wednesday, March 30, 2011 9:55 PM To: (Teachers) Subject: Reminder-Survey ends April 1! Teachers- A quick reminder-If you've not had a chance to take the survey for teachers, I'd love to have your input. See below. Takes less than five minutes and you might win a $20 gift card. If you wish to participate please do so by Friday, April 1! If you have already taken the survey, please do not do so again. Thanks- Dan ____________ Dear (Name of District) Teacher: I am the Assistant Principal at South Warren Middle School and an Ed.D. candidate in the Western Kentucky University Educational Leadership Doctoral Program. My dissertation research focuses on the preferences of K-12 teachers with respect to gender and leadership traits of principals. Mr. Murley has permitted me to conduct a survey of teachers in our district. Participation in the survey is voluntary and should only take about five minutes to complete online. Once you finish you can choose to enter into a drawing for one of thirty-five $20 Target or Wal-Mart gift cards. Your opinions will help school leaders across the country understand what you want in your ideal principal. Would you please take a moment to click on the following link in order to participate by April 1? http://www.surveymonkey.com/s/teacher_preferences_of_administrators This project is being completed under the guidance of Dr. Chris Wagner at Western Kentucky University. If you have questions about the study, you may contact him at (270) 745-4890 or [email protected]. I can be reached via email at [email protected] or by phone, (270) 779-8130. Thank you for your participation! Sincerely, Dan Costellow ____________ Dan Costellow Assistant Principal South Warren Middle School

165
Appendix K: Additional Findings
Table K1
Teachers’ Gender Preference of Administrators and their Experience with Each Gender
Preference for Gender of Administrator
Experience Prefer Female N (%)
Prefer Male N (%)
No Preference
N (%)
Total Respondents
Female, only worked for male principals 16 (3.18) 121 (24.10) 366 (72.76) 503
Female, only worked for female principals 35 (13.83) 20 (7.91) 198 (78.26) 253
Female, worked for male & female principals 136 (8.90) 468 (30.63) 924 (60.47) 1528
Male, only worked for male principals 0 (0) 66 (44.00) 84 (56.00) 150
Male, only worked for female principals 1 (2.08) 7 (14.58) 40 (83.33) 48
Male, worked for male & female principals 19 (6.76) 113 (40.21) 149 (53.02) 281

166
Table K2
Teacher’s Preference for Minimal Education Level of Administrators by Teacher Gender
Preferred Level of Education for an Administrator
Respondents Master’s
N (%) Rank I N (%)
Doctorate N (%)
No Preference N (%)
Male Teachers 124 (26.16) 301 (63.50) 12 (2.53) 37 (7.81)
Female Teachers 350 (15.46) 1,676 (74.06) 79 (3.49) 158 (6.98) Total 474 (17.32) 1,977 (72.23) 91 (3.32) 195 (7.12)
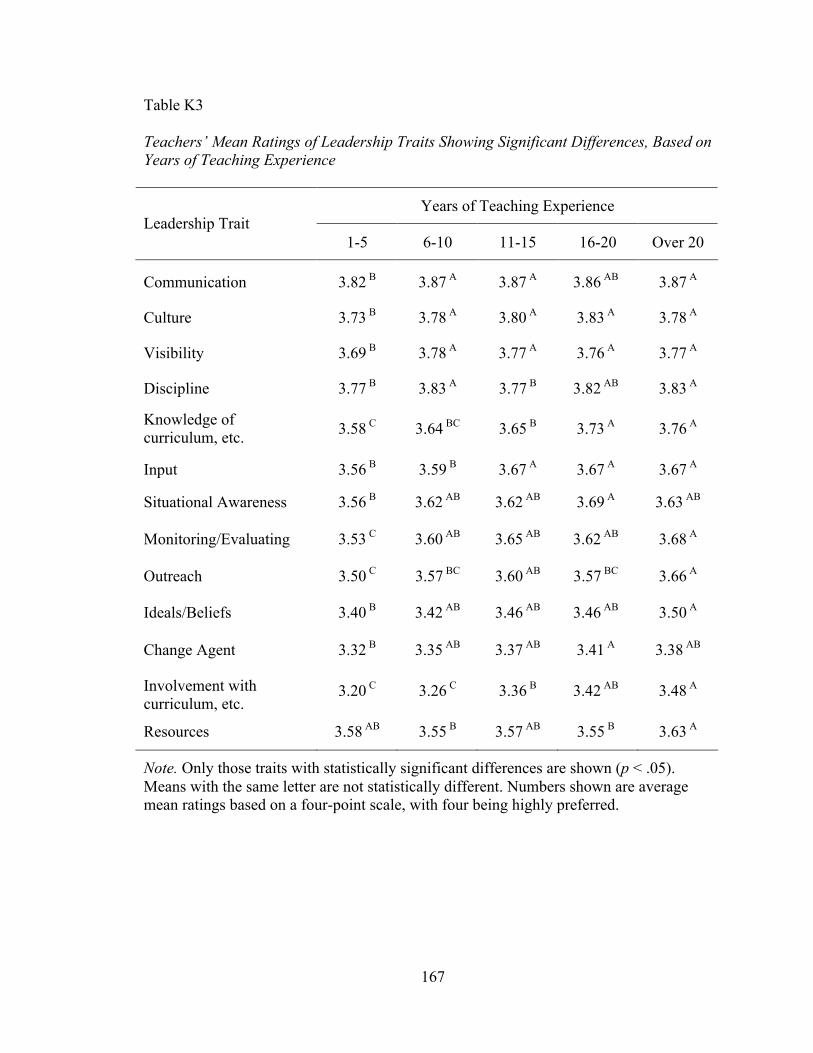
167
Table K3
Teachers’ Mean Ratings of Leadership Traits Showing Significant Differences, Based on Years of Teaching Experience
Years of Teaching Experience Leadership Trait
1-5 6-10 11-15 16-20 Over 20
Communication 3.82 B 3.87 A 3.87 A 3.86 AB 3.87 A
Culture 3.73 B 3.78 A 3.80 A 3.83 A 3.78 A
Visibility 3.69 B 3.78 A 3.77 A 3.76 A 3.77 A
Discipline 3.77 B 3.83 A 3.77 B 3.82 AB 3.83 A
Knowledge of curriculum, etc. 3.58 C 3.64 BC 3.65 B 3.73 A 3.76 A
Input 3.56 B 3.59 B 3.67 A 3.67 A 3.67 A
Situational Awareness 3.56 B 3.62 AB 3.62 AB 3.69 A 3.63 AB
Monitoring/Evaluating 3.53 C 3.60 AB 3.65 AB 3.62 AB 3.68 A
Outreach 3.50 C 3.57 BC 3.60 AB 3.57 BC 3.66 A
Ideals/Beliefs 3.40 B 3.42 AB 3.46 AB 3.46 AB 3.50 A
Change Agent 3.32 B 3.35 AB 3.37 AB 3.41 A 3.38 AB
Involvement with curriculum, etc.
3.20 C 3.26 C 3.36 B 3.42 AB 3.48 A
Resources 3.58 AB 3.55 B 3.57 AB 3.55 B 3.63 A
Note. Only those traits with statistically significant differences are shown (p < .05). Means with the same letter are not statistically different. Numbers shown are average mean ratings based on a four-point scale, with four being highly preferred.
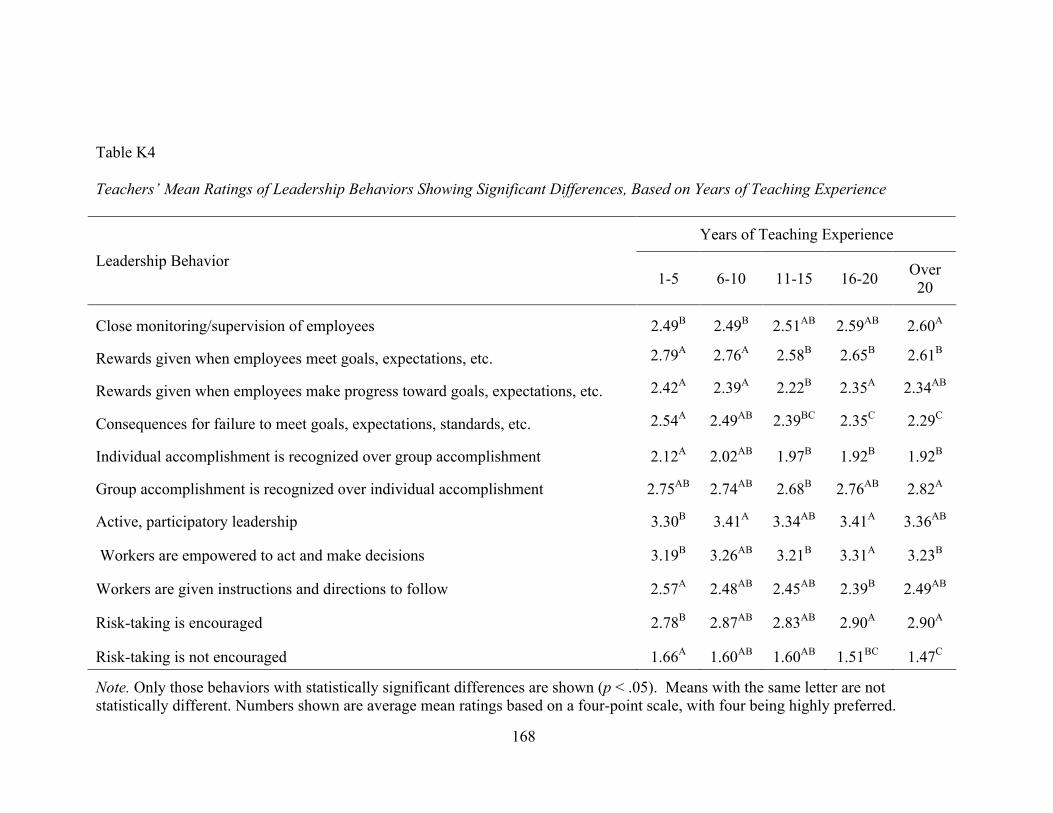
168
Table K4
Teachers’ Mean Ratings of Leadership Behaviors Showing Significant Differences, Based on Years of Teaching Experience
Years of Teaching Experience
Leadership Behavior 1-5 6-10 11-15 16-20 Over
20
Close monitoring/supervision of employees 2.49B 2.49B 2.51AB 2.59AB 2.60A
Rewards given when employees meet goals, expectations, etc. 2.79A 2.76A 2.58B 2.65B 2.61B
Rewards given when employees make progress toward goals, expectations, etc. 2.42A 2.39A 2.22B 2.35A 2.34AB
Consequences for failure to meet goals, expectations, standards, etc. 2.54A 2.49AB 2.39BC 2.35C 2.29C
Individual accomplishment is recognized over group accomplishment 2.12A 2.02AB 1.97B 1.92B 1.92B
Group accomplishment is recognized over individual accomplishment 2.75AB 2.74AB 2.68B 2.76AB 2.82A
Active, participatory leadership 3.30B 3.41A 3.34AB 3.41A 3.36AB
Workers are empowered to act and make decisions 3.19B 3.26AB 3.21B 3.31A 3.23B
Workers are given instructions and directions to follow 2.57A 2.48AB 2.45AB 2.39B 2.49AB
Risk-taking is encouraged 2.78B 2.87AB 2.83AB 2.90A 2.90A
Risk-taking is not encouraged 1.66A 1.60AB 1.60AB 1.51BC 1.47C
Note. Only those behaviors with statistically significant differences are shown (p < .05). Means with the same letter are not statistically different. Numbers shown are average mean ratings based on a four-point scale, with four being highly preferred.
168

169
Table K5
Teachers’ Mean Ratings of Leadership Traits Showing Significant Differences, Based on Teachers’ Education Level
Teachers’ Education Level Leadership Trait
Bachelor’s Master’s Rank I Doctorate
Resources 3.65 A 3.57 A 3.57 A 3.27 B
Ideals/beliefs 3.44 AB 3.43 AB 3.48 A 3.21 B
Note. Only those traits with statistically significant differences are shown (p < .05). Means with the same letter are not statistically different. Numbers shown are average mean ratings based on a four-point scale, with four being highly preferred.

170
Table K6
Teachers’ Mean Ratings of Leadership Behaviors Showing Significant Differences, Based on Teachers’ Education Level
Teachers’ Education Level Leadership Behavior
Bachelor’s Master’s Rank I Doctorate
Rewards are given when employees make progress toward goals, even before they have been met
2.81 AB 2.61 B 2.71 B 3.14 A
Note. Only one behavior was statistically significant among categories (p < .05). Means with the same letter are not statistically different. Numbers shown are average mean ratings based on a four-point scale, with four being highly preferred.

171
Table K7
Teachers’ Mean Ratings of Leadership Traits Showing Significant Differences, Based on Leadership Experience
Leadership Experience Leadership Trait
Experience No Experience
Culture 3.82 3.73
Involvement with curriculum, etc. 3.39 3.28
Focus 3.39 3.28
Visibility 3.77 3.73
Change Agent 3.39 3.33
Optimizer 3.44 3.38
Monitoring/evaluating 3.65 3.57
Situational Awareness 3.64 3.60
Note. Only those traits with statistically significant differences are shown (p < .05). Numbers shown are average mean ratings based on a four-point scale, with four being highly preferred.

172
Table K8
Teachers’ Mean Ratings of Leadership Behaviors Showing Significant Differences, Based on Leadership Experience
Leadership Experience Leadership Behavior
Experience No Experience
Close monitoring/supervision of employees 2.58 2.48
Consequences for failure to meet goals, expectations, standards, and levels of performance 2.45 2.38
Leadership works with staff to find answers for failure to meet goals, expectations, standards, and levels of performance 3.44 3.35
Group accomplishment is recognized over individual accomplishment 2.79 2.71
Active, participatory leadership 3.40 3.30
Workers are empowered to act and make decisions 3.27 3.19
Risk-taking is encouraged 2.93 2.75
Risk-taking is not encouraged 1.55 1.61
Note. Only those behaviors with statistically significant differences are shown (p < .05). Numbers shown are average mean ratings based on a four-point scale, with four being highly preferred.
172

173
Table K9
Teachers’ Mean Ratings of Leadership Traits Showing Significant Differences, Based on Teacher Gender
Leadership Trait Male Rating
Female Rating
Culture 3.72 3.79
Order 3.64 3.75
Discipline 3.76 3.81
Resources 3.41 3.62
Involvement in curriculum, instruction, & assessment 3.11 3.39
Focus 3.67 3.74
Knowledge of curriculum, instruction, & assessment 3.41 3.72
Visibility 3.70 3.76
Contingent rewards 3.18 3.26
Communication 3.77 3.87
Outreach 3.47 3.60
Input 3.50 3.66
Affirmation 3.50 3.61
Change agent 3.26 3.38
Optimizer 3.26 3.45
Ideals/beliefs 3.39 3.46
Monitoring/evaluating 3.51 3.64
Flexibility 3.46 3.61
Situational Awareness 3.53 3.64
Intellectual Stimulation 2.42 2.56
Note. Only those traits with statistically significant differences are shown (p < .05). Numbers shown are average mean ratings based on a four-point scale, with four being highly preferred.

174
Table K10
Teachers’ Mean Ratings of Leadership Behaviors Showing Significant Differences, Based on Teacher Gender
Leadership Behavior Male Rating
Female Rating
Close monitoring/supervision of employees 2.42 2.56
Employees are given autonomy to manage themselves 3.20 2.92
Consequences for failure to meet goals, expectations, standards, and levels of performance 2.59 2.38
Clear boundaries, procedures, and duties for all personnel 3.36 3.44
Group accomplishment is recognized over individual accomplishment 2.91 2.72
Active, participatory leadership 3.19 3.39
Hands-off leadership 2.05 1.64
Risk-taking is encouraged 2.96 2.83
Risk-taking is not encouraged 1.65 1.56
Note. Only those behaviors with statistically significant differences are shown (p < .05). Numbers shown are average mean ratings based on a four-point scale, with four being highly preferred.
174

175
Table K11
Teachers’ Mean Ratings of Leadership Traits Showing Significant Differences, Based on Teachers’ Preferred Gender of a Principal
Teacher’s Gender Preference for a Principal Leadership Trait Prefer
Male Prefer Female
No Preference
Discipline 3.83 A 3.75 B 3.79 AB
Resources 3.53 B 3.66 A 3.59 AB Involvement in curriculum, instruction, & assessment 3.30 B 3.45 A 3.34 B
Focus 3.70 B 3.77 A 3.74 AB Knowledge of curriculum, instruction, & assessment 3.60 B 3.72 A 3.69 A
Contingent rewards 3.25 B 3.35 A 3.23 B Outreach 3.54 B 3.62 A 3.59 AB
Input 3.60 B 3.69 A 3.64 AB Affirmation 3.57 B 3.70 A 3.59 B
Relationships 3.55 B 3.64 A 3.55 B Intellectual stimulation 3.24 B 3.36 A 3.29 AB
Note. Only those traits with statistically significant differences are shown (p < .05). Means with the same letter are not statistically different. Numbers shown are average mean ratings based on a four-point scale, with four being highly preferred.
175
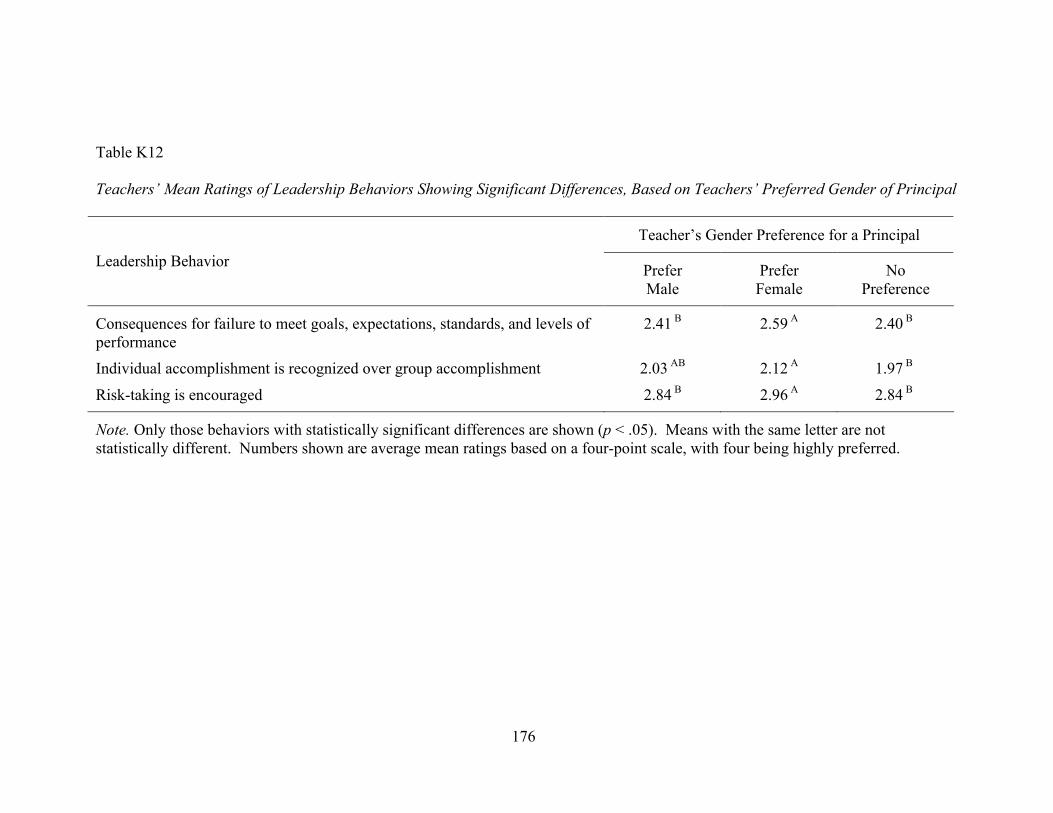
176
Table K12
Teachers’ Mean Ratings of Leadership Behaviors Showing Significant Differences, Based on Teachers’ Preferred Gender of Principal
Teacher’s Gender Preference for a Principal Leadership Behavior Prefer
Male Prefer Female
No Preference
Consequences for failure to meet goals, expectations, standards, and levels of performance
2.41 B 2.59 A 2.40 B
Individual accomplishment is recognized over group accomplishment 2.03 AB 2.12 A 1.97 B
Risk-taking is encouraged 2.84 B 2.96 A 2.84 B
Note. Only those behaviors with statistically significant differences are shown (p < .05). Means with the same letter are not statistically different. Numbers shown are average mean ratings based on a four-point scale, with four being highly preferred.
176

177
Table K13
Teachers’ Mean Ratings of Leadership Traits Showing Significant Differences, Based on Grade Level Taught
Grade Level Taught Leadership Trait
Elementary Middle High
Resources 3.66 A 3.55 B 3.46 B Involvement in curriculum, instruction, & assessment 3.47 A 3.28 B 3.14 C
Knowledge of curriculum, instruction, & assessment 3.77 A 3.62 B 3.51 C
Input 3.68 A 3.59 B 3.57 B
Optimizer 3.49 A 3.38 AB 3.29 B Ideals/beliefs 3.48 AB 3.44 AB 3.39 B
Monitors/evaluates 3.68 A 3.60 AB 3.52 B Flexibility 3.62 AB 3.55 AB 3.54 B
Intellectual stimulation 3.38 A 3.23 B 3.14 B
Note. Only those traits with statistically significant differences are shown (p < .05). Means with the same letter are not statistically different. Numbers shown are average mean ratings based on a four-point scale, with four being highly preferred.

178
Table K14
Teachers’ Mean Ratings of Leadership Behaviors Showing Significant Differences, Based on Grade Level Taught
Grade Level Taught Leadership Behavior
Elementary Middle High
Close monitoring/supervision of employees 2.61 A 2.54 AB 2.40 B
Employees are given autonomy to manage themselves 2.90 B 2.98 AB 3.08 A Consequences for failure to meet goals, expectations, standards, and levels of performance 3.34 B 2.49 AB 2.51 A
Active, participatory leadership 3.44 A 3.32 AB 3.25 B
Hands-off leadership 1.59 B 1.77 A 1.86 A
Note. Only those behaviors with statistically significant differences are shown (p < .05). Means with the same letter are not statistically different. Numbers shown are average mean ratings based on a four-point scale, with four being highly preferred.
178

179
Table K15
Teachers’ Mean Ratings of Leadership Traits Showing Significant Differences, Based on Teachers’ Desired Minimal Education Level for a Principal
Desired Minimal Education Level for a Principal Leadership Trait
Master’s Rank I Doctorate No Preference
Resources 3.53 BC 3.60 AB 3.66 A 3.48 C
Involvement in curriculum, instruction, & assessment 3.22 B 3.38 A 3.42 A 3.14 B
Focus 3.69 B 3.74 AB 3.80 A 3.65 B
Knowledge of curriculum, instruction, & assessment 3.57 B 3.70 A 3.77 A 3.53 B
Contingent rewards 3.17 AB 3.27 A 3.31 A 3.10 B
Outreach 3.48 B 3.60 A 3.67 A 3.57 AB
Affirmation 3.54 B 3.61 AB 3.66 A 3.56 AB
Relationships 3.48 B 3.54 AB 3.64 A 3.48 B
Change agent 3.31 AB 3.38 AB 3.44 A 3.28 B
Optimizer 3.38 B 3.43 AB 3.53 A 3.31 B
Ideals/beliefs 3.41 B 3.46 AB 3.55 A 3.35 B
Monitoring/evaluating 3.55 B 3.63 AB 3.72 A 3.54 B
Intellectual Stimulation 3.18 BC 3.31 AB 3.41 A 3.15 C
Note. Only those traits with statistically significant differences are shown (p < .05). Means with the same letter are not statistically different. Numbers shown are average mean ratings based on a four-point scale, with four being highly preferred.

180
Table K16
Teachers’ Mean Ratings of Leadership Behaviors Showing Significant Differences, Based on Teachers’ Desired Minimal Education Level for a Principal
Desired Minimal Education Level for a Principal Leadership Behavior
Master’s Rank I Doctorate No Preference
Close monitoring/supervision of employees 2.43 BC 2.57 AB 2.70 A 2.34 C
Rewards given when employees meet goals, expectations, etc. 2.67 AB 2.69 AB 2.80 A 2.56 B
Rewards are given when employees make progress toward goals, even before they have been met 2.31 BC 2.36 B 2.55 A 2.13 C
Consequences for failure to meet goals, expectations, standards, etc. 2.46 A 2.42 AB 2.56 A 2.26 B
Clear boundaries, procedures, and duties for all personnel 3.40 B 3.43 B 3.58 A 3.38 B
Individual accomplishment is recognized over group accomplishment 1.98 B 2.00 B 2.28 A 1.86 B
Group accomplishment is recognized over individual accomplishment 2.77 AB 2.76 AB 2.83 A 2.60 B
Hands-off leadership 1.78 AB 1.68 B 1.88 A 1.86 AB
Workers are given instructions and directions to follow 2.53 AB 2.46 B 3.45 A 3.50 AB
Risk-taking is encouraged 2.81 AB 2.87 AB 2.91 A 2.73 B
Note. Only those behaviors with statistically significant differences are shown (p < .05). Means with the same letter are not statistically different. Numbers shown are average mean ratings based on a four-point scale, with four being highly preferred.
180

181
Table K17
Principals’ Mean Ratings of their Frequency of Leadership Behaviors Showing Significant Differences, Based on Principals’ Education Level
Principals’ Education Level Leadership Behavior Master’s
Degree Rank I Doctorate
Employees are given autonomy to manage themselves 2.92 B 3.11 B 4.00 A
Rewards are given when employees meet goals, expectations, standards, and levels of performance
2.54 B 2.59 B 3.50 A
Note. Only those behaviors with statistically significant differences are shown (p < .05). Means with the same letter are not statistically different. Numbers shown are average mean ratings based on a four-point scale, with four being most often practiced.

182
Table K18
Gender Differences Among Principals’ Mean Ratings of Leadership Traits
Leadership Trait Male Rating
Female Rating
Culture 3.79 3.94
Resources 3.48 3.73
Knowledge of curriculum, instruction, & assessment 3.48 3.84
Visibility 3.80 3.94
Contingent rewards 3.27 3.51
Outreach 3.46 3.73
Input 3.42 3.65
Affirmation 3.55 3.88
Change agent 3.48 3.69
Monitors/evaluates 3.59 3.84
Intellectual Stimulation 3.17 3.45
Note. Only those traits with statistically significant differences are shown (p < .05). Numbers shown are average mean ratings based on a four-point scale, with four being highly preferred.

183
Table K19
Principals’ Mean Ratings of Leadership Traits Showing Significant Differences, Based on Years of Experience in Administration
Years of Experience in School Administration Leadership Trait
1-5 6-10 11-15 16-20 Over 20
Culture 3.87 AB 3.93 A 3.75 AB 3.89 AB 3.63 B
Discipline 3.72 ABC 3.85 AB 3.46 C 4.00 A 3.63 BC
Involvement in curriculum, instruction, & assessment
3.64 AB 3.58 AB 3.42 B 3.89 A 3.63 AB
Focus 3.77 AB 3.78 AB 3.54 B 4.00 A 3.75 AB
Visibility 3.90 AB 3.88 AB 3.71 B 3.89 AB 4.00 A
Communication 3.95 A 3.98 A 3.88 A 3.89 A 3.63 B
Ideals/Beliefs 3.56 AB 3.63 AB 3.42 B 3.89 A 3.38 B
Intellectual Stimulation 3.33 A 3.43 A 2.88 B 3.33 A 3.50 A
Note. Only those traits with statistically significant differences are shown (p < .05). Means with the same letter are not statistically different. Numbers shown are average mean ratings based on a four-point scale, with four being highly preferred.

184
Table K20
Principals’ Mean Ratings of Frequency of Leadership Behaviors Showing Significant Differences, Based on Years of Experience in School Administration
Years of Experience in School Administration Leadership Behavior
1-5 6-10 11-15 16-20 Over 20
Close monitoring/supervision of employees 3.87 AB 3.93 A 3.75 AB 3.89 AB 3.63 B
Group accomplishment is recognized over individual accomplishment 2.87 B 3.05 AB 3.13 AB 2.67 B 3.50 A
Workers are given instructions and directions to follow 2.58 AB 2.63 AB 2.58 AB 3.00 A 2.38 B
Risk-taking is not encouraged 1.34 AB 1.58 A 1.46 A 1.00 B 1.38 AB
Note. Only those behaviors with statistically significant differences are shown (p < .05). Means with the same letter are not statistically different. Numbers shown are average mean ratings based on a four-point scale, with four being most often practiced.
184

185
Table K21
Principals’ Mean Ratings of Frequency of Leadership Behaviors Showing Significant Differences, Based on the Minimal Education Level They Believe a Principal Should Have
Minimal Education Level a Principal Should Have* Leadership Behavior Master’s
Degree Rank I No Preference
Consequences for failure to meet goals, expectations, standards, etc. 1.88 AB 2.23 A 1.60 B
Individual accomplishment is recognized over group accomplishment 2.12 A 2.28 A 1.20 B
Group accomplishment is recognized over individual accomplishment 2.82 B 3.05 AB 3.60 A
Risk-taking is encouraged 3.00 B 3.20 AB 3.60 A
Note. Only those behaviors with statistically significant differences are shown (p < .05). Means with the same letter are not statistically different. Numbers shown are average mean ratings based on a four-point scale, with four being most often practiced. *No participants selected Doctorate as a minimal education level.
185

186
Table K22
Principals’ Mean Ratings of Leadership Traits Showing Significant Differences, Based on the Minimal Education Level They Believe a Principal Should Have
Minimal Education Level a Principal Should Have* Leadership Trait Master’s
Degree Rank I No Preference
Resources 3.46 AB 3.66 A 3.20 B
Involvement in curriculum, instruction, & assessment 3.46 AB 3.68 A 3.20 B
Knowledge of curriculum, instruction, & assessment 3.57 AB 3.68 A 3.20 B
Note. Only those traits with statistically significant differences are shown (p < .05). Means with the same letter are not statistically different. Numbers shown are average mean ratings based on a four-point scale, with four being highly preferred. *No participants selected Doctorate as a minimal education level.
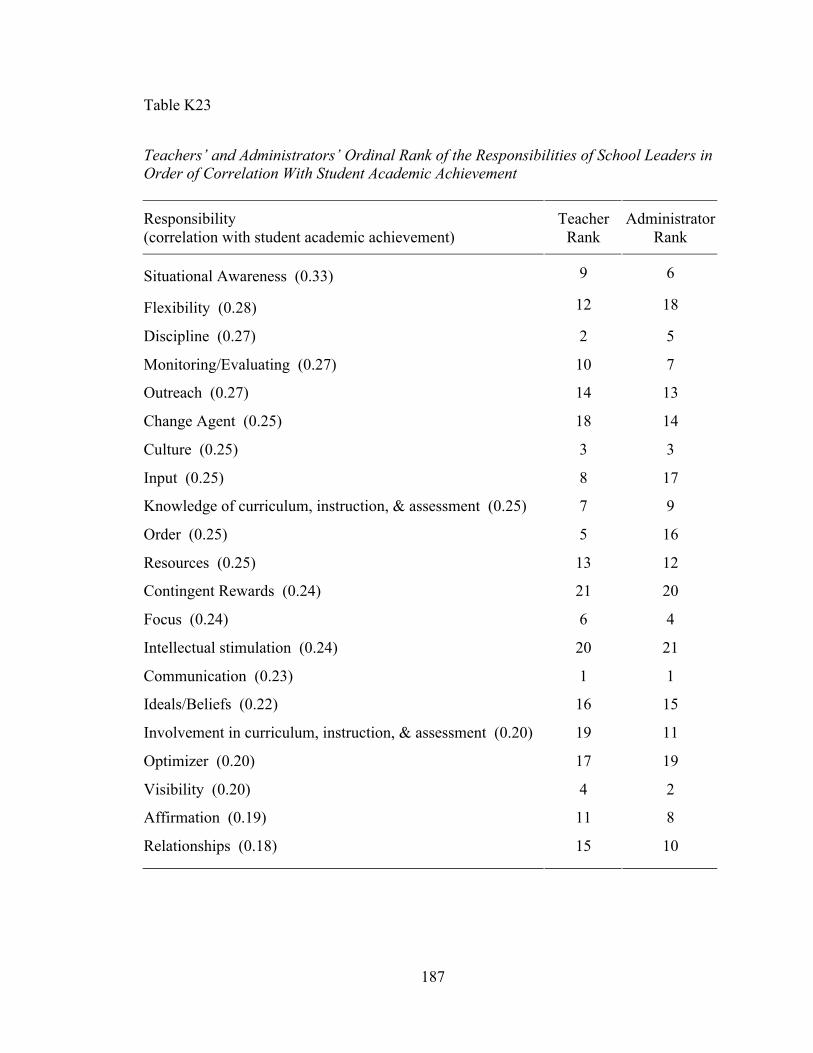
187
Table K23
Teachers’ and Administrators’ Ordinal Rank of the Responsibilities of School Leaders in Order of Correlation With Student Academic Achievement
Responsibility (correlation with student academic achievement)
Teacher Rank
Administrator Rank
Situational Awareness (0.33) 9 6
Flexibility (0.28) 12 18
Discipline (0.27) 2 5
Monitoring/Evaluating (0.27) 10 7
Outreach (0.27) 14 13
Change Agent (0.25) 18 14
Culture (0.25) 3 3
Input (0.25) 8 17
Knowledge of curriculum, instruction, & assessment (0.25) 7 9
Order (0.25) 5 16
Resources (0.25) 13 12
Contingent Rewards (0.24) 21 20
Focus (0.24) 6 4
Intellectual stimulation (0.24) 20 21
Communication (0.23) 1 1
Ideals/Beliefs (0.22) 16 15
Involvement in curriculum, instruction, & assessment (0.20) 19 11
Optimizer (0.20) 17 19
Visibility (0.20) 4 2
Affirmation (0.19) 11 8
Relationships (0.18) 15 10

188
CURRICULUM VITAE
TROY DAN COSTELLOW
3653 Silver Sun Drive, Bowling Green, KY 42104
Home: (270) 843-8073
Cellular: (270) 779-8130
EDUCATION
Doctorate of Educational Leadership, Western Kentucky University, Bowling Green, KY.
P–12 Administrative Leadership Strand, August 2011.
Master of Education, Western Kentucky University, Bowling Green, KY. Major field:
Secondary Education, July 1998.
Bachelor of Arts, Western Kentucky University, Bowling Green, KY. Major field:
Agricultural Education, July 1995.
PROFESSIONAL EXPERIENCE
July 2010 to present Assistant Principal, South Warren Middle School, Bowling Green,
KY. Duties include teacher supervision, discipline, maintenance
and grounds, safety, transportation.
September 1995 Vocational Agriculture Teacher, Warren East High School,
to June 2010 Bowling Green, KY. Courses taught include Agricultural
Business Management, Greenhouse Technology, Landscape and Turf
Management, Leadership Dynamics, Equine Science, and Heavy
Equipment Operation, grades 10-12.
September 2002 Instructor, Advanced Course in Heavy Equipment Operations.
to April 2004 Course offered through Associated Builders and Contractors,
Louisville, KY. Conducted weekly night class training in general
construction and construction equipment operation.

189
PROFESSIONAL CERTIFICATIONS
Rank I-Provisional Certificate for Instructional Leadership-Principal, All Grades, Level 1
Effective July 1, 2009; Expires June 30, 2015
Rank II-Provisional Certificate for Teaching Vocational Agriculture, Grades 7-12
Effective July 1, 1995; Expires June 30, 2015
OTHER CERTIFICATIONS AND TRAINING
WCPS School Volunteer Training. February 2011
Certified School Bus Driver. 1996-present
SBDM Principal Selection Committee Member. August 2007
Teacher Performance Assessment (TPA) Training. January 2007
Kentucky Teacher Internship Program (KTIP) Training. July 2001
Construction Trainer Training, Associated Builders and Contractors. February 2001
PROFESSIONAL ACTIVITIES
Certified Personnel Evaluation Training. September 2010
Warren County Schools Safety Advisory Committee Member. July 2010-present
South Warren Middle School Positive Behavioral Intervention and Support Team
Leader. June 2010-present
Warren Co. Pupil Transportation Positive Behavioral Intervention and Support Team
Member. June 2010-present
Warren East High School Site-Based Decision Making Council, Vice-chair & Teacher
Representative. July 2007-June 2010
Warren East High School Culture Team Member. June 2007-June 2010
Warren East High School Crisis Response Team Member. July 2005-June 2010
Warren East High School Agriculture Department Head. July 2000-June 2010
FFA Advisor, Warren East High School. 1995-June 2010
SBDM Standing Committee Service. 1995-June 2010:
! Communication Component Mgr., Comprehensive School Improvement Plan, 5 years
! Budget Committee Member, 4 years
! Team Travel Committee Member, one year

190
! Technology Committee Member, 6 years
Elected by Warren County Schools teachers to serve on the Superintendent Selection
Screening Committee, 2009
Supervised first year teacher for the Kentucky Teacher Internship Program. 2008-2009
Warren East High School “Check and Connect” Mentor for struggling freshman students.
Jan. 2008-May 2009
Selected to help develop Common High School Student Learning Targets for Warren
County High School Vocational Programs. December 2008
Warren County Schools Book Study: Learning by Doing. January 2008
Supervised eight student teachers. 2001-2008
Senior Portfolio Scoring Team Member. April 2008
Student Teacher Work Sample Scorer, Western Kentucky University. 2006-2008
KACTE Membership Recruitment Liaison for Warren County. January 2007
New Agriculture Teacher Mentor for the Barren River Region. 2006
KVATA Regional Chairman. 1998-2000
KVATA Regional Secretary/Treasurer. 1996-1998
Conferences/Meetings
Kentucky Association of School Administrators Conference, Louisville, KY. July 2011
Leader in Me program Kickoff, Warren County Schools. June 2011
Warren Co. Schools Administrator’s Meeting on school safety, bullying, EPAS, policies
and procedures. June 2011
Formative/Summative Assessment Workshop. Spring 2011
Western Kentucky University Doctoral Symposium, April 2011
Implementing and Managing Student Centers in Kindergarten – Third Grade Classrooms
Workshop, Warren County Board of Education Office. March 2011
Common Core Standards Conference, South Warren Middle School. February 2011
Warren Co. Schools Administrator’s Meeting on media communication, legal matters,
professional learning communities. June 2010
National Energy Education Development Workshop, Bowling Green, KY. November 2009
Kentucky Association of School Administrators Conference, Louisville, KY. July 2009

191
Kentucky Career and Technical Education Conference, Louisville. July 1996-July 2009
Kentucky Center for Instructional Discipline State Conference. June 2009
Warren Co. Schools Administrator’s Meeting on professional learning communities and
formative assessment. June 2009
Aspiring Principal Workshop- Getting the Job-Done Right!, Louisville, KY. March 2009
KYCID Benchmarks of Quality training, Bowling Green, KY. February 2009
Previewing the 21st Century Principalship, Louisville, KY. January 2009
GRECC Grant Writing Workshop, Bowling Green, KY. November 2008
KYCID Sustaining Positive Behavior Support training, Bowling Green, KY. June 2008
Warren Co. Schools Administrator’s Meeting on Professional Learning Communities.
June 2008
Kentucky Teaching and Learning Conference, Louisville, KY. March 2008
Model Schools Symposium, Atlanta, GA. November 2007
Rigor and Relevance Workshop, Bowling Green, KY. February 2007
High Schools That Work Conference, Hilton Head, SC. February 2006
Community
Appointed by Governor Steve Beshear to the Bowling Green Community & Technical
College Nominating Commission. December 2009-present
Assisted with annual Raider Renovation Day at Warren East High School. 2008-present
Coordinated annual community canned food drives at Warren East High School. 2001-10
Led students in multiple community service projects at Ephram White Park. 2001-10
Treasurer and Fund Raising Chairman, FarmHouse Foundation, Western Kentucky
University. Duties include managing alumni database and raising funds for the
academic use of undergraduate students. January 2000-present
Usher, Security Team, Junior High Student Ministries, and First Connection Ministries.
Hillvue Heights Church. 1996-present
Organized and conducted regional Kentucky Agriculture Commissioner candidate public
forum held at Warren East Middle School. September 2003
Advisory Board Member. Leonard D. Brown Agricultural Exposition Center, Western
Kentucky University. 2001-2002

192
Grants
Kentucky Department of Agriculture Grant (2010), $600. Hobby greenhouse and plant
propagation system for Warren East Agriculture students.
Kentucky Department of Agriculture Grant (2007), $960. Daylily propagation and
identification laboratory for Warren East Horticulture students.
Kentucky Tobacco Settlement Grant (2005), $2684. Funds used to purchase supplies to
enhance instruction in Warren East Greenhouse Technology classes.
Kentucky Department of Agriculture Grant (2005), $2752. Matching grant used toward
the purchase of six laptop computers for the Warren East Agriculture Department.
Kentucky Tobacco Settlement Grant (2004), $3000. Funds used to enhance instruction in
Greenhouse Technology classes.
Agriculture Diversification Grant (2002), $5000. Funds used to purchase two laptop
computers and other supplies to enhance instruction in agriculture courses.
Kentucky Department of Agriculture Grant (2000), $962. Created landscape plant
identification laboratory.
Kentucky Department of Agriculture Grant (1996), $840. Installed hydroponic vegetable
garden system in school greenhouse.
PROFESSIONAL AFFILIATIONS
Kentucky Association of Elementary School Principals
Association for Supervision and Curriculum Development
Kentucky Association of School Administrators
Lifetime member, National FFA Alumni Association
Kentucky Vocational Agriculture Teachers Association
Association for Career and Technical Education
Kentucky Association for Career and Technical Education
National Association for Agriculture Educators
Kentucky Farm Bureau

193
HONORS, AWARDS, OTHER ACHIEVEMENTS
Warren County Conservation District Educator of the Year Award. March 2010
Selected by students for the PRIDE Teacher award at Warren East High School.
December 2009
Received the Kentucky Assoc. of School Administrators Tomorrow’s Leader Scholarship.
July 2009
Member of the first cohort in the Educational Leadership Doctoral Program at Western
Kentucky University. March 2008
PRIDE Teacher award, awarded by students at Warren East High School. March 2008
Outstanding Greek Organization advisor, Western Kentucky University. 2004
Created the second High School Heavy Equipment Training Program in Kentucky.
August 2001
Warren East Agriculture Education program identified as a Local Program of Success by
the National FFA Organization. 1998
Increased FFA membership by 107% within three years. 1995-1998
Initiated and demonstrated use of various new technologies at Warren East High School,
including instructional use of LCD projector, digital cameras, laptop computers,
wireless networking, FFA webpage, designated departmental email account for
our program, and online textbook use.
Led Kentucky agriculture teachers in the initial use and revision of the CAERT Online
Agriculture Test and Instructional System.
PRESENTATIONS
Guest Lecturer, WKU Psychology Graduate Course (PSY 519, Classroom Behavior).
Shared strategies for working with students, teachers, administrators, and parents in
managing student behaviors. Dr. Kelly Davis, May 2011
KAESP Aspiring Principal’s Workshop. Assisted Dr. Mary Evans with presenting a one-
day workshop to aspiring principals. March 2011
Positive Behavior Support Strategies. Professional Development group presentation to
faculty of Warren East High School. August 2009
School Wide Reinforcement Systems. Group presentation at the Kentucky Center for

194
Instructional Discipline State Conference. June 2009
Warren East High School Leadership Day. Invited to give introductory welcome and
leadership speech to leadership students from four Warren County elementary
schools. February 2009
Greenhouse Production Workshop. Conducted workshop in conjunction with Hummert
International for Kentucky Agriculture teachers. February 2008
Regional Agriculture Teacher Training. Trained Barren River Region agriculture
teachers in the use of the MyCAERT Online Agriculture Teaching Resource.
October and December 2007
Integrating Professional Learning Community Strategies. Professional Development group
presentation to faculty of Warren East High School. August 2007
Improving the Culture of Warren East High School. Professional Development group
presentation to faculty of Warren East High School. August 2007
Top Ten Reasons to Integrate Online Assessment Into Your Program. Roundtable
presentation for teachers at the Ky. Vocational Teachers Conference. July 2007
Teaching to the Millennial Generation. Professional Development presentation to faculty
of Warren East High School. August 2004

195


![Inherited Traits Versus Learned Behaviors [4th grade]](https://img.pdfslide.us/doc/110x75/615c4a59bb7adf5b454516c2/inherited-traits-versus-learned-behaviors-4th-grade.jpg)