Embed Size (px)
Citation preview

1
THE PREDICTIVE VALIDITY OF THE APIL-B IN A FINANCIAL INSTITUTION
ANTONIO LOPES
GERT ROODT Programme in Industrial Psychology
Department of Human Resources Management Rand Afrikaans University
RICKY MAUER
Department of Industrial Psychology UNISA
ABSTRACT
The purpose of this study was to assess the predictive validity of the APIL
test battery, designed to identify learning potential. A sample of 235
successful job applicants completed the APIL Battery and the scores obtained
were compared with a set of job success ratings provided by their direct
managers. The predictive validity and the use of this psychometric device
were assessed within the broad context of the provisions of the Employment
Equity Act (55 of 1998), and the manner in which the information about an
employee is to be used. The findings are generally positive and their
implications are discussed below.
OPSOMMING
Die doel van hierdie ondersoek was om die voorspellingsgeldigheid van die
APIL-toetsbattery, wat ontwerp is om leerpotentiaal te identifiseer, te
evalueer. ‘n Steekproef van 235 suksesvolle aansoekers het die APIL-
toetsbattery voltooi en die tellings wat sodoende bekom is, is vergelyk met
beoordelings van werksukses wat deur hul direkte bestuurders uitgevoer is.
Die voorspellingsgeldighede en die gebruik van hierdie psigometriese
meetmiddel is binne die breë konteks van die vereistes van die Employment
Equity Act (Werkbillikheidswet) (55 van 1998) geëevalueer, sowel as die
wyse waarop dié inligting oor ‘n werknemer gebruik behoort te word. Die
bevindings was oor algemeen positief en hul implikasies word in die artikel
bespreek.

2
The South African labour situation has changed dramatically during the last five years. This
has been the result of factors such as the new Constitution (Act 108 of 1996), the changed
political dispensation, and especially the promulgation and implementation of a series of Acts
of Parliament to regulate matters pertaining to labour. The promulgation of chapter 2 of the
Employment Equity Act (55 of 1998), which was finally implemented on the 9th August
1999, has led to a situation in which users of psychological tests and “other similar
assessments”, have become increasingly concerned about the legitimacy of their use of
assessment procedures - especially in industry - for purposes including screening, selecting,
and identifying potential. In many cases, the apprehensions and fears have been caused by
what may eventually turn out to be no more than an excessively rigid interpretation of
Section 8 of the Employment Equity Act (EEA).
The fact that reliability, validity, bias and fairness are highlighted in Section 8 of the EEA,
and the need for these issues to be “scientifically shown” poses specific dilemmas in all
contexts in which assessment is used. Psychologists have been aware of the first two
requirements for many decades (See, for example, Guion, 1965; Gulliksen, 1950;
Magnusson, 1967). American affirmative action legislation, and the ensuing court cases in
the USA, highlighted the issue of assessment bias. It, too, is well known to South African
psychologists.
In many respects, the negative perceptions of the assessment situation, and, for that matter,
of the future of testing, have been exacerbated by the obvious complexities which tend to
coincide with multiculturalism and multilingualism.
Based on the preceding discussion, it is clear that a major need exists to establish the extent
to which assessment devices used in industry comply with the requirements of the
Employment Equity Act (55 of 1998). Apart from legal obligations, there is also a
demonstrable need as far as industrial psychology is concerned to develop our knowledge
3
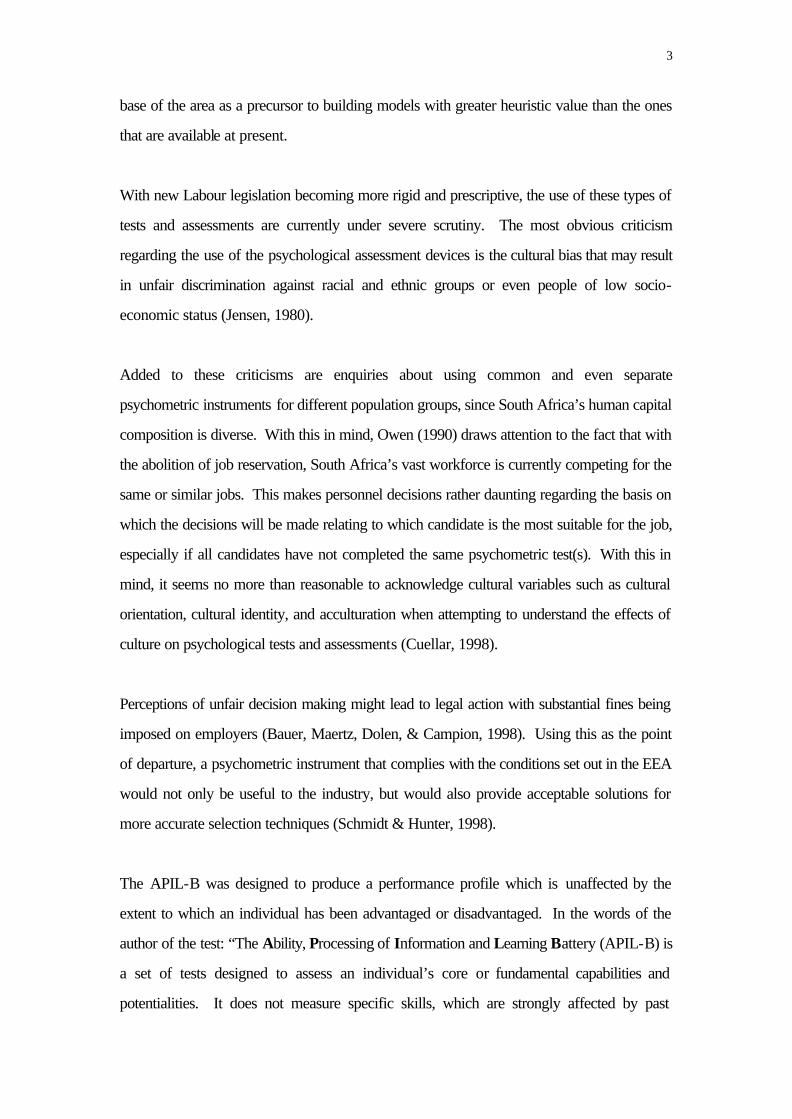
base of the area as a precursor to building models with greater heuristic value than the ones
that are available at present.
With new Labour legislation becoming more rigid and prescriptive, the use of these types of
tests and assessments are currently under severe scrutiny. The most obvious criticism
regarding the use of the psychological assessment devices is the cultural bias that may result
in unfair discrimination against racial and ethnic groups or even people of low socio-
economic status (Jensen, 1980).
Added to these criticisms are enquiries about using common and even separate
psychometric instruments for different population groups, since South Africa’s human capital
composition is diverse. With this in mind, Owen (1990) draws attention to the fact that with
the abolition of job reservation, South Africa’s vast workforce is currently competing for the
same or similar jobs. This makes personnel decisions rather daunting regarding the basis on
which the decisions will be made relating to which candidate is the most suitable for the job,
especially if all candidates have not completed the same psychometric test(s). With this in
mind, it seems no more than reasonable to acknowledge cultural variables such as cultural
orientation, cultural identity, and acculturation when attempting to understand the effects of
culture on psychological tests and assessments (Cuellar, 1998).
Perceptions of unfair decision making might lead to legal action with substantial fines being
imposed on employers (Bauer, Maertz, Dolen, & Campion, 1998). Using this as the point
of departure, a psychometric instrument that complies with the conditions set out in the EEA
would not only be useful to the industry, but would also provide acceptable solutions for
more accurate selection techniques (Schmidt & Hunter, 1998).
The APIL-B was designed to produce a performance profile which is unaffected by the
extent to which an individual has been advantaged or disadvantaged. In the words of the
author of the test: “The Ability, Processing of Information and Learning Battery (APIL-B) is
a set of tests designed to assess an individual’s core or fundamental capabilities and
potentialities. It does not measure specific skills, which are strongly affected by past

4
opportunities” (Taylor, 1997 p. 1).
Existing validity studies on the APIL Battery uncover correlations ranging between 0,21 and
0,89 extracted from six different sample studies (Taylor, 1997). The reliability estimates of
the various subtests are in the region of 0,60 – 0,70 but may be as high as 0,97 and as low
as 0,45 (Taylor, 1997).
Based on the above statistics, the APIL-B is therefore a potentially useful instrument for
making “fair” selection decisions and identifying candidates who are likely to master more
demanding tasks. The terms “fair” and “unfair” will be defined more comprehensively
further on.
Given that the test is primarily non-verbal (except for the instructions) the issue of cultural
bias is addressed to a certain extent. The test items are mainly presented in a geometric-
diagrammatic format, thereby limiting the bias introduced by requiring that candidates
respond to test items in a second or third language (Taylor, 1997).
The majority of South Africans speak languages, and dialects, quite different from standard
English as their mother tongues. It is therefore reasonable to assume that some of the
generally observed discrepancies in test scores between white and black South Africans are
attributable to the variety of languages and dialects that are spoken (Jensen, 1980).
However, Jensen (1980) also adds that numerous studies abroad have concluded that
although black American children use different dialects, they manage to develop an
understanding of the standard language at an early age and suffer minimal disadvantage
(Eisenberg, Berlin, Dill, & Sheldon, 1968; Hall & Turner, 1971, 1974; Harms, 1961;
Krauss & Rotter, 1968; Peisach, 1965; Weener, 1969).
The testing of candidates from dissimilar cultural backgrounds has received strong interest
over the past 50 odd years. There is great concern about the applicability of current tests
available to culturally disadvantaged groups (Anastasi & Urbina, 1997). Cuellar (1998)
stipulates that initially, “mental tests” were standardised on homogeneous cultural groups and

5
only more recently have attributes such as gender, education and ethnic representativeness
been taken into account. Ethnic representation arouses concern as inadequate
representation of a sample as far as gender, ethnicity, education, and so forth are concerned,
could be conceived as sources of cultural bias. An example of this is to be found in the
United States where most psychometric assessments that have been developed fail to
address, and include, adequate representative samples of American Hispanics (Cuellar,
1998). These individuals who constitute a substantial part of the American population, are
almost never included in norm groups (Cuellar, 1998). Such glaring discrepancies in
representation lead to suspect predictive validity coefficients for American Hispanics.
According to Jensen (1980) the issue of “cultural bias” in ability testing has been around
since the early 1900’s. Binet and Simon acknowledged this problem in 1908, when their
newly developed ability test produced different results when administered to groups of
children of different social status (Anastasi & Urbina, 1997). According to Rosenbach and
Mowder (1981), Stern noted that the average performance of lower-class 10-year-old
test-takers was the same as that of average higher-class 9 year olds. It was Binet who
fully recognised that aspects such as language, cultural background and a common
background of experience are important when measuring individual abilities (Jensen, 1980).
A point to remember is that “culture fairness”, a term often mistaken for the lack of cultural
bias, presumes equal familiarity among participants who come from different cultural
backgrounds (Oakland & Hambleton, 1995).
Oakland and Hambleton (1995) identified a number of culture-related factors that could
affect the performance of test scores. These are as follows: The tester (ethnic identity,
linguistic expressions, etc.), the test-takers (level of education), the relationship between the
test administrator and the participants (ambiguity in communication, etc.), familiarity with
response procedures (for instance the effects of incorrect answers), and stimuli (familiarity
with material, knowledge of testing language).
Before dealing with issues of culture, bias and fairness, it would seem appropriate to
evaluate what the Legislation provides for.
6
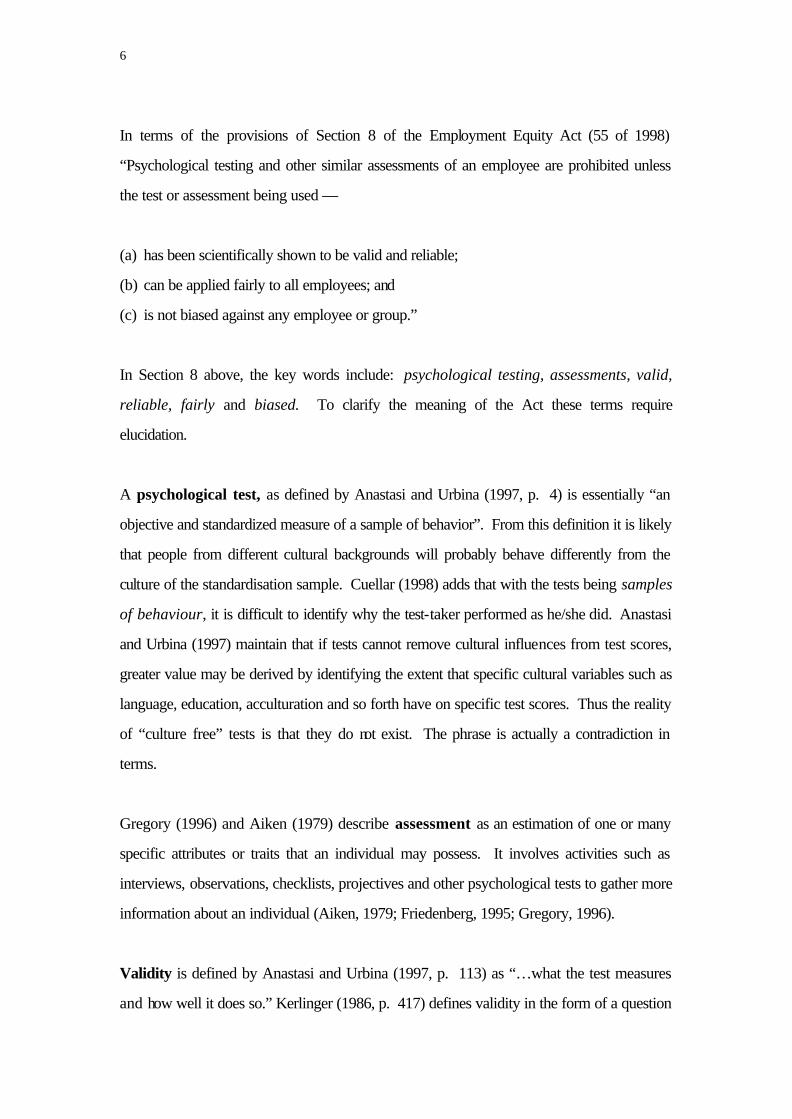
In terms of the provisions of Section 8 of the Employment Equity Act (55 of 1998)
“Psychological testing and other similar assessments of an employee are prohibited unless
the test or assessment being used —
(a) has been scientifically shown to be valid and reliable;
(b) can be applied fairly to all employees; and
(c) is not biased against any employee or group.”
In Section 8 above, the key words include: psychological testing, assessments, valid,
reliable, fairly and biased. To clarify the meaning of the Act these terms require
elucidation.
A psychological test, as defined by Anastasi and Urbina (1997, p. 4) is essentially “an
objective and standardized measure of a sample of behavior”. From this definition it is likely
that people from different cultural backgrounds will probably behave differently from the
culture of the standardisation sample. Cuellar (1998) adds that with the tests being samples
of behaviour, it is difficult to identify why the test-taker performed as he/she did. Anastasi
and Urbina (1997) maintain that if tests cannot remove cultural influences from test scores,
greater value may be derived by identifying the extent that specific cultural variables such as
language, education, acculturation and so forth have on specific test scores. Thus the reality
of “culture free” tests is that they do not exist. The phrase is actually a contradiction in
terms.
Gregory (1996) and Aiken (1979) describe assessment as an estimation of one or many
specific attributes or traits that an individual may possess. It involves activities such as
interviews, observations, checklists, projectives and other psychological tests to gather more
information about an individual (Aiken, 1979; Friedenberg, 1995; Gregory, 1996).
Validity is defined by Anastasi and Urbina (1997, p. 113) as “…what the test measures
and how well it does so.” Kerlinger (1986, p. 417) defines validity in the form of a question

7
asking: “Are we measuring what we think we are measuring?”
In other words, does the test measure what it is supposed to measure? Three types of
validity are important namely: content, criterion-related and construct validity (Anastasi &
Urbina, 1997; Kerlinger, 1986). A test’s construct validity according to Anastasi and
Urbina (1997) is the extent to which it measures a theoretical construct or trait such as
learning potential.
Reynolds (1983, p. 245) refers to bias in construct validity as follows: “Bias exists in regard
to construct validity when a test is shown to measure different hypothetical traits
(psychological constructs) for one group than for another or to measure the same trait but
with different degrees of accuracy”. Owen (1991) showed that authors such as Bond
(1981), Cole (1981), Green (1972), Peterson (1980), Shepard (1981) and Sundberg and
Gonzales (1981) agree that bias in construct validity indicates that a test measures one thing
in a certain group and another in a different group under the assumption the test is measuring
the same construct. Scheuneman (1981) stipulates that although tests are essentially valid
for diverse groups (no bias in construct validity), bias may be observed in the
underestimation of minority group abilities.
Predictive validity is a form of criterion-related validity, and concerns the relationship
between scores on a test or questionnaire and a criterion measure taken at some time
subsequent to the test. Validity coefficients are represented by correlations between test
scores and the scores obtained in the actual field for which an individual has been selected
(Rust & Golombok, 1989). The higher the correlations, the higher the validity (Huysamen,
1996; Rust & Golombok, 1989). Huysamen (1996, p. 129) discusses the terms predictive
bias and test bias, and describes them using the following example: “…if the present test is
used to predict future performance as a motor mechanic, men may indeed outperform
women in the test. If this is the case, applying the test does not result in predictive bias.”
This suggests the instrument is not biased, but that the situation to which it has been applied
may be. In addition, this does not necessarily mean that women would not be able to
perform well as motor mechanics.

8
Cuellar (1998) believes that the predictive validity of a specific score may differ quite
substantially across cultures, and that bias exists when test scores differ across groups in
relation to an external criterion. When predictive validity differs across cultural groups, there
is a need to interpret scores based on group-specific predictive validity coefficients (Cuellar,
1998). Cascio (1997), in turn, claims that if an individual from a specific population group
does not have an equal opportunity at being selected for a specific post, but has an equal
probability of succeeding at the job, test bias may exist which could result in unfair
discrimination.
Test reliability relates to the accuracy or precision of a measuring instrument (Kerlinger,
1986). The concept encompasses constructs like stability, dependability, consistency,
predictability and accuracy. Anastasi and Urbina (1997, p. 84) refer to reliability as “the
consistency of scores obtained by the same person when they are re-examined with the
same test on different occasions, or with different sets of equivalent items, or under other
variable examining conditions.”
Jensen (1980) defines “fair” and “unfair” as the manner in which test scores are used when
making selection decisions. He continues by maintaining that terms such as “fairness”,
“social justice”, and “equal protection of the law” are concepts linked to moral, legal and
philosophical opinions. Anastasi and Urbina (1997) note that it is inevitable that people
holding different views on the meaning of "fairness” and “unfairness” will behave differently
when making a decision as it is a subjective non-scientific concept (Jensen, 1980).
In psychometrics, “bias” is referred to by Jensen (1980) as systematic errors in the
predictive validity of test scores of an individual, and where these errors are as a result of
the individual’s group membership. Anastasi and Urbina (1997) adds that these errors are
constant as opposed to random errors, it is a technical concept and infers different validities
for members of different population groups (Gregory, 1996).
In subsection 8(c) of the Employment Equity Act, the focus is placed on being unbiased
9
towards any employee or group. This brings up an interesting debate regarding the
comparison of test scores across cultures. It has already been stated that the test should
measure the same trait across different population groups. Oakland and Hambleton (1995)
suggest that in cases of test score comparisons, the requirements of equivalence need to be
extremely strict.
Anastasi and Urbina (1997) and Smit (1996) describe equivalence as comparing scores
obtained from a number of different tests against the same measurement scale. The
comparability of the scores hinge on the similarity of the test content, reliability, level of
difficulty, and the statistical methods used to calculate the comparisons. Anastasi and
Urbina (1997) add that test scores should not be compared unless they are truly
interchangeable.

10
METHOD
The pressure that has been imposed on the staff assessment enterprise in South Africa is of
such a nature that it is extremely important to investigate the instruments that are used in this
country.
The APIL-B is a well-known, and widely used, psychometric device for the selection of
staff in commerce and industry in South Africa. Taylor (1997) claims that it assesses an
individual’s potential to a greater extent than conventional measuring devices, which tend to
measure current skills and abilities. While Taylor (1997) uses difference scores as a basis
for measuring learning potential, there has been a long-standing debate in the professional
literature about the utility of difference scores. Some authors contend that learning potential
is a multidimensional issue, and that it cannot be measured with a single test. In an
unpublished document by Schepers (2000), he draws attention to the writings of Ree and
Earles (1991), Ree, Earles and Teachout (1994), Stake (1958), Woodrow (1938a,b, c)
and Woodrow (1946), and comes to the conclusion that the notion of a single general factor
of learning potential is “a myth.” While the arguments advanced appear plausible, there is
not yet a generally held view on the matter, and the APIL-B has yielded positive results in
several validity studies. Against that background it is important to take note of this issue, but
nonetheless to pursue the current research.
The APIL scores produced are useful to companies interested in looking beyond the effects
of disadvantagement, and additionally to identify those individuals with potential for
development. Further, the APIL-B has the advantage of being group administrable.
Although Anastasi and Urbina (1997) have listed potential disadvantages of testing subjects
in groups, such as: lack of rapport, less opportunity to maintain interest, restrictions imposed
by the extent of the test-taker’s responses, the unlikeliness of identifying aspects such as
anxiety, worry or fatigue of test-takers that could affect their performance and so on, as with
most testing devices, each limitation in one situation may in fact be an advantage in another
depending on the primary objective behind the use of that particular instrument.

11
In addition, Taylor (1994) stipulates that the information-processing constructs found in the
APIL-B are more clearly defined, and the measures used are so basic that claims of cultural
bias should be minimal. However, very few studies have been conducted on information-
processing tests across cultures to support this statement with certainty.
Schmitt, Gooding, Noe and Kirsch (1984) believe that the use of a psychometric instrument
in selection may be seen as unbiased if the reliability and validity reflect the specific selection
dimensions targeted by the test, as well as the transferability of the test to members of
different population groups.
Research questions
In view of the issues raised in the preceding discussion, the following questions are to be
investigated:
• Is the APIL-B reliable when applied to a group of job applicants at a large financial
institution?
• Is the APIL-B valid when used for selecting employees in the financial sector?
• Are the results of the APIL-B biased against specific population groups when used for
selecting employees in the financial sector?
Sample
The sample consists of 235 successful job applicants at a large insurance organisation. The
jobs for which the applicants were being considered included positions such as: actuarial
assistants, clerks, consultants, legal advisors, computer programmers, underwriters, and so
on. Seventy-three of the applicants are males and one hundred and sixty two females. The
applicants’ ages range between 16 and 58 years, and their educational levels fall between
standard 7 and postgraduate qualifications. The distribution of the so-called ethnic groups is
shown in Table 1.
<Insert Table 1>

12
Data analysis
The statistical techniques include descriptive statistics (means, standard deviations, etc.),
product-moment correlation coefficients, discriminant analysis, Kuder-Richardson reliability
formulae and logistic regression analysis.
Measuring instruments
The criterion measure
In order to compute criterion-related validity coefficients, the raw scores of the six subtests
of the APIL-B were entered into a multiple stepwise regression analysis with manager
ratings as the criterion variable. A criterion measure was specifically developed for this
investigation and consisted of a single rating on a five-point scale. To validate the criterion
measure, Elliott Jaques’ “Critical Incident Approach” was used (Jaques, 1975, 1978, 1982,
1989). This involved randomly selecting thirty-seven participants from the sample,
interviewing the manager who rated these participants and establishing the reason for the
rating obtained.
The predictor variable
The APIL-B is an instrument used to assist in assessing the needs confronting all South
Africans who endeavour to create an equitable society. The battery is used to identify those
employees who demonstrate the potential for development irrespective of previously
acquired skills or past discrimination. By using learning potential as point of departure for
future training, development, mentorship, and growth, long term benefits are derived since
the measurement criteria no longer focus on previous opportunities but future capabilities.
The complete APIL battery provides a profile of eight scores and a learning curve which,
when integrated, produces an overall global score. The scores indicate an individual’s:
• Capacity to think abstractly and conceptually, this is assessed in the Concept Formation
Test (CFT). Taylor (1997) postulates that in work activities requiring additional effort
above simple routine duties, conceptual thinking plays an important part. Cattell (1971)
and Taylor (1994) share the opinion that the capacity to think abstractly forms an
13
integral part of fluid intelligence. Hunt (1980) provides the view that fluid intelligence
may be seen as a function of thinking strategies accessible to an individual.
• Speed, accuracy and flexibility of information processing and the capacity to cope with
multiple problem formats under time constraints is the second score in the battery and
called the Flexibility-Accuracy-Speed Test (FAST). The speed scores do not only
highlight the rate at which information is processed but also provides an indication of the
individual’s ability to acquire new competencies (Taylor, 1997). Taylor (1997) defines
accuracy as the incidence of error per block of work. Hence, inaccurate processing of
information suggests the brain’s “computer” is erratic but does not imply an incapacity to
solve the problem, merely that there may be concentration lapses resulting in failure to
adhere to the “quality control” of the processing procedure. The flexibility component
refers more to the cognitive flexibility in which a rapid problem solving approach has
been adopted in order to solve the problem at hand (Taylor, 1997). It is further noted
that a prompt choice of a good strategy for solving problems is claimed to be another
fundamental characteristic of intelligent behaviour (Taylor, 1997).
• Learning rate in the next score produced. The APIL-B provides two sets of scores
from the learning assessment exercises — the difference in output between the fourth
and first session, and the total amount of work completed in all four sessions. Taylor,
(1997) describes learning rate as a function of improved performance (units of work
correctly completed per unit time) from the first to the last session. The Curve of
Learning (COL), specifically taps into the learning potential of an individual, it assesses
the person’s future achievement capability rather than measuring past achievements
(Taylor, 1997).
• Memory and Understanding is the next set of test scores which measure the capacity to
memorise and master concepts. This subtest is a sequel to the COL in that it measures
the individual’s retention of the material exposed to during the COL series of exercises
(Taylor, 1997). Test takers who have internalised the information and understood the
interrelationships among the concepts often produce higher scores in comparison to

14
those who have just copied the material from the dictionary without attempting to retain
the information (Taylor, 1997).
• The final score in the battery is a measure of the capacity to transfer learning to novel
applications. This subtest is known as the Knowledge Transfer Test (KTT), it measures
the extent to which an individual has the capacity to transfer knowledge or skill from one
problem situation to another but related problem (Taylor, 1997). The capacity to apply
and adapt knowledge is another important component of leaning potential and is
especially important in a work situation where experience gained in one situation may be
transferred to another in order to solve a related problem (Taylor, 1997).
The dimensions assessed by the above-mentioned subtests, according to Taylor (1997), are
fundamental building blocks of intellectual competence. The APIL-B provides an indication
of an individual’s intellectual adaptability rather than his/her previously acquired skills or
abilities.
Taylor (1997, p. 4) stated that, “[t]he APIL does not have to be administered in its entirety,
although a more reliable reading on the individual’s intellectual capacity and potentiality is
obtained if the whole battery is used. Two shortened versions that are quite commonly used
are the APIL minus the KTT and the APIL minus the KTT and FAST.” With this comment
in mind, the research completed in this study was limited by the fact that it had access to all
the data and information of the APIL battery barring the results from the KTT.
Procedure
The APIL battery was administered to a large number of job applicants who had applied for
a variety of vacancies at a large insurance company. Only the successful job applicants’
data were assessed since the dependent variable was a company-specific measure.
The order of the battery administration was supervised as per the administrator’s manual,
beginning the testing session with the Concept Formation Test and ending with the Memory
and Understanding Test (when using the full battery, Knowledge Transfer Test is

15
administered last). Approximately 15 to 20 candidates were tested in any one session.
Normal testing conditions prevailed in well-ventilated, well-lit, quiet rooms with each
candidate given their own desk to work on with all the necessary stationery being provided.
The instructions were read verbatim from the instruction test booklet in a standard fashion
emphasising the strictness of the test conditions and what the test-takers should be expecting
from the tests. This instructional routine was followed for the entire test battery and for
every group that was tested.
All the raw data from the tests were collected and organised into a workable format. For
comparative reasons, certain biographical details such as age, reporting time to current
manager, educational level and so forth were also recorded. Respondents lacking a full set
of data were excluded from the sample (for example those who did not complete all the
subtests or those who were not rated by their manager).
Thirty-seven people were randomly selected from the original sample to aid in a validation
interview conducted with nine managers. The interview focused both on the individuals’
work performance and their ability to grasp new concepts, ideas and tasks. During the
interview, the manager was required to give an explanation as to why he/she believed the
individual deserved the particular rating obtained. Examples of specific actions were
solicited to assist in quantifying the motive behind each rating. A summary of these findings
has been recorded in the results section of this paper.
Raw data from the six subtests of the APIL–B were available for a final sample of 235
subjects. The standard deviations and means of these raw scores were calculated and
converted to z-scores to facilitate comparison. These z-scores when added together, (using
different standard weightings in accordance with the instructor’s manual) produce a
Composite Score which forms an integral component of the final global score.
The Curve of Learning subtest produced two sets of data, namely COL tot and COL diff.
COL tot and COL diff are the only scores given a half weight each as they are highly
correlated. They are therefore abbreviated to COL tot Z.0,5 and COL diff Z.0,5 (Taylor,

16
1994). Taylor (1997) adds that the first four scores (CFT, Speed, Acc, Flex) are classified
as “static” scores, while the remaining three scores may be called “dynamic” scores (they
reflect the learning processes). The latter scores “gives additional information on the
individual, which seems to be particularly valuable in cross–cultural assessment exercises
and where testees differ in advantagement or past opportunity” (Taylor, 1994, p. 189).
Taylor (1994) indicates that static scores are derived from an external intelligence test or the
initial performance on a learning test. Dynamic scores reflect the performance score that
measures learning, either by repeated exposure or by both repeated exposure and
instruction (Taylor, 1994). It is thus possible to produce very different results for each type
of test. Often a person who scores poorly on the static tests, delivers somewhat improved
results in the dynamic tests (Taylor, 1994). Both from a theoretical and conceptual point of
view, a major advantage derived from dynamic testing is its relative lack of susceptibility to
the effects of cultural bias.
The criterion measure used, as previously stated, was a single rating given on a five-point
scale designed to assess the individual’s learning potential as rated by the manager.
RESULTS
The distribution of criterion values is shown in Table 2. The most striking observation is
between ratings of 3 and 4. More women than men were given a rating of 4, while more
men than women were given a rating of 3. As a result of the skewness of the distribution, it
was decided that the data had to be treated as being of nominal strength only.
<Insert Table 2>
The distribution of the ratings for the population groups is shown in Table 3. Ratings 3 and
4 are the most common scores observed with the white population occupying the highest
representation of the ethnic groups.
<Insert Table 3>

17
Means and standard deviations for ethnic groups on predictor scores may be studied in
Table 4 below. This table displays interesting comparisons between the different ethnic
groups.
<Insert Table 4>
The z-scores for the subtests were intercorrelated with age and reporting time (this being the
length of time the individual reported to the manager who provided the rating). The results
are shown in Table 5 where all the subtests correlate highly with one another.
<Insert Table 5> The predictive validity of the test battery was assessed by using a canonical discriminant
analysis procedure. This procedure was adopted in view of the nominal strength of the
managers’ ratings. Because of the limited sample size the 5-point rating scale was eventually
collapsed to a 2-point classification. (This procedure will be discussed in more detail during
the discussion section). Wilks’ Lambda coefficient was used to determine whether the
centroids of the various groups differed significantly. The following decision rules were
applied: Maximum number of steps is 18; minimum partial F to enter is 3,84; maximum
partial F to remove is 2,71; and F level, tolerance, or VIN insufficient for further
computation.
<Insert Table 6>
This was followed by a stepwise procedure to identify the variables that discriminated the
best. Reporting Time in Table 7 stands out with a low F value and a p-value of 0,819.
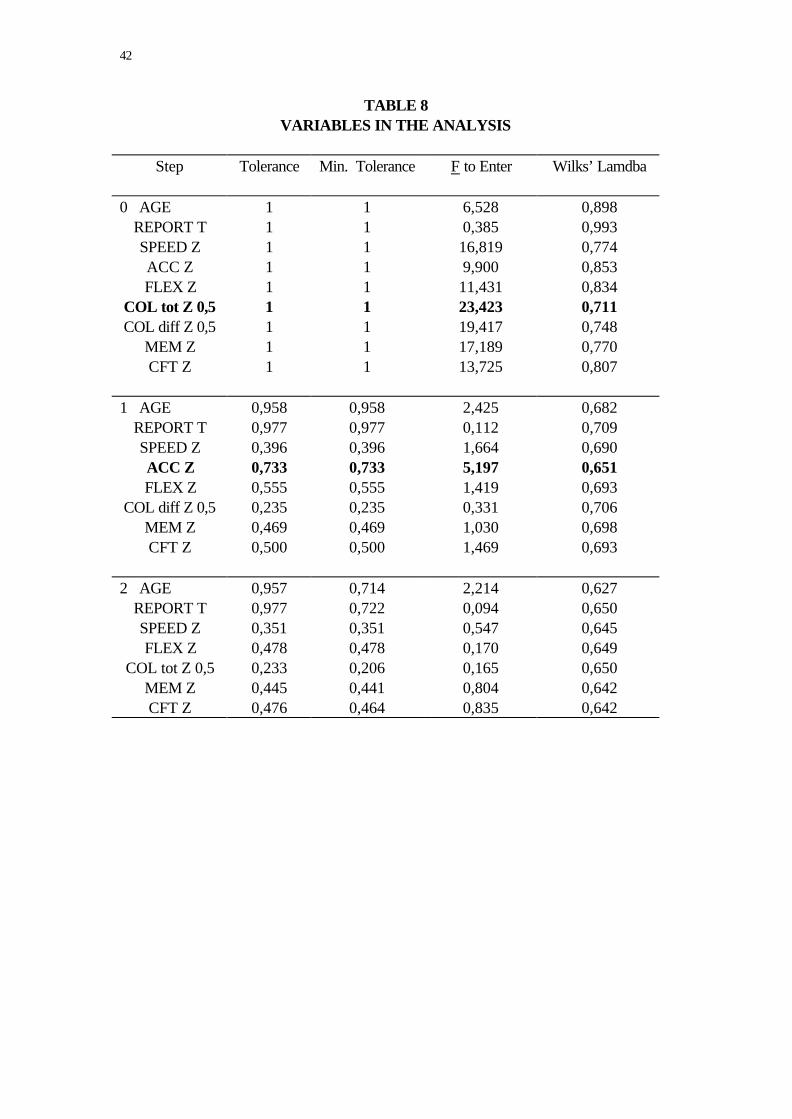
From Table 8, it may be seen that two variables were required to reach the optimum
discrimination level. Only two steps were required to obtain this optimum level.
<Insert Tables 7 and 8>
18
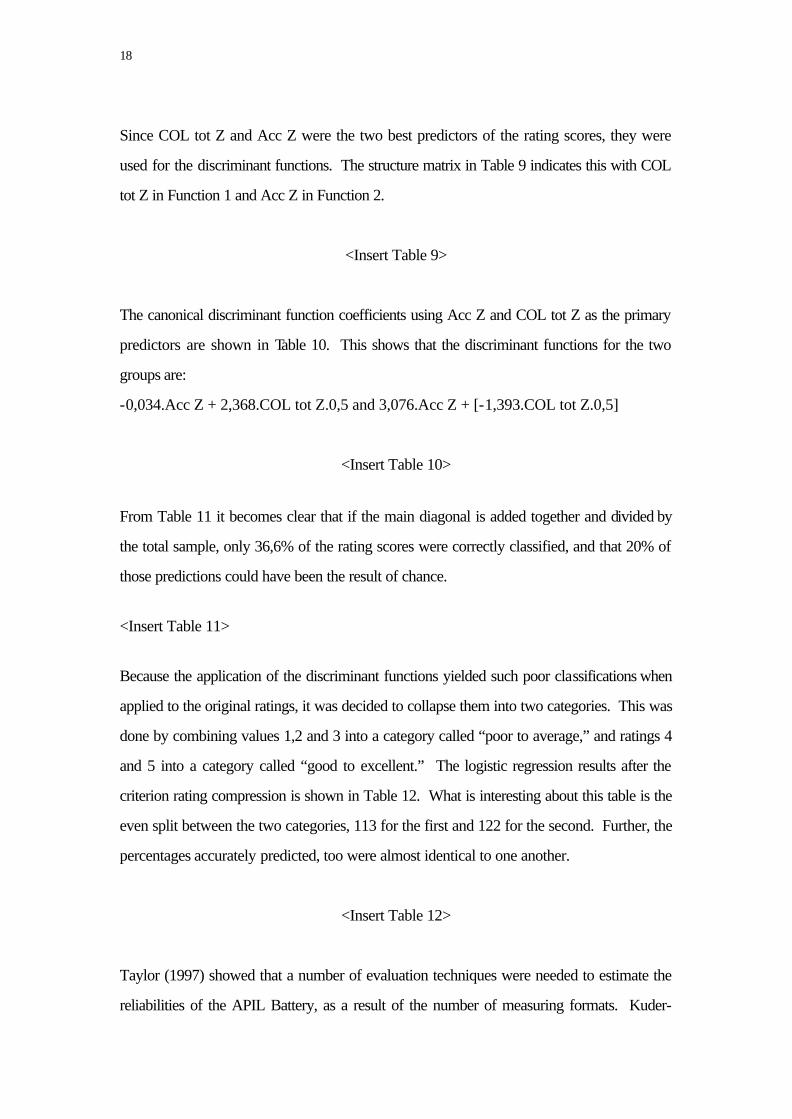
Since COL tot Z and Acc Z were the two best predictors of the rating scores, they were
used for the discriminant functions. The structure matrix in Table 9 indicates this with COL
tot Z in Function 1 and Acc Z in Function 2.
<Insert Table 9>
The canonical discriminant function coefficients using Acc Z and COL tot Z as the primary
predictors are shown in Table 10. This shows that the discriminant functions for the two
groups are:
-0,034.Acc Z + 2,368.COL tot Z.0,5 and 3,076.Acc Z + [-1,393.COL tot Z.0,5]
<Insert Table 10> From Table 11 it becomes clear that if the main diagonal is added together and divided by
the total sample, only 36,6% of the rating scores were correctly classified, and that 20% of
those predictions could have been the result of chance.
<Insert Table 11>
Because the application of the discriminant functions yielded such poor classifications when
applied to the original ratings, it was decided to collapse them into two categories. This was
done by combining values 1,2 and 3 into a category called “poor to average,” and ratings 4
and 5 into a category called “good to excellent.” The logistic regression results after the
criterion rating compression is shown in Table 12. What is interesting about this table is the
even split between the two categories, 113 for the first and 122 for the second. Further, the
percentages accurately predicted, too were almost identical to one another.
<Insert Table 12>
Taylor (1997) showed that a number of evaluation techniques were needed to estimate the
reliabilities of the APIL Battery, as a result of the number of measuring formats. Kuder-

19
Richardson Formula 21 was used to estimate the reliabilities of CFT and Mem which
produced scores of 0,85 and 0,76 respectively.
The reliability estimate of COL diff was calculated by subtracting the number correct in
COL3 from those correct in COL1 thus producing a new score. The correct answers in
COL4 were then subtracted from the number correct in COL2 to produce a second score.
The correlation between these two scores produced a value of 0,37 at p<0,01.
COL tot’s reliability was estimated by adding COL1 and COL3 and adding COL2 and
COL4 to produce two new scores. The correlation between the new scores is 0,95 at
p<0,01.
Taylor reports (1997) that the reliability of the Speed variable cannot be directly computed,
but that an indication of the reliability may be obtained by correlating the individual
components that make up the Speed variable. These components include the Series, Mirror
and Transformation tests. Correlations between the Series and Transformation tests were
0,70 and 0,72 between Series and Mirror, significant at the 0,01 level.
To estimate the reliability of the Accuracy variable, the FAST subtest is separated into two
scores being, Series plus Transformation and Mirror plus Combined, these correlations
provide reliability estimates of 0,87 at p<0,01.
The reasoning underlying the criterion ratings was assessed by interviewing nine managers
who had rated 37 candidates. A summary of the results from the interviews follows:
• One employee from the 37 interviewed was given a rating of 1 and the manager’s
explanation for this rating was that the individual is very slow to grasp concepts, ideas
and what is required to perform a particular function. The person needs to be told
three, four and even five times before any form of understanding becomes evident. The
individual needs to be trained on the job three or four times in order to do the job
function. In addition, compared to her colleagues, this person struggles to learn and
there is little knowledge retention and no skills or knowledge transfer ability.

20
• Two people were given ratings of 2, with the comments being “very slow to learn, you
need to keep telling and telling, showing and showing,” “it is difficult for the person to
grasp, never asked questions,” but whilst completing a repetitive function, coped
adequately.
• There were 12 people who were rated as a 3, some of the most common reasons were
as follows: “does what is told, does not perform the job at a high level or at a low level,
just as expected,” “retains and applies knowledge well,” “was not able to learn a new
computer system too well,” “the person does not seem to internalise feedback provided
well, almost as if there is limited learning ability,” “does not catch on very quickly”, “if a
new task is explained to her, she will not get it right the first time but the second or third
time she might get it right”, and “not below average and not above average”.

21
• Eighteen staff members were rated as 4. The managers reported that it was for the
following reasons: “knew a particular function well, and was able to teach others this
job,” “learns quickly, displays high potential with above average learning potential,”
“enormous initiative, acquires knowledge and skills very quickly (products and
systems),” “does things right the first time, don’t have to repeat instructions, grasps
concepts easily and then gets on with it”. Other comments included: good transferability
skills, can be used to train up new staff, good listening skills, asks probing questions to
gain complete clarity, successful in current departmental tests and assessments, goes the
extra mile to gain additional information and has the ability to impart this knowledge to
others with ease.
• Four people of the selected 37 had been given a rating of 5, and these were the
comments: “incredible ability to assimilate and process information, very proactive,”
“exceptional ability, fast learner who successfully imparts his knowledge to others well,”
“very competent in her job, excellent ability to retain and transfer knowledge,” “listens
very well and asks the appropriate questions to ensure all the facts have been
established,” and finally “performs the task exceptionally well.”
DISCUSSION
As may be seen from Table 2, the ratio between females and males in the sample is 2,22 to
1,00. This is higher than the current female to male ratio in the organisation which is 1,08 to
1,00, but it has to be borne in mind that the higher echelons are still predominantly populated
by men. This phenomenon remains common in most large corporations in South Africa.
Bearing in mind that the ratings of women are higher than those of men — a mode of 4
versus a mode of 3 — it would appear that the organisation may be well advised in
appointing more women than men. In spite of the major changes that have taken place in
the socially-defined roles of women, old stereotypes still prevail and men are probably more
inclined to be drawn to technical jobs than are women. This assertion is clearly difficult to

22
substantiate on an empirical basis.
It will be recalled that the criterion scores were derived from ratings done by the test-takers’
supervisors. The distribution of criterion scores — or categories — that is shown in Table 3
may, on appearance, suggest that African and Coloured candidates were rated lower than
were Indian and White ones. If there were any substance to such an observation, it would
give rise to concern about the role of possible bias on the part of the assessors. A
straightforward χ2 test, however, shows that this is not the case (χ2 = 0,445, df = 12, p >
0,05) and that the assessors did not, on the available evidence, discriminate between the so-
called ethnic groups.
As has been mentioned, the raw scores of the subtests of the APIL-B (the predictor scores)
were converted to z-scores based on the total sample statistics to ensure comparability of
the tests. This also has the advantage that if the means of these z-scores are computed for
the four ethnic groups separately, they immediately provide a divergence score from the
group mean in scores that are equivalent to standard deviations. The figures that appear in
Table 4 show that the African group is consistently lower than the total sample mean. In
four of the cases the means are one, or slightly less than one. The Indian group shows few
meaningful differences from the mean. The mean APIL-B subtest scores for the Coloured
group are consistently lower than the scores for the whole sample, although the magnitude of
this difference in not particularly large. The subtest means of the White group are
consistently above the total sample mean, but the differences are not really sizeable.
The main area for concern is, of course, the fact that the scores for the African group are so
low. In many respects, the author of the APIL-B has gone to considerable lengths to try to
ensure that group or cultural issues do not play a part in test-takers’ scores. While the
material has been carefully designed, it has been found elsewhere (Blake, 2000) that deficits
in English language capability lead to concomitant differences in test score attainment. In
unpublished research conducted in a large South African bank, it could be shown that if
black and white test-takers were matched in terms of their English language reading
proficiency, differences on cognitive tests disappeared.

23
While the difference that have been found in this study may pause some cause for concern,
mere differences in mean test score would imply bias only if these differences are not also
evident in work performance. High levels of validity would, of course, be an indirect
indication that bias is not likely to exist in the APIL-B.
The primary aim of this study was, however, to investigate the predictive validity of the
APIL Battery against the background of the requirements laid down in recent, relevant
legislation. The z-scores of the various subtests were intercorrelated producing a number of
generally high correlations. A striking correlation between COL tot Z and COL diff Z of
0,908, significant at the p<0,01 level, was found, indicating there is a strong relationship
between these two scores. This supports the test developer’s findings.
From Table 5, it can be seen that the intercorrelations between the various subtests are
generally high. These high correlations indicate that, to a degree, the battery of tests as a
whole, do measure the same variable.
Many significant correlations were found between reporting time and age. Although the
correlations between reporting time and the individual tests are significant in most cases, the
p-levels are at the < 0,05 level. Age, however, correlated negatively with most of the
individual tests, and at the p<0,01 level showing that younger test takers perform better than
the older ones. This is probably caused by the normal decreases in psychomotor speed that
are associated with ageing. To establish whether age has an effect on actual learning
potential would require further research with a more complex design.
Canonical discriminant analysis was used to determine which independent variables (APIL-
B test scores) had the greatest utility in classifying members of the sample into the five
categories of the assessment process. The analysis yielded two discriminant functions. It is
worth noting that the means of all the variables, with the exception of Reporting Time,
differed significantly across the five categories of the performance assessment (Table 7).

24
The stepwise canonical discriminant analysis showed that only two steps were required to
establish the best predictors. As shown in Table 8, COL tot Z and Acc Z combined were
the variables that explained the greatest amount of variance. No further variables were
added or deleted. Unfortunately, the accuracy of the prediction was not as high as had been
hoped for, and 36,6% of the ratings were accurately predicted. If one were to terminate the
investigation at this stage, it would be too easy to conclude either that the APIL-B results
are not as good as had been hoped for when it comes to predicting the performance ratings
that the test takers had been given, or that the criterion measure is suspect. It is, however,
important to bear in mind that, had a stepwise regression procedure been used, a squared
multiple correlation coefficient (R2) that is equivalent to an explanation of 36,6% of the
variance would have required an R-coefficient of 0,605.
Because the doubts about the criterion had not yet been addressed, it was decided to
collapse the five rating categories into two new categories, namely “poor to average” and
“good to excellent”. The labels for the new categories were based on the information
received while interviewing the managers regarding why particular people qualified for
certain ratings. Those individuals scoring a 1,2 or 3 appeared to be the poor to average
performers while staff who were rated as 4 or 5, were praised for their exceptional abilities
and excellent performances.
Still using COL tot Z and Acc Z as predictors for the two new categories, a logistic
regression analysis was conducted. This regression technique requires a dichotomous
variable as criterion and was used to assist in improving the predictability of the rating
categories. The stepwise logistic regression analysis revealed that under the new categories
a total of 72,77% of the test takers could be accurately placed into either of the two
categories. The “poor to average” category was calculated as 72,57%, while the “good to
excellent” category was 72,95%.
Once again, using the argument about the implied equivalence of a classification of 72,77%
accuracy as resembling R2, this would imply that the possible multiple correlation would
have been about 0,85. It is, of course, to be expected that the magnitude of a multiple

25
regression coefficient, or a discriminant function’s accuracy of classification, will increase if
the categories of the criterion variable are collapsed. Nevertheless, the findings of this
investigation, both before and after the collapse of the categories, are of considerable
importance.
What has been shown is that, despite concerns relating to the reliability of the criterion, the
APIL-B is nevertheless able to predict the performance of employees in a financial institution
at a level of accuracy that makes the test battery an important proposition in the field of
human resources assessment. While 36,6% may appear to be a poor prediction of job
performance when taken at face value, it must be borne in mind that the generally accepted
wisdom among psychologists about 20 years ago was that the average correlation between
measures of cognitive ability and job performance was in the order of 0,30 — in other
words, roughly 9% of the variance of the criterion was explained!
There can be little doubt that the APIL-B is an unusually useful instrument for the prediction
of whether an individual is likely to be assessed as above average, or average and below, in
a selection situation.
To return to the original research questions, the above results do indicate that the APIL-B is
a reliable instrument when applied to job applicants within a financial institution. The high
reliability estimates and correlations are consistent with existing findings. Regarding the
validity, as seen by the intercorrelations discussed earlier, the battery does measure a
specific construct or dimension quite effectively but to state it is a valid tool used for
selection purposes would be rather bold at this stage since additional intensive research
would be required to back a statement of that calibre.
Although the issue of bias is of the great importance in terms of the provisions of the EEA,
the computation of the bias of the APIL-B presents a major problem under the existing
circumstances. The sample sizes that are required to do an adequate analysis would be far
larger than those that are available in this study. An inspection of the distribution of the
sample that is shown in Table 3 clarifies the situation. With cell totals as small as 10, 12 and

26
20, it would hardly be worth trying to determine whether the test is biased in terms of race
and gender. The value of the results would obviously be dubious when based on these cell
sizes. This is certainly a situation in which the research will have to be repeated on a much
larger sample to be able to arrive at a satisfactory answer about the possible bias of the test.
An adequate discussion of the extent to which the test results have been fairly used is also a
difficult issue when it is not possible to compute satisfactory bias statistics. Fairness in the
context of the EEA implies that the manner in which the results are applied has to be
administratively fair. It presupposes that the assessment device is sufficiently reliable, valid
and unbiased. Given this set of conditions, it then becomes necessary to investigate the
policies and procedures, and the extent to which the controls in the organisation ensure that
they are adhered to. An indirect, and not necessarily adequate approach to attesting to the
fairness of the procedure, would be to claim that the procedures that were followed in the
use of the APIL-B were fair to the extent that none of the test takers had, at any stage,
raised a complaint about the procedures, and neither had any of them lodged complaints
with the Commission for Conciliation, Mediation and Arbitration (CCMA).
It is self-evident that there are a number of limitations to this study. It is recommended that
the study be repeated at some future date, and that the limitations be taken care of at the
design stage of the research.
Conclusion
Given the importance of tests, and the emphasis in South African legislation on fairness, it is
surprising to find so little research on the appropriateness and effectiveness of psychological
testing across cultures in South Africa.
If South Africa as a country wants to grow, develop, and prosper economically and in its
human capital, a radical shift needs to be made. Individuals’ potential needs to be the main
focus with much emphasis being placed on the advancement, training and development of
these high potential individuals allowing them to harness and master specific skills. If these
high potential people are identified, the time, effort, and resources expended on them will

27
have a much larger return on investment than if we continue to operate in the haphazard
manner currently adopted.

28
REFERENCES
Aiken, L.R. (1979). Psychological testing and assessment . (3rd ed.). Boston: Allyn & Bacon.
Anastasi, A. & Urbina, S. (1997). Psychological testing. (7th ed.) Upper Saddle River,
NJ: Prentice-Hall. Bauer, T.N., Maertz, C.P., Dolen, M.R. & Campion, M.A. (1998). Longitudinal
assessment of applicant reactions to employment testing and test outcome feedback. Journal of Applied Psychology, 83 (6), 892-903.
Blake, R.H. (July, 2000). Personal communication concerning the effect of matching
language proficiency on test score differences between ethnic groups. Cattell, R.B. (1971). Abilities: Their structure, growth, and action. Boston: Houghton
Mifflin. Cascio, W.F. (1997). Applied psychology in human resource management.
Englewood Cliffs, NJ: Prentice-Hall. Cuellar, I. (1998). Cross-cultural clinical psychological assessment of Hispanic Americans.
Journal of Personality Assessment, 70(1), 71-86. Friedenberg, L. (1995). Psychological testing: Design, analysis, and use. Boston: Allyn
& Bacon. Gregory, R.J. (1996). Psychological testing: History, principles and applications (2nd
ed.) Boston: Allyn & Bacon. Guion, R.M. (1965). Personnel testing. New York: McGraw-Hill. Gulliksen, H. (1950). Theory of mental tests. New York: Wiley. Hunt, E. (1980). Intelligence as an information processing concept. British Journal of
Psychology, 71, 449-474.

29
Huysamen, G.K. (1996). Psychological measurement: An introduction with South African examples. Pretoria: J.L. van Schaik.
Jaques, E. (1975). A general theory of bureaucracy. London: Heinemann Educational. Jaques, E. (1978). Levels of abstraction in logic and human action. Exeter, New
Hampshire, UK: Heinemann Educational. Jaques, E. (1982). The form of time. New York: Crane, Russak. Jaques, E. (1989). Requisite Organisation. Arlington, VA: Cason Hall. Jensen, A.R. (1980). Bias in mental testing. London: Methuen. Jensen, A.R. (1981). Straight talk about mental tests. London: Methuen. Kerlinger, F.N. (1986). Foundations of behavioral research (3rd ed.) Chicago: Holt,
Rinehart & Winston. Magnusson, D. (1967). Test theory. Reading, MA: Addison-Wesley. Oakland, T. & Hambleton, R.K. (1995). International perspectives on academic
assessment. Boston: Kluwer Academic. Owen, K. (1991). Test bias: The validity of the junior aptitude tests (JAT) for various
population groups in South Africa regarding constructs measured. South African Journal of Psychology, 21 (2), 112-118.
Ree, M.J. & Earles, J.A. (1991). Predicting training success: Not much more than g.
Personnel Psychology, 44, 321-332. Ree, M.J., Earles, J.A. & Teachout, M.S. (1994). Predicting job performance: Not much
more than g. Journal of Applied Psychology, 79 (4), 518 - 524. Republic of South Africa. (1998). Employment Equity Act (55 of 1998). Government
Gazette, 400, No. 19370: Pretoria. Reynolds, C.R. (1983). Test bias: In God we trust: All others must have data. The
Journal of Special Education, 17, 241-260. Rosenbach, J.H. & Mowder, B.A. (1981). Test bias: The other side of the coin.
Psychology in Schools, 18, 450-454. Rust, J. & Golombok, S. (1989). Modern psychometrics: The science of psychological
assessment. London: Routledge.

30
Schepers, J.M. (2000). Measuring of learning potential. Unpublished document, Rand Afrikaans University, Johannesburg.
Scheuneman, J.D. (1981). A new look at bias in aptitude tests. New Directions in
Testing and Measurement, 12, 3-35. Schmidt, F.L. & Hunter, J.E. (1998). The validity and utility of selection methods in
personnel psychology: Practical and theoretical implications of 85 years of research findings. Psychological Bulletin, 124 (2), 262-274.
Schmitt, N., Gooding, R.Z., Noe, R.A. & Kirsch, M. (1984). Meta-analysis of validity
studies published between 1964 and 1982 and the investigation of study characteristics. Personnel Psychology, 37, 407-422.
Smit, G. J. (1996). Psychometrics aspects of measurement. Pretoria: Kagiso. Stake, R.E. (1958). Learning parameters, aptitudes, and achievements. (E.T.S.
Technical Report). Princeton, NJ: Educational Testing Services. Taylor, T.R. (1997). Administrator’s manual for APIL Battery. Parktown: Jetline. Taylor, T.R. (1994). A review of three approaches to cognitive assessment, and a
proposed integrated approach based on a unifying theoretical framework. South African Journal of Psychology, 24, 184-193.
Woodrow, H. (1938a). The relation between abilities and improvement with practice.
Journal of Educational Psychology, 29, 215-230. Woodrow, H. (1938b). The effect of practice on groups of different initial ability. Journal
of Educational Psychology, 29, 268-278.

31
Woodrow, H. (1938c). The effect of practice on test intercorrelations. Journal of
Educational Psychology, 29, 561-572.
Woodrow, H. (1946). The ability to learn. Psychological Review, 29, 147-158.

32
TABLE 1 DISTRIBUTION OF SAMPLE STATISTICS
Population Groups Male Female Age
N N Total N % M (SD)
Blacks 31 14 45 19,1 36,8 8,2
Coloureds 10 27 37 15,7 31,8 7,3
Indians 12 31 43 18,3 30,9 6,6
Whites 20 90 110 46,8 34,9 8,5
Total 73 162 235 34 8,2
Percentage 31,1 68,9 100

33
TABLE 2 GENDER AND RATING DISTRIBUTION OF CRITERION SCORES
Rating
1 2 3 4 5 Total
Gender n 2 12 54 72 22 162
F Gender % 1,2 7,4 33,3 44,4 13,6 100
Rating % 33,3 54,4 63,5 82,8 62,9 68,9
n 4 10 31 15 13 73
M Gender % 5,5 13,7 42,5 20,5 17,8 100
Rating % 66,7 45,5 36,5 17,2 37,1 31,1
N 6 22 85 87 35 235
Total Gender % 2,6 9,4 36,2 37 14,9 100
Rating % 100 100 100 100 100 100

34
TABLE 3 ETHNIC GROUPS AND RATING DISTRIBUTION OF
CRITERION SCORES 1 2 3 4 5 Total
n 5 10 20 8 2 45
African Ethnic Group % 11,1 22,2 44,4 17,8 4,4 100
Rating % 83,3 45,5 23,5 9,2 5,7 19,1
n 0 3 13 16 11 43
Indian Ethnic Group % 0 7 30,2 37,2 25,6 100
Rating % 0 13,6 15,3 18,4 31,4 18,3
n 0 4 18 12 3 37
Coloured Ethnic Group % 0 10,8 48,6 32,4 8,1 100
Rating % 0 18,2 21,2 13,8 8,6 15,7
n 1 5 34 51 19 110
White Ethnic Group % 0,9 4,5 30,9 46,4 17,3 100
Rating % 16,7 22,7 40 58,6 54,3 46,8
N 6 22 85 87 35 235
Total Ethnic Groups % 2,6 9,4 36,2 37 14,9 100
Rating % 100 100 100 100 100 100

35
TABLE 4 MEANS AND STANDARD DEVIATIONS FOR ETHNIC GROUPS ON
PREDICTOR SCORES
African M SD
Indian M SD
Coloured M SD
White M SD
CFT Z -0,88 0,92 0,05 0,96 -0,33 0,80 0,45 0,82
SPEED Z -1,13 0,84 0,09 0,81 -0,30 0,78 0,53 0,75 ACC Z -0,41 0,37 0,04 0,38 -0,11 0,28 0,19 0,33 FLEX Z -0,93 0,67 -0,02 0,78 -0,39 0,73 0,52 0,93
COL tot Z 0,5 -0,52 0,32 -0,03 0,38 -0,16 0,34 0,28 0,45 COL diff Z 0,5 -0,43 0,29 -0,01 0,45 -0,16 0,37 0,23 0,49
MEM Z -1,06 0,89 0,11 0,86 -0,15 0,77 0,44 0,82


37
TABLE 5 MATRIX OF INTERCORRELATIONS BETWEEN AGE, REPORTING TIME AND APIL-B SCORES
Age Reporting
time CFT Z COL tot Z
0,5 COL diff Z 0,5 MEM Z SPEED Z ACC Z FLEX Z
Age 1 200** -307** -321** -324** -297** -277** -233** -162* Reporting time 1 -170** -167* -138* -134* -187** -112 -144 CFT Z 1 776** 709** 710** 701** 559** 644** COL tot Z 0,5 1 908** 795** 827** 564** 725** COL diff Z 0,5 1 758** 689** 475** 615** MEM Z 1 716** 566** 634** SPEED Z 1 635** 720** ACC Z 1 634** FLEX Z 1 ** Correlation significant at p ≤ 0,01 level (2-tailed) * Correlation significant at p ≤ 0,05 level (2-tailed)
Decimal commas omitted.

38
TABLE 6
CANONICAL DISCRIMINANT FUNCTIONS
Wilks’ Lambda Exact F
Step Entered λ df1 df2 df3 λ df1 df2 p ≤ 1 COL tot Z 0,5 0,771 1 4 230 23,423 4 230 01 2 ACC Z 0,651 2 4 230 13,683 8 458 01

39

40
TABLE 7 TESTS OF EQUALITY OF GROUP MEANS
Wilks’
Lambda F df1 df2 p ≤
AGE 0,898 6,528 4 230 01 REPORT T 0,993 0,385 4 230 0,819
SPEED Z 0,774 16,819 4 230 01 ACC Z 0,853 9,900 4 230 01 FLEX Z 0,834 11,431 4 230 01
COL tot Z 0,5 0,711 23,423 4 230 01 COL diff Z 0,5 0,748 19,417 4 230 01
MEM Z 0,770 17,189 4 230 01 CFT Z 0,807 13,725 4 230 01

41
42
TABLE 8 VARIABLES IN THE ANALYSIS
Step Tolerance Min. Tolerance F to Enter Wilks’ Lamdba
0 AGE 1 1 6,528 0,898
REPORT T 1 1 0,385 0,993 SPEED Z 1 1 16,819 0,774 ACC Z 1 1 9,900 0,853 FLEX Z 1 1 11,431 0,834
COL tot Z 0,5 1 1 23,423 0,711 COL diff Z 0,5 1 1 19,417 0,748
MEM Z 1 1 17,189 0,770 CFT Z 1 1 13,725 0,807
1 AGE 0,958 0,958 2,425 0,682
REPORT T 0,977 0,977 0,112 0,709 SPEED Z 0,396 0,396 1,664 0,690 ACC Z 0,733 0,733 5,197 0,651 FLEX Z 0,555 0,555 1,419 0,693
COL diff Z 0,5 0,235 0,235 0,331 0,706 MEM Z 0,469 0,469 1,030 0,698 CFT Z 0,500 0,500 1,469 0,693
2 AGE 0,957 0,714 2,214 0,627
REPORT T 0,977 0,722 0,094 0,650 SPEED Z 0,351 0,351 0,547 0,645 FLEX Z 0,478 0,478 0,170 0,649
COL tot Z 0,5 0,233 0,206 0,165 0,650 MEM Z 0,445 0,441 0,804 0,642 CFT Z 0,476 0,464 0,835 0,642

43
TABLE 9 CANONICAL DISCRIMINANT ANALYSIS STRUCTURE MATRIX
Function 1 2
COL tot Z 0,5
1,000
0,110 COL diff Z 0,5 0,875 -0,340
SPEED Z 0,775 0,222 MEM Z 0,727 0,164 CFT Z 0,706 0,161 FLEX Z 0,664 0,285
AGE 0,204 -0,034 REPORT T 0,152 -0,014
ACC Z 0,507 0,862

44
TABLE 10 CANONICAL DISCRIMINANT FUNCTION COEFFICIENTS
Function 1 2
ACC Z
-0,034
3,076 COL tot Z 0,5 2,368 -1,393
(Constant) 0 0

45

46
TABLE 11 CLASSIFICATION RESULTS
Predicted Group Membership Rating 1 2 3 4 5 Total 1 4 1 1 0 0 6 2 7 8 4 2 1 22
Original Count 3 22 13 18 23 9 85 4 7 6 12 34 28 87 5 1 0 7 5 22 35 1 66,7 16,7 16,7 0 0 100 2 31,8 36,4 18,2 9,1 4,5 100
Percentages 3 25,9 15,3 21,2 27,1 10,6 100 4 8 6,9 13,8 39,1 32,2 100 5 2,9 0 20 14,3 62,9 100
36,6% of cases correctly classified.

47

48
TABLE 12 CLASSIFICATION FOR COLLAPSED GROUPS
Predicted % Correct Rating 1,2 & 3 Rating 4 & 5 Overall
Observed Rating 1,2 & 3 82 31 113 72,57 Rating 4 & 5 33 89 122 72,95
Overall 115 120 235 72,77

49