Embed Size (px)
Citation preview
Journal of Biomechanics 35 (2002) 69–79
The precision of radiostereometric measurements.Manual vs. digital measurements
Niclas B .orlina,*, Truike Thienb, Johan K.arrholmc
aDepartment of Computing Science, Ume (a University, S-901 87 Ume (a, SwedenbBiomechanics Section, Katholieke Universiteit Nijmegen, 6500 Nijmegen, Netherlands
cDepartment of Orthopaedics, Sahlgrenska University Hospital, S-413 45 G .oteborg, Sweden
Accepted 1 August 2001
Abstract
The precision of digital vs. manual radiostereometric measurements in total hip arthroplasty was evaluated using repeated
stereoradiographic exposures with an interval of 10–15min. Ten Lubinus SP2 stems cemented into bone specimens and 12 patientswith the same stem design were used to evaluate the precision of stem translations and rotations. The precision of translations androtations of the cup and femoral head penetration was studied in 12 patients with whole polyethylene cups.The use of a measurement method based on digitised radiographs improved the precision for some of the motion parameters,
whereas many of them did not change. A corresponding pattern was observed for both the intra- and interobserver error. Of thewear parameters, the most pronounced improvements were the 3D wear and in the proximal-distal direction, although the anterior-posterior precision was also improved. The mean errors of rigid body and elliptic fitting decreased in all evaluations but one,
consistent with a more reproducible identification of the markers centres and the edge of the femoral head.Increased precision of radiostereometric measurements may be used to increase the statistical power of future randomised studies
and to study new fields in orthopaedics requiring higher precision than has been available with RSA based on manual
measurements. r 2002 Elsevier Science Ltd. All rights reserved.
Keywords: Radiostereometry; Digital radiographs; Precision; Micromotion; Wear
1. Introduction
Radiostereometric analysis (RSA) has because of itshigh precision been used with increasing frequency as atool in orthopaedic research (K.arrholm, 1989). Until thelatest years the development of the method has focusedon improvements of the software and the mathematicalcomputations associated with the final evaluation ofmotion parameters (Nystr .om et al., 1994; S .oderqvistand Wedin, 1993). The radiographs were measuredmanually, which was time consuming. This procedurealso increased the risk for loss of precision and evenerrors caused by the human factor. During the last yearsa few techniques (Talmage et al., 1995; Vrooman et al.,1998; Wang et al., 1996; Østgaard et al., 1997) have beenpresented, which utilise the possibility to measure
digitised radiographs. The potential benefits with thesemethods are increased speed, reduced need for manualinterference, and higher precision.
In 1992 we initiated a project aimed to enablemeasurements of digitised radiographs (B .orlin andTennberg, 1992). Two basic requirements should bemet; the precision should be at least as good as using themanual technique and the evaluation time should notincrease.
In 1997 we presented the first results based on a proto-type system, showing that the precision could indeed bemaintained on clinical hip and knee images (B .orlin andK.arrholm, 1997). Since then the prototype system hasevolved (UmRSA Digital Measure v1.0, RSA Biomedi-cal Innovations, Ume(a, Sweden). After having evaluated6000 pairs of stereoradiographs with this technique atthe Sahlgrenska University Hospital, manual measure-ments have been completely abandoned.
Our aim was to evaluate the precision of this methodto measure digitised radiographs obtained with the RSA
*Corresponding author. Tel.: +46-90-786-68-32; fax: +46-90-786-
61-26.
E-mail address: [email protected] (N. B .orlin).
0021-9290/02/$ - see front matter r 2002 Elsevier Science Ltd. All rights reserved.
PII: S 0 0 2 1 - 9 2 9 0 ( 0 1 ) 0 0 1 6 2 - 2
technique. Previous studies of the uniplanar or con-vergent technique has shown that this set up isassociated with higher errors concerning translationsin the direction perpendicular to the X-ray film thanrecorded for the biplanar technique (Woltring et al.,1985). In the examination of hip prostheses thisaxis usually coincides with the anterior–posterioraxis of the body. Larger contrast variations areusually present when the hip is examined becausethis part of the body is surrounded by more softtissues than e.g. the knee or ankle often examinedwith the biplanar technique. We therefore chose theuniplanar set-up when applied to total hip prostheses inour evaluation. The digital measurements were com-pared with manual measurements based on repeatedexposures. The intra- and interobserver variabilitieswere also studied.
2. Materials and methods
2.1. Specimens and patients
A series of 10 femoral stems (Lubinus SP2, Link,Germany) was cemented into cadaveric femora of adultsows. Tantalum markers (+ ¼ 0:8 or 1.0mm) wereinserted into the femur and were spread proximal-distally on both sides of the prosthesis. One tantalummarker was placed at the top of the greater trochanter.The manufacturer had supplied the stem with threetitanium towers, one at the shoulder, one at themedial part of the collar and one at the tip. Each towerwas supplied with a tantalum marker (1 ¼ 0:8mm)at its tip.
The condition number (S .oderqvist and Wedin, 1993)was computed as a part of the RSA evaluation. Thisparameter was developed to enable a simple control ofmarker scatter. In the evaluation of hip prostheses weaim at condition numbers lower than 80–90. If thisnumber exceeds 120–150 the evaluation is usuallydiscarded as unreliable depending on marker stability.Each preparation was stereoradiographed in twodifferent positions using the uniplanar cage (Selvik,1989). These two pairs of radiographs were measuredmanually and digitally.
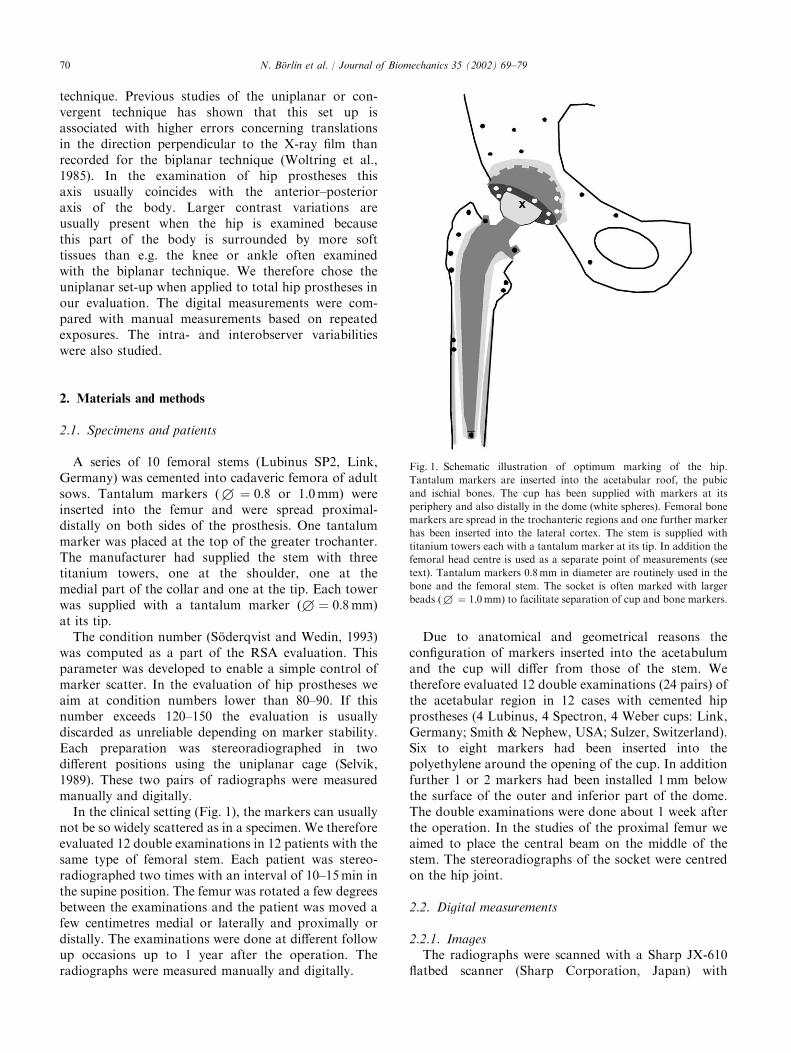
In the clinical setting (Fig. 1), the markers can usuallynot be so widely scattered as in a specimen. We thereforeevaluated 12 double examinations in 12 patients with thesame type of femoral stem. Each patient was stereo-radiographed two times with an interval of 10–15min inthe supine position. The femur was rotated a few degreesbetween the examinations and the patient was moved afew centimetres medial or laterally and proximally ordistally. The examinations were done at different followup occasions up to 1 year after the operation. Theradiographs were measured manually and digitally.
Due to anatomical and geometrical reasons theconfiguration of markers inserted into the acetabulumand the cup will differ from those of the stem. Wetherefore evaluated 12 double examinations (24 pairs) ofthe acetabular region in 12 cases with cemented hipprostheses (4 Lubinus, 4 Spectron, 4 Weber cups: Link,Germany; Smith & Nephew, USA; Sulzer, Switzerland).Six to eight markers had been inserted into thepolyethylene around the opening of the cup. In additionfurther 1 or 2 markers had been installed 1mm belowthe surface of the outer and inferior part of the dome.The double examinations were done about 1 week afterthe operation. In the studies of the proximal femur weaimed to place the central beam on the middle of thestem. The stereoradiographs of the socket were centredon the hip joint.
2.2. Digital measurements
2.2.1. ImagesThe radiographs were scanned with a Sharp JX-610
flatbed scanner (Sharp Corporation, Japan) with
Fig. 1. Schematic illustration of optimum marking of the hip.
Tantalum markers are inserted into the acetabular roof, the pubic
and ischial bones. The cup has been supplied with markers at its
periphery and also distally in the dome (white spheres). Femoral bone
markers are spread in the trochanteric regions and one further marker
has been inserted into the lateral cortex. The stem is supplied with
titanium towers each with a tantalum marker at its tip. In addition the
femoral head centre is used as a separate point of measurements (see
text). Tantalum markers 0.8mm in diameter are routinely used in the
bone and the femoral stem. The socket is often marked with larger
beads (+ ¼ 1:0mm) to facilitate separation of cup and bone markers.
N. B .orlin et al. / Journal of Biomechanics 35 (2002) 69–7970
standard backlight. The scanning resolution was 300dots per inch and 8 bits greyscale depth. The brightnessand contrast settings were optimised for each image,and all image processing features of the scanner wereturned off.
2.2.2. MeasurementsThe measurement of each marker is based on non-
linear least squares fitting of a mathematical model ofthe marker and background to the image datasurrounding each marker. The fitting algorithm is amodified Gauss–Newton with Tikhonov regularisation(Eriksson et al., 1998). The four available modelsdescribe one or two markers projected close to eachother and/or a neighbouring interfering edge. (Fordetails see Appendix A.)
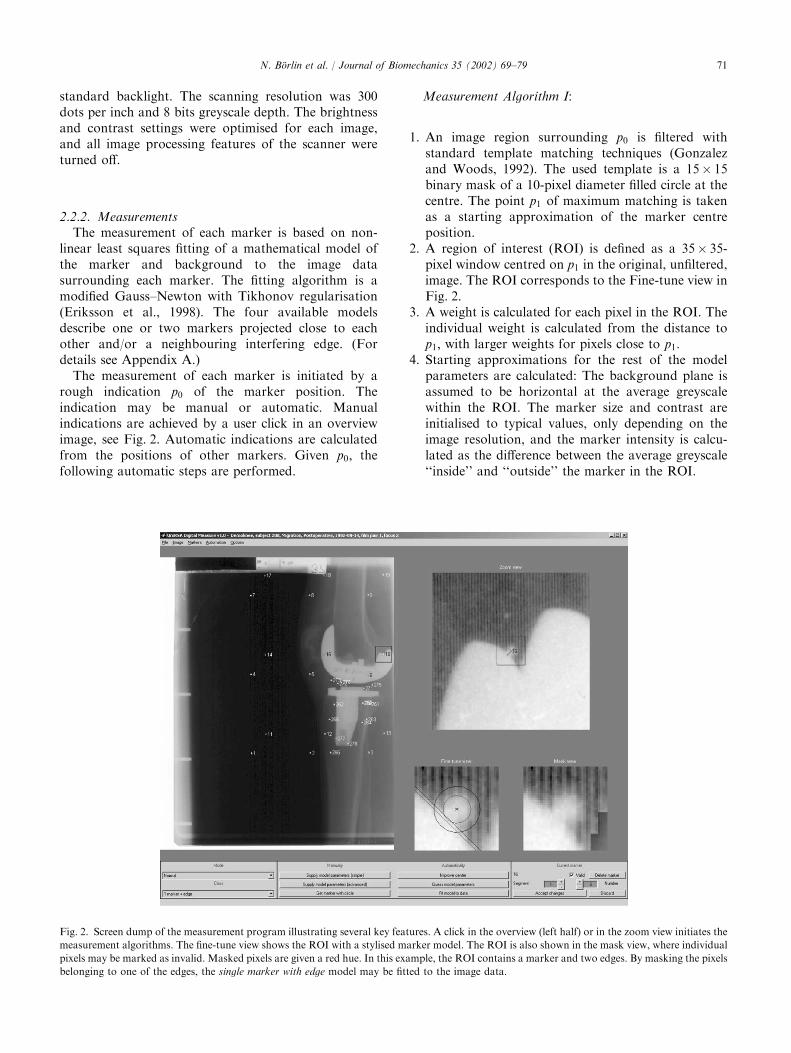
The measurement of each marker is initiated by arough indication p0 of the marker position. Theindication may be manual or automatic. Manualindications are achieved by a user click in an overviewimage, see Fig. 2. Automatic indications are calculatedfrom the positions of other markers. Given p0; thefollowing automatic steps are performed.
Measurement Algorithm I:
1. An image region surrounding p0 is filtered withstandard template matching techniques (Gonzalezand Woods, 1992). The used template is a 15� 15binary mask of a 10-pixel diameter filled circle at thecentre. The point p1 of maximum matching is takenas a starting approximation of the marker centreposition.
2. A region of interest (ROI) is defined as a 35� 35-pixel window centred on p1 in the original, unfiltered,image. The ROI corresponds to the Fine-tune view inFig. 2.
3. A weight is calculated for each pixel in the ROI. Theindividual weight is calculated from the distance top1; with larger weights for pixels close to p1:
4. Starting approximations for the rest of the modelparameters are calculated: The background plane isassumed to be horizontal at the average greyscalewithin the ROI. The marker size and contrast areinitialised to typical values, only depending on theimage resolution, and the marker intensity is calcu-lated as the difference between the average greyscale‘‘inside’’ and ‘‘outside’’ the marker in the ROI.
Fig. 2. Screen dump of the measurement program illustrating several key features. A click in the overview (left half) or in the zoom view initiates the
measurement algorithms. The fine-tune view shows the ROI with a stylised marker model. The ROI is also shown in the mask view, where individual
pixels may be marked as invalid. Masked pixels are given a red hue. In this example, the ROI contains a marker and two edges. By masking the pixels
belonging to one of the edges, the single marker with edge model may be fitted to the image data.
N. B .orlin et al. / Journal of Biomechanics 35 (2002) 69–79 71
5. A non-linear least squares fit of the model to theimage data inside ROI is performed (Eriksson et al.,1998).
6. The marker centre is taken from the parameters ofthe best fit and called p2:
7. The steps 2–6 are repeated with p1 substituted by p2;resulting in a new marker centre approximation p3:
8. The position p3 is registered as the final markerposition and the distance between p2 and p3 isdisplayed to the user as a measure of stability.
Given a bad fit, the user has several ‘‘contingencyoptions’’, including:
* Selecting another of the marker models, which betterdescribes the ROI.
* Marking individual pixels inside the ROI as ‘‘invalid’’and refitting the model. The invalid pixels are given azero weight and are ignored by the fitting algorithm.This allows a model to be fitted to a ROI which onlypartially corresponds to the model as illustrated inFig. 2.
* Measuring the marker manually with a circle withadjustable radius.
The contingency options were needed for lessthan 4% of the 230,000 markers in the first 4000image pairs measured at Sahlgrenska, or for anaverage of about one marker per image.Measurements of points on the edge of the femoral
head. To measure the points on the femoral head edge(Nystr .om, 1986), a rough indication of the femoral headcentre c is required from the user. Given this, the edgepoints are measured in the following manner.
Measurement Algorithm II:
1. A user click q0 is taken as an initial edge pointapproximation.
2. A region surrounding q0 is filtered with an anisotropicedge detector (Granlund and Knutsson, 1995), tunedat edges perpendicular to the radial vector q02c:
3. A hill-climb search is performed in the filtered image,using q0 as the starting point.
4. The hilltop is registered as the edge point position.
Automation
* Given two to three fiducial markers and two to threecontrol points, the remaining cage markers may bemeasured automatically. Their predicted positionsare supplied as p0 to Measurement Algorithm I. Thisfeature reduces the risk to mix cage with patientmarkers or vice versa.
* Given three to four points on the edge of the femoralhead, the remaining points may be measured auto-matically by supplying their predicted positions as q0to Measurement Algorithm II.
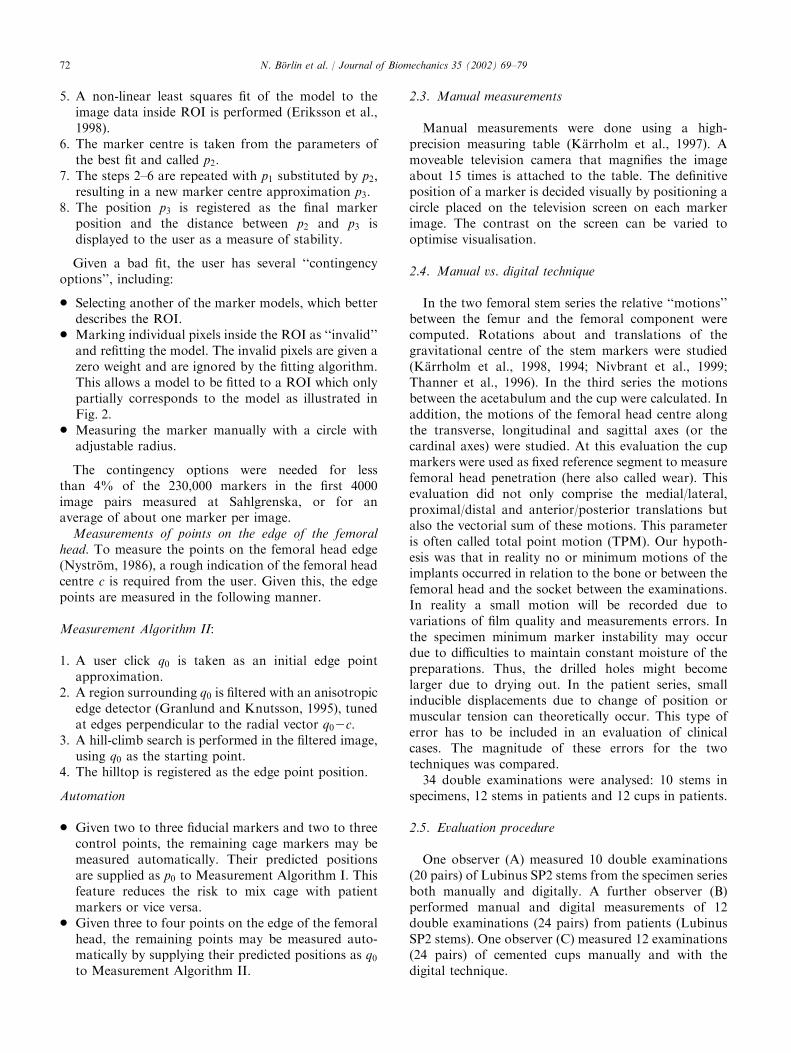
2.3. Manual measurements
Manual measurements were done using a high-precision measuring table (K.arrholm et al., 1997). Amoveable television camera that magnifies the imageabout 15 times is attached to the table. The definitiveposition of a marker is decided visually by positioning acircle placed on the television screen on each markerimage. The contrast on the screen can be varied tooptimise visualisation.
2.4. Manual vs. digital technique
In the two femoral stem series the relative ‘‘motions’’between the femur and the femoral component werecomputed. Rotations about and translations of thegravitational centre of the stem markers were studied(K.arrholm et al., 1998, 1994; Nivbrant et al., 1999;Thanner et al., 1996). In the third series the motionsbetween the acetabulum and the cup were calculated. Inaddition, the motions of the femoral head centre alongthe transverse, longitudinal and sagittal axes (or thecardinal axes) were studied. At this evaluation the cupmarkers were used as fixed reference segment to measurefemoral head penetration (here also called wear). Thisevaluation did not only comprise the medial/lateral,proximal/distal and anterior/posterior translations butalso the vectorial sum of these motions. This parameteris often called total point motion (TPM). Our hypoth-esis was that in reality no or minimum motions of theimplants occurred in relation to the bone or between thefemoral head and the socket between the examinations.In reality a small motion will be recorded due tovariations of film quality and measurements errors. Inthe specimen minimum marker instability may occurdue to difficulties to maintain constant moisture of thepreparations. Thus, the drilled holes might becomelarger due to drying out. In the patient series, smallinducible displacements due to change of position ormuscular tension can theoretically occur. This type oferror has to be included in an evaluation of clinicalcases. The magnitude of these errors for the twotechniques was compared.
34 double examinations were analysed: 10 stems inspecimens, 12 stems in patients and 12 cups in patients.
2.5. Evaluation procedure
One observer (A) measured 10 double examinations(20 pairs) of Lubinus SP2 stems from the specimen seriesboth manually and digitally. A further observer (B)performed manual and digital measurements of 12double examinations (24 pairs) from patients (LubinusSP2 stems). One observer (C) measured 12 examinations(24 pairs) of cemented cups manually and with thedigital technique.
N. B .orlin et al. / Journal of Biomechanics 35 (2002) 69–7972
2.6. Interobserver variability
Three observers (B, C and D) measured 10 randomlychosen pairs of radiographs from the specimen seriesusing the manual and digital technique. All radiographswere re-scanned between the digital measurements.
The measuring experience differed among the ob-servers: Observer A had only 1–2 weeks of experiencewhen she measured the first pairs of radiographs in thisseries. Observers B, C and D had 1–2 years experiencewith the digital technique and 5–6 years, 6–8 monthsand 1–2 years experience with the manual technique atthe time for the different manual measurements.
2.7. Data evaluation
The measured two-dimensional co-ordinates wereprocessed using the UmRSA software (UmRSA 3.2and 4.0, RSA Biomedical Innovations, Ume(a, Sweden).The ‘‘segment motion’’ routine in UmRSA was used tocompute the rotations and the translation of theacetabular and femoral implants between the examina-tions. The corresponding ‘‘point motion’’ routine wasused to measure femoral head penetration. In the firstinstances the bone markers in the acetabulum or thefemur were used as fixed reference. In the secondinstance the cup markers were used as fixed referencesegment. The translations of the two components weremeasured at the gravitational centre of the twocomponents, respectively. The gravitational centrecorresponds to an imaginary point where the distanceto each marker in the segment is minimized. Thecomputed motions and the penetration of the femoralhead should theoretically be close to zero. The presenceof a minimum but true motion (inducible displacement)between these two examinations can, as indicated abovenot be completely excluded, especially in the evaluationof the patient series. The mean error of rigid body fittingwas also recorded (Selvik, 1989). In the series ofradiographs aimed to evaluate the acetabular area(migration of the socket and wear) we also account forthe mean error of the elliptic fitting of the femoral headfor each pair of radiographs (Nystr .om, 1986).
In all comparisons the same tantalum markers wereused in each specimen and each patient, respectively.
The evaluation time was recorded for 4 consecutivepairs of radiographs done by observers B and C for bothdigital and manual measurements.
2.8. Statistics
The migration data and the values for the mean errorswere statistically analysed on a personal computer usingSPSS for Windows. The non-parametric WilcoxonMatched-Pairs Signed-Ranks test was used. To reducethe risk of spuriously occurring significances because of
repeated testing p-values less than 0.025 were regardedto represent a significant difference.
3. Results
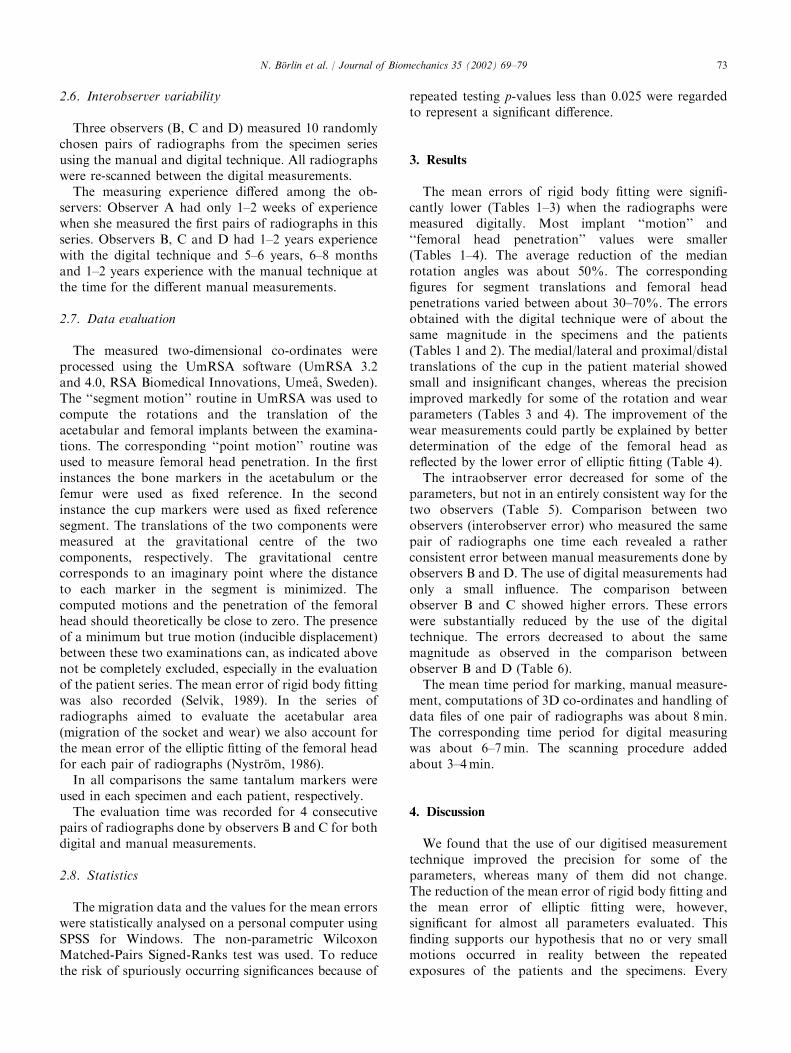
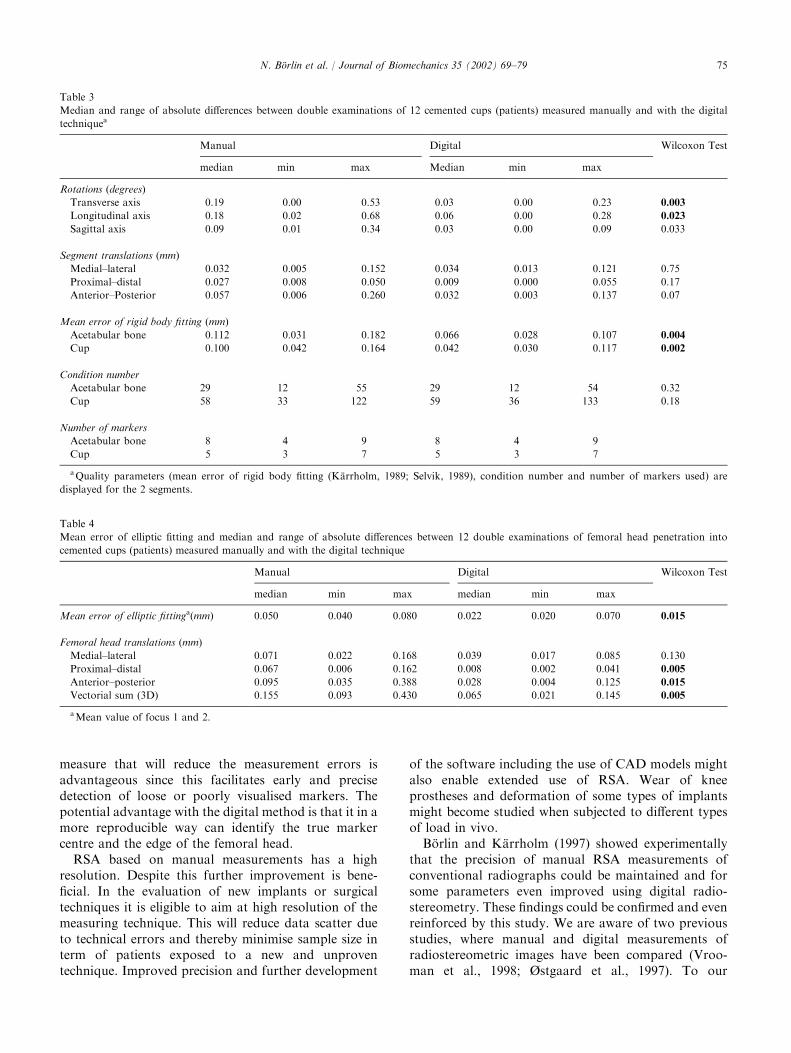
The mean errors of rigid body fitting were signifi-cantly lower (Tables 1–3) when the radiographs weremeasured digitally. Most implant ‘‘motion’’ and‘‘femoral head penetration’’ values were smaller(Tables 1–4). The average reduction of the medianrotation angles was about 50%. The correspondingfigures for segment translations and femoral headpenetrations varied between about 30–70%. The errorsobtained with the digital technique were of about thesame magnitude in the specimens and the patients(Tables 1 and 2). The medial/lateral and proximal/distaltranslations of the cup in the patient material showedsmall and insignificant changes, whereas the precisionimproved markedly for some of the rotation and wearparameters (Tables 3 and 4). The improvement of thewear measurements could partly be explained by betterdetermination of the edge of the femoral head asreflected by the lower error of elliptic fitting (Table 4).
The intraobserver error decreased for some of theparameters, but not in an entirely consistent way for thetwo observers (Table 5). Comparison between twoobservers (interobserver error) who measured the samepair of radiographs one time each revealed a ratherconsistent error between manual measurements done byobservers B and D. The use of digital measurements hadonly a small influence. The comparison betweenobserver B and C showed higher errors. These errorswere substantially reduced by the use of the digitaltechnique. The errors decreased to about the samemagnitude as observed in the comparison betweenobserver B and D (Table 6).
The mean time period for marking, manual measure-ment, computations of 3D co-ordinates and handling ofdata files of one pair of radiographs was about 8min.The corresponding time period for digital measuringwas about 6–7min. The scanning procedure addedabout 3–4min.
4. Discussion
We found that the use of our digitised measurementtechnique improved the precision for some of theparameters, whereas many of them did not change.The reduction of the mean error of rigid body fitting andthe mean error of elliptic fitting were, however,significant for almost all parameters evaluated. Thisfinding supports our hypothesis that no or very smallmotions occurred in reality between the repeatedexposures of the patients and the specimens. Every
N. B .orlin et al. / Journal of Biomechanics 35 (2002) 69–79 73
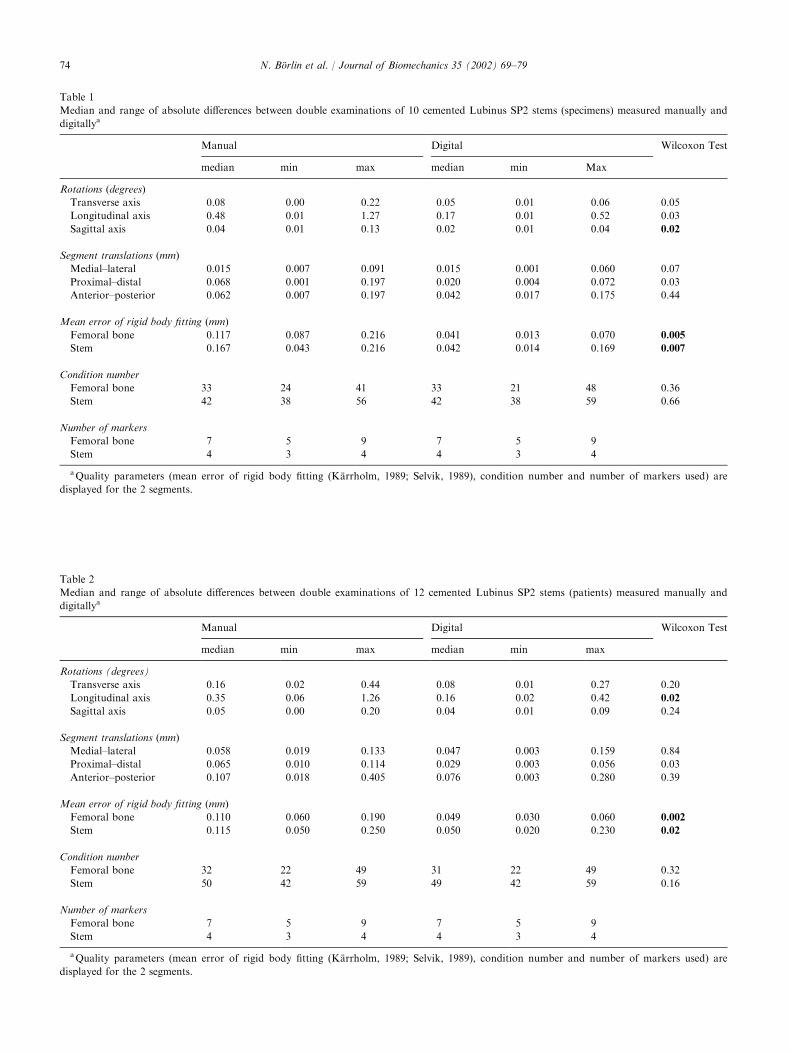
Table 1
Median and range of absolute differences between double examinations of 10 cemented Lubinus SP2 stems (specimens) measured manually and
digitallya
Manual Digital Wilcoxon Test
median min max median min Max
Rotations (degrees)
Transverse axis 0.08 0.00 0.22 0.05 0.01 0.06 0.05
Longitudinal axis 0.48 0.01 1.27 0.17 0.01 0.52 0.03
Sagittal axis 0.04 0.01 0.13 0.02 0.01 0.04 0.02
Segment translations (mm)
Medial–lateral 0.015 0.007 0.091 0.015 0.001 0.060 0.07
Proximal–distal 0.068 0.001 0.197 0.020 0.004 0.072 0.03
Anterior–posterior 0.062 0.007 0.197 0.042 0.017 0.175 0.44
Mean error of rigid body fitting (mm)
Femoral bone 0.117 0.087 0.216 0.041 0.013 0.070 0.005
Stem 0.167 0.043 0.216 0.042 0.014 0.169 0.007
Condition number
Femoral bone 33 24 41 33 21 48 0.36
Stem 42 38 56 42 38 59 0.66
Number of markers
Femoral bone 7 5 9 7 5 9
Stem 4 3 4 4 3 4
aQuality parameters (mean error of rigid body fitting (K.arrholm, 1989; Selvik, 1989), condition number and number of markers used) are
displayed for the 2 segments.
Table 2
Median and range of absolute differences between double examinations of 12 cemented Lubinus SP2 stems (patients) measured manually and
digitallya
Manual Digital Wilcoxon Test
median min max median min max
Rotations (degrees)
Transverse axis 0.16 0.02 0.44 0.08 0.01 0.27 0.20
Longitudinal axis 0.35 0.06 1.26 0.16 0.02 0.42 0.02
Sagittal axis 0.05 0.00 0.20 0.04 0.01 0.09 0.24
Segment translations (mm)
Medial–lateral 0.058 0.019 0.133 0.047 0.003 0.159 0.84
Proximal–distal 0.065 0.010 0.114 0.029 0.003 0.056 0.03
Anterior–posterior 0.107 0.018 0.405 0.076 0.003 0.280 0.39
Mean error of rigid body fitting (mm)
Femoral bone 0.110 0.060 0.190 0.049 0.030 0.060 0.002
Stem 0.115 0.050 0.250 0.050 0.020 0.230 0.02
Condition number
Femoral bone 32 22 49 31 22 49 0.32
Stem 50 42 59 49 42 59 0.16
Number of markers
Femoral bone 7 5 9 7 5 9
Stem 4 3 4 4 3 4
aQuality parameters (mean error of rigid body fitting (K.arrholm, 1989; Selvik, 1989), condition number and number of markers used) are
displayed for the 2 segments.
N. B .orlin et al. / Journal of Biomechanics 35 (2002) 69–7974
measure that will reduce the measurement errors isadvantageous since this facilitates early and precisedetection of loose or poorly visualised markers. Thepotential advantage with the digital method is that it in amore reproducible way can identify the true markercentre and the edge of the femoral head.
RSA based on manual measurements has a highresolution. Despite this further improvement is bene-ficial. In the evaluation of new implants or surgicaltechniques it is eligible to aim at high resolution of themeasuring technique. This will reduce data scatter dueto technical errors and thereby minimise sample size interm of patients exposed to a new and unproventechnique. Improved precision and further development
of the software including the use of CAD models mightalso enable extended use of RSA. Wear of kneeprostheses and deformation of some types of implantsmight become studied when subjected to different typesof load in vivo.
B .orlin and K.arrholm (1997) showed experimentallythat the precision of manual RSA measurements ofconventional radiographs could be maintained and forsome parameters even improved using digital radio-stereometry. These findings could be confirmed and evenreinforced by this study. We are aware of two previousstudies, where manual and digital measurements ofradiostereometric images have been compared (Vroo-man et al., 1998; Østgaard et al., 1997). To our
Table 3
Median and range of absolute differences between double examinations of 12 cemented cups (patients) measured manually and with the digital
techniquea
Manual Digital Wilcoxon Test
median min max Median min max
Rotations (degrees)
Transverse axis 0.19 0.00 0.53 0.03 0.00 0.23 0.003
Longitudinal axis 0.18 0.02 0.68 0.06 0.00 0.28 0.023
Sagittal axis 0.09 0.01 0.34 0.03 0.00 0.09 0.033
Segment translations (mm)
Medial–lateral 0.032 0.005 0.152 0.034 0.013 0.121 0.75
Proximal–distal 0.027 0.008 0.050 0.009 0.000 0.055 0.17
Anterior–Posterior 0.057 0.006 0.260 0.032 0.003 0.137 0.07
Mean error of rigid body fitting (mm)
Acetabular bone 0.112 0.031 0.182 0.066 0.028 0.107 0.004
Cup 0.100 0.042 0.164 0.042 0.030 0.117 0.002
Condition number
Acetabular bone 29 12 55 29 12 54 0.32
Cup 58 33 122 59 36 133 0.18
Number of markers
Acetabular bone 8 4 9 8 4 9
Cup 5 3 7 5 3 7
aQuality parameters (mean error of rigid body fitting (K.arrholm, 1989; Selvik, 1989), condition number and number of markers used) are
displayed for the 2 segments.
Table 4
Mean error of elliptic fitting and median and range of absolute differences between 12 double examinations of femoral head penetration into
cemented cups (patients) measured manually and with the digital technique
Manual Digital Wilcoxon Test
median min max median min max
Mean error of elliptic fittinga(mm) 0.050 0.040 0.080 0.022 0.020 0.070 0.015
Femoral head translations (mm)
Medial–lateral 0.071 0.022 0.168 0.039 0.017 0.085 0.130
Proximal–distal 0.067 0.006 0.162 0.008 0.002 0.041 0.005
Anterior–posterior 0.095 0.035 0.388 0.028 0.004 0.125 0.015
Vectorial sum (3D) 0.155 0.093 0.430 0.065 0.021 0.145 0.005
aMean value of focus 1 and 2.
N. B .orlin et al. / Journal of Biomechanics 35 (2002) 69–79 75
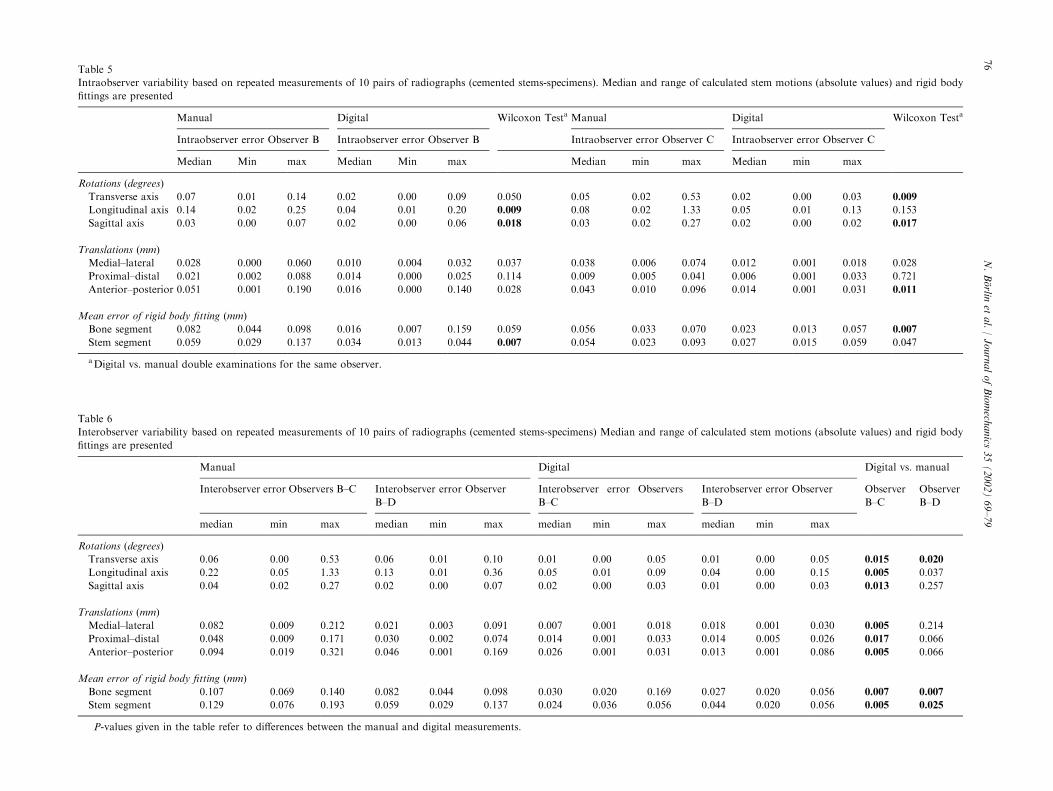
Table 5
Intraobserver variability based on repeated measurements of 10 pairs of radiographs (cemented stems-specimens). Median and range of calculated stem motions (absolute values) and rigid body
fittings are presented
Manual Digital Wilcoxon Testa Manual Digital Wilcoxon Testa
Intraobserver error Observer B Intraobserver error Observer B Intraobserver error Observer C Intraobserver error Observer C
Median Min max Median Min max Median min max Median min max
Rotations (degrees)
Transverse axis 0.07 0.01 0.14 0.02 0.00 0.09 0.050 0.05 0.02 0.53 0.02 0.00 0.03 0.009
Longitudinal axis 0.14 0.02 0.25 0.04 0.01 0.20 0.009 0.08 0.02 1.33 0.05 0.01 0.13 0.153
Sagittal axis 0.03 0.00 0.07 0.02 0.00 0.06 0.018 0.03 0.02 0.27 0.02 0.00 0.02 0.017
Translations (mm)
Medial–lateral 0.028 0.000 0.060 0.010 0.004 0.032 0.037 0.038 0.006 0.074 0.012 0.001 0.018 0.028
Proximal–distal 0.021 0.002 0.088 0.014 0.000 0.025 0.114 0.009 0.005 0.041 0.006 0.001 0.033 0.721
Anterior–posterior 0.051 0.001 0.190 0.016 0.000 0.140 0.028 0.043 0.010 0.096 0.014 0.001 0.031 0.011
Mean error of rigid body fitting (mm)
Bone segment 0.082 0.044 0.098 0.016 0.007 0.159 0.059 0.056 0.033 0.070 0.023 0.013 0.057 0.007
Stem segment 0.059 0.029 0.137 0.034 0.013 0.044 0.007 0.054 0.023 0.093 0.027 0.015 0.059 0.047
aDigital vs. manual double examinations for the same observer.
Table 6
Interobserver variability based on repeated measurements of 10 pairs of radiographs (cemented stems-specimens) Median and range of calculated stem motions (absolute values) and rigid body
fittings are presented
Manual Digital Digital vs. manual
Interobserver error Observers B–C Interobserver error Observer
B–D
Interobserver error Observers
B–C
Interobserver error Observer
B–D
Observer
B–C
Observer
B–D
median min max median min max median min max median min max
Rotations (degrees)
Transverse axis 0.06 0.00 0.53 0.06 0.01 0.10 0.01 0.00 0.05 0.01 0.00 0.05 0.015 0.020
Longitudinal axis 0.22 0.05 1.33 0.13 0.01 0.36 0.05 0.01 0.09 0.04 0.00 0.15 0.005 0.037
Sagittal axis 0.04 0.02 0.27 0.02 0.00 0.07 0.02 0.00 0.03 0.01 0.00 0.03 0.013 0.257
Translations (mm)
Medial–lateral 0.082 0.009 0.212 0.021 0.003 0.091 0.007 0.001 0.018 0.018 0.001 0.030 0.005 0.214
Proximal–distal 0.048 0.009 0.171 0.030 0.002 0.074 0.014 0.001 0.033 0.014 0.005 0.026 0.017 0.066
Anterior–posterior 0.094 0.019 0.321 0.046 0.001 0.169 0.026 0.001 0.031 0.013 0.001 0.086 0.005 0.066
Mean error of rigid body fitting (mm)
Bone segment 0.107 0.069 0.140 0.082 0.044 0.098 0.030 0.020 0.169 0.027 0.020 0.056 0.007 0.007
Stem segment 0.129 0.076 0.193 0.059 0.029 0.137 0.024 0.036 0.056 0.044 0.020 0.056 0.005 0.025
P-values given in the table refer to differences between the manual and digital measurements.
N.B. orlin
etal./JournalofBiomech
anics
35(2002)69–79
76
knowledge, our results are so far the only ones to showincreased precision over the manual technique in aclinical setting. It should be pointed out that theseresults are based on a certain level of film quality andscanning technique. Should these factors be changedand especially against the poorer side our results wouldprobably not be valid.
In radiostereometry the error depends on a number offactors. When the uniplanar technique is used the erroris usually largest for motions which are most parallel tothe X-ray beams (Woltring et al., 1985). In our studythis direction most closely corresponded to the anterior/posterior translations. In the manual measurements theerrors were largest in this direction, in the digitalevaluations the magnitude of this error was closer tothe medial/lateral translations.
The overall precision of radiostereometry depends onthe number and scatter of markers, the quality of thecalibration cages, the radiographs and the equipmentused to measure the stereoradiographs. The last twofactors will influence the possibility to properly identifythe marker centre. In manual measurements individualfactors related to the observer are added. The definitiveposition of a marker is decided visually by adjusting thecamera position until the marker projection coincideswith the marked centre of the attached display monitor.The eyesight of a person is influenced by factors likebrightness, ambient light, and physical condition, whichwill show a certain variation. It is important that theobserver is comfortably seated with the televisionmonitor at eye level to reduce parallax errors. If oneobserver is measuring radiographs with a consistenterror, the deviations may be a negligible factor in themanual measurement of a complete series of radio-graphs, because the errors will even out.
Our study has shown that the errors of the digitaltechnique are at least as small as for the manual one. Inthe future digital radiography will become the routineprocedure in most hospitals. It will be possible to obtaindigital data directly from film plates or digital potters,which most probably will reduce the evaluation time.Each step in such an evolution should, however, beaccompanied by continuous studies of the precision ofthe method to assure that no deterioration of itsprecision occurs. When clinical studies run over longtime periods and different examiners might becomeinvolved it is probably preferable to use the digitaltechnique because it seems to ascertain a low inter-observer error.
Our digitised technique has so far not implied areduction of the total measurement time if the scanningtime is included. However, given the time and effortspent operating and examining the patient, the measure-ment time is small in comparison. The final part of theevaluation procedureFthe motion analysisFwill mostlikely benefit from the higher measurement precision.
Low measurement errors reduce the risk of erroneousmarker couplings between images and examinations andthe correction of such errors are often time consuming.In the future, the use of digitised radiography and furtherdevelopment of the software can be expected to reducethe measurement time. The digital RSA technique allowsmarkers to be corrected and added independently ofother markers in the same image, which is an importantadvantage. With manual measurements the whole imagemust be re-measured. Other timesaving benefits with ourmethod include the automated location of most cagemarkers and points on the edge of the femoral head.Some recent, not yet fully evaluated improvements of themeasurements are fully automated measurements of thecage markers, filtering of image regions to find candidatemarkers, and the use of previous examinations to locateand label markers correctly. For some complicatedimages, where e.g. presence of metallic edges withindentations or cerclage wires will create complicatedimages due to over-projections, user support will nowand then become necessary. However, in the majority ofcases we believe that these improvements will reduce themeasurement time to a few minutes on contemporarycomputer hardware.
Acknowledgements
This study was funded by the Swedish Institute ofApplied Mathematics (ITM), Swedish Medical ResearchCouncil (MFR K97-17X-07941-11B), Ingabritt andArne Lundbergs Research Foundation and F!elixNeubergh Research Foundation.
Appendix A. Models
Marker
The marker is modelled with a rotationally symmetricsigmoid function
fm ðx; yÞ ¼ k=ð1þ exp ð�bðd � aÞÞÞ;
d ¼ffiffiffiffiffiffiffiffiffiffiffiffiffiffiffiffiffiffiffiffiffiffiffiffiffiffiffiffiffiffiffiffiffiffiffiffiffiffiffiffiffiffiðx� xcÞ
2 þ ðy� ycÞ2
q;
where d is the distance to the marker centre (xc, yc), a isthe marker full width, half-maximum, k is the markerintensity, and b corresponds to the marker contrast.
Edge
The edge is similarly modelled with a sigmoidfunction
fe ðx; yÞ ¼ ke=ð1þ exp ð�be ðd � aeÞÞÞ;
d ¼ ðx� xrÞcos dþ ðy� yrÞsin d;
N. B .orlin et al. / Journal of Biomechanics 35 (2002) 69–79 77
where d is the edge-orthogonal distance to a referencepoint ðxr; yrÞ; typically the marker centre, ae is thedistance between the edge and the reference point, ke isthe edge strength, and be is the slope of the edge.
Background
The background is modelled with a plane
fp ðx; yÞ ¼ aþ bxþ cy;
to allow for a linear gradient in the image.
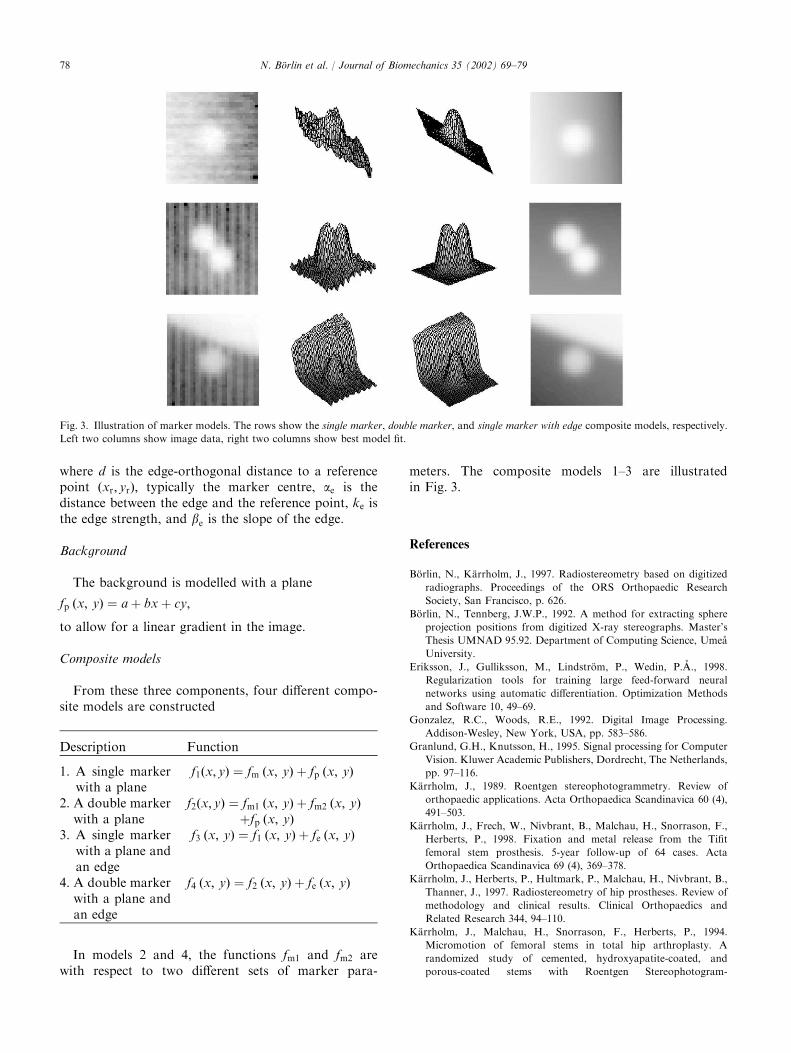
Composite models
From these three components, four different compo-site models are constructed
Description Function
1. A single markerwith a plane
f1ðx; yÞ ¼ fm ðx; yÞ þ fp ðx; yÞ
2. A double markerwith a plane
f2ðx; yÞ ¼ fm1 ðx; yÞ þ fm2 ðx; yÞþfp ðx; yÞ
3. A single markerwith a plane andan edge
f3 ðx; yÞ ¼ f1 ðx; yÞ þ fe ðx; yÞ
4. A double markerwith a plane andan edge
f4 ðx; yÞ ¼ f2 ðx; yÞ þ fe ðx; yÞ
In models 2 and 4, the functions fm1 and fm2 arewith respect to two different sets of marker para-
meters. The composite models 1–3 are illustratedin Fig. 3.
References
B .orlin, N., K.arrholm, J., 1997. Radiostereometry based on digitized
radiographs. Proceedings of the ORS Orthopaedic Research
Society, San Francisco, p. 626.
B .orlin, N., Tennberg, J.W.P., 1992. A method for extracting sphere
projection positions from digitized X-ray stereographs. Master’s
Thesis UMNAD 95.92. Department of Computing Science, Ume(a
University.
Eriksson, J., Gulliksson, M., Lindstr .om, P., Wedin, P. (A., 1998.
Regularization tools for training large feed-forward neural
networks using automatic differentiation. Optimization Methods
and Software 10, 49–69.
Gonzalez, R.C., Woods, R.E., 1992. Digital Image Processing.
Addison-Wesley, New York, USA, pp. 583–586.
Granlund, G.H., Knutsson, H., 1995. Signal processing for Computer
Vision. Kluwer Academic Publishers, Dordrecht, The Netherlands,
pp. 97–116.
K.arrholm, J., 1989. Roentgen stereophotogrammetry. Review of
orthopaedic applications. Acta Orthopaedica Scandinavica 60 (4),
491–503.
K.arrholm, J., Frech, W., Nivbrant, B., Malchau, H., Snorrason, F.,
Herberts, P., 1998. Fixation and metal release from the Tifit
femoral stem prosthesis. 5-year follow-up of 64 cases. Acta
Orthopaedica Scandinavica 69 (4), 369–378.
K.arrholm, J., Herberts, P., Hultmark, P., Malchau, H., Nivbrant, B.,
Thanner, J., 1997. Radiostereometry of hip prostheses. Review of
methodology and clinical results. Clinical Orthopaedics and
Related Research 344, 94–110.
K.arrholm, J., Malchau, H., Snorrason, F., Herberts, P., 1994.
Micromotion of femoral stems in total hip arthroplasty. A
randomized study of cemented, hydroxyapatite-coated, and
porous-coated stems with Roentgen Stereophotogram-
Fig. 3. Illustration of marker models. The rows show the single marker, double marker, and single marker with edge composite models, respectively.
Left two columns show image data, right two columns show best model fit.
N. B .orlin et al. / Journal of Biomechanics 35 (2002) 69–7978
metric analysis. Journal of Bone and Joint Surgery 76A (11),
1692–1705.
Nivbrant, B., K.arrholm, J., S .oderlund, P., 1999. Increased migration
of the SHP prostheses. Radiostereometric comparison with the
Lubinus Sp2 design in 40 cases. Acta Orthopaedica Scandinavica
70 (6), 569–577.
Nystr .om, L., 1986. Approximationsrutiner f .or stereor .ontgenanalys
(Approximation routines for Radiostereometric Analysis). Mas-
ter’s Thesis UMNAD 29.86. Institute of Information Processing,
Ume(a University, in Swedish
Nystr .om, L., S .oderqvist, I., Wedin, P. (A., 1994. A note on some
identification problems arising in roentgen stereophotogrammetric
analysis. Journal of Biomechanics 27 (10), 1291–1294.
Østgaard, S.E., Gottlieb, L., Toksvig-Larsen, S., Lebech, A., Talbot,
A., Lund, B., 1997. Roentgen stereophotogrammetric analysis
using computer-based image-analysis. Journal of Biomechanics 30
(9), 993–995.
Selvik, G., 1989. Roentgen Stereophotogrammetry. A method for the
study of the kinematics of the skeletal system. Thesis, University of
Lund, Lund, Sweden 1974. Reprint: Acta Orthopaedica Scandina-
vica, Supplement 232.
S .oderqvist, I., Wedin, P. (A., 1993. Determining the movements of the
skeleton using well-configured markers. Journal of Biomechanics
26, 1473–1477.
Talmage, D., Noble, A., Zisserman, A., 1995. Uncalibrated X-ray
stereo reconstruction. In: Pycock, D. (Ed.), Proceedings of the
sixth British Machine Vision Conference. BVMA Press, Guildford,
UK, pp. 187–196.
Thanner, J., Freij-Larsson, C., K.arrholm, J., Malchau, H., Wessl!en,
B., 1996. Evaluation of bonelocs. Chemical and mechanical
properties, and a randomized clinical study of 30 total
hip arthroplasties. Acta Orthopaedica Scandinavica 66 (3),
207–214.
Vrooman, H.A., Valstar, E.R., Brand, G.J., Admiraal, D.R., Rozing,
P.M., Reiber, J.H.C., 1998. Fast and accurate automated
measurements in digitized stereophotogrammetric radiographs.
Journal of Biomechanics 31, 491–498.
Wang, S., Jones, N.B., Richardson, J.B., Klaassens, E., 1996.
Optimised method for locating reference markers in r .ontgen
stereophotogrammetric analysis of orthopaedic radiographs. Med-
ical and Biological Engineering and Computing 34, 88–92.
Woltring, H.J., Huiskes, R., De Lange, A., Veldpaus, F.E., 1985.
Finite centroid and helical axis estimation from noisy landmark
measurements in the study of human joint kinematics. Journal of
Biomechanics 18, 379–389.
N. B .orlin et al. / Journal of Biomechanics 35 (2002) 69–79 79