Embed Size (px)
Citation preview
1
The Practice of Survey Research: Changes and Challenges
D. Sunshine Hillygus
Department of Political Science
Duke University
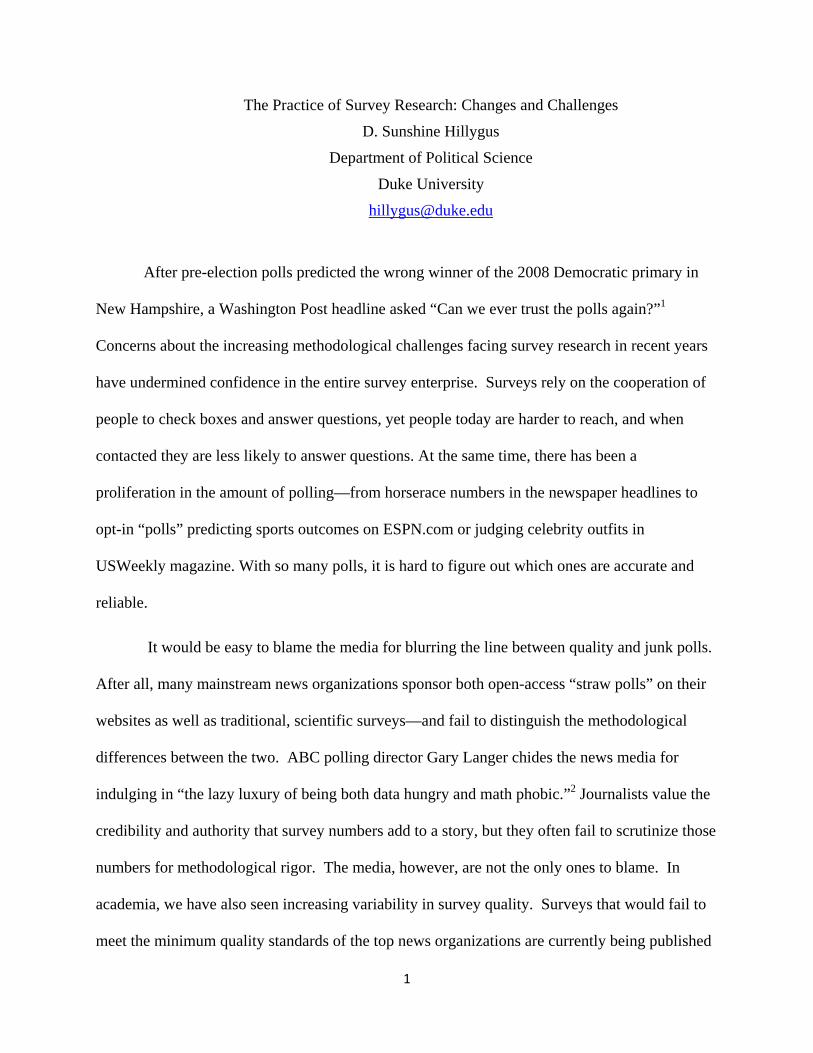
After pre-election polls predicted the wrong winner of the 2008 Democratic primary in
New Hampshire, a Washington Post headline asked “Can we ever trust the polls again?”1
Concerns about the increasing methodological challenges facing survey research in recent years
have undermined confidence in the entire survey enterprise. Surveys rely on the cooperation of
people to check boxes and answer questions, yet people today are harder to reach, and when
contacted they are less likely to answer questions. At the same time, there has been a
proliferation in the amount of polling—from horserace numbers in the newspaper headlines to
opt-in “polls” predicting sports outcomes on ESPN.com or judging celebrity outfits in
USWeekly magazine. With so many polls, it is hard to figure out which ones are accurate and
reliable.
It would be easy to blame the media for blurring the line between quality and junk polls.
After all, many mainstream news organizations sponsor both open-access “straw polls” on their
websites as well as traditional, scientific surveys—and fail to distinguish the methodological
differences between the two. ABC polling director Gary Langer chides the news media for
indulging in “the lazy luxury of being both data hungry and math phobic.”2 Journalists value the
credibility and authority that survey numbers add to a story, but they often fail to scrutinize those
numbers for methodological rigor. The media, however, are not the only ones to blame. In
academia, we have also seen increasing variability in survey quality. Surveys that would fail to
meet the minimum quality standards of the top news organizations are currently being published
2
in social science journals.3 Some scholars justify their use by arguing that because all surveys
are flawed it is just as valid to use inexpensive, opt-in samples. Others are simply unaware of
how to evaluate survey quality or naive about the way survey design decisions can affect the
validity of their research conclusions.
In this essay, I will outline some of the key methodological challenges in conducting,
using, and evaluating surveys as a measure of public opinion. This essay has three “take-home”
messages: First, I will explain why all surveys are not created equal. Some surveys should be
trusted more than others, and, unfortunately, it is not sufficient to make assumptions about
survey quality based on polling topic (say, politics rather than entertainment), sample size, or
sponsorship. The total survey error perspective provides a framework for evaluating how various
aspects of the survey method can shape survey accuracy and reliability. Second, I hope this essay
makes clear that NO survey is perfect. While there is significant variation in survey quality, not
even our “gold standard” surveys like the American National Election Study should be immune
from scrutiny. Finally, I will appeal for journalists and scholars at all levels to provide enough
information about their survey methods for readers to assess the knowledge claims being made.
While no survey is perfect, increased transparency should make clear that not all survey methods
are equal.
The Data Stork Myth
Despite increasing concerns about survey quality, surveys remain the cornerstone of
research on economic, political, and social phenomena across academic, commercial, nonprofit,
and government sectors. When properly designed, surveys are a powerful tool for collecting
information about the attitudes, characteristics, and behaviors of individuals, households, and
3
organizations. Too often, however, scholars and journalists tend to treat survey data as if it has
been delivered by a data stork, failing to question where they came from, how they were
produced, and by what methodology. Yet a survey involves a number of different steps and
decisions, and with each one, error can be introduced into the resulting survey statistics. A
significant part of the difficulty in establishing survey quality standards is not that our scientific
understanding of survey methodology is flawed or inadequate, but rather that scientific research
in survey methodology has not permeated the broader community of survey consumers. In the
survey methodology literature, scholars have adopted a total survey error perspective that
recognizes the need to consider a variety of different types of error in evaluating survey quality.4
A high quality survey is one that tries to minimize all sources of error within the inevitable time
and budgetary constraints of the project. I will discuss some of these sources—sampling error,
coverage error, nonresponse error, and measurement error—highlighting specific challenges and
controversies. I first provide an overview of the survey process and introduce some key
terminology.
Overview of the Survey Process
When we think of surveys, we often have in mind the resulting survey statistics. A recent
news story, citing a CNN poll, reported that 67% of Americans favor allowing gays and lesbians
to openly serve in the military. Such a conclusion about public opinion is the product of a very
specific survey process that involves a series of consequential methodological decisions and
assumptions. In small print at the end of the article, we find some of that methodological
information: “Interviews with 1,010 adult Americans were conducted by residential telephone on
September 21-23, 2010. The margin of sampling error is plus or minus 3 percentage points.” In
4
this section, I will outline the basic process involved in reaching conclusions about public
opinion on the basis of a smaller sample of respondents.
The first step in the survey process is deciding on the target population; that is, the group
to whom the survey is intended to generalize. CNN obviously did not ask all Americans their
opinion on this issue; rather, they surveyed 1,010 individuals that they believed were
representative of the broader American public. Their target population was the entire adult US
population.5 Pre-election polls, in contrast, typically want to generalize to the US voting
population—adult citizens who will cast a ballot in the election (the so-called “likely voters”).
Other surveys are interested in even more specialized populations; for example, a recent survey
on alcohol and drug use at Duke University was meant to represent only those undergraduates
currently enrolled at the university.
After determining the target population, the next step in the survey process is specifying a
sample frame—lists or procedures that identify all elements of the target population. The sample
frame may be a list of telephone numbers, maps of areas in which households can be found, or a
procedure (like random digit dialing) that could identify the target population. At their simplest,
sampling frames just list the phone numbers, addresses, or emails of individuals in the target
population, such as the list of student email addresses for the Duke University students survey.
In the case of the CNN poll, random digit dialing was likely used. In random digit dialing, a
computer generates a random set of seven-digit numbers (in this case, excluding nonresidential
and cellular exchanges). Compared to using a telephone book or other list of telephone numbers,
an RDD sample frame has the advantage of including unlisted numbers.
Often, the list will not perfectly capture the entire target population. For example, the
target population of the CNN poll is U.S. adults, but the sample frame excludes individuals
5
living in households without landline telephones. This can result in coverage error—the error
that arises when the sampling approach is not representative of the target population. That is,
when there is a failure to give some persons in the target population a chance of selection into the
sample. There is a growing concern that the recent rise in the number of cell only households
threatens the generalizability of telephone surveys – a coverage error concern.
Once a sample frame has been identified, individual cases are randomly selected to be in
the survey. Because the survey is administered to a sample, rather than all, of the target
population, it is subject to random sampling error. This is the “margin of error” mentioned in the
methodological disclosure of the CNN poll. Of course, these selected cases are just the people
asked to be in the survey—many of them will be difficult to reach, will refuse to participate, or
will drop out during the survey. Nonresponse error occurs when the individuals invited to take
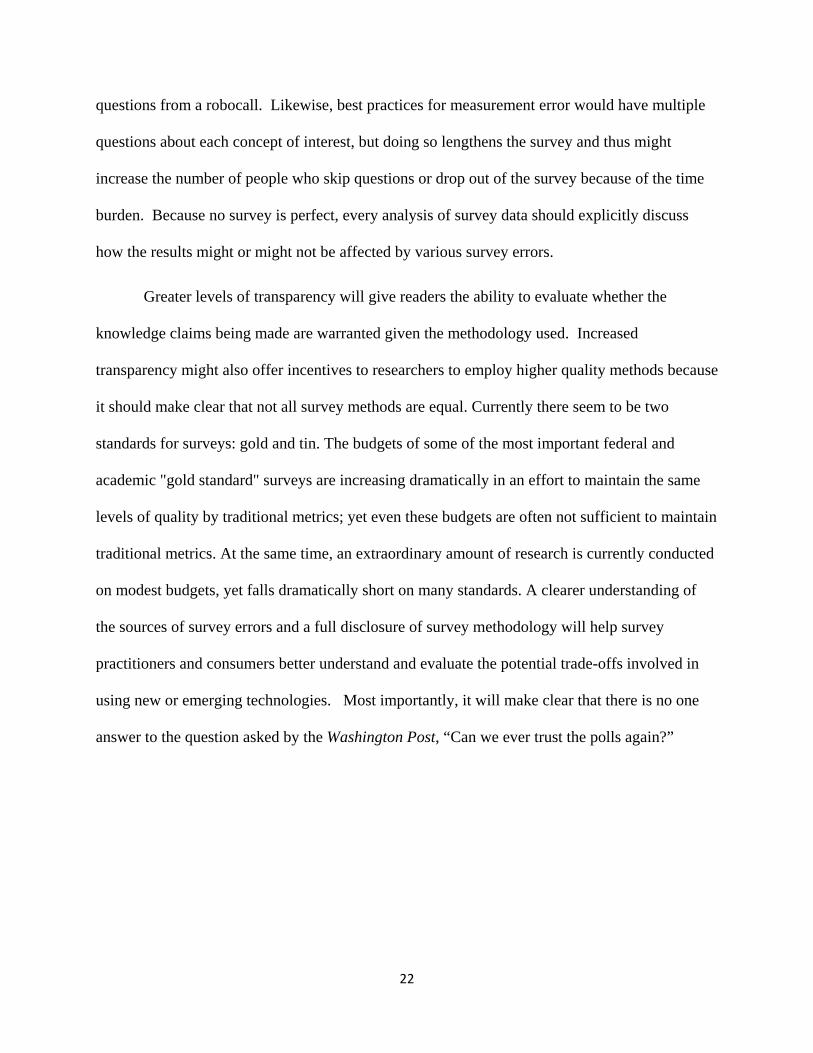
the survey do not actually take the survey. Finally, the respondents are the subsample of the
selected cases who actually complete the survey and on which the analysis is conducted.6
Figure 1 illustrates the key steps in the survey sampling process using the CNN poll as an
example. As shown in the figure, each step in the survey sampling process can introduce
uncertainty and bias in the resulting survey statistics. These errors can threaten the ability to
generalize from the sample to the target population.
[FIGURE 1 HERE]
Figure 1: Steps and Potential Error in Survey Sampling Process, CNN poll example
Traditionally, survey users have focused on sampling error as the metric for evaluating
survey quality. As mentioned, sampling error represents the uncertainty or imprecision in
6
estimates based on random chance that occurs simply because we observe data on a sample of
individuals in the population rather than on every individual in the population. Sampling error is
often reported as margin of error. In the case of the CNN poll, we should interpret the results as
showing that public approval for gays serving openly in the military is 67% +/- 3 percentage
points. This tells us how precise we are in our estimate of public opinion on this issue—the
larger the margin of error, the less confidence we have in our estimate. The literal interpretation
of the margin of error is that, in repeated sampling, we would expect the true level of public
support for gays in the military to fall between 64% and 70% in 95 out of 100 samples.
Critically, the size of sampling error depends only on the size of the sample collected—
the larger the sample, the less uncertainty in the estimate. Sampling error does not tell us about
whether our estimates are biased or inaccurate. Thus, despite the traditional focus on sampling
error, it may well be the least important aspect of survey error; for a survey of a given size
sampling error simply “is what it is”, whereas other sources of error—coverage error,
nonresponse error, measurement error—can be minimized through various design decisions.7
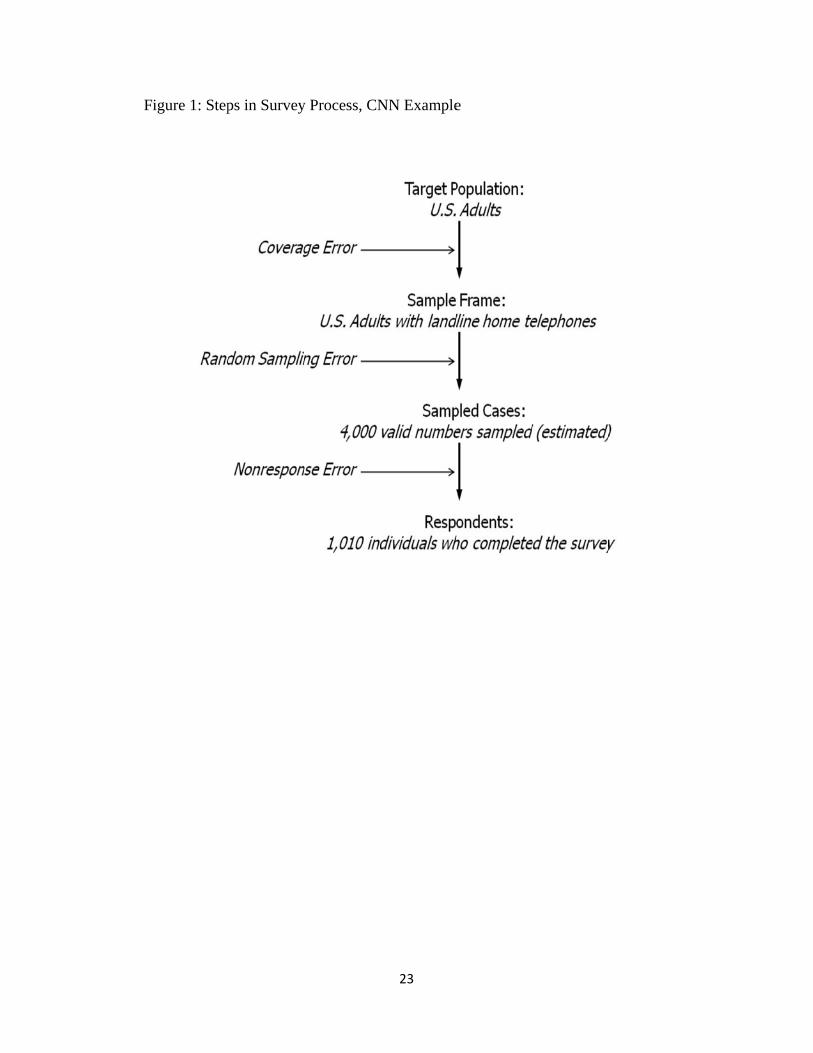
The total survey error perspective highlights the need to take into account both sampling
error and nonsampling error in evaluating survey quality. Figure 2, reproduced from Herb
Weisberg’s textbook The Total Survey Error Approach, summarizes the various sources of error
in the survey process.8 This perspective highlights the need to evaluate additional sources of
error in the survey sampling process—coverage error and nonresponse error. At the same time,
it recognizes that the substantive conclusions drawn from surveys also depend on the
measurement process, in which scholars have to make decisions about how to operationalize and
measure their theoretical constructs and then have to make decisions about how to code and
7
adjust the resulting data. In the remained of this essay, I will use the total survey perspective to
outline some of the key contemporary threats to survey quality.
[FIGURE 2 HERE]
Figure 2: The Total Survey Error Perspective (from Weisberg 2005)
Probability vs. Non-probability sampling
Surveys are typically conducted in order to make generalizations about a target
population from data collected from a smaller subset—the sample. The ability to generalize from
the sample to the population rests on the use of probability sampling. Probability samples are
ones that use some form of random selection. As pollsters like to joke, “If you don't believe in
random sampling, the next time you have a blood test tell the doctor to take it all.” Random
selection of respondents means that errors—both those observed and unobserved—cancel out
over the long run. In order to have a random selection method, it’s necessary for each member
of the target population to have a chance of being selected into the sample. With a random
probability sample, the results will be close (within the “margin of error”) to what we would
have found had we interviewed the entire population. George Gallup liked to compare sampling
public opinion to sampling soup – “as long as it was well-stirred pot, you only need a single sip
to determine the taste.”
In contrast, nonprobability samples select respondents from the target population in some
nonrandom manner, so that some members of the population have no chance of selection. For
example, many media organizations invite visitors to their websites to answer “straw polls”.
This type of nonprobability sampling is often called convenience sampling because members of
8
the population are chosen based on their relative ease of access. A variant, quota sampling,
identifies a set of groups (e.g., men, women, 18-25 year olds, 26-40 year olds, etc) and specifies
a fixed number of people to be recruited for each group. Interviewing then proceeds until the
quota is reached for each group. For example, convenience samples might be designed so that
they match the population proportions on age, gender, and socio-economic status. Unfortunately,
some people will be more likely to visit the website than others and some website visitors will be
more likely to participate than others, so the results are not representative of any broader
population—even if they look demographically similar.
The Literary Digest polling fiasco of 1936 is the classic example of how nonprobability
samples can lead to biased conclusions. The popular magazine had correctly predicted the
winner in the previous 5 presidential elections, but in 1936 incorrectly predicted that Alf Landon
would beat FDR in that year's election by 57 to 43 percent (FDR won with 60.8 percent of the
popular vote). The Digest had mailed over 10 million survey questionnaires to their subscribers
and to names drawn from lists of automobile and telephone owners. More than 2.3 million
people responded, but it turns out that, in 1936, those who owned automobiles, telephones, or
had the disposable income to subscribe to a magazine were not a random cross-section of the
voting public.
More recently, a Scientific American online poll illustrated the perils of nonprobability
surveys. The popular science magazine’s online poll asking their readers about climate change
attracted the attention of climate skeptic bloggers who directed their own readers to participate in
the poll. The resulting poll results found that 80% of respondents denied climate change and
84% answered that “The Intergovernmental Panel on Climate Change is… "A corrupt
organization, prone to groupthink, with a political agenda." Although it’s not unusual for online
9
polls to be hijacked by activists, these skewed polling results have since been reported in a Wall
Street Journal editorial and included in Congressional testimony with no mention of the
unscientific methodology.9
Probability sampling allows us to calculate sampling error so we can estimate how much
our sample might differ from the target population (the margin of error). In nonprobability
sampling, in contrast, the degree to which the sample differs from the population remains
unknown and unknowable. Even if the sample looks demographically similar to the target
population (as with quota sampling), we have no way to evaluate if the sample is representative
on unobserved characteristics.
One of the key contemporary debates in public opinion research regards the quality of
nonprobability-based online panel surveys. New technologies have both made probability
sampling more difficult and made nonprobability sampling—especially with online panels—easy
and inexpensive. The main concern with internet based surveys is not just that they will miss
those without internet access—internet usage rates are quickly approaching the same coverage
rate of landline telephones. The key hurdle is that, in most cases, it is difficult to define an
appropriate sample frame from which to draw a random sample that is a reasonable
approximation of the target population.10 In other words, there is typically no list of internet
users from which a random sample can be drawn. While not a problem in cases where a
population list exists and is reachable online (e.g., email addresses of students at a university),
for general population surveys, the nature of the Internet means that “frames of Internet users in
a form suitable for sampling do not – and likely will not – exist.”11
This issue is a source of confusion for academics and journalists alike. For one, not all
Internet surveys are the same. In cases where the population list is known and reachable online
10
(e.g., email addresses of students at a university or business CEOs), web surveys are
appropriate—even preferable.12 It is also possible to draw a probability-based sample using a
traditional technique (such RDD or address-based sampling), and then provide internet access to
those without it. This is the approach of the survey firm, Knowledge Networks. But the majority
of web-based surveys, including those by well-known firms like YouGov/Polimetrix, Harris
Interactive, and Zogby Internet, rely on nonprobability online panels. In such cases the
respondents are (nonrandomly) recruited through a variety of techniques: website
advertisements, targeted emails, and the like.13 Individuals are then signed up in an online panel
in which they are regularly invited to answer surveys in exchange for financial incentives or
other awards. Even if a pull is randomly selected from this online panel, the pool of potential
respondents are all people who initially “opted in” to the respondent pool.
A second source of confusion is that nonprobability samples are often claimed to be
“representative” because the sample looks like the target population on a set of observed
characteristics; often through adjustments (e.g., weighting and/or matching) of the opt-in sample
to census benchmarks.14 These surveys are then reported to be comparable to population
estimates on race, age, gender, and the like.
Inherently, however, there are only a limited number of benchmarks on which the sample
can be compared, so these samples still require the untestable assumption that unmatched
characteristics are ignorable.15 And research has shown, for instance, that those who volunteer
to participate in surveys are often more informed, knowledgeable, and opinionated about the
survey topic even if they look demographically similar to the general population.16 A recent
taskforce of the American Association for Public Opinion Research (AAPOR), the leading
professional organization of public opinion and survey research professionals in the U.S., tackled
11
the issue of online panels and forcefully concludes that “There currently is no generally accepted
theoretical basis from which to claim that survey results using samples from nonprobability
online panels are projectable to the general population…Claims of ‘representativeness’ should be
avoided”. Pollsters Gary Langer and Jon Cohen offer a similar, if more colorful, conclusion:
“anyone following the polls is probably finding it increasingly difficult to separate signal from noise….In reality, there are good polls and bad, reliable methods and unreliable ones. To meet reasonable news standards, a poll should be based on a representative, random sample of respondents; "probability sampling" is a fundamental requirement of inferential statistics, the foundation on which survey research is built. Surrender to "convenience" or self-selected samples of the sort that so many people click on the Internet, and you're quickly afloat in a sea of voodoo data….Probability sampling has its own challenges, of course. Many telephone surveys are conducted using techniques that range from the minimally acceptable to the dreadful. When it's all just numbers, these, too, get tossed into the mix, like turpentine in the salad dressing.”17
To be sure, there are many research questions for which a probability sample will not be
a priority. For example, scholars conducting survey experiments are often more concerned with
internal validity (a clear causal effect) than external validity (generalizability). Likewise,
focused exploratory research might use a nonprobability sample to generate hypotheses or pilot
various measurements. There may also be times when the researcher simply wants to
demonstrate that a particular trait occurs in a population. These are all cases in which the
researcher does not intend to draw inferences to the broader population, so a nonprobability
sample can be a cost effective method for the research goals.
In sum, the validity of inferences from a sample to a larger population rests on random
probability sampling. In contrast, nonprobability samples—no matter their size—are not
generalizable because there is no way to know how respondents and nonrespondents might differ
across an infinite number of characteristics related to the outcome of interest. Procedures such as
quota sampling, matching, or weighting that ensure a convenience sample looks like the target
12
population on a set of observed characteristics inherently assume that unobserved characteristics
do not influence the phenomenon being studied—an often unrealistic, untestable and unstated
assumption. This does not mean that nonprobability samples should never be conducted, but
given the fundamental distinction between probability and nonprobability samples, it is critical
that scholars are transparent about the methodology being used. AAPOR, for example,
recommends the following wording when documenting surveys with non-probability samples:
“Respondents for this survey were selected from among those who have [volunteered to participate/registered to participate in (company name) online surveys and polls]. The data (have been/have not been) weighted to reflect the demographic composition of (target population). Because the sample is based on those who initially self-selected for participation [in the panel] rather than a probability sample, no estimates of sampling error can be calculated. All sample surveys and polls may be subject to multiple sources of error, including, but not limited to sampling error, coverage error, and measurement error.”
Unfortunately, there is a deep and growing schism in academia, journalism, and politics over the
value of nonprobability samples. On one side are those who insist that statistical theory renders
all nonprobability samples useless; on the other side are those who believe that nonprobability
samples likely get us “close enough” to the right answer. Where ever one falls in this debate, we
have an obligation to fully disclose the research methodology being used. At minimum, we
should explicitly discuss the assumptions underlying our substantive conclusions.
Nonresponse error:
Nonresponse errors refer to errors introduced by the practical reality that surveys almost never
collect data from all sampled cases. People are often difficult to reach or they refuse to
participate. In fact, most of us have probably contributed to nonresponse in a survey if we have
ever hung up the phone when we realized it was a pollster was on the other end of the line
13
interrupting our dinner. There has been considerable focus on nonresponse error in recent
decades and rightfully so. In recent decades, response rates have declined precipitously across
government, academic, and media surveys. Given the barrage of telemarketing calls, spam, and
junk mail, people are increasingly hesitant to participate in surveys. And technologies like
voicemail and caller id make it easier than ever to avoid intrusions from strangers.
The most common marker for nonresponse error has traditionally been the survey
response rate. In its most basic form, response rate is calculated as the number of people you
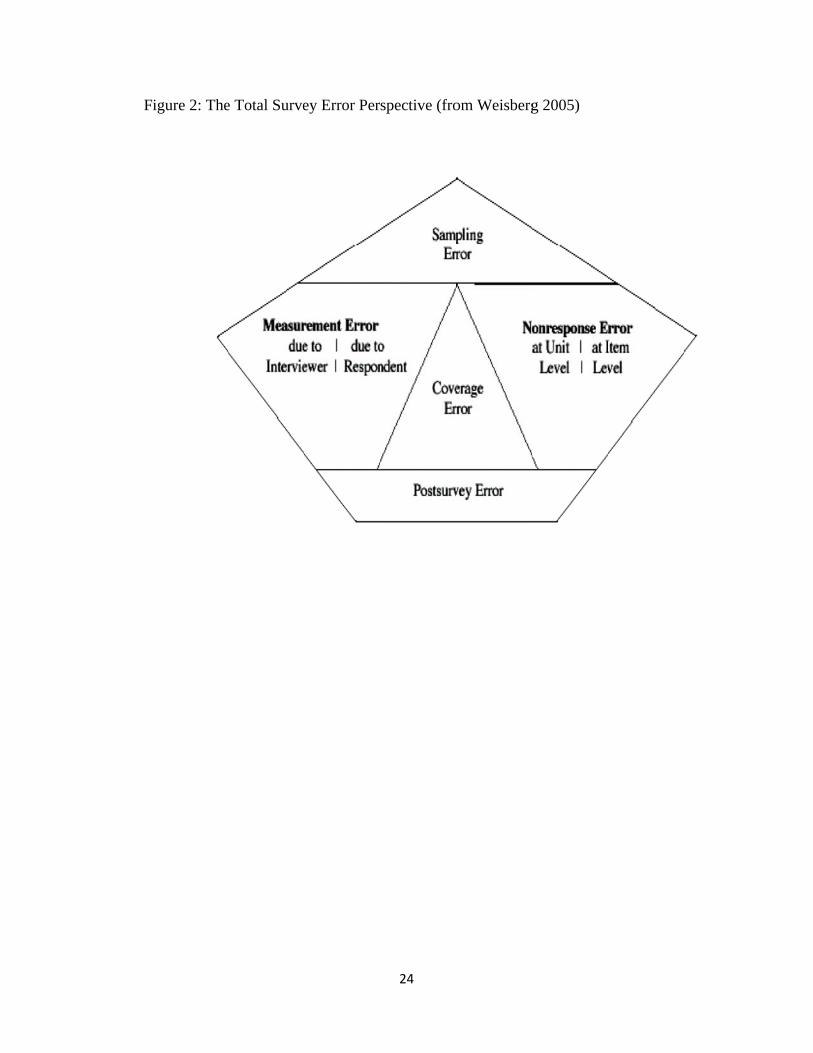
actually surveyed divided by the number of people you tried to survey. Figure 3 graphs the
response rates in the General Social Survey and the American National Election Study in recent
years, and illustrates that declining response rates are affecting even the high-budget “gold
standard” academic studies.18 For example, the ANES response rate declined from 74 percent
in 1992 to less than 60 percent in 2008. Although not shown in the graph, these declines are
largely due to increasing rates of refusal. For example, the ANES refusal rate increased from
less than 15% in 1972 to over 24% in 2004. Response rates for media polls have been especially
hard hit by declining cooperation. Although the response rate was not reported for the CNN poll
example, it is unlikely that survey with a three day field period exceeded a 25% response rate
(1,010/4,000). In reality, many media polls—especially those conducted as overnight “snapshot”
polls on a salient topic that may have a limited number of callbacks—now have response rates
that hover around 10%.
[FIGURE 3 HERE]
Figure 3: Response Rate Trends in Major Academic Surveys. Compiled from codebooks.19
The question is whether these lower response rates actually lessen data quality. Certainly,
low response rates of telephone polls are often used as justification for using nonprobability
14
samples. Some argue that the bias introduced by those who “opt out” from survey requests
(nonresponse) is no different from the bias introduced by people choosing to “opt in” to online
nonprobability panels. An increasing body of research has evaluated the link between response
rate and nonresponse bias, and, perhaps surprisingly, has concluded that low response rate by
itself does not indicate the results are inaccurate.20 Multiple studies have found that lower
response rates do not significantly reduce survey quality.21 Nonresponse bias depends not just
on the rate of nonresponse but the extent to which those who answer are different from those
who did not. So, a low response rate indicates a risk of lower accuracy, but does not guarantee it.
Thus, the nonprobability “opt-in” samples discussed above likely present a greater threat to
inferences about the target population than the declining response rates in probability samples.
The reassuring news on response rates does not mean we can ignore nonresponse error.
To the contrary, it remains a significant concern—we have just been using an incomplete metric
for evaluating its impact. In thinking about nonresponse error, it’s first worth clarifying that
nonresponse can be classified in two different categories: unit and item nonresponse. Unit
nonresponse is where an individual fails to take part in a survey. This is the basis of response
rate calculations. Another type of nonresponse, item nonresponse, occurs when the individual
answering the questionnaire skips a question, giving us incomplete data on an individual
respondent. Questions on income, for instance, are often susceptible to item nonresponse. Once
again, the key concern is with potential differences between nonrespondents and respondents.
For instance, in his book Silent Voices, Adam Berinsky shows that item nonresponse in racially
sensitive survey questions can reflect prejudicial sentiments.22
For both unit and item nonresponse, the most important step in reducing nonresponse bias
is to create an appropriately designed survey in the first place. Many of the fundamental design
15
decisions, including mode, interviewer characteristics, length of survey, question wording and
response options, can directly affect the extent of nonresponse bias. For example, research on
the 2004 exit polls found that using college-aged interviewers resulted in higher rates of
nonresponse among Republican voters compared to Democratic voters, thereby biasing estimates
of vote choice.23 Self-administered surveys (mail and internet) have higher levels of item
nonresponse than interviewer-administered surveys, but answers in self-administered surveys
tend to be more accurate because of reduced pressures to give a socially desirable answer.
Respondents are more likely to skip questions that are long, burdensome, confusing, vague, or
that do not provide the preferred response, so it becomes especially important that the
questionnaire itself follows best practice principles for the particular mode being used.
Again, while response rates are perhaps not the key marker of nonresponse bias, it is
nonetheless important for those conducting surveys to try to minimize nonresponse error and
those consuming surveys to consider the nature and extent of nonresponse bias in any reported
data.
Coverage Error:
One of the growing issues of concern about survey quality comes from coverage error. Coverage
error is the failure to give some persons in a target population a chance of being selected into the
sample, such as when those without internet access have no chance of ending up in an internet
survey. The extent of bias resulting from coverage error depends both on the rate of
noncoverage and difference between those covered by the survey and those not. So, if internet
users were no different from non-internet users on most dimensions then we might have
16
coverage error, but our resulting estimates could still accurately reflect the characteristics of the
target population we are interested in.
Much of the focus on coverage bias has concerned the impact of cell phone only
households on telephone surveys. It is widely recognized that there is a growing cellular only
population, so that surveys that omit people who are exclusively or primarily reached through
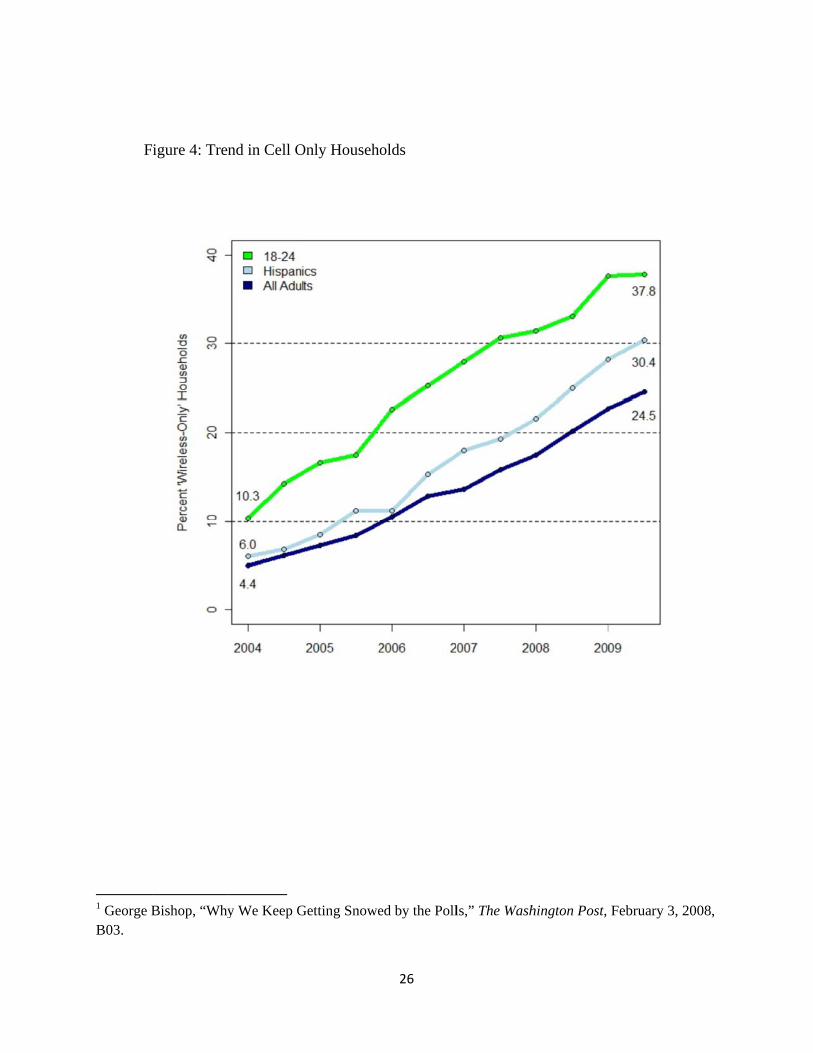
their cell phones may not be representative. Figure 4 shows the growth in cell phone only
households in the last few years. Cell phone usage is particularly prevalent among young people
and minorities—24.5% of the U.S. population is cell phone only, while 30.4% of Hispanics, and
37.8% of those age 18-24 live in houses with wireless only telephones. It is also the case that cell
phone only respondents often differ in their views than those with landline telephones. For
instance, research from the 2008 presidential campaign found that cell-phone only respondents
were significantly more likely to support Obama—60.5% of those with only a cell phone
reported voting for Obama, compared to his actual vote share of 52.9%.24
[FIGURE 4 HERE]
Figure 4: Trend in Cell only households. Source: National Health Interview Surveys
It is worth first pausing to explain why cell phone numbers are often excluded from
telephone surveys. Although there are some quality issues (e.g., blurry geographic associations,
shorter questionnaires possible, lower response rates), mainly it’s an issue of cost. Specifically,
the 1991 Telephone Consumer Protection Act (TCPA) prohibits the use of automated dialers for
all unsolicited calls to cell phones, including surveys. Pollsters typically use automated dialers—
a device that automatically calls telephone numbers until reaching a live respondent—because it
is much faster (and thus less expensive) than having interviewers manually dial the numbers.
17
To determine the extent of coverage bias introduced by excluding cell phone only
households we must take into account not only the difference in opinions between cell phone
only and landline response but also their expected proportion in the target population. For
example, support for Obama was higher among cell phone only individuals than the electorate at
large, but those who relied solely on cell phones were also significantly less likely to vote. Thus,
there was not as much bias in the polls as might otherwise be expected. Still, the problem is
worsening, and a 2010 Pew Research Center study found that landline samples "tend to slightly
underestimate support for Democratic candidates when compared with estimates from dual
frame landline and cell samples in polling."25 There is a related concern about the “cell phone
mostly crowd”, although there is limited research on this group to date. It is known that this
group is nearly impossible to reach on a landline, and they look quite different—highly educated,
white, homeowners, and married—from both the cell phone only and the other landline crowds.
Returning to the example of the CNN poll, cell phone only households were excluded
from the sample frame. Because younger age groups tend to have more liberal positions on gay
rights, we might suspect that the poll actually underestimates public support for allowing gays
and lesbians to serve openly in the military actually because younger age groups might not be
adequately represented. Given the clear implications of cell only households on the
generalizability of survey estimates, many top media organizations, including ABC News, CBS
News, New York Times—have started routinely including cell phone respondents in their
samples, despite the increased cost.
Measurement error
18
Thus far, we have focused on sources of error that shape the ability to generalize from a
sample of respondents to a population of interest. But the quality of a survey depends not only
on the ability to generalize, but also on the ability to accurately measure the theoretical concepts
of interest. Ideally, the survey questions result in measures that are both valid—they fully and
accurately measure the concept that is supposed to be measured—and reliable—they measure the
concept in a reproducible manner. Measurement error occurs when recorded responses to a
survey fail to reflect the true characteristics of the respondents, and it can influence both the
accuracy and reliability of our results.
There are many different sources of measurement error: the questionnaire, the data
collection method, the interviewer, and the respondent. Questionnaire factors like question
wording, question order, length of questions and questionnaire, number of response categories,
presence of a “don’t know” or middle response option can all influence measurement error. Even
very small differences in question wording can generate very different findings. For example,
asking about attitudes towards “assistance for the poor” generates much higher levels of support
than a question asking about attitudes towards “welfare”.26 In another example, party
identification questions that are otherwise identical besides the beginning phrase, either “In
politics today” or “Generally speaking”, result in entirely different conclusions regarding the
stability of partisanship.27
Measurement error can also be affected by the mode of survey administration (e.g.,
telephone, in-person, mail). A survey that uses an interviewer in the administration, for example,
can introduce measurement error from that interaction. Numerous studies have found that whites
express more liberal racial attitudes to black interviewers than to white interviewers.28
19
Finally respondents themselves introduce error based on their comprehension or
interpretation of the question in addition to any editing of the responses they might make because
of fears of disclosure, concerns about privacy, or a desire to give a response that would be
viewed favorably by others. People are especially reluctant to provide honest answers on
sensitive topics, like sexual history, drug use, or racial attitudes. Voter turnout is another
sensitive question—people tend to overreport voting because they want to appear to be good
citizens. Thus, the ANES does not simply ask “Did you vote in the 2008 election? (yes or no?).”
Rather, they attempt to reassure the respondent that it really is okay to admit to not voting:
“In talking to people about elections, we often find that a lot of people were not able to vote because they weren’t registered, they were sick, or they just didn’t have time. Which of the following statements best describes you:
1) I did not vote (in the election this November) 2) I thought about voting this time - but didn’t 3) I usually vote, but didn’t this time 4) I am sure I voted”
For those conducting their own surveys, it is worth remembering that substantive expertise on a
topic is not the only skill needed to conduct a survey. There is a rich body of research on the
nature and extent of measurement error in surveys, and emerging best practices for reducing that
error.29 The single best way to improve measurement is to do extensive pretesting of the survey
instrument.30 For instance, cognitive pretesting, in which draft survey questions are administered
for the purpose of collecting information about how people interpret and process the questions,
can be used to identify any questions that are difficult to interpret or that can be interpreted in
ways different from what the researcher intends. And for those introducing a new measure, it is
especially important to explicitly evaluate the operationalization of that measure for validity and
reliability. In this regard, political science as a field could take guidance from fields like
psychology or education, where it is standard practice to take measurement seriously.
20
For those using secondary survey data, there is often a tendency to take for granted that
the survey questions adequately measure the concepts of interest. However, many questions in
major infrastructure surveys were written before the development of rigorous question-wording
practices. Moreover, because over time inferences depend on having identical question wording,
recurring surveys like the American National Election Study a tension between the need for
continuity in question wording and the need for innovation to keep up with developing
knowledge in the field of survey methodology. Ultimately, we often must “work with what we
got,” but any analysis that uses survey research should pay careful attention to the potential for
measurement error.
Disclosure:
As the previous discussion highlights, there are many different threats to survey quality.
Ultimately, the ability to assess survey quality—across all sources of survey error—rests on
having sufficient information about the survey methodology. Although most academic journals
and media organizations do not have formal disclosure requirements in place, there are
increasing pressures on survey users to improve methodological transparency. In the last few
years, there have been at least two well-publicized incidents in which survey firms appear to
have made-up or manipulated survey results. The liberal blog, DailyKos, discovered that weekly
polling results they had paid for and featured from the organization Research 2000 (R2K) were
“largely bunk.”31 Likewise, blogger Nate Silver of fivethirtyeight.com concluded that pollster
Strategic Vision LLC was “disreputable and fraudulent.”32 AAPOR publicly reprimanded
Strategic Vision for failure to disclose basic methodological information about the studies. Not
long after, they announced a transparency initiative aimed at encouraging and making it as easy
21
as possible for survey firms to be transparent about their research methods. Basic standards for
minimal disclosure include reports of the following information about a survey:33
1. Who sponsored the survey, and who conducted it. 2. The exact wording of questions asked, including the text of any preceding instruction or explanation to the interviewer or respondents that might reasonably be expected to affect the response. 3. A definition of the population under study, and a description of the sampling frame used to identify this population. 4. A description of the sample design, giving a clear indication of the method by which the respondents were selected by the researcher, or whether the respondents were entirely self-selected. 5. Sample sizes and, where appropriate, eligibility criteria, screening procedures, and response rates computed according to AAPOR Standard Definitions. At a minimum, a summary of disposition of sample cases should be provided so that response rates could be computed. 6. A discussion of the precision of the findings, including estimates of sampling error, and a description of any weighting or estimating procedures used. 7. Which results are based on parts of the sample, rather than on the total sample, and the size of such parts. 8. Method, location, and dates of data collection.
With this basic information, readers can determine if the survey is a probability or nonprobability
sample, and thus whether the sample is generalizable to the population of interest. It also offers
some indication about the potential for nonsampling error, including coverage error, nonresponse
error, and measurement error.
Full methodological disclosure should make clear that every survey is flawed in some
way. There is no perfect survey design in part because there are inevitable trade-offs involved in
balancing the various sources of survey error. In reducing one source of survey error a
researcher could inadvertently increase another source of error. For example, new technologies
such as Interactive Voice Response (IVR) have the potential to reduce measurement bias
introduced by the interactions of human interviewers, but they simultaneously increase
nonresponse error or exacerbate coverage problems because people are less inclined to answer
22
questions from a robocall. Likewise, best practices for measurement error would have multiple
questions about each concept of interest, but doing so lengthens the survey and thus might
increase the number of people who skip questions or drop out of the survey because of the time
burden. Because no survey is perfect, every analysis of survey data should explicitly discuss
how the results might or might not be affected by various survey errors.
Greater levels of transparency will give readers the ability to evaluate whether the
knowledge claims being made are warranted given the methodology used. Increased
transparency might also offer incentives to researchers to employ higher quality methods because
it should make clear that not all survey methods are equal. Currently there seem to be two
standards for surveys: gold and tin. The budgets of some of the most important federal and
academic "gold standard" surveys are increasing dramatically in an effort to maintain the same
levels of quality by traditional metrics; yet even these budgets are often not sufficient to maintain
traditional metrics. At the same time, an extraordinary amount of research is currently conducted
on modest budgets, yet falls dramatically short on many standards. A clearer understanding of
the sources of survey errors and a full disclosure of survey methodology will help survey
practitioners and consumers better understand and evaluate the potential trade-offs involved in
using new or emerging technologies. Most importantly, it will make clear that there is no one
answer to the question asked by the Washington Post, “Can we ever trust the polls again?”
F
igure 1: Stepps in Surveyy Process, CN
23
NN Examplee
F
igure 2: Thee Total Surveey Error Per
24
spective (froom Weisbergg 2005)
F
igure 3: Ressponse Rate Trends
25
F
1 George BB03.
igure 4: Tren
Bishop, “Why
nd in Cell O
y We Keep G
Only Househo
Getting Snowe
26
olds
ed by the Pollls,” The Washhington Post, February 3, 22008,
27
2 “Tracking Polls” transcript, On the Media March 26, 2010. Accessed at http://www.onthemedia.org/transcripts/2010/03/26/04 3 Indeed, top media organizations are more likely than academic journals to have written survey-quality standards. For example, The Associated Press, The New York Times, and ABC News, among others, have developed internal standards for judging whether or not they should report a survey. Media organizations often maintain a list of survey vendors—based on their methodology—that do not pass minimum quality standards. 4 Herb Weisberg, The Total Survey Error Approach: A Guide to the new Science of Survey Research (Chicago: The University of Chicago Press, 2005); Robert Groves et al., Survey Methodology (New York: John Wiley and Sons, 2004). 5 We could even be more specific in defining our target population, in this case, as adults reachable at home September 21-23, 2010. 6 Not mentioned are a number of other important steps, including choosing the precision level necessary, choosing the response mode, drafting the questionnaire, pretesting the instrument, data processing and analysis. These steps, too, can introduce error in the resulting statistics. 7 It is perhaps also worth noting that estimates of sampling error (margin of error; standard errors) almost always are calculated assuming the survey was collected using simple random sampling. Yet, most major data collections use a more complex probability sampling design such as clustered or stratified sampling. Although procedures exist in statistical packages like R and STATA for correcting the standard errors to account for complex designs, it is rarely ever done in political science. As such, published political science research often underestimates standard errors. 8 Weisberg, The total survey error approach. 9 http://online.wsj.com/article_email/SB10001424052748703305404575610402116987146-lMyQjAxMTAwMDEwNjExNDYyWj.html; http://democrats.science.house.gov/Media/file/Commdocs/hearings/2010/Energy/17nov/Michaels_Testimony.pdf 10 There are also heightened concerns about data quality, particularly for Internet panels. For instance, it can be difficult for researchers to verify that the person taking the survey is the desired respondent. Also, scholars have shown that web respondents are more likely to satisfice when inputting responses to survey items. See Dirk Heerwegh and Geert Loosveldt, “Face to Face Versus Web Surveying in a High-Internet Coverage Population: Differences in Response Quality,” Public Opinion Quarterly 72 (2009). In this mode, the authors found respondents provided “don’t know” responses at a higher rate, were less likely to provide differentiated responses across items, and were more likely to avoid responding to individual items altogether. On these points, see also Scott Fricker et al., “An Experimental Comparison of Web and Telephone Surveys,” Public Opinion Quarterly 69 (2005). 11 Mick Couper and Peter Miller, “Web Survey Methods,” Public Opinion Quarterly 72 (2008). 12 Indeed, the web, as a mode, has a number of unique advantages. For instance, web-based surveys are convenient for both interviewers and subjects – respondents can decide when to answer rather than having dinner interrupted by a phone survey. Researchers have shown that the web-based mode is quite resistant to social desirability biases. See Frauke Kreuter, Stanley Presser, and Roger Tourangeau, “Social Desirability Bias in CATI, IVR, and Web Surveys,” Public Opinion Quarterly 72 (2008); Don Dillman, “Why Choice of Survey Mode Makes a Difference,” Public Health Reports 121 (2006). 13 Researchers have evaluated the success rates from various recruitment strategies. See R. Michael Alvarez, Robert Sherman, and Carla VanBeselaere, “Subject Acquisition for Web-Based Surveys,” Political Analysis 11 (2003). They found, for instance, that their banner ad was displayed over 17 million
28
times, resulting in 53,285 clicks directing respondents to the panel Web site, and ultimately 3,431 panel members. 14 The matching procedure might work as follows. First, the survey is administered to a sample of opt-in respondents. Next, a random sample of individuals from existing consumer and voter registration files is drawn, but not administered the survey. Finally, a matching procedure is used to find the opt-in respondent (who answered the survey) who most closely matches the randomly selected individual (who did not answer the survey). Survey weighting is a post-survey procedure that adjusts the sample to look more representative on some observed characteristics. For example, if the sample of respondents is 60% female, 40% male, but the target population is evenly split between the two, then we might could each man in the sample a bit more and each woman a bit less. 15 A large number of studies—at least 19—have examined survey results with the same questionnaire administered to probability samples and online to nonprobability samples. See, for instance Yeager et al., “Comparing the Accuracy of RDD Telephone Surveys and Internet Surveys Conducted with Probability and Non-Probability Samples,” working paper (Knowledge Networks, 2009), www.knowledgenetworks.com/insights/docs/Mode-04\_2.pdf. All but one found significant differences in the results that could not be substantially reduced by weighting. Unfortunately, most of these studies cannot adequately distinguish differences due to sampling design effects and differences due to mode effects. 16 Mick Couper, “Web Surveys: A Review of Issues and Approaches,” Public Opinion Quarterly 64 (2000); Jill Dever, Ann Rafferty, and Richard Valliant, “Internet Surveys: Can Statistical Adjustments Eliminate Coverage Bias?” Survey Research Methods 2 (2008); Linchiat Chang and Jon Krosnick, “National Surveys via RDD Telephone Interviewing versus the Internet: Comparing Sample Representativeness and Response Quality,” Public Opinion Quarterly 73 (2009); Neil Malhotra and Jon Krosnick, “The Effect of Survey Mode and Sampling on Inferences about Political Attitudes and Behavior: Comparing the 2000 and 2004 ANES to Internet Surveys with Nonprobability Samples,” Political Analysis 15 (2007). 17 Gary Langer and Jon Cohen, “5 Tips for Decoding Those Election Polls” The Washington Post, December 30, 2007 Sunday B03 18 The response rates for the GSS were computed by dividing the number of completed cases by the “net” original sample, which excludes sampled households not deemed “eligible.” The ANES response rates were computed by the American National Election Studies. Response Rates for 2002 and 2004 were computed as described above, by dividing the number of completed cases by the number of “eligible” households included in the original sample. The response rate for the 2008 ANES was computed according to AAPOR’s “minimum response rate” (RR1). It is referred to as the "minimum" because it assumes that in all households at which the eligibility of residents was not determined, at least one eligible adult lived there. 19 For GSS, all rates reported in James Allan Davis, Tom W. Smith, and Peter V. Marsden, General Social Surveys, 1972-2008: Cumulative Codebook. Chicago: National Opinion Research Center, 2009. For ANES, numbers through 2000 reported in American National Election Studies. "Data Quality." Accessed November 18, 2010. http://www.electionstudies.org/overview/dataqual.htm. Subsequent numbers compiled from individual study year codebooks. 20 Emilia Peytcheva and Robert Groves, “Using Variation in Response Rates of Demographic Subgroups as Evidence of Nonresponse Bias in Survey Estimates,” Journal of Official Statistics 25 (2009).
29
21 Scott Keeter et al., “Gauging the Impact of Growing Nonresponse on Estimates from a National RDD telephone Survey,” Public Opinion Quarterly 70 (2006); Penny Visser et al., “Mail Surveys for Election Forecasting? An Evaluation of the Columbus Dispatch Poll,” Public Opinion Quarterly 60 (1996). 22 Adam Berinsky, Silent Voices: Opinion Polls and Political Representation in America (Princeton, NJ: Princeton University Press, 2004). 23 Warren Mitofsky, “Evaluation of Edison/ Mitofsky Election System of 2004,” accessed 10-1-10, http://www.exit-poll.net/electionnight/EvaluationJan192005.pdf. 24 Michael Mokrzycki, Scott Keeter, and Courtney Kennedy, “Cell Phone Only Voters in the 2008 Exit Poll and Implications for Future Noncoverage Bias,” Public Opinion Quarterly 73 (2009). 25 Leah Christian et al., “Assessing the Cell Phone Challenge” Pew Research Center May 20, 2010. http://pewresearch.org/pubs/1601/assessing-cell-phone-challenge-in-public-opinion-surveys. 26 Tom Smith, “That Which we Call Welfare by any other Name Would Smell Sweeter: An Analysis of the Impact of Question Wording on Response Patterns,” Public Opinion Quarterly 51 (1987). 27 Paul Abramson, and Charles Ostrom, Jr., “Macropartisanship: An Empirical Reasessment,” American Political Science Review (1991). Paul Abramson et al., “Question Form and Context Effects in the Measurement of Partisanship: Experimental Tests of the Artifact Hypothesis,” American Political Science Review 88 (1994). 28 See, for example, Darren Davis, “Nonrandom Measurement Error and Race of Interviewer Effects among African-Americans,” Public Opinion Quarterly 61 (1997). 29 Paul Biemer et al., Measurement Errors in Surveys (New York: John Wiley and Sons, Inc., 1991). Colm O’Muircheartaigh, Measurement Error in Surveys: A Historical Perspective (1997). 30 Mick Couper et al., Methods for Testing and Evaluating Survey Questionnaires (New York: Wiley, 2004). 31 For more complete discussion of the controversy and evidence, see http://www.dailykos.com/storyonly/2010/6/29/880185/-More-on-Research-2000. 32 http://www.fivethirtyeight.com/search/label/strategic%20vision 33http://www.aapor.org/AM/Template.cfm?Section=Standards_andamp_Ethics&Template=/CM/ContentDisplay.cfm&ContentID=2397